Recently Published Bulletin Reports
Kadovar (Papua New Guinea) An ash plume and weak thermal anomaly during May 2023
San Miguel (El Salvador) Small gas-and-ash explosions during March and May 2023
Ebeko (Russia) Continued explosions, ash plumes, and ashfall during October 2022-May 2023
Home Reef (Tonga) Discolored plumes continued during November 2022-April 2023
Semisopochnoi (United States) Occasional explosions, ash deposits, and gas-and-steam plumes during December 2022-May 2023
Ambae (Vanuatu) New lava flow, ash plumes, and sulfur dioxide plumes during February-May 2023
Ibu (Indonesia) Daily ash explosions continue, along with thermal anomalies in the crater, October 2022-May 2023
Dukono (Indonesia) Continuing ash emissions, SO2 plumes, and thermal signals during October 2022-May 2023
Sabancaya (Peru) Explosions, gas-and-ash plumes, and thermal activity persist during November 2022-April 2023
Sheveluch (Russia) Significant explosions destroyed part of the lava-dome complex during April 2023
Bezymianny (Russia) Explosions, ash plumes, lava flows, and avalanches during November 2022-April 2023
Chikurachki (Russia) New explosive eruption during late January-early February 2023
Kadovar (Papua New Guinea) — June 2023  Cite this Report
Kadovar
Papua New Guinea
3.608°S, 144.588°E; summit elev. 365 m
All times are local (unless otherwise noted)
An ash plume and weak thermal anomaly during May 2023
Kadovar is a 2-km-wide island that is the emergent summit of a Bismarck Sea stratovolcano. It lies off the coast of New Guinea, about 25 km N of the mouth of the Sepik River. Prior to an eruption that began in 2018, a lava dome formed the high point of the volcano, filling an arcuate landslide scarp open to the S. Submarine debris-avalanche deposits occur to the S of the island. The current eruption began in January 2018 and has comprised lava effusion from vents at the summit and at the E coast; more recent activity has consisted of ash plumes, weak thermal activity, and gas-and-steam plumes (BGVN 48:02). This report covers activity during February through May 2023 using information from the Darwin Volcanic Ash Advisory Center (VAAC) and satellite data.
Activity during the reporting period was relatively low and mainly consisted of white gas-and-steam plumes that were visible in natural color satellite images on clear weather days (figure 67). According to a Darwin VAAC report, at 2040 on 6 May an ash plume rose to 4.6 km altitude and drifted W; by 2300 the plume had dissipated. MODIS satellite instruments using the MODVOLC thermal algorithm detected a single thermal hotspot on the SE side of the island on 7 May. Weak thermal activity was also detected in a satellite image on the E side of the island on 14 May, accompanied by a white gas-and-steam plume that drifted SE (figure 68).
Geologic Background. The 2-km-wide island of Kadovar is the emergent summit of a Bismarck Sea stratovolcano of Holocene age. It is part of the Schouten Islands, and lies off the coast of New Guinea, about 25 km N of the mouth of the Sepik River. Prior to an eruption that began in 2018, a lava dome formed the high point of the andesitic volcano, filling an arcuate landslide scarp open to the south; submarine debris-avalanche deposits occur in that direction. Thick lava flows with columnar jointing forms low cliffs along the coast. The youthful island lacks fringing or offshore reefs. A period of heightened thermal phenomena took place in 1976. An eruption began in January 2018 that included lava effusion from vents at the summit and at the E coast.
Information Contacts: Darwin Volcanic Ash Advisory Centre (VAAC), Bureau of Meteorology, Northern Territory Regional Office, PO Box 40050, Casuarina, NT 0811, Australia (URL: http://www.bom.gov.au/info/vaac/); Hawai'i Institute of Geophysics and Planetology (HIGP) - MODVOLC Thermal Alerts System, School of Ocean and Earth Science and Technology (SOEST), Univ. of Hawai'i, 2525 Correa Road, Honolulu, HI 96822, USA (URL: http://modis.higp.hawaii.edu/); Copernicus Browser, Copernicus Data Space Ecosystem, European Space Agency (URL: https://dataspace.copernicus.eu/browser/).
San Miguel (El Salvador) — June 2023 Cite this Report
San Miguel
El Salvador
13.434°N, 88.269°W; summit elev. 2130 m
All times are local (unless otherwise noted)
Small gas-and-ash explosions during March and May 2023
San Miguel in El Salvador is a broad, deep crater complex that has been frequently modified by eruptions recorded since the early 16th century and consists of the summit known locally as Chaparrastique. Flank eruptions have produced lava flows that extended to the N, NE, and SE during the 17-19th centuries. The most recent activity has consisted of minor ash eruptions from the summit crater. The current eruption period began in November 2022 and has been characterized by frequent phreatic explosions, gas-and-ash emissions, and sulfur dioxide plumes (BGVN 47:12). This report describes small gas-and-ash explosions during December 2022 through May 2023 based on special reports from the Ministero de Medio Ambiente y Recursos Naturales (MARN).
Activity has been relatively low since the last recorded explosions on 29 November 2022. Seismicity recorded by the San Miguel Volcano Station (VSM) located on the N flank at 1.7 km elevation had decreased by 7 December. Sulfur dioxide gas measurements taken with DOAS (Differential Optical Absorption Spectroscopy) mobile equipment were below typical previously recorded values: 300 tons per day (t/d). During December, small explosions were recorded by the seismic network and manifested as gas-and-steam emissions.
Gas-and-ash explosions in the crater occurred during January 2023, which were recorded by the seismic network. Sulfur dioxide values remained low, between 300-400 t/d through 10 March. At 0817 on 14 January a gas-and-ash emission was visible in webcam images, rising just above the crater rim. Some mornings during February, small gas-and-steam plumes were visible in the crater. On 7 March at 2252 MARN noted an increase in degassing from the central crater; gas emissions were constantly observed through the early morning hours on 8 March. During the early morning of 8 March through the afternoon on 9 March, 12 emissions were registered, some accompanied by ash. The last gas-and-ash emission was recorded at 1210 on 9 March; very fine ashfall was reported in El Tránsito (10 km S), La Morita (6 km W), and La Piedrita (3 km W). The smell of sulfur was reported in Piedra Azul (5 km SW). On 16 March MARN reported that gas-and-steam emissions decreased.
Low degassing and very low seismicity were reported during April; no explosions have been detected between 9 March and 27 May. The sulfur dioxide emissions remained between 350-400 t/d; during 13-20 April sulfur dioxide values fluctuated between 30-300 t/d. Activity remained low through most of May; on 23 May seismicity increased. An explosion was detected at 1647 on 27 May generated a gas-and-ash plume that rose 700 m high (figure 32); a decrease in seismicity and gas emissions followed. The DOAS station installed on the W flank recorded sulfur dioxide values that reached 400 t/d on 27 May; subsequent measurements showed a decrease to 268 t/d on 28 May and 100 t/d on 29 May.
Geologic Background. The symmetrical cone of San Miguel, one of the most active volcanoes in El Salvador, rises from near sea level to form one of the country's most prominent landmarks. A broad, deep, crater complex that has been frequently modified by eruptions recorded since the early 16th century caps the truncated unvegetated summit, also known locally as Chaparrastique. Flanks eruptions of the basaltic-andesitic volcano have produced many lava flows, including several during the 17th-19th centuries that extended to the N, NE, and SE. The SE-flank flows are the largest and form broad, sparsely vegetated lava fields crossed by highways and a railroad skirting the base of the volcano. Flank vent locations have migrated higher on the edifice during historical time, and the most recent activity has consisted of minor ash eruptions from the summit crater.
Information Contacts: Ministero de Medio Ambiente y Recursos Naturales (MARN), Km. 5½ Carretera a Nueva San Salvador, Avenida las Mercedes, San Salvador, El Salvador (URL: http://www.snet.gob.sv/ver/vulcanologia).
Ebeko
Russia
50.686°N, 156.014°E; summit elev. 1103 m
All times are local (unless otherwise noted)
Continued explosions, ash plumes, and ashfall during October 2022-May 2023
Ebeko, located on the N end of Paramushir Island in the Kuril Islands, consists of three summit craters along a SSW-NNE line at the northern end of a complex of five volcanic cones. Eruptions date back to the late 18th century and have been characterized as small-to-moderate explosions from the summit crater, accompanied by intense fumarolic activity. The current eruption period began in June 2022 and has recently consisted of frequent explosions, ash plumes, and thermal activity (BGVN 47:10). This report covers similar activity during October 2022 through May 2023, based on information from the Kamchatka Volcanic Eruptions Response Team (KVERT) and satellite data.
Activity during October consisted of explosive activity, ash plumes, and occasional thermal anomalies. Visual data by volcanologists from Severo-Kurilsk showed explosions producing ash clouds up to 2.1-3 km altitude which drifted E, N, NE, and SE during 1-8, 10, 16, and 18 October. KVERT issued several Volcano Observatory Notices for Aviation (VONA) on 7, 13-15, and 27 October 2022, stating that explosions generated ash plumes that rose to 2.3-4 km altitude and drifted 5 km E, NE, and SE. Ashfall was reported in Severo-Kurilsk (Paramushir Island, about 7 km E) on 7 and 13 October. Satellite data showed a thermal anomaly over the volcano on 15-16 October. Visual data showed ash plumes rising to 2.5-3.6 km altitude on 22, 25-29, and 31 October and moving NE due to constant explosions.
Similar activity continued during November, with explosions, ash plumes, and ashfall occurring. KVERT issued VONAs on 1-2, 4, 6-7, 9, 13, and 16 November that reported explosions and resulting ash plumes that rose to 1.7-3.6 km altitude and drifted 3-5 km SE, ESE, E, and NE. On 1 November ash plumes extended as far as 110 km SE. On 5, 8, 12, and 24-25 November explosions and ash plumes rose to 2-3.1 km altitude and drifted N and E. Ashfall was observed in Severo-Kurilsk on 7 and 16 November. A thermal anomaly was visible during 1-4, 16, and 20 November. Explosions during 26 November rose as high as 2.7 km altitude and drifted NE (figure 45).
Explosions and ash plumes continued to occur in December. During 1-2 and 4 December volcanologists from Severo-Kurilsk observed explosions that sent ash to 1.9-2.5 km altitude and drifted NE and SE (figure 46). VONAs were issued on 5, 9, and 16 December reporting that explosions generated ash plumes rising to 1.9 km, 2.6 km, and 2.4 km altitude and drifted 5 km SE, E, and NE, respectively. A thermal anomaly was visible in satellite imagery on 16 December. On 18 and 27-28 December explosions produced ash plumes that rose to 2.5 km altitude and drifted NE and SE. On 31 December an ash plume rose to 2 km altitude and drifted NE.
Explosions continued during January 2023, based on visual observations by volcanologists from Severo-Kurilsk. During 1-7 January explosions generated ash plumes that rose to 4 km altitude and drifted NE, E, W, and SE. According to VONAs issued by KVERT on 2, 4, 10, and 23 January, explosions produced ash plumes that rose to 2-4 km altitude and drifted 5 km N, NE, E, and ENE; the ash plume that rose to 4 km altitude occurred on 10 January (figure 47). Satellite data showed a thermal anomaly during 3-4, 10, 13, 16, 21, 22, and 31 January. KVERT reported that an ash cloud on 4 January moved 12 km NE. On 6 and 9-11 January explosions sent ash plumes to 4.5 km altitude and drifted W and ESE. On 13 January an ash plume rose to 3 km altitude and drifted SE. During 20-24 January ash plumes from explosions rose to 3.7 km altitude and drifted SE, N, and NE. On 21 January the ash plume drifted as far as 40 km NE. During 28-29 and 31 January and 1 February ash plumes rose to 4 km altitude and drifted NE.
During February, explosions, ash plumes, and ashfall were reported. During 1, 4-5 and 7-8 February explosions generated ash plumes that rose to 4.5 km altitude and drifted E and NE; ashfall was observed on 5 and 8 February. On 6 February an explosion produced an ash plume that rose to 3 km altitude and drifted 7 km E, causing ashfall in Severo-Kurilsk. A thermal anomaly was visible in satellite data on 8, 9, 13, and 21 February. Explosions on 9 and 12-13 February produced ash plumes that rose to 4 km altitude and drifted E and NE; the ash cloud on 12 February extended as far as 45 km E. On 22 February explosions sent ash to 3 km altitude that drifted E. During 24 and 26-27 February ash plumes rose to 4 km altitude and drifted E. On 28 February an explosion sent ash to 2.5-3 km altitude and drifted 5 km E; ashfall was observed in Severo-Kurilsk.
Activity continued during March; visual observations showed that explosions generated ash plumes that rose to 3.6 km altitude on 3, 5-7, and 9-12 March and drifted E, NE, and NW. Thermal anomalies were visible on 10, 13, and 29-30 March in satellite imagery. On 18, 21-23, 26, and 29-30 March explosions produced ash plumes that rose to 2.8 km altitude and drifted NE and E; the ash plumes during 22-23 March extended up to 76 km E. A VONA issued on 21 March reported an explosion that produced an ash plume that rose to 2.8 km altitude and drifted 5 km E. Another VONA issued on 23 March reported that satellite data showed an ash plume rising to 3 km altitude and drifted 14 km E.
Explosions during April continued to generate ash plumes. On 1 and 4 April an ash plume rose to 2.8-3.5 km altitude and drifted SE and NE. A thermal anomaly was visible in satellite imagery during 1-6 April. Satellite data showed ash plumes and clouds rising to 2-3 km altitude and drifting up to 12 km SW and E on 3 and 6 April (figure 48). KVERT issued VONAs on 3, 5, 14, 16 April describing explosions that produced ash plumes rising to 3 km, 3.5 km, 3.5 km, and 3 km altitude and drifting 5 km S, 5 km NE and SE, 72 km NNE, and 5 km NE, respectively. According to satellite data, the resulting ash cloud from the explosion on 14 April was 25 x 7 km in size and drifted 72-104 km NNE during 14-15 April. According to visual data by volcanologists from Severo-Kurilsk explosions sent ash up to 3.5 km altitude that drifted NE and E during 15-16, 22, 25-26, and 29 April.
The explosive eruption continued during May. Explosions during 3-4, 6-7, and 9-10 May generated ash plumes that rose to 4 km altitude and drifted SW and E. Satellite data showed a thermal anomaly on 3, 9, 13-14, and 24 May. During 12-16, 23-25, and 27-28 May ash plumes rose to 3.5 km altitude and drifted in different directions due to explosions. Two VONA notices were issued on 16 and 25 May, describing explosions that generated ash plumes rising to 3 km and 3.5 km altitude, respectively and extending 5 km E. The ash cloud on 25 May drifted 75 km SE.
Thermal activity in the summit crater, occasionally accompanied by ash plumes and ash deposits on the SE and E flanks due to frequent explosions, were visible in infrared and true color satellite images (figure 49).
Geologic Background. The flat-topped summit of the central cone of Ebeko volcano, one of the most active in the Kuril Islands, occupies the northern end of Paramushir Island. Three summit craters located along a SSW-NNE line form Ebeko volcano proper, at the northern end of a complex of five volcanic cones. Blocky lava flows extend west from Ebeko and SE from the neighboring Nezametnyi cone. The eastern part of the southern crater contains strong solfataras and a large boiling spring. The central crater is filled by a lake about 20 m deep whose shores are lined with steaming solfataras; the northern crater lies across a narrow, low barrier from the central crater and contains a small, cold crescentic lake. Historical activity, recorded since the late-18th century, has been restricted to small-to-moderate explosive eruptions from the summit craters. Intense fumarolic activity occurs in the summit craters, on the outer flanks of the cone, and in lateral explosion craters.
Information Contacts: Kamchatka Volcanic Eruptions Response Team (KVERT), Far Eastern Branch, Russian Academy of Sciences, 9 Piip Blvd., Petropavlovsk-Kamchatsky, 683006, Russia (URL: http://www.kscnet.ru/ivs/kvert/); MIROVA (Middle InfraRed Observation of Volcanic Activity), a collaborative project between the Universities of Turin and Florence (Italy) supported by the Centre for Volcanic Risk of the Italian Civil Protection Department (URL: http://www.mirovaweb.it/); Copernicus Browser, Copernicus Data Space Ecosystem, European Space Agency (URL: https://dataspace.copernicus.eu/browser/).
Home Reef
Tonga
18.992°S, 174.775°W; summit elev. -10 m
All times are local (unless otherwise noted)
Discolored plumes continued during November 2022-April 2023
Home Reef is a submarine volcano located in the central Tonga islands between Lateiki (Metis Shoal) and Late Island. The first recorded eruption occurred in the mid-19th century, when an ephemeral island formed. An eruption in 1984 produced a 12-km-high eruption plume, a large volume of floating pumice, and an ephemeral island 500 x 1,500 m wide, with cliffs 30-50 m high that enclosed a water-filled crater. Another island-forming eruption in 2006 produced widespread pumice rafts that drifted as far as Australia; by 2008 the island had eroded below sea level. The previous eruption occurred during October 2022 and was characterized by a new island-forming eruption, lava effusion, ash plumes, discolored water, and gas-and-steam plumes (BGVN 47:11). This report covers discolored water plumes during November 2022 through April 2023 using satellite data.
Discolored plumes continued during the reporting period and were observed in true color satellite images on clear weather days. Satellite images show light green-yellow discolored water extending W on 8 and 28 November 2022 (figure 31), and SW on 18 November. Light green-yellow plumes extended W on 3 December, S on 13 December, SW on 18 December, and W and S on 23 December (figure 31). On 12 January 2023 discolored green-yellow plumes extended to the NE, E, SE, and N. The plume moved SE on 17 January and NW on 22 January. Faint discolored water in February was visible moving NE on 1 February. A discolored plume extended NW on 8 and 28 March and NW on 13 March (figure 31). During April, clear weather showed green-blue discolored plumes moving S on 2 April, W on 7 April, and NE and S on 12 April. A strong green-yellow discolored plume extended E and NE on 22 April for several kilometers (figure 31).
Geologic Background. Home Reef, a submarine volcano midway between Metis Shoal and Late Island in the central Tonga islands, was first reported active in the mid-19th century, when an ephemeral island formed. An eruption in 1984 produced a 12-km-high eruption plume, large amounts of floating pumice, and an ephemeral 500 x 1,500 m island, with cliffs 30-50 m high that enclosed a water-filled crater. In 2006 an island-forming eruption produced widespread dacitic pumice rafts that drifted as far as Australia. Another island was built during a September-October 2022 eruption.
Information Contacts: Copernicus Browser, Copernicus Data Space Ecosystem, European Space Agency (URL: https://dataspace.copernicus.eu/browser/).
Semisopochnoi (United States) — June 2023 Cite this Report
Semisopochnoi
United States
51.93°N, 179.58°E; summit elev. 1221 m
All times are local (unless otherwise noted)
Occasional explosions, ash deposits, and gas-and-steam plumes during December 2022-May 2023
Semisopochnoi is located in the western Aleutians, is 20-km-wide at sea level, and contains an 8-km-wide caldera. The three-peaked Mount Young (formerly Cerberus) was constructed within the caldera during the Holocene. Each of these peaks contains a summit crater; the lava flows on the N flank appear younger than those on the S side. The current eruption period began in early February 2021 and has more recently consisted of intermittent explosions and ash emissions (BGVN 47:12). This report updates activity during December 2022 through May 2023 using daily, weekly, and special reports from the Alaska Volcano Observatory (AVO). AVO monitors the volcano using local seismic and infrasound sensors, satellite data, web cameras, and remote infrasound and lightning networks.
Activity during most of December 2022 was relatively quiet; according to AVO no eruptive or explosive activity was observed since 7 November 2022. Intermittent tremor and occasional small earthquakes were observed in geophysical data. Continuous gas-and-steam emissions were observed from the N crater of Mount Young in webcam images on clear weather days (figure 25). On 24 December, there was a slight increase in earthquake activity and several small possible explosion signals were detected in infrasound data. Eruptive activity resumed on 27 December at the N crater of Mount Young; AVO issued a Volcano Activity Notice (VAN) that reported minor ash deposits on the flanks of Mount Young that extended as far as 1 km from the vent, according to webcam images taken during 27-28 December (figure 26). No ash plumes were observed in webcam or satellite imagery, but a persistent gas-and-steam plume that might have contained some ash rose to 1.5 km altitude. As a result, AVO raised the Aviation Color Code (ACC) to Orange (the second highest level on a four-color scale) and the Volcano Alert Level (VAL) to Watch (the second highest level on a four-level scale). Possible explosions were detected during 21 December 2022 through 1 January 2023 and seismic tremor was recorded during 30-31 December.
During January 2023 eruptive activity continued at the active N crater of Mount Young. Minor ash deposits were observed on the flanks, extending about 2 km SSW, based on webcam images from 1 and 3 January. A possible explosion occurred during 1-2 January based on elevated seismicity recorded on local seismometers and an infrasound signal recorded minutes later by an array at Adak. Though no ash plumes were observed in webcam or satellite imagery, a persistent gas-and-steam plume rose to 1.5 km altitude that might have carried minor traces of ash. Ash deposits were accompanied by periods of elevated seismicity and infrasound signals from the local geophysical network, which AVO reported were likely due to weak explosive activity. Low-level explosive activity was also detected during 2-3 January, with minor gas-and-steam emissions and a new ash deposit that was visible in webcam images. Low-level explosive activity was detected in geophysical data during 4-5 January, with elevated seismicity and infrasound signals observed on local stations. Volcanic tremor was detected during 7-9 January and very weak explosive activity was detected in seismic and infrasound data on 9 January. Weak seismic and infrasound signals were recorded on 17 January, which indicated minor explosive activity, but no ash emissions were observed in clear webcam images; a gas-and-steam plume continued to rise to 1.5 km altitude. During 29-30 January, ash deposits near the summit were observed on fresh snow, according to webcam images.
The active N cone at Mount Young continued to produce a gas-and-steam plume during February, but no ash emissions or explosive events were detected. Seismicity remained elevated with faint tremor during early February. Gas-and-steam emissions from the N crater were observed in clear webcam images on 11-13 and 16 February; no explosive activity was detected in seismic, infrasound, or satellite data. Seismicity has also decreased, with no significant seismic tremor observed since 25 January. Therefore, the ACC was lowered to Yellow (the second lowest level on a four-color scale) and the VAL was lowered to Advisory (the second lowest level on a four-color scale) on 22 February.
Gas-and-steam emissions persisted during March from the N cone of Mount Young, based on clear webcam images. A few brief episodes of weak tremor were detected in seismic data, although seismicity decreased over the month. A gas-and-steam plume detected in satellite data extended 150 km on 18 March. Low-level ash emissions from the N cone at Mount Young were observed in several webcam images during 18-19 March, in addition to small explosions and volcanic tremor. The ACC was raised to Orange and the VAL increased to Watch on 19 March. A small explosion was detected in seismic and infrasound data on 21 March.
Low-level unrest continued during April, although cloudy weather often obscured views of the summit; periods of seismic tremor and local earthquakes were recorded. During 3-4 April a gas-and-steam plume was visible traveling more than 200 km overnight; no ash was evident in the plume, according to AVO. A gas-and-steam plume was observed during 4-6 April that extended 400 km but did not seem to contain ash. Small explosions were detected in seismic and infrasound data on 5 April. Occasional clear webcam images showed continuing gas-and-steam emissions rose from Mount Young, but no ash deposits were observed on the snow. On 19 April small explosions and tremor were detected in seismic and infrasound data. A period of seismic tremor was detected during 22-25 April, with possible weak explosions on 25 April. Ash deposits were visible near the crater rim, but it was unclear if these deposits were recent or due to older deposits.
Occasional small earthquakes were recorded during May, but there were no signs of explosive activity seen in geophysical data. Gas-and-steam emissions continued from the N crater of Mount Young, based on webcam images, and seismicity remained slightly elevated. A new, light ash deposit was visible during the morning of 5 May on fresh snow on the NW flank of Mount Young. During 10 May periods of volcanic tremor were observed. The ACC was lowered to Yellow and the VAL to Advisory on 17 May due to no additional evidence of activity.
Geologic Background. Semisopochnoi, the largest subaerial volcano of the western Aleutians, is 20 km wide at sea level and contains an 8-km-wide caldera. It formed as a result of collapse of a low-angle, dominantly basaltic volcano following the eruption of a large volume of dacitic pumice. The high point of the island is Anvil Peak, a double-peaked late-Pleistocene cone that forms much of the island's northern part. The three-peaked Mount Cerberus (renamed Mount Young in 2023) was constructed within the caldera during the Holocene. Each of the peaks contains a summit crater; lava flows on the N flank appear younger than those on the south side. Other post-caldera volcanoes include the symmetrical Sugarloaf Peak SSE of the caldera and Lakeshore Cone, a small cinder cone at the edge of Fenner Lake in the NE part of the caldera. Most documented eruptions have originated from Young, although Coats (1950) considered that both Sugarloaf and Lakeshore Cone could have been recently active.
Information Contacts: Alaska Volcano Observatory (AVO), a cooperative program of a) U.S. Geological Survey, 4200 University Drive, Anchorage, AK 99508-4667 USA (URL: https://avo.alaska.edu/), b) Geophysical Institute, University of Alaska, PO Box 757320, Fairbanks, AK 99775-7320, USA, and c) Alaska Division of Geological & Geophysical Surveys, 794 University Ave., Suite 200, Fairbanks, AK 99709, USA (URL: http://dggs.alaska.gov/).
Ambae
Vanuatu
15.389°S, 167.835°E; summit elev. 1496 m
All times are local (unless otherwise noted)
New lava flow, ash plumes, and sulfur dioxide plumes during February-May 2023
Ambae, also known as Aoba, is a large basaltic shield volcano in Vanuatu. A broad pyroclastic cone containing three crater lakes (Manaro Ngoru, Voui, and Manaro Lakua) is located at the summit within the youngest of at least two nested calderas. Periodic phreatic and pyroclastic explosions have been reported since the 16th century. A large eruption more than 400 years ago resulted in a volcanic cone within the summit crater that is now filled by Lake Voui; the similarly sized Lake Manaro fills the western third of the caldera. The previous eruption ended in August 2022 that was characterized by gas-and-steam and ash emissions and explosions of wet tephra (BGVN 47:10). This report covers a new eruption during February through May 2023 that consisted of a new lava flow, ash plumes, and sulfur dioxide emissions, using information from the Vanuatu Meteorology and Geo-Hazards Department (VMGD) and satellite data.
During the reporting period, the Alert Level remained at a 2 (on a scale of 0-5), which has been in place since December 2021. Activity during October 2022 through March 2023 remained relatively low and mostly consisted of gas-and-steam emissions in Lake Voui. VMGD reported that at 1300 on 15 November a satellite image captured a strong amount of sulfur dioxide rising above the volcano (figure 99), and that seismicity slightly increased. The southern and northern part of the island reported a strong sulfur dioxide smell and heard explosions. On 20 February 2023 a gas-and-ash plume rose 1.3 km above the summit and drifted SSW, according to a webcam image (figure 100). Gas-and-steam and possibly ash emissions continued on 23 February and volcanic earthquakes were recorded by the seismic network.
During April, volcanic earthquakes and gas-and-steam and ash emissions were reported from the cone in Lake Voui. VMGD reported that activity increased during 5-7 April; high gas-and-steam and ash plumes were visible, accompanied by nighttime incandescence. According to a Wellington VAAC report, a low-level ash plume rose as high as 2.5 km above the summit and drifted W and SW on 5 April, based on satellite imagery. Reports in Saratamata stated that a dark ash plume drifted to the WSW, but no loud explosion was heard. Webcam images from 2100 showed incandescence above the crater and reflected in the clouds. According to an aerial survey, field observations, and satellite data, water was no longer present in the lake. A lava flow was reported effusing from the vent and traveling N into the dry Lake Voui, which lasted three days. The next morning at 0745 on 6 April a gas-and-steam and ash plume rose 5.4 km above the summit and drifted ESE, based on information from VMGD (figure 101). The Wellington VAAC also reported that light ashfall was observed on the island. Intermittent gas-and-steam and ash emissions were visible on 7 April, some of which rose to an estimated 3 km above the summit and drifted E. Webcam images during 0107-0730 on 7 April showed continuing ash emissions. A gas-and-steam and ash plume rose 695 m above the summit crater at 0730 on 19 April and drifted ESE, based on a webcam image (figure 102).
According to visual and infrared satellite data, water was visible in Lake Voui as late as 24 March 2023 (figure 103). The vent in the caldera showed a gas-and-steam plume drifted SE. On 3 April thermal activity was first detected, accompanied by a gas-and-ash plume that drifted W (figure 103). The lava flow moved N within the dry lake and was shown cooling by 8 April. By 23 April much of the water in the lake had returned. Occasional sulfur dioxide plumes were detected by the TROPOMI instrument on the Sentinel-5P satellite that exceeded 2 Dobson Units (DU) and drifted in different directions (figure 104).
Geologic Background. The island of Ambae, also known as Aoba, is a massive 2,500 km3 basaltic shield that is the most voluminous volcano of the New Hebrides archipelago. A pronounced NE-SW-trending rift zone with numerous scoria cones gives the 16 x 38 km island an elongated form. A broad pyroclastic cone containing three crater lakes (Manaro Ngoru, Voui, and Manaro Lakua) is located at the summit within the youngest of at least two nested calderas, the largest of which is 6 km in diameter. That large central edifice is also called Manaro Voui or Lombenben volcano. Post-caldera explosive eruptions formed the summit craters about 360 years ago. A tuff cone was constructed within Lake Voui (or Vui) about 60 years later. The latest known flank eruption, about 300 years ago, destroyed the population of the Nduindui area near the western coast.
Information Contacts: Geo-Hazards Division, Vanuatu Meteorology and Geo-Hazards Department (VMGD), Ministry of Climate Change Adaptation, Meteorology, Geo-Hazards, Energy, Environment and Disaster Management, Private Mail Bag 9054, Lini Highway, Port Vila, Vanuatu (URL: http://www.vmgd.gov.vu/, https://www.facebook.com/VanuatuGeohazardsObservatory/); Wellington Volcanic Ash Advisory Centre (VAAC), Meteorological Service of New Zealand Ltd (MetService), PO Box 722, Wellington, New Zealand (URL: http://www.metservice.com/vaac/, http://www.ssd.noaa.gov/VAAC/OTH/NZ/messages.html); MIROVA (Middle InfraRed Observation of Volcanic Activity), a collaborative project between the Universities of Turin and Florence (Italy) supported by the Centre for Volcanic Risk of the Italian Civil Protection Department (URL: http://www.mirovaweb.it/); Global Sulfur Dioxide Monitoring Page, Atmospheric Chemistry and Dynamics Laboratory, NASA Goddard Space Flight Center (NASA/GSFC), 8800 Greenbelt Road, Goddard, Maryland, USA (URL: https://so2.gsfc.nasa.gov/); Copernicus Browser, Copernicus Data Space Ecosystem, European Space Agency (URL: https://dataspace.copernicus.eu/browser/).
Ibu
Indonesia
1.488°N, 127.63°E; summit elev. 1325 m
All times are local (unless otherwise noted)
Daily ash explosions continue, along with thermal anomalies in the crater, October 2022-May 2023
Persistent eruptive activity since April 2008 at Ibu, a stratovolcano on Indonesian’s Halmahera Island, has consisted of daily explosive ash emissions and plumes, along with observations of thermal anomalies (BGVN 47:04). The current eruption continued during October 2022-May 2023, described below, based on advisories issued by the Pusat Vulkanologi dan Mitigasi Bencana Geologi (PVMBG, also known as Indonesian Center for Volcanology and Geological Hazard Mitigation, CVGHM), daily reports by MAGMA Indonesia (a PVMBG platform), and the Darwin Volcanic Ash Advisory Centre (VAAC), and various satellite data. The Alert Level during the reporting period remained at 2 (on a scale of 1-4), except raised briefly to 3 on 27 May, and the public was warned to stay at least 2 km away from the active crater and 3.5 km away on the N side of the volcano.
According to MAGMA Indonesia, during October 2022-May 2023, daily gray-and-white ash plumes of variable densities rose 200-1,000 m above the summit and drifted in multiple directions. On 30 October and 11 November, plumes rose a maximum of 2 km and 1.5 km above the summit, respectively (figures 42 and 43). According to the Darwin VAAC, discrete ash emissions on 13 November rose to 2.1 km altitude, or 800 m above the summit, and drifted W, and multiple ash emissions on 15 November rose 1.4 km above the summit and drifted NE. Occasional larger ash explosions through May 2023 prompted PVMBG to issue Volcano Observatory Notice for Aviation (VONA) alerts (table 6); the Aviation Color Code remained at Orange throughout this period.
Table 6. Volcano Observatory Notice for Aviation (VONA) ash plume alerts for Ibu issued by PVMBG during October 2022-May 2023. Maximum height above the summit was estimated by a ground observer. VONAs in January-May 2023 all described the ash plumes as dense.
| Date |
Time (local) |
Max height above summit |
Direction |
| 17 Oct 2022 |
0858 |
800 m |
SW |
| 18 Oct 2022 |
1425 |
800 m |
S |
| 19 Oct 2022 |
2017 |
600 m |
SW |
| 21 Oct 2022 |
0916 |
800 m |
NW |
| 16 Jan 2023 |
1959 |
600 m |
NE |
| 22 Jan 2023 |
0942 |
1,000 m |
E |
| 29 Jan 2023 |
2138 |
1,000 m |
E |
| 10 May 2023 |
0940 |
800 m |
NW |
| 10 May 2023 |
2035 |
600 m |
E |
| 21 May 2023 |
2021 |
600 m |
W |
| 21 May 2023 |
2140 |
1,000 m |
W |
| 29 May 2023 |
1342 |
800 m |
N |
| 31 May 2023 |
1011 |
1,000 m |
SW |
Sentinel-2 L1C satellite images throughout the reporting period show two, sometimes three persistent thermal anomalies in the summit crater, with the most prominent hotspot from the top of a cone within the crater. Clear views were more common during March-April 2023, when a vent and lava flows on the NE flank of the intra-crater cone could be distinguished (figure 44). White-to-grayish emissions were also observed during brief periods when weather clouds allowed clear views.
The MIROVA space-based volcano hotspot detection system recorded almost daily thermal anomalies throughout the reporting period, though cloud cover often interfered with detections. Data from imaging spectroradiometers aboard NASA’s Aqua and Terra satellites and processed using the MODVOLC algorithm (MODIS-MODVOLC) recorded hotspots on one day during October 2022 and December 2022, two days in April 2023, three days in November 2022 and May 2023, and four days in March 2023.
Geologic Background. The truncated summit of Gunung Ibu stratovolcano along the NW coast of Halmahera Island has large nested summit craters. The inner crater, 1 km wide and 400 m deep, has contained several small crater lakes. The 1.2-km-wide outer crater is breached on the N, creating a steep-walled valley. A large cone grew ENE of the summit, and a smaller one to the WSW has fed a lava flow down the W flank. A group of maars is located below the N and W flanks. The first observed and recorded eruption was a small explosion from the summit crater in 1911. Eruptive activity began again in December 1998, producing a lava dome that eventually covered much of the floor of the inner summit crater along with ongoing explosive ash emissions.
Information Contacts: Pusat Vulkanologi dan Mitigasi Bencana Geologi (PVMBG, also known as Indonesian Center for Volcanology and Geological Hazard Mitigation, CVGHM), Jalan Diponegoro 57, Bandung 40122, Indonesia (URL: http://www.vsi.esdm.go.id/); MAGMA Indonesia (Multiplatform Application for Geohazard Mitigation and Assessment in Indonesia), Kementerian Energi dan Sumber Daya Mineral (URL: https://magma.esdm.go.id/v1); Copernicus Browser, Copernicus Data Space Ecosystem, European Space Agency (URL: https://dataspace.copernicus.eu/browser/); MIROVA (Middle InfraRed Observation of Volcanic Activity), a collaborative project between the Universities of Turin and Florence (Italy) supported by the Centre for Volcanic Risk of the Italian Civil Protection Department (URL: http://www.mirovaweb.it/); Hawai'i Institute of Geophysics and Planetology (HIGP) - MODVOLC Thermal Alerts System, School of Ocean and Earth Science and Technology (SOEST), Univ. of Hawai'i, 2525 Correa Road, Honolulu, HI 96822, USA (URL: http://modis.higp.hawaii.edu/).
Dukono
Indonesia
1.6992°N, 127.8783°E; summit elev. 1273 m
All times are local (unless otherwise noted)
Continuing ash emissions, SO2 plumes, and thermal signals during October 2022-May 2023
Dukono, a remote volcano on Indonesia’s Halmahera Island, has been erupting continuously since 1933, with frequent ash explosions and sulfur dioxide plumes (BGVN 46:11, 47:10). This activity continued during October 2022 through May 2023, based on reports from the Pusat Vulkanologi dan Mitigasi Bencana Geologi (PVMBG; also known as Indonesian Center for Volcanology and Geological Hazard Mitigation, CVGHM), the Darwin Volcanic Ash Advisory Centre (VAAC), and satellite data. During this period, the Alert Level remained at 2 (on a scale of 1-4) and the public was warned to remain outside of the 2-km exclusion zone. The highest reported plume of the period reached 9.4 km above the summit on 14 November 2022.
According to MAGMA Indonesia (a platform developed by PVMBG), white, gray, or dark plumes of variable densities were observed almost every day during the reporting period, except when fog obscured the volcano (figure 33). Plumes generally rose 25-450 m above the summit, but rose as high as 700-800 m on several days, somewhat lower than the maximum heights reached earlier in 2022 when plumes reached as high as 1 km. However, the Darwin VAAC reported that on 14 November 2022, a discrete ash plume rose 9.4 km above the summit (10.7 km altitude), accompanied by a strong hotspot and a sulfur dioxide signal observed in satellite imagery; a continuous ash plume that day and through the 15th rose to 2.1-2.4 km altitude and drifted NE.
Sentinel-2 images were obscured by weather clouds almost every viewing day during the reporting period. However, the few reasonably clear images showed a hotspot and white or gray emissions and plumes. Strong SO2 plumes from Dukono were present on many days during October 2022-May 2023, as detected using the TROPOMI instrument on the Sentinel-5P satellite (figure 34).
Geologic Background. Reports from this remote volcano in northernmost Halmahera are rare, but Dukono has been one of Indonesia's most active volcanoes. More-or-less continuous explosive eruptions, sometimes accompanied by lava flows, have occurred since 1933. During a major eruption in 1550 CE, a lava flow filled in the strait between Halmahera and the N-flank Gunung Mamuya cone. This complex volcano presents a broad, low profile with multiple summit peaks and overlapping craters. Malupang Wariang, 1 km SW of the summit crater complex, contains a 700 x 570 m crater that has also been active during historical time.
Information Contacts: Pusat Vulkanologi dan Mitigasi Bencana Geologi (PVMBG, also known as Indonesian Center for Volcanology and Geological Hazard Mitigation, CVGHM), Jalan Diponegoro 57, Bandung 40122, Indonesia (URL: http://www.vsi.esdm.go.id/); MAGMA Indonesia (Multiplatform Application for Geohazard Mitigation and Assessment in Indonesia), Kementerian Energi dan Sumber Daya Mineral (URL: https://magma.esdm.go.id/v1); Darwin Volcanic Ash Advisory Centre (VAAC), Bureau of Meteorology, Northern Territory Regional Office, PO Box 40050, Casuarina, NT 0811, Australia (URL: http://www.bom.gov.au/info/vaac/); NASA Global Sulfur Dioxide Monitoring Page, Atmospheric Chemistry and Dynamics Laboratory, NASA Goddard Space Flight Center (NASA/GSFC), 8800 Greenbelt Road, Goddard, Maryland, USA (URL: https://so2.gsfc.nasa.gov/); Sentinel Hub Playground (URL: https://www.sentinel-hub.com/explore/sentinel-playground).
Sabancaya
Peru
15.787°S, 71.857°W; summit elev. 5960 m
All times are local (unless otherwise noted)
Explosions, gas-and-ash plumes, and thermal activity persist during November 2022-April 2023
Sabancaya is located in Peru, NE of Ampato and SE of Hualca Hualca. Eruptions date back to 1750 and have been characterized by explosions, phreatic activity, ash plumes, and ashfall. The current eruption period began in November 2016 and has more recently consisted of daily explosions, gas-and-ash plumes, and thermal activity (BGVN 47:11). This report updates activity during November 2022 through April 2023 using information from Instituto Geophysico del Peru (IGP) that use weekly activity reports and various satellite data.
Intermittent low-to-moderate power thermal anomalies were reported by the MIROVA project during November 2022 through April 2023 (figure 119). There were few short gaps in thermal activity during mid-December 2022, late December-to-early January 2023, late January to mid-February, and late February. According to data recorded by the MODVOLC thermal algorithm, there were a total of eight thermal hotspots: three in November 2022, three in February 2023, one in March, and one in April. On clear weather days, some of this thermal anomaly was visible in infrared satellite imagery showing the active lava dome in the summit crater (figure 120). Almost daily moderate-to-strong sulfur dioxide plumes were recorded during the reporting period by the TROPOMI instrument on the Sentinel-5P satellite (figure 121). Many of these plumes exceeded 2 Dobson Units (DU) and drifted in multiple directions.
IGP reported that moderate activity during November and December 2022 continued; during November, an average number of explosions were reported each week: 30, 33, 36, and 35, and during December, it was 32, 40, 47, 52, and 67. Gas-and-ash plumes in November rose 3-3.5 km above the summit and drifted E, NE, SE, S, N, W, and SW. During December the gas-and-ash plumes rose 2-4 km above the summit and drifted in different directions. There were 1,259 volcanic earthquakes recorded during November and 1,693 during December. Seismicity also included volcano-tectonic-type events that indicate rock fracturing events. Slight inflation was observed in the N part of the volcano near Hualca Hualca (4 km N). Thermal activity was frequently reported in the crater at the active lava dome (figure 120).
Explosive activity continued during January and February 2023. The average number of explosions were reported each week during January (51, 50, 60, and 59) and February (43, 54, 51, and 50). Gas-and-ash plumes rose 1.6-2.9 km above the summit and drifted NW, SW, and W during January and rose 1.4-2.8 above the summit and drifted W, SW, E, SE, N, S, NW, and NE during February. IGP also detected 1,881 volcanic earthquakes during January and 1,661 during February. VT-type earthquakes were also reported. Minor inflation persisted near Hualca Hualca. Satellite imagery showed continuous thermal activity in the crater at the lava dome (figure 120).
During March, the average number of explosions each week was 46, 48, 31, 35, and 22 and during April, it was 29, 41, 31, and 27. Accompanying gas-and-ash plumes rose 1.7-2.6 km above the summit crater and drifted W, SW, NW, S, and SE during March. According to a Buenos Aires Volcano Ash Advisory Center (VAAC) notice, on 22 March at 1800 through 23 March an ash plume rose to 7 km altitude and drifted NW. By 0430 an ash plume rose to 7.6 km altitude and drifted W. On 24 and 26 March continuous ash emissions rose to 7.3 km altitude and drifted SW and on 28 March ash emissions rose to 7.6 km altitude. During April, gas-and-ash plumes rose 1.6-2.5 km above the summit and drifted W, SW, S, NW, NE, and E. Frequent volcanic earthquakes were recorded, with 1,828 in March and 1,077 in April, in addition to VT-type events. Thermal activity continued to be reported in the summit crater at the lava dome (figure 120).
Geologic Background. Sabancaya, located in the saddle NE of Ampato and SE of Hualca Hualca volcanoes, is the youngest of these volcanic centers and the only one to have erupted in historical time. The oldest of the three, Nevado Hualca Hualca, is of probable late-Pliocene to early Pleistocene age. The name Sabancaya (meaning "tongue of fire" in the Quechua language) first appeared in records in 1595 CE, suggesting activity prior to that date. Holocene activity has consisted of Plinian eruptions followed by emission of voluminous andesitic and dacitic lava flows, which form an extensive apron around the volcano on all sides but the south. Records of historical eruptions date back to 1750.
Information Contacts: Instituto Geofisico del Peru (IGP), Centro Vulcanológico Nacional (CENVUL), Calle Badajoz N° 169 Urb. Mayorazgo IV Etapa, Ate, Lima 15012, Perú (URL: https://www.igp.gob.pe/servicios/centro-vulcanologico-nacional/inicio); Buenos Aires Volcanic Ash Advisory Center (VAAC), Servicio Meteorológico Nacional-Fuerza Aérea Argentina, 25 de mayo 658, Buenos Aires, Argentina (URL: http://www.smn.gov.ar/vaac/buenosaires/inicio.php); MIROVA (Middle InfraRed Observation of Volcanic Activity), a collaborative project between the Universities of Turin and Florence (Italy) supported by the Centre for Volcanic Risk of the Italian Civil Protection Department (URL: http://www.mirovaweb.it/); Hawai'i Institute of Geophysics and Planetology (HIGP) - MODVOLC Thermal Alerts System, School of Ocean and Earth Science and Technology (SOEST), Univ. of Hawai'i, 2525 Correa Road, Honolulu, HI 96822, USA (URL: http://modis.higp.hawaii.edu/); NASA Global Sulfur Dioxide Monitoring Page, Atmospheric Chemistry and Dynamics Laboratory, NASA Goddard Space Flight Center (NASA/GSFC), 8800 Greenbelt Road, Goddard MD 20771, USA (URL: https://so2.gsfc.nasa.gov/); Copernicus Browser, Copernicus Data Space Ecosystem, European Space Agency (URL: https://dataspace.copernicus.eu/browser/).
Sheveluch
Russia
56.653°N, 161.36°E; summit elev. 3283 m
All times are local (unless otherwise noted)
Significant explosions destroyed part of the lava-dome complex during April 2023
Sheveluch (also spelled Shiveluch) in Kamchatka, has had at least 60 large eruptions during the last 10,000 years. The summit is truncated by a broad 9-km-wide caldera that is breached to the S, and many lava domes occur on the outer flanks. The lava dome complex was constructed within the large open caldera. Frequent collapses of the dome complex have produced debris avalanches; the resulting deposits cover much of the caldera floor. A major south-flank collapse during a 1964 Plinian explosion produced a scarp in which a “Young Sheveluch” dome began to form in 1980. Repeated episodes of dome formation and destruction since then have produced major and minor ash plumes, pyroclastic flows, block-and-ash flows, and “whaleback domes” of spine-like extrusions in 1993 and 2020 (BGVN 45:11). The current eruption period began in August 1999 and has more recently consisted of lava dome growth, explosions, ash plumes, and avalanches (BGVN 48:01). This report covers a significant explosive eruption during early-to-mid-April 2023 that generated a 20 km altitude ash plume, produced a strong sulfur dioxide plume, and destroyed part of the lava-dome complex; activity described during January through April 2023 use information primarily from the Kamchatka Volcanic Eruptions Response Team (KVERT) and various satellite data.
Satellite data. Activity during the majority of this reporting period was characterized by continued lava dome growth, strong fumarole activity, explosions, and hot avalanches. According to the MODVOLC Thermal Alerts System, 140 hotspots were detected through the reporting period, with 33 recorded in January 2023, 29 in February, 44 in March, and 34 in April. Frequent strong thermal activity was recorded during January 2023 through April, according to the MIROVA (Middle InfraRed Observation of Volcanic Activity) graph and resulted from the continuously growing lava dome (figure 94). A slightly stronger pulse in thermal activity was detected in early-to-mid-April, which represented the significant eruption that destroyed part of the lava-dome complex. Thermal anomalies were also visible in infrared satellite imagery at the summit crater (figure 95).
During January 2023 KVERT reported continued growth of the lava dome, accompanied by strong fumarolic activity, incandescence from the lava dome, explosions, ash plumes, and avalanches. Satellite data showed a daily thermal anomaly over the volcano. Video data showed ash plumes associated with collapses at the dome that generated avalanches that in turn produced ash plumes rising to 3.5 km altitude and drifting 40 km W on 4 January and rising to 7-7.5 km altitude and drifting 15 km SW on 5 January. A gas-and-steam plume containing some ash that was associated with avalanches rose to 5-6 km altitude and extended 52-92 km W on 7 January. Explosions that same day produced ash plumes that rose to 7-7.5 km altitude and drifted 10 km W. According to a Volcano Observatory Notice for Aviation (VONA) issued at 1344 on 19 January, explosions produced an ash cloud that was 15 x 25 km in size and rose to 9.6-10 km altitude, drifting 21-25 km W; as a result, the Aviation Color Code (ACC) was raised to Red (the highest level on a four-color scale). Another VONA issued at 1635 reported that no more ash plumes were observed, and the ACC was lowered to Orange (the second highest level on a four-color scale). On 22 January an ash plume from collapses and avalanches rose to 5 km altitude and drifted 25 km NE and SW; ash plumes associated with collapses extended 70 km NE on 27 and 31 January.
Lava dome growth, fumarolic activity, dome incandescence, and occasional explosions and avalanches continued during February and March. A daily thermal anomaly was visible in satellite data. Explosions on 1 February generated ash plumes that rose to 6.3-6.5 km altitude and extended 15 km NE. Video data showed an ash cloud from avalanches rising to 5.5 km altitude and drifting 5 km SE on 2 February. Satellite data showed gas-and-steam plumes containing some ash rose to 5-5.5 km altitude and drifted 68-110 km ENE and NE on 6 February, to 4.5-5 km altitude and drifted 35 km WNW on 22 February, and to 3.7-4 km altitude and drifted 47 km NE on 28 February. Scientists from the Kamchatka Volcanological Station (KVS) went on a field excursion on 25 February to document the growing lava dome, and although it was cloudy most of the day, nighttime incandescence was visible. Satellite data showed an ash plume extending up to 118 km E during 4-5 March. Video data from 1150 showed an ash cloud from avalanches rose to 3.7-5.5 km altitude and drifted 5-10 km ENE and E on 5 March. On 11 March an ash plume drifted 62 km E. On 27 March ash plumes rose to 3.5 km altitude and drifted 100 km E. Avalanches and constant incandescence at the lava dome was focused on the E and NE slopes on 28 March. A gas-and-steam plume containing some ash rose to 3.5 km altitude and moved 40 km E on 29 March. Ash plumes on 30 March rose to 3.5-3.7 km altitude and drifted 70 km NE.
Similar activity continued during April, with lava dome growth, strong fumarolic activity, incandescence in the dome, occasional explosions, and avalanches. A thermal anomaly persisted throughout the month. During 1-4 April weak ash plumes rose to 2.5-3 km altitude and extended 13-65 km SE and E.
Activity during 11 April 2023. The Institute of Volcanology and Seismology, Far Eastern Branch, Russian Academy of Sciences (IVS FEB RAS) reported a significant increase in seismicity around 0054 on 11 April, as reported by strong explosions detected on 11 April beginning at 0110 that sent ash plumes up to 7-10 km altitude and extended 100-435 km W, WNW, NNW, WSW, and SW. According to a Tokyo VAAC report the ash plume rose to 15.8 km altitude. By 0158 the plume extended over a 75 x 100 km area. According to an IVS FEB RAS report, the eruptive column was not vertical: the initial plume at 0120 on 11 April deviated to the NNE, at 0000 on 12 April, it drifted NW, and by 1900 it drifted SW. KVS reported that significant pulses of activity occurred at around 0200, 0320, and then a stronger phase around 0600. Levin Dmitry took a video from near Békés (3 km away) at around 0600 showing a rising plume; he also reported that a pyroclastic flow traveled across the road behind him as he left the area. According to IVS FEB RAS, the pyroclastic flow traveled several kilometers SSE, stopping a few hundred meters from a bridge on the road between Klyuchi and Petropavlovsk-Kamchatsky.
Ashfall was first observed in Klyuchi (45 km SW) at 0630, and a large, black ash plume blocked light by 0700. At 0729 KVERT issued a Volcano Observatory Notice for Aviation (VONA) raising the Aviation Color Code to Red (the highest level on a four-color scale). It also stated that a large ash plume had risen to 10 km altitude and drifted 100 km W. Near-constant lightning strikes were reported in the plume and sounds like thunderclaps were heard until about 1000. According to IVS FEB RAS the cloud was 200 km long and 76 km wide by 0830, and was spreading W at altitudes of 6-12 km. In the Klyuchi Village, the layer of both ash and snow reached 8.5 cm (figure 96); ashfall was also reported in Kozyrevsk (112 km SW) at 0930, Mayskoye, Anavgay, Atlasovo, Lazo, and Esso. Residents in Klyuchi reported continued darkness and ashfall at 1100. In some areas, ashfall was 6 cm deep and some residents reported dirty water coming from their plumbing. According to IVS FEB RAS, an ash cloud at 1150 rose to 5-20 km altitude and was 400 km long and 250 km wide, extending W. A VONA issued at 1155 reported that ash had risen to 10 km and drifted 340 km NNW and 240 km WSW. According to Simon Carn (Michigan Technological University), about 0.2 Tg of sulfur dioxide in the plume was measured in a satellite image from the TROPOMI instrument on the Sentinel-5P satellite acquired at 1343 that covered an area of about 189,000 km2 (figure 97). Satellite data at 1748 showed an ash plume that rose to 8 km altitude and drifted 430 km WSW and S, according to a VONA.
Activity during 12-15 April 2023. On 12 April at 0730 satellite images showed ash plumes rose to 7-8 km altitude and extended 600 km SW, 1,050 km ESE, and 1,300-3,000 km E. By 1710 that day, the explosions weakened. According to news sources, the ash-and-gas plumes drifted E toward the Aleutian Islands and reached the Gulf of Alaska by 13 April, causing flight disruptions. More than 100 flights involving Alaska airspace were cancelled due to the plume. Satellite data showed ash plumes rising to 4-5.5 km altitude and drifted 400-415 km SE and ESE on 13 April. KVS volcanologists observed the pyroclastic flow deposits and noted that steam rose from downed, smoldering trees. They also noted that the deposits were thin with very few large fragments, which differed from previous flows. The ash clouds traveled across the Pacific Ocean. Flight cancellations were also reported in NW Canada (British Columbia) during 13-14 April. During 14-15 April ash plumes rose to 6 km altitude and drifted 700 km NW.
Alaskan flight schedules were mostly back to normal by 15 April, with only minor delays and far less cancellations; a few cancellations continued to be reported in Canada. Clear weather on 15 April showed that most of the previous lava-dome complex was gone and a new crater roughly 1 km in diameter was observed (figure 98); gas-and-steam emissions were rising from this crater. Evidence suggested that there had been a directed blast to the SE, and pyroclastic flows traveled more than 20 km. An ash plume rose to 4.5-5.2 km altitude and drifted 93-870 km NW on 15 April.
Activity during 16-30 April 2023. Resuspended ash was lifted by the wind from the slopes and rose to 4 km altitude and drifted 224 km NW on 17 April. KVERT reported a plume of resuspended ash from the activity during 10-13 April on 19 April that rose to 3.5-4 km altitude and drifted 146-204 km WNW. During 21-22 April a plume stretched over the Scandinavian Peninsula. A gas-and-steam plume containing some ash rose to 3-3.5 km altitude and drifted 60 km SE on 30 April. A possible new lava dome was visible on the W slope of the volcano on 29-30 April (figure 99); satellite data showed two thermal anomalies, a bright one over the existing lava dome and a weaker one over the possible new one.
References. Girina, O., Loupian, E., Horvath, A., Melnikov, D., Manevich, A., Nuzhdaev, A., Bril, A., Ozerov, A., Kramareva, L., Sorokin, A., 2023, Analysis of the development of the paroxysmal eruption of Sheveluch volcano on April 10–13, 2023, based on data from various satellite systems, ??????????? ???????? ??? ?? ???????, 20(2).
Geologic Background. The high, isolated massif of Sheveluch volcano (also spelled Shiveluch) rises above the lowlands NNE of the Kliuchevskaya volcano group. The 1,300 km3 andesitic volcano is one of Kamchatka's largest and most active volcanic structures, with at least 60 large eruptions during the Holocene. The summit of roughly 65,000-year-old Stary Shiveluch is truncated by a broad 9-km-wide late-Pleistocene caldera breached to the south. Many lava domes occur on its outer flanks. The Molodoy Shiveluch lava dome complex was constructed during the Holocene within the large open caldera; Holocene lava dome extrusion also took place on the flanks of Stary Shiveluch. Widespread tephra layers from these eruptions have provided valuable time markers for dating volcanic events in Kamchatka. Frequent collapses of dome complexes, most recently in 1964, have produced debris avalanches whose deposits cover much of the floor of the breached caldera.
Information Contacts: Kamchatka Volcanic Eruptions Response Team (KVERT), Far Eastern Branch, Russian Academy of Sciences, 9 Piip Blvd., Petropavlovsk-Kamchatsky, 683006, Russia (URL: http://www.kscnet.ru/ivs/kvert/); Institute of Volcanology and Seismology, Far Eastern Branch, Russian Academy of Sciences (IVS FEB RAS), 9 Piip Blvd., Petropavlovsk-Kamchatsky 683006, Russia (URL: http://www.kscnet.ru/ivs/eng/); Kamchatka Volcanological Station, Kamchatka Branch of Geophysical Survey, (KB GS RAS), Klyuchi, Kamchatka Krai, Russia (URL: http://volkstat.ru/); Hawai'i Institute of Geophysics and Planetology (HIGP) - MODVOLC Thermal Alerts System, School of Ocean and Earth Science and Technology (SOEST), Univ. of Hawai'i, 2525 Correa Road, Honolulu, HI 96822, USA (URL: http://modis.higp.hawaii.edu/); MIROVA (Middle InfraRed Observation of Volcanic Activity), a collaborative project between the Universities of Turin and Florence (Italy) supported by the Centre for Volcanic Risk of the Italian Civil Protection Department (URL: http://www.mirovaweb.it/); Copernicus Browser, Copernicus Data Space Ecosystem, European Space Agency (URL: https://dataspace.copernicus.eu/browser/); Kam 24 News Agency, 683032, Kamchatka Territory, Petropavlovsk-Kamchatsky, Vysotnaya St., 2A (URL: https://kam24.ru/news/main/20230411/96657.html#.Cj5Jrky6.dpuf); Simon Carn, Geological and Mining Engineering and Sciences, Michigan Technological University, 1400 Townsend Drive, Houghton, MI 49931, USA (URL: http://www.volcarno.com/, Twitter: @simoncarn).
Bezymianny
Russia
55.972°N, 160.595°E; summit elev. 2882 m
All times are local (unless otherwise noted)
Explosions, ash plumes, lava flows, and avalanches during November 2022-April 2023
Bezymianny is located on the Kamchatka Peninsula of Russia as part of the Klyuchevskoy volcano group. Historic eruptions began in 1955 and have been characterized by dome growth, explosions, pyroclastic flows, ash plumes, and ashfall. During the 1955-56 eruption a large open crater was formed by collapse of the summit and an associated lateral blast. Subsequent episodic but ongoing lava-dome growth, accompanied by intermittent explosive activity and pyroclastic flows, has largely filled the 1956 crater. The current eruption period began in December 2016 and more recent activity has consisted of strong explosions, ash plumes, and thermal activity (BGVN 47:11). This report covers activity during November 2022 through April 2023, based on weekly and daily reports from the Kamchatka Volcano Eruptions Response Team (KVERT) and satellite data.
Activity during November and March 2023 was relatively low and mostly consisted of gas-and-steam emissions, occasional small collapses that generated avalanches along the lava dome slopes, and a persistent thermal anomaly over the volcano that was observed in satellite data on clear weather days. According to the Tokyo VAAC and KVERT, an explosion produced an ash plume that rose to 6 km altitude and drifted 25 km NE at 1825 on 29 March.
Gas-and-steam emissions, collapses generating avalanches, and thermal activity continued during April. According to two Volcano Observatory Notice for Aviation (VONA) issued on 2 and 6 April (local time) ash plumes rose to 3 km and 3.5-3.8 km altitude and drifted 35 km E and 140 km E, respectively. Satellite data from KVERT showed weak ash plumes extending up to 550 km E on 2 and 5-6 April.
A VONA issued at 0843 on 7 April described an ash plume that rose to 4.5-5 km altitude and drifted 250 km ESE. Later that day at 1326 satellite data showed an ash plume that rose to 5.5-6 km altitude and drifted 150 km ESE. A satellite image from 1600 showed an ash plume extending as far as 230 km ESE; KVERT noted that ash emissions were intensifying, likely due to avalanches from the growing lava dome. The Aviation Color Code (ACC) was raised to Red (the highest level on a four-color scale). At 1520 satellite data showed an ash plume rising to 5-5.5 km altitude and drifting 230 km ESE. That same day, Kamchatka Volcanological Station (KVS) volcanologists traveled to Ambon to collect ash; they reported that a notable eruption began at 1730, and within 20 minutes a large ash plume rose to 10 km altitude and drifted NW. KVERT reported that the strong explosive phase began at 1738. Video and satellite data taken at 1738 showed an ash plume that rose to 10-12 km altitude and drifted up to 2,800 km SE and E. Explosions were clearly audible 20 km away for 90 minutes, according to KVS. Significant amounts of ash fell at the Apakhonchich station, which turned the snow gray; ash continued to fall until the morning of 8 April. In a VONA issued at 0906 on 8 April, KVERT stated that the explosive eruption had ended; ash plumes had drifted 2,000 km E. The ACC was lowered to Orange (the third highest level on a four-color scale). The KVS team saw a lava flow on the active dome once the conditions were clear that same day (figure 53). On 20 April lava dome extrusion was reported; lava flows were noted on the flanks of the dome, and according to KVERT satellite data, a thermal anomaly was observed in the area. The ACC was lowered to Yellow (the second lowest on a four-color scale).
Satellite data showed an increase in thermal activity beginning in early April 2023. A total of 31 thermal hotspots were detected by the MODVOLC thermal algorithm on 4, 5, 7, and 12 April 2023. The elevated thermal activity resulted from an increase in explosive activity and the start of an active lava flow. The MIROVA (Middle InfraRed Observation of Volcanic Activity) volcano hotspot detection system based on the analysis of MODIS data also showed a pulse in thermal activity during the same time (figure 54). Infrared satellite imagery captured a continuous thermal anomaly at the summit crater, often accompanied by white gas-and-steam emissions (figure 55). On 4 April 2023 an active lava flow was observed descending the SE flank.
Geologic Background. The modern Bezymianny, much smaller than its massive neighbors Kamen and Kliuchevskoi on the Kamchatka Peninsula, was formed about 4,700 years ago over a late-Pleistocene lava-dome complex and an edifice built about 11,000-7,000 years ago. Three periods of intensified activity have occurred during the past 3,000 years. The latest period, which was preceded by a 1,000-year quiescence, began with the dramatic 1955-56 eruption. This eruption, similar to that of St. Helens in 1980, produced a large open crater that was formed by collapse of the summit and an associated lateral blast. Subsequent episodic but ongoing lava-dome growth, accompanied by intermittent explosive activity and pyroclastic flows, has largely filled the 1956 crater.
Information Contacts: Kamchatka Volcanic Eruptions Response Team (KVERT), Far Eastern Branch, Russian Academy of Sciences, 9 Piip Blvd., Petropavlovsk-Kamchatsky, 683006, Russia (URL: http://www.kscnet.ru/ivs/kvert/); Kamchatka Volcanological Station, Kamchatka Branch of Geophysical Survey, (KB GS RAS), Klyuchi, Kamchatka Krai, Russia (URL: http://volkstat.ru/); Hawai'i Institute of Geophysics and Planetology (HIGP) - MODVOLC Thermal Alerts System, School of Ocean and Earth Science and Technology (SOEST), Univ. of Hawai'i, 2525 Correa Road, Honolulu, HI 96822, USA (URL: http://modis.higp.hawaii.edu/); MIROVA (Middle InfraRed Observation of Volcanic Activity), a collaborative project between the Universities of Turin and Florence (Italy) supported by the Centre for Volcanic Risk of the Italian Civil Protection Department (URL: http://www.mirovaweb.it/); Copernicus Browser, Copernicus Data Space Ecosystem, European Space Agency (URL: https://dataspace.copernicus.eu/browser/).
Chikurachki
Russia
50.324°N, 155.461°E; summit elev. 1781 m
All times are local (unless otherwise noted)
New explosive eruption during late January-early February 2023
Chikurachki, located on Paramushir Island in the northern Kuriles, has had Plinian eruptions during the Holocene. Lava flows have reached the sea and formed capes on the NW coast; several young lava flows are also present on the E flank beneath a scoria deposit. Reported eruptions date back to 1690, with the most recent eruption period occurring during January through October 2022, characterized by occasional explosions, ash plumes, and thermal activity (BGVN 47:11). This report covers a new eruptive period during January through February 2023 that consisted of ash explosions and ash plumes, based on information from the Kamchatka Volcanic Eruptions Response Team (KVERT) and satellite data.
According to reports from KVERT, an explosive eruption began around 0630 on 29 January. Explosions generated ash plumes that rose to 3-3.5 km altitude and drifted 6-75 km SE and E, based on satellite data. As a result, the Aviation Color Code (ACC) was raised to Orange (the second highest level on a four-color scale). At 1406 and 1720 ash plumes were identified in satellite images that rose to 4.3 km altitude and extended 70 km E. By 2320 the ash plume had dissipated. A thermal anomaly was visible at the volcano on 31 January, according to a satellite image, and an ash plume was observed drifting 66 km NE.
Occasional explosions and ash plumes continued during early February. At 0850 on 1 February an ash plume rose to 3.5 km altitude and drifted 35 km NE. Satellite data showed an ash plume that rose to 3.2-3.5 km altitude and drifted 50 km NE at 1222 later that day (figure 22). A thermal anomaly was detected over the volcano during 5-6 February and ash plumes drifted as far as 125 km SE, E, and NE. Explosive events were reported at 0330 on 6 February that produced ash plumes rising to 4-4.5 km altitude and drifting 72-90 km N, NE, and ENE. KVERT noted that the last gas-and steam plume that contained some ash was observed on 8 February and drifted 55 km NE before the explosive eruption ended. The ACC was lowered to Yellow and then Green (the lowest level on a four-color scale) on 18 February.
Geologic Background. Chikurachki, the highest volcano on Paramushir Island in the northern Kuriles, is a relatively small cone constructed on a high Pleistocene edifice. Oxidized basaltic-to-andesitic scoria deposits covering the upper part of the young cone give it a distinctive red color. Frequent basaltic Plinian eruptions have occurred during the Holocene. Lava flows have reached the sea and formed capes on the NW coast; several young lava flows are also present on the E flank beneath a scoria deposit. The Tatarinov group of six volcanic centers is located immediately to the south, and the Lomonosov cinder cone group, the source of an early Holocene lava flow that reached the saddle between it and Fuss Peak to the west, lies at the southern end of the N-S-trending Chikurachki-Tatarinov complex. In contrast to the frequently active Chikurachki, the Tatarinov centers are extensively modified by erosion and have a more complex structure. Tephrochronology gives evidence of an eruption around 1690 CE from Tatarinov, although its southern cone contains a sulfur-encrusted crater with fumaroles that were active along the margin of a crater lake until 1959.
Information Contacts: Kamchatka Volcanic Eruptions Response Team (KVERT), Far East Division, Russian Academy of Sciences, 9 Piip Blvd., Petropavlovsk-Kamchatsky, 683006, Russia (URL: http://www.kscnet.ru/ivs/); Copernicus Browser, Copernicus Data Space Ecosystem, European Space Agency (URL: https://dataspace.copernicus.eu/browser/).
Search Bulletin Archive by Publication Date
Select a month and year from the drop-downs and click "Show Issue" to have that issue displayed in this tab.
The default month and year is the latest issue available.
Scientific Event Alert Network Bulletin - Volume 09, Number 01 (January 1984)
Managing Editor: Lindsay McClelland
Aira (Japan)
Lapilli damage car windshields; air shock breaks windows; 1983 explosions and ashfalls tabulated
Atmospheric Effects (1980-1989) (Unknown)
El Chichón cloud persists; lidar data to N Pole
Bagana (Papua New Guinea)
Two active lava flows
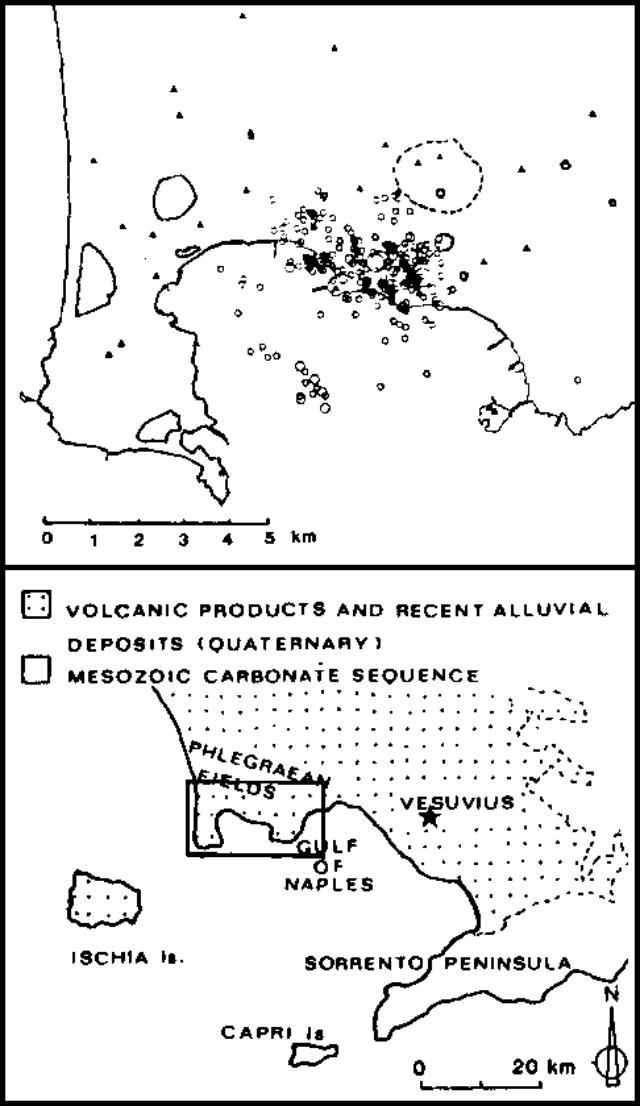
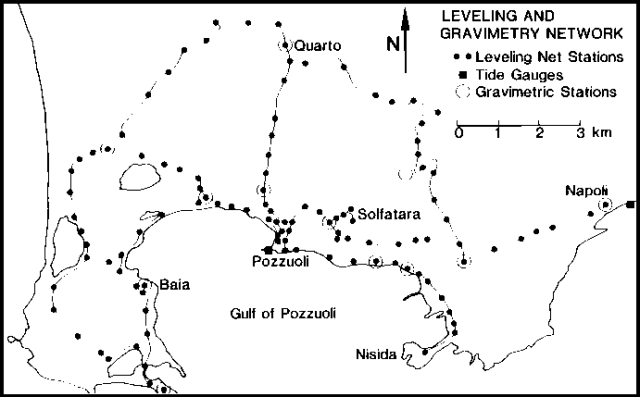
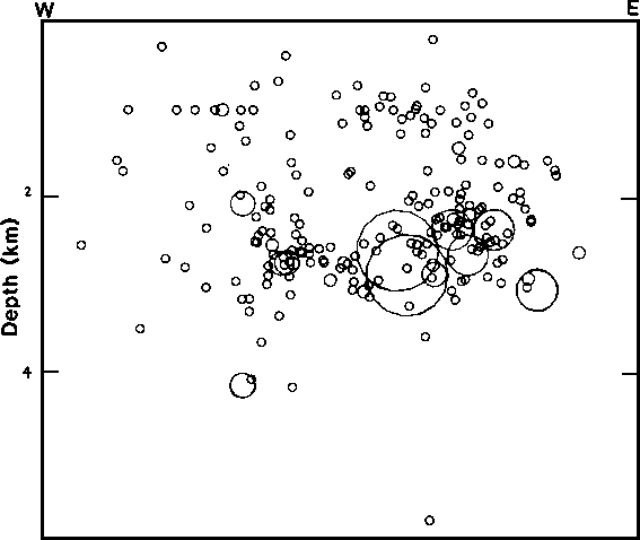
Campi Flegrei (Italy)
Uplift and seismicity in the caldera since mid-1982
Erebus (Antarctica)
Dimensions of active lava lake from photo data; seismicity normal; SO2 flux measured
Etna (Italy)
Incandescent tephra from central crater; seismicity
Fournaise, Piton de la (France)
Second phase of lava emission
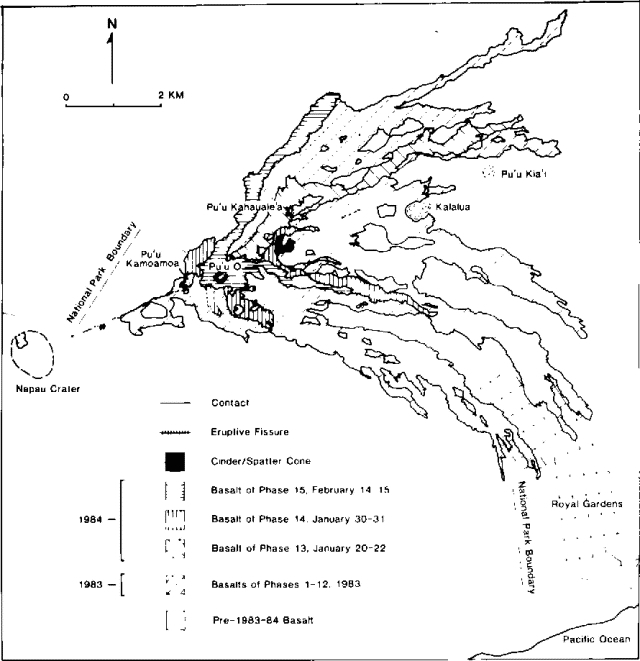
Kilauea (United States)
13th-15th major episodes of East Rift Zone eruption include lava fountains to 300 m and temperatures to 1,147°C
Kusatsu-Shiranesan (Japan)
1983 activity summarized
Langila (Papua New Guinea)
Vulcanian explosions; ashfalls on coast
Manam (Papua New Guinea)
Strombolian activity; explosion cloud to 3.5 km
Pavlof (United States)
Plumes on satellite imagery; harmonic tremor
Rabaul (Papua New Guinea)
Earthquakes, tilt indicate magma intrusion; eruption more likely within next few months
St. Helens (United States)
Deformation and seismicity then new lobe
Veniaminof (United States)
Lava fountains and flow continue
Aira
Japan
31.5772°N, 130.6589°E; summit elev. 1117 m
All times are local (unless otherwise noted)
Lapilli damage car windshields; air shock breaks windows; 1983 explosions and ashfalls tabulated
Recorded explosive eruptions were fewer in October (21) and November (16), but about as frequent in December (37) as in August [33] and September (36). About 1/4 of October's explosions were accompanied by large quantities of ejecta. On 10 October, the last and strongest of explosions at 1001, 1131 and 1351 sent an eruption column to 2.5 km above the summit. A large amount of lapilli broke windshields on two cars at Nojiri and Mochiki, at the SW foot of the volcano about 4 km from the summit. Activity remained at a relatively low level from late October to mid November. In late November stronger explosions were again frequently observed. During the first 12 explosions in December, observers at the Kagoshima Observatory witnessed lapilli ejection. Ejecta from an explosion at 1702 on 7 December broke a windshield at Usine in Tarumizu City (10 km SSE). 0n 13 December an explosion at 1028 generated an air shock that broke five windows in a hotel and one in a house. There were 413 recorded explosions in 1983, the second largest annual total since the current eruption began in 1955.
Geologic Background. The Aira caldera in the northern half of Kagoshima Bay contains the post-caldera Sakurajima volcano, one of Japan's most active. Eruption of the voluminous Ito pyroclastic flow accompanied formation of the 17 x 23 km caldera about 22,000 years ago. The smaller Wakamiko caldera was formed during the early Holocene in the NE corner of the caldera, along with several post-caldera cones. The construction of Sakurajima began about 13,000 years ago on the southern rim and built an island that was joined to the Osumi Peninsula during the major explosive and effusive eruption of 1914. Activity at the Kitadake summit cone ended about 4,850 years ago, after which eruptions took place at Minamidake. Frequent eruptions since the 8th century have deposited ash on the city of Kagoshima, located across Kagoshima Bay only 8 km from the summit. The largest recorded eruption took place during 1471-76.
Information Contacts: JMA, Tokyo.
Atmospheric Effects (1980-1989) (Unknown) — January 1984 Cite this Report
Atmospheric Effects (1980-1989)
Unknown
Unknown, Unknown; summit elev. m
All times are local (unless otherwise noted)
El Chichón cloud persists; lidar data to N Pole
NASA Airborne Lidar Mission, 37°N-North Pole. The following is a report from M. P. McCormick. "An airborne lidar mission was flown 19-28 January on the NASA Electra aircraft from 37°N to the North Pole, via Goose Bay, Labrador, and Söndre Strömfjord and Thule airbases, Greenland. The primary objective of the mission was to provide correlative stratosperic aerosol measurements for the SAM II (Stratospheric Aerosol Measurement) satellite, successfully accomplished on 3 separate satellite underflights.
"The El Chichón cloud was very consistent from 37°N-76°N, generally as a single broad layer with very little structure. From Thule a flight was conducted 24 January to the North Pole along the 60° W meridian to determine the northerly extent of the El Chichón material and to search for polar stratospheric clouds (PSC's, see below). As the aircraft proceeded north from Thule, considerable structure and varied intensity were observed in the El Chichón cloud, with an increase in peak scattering ratio.
"First detected by the SAM II satellite, PSC's are thought to be ice clouds that form during the Arctic and Antarctic winter by freezing of diluted sulfuric acid-water aerosol droplets at temperatures less than about -80° to -85°C, followed by rapid growth by sublimation (McCormick et al., 1982, and Steele et al., 1983). Nacreous or mother-of-pearl clouds are thought to be subsets of PSC's. From 85°N to the Pole, PSC's were detected for the first time by a remote sensor other than SAM II. They occurred at 19-21 km altitude, above the main El Chichón layer.
"A second flight was conducted 25 January from Thule to 86°N and PSC's were again detected within the temperature region of -85°C from about 81°N - 86°N. A third mission was flown 27 January from Thule to 87°N over the same flight path (60° meridian) and somewhat to the east. The El Chichón layer decreased in intensity and was less structured. There were no indications of PSC's, correlating with stratospheric temperature data, which showed that the low-temperature region had moved over the north pole toward Siberia. Returning to Virginia on 28 January, the same consistency was observed in the stratospheric layer as on the earlier northbound flight, with a slight decrease in peak scattering ratio.
"In addition to the uplooking airborne lidar, a downlooking lidar was used to study the tropospheric aerosols. In-situ measurements of aerosol mass and number density, CO2 and O3 were made over the full flight range at various altitudes during the mission.
Lidar data. At Mauna Loa, Hawaii, a distinct double aerosol layer was observed 3 January, similar to the pattern observed in December. No strong upper peak was present a week later, but numerous small layers were detected above the main lower peak. On 19 January, enhanced higher-altitude layers were no longer detected. Two distinct layers were observed over Fukuoka, Japan on 10 February, in contrast to the broad monolayer present a month earlier.
Lidar at Garmisch-Partenkirchen, West Germany continued to detect aerosols from the March-April 1982 eruption of El Chichón. Altitude and values of peak backscattering were slightly lower than in the summer but secondary peaks at higher altitudes were sometimes detected. Integrated backscattering between 1 km above the tropopause and the top of the aerosol layer, about 20% below expected values in the second half of September and the first half of October, rose to 70% above expected values 14 November as the tropopause altitude dropped to 9.9 km in arctic air and backscattering was enhanced between 9 and 13 km.
Unusual sunrises and sunsets. Edward Brooks reported that dawns and dusks indicated a variable and often weak aerosol layer over Jeddah, Saudi Arabia in late December and early January. Morning and evening colors on 26 December suggested that few scattering particles were present at either low or high altitudes. Stronger sunrises and sunsets were observed 27-30 December, but only late dawn colors, illuminating low-altitude aerosols, were visible 31 December. Dawns were essentially colorless 3 and 7-9 January; only late dawn colors (aerosols at low altitude) were visible on the 4th, while only early dawn colors (high-altitude material) were seen 2 days later.
From Millville, New Jersey, Fred Schaaf reported that twilight colors were usually weak to moderate in December and early January. On 16 December, early twilight colors merged into a strong crimson glow at 12° altitude, suggesting that the top of the scattering layer was at 13-18 km altitude. Colors were strong again the following evening and included secondary illumination to a solar depression angle of about 12°. As in previous months, the arrival of arctic air 24 December weakened twilight colors. On 8 January, weak to moderate colors were replaced suddenly by a milky area at 12° altitude, indicating the top of the aerosol layer at 13-16 km. The same evening, a secondary glow remained visible to an SDA of 10°. On 12 January, the time that illumination ended suggested that highest aerosols were at 11-13 km. Only early twilight colors were visible 19 January. A week later, timing of the end of purplish illumination indicated that aerosols reached 16-19 km altitude and a deep-hued secondary glow persisted for much longer. However, colors were very weak the following night. On 1 February, moderate colors disappeared at a time indicating aerosols reached 11-16 km.
References. McCormick, M. P., Steele, H. M., Hamill, P., Chu, W. P., and Swissler, T. J., 1982, Polar stratospheric cloud sightings by SAM II: Journal of the Atmospheric Sciences, v. 39, no. 6, p. 1387-1397.
Steele, H. M., Hamill, P., McCormick, M. P., and Swissler, T. J., 1983, The formation of polar stratospheric clouds: Journal of the Atmospheric Sciences, v. 40, no. 8, p. 2055-2067.
Geologic Background. The enormous aerosol cloud from the March-April 1982 eruption of Mexico's El Chichón persisted for years in the stratosphere, and led to the Atmospheric Effects section becoming a regular feature of the Bulletin. Descriptions of the initial dispersal of major eruption clouds remain with the individual eruption reports, but observations of long-term stratospheric aerosol loading will be found here.
Information Contacts: P. McCormick, NASA; R. Reiter, Garmisch-Partenkirchen, W. Germany; T. DeFoor, MLO; M. Fujiwara and M. Hirono, Kyushu Univ., Japan; E. Brooks, Saudi Arabia; F. Schaaf, Millville, NJ.
Bagana (Papua New Guinea) — January 1984 Cite this Report
Bagana
Papua New Guinea
6.137°S, 155.196°E; summit elev. 1855 m
All times are local (unless otherwise noted)
Two active lava flows
"The increase of summit activity noted in December resulted in [pulses of lava down the channel on the N flank] of the volcano from 5 January onwards. This lava remained active throughout the month and produced plumes of white and grey vapour."
Geologic Background. Bagana volcano, in a remote portion of central Bougainville Island, is frequently active. This massive symmetrical cone was largely constructed by an accumulation of viscous andesitic lava flows. The entire edifice could have been constructed in about 300 years at its present rate of lava production. Eruptive activity is characterized by non-explosive effusion of viscous lava that maintains a small lava dome in the summit crater, although occasional explosive activity produces pyroclastic flows. Lava flows with tongue-shaped lobes up to 50 m thick and prominent levees descend the flanks on all sides.
Information Contacts: P. Lowenstein, RVO.
Campi Flegrei (Italy) — January 1984 Cite this Report
Campi Flegrei
Italy
40.827°N, 14.139°E; summit elev. 458 m
All times are local (unless otherwise noted)
Uplift and seismicity in the caldera since mid-1982
"Campi Flegrei has been the site of slow vertical movements since at least Roman times. A slow subsidence had occurred since the last eruption in 1538. An uplift observed in 1970 continued until 1972 without significant seismic activity. The inferred maximum uplift with respect to previous levellings was 170 cm. Slow ground oscillations observed between 1972 and 1982 had an annual period with a range of about 10-15 cm/year in the zone of maximum uplift. Since the summer of 1982 oscillation has not reversed as in previous years. The overall uplift amounted to 110 cm between January 1982 and December 1983 in the zone of maximum movement, within the town of Pozzuoli in the center of the caldera. Repeated levelling surveys in the area have given evidence of an area of uplift of about 6 km radius with a fairly circular symmetry.
"In November 1982 moderate seismic activity was observed by the permanent seismic network that has been operating since 1972 (figure 1). The level of activity was slightly above the microseismic background in the area. In January 1983, public officials were notified of the anomalous trend of the phenomenon and the possibility of increasing seismic and volcanic hazard. In March, a distinct increase in seismic activity was observed with the first M 3 earthquake. Since then, ground uplift has continued with a velocity that reached 5 mm/day during October. After October, oscillations in the rate of uplift were observed, with a range between 1 and 4 mm/day. The seismic activity increased, following a trend similar to that of the uplift velocity. A M 4 earthquake occurred on 4 October when the rate of uplift reached 5 mm/day. This earthquake caused some building collapses (without injuries) in the town of Pozzuoli. Downtown Pozzuoli was evacuated after this event because of concern about the increasing seismic hazard. The main part of the town is built of old brick houses that were increasingly affected by the continuous seismic activity. On 13 October a seismic swarm of >250 shocks occurred in 5 hours. Maximum magnitude was 3.0.
"The people evacuated from Pozzuoli were temporarily resettled in the resort areas surrounding Campi Flegrei. A new settlement has already been planned on the border of the more vulnerable area. The choice of its location was made by public authorities to minimize the social consequences of evacuating people from their residences. The new settlement is relatively safe from a seismic point of view but is not safe from a maximum probable volcanic event.
"The permanent surveillance network operating in the area comprises measurements of ground deformation and seismic activity, and monitoring of gas content and temperatures of fumaroles. Temporary measurements of self-potential have been performed by a French team from the IPG.
"Vertical ground deformation is measured by a repeated levelling of the permanent network (figure 2) and is also checked daily by a tide gauge in Pozzuoli harbor. Measurements are referred to a tide gauge located in the nearest stable place in Naples. Horizontal deformation is also measured on a network covering Campi Flegrei. The data give evidence of a maximum extension of about 40 cm over 4 km, nearly coincident with the area of maximum vertical uplift.
"The permanent seismic network operating in the area is composed of 22 vertical seismometers, eight of which are operated by the Osservatorio Vesuviano (OV) and 14 by the AGIP company for the initial purpose of monitoring seismic activity connected with the geothermal field. Seven AGIP stations and the eight OV stations are cable-connected to a central point in Naples. Routine locations are made on these 15 stations using the HYP071 program. Subsequent analysis of data from all 22 stations is made utilizing the program LQUAKE by R. Crosson. The preliminary velocity model is based on data collected from the geothermal wells in the area. The shallow character of the seismic activity does not give any evidence of a zone of anomalous propagation of S waves. A seismic explosion campaign has been planned in the Gulf of Pozzuoli of to provide information on the deeper structure of the area.
"The earthquakes of higher magnitude are mainly confined within a restricted area under the Solfatara Crater. They are offset with respect to the area of maximum uplift and their mean depth is about 3 km (E-W profile is shown in figure 3). Preliminary focal mechanisms indicate a predominantly tensile field in this area. The data on temporal distribution of earthquakes indicate a swarm-type character. The event of maximum magnitude (4) occurred 4 October 1983 and its epicenter was in the Solfatara area. A close correlation seems to exist between the velocity of uplift and the seismic activity. The more energetic earthquakes seem to coincide with the higher rates of uplift (4-5 mm/day).
"A cross-cooperation with seimologists from the Univ of Wisconsin is under way. A temporary network of ten 3-component stations with high dynamic range has already been deployed in the area and will be operating for some months. A temporary network of 3-component stations was also operated during November 1983 by IPG seismologists.
"Since April 1983, radon measurements have been made in water wells located in the area. The data are still too preliminary to infer any model. We await a prolonged period of measurements to infer what may be the seasonal trend. Temperatures of the Solfatara fumaroles are also continuously monitored. No significant change has been detected.
"Gas monitoring of the Solfatara fumaroles is carried out by several teams from the Universities of of Pisa, Palermo and Florence, both by continuous measurement and periodic sampling. Preliminary data seem to indicate an increase in the energy flux supplied to the deep water table located at 1.2 km depth by the geothermal wells.
"Two detailed surveys of the helium content of the ground have been performed by a team from the Univ of Rome. Order of magnitude variations have been detected in a large area NW of Pozzuoli."
Reference. Nunziata, C., and Rapolla, A., 1981, Interpretation of gravity and magnetic in the Phlegraean Fields Geothermal Area, Naples, Italy: JVGR, v. 9, p.
Geologic Background. Campi Flegrei is a 13-km-wide caldera that encompasses part of Naples and extends to the south beneath the Gulf of Pozzuoli. Episodes of significant uplift and subsidence within the dominantly trachytic caldera have occurred since Roman times. The earliest known eruptive products are dated 47,000 years BP. The caldera formed following two large explosive eruptions, the massive Campanian ignimbrite about 36,000 BP, and the over 40 km3 Neapolitan Yellow Tuff (NYT) about 15,000 BP. Following eruption of the NYT a large number of eruptions originated from widely scattered subaerial and submarine vents. Most activity occurred during three intervals: 15,000-9,500, 8,600-8,200, and 4,800-3,800 BP. The latest eruption were in 1158 CE at Solfatara and activity in 1538 CE that formed the Monte Nuovo cinder cone.
Information Contacts: G. Luongo and R. Scandone, OV; F. Barberi, Univ. di Pisa.
Erebus (Antarctica) — January 1984 Cite this Report
Erebus
Antarctica
77.53°S, 167.17°E; summit elev. 3794 m
All times are local (unless otherwise noted)
Dimensions of active lava lake from photo data; seismicity normal; SO2 flux measured
"Volcanic activity at Mt. Erebus was observed in November and December 1983 by scientists from New Zealand and the U.S. The persistent convecting anorthoclase phonolite lava lake still existed and displayed activity similar to that observed over the last few years. Since 1976 its surface area has remained relatively constant. A recent airphoto showing the lava lake allowed a more precise determination of its size. The photo showed that the lake was ovoid and ~60 m long by ~45 m wide, considerably smaller than other ground-based observations have suggested.
"It has been previously reported that the level of the lava lake was dropping. A recent analysis of ground-based photographs makes it difficult to confirm a substantial lowering in the lake surface relative to other features seen on the Inner Crater floor. A small amount of lowering was documented in the 1979-80 austral summer field season, when a distinct bench with fumaroles rimmed the lake. However, the volcanic gas plume from the lake makes it extremely difficult to determine the lava lake height using simple visual estimates from the crater rim. Deformation studies currently in progress by NZGS personnel should give a better indication of the changes in the lava lake.
"The seismic network on Mt. Erebus was expanded by University of Alaska and Japanese personnel. Six radio-telemetry stations consisting of a single vertical-component seismometer are now situated on the flanks of the mountain. An additional station near the summit is presently inoperative. Three other stations are placed at sites 30-40 km from the summit of Mt. Erebus. Preliminary analysis of the seismic records show the level of seismicity to be normal.
"Airborne observations made using a C130 aircraft included sampling the plume for particle size distribution, and remote sensing using a COSPEC to determine SO2 flux, which was 230 ± 90 t/d [on 19 December]."
Further Reference. Chuan, R.L., Palais, J., and Rose, W.I., 1986, Fluxes, sizes, morphology, and compositions of particles in the Mt. Erebus volcanic plume, December 1983: Journal of Atmospheric Chemistry, v. 4, p. 467-477.
Geologic Background. Mount Erebus, the world's southernmost historically active volcano, overlooks the McMurdo research station on Ross Island. It is the largest of three major volcanoes forming the crudely triangular Ross Island. The summit of the dominantly phonolitic volcano has been modified by one or two generations of caldera formation. A summit plateau at about 3,200 m elevation marks the rim of the youngest caldera, which formed during the late-Pleistocene and within which the modern cone was constructed. An elliptical 500 x 600 m wide, 110-m-deep crater truncates the summit and contains an active lava lake within a 250-m-wide, 100-m-deep inner crater; other lava lakes are sometimes present. The glacier-covered volcano was erupting when first sighted by Captain James Ross in 1841. Continuous lava-lake activity with minor explosions, punctuated by occasional larger Strombolian explosions that eject bombs onto the crater rim, has been documented since 1972, but has probably been occurring for much of the volcano's recent history.
Information Contacts: P. Kyle, New Mexico Inst. of Mining & Tech.; W. Rose, Michigan Tech. Univ.
Etna
Italy
37.748°N, 14.999°E; summit elev. 3357 m
All times are local (unless otherwise noted)
Incandescent tephra from central crater; seismicity
"Beginning in December, numerous seismic crises were recorded, mainly connected to the degassing of the magma column through the central vents. In the same period, ejections of reddish ash (old material) or dark ash (fresh material) occurred from the central crater. At times (14, 16, and 28 January) these have been rather significant, depositing thin layers of ash on the E flank. Some nights, pulsating flashes, due to the ejection of incandescent material from Bocca Nuova were observed. Tiltmeter variations were also recorded."
Geologic Background. Mount Etna, towering above Catania on the island of Sicily, has one of the world's longest documented records of volcanism, dating back to 1500 BCE. Historical lava flows of basaltic composition cover much of the surface of this massive volcano, whose edifice is the highest and most voluminous in Italy. The Mongibello stratovolcano, truncated by several small calderas, was constructed during the late Pleistocene and Holocene over an older shield volcano. The most prominent morphological feature of Etna is the Valle del Bove, a 5 x 10 km caldera open to the east. Two styles of eruptive activity typically occur, sometimes simultaneously. Persistent explosive eruptions, sometimes with minor lava emissions, take place from one or more summit craters. Flank vents, typically with higher effusion rates, are less frequently active and originate from fissures that open progressively downward from near the summit (usually accompanied by Strombolian eruptions at the upper end). Cinder cones are commonly constructed over the vents of lower-flank lava flows. Lava flows extend to the foot of the volcano on all sides and have reached the sea over a broad area on the SE flank.
Information Contacts: R. Romano, IIV.
Piton de la Fournaise (France) — January 1984 Cite this Report
Piton de la Fournaise
France
21.244°S, 55.708°E; summit elev. 2632 m
All times are local (unless otherwise noted)
Second phase of lava emission
"A second eruptive phase began on 18 January at 0454, preceded by inflation of the summit area that began in early January. A seismic swarm of about 50 low-energy events occurred between 0313 and 0454 on 18 January when harmonic tremor began. The eruptive fissure of the first phase, which began on 4 December, was still active (but with virtually no explosive activity and a low level of effusive activity) when the second phase began, but apparently ceased during the day on 18 January.
"Two new eruptive fissures formed ~400 m NNW of the main first phase fissure. Activity at the upper one rapidly decreased, and stopped at 0200 on 19 January. The other, ~200 m long, sustained lava fountaining more than 80 m high 18-19 January. The fountains produced a large amount of Pele's hair that was transported SW by wind and deposited on inhabited areas, causing a potential hazard for livestock grazing in the area. Emergency measures were taken by local authorities; fortunately, heavy rains and wind 19-23 January washed away most of the tephra that remained on the grass.
"During 18 January, the lava discharge was vigorous (up to 100 m3/s). At 1200 the flow extended 4 km from the vents. Inflation, possibly related to the emplacement of an intrusion, was measured on 18 January, showing the same pattern as after the start of the first phase on 4 December.
"On 24 January, the eruption was localized at two vents that were building two cinder cones. On 27 January, only one of the vents was still active. Eruptive activity was continuing as of 8 February."
Geologic Background. Piton de la Fournaise is a massive basaltic shield volcano on the French island of Réunion in the western Indian Ocean. Much of its more than 530,000-year history overlapped with eruptions of the deeply dissected Piton des Neiges shield volcano to the NW. Three scarps formed at about 250,000, 65,000, and less than 5,000 years ago by progressive eastward slumping, leaving caldera-sized embayments open to the E and SE. Numerous pyroclastic cones are present on the floor of the scarps and their outer flanks. Most recorded eruptions have originated from the summit and flanks of Dolomieu, a 400-m-high lava shield that has grown within the youngest scarp, which is about 9 km wide and about 13 km from the western wall to the ocean on the E side. More than 150 eruptions, most of which have produced fluid basaltic lava flows, have occurred since the 17th century. Only six eruptions, in 1708, 1774, 1776, 1800, 1977, and 1986, have originated from fissures outside the scarps.
Information Contacts: J. Lenat, A. Bonneville, C. Hemond, F. Lalanne, and P. Tarits, OVPDLF, Réunion; P. Bachelery and J. Bougeres, Univ. de la Réunion.
Kilauea (United States) — January 1984 Cite this Report
Kilauea
United States
19.421°N, 155.287°W; summit elev. 1222 m
All times are local (unless otherwise noted)
13th-15th major episodes of East Rift Zone eruption include lava fountains to 300 m and temperatures to 1,147°C
"Kīlauea's episodic E rift zone eruption resumed in late January after 7 weeks of repose characterized by a desultory pattern of summit inflation, vanishingly weak harmonic tremor, and the virtual disappearance of magmatic gas at the vent. Episode 13 occurred 20-22 January, and episode 14 on 30-31 January. As in episodes 4-12, the eruptive vent for episodes 13 and 14 was at Pu'u O (figure 24).
EPISODE 13
"Episode 12, which ended on 1 December 1983, left a complex of craters separated by low septa in the interior of Pu'u O. The largest and most central of the craters narrowed downward into a nearly vertical pipe about 20 m in diameter and at least 90 m long.
"On 20 January, harmonic tremor in the eruption zone increased gradually beginning at about 1030, and at 1117 HVO personnel first sighted moving lava about 50 m down in the pipe; by mid-afternoon the lava column could be seen slowly rising within the pipe. At 1724, the lava, which had by then filled the pipe and spread across the 30-40 m-wide floor of the crater, began to flow through the deep breach in the crater's NE rim. Supplied at a rate of approximately 10,000 m3/hour (an order of magnitude less than normal minimum rates for vigorous eruption at Pu'u O), the lava began advancing NE in the channel evacuated at the end of episode 12. By this time, tremor amplitude had increased tenfold.
"As the lava rising within Pu'u O approached and overflowed the spillway, the lava surface, from which a low dome fountain repeatedly rose and fell, was agitated, resembling a rolling boil in a saucepan. Over the next few hours, the vigor of lava emission and fountain activity gradually increased, accompanied by increasingly intense harmonic tremor.
"Unlike some of the recent previous episodes, in which a complex of fountains formed within Pu'u O as well as on its rim and flanks, episode 13 developed a single fountain over the large central conduit. The production of lava, normally steady in previous episodes, pulsed strongly. At intervals on the order of 0.5-1 minute the flux of lava in the channel and the height of the fountain waxed and waned. Hence, the fountain alternated rapidly from about the height of the crater rim (30-40 m above the pond surface within the crater) to as much as 40 or 50 m above the crater rim. The repeated increases in discharge of lava caused surges that advanced at about 10 m/s down the first 100 m or so of the lava channel.
"Episode 13 effusion stopped temporarily on 22 January at about 0030. During this first 31-hour period the lava river debouching from Pu'u O fed a 7 km-long flow that advanced NE. It split into 2 lobes (at Pu'u Kahauale'a) that rejoined farther NE. Continuous eruptive activity resumed at about 0530; it was preceded by an hour of intermittent, low fountain activity. The fountain was visible above the rim of Pu'u O by 0550, and effusion accompanied by renewed intense harmonic tremor continued until the eruptive activity waned sporadically from 1115 to its termination at 1123. This 6-hour period produced a second flow that advanced directly on top of the first; it followed the fork N of Pu'u Kahauale'a and stopped about 3 km NE of Pu'u O. The two effusive periods each terminated with [discontinuous] lava emission such that the fountain disappeared and reappeared repeatedly for a period of several minutes. Simultaneously, harmonic tremor decayed with marked alternations in amplitude.
Repose-period activity. "After episode 13, the interior of Pu'u O was a single bowl-like crater with a narrowing conduit, about 25 m wide at its mouth, extending downward from the crater floor. Throughout the entire repose period between episodes 13 and 14, the surface of a lava column was visible at depths of 0-25 m in the conduit. Sometimes fresh to barely crusted lava was exposed at the pond surface; at other times the pond surface was a solid frozen crust through which a small (0.5-3 m) orifice accommodated intermittent venting of magmatic gas, spatter, and small flows. At times, emission of spatter and gas through the small vent in the crust or alternating rise and fall of the fluid pond surface through a vertical interval of 10-15 m became strongly rhythmic with cycles about 4-6 minutes long. The activity closely resembled the gas-piston activity noted in Mauna Ulu lava ponds (1969-1974). In a typical cycle at Pu'u O, the pond surface appeared deep in the conduit and slowly rose for about 4 minutes. It remained poised momentarily, became agitated, and the lava then drained rapidly out of sight in about 1/2 minute. Draining was accompanied by emission of a plume of magmatic gas and a brief increase in tremor amplitude. After 1.5 minutes, lava would reappear deep in the conduit. When last visited in the early afternoon of 30 January, the lava pond had filled the steep-walled conduit and had begun to spread across the more gently sloping floor of the crater. About 30 m in diameter, the pond surface was about 5 m below the low point in the breach of the crater's NE rim. The surface was solid, and gas under pressure along with minor spatter issued intermittently with a deafening roar from a 0.5 m-diameter vent in the crust. Gas samples from this vent showed that there had been no change in gas composition during more than a year of eruptive activity.
EPISODE 14
"At about 1030 on 30 January, the amplitude of harmonic tremor began a gradual and persistent increase that reached a high level by about 1830, when glow and visible fountains of episode 14 were first reported. Observations from a vantage point in the upper E rift zone as well as from the S coast of Kīlauea indicate that in the evening hours the sustained height of the fountain at Pu'u O was 150-200 m above the rim of the cone, and bursts of spatter were rising as high as 300 m. By morning, when observers arrived at the vent, the single fountain, again centered over the large central conduit, was lower; through the remainder of episode 14 the fountain height fluctuated at intervals of 10-20 seconds from low (commonly 10-20 m above the rim of the cone) to high levels (up to about 80-100 m above the rim of the cone). The high bursts produced tephra plumes and short-lived spatter-fed flows on the flanks of Pu'u O.
"Flows to the N and E (figure 24) were fed by distributary channels branching from the lava river that poured through the breached NE crater rim. The longest flow extended about 4 km from the vent. It turned SE and extended about halfway to Royal Gardens subdivision. A thick aa flow, fed entirely by spatter that cascaded over the S rim of the cone, advanced about 1.5 km S.
"Between 1315 and 1318 on 31 January lava emission declined, once again in spasmodic fits and starts. Harmonic tremor also decreased rapidly beginning at 1315, marking the eruption's end. In early February, the level of tremor, like that between episodes 13 and 14, was considerably higher than the background level during many of the previous repose periods.
"Following episode 14, the crater of Pu'u O was again a broad, steep-walled bowl from which a 20 m-diameter conduit extended nearly vertically downward. A 30-40 m-deep cleft in the NE crater rim marked the breach through which lava exited the crater.
Petrology. "Basalt of episodes 13 and 14 is sparsely porphyritic with scattered small olivine phenocrysts visible in hand-lens view. Lava temperatures measured by thermocouple were 1,129-1,131°C in the first few hours of episode 13. Subsequent episode 13 temperatures were 1,140-1,147°C, and include the highest temperature measured so far in this series of eruptions. During episode 14, temperatures, measured only at the edges of the widespread pahoehoe flow N of Pu'u O, were 1,136-1,137°C.
Deformation. Rapid summit subsidence, as recorded by the Uwekahuna tiltmeter, began at 2100 on 20 January and again at 1930 on 30 January-in each case a short time after vigorous eruption was under way. Resumption of inflationary tilt followed the end of each eruption by several hours. E-W deflationary changes measured at Uwekahuna were 11 µrad for episode 13 and 10 µrad for episode 14. This suggests that a minimum of 8 x 10⁶ m3 of magma was withdrawn from the summit reservoir system during episodes 13 and 14."
Addendum: Episode 15 began at about 1945 on 14 February with a sharp increase in harmonic tremor. Summit deflation began about 2 hours later. During the evening, lava fountains rose as high as 300 m from the previously active vent at Pu'u O. Vigorous lava fountaining continued the next morning and lava flowed E and NE from Pu'u O. Eruptive activity ceased at about 1500 on 15 February.
Geologic Background. Kilauea overlaps the E flank of the massive Mauna Loa shield volcano in the island of Hawaii. Eruptions are prominent in Polynesian legends; written documentation since 1820 records frequent summit and flank lava flow eruptions interspersed with periods of long-term lava lake activity at Halemaumau crater in the summit caldera until 1924. The 3 x 5 km caldera was formed in several stages about 1,500 years ago and during the 18th century; eruptions have also originated from the lengthy East and Southwest rift zones, which extend to the ocean in both directions. About 90% of the surface of the basaltic shield volcano is formed of lava flows less than about 1,100 years old; 70% of the surface is younger than 600 years. The long-term eruption from the East rift zone between 1983 and 2018 produced lava flows covering more than 100 km2, destroyed hundreds of houses, and added new coastline.
Information Contacts: E. Wolfe, A. Okamura, R. Koyanagi, T. Duggan, R. Okamura, HVO.
Kusatsu-Shiranesan (Japan) — January 1984 Cite this Report
Kusatsu-Shiranesan
Japan
36.618°N, 138.528°E; summit elev. 2165 m
All times are local (unless otherwise noted)
1983 activity summarized
1983 activity is summarized in table 1; locations are on figure 1.
Table 1. Seismic activity at Kusatsu-Shirane, 1983. Courtesy of JMA.
| Month |
Discrete Seismic Events |
Continuous Tremor |
Remarks |
| Jan 1983 |
Observed swarms |
Observed |
Rumbling at the summit. |
| Mar 1983 |
Observed swarms |
-- |
Increased fumarolic activity at Pit No. 2. |
| Apr 1983 |
-- |
Observed |
White plumes from Pits No. 2, No. 7, and a fumarole on the N inner wall of Yugama; N edge of frozen Yugama lake melted. |
| Jun 1983 |
Observed swarms |
-- |
-- |
| Jul 1983 |
Observed swarms |
Almost at noise level |
Small eruption at Pit No. 6, NW wall of Yugama, on 26 July; small amount of ash. |
| Nov 1983 |
Observed swarms |
Observed during eruptive activity |
Explosive eruption at NW inner wall of Yugama and at Karagama on 13 Nov; a larger amount of ejecta. |
| Dec 1983 |
Observed swarms |
Observed during eruptive activity |
-- |
Further Reference. The 1982-1983 eruptions of Kusatsu-Shirane volcano, in XIX IUGG General Assembly, 1987, Report on volcanic activities and volcanological studies in Japan for the period from 1983 to 1986, p. 5-8.
Geologic Background. The Kusatsu-Shiranesan complex, located immediately north of Asama volcano, consists of a series of overlapping pyroclastic cones and three crater lakes. The andesitic-to-dacitic volcano was formed in three eruptive stages beginning in the early to mid-Pleistocene. The Pleistocene Oshi pyroclastic flow produced extensive welded tuffs and non-welded pumice that covers much of the E, S, and SW flanks. The latest eruptive stage began about 14,000 years ago. Historical eruptions have consisted of phreatic explosions from the acidic crater lakes or their margins. Fumaroles and hot springs that dot the flanks have strongly acidified many rivers draining from the volcano. The crater was the site of active sulfur mining for many years during the 19th and 20th centuries.
Information Contacts: JMA, Tokyo.
Langila (Papua New Guinea) — January 1984 Cite this Report
Langila
Papua New Guinea
5.525°S, 148.42°E; summit elev. 1330 m
All times are local (unless otherwise noted)
Vulcanian explosions; ashfalls on coast
"Activity remained high at Crater 2, but Vulcanian explosions replaced the more continuous activity that produced the lava flow on the NE flank in December. For most of the time, Crater 2 produced moderate amounts of white to brown ash-laden vapour, accompanied by discontinuous rumbling and explosion sounds, while the seismic station at Cape Gloucester airstrip, 9 km away, recorded discontinuous tremors and large explosion earthquakes. Peaks of activity occurred on 7, 12, and 25 January with emission of columns of thick dark tephra-laden vapour to heights of 1.5-2.5 km above the crater. Large blocks were ejected as far as 2 km from the vent by the more powerful explosions, and ashfalls were experienced on the coast, 10 km downwind. Activity at Crater 3 was confined to the emission of white and blue vapours."
Geologic Background. Langila, one of the most active volcanoes of New Britain, consists of a group of four small overlapping composite basaltic-andesitic cones on the lower E flank of the extinct Talawe volcano in the Cape Gloucester area of NW New Britain. A rectangular, 2.5-km-long crater is breached widely to the SE; Langila was constructed NE of the breached crater of Talawe. An extensive lava field reaches the coast on the N and NE sides of Langila. Frequent mild-to-moderate explosive eruptions, sometimes accompanied by lava flows, have been recorded since the 19th century from three active craters at the summit. The youngest and smallest crater (no. 3 crater) was formed in 1960 and has a diameter of 150 m.
Information Contacts: P. Lowenstein, RVO.
Manam (Papua New Guinea) — January 1984 Cite this Report
Manam
Papua New Guinea
4.08°S, 145.037°E; summit elev. 1807 m
All times are local (unless otherwise noted)
Strombolian activity; explosion cloud to 3.5 km
"The eruptive activity continued through January. It consisted of night glow at both Main and Southern craters, and frequent Strombolian ejections of glowing lava fragments up to several hundred meters above Southern crater. Explosion noises and sub-continuous rumbling sounds were heard. Scoria and bombs ejected from Southern crater avalanched down the SW and SE valleys.
"Beginning 13 January, the amplitude of recorded B-type earthquakes started to increase considerably, although their number remained about 2,000/day. From 18-26 January, the amplitudes of events increased to about four times normal. At 1155 on 26 January, a large explosion from Southern crater produced a voluminous, dark ash-laden plume rising to 3.5 km. The amplitude of the sub-continuous tremor and B-type events then returned rapidly to normal. Up to 3 mm of ash were deposited on the coastal areas. For the remainder of January, the Strombolian activity continued at the same level as at the beginning of the month."
Geologic Background. The 10-km-wide island of Manam, lying 13 km off the northern coast of mainland Papua New Guinea, is one of the country's most active volcanoes. Four large radial valleys extend from the unvegetated summit of the conical basaltic-andesitic stratovolcano to its lower flanks. These valleys channel lava flows and pyroclastic avalanches that have sometimes reached the coast. Five small satellitic centers are located near the island's shoreline on the northern, southern, and western sides. Two summit craters are present; both are active, although most observed eruptions have originated from the southern crater, concentrating eruptive products during much of the past century into the SE valley. Frequent eruptions, typically of mild-to-moderate scale, have been recorded since 1616. Occasional larger eruptions have produced pyroclastic flows and lava flows that reached flat-lying coastal areas and entered the sea, sometimes impacting populated areas.
Information Contacts: P. Lowenstein, RVO.
Pavlof (United States) — January 1984 Cite this Report
Pavlof
United States
55.417°N, 161.894°W; summit elev. 2493 m
All times are local (unless otherwise noted)
Plumes on satellite imagery; harmonic tremor
Six explosions were recorded between 1600 and 2000 on 15 December by Lamont-Doherty's 5-station seismic net 4.5-10 km from the volcano. One station, about [8.5] km from Pavlof, detected bursts of harmonic tremor 17 December, 1100-18 December, 0330; 18 December, 0530-0615 and 1040-1110; 20 December, 2200-2245; and 21 December, 2035-2048. Seismicity then decreased to the background level of several tens of events per day and remained at that level as of 26 January.
Eruption plumes were observed on three images returned 15-17 December from the NOAA 8 polar orbiting satellite. The images at 2101 on the 15th and 1031 on the 17th showed well-defined, relatively dense plumes extending 225 km E and 400 km NE from Pavlof above the weather cloud layer. A diffuse plume was observed on the image at 2018 on 18 December. No volcanic plumes were observed on other images 15-21 December, but heavy weather clouds obscured the area. There have been no eyewitness reports of eruptive activity since airline pilots last reported eruption clouds from Pavlof at 1400 on 15 December.
Geologic Background. The most active volcano of the Aleutian arc, Pavlof is a Holocene stratovolcano that was constructed along a line of vents extending NE from the Emmons Lake caldera. Pavlof and Pavlof Sister to the NE form a dramatic pair of symmetrical, glacier-covered stratovolcanoes that overlook Pavlof and Volcano bays. Little Pavlof is a smaller cone on the SW flank of Pavlof volcano, near the rim of Emmons Lake caldera. Unlike Pavlof Sister, eruptions have frequently been reported from Pavlof, typically Strombolian to Vulcanian explosive eruptions from the summit vents and occasional lava flows. The active vents lie near the summit on the north and east sides. The largest recorded eruption took place in 1911, at the end of a 5-year-long eruptive episode, when a fissure opened on the N flank, ejecting large blocks and issuing lava flows.
Information Contacts: S. McNutt, LDGO; M. E. Yount, USGS, Anchorage; M. Matson and W. Gould, NOAA/NESDIS.
Rabaul (Papua New Guinea) — January 1984 Cite this Report
Rabaul
Papua New Guinea
4.2459°S, 152.1937°E; summit elev. 688 m
All times are local (unless otherwise noted)
Earthquakes, tilt indicate magma intrusion; eruption more likely within next few months
"There was a marked increase in the amount of unrest in Rabaul Caldera during January, with a total of 8,372 volcanic earthquakes recorded, an increase of 1,255 over the December total.
"A major seismic crisis took place on 15 January when 942 earthquakes occurred, including several strongly felt events. The maximum magnitude earthquake (ML 4.9) was accompanied by underground rumbling sounds. This crisis was accompanied by a maximum tilt change of 32.5 µrad at [a station immediately N of Greet Harbour] . . . .
"The overall distribution of earthquakes in January was similar to that in December, with high concentrations on the NE (Greet Harbour) and W (Karavia Bay) sides of the harbour. . . . Steady inflation of the Karavia Bay and Greet Harbour magma reservoirs continued throughout the month. . . .
"As a result of the increased activity in January, a warning was issued to the authorities to the effect that the eruption, which was previously thought to be only a possibility when the Stage-2 volcanic alert was declared on 29 October, was now much more likely to occur within the next few months."
Geologic Background. The low-lying Rabaul caldera on the tip of the Gazelle Peninsula at the NE end of New Britain forms a broad sheltered harbor utilized by what was the island's largest city prior to a major eruption in 1994. The outer flanks of the asymmetrical shield volcano are formed by thick pyroclastic-flow deposits. The 8 x 14 km caldera is widely breached on the east, where its floor is flooded by Blanche Bay and was formed about 1,400 years ago. An earlier caldera-forming eruption about 7,100 years ago is thought to have originated from Tavui caldera, offshore to the north. Three small stratovolcanoes lie outside the N and NE caldera rims. Post-caldera eruptions built basaltic-to-dacitic pyroclastic cones on the caldera floor near the NE and W caldera walls. Several of these, including Vulcan cone, which was formed during a large eruption in 1878, have produced major explosive activity during historical time. A powerful explosive eruption in 1994 occurred simultaneously from Vulcan and Tavurvur volcanoes and forced the temporary abandonment of Rabaul city.
Information Contacts: P. Lowenstein, RVO.
St. Helens (United States) — January 1984 Cite this Report
St. Helens
United States
46.2°N, 122.18°W; summit elev. 2549 m
All times are local (unless otherwise noted)
Deformation and seismicity then new lobe
A new phase of the ongoing activity began with increasing deformation and seismicity in late January 1984, followed by the extrusion of a new lobe near the dome's summit.
Numerous rockfalls occurred in December after the active lobe had reached the top of the dome's steep S and SE flanks. Rockfalls from that area were infrequent in January, suggesting that the advance of the lobe had nearly stopped. Deformation of the dome's SE flank accelerated briefly in late December to more than 50 cm/day, but slowed by an order of magnitude in early January and remained at 5-6 cm/day through the end of the month. On the NE flank, rates of outward movement remained relatively high through 4 January. On 9 January, when weather next allowed access to the crater, NE flank deformation had slowed and a new mound was perched just E of the dome's summit (SEAN 08:12). The surface of the mound was old material, but it was apparently cored by magma. It reached its maximum elevation 20 January, then subsided slowly. Earthquakes remained relatively numerous through 9 January, but the period 10-17 January was the quietest seismically since late September, with the number of events per day dropping from about fourteen to two to six and energy release declining to near background level.
In mid-January, points on the floor of the crater's breach, about 1 km N of the dome, began to move outward, and medium-frequency events started to appear on seismic records. Energy release remained low but the number of medium-frequency events increased gradually through the end of January. Gas ejection episodes increased noticeably in duration and amplitude on seismic records. By 23 January, some were followed by several minutes of weak harmonic tremor. Vigorous plumes were observed and small blocks were deposited on the crater floor. SO2 emission averaged 90 ± 40 t/d during the first 3 weeks of January (as compared to 105 ± 25 t/d in December), but dropped to 35 ± 20 t/d for the remainder of the month and was below detection limits 26-28 January. A fairly large gas-and-ash ejection on the 28th was not followed by the typical temporary several-fold increase in SO2 flux.
New cracks were observed on top of the dome 29 January. A graben was evident on its SW side by 1 February, and radial cracks had appeared on the W side. By 3 February, the graben was a few tens of meters wide and a few meters deep, extending across the summit crater. Deformation began to accelerate rapidly. A point halfway up the N flank of the dome that had moved outward no more than a few centimeters per day through most of January showed rates of 11.6 cm/day on 30 January, 46 cm/day on 3 February and about 1 m/day by the 5th. Deformation changes on the SE flank were less dramatic, but rates also increased, from 6 cm/day through 3 February to 20 cm/day on 5 February (all rates are average daily changes since the previous measurement). This activity was accompanied by a rapid increase in the number of earthquakes and seismic energy release beginning 1 February. SO2 emission increased to 55 t/d 1 February and reached 140 t/d on the 6th.
When geologists arrived at the crater 6 February they observed a new mound filling the NW part of the dome's summit crater. The early January mound, about 100 m to the E, was subsiding. That evening, a small landslide from the E side of the dome moved 50-100 m to the main crater wall, causing minor snowmelt. The next day, the new mound had elongated and extended a short distance down the dome's N flank, while the January mound continued to subside. The surface of the new mound, like the January mound, was old material. No glow from the new mound was observed at night. N flank displacement was 2.4 m between 5 and 6 February, and rates of 3 m per day were measured on the 6th. SO2 emission increased to 140 t/d on 6 February and 170 t/d the next day. Seismicity peaked during the evening of 7 February, dropping sharply in the next 24 hours to only slightly elevated levels. The number of rockfall events increased but they were smaller and less frequent than during previous extrusion episodes. Poor weather prevented access to the crater after 6 February. A brief glimpse of the dome on 10 February revealed a new lobe perched on its summit. . . . The new lobe appeared to be hot; snow had accumulated on the rest of the dome, but not on the new lobe.
Geologic Background. Prior to 1980, Mount St. Helens was a conical volcano sometimes known as the Fujisan of America. During the 1980 eruption the upper 400 m of the summit was removed by slope failure, leaving a 2 x 3.5 km breached crater now partially filled by a lava dome. There have been nine major eruptive periods beginning about 40-50,000 years ago, and it has been the most active volcano in the Cascade Range during the Holocene. Prior to 2,200 years ago, tephra, lava domes, and pyroclastic flows were erupted, forming the older edifice, but few lava flows extended beyond the base of the volcano. The modern edifice consists of basaltic as well as andesitic and dacitic products from summit and flank vents. Eruptions in the 19th century originated from the Goat Rocks area on the N flank, and were witnessed by early settlers.
Information Contacts: R. Holcomb, T. Casadevall, USGS CVO, Vancouver, WA; S. Malone, University of Washington.
Veniaminof (United States) — January 1984 Cite this Report
Veniaminof
United States
56.17°N, 159.38°W; summit elev. 2507 m
All times are local (unless otherwise noted)
Lava fountains and flow continue
Perryville residents observed glow over the summit of the volcano during the evenings of 31 December, and 3, 4, 11, and 13 January. Activity intensified on 17 January, when they observed lava fountains as high as 200 m. The fountains were active for 30-45-minute periods, waned for indefinite intervals, then resumed.
During an overflight by USGS personnel between 1345 and 1410 on 23 January, billowing white vapor clouds rose from the summit area of the intra-caldera cone to approximately 3-4 km altitude and were blown E (figures 5 and 6). There was no ash in the eruption plume or on the area surrounding the cone. Fountains rose 10-20 m and lava flowed from a vent about 100 m below the summit of the cinder cone that has grown during the eruption to nearly fill the crater of the intra-caldera cone. The lava flow, estimated at 10-20 m wide, was confined by steep levees and extended more than 200 m onto the lava delta formed by earlier flows that covered the entire floor of the ice pit. Although the surface of the lava delta was irregular, its average thickness was estimated at about 30 m. USGS personnel estimated that approximately 45 x 106 m3 of lava has filled the ice pit since June.
The ice pit had increased in size since the last overflight on 4 November to more than 2 km by about 1 km (compare figures 5 and 2). Steam rose from numerous sites on the perimeter of the pit where lava contacted ice. Perryville residents observed a very large vapor cloud, but not much incandescent material, over the summit of the volcano 4-6 February. On the evening of the 6th, lava fountains rose to heights of several tens of meters for approximately half hour periods, separated by 45-minute intervals. On 7 February a small vapor cloud rose from the summit area, and that evening Perryville residents saw a faint glow but no lava fountains.
Geologic Background. Veniaminof, on the Alaska Peninsula, is truncated by a steep-walled, 8 x 11 km, glacier-filled caldera that formed around 3,700 years ago. The caldera rim is up to 520 m high on the north, is deeply notched on the west by Cone Glacier, and is covered by an ice sheet on the south. Post-caldera vents are located along a NW-SE zone bisecting the caldera that extends 55 km from near the Bering Sea coast, across the caldera, and down the Pacific flank. Historical eruptions probably all originated from the westernmost and most prominent of two intra-caldera cones, which rises about 300 m above the surrounding icefield. The other cone is larger, and has a summit crater or caldera that may reach 2.5 km in diameter, but is more subdued and barely rises above the glacier surface.
Information Contacts: M.E. Yount and T. Miller, USGS, Anchorage.