Recently Published Bulletin Reports
Ebeko (Russia) Continued explosions, ash plumes, and ashfall during October 2022-May 2023
Ambae (Vanuatu) New lava flow, ash plumes, and sulfur dioxide plumes during February-May 2023
Ibu (Indonesia) Daily ash explosions continue, along with thermal anomalies in the crater, October 2022-May 2023
Dukono (Indonesia) Continuing ash emissions, SO2 plumes, and thermal signals during October 2022-May 2023
Sabancaya (Peru) Explosions, gas-and-ash plumes, and thermal activity persist during November 2022-April 2023
Sheveluch (Russia) Significant explosions destroyed part of the lava-dome complex during April 2023
Bezymianny (Russia) Explosions, ash plumes, lava flows, and avalanches during November 2022-April 2023
Chikurachki (Russia) New explosive eruption during late January-early February 2023
Marapi (Indonesia) New explosive eruption with ash emissions during January-March 2023
Kikai (Japan) Intermittent white gas-and-steam plumes, discolored water, and seismicity during May 2021-April 2023
Lewotolok (Indonesia) Strombolian eruption continues through April 2023 with intermittent ash plumes
Barren Island (India) Thermal activity during December 2022-March 2023
Ebeko
Russia
50.686°N, 156.014°E; summit elev. 1103 m
All times are local (unless otherwise noted)
Continued explosions, ash plumes, and ashfall during October 2022-May 2023
Ebeko, located on the N end of Paramushir Island in the Kuril Islands, consists of three summit craters along a SSW-NNE line at the northern end of a complex of five volcanic cones. Eruptions date back to the late 18th century and have been characterized as small-to-moderate explosions from the summit crater, accompanied by intense fumarolic activity. The current eruption period began in June 2022 and has recently consisted of frequent explosions, ash plumes, and thermal activity (BGVN 47:10). This report covers similar activity during October 2022 through May 2023, based on information from the Kamchatka Volcanic Eruptions Response Team (KVERT) and satellite data.
Activity during October consisted of explosive activity, ash plumes, and occasional thermal anomalies. Visual data by volcanologists from Severo-Kurilsk showed explosions producing ash clouds up to 2.1-3 km altitude which drifted E, N, NE, and SE during 1-8, 10, 16, and 18 October. KVERT issued several Volcano Observatory Notices for Aviation (VONA) on 7, 13-15, and 27 October 2022, stating that explosions generated ash plumes that rose to 2.3-4 km altitude and drifted 5 km E, NE, and SE. Ashfall was reported in Severo-Kurilsk (Paramushir Island, about 7 km E) on 7 and 13 October. Satellite data showed a thermal anomaly over the volcano on 15-16 October. Visual data showed ash plumes rising to 2.5-3.6 km altitude on 22, 25-29, and 31 October and moving NE due to constant explosions.
Similar activity continued during November, with explosions, ash plumes, and ashfall occurring. KVERT issued VONAs on 1-2, 4, 6-7, 9, 13, and 16 November that reported explosions and resulting ash plumes that rose to 1.7-3.6 km altitude and drifted 3-5 km SE, ESE, E, and NE. On 1 November ash plumes extended as far as 110 km SE. On 5, 8, 12, and 24-25 November explosions and ash plumes rose to 2-3.1 km altitude and drifted N and E. Ashfall was observed in Severo-Kurilsk on 7 and 16 November. A thermal anomaly was visible during 1-4, 16, and 20 November. Explosions during 26 November rose as high as 2.7 km altitude and drifted NE (figure 45).
Explosions and ash plumes continued to occur in December. During 1-2 and 4 December volcanologists from Severo-Kurilsk observed explosions that sent ash to 1.9-2.5 km altitude and drifted NE and SE (figure 46). VONAs were issued on 5, 9, and 16 December reporting that explosions generated ash plumes rising to 1.9 km, 2.6 km, and 2.4 km altitude and drifted 5 km SE, E, and NE, respectively. A thermal anomaly was visible in satellite imagery on 16 December. On 18 and 27-28 December explosions produced ash plumes that rose to 2.5 km altitude and drifted NE and SE. On 31 December an ash plume rose to 2 km altitude and drifted NE.
Explosions continued during January 2023, based on visual observations by volcanologists from Severo-Kurilsk. During 1-7 January explosions generated ash plumes that rose to 4 km altitude and drifted NE, E, W, and SE. According to VONAs issued by KVERT on 2, 4, 10, and 23 January, explosions produced ash plumes that rose to 2-4 km altitude and drifted 5 km N, NE, E, and ENE; the ash plume that rose to 4 km altitude occurred on 10 January (figure 47). Satellite data showed a thermal anomaly during 3-4, 10, 13, 16, 21, 22, and 31 January. KVERT reported that an ash cloud on 4 January moved 12 km NE. On 6 and 9-11 January explosions sent ash plumes to 4.5 km altitude and drifted W and ESE. On 13 January an ash plume rose to 3 km altitude and drifted SE. During 20-24 January ash plumes from explosions rose to 3.7 km altitude and drifted SE, N, and NE. On 21 January the ash plume drifted as far as 40 km NE. During 28-29 and 31 January and 1 February ash plumes rose to 4 km altitude and drifted NE.
During February, explosions, ash plumes, and ashfall were reported. During 1, 4-5 and 7-8 February explosions generated ash plumes that rose to 4.5 km altitude and drifted E and NE; ashfall was observed on 5 and 8 February. On 6 February an explosion produced an ash plume that rose to 3 km altitude and drifted 7 km E, causing ashfall in Severo-Kurilsk. A thermal anomaly was visible in satellite data on 8, 9, 13, and 21 February. Explosions on 9 and 12-13 February produced ash plumes that rose to 4 km altitude and drifted E and NE; the ash cloud on 12 February extended as far as 45 km E. On 22 February explosions sent ash to 3 km altitude that drifted E. During 24 and 26-27 February ash plumes rose to 4 km altitude and drifted E. On 28 February an explosion sent ash to 2.5-3 km altitude and drifted 5 km E; ashfall was observed in Severo-Kurilsk.
Activity continued during March; visual observations showed that explosions generated ash plumes that rose to 3.6 km altitude on 3, 5-7, and 9-12 March and drifted E, NE, and NW. Thermal anomalies were visible on 10, 13, and 29-30 March in satellite imagery. On 18, 21-23, 26, and 29-30 March explosions produced ash plumes that rose to 2.8 km altitude and drifted NE and E; the ash plumes during 22-23 March extended up to 76 km E. A VONA issued on 21 March reported an explosion that produced an ash plume that rose to 2.8 km altitude and drifted 5 km E. Another VONA issued on 23 March reported that satellite data showed an ash plume rising to 3 km altitude and drifted 14 km E.
Explosions during April continued to generate ash plumes. On 1 and 4 April an ash plume rose to 2.8-3.5 km altitude and drifted SE and NE. A thermal anomaly was visible in satellite imagery during 1-6 April. Satellite data showed ash plumes and clouds rising to 2-3 km altitude and drifting up to 12 km SW and E on 3 and 6 April (figure 48). KVERT issued VONAs on 3, 5, 14, 16 April describing explosions that produced ash plumes rising to 3 km, 3.5 km, 3.5 km, and 3 km altitude and drifting 5 km S, 5 km NE and SE, 72 km NNE, and 5 km NE, respectively. According to satellite data, the resulting ash cloud from the explosion on 14 April was 25 x 7 km in size and drifted 72-104 km NNE during 14-15 April. According to visual data by volcanologists from Severo-Kurilsk explosions sent ash up to 3.5 km altitude that drifted NE and E during 15-16, 22, 25-26, and 29 April.
The explosive eruption continued during May. Explosions during 3-4, 6-7, and 9-10 May generated ash plumes that rose to 4 km altitude and drifted SW and E. Satellite data showed a thermal anomaly on 3, 9, 13-14, and 24 May. During 12-16, 23-25, and 27-28 May ash plumes rose to 3.5 km altitude and drifted in different directions due to explosions. Two VONA notices were issued on 16 and 25 May, describing explosions that generated ash plumes rising to 3 km and 3.5 km altitude, respectively and extending 5 km E. The ash cloud on 25 May drifted 75 km SE.
Thermal activity in the summit crater, occasionally accompanied by ash plumes and ash deposits on the SE and E flanks due to frequent explosions, were visible in infrared and true color satellite images (figure 49).
Geologic Background. The flat-topped summit of the central cone of Ebeko volcano, one of the most active in the Kuril Islands, occupies the northern end of Paramushir Island. Three summit craters located along a SSW-NNE line form Ebeko volcano proper, at the northern end of a complex of five volcanic cones. Blocky lava flows extend west from Ebeko and SE from the neighboring Nezametnyi cone. The eastern part of the southern crater contains strong solfataras and a large boiling spring. The central crater is filled by a lake about 20 m deep whose shores are lined with steaming solfataras; the northern crater lies across a narrow, low barrier from the central crater and contains a small, cold crescentic lake. Historical activity, recorded since the late-18th century, has been restricted to small-to-moderate explosive eruptions from the summit craters. Intense fumarolic activity occurs in the summit craters, on the outer flanks of the cone, and in lateral explosion craters.
Information Contacts: Kamchatka Volcanic Eruptions Response Team (KVERT), Far Eastern Branch, Russian Academy of Sciences, 9 Piip Blvd., Petropavlovsk-Kamchatsky, 683006, Russia (URL: http://www.kscnet.ru/ivs/kvert/); MIROVA (Middle InfraRed Observation of Volcanic Activity), a collaborative project between the Universities of Turin and Florence (Italy) supported by the Centre for Volcanic Risk of the Italian Civil Protection Department (URL: http://www.mirovaweb.it/); Copernicus Browser, Copernicus Data Space Ecosystem, European Space Agency (URL: https://dataspace.copernicus.eu/browser/).
Ambae
Vanuatu
15.389°S, 167.835°E; summit elev. 1496 m
All times are local (unless otherwise noted)
New lava flow, ash plumes, and sulfur dioxide plumes during February-May 2023
Ambae, also known as Aoba, is a large basaltic shield volcano in Vanuatu. A broad pyroclastic cone containing three crater lakes (Manaro Ngoru, Voui, and Manaro Lakua) is located at the summit within the youngest of at least two nested calderas. Periodic phreatic and pyroclastic explosions have been reported since the 16th century. A large eruption more than 400 years ago resulted in a volcanic cone within the summit crater that is now filled by Lake Voui; the similarly sized Lake Manaro fills the western third of the caldera. The previous eruption ended in August 2022 that was characterized by gas-and-steam and ash emissions and explosions of wet tephra (BGVN 47:10). This report covers a new eruption during February through May 2023 that consisted of a new lava flow, ash plumes, and sulfur dioxide emissions, using information from the Vanuatu Meteorology and Geo-Hazards Department (VMGD) and satellite data.
During the reporting period, the Alert Level remained at a 2 (on a scale of 0-5), which has been in place since December 2021. Activity during October 2022 through March 2023 remained relatively low and mostly consisted of gas-and-steam emissions in Lake Voui. VMGD reported that at 1300 on 15 November a satellite image captured a strong amount of sulfur dioxide rising above the volcano (figure 99), and that seismicity slightly increased. The southern and northern part of the island reported a strong sulfur dioxide smell and heard explosions. On 20 February 2023 a gas-and-ash plume rose 1.3 km above the summit and drifted SSW, according to a webcam image (figure 100). Gas-and-steam and possibly ash emissions continued on 23 February and volcanic earthquakes were recorded by the seismic network.
During April, volcanic earthquakes and gas-and-steam and ash emissions were reported from the cone in Lake Voui. VMGD reported that activity increased during 5-7 April; high gas-and-steam and ash plumes were visible, accompanied by nighttime incandescence. According to a Wellington VAAC report, a low-level ash plume rose as high as 2.5 km above the summit and drifted W and SW on 5 April, based on satellite imagery. Reports in Saratamata stated that a dark ash plume drifted to the WSW, but no loud explosion was heard. Webcam images from 2100 showed incandescence above the crater and reflected in the clouds. According to an aerial survey, field observations, and satellite data, water was no longer present in the lake. A lava flow was reported effusing from the vent and traveling N into the dry Lake Voui, which lasted three days. The next morning at 0745 on 6 April a gas-and-steam and ash plume rose 5.4 km above the summit and drifted ESE, based on information from VMGD (figure 101). The Wellington VAAC also reported that light ashfall was observed on the island. Intermittent gas-and-steam and ash emissions were visible on 7 April, some of which rose to an estimated 3 km above the summit and drifted E. Webcam images during 0107-0730 on 7 April showed continuing ash emissions. A gas-and-steam and ash plume rose 695 m above the summit crater at 0730 on 19 April and drifted ESE, based on a webcam image (figure 102).
According to visual and infrared satellite data, water was visible in Lake Voui as late as 24 March 2023 (figure 103). The vent in the caldera showed a gas-and-steam plume drifted SE. On 3 April thermal activity was first detected, accompanied by a gas-and-ash plume that drifted W (figure 103). The lava flow moved N within the dry lake and was shown cooling by 8 April. By 23 April much of the water in the lake had returned. Occasional sulfur dioxide plumes were detected by the TROPOMI instrument on the Sentinel-5P satellite that exceeded 2 Dobson Units (DU) and drifted in different directions (figure 104).
Geologic Background. The island of Ambae, also known as Aoba, is a massive 2,500 km3 basaltic shield that is the most voluminous volcano of the New Hebrides archipelago. A pronounced NE-SW-trending rift zone with numerous scoria cones gives the 16 x 38 km island an elongated form. A broad pyroclastic cone containing three crater lakes (Manaro Ngoru, Voui, and Manaro Lakua) is located at the summit within the youngest of at least two nested calderas, the largest of which is 6 km in diameter. That large central edifice is also called Manaro Voui or Lombenben volcano. Post-caldera explosive eruptions formed the summit craters about 360 years ago. A tuff cone was constructed within Lake Voui (or Vui) about 60 years later. The latest known flank eruption, about 300 years ago, destroyed the population of the Nduindui area near the western coast.
Information Contacts: Geo-Hazards Division, Vanuatu Meteorology and Geo-Hazards Department (VMGD), Ministry of Climate Change Adaptation, Meteorology, Geo-Hazards, Energy, Environment and Disaster Management, Private Mail Bag 9054, Lini Highway, Port Vila, Vanuatu (URL: http://www.vmgd.gov.vu/, https://www.facebook.com/VanuatuGeohazardsObservatory/); Wellington Volcanic Ash Advisory Centre (VAAC), Meteorological Service of New Zealand Ltd (MetService), PO Box 722, Wellington, New Zealand (URL: http://www.metservice.com/vaac/, http://www.ssd.noaa.gov/VAAC/OTH/NZ/messages.html); MIROVA (Middle InfraRed Observation of Volcanic Activity), a collaborative project between the Universities of Turin and Florence (Italy) supported by the Centre for Volcanic Risk of the Italian Civil Protection Department (URL: http://www.mirovaweb.it/); Global Sulfur Dioxide Monitoring Page, Atmospheric Chemistry and Dynamics Laboratory, NASA Goddard Space Flight Center (NASA/GSFC), 8800 Greenbelt Road, Goddard, Maryland, USA (URL: https://so2.gsfc.nasa.gov/); Copernicus Browser, Copernicus Data Space Ecosystem, European Space Agency (URL: https://dataspace.copernicus.eu/browser/).
Ibu
Indonesia
1.488°N, 127.63°E; summit elev. 1325 m
All times are local (unless otherwise noted)
Daily ash explosions continue, along with thermal anomalies in the crater, October 2022-May 2023
Persistent eruptive activity since April 2008 at Ibu, a stratovolcano on Indonesian’s Halmahera Island, has consisted of daily explosive ash emissions and plumes, along with observations of thermal anomalies (BGVN 47:04). The current eruption continued during October 2022-May 2023, described below, based on advisories issued by the Pusat Vulkanologi dan Mitigasi Bencana Geologi (PVMBG, also known as Indonesian Center for Volcanology and Geological Hazard Mitigation, CVGHM), daily reports by MAGMA Indonesia (a PVMBG platform), and the Darwin Volcanic Ash Advisory Centre (VAAC), and various satellite data. The Alert Level during the reporting period remained at 2 (on a scale of 1-4), except raised briefly to 3 on 27 May, and the public was warned to stay at least 2 km away from the active crater and 3.5 km away on the N side of the volcano.
According to MAGMA Indonesia, during October 2022-May 2023, daily gray-and-white ash plumes of variable densities rose 200-1,000 m above the summit and drifted in multiple directions. On 30 October and 11 November, plumes rose a maximum of 2 km and 1.5 km above the summit, respectively (figures 42 and 43). According to the Darwin VAAC, discrete ash emissions on 13 November rose to 2.1 km altitude, or 800 m above the summit, and drifted W, and multiple ash emissions on 15 November rose 1.4 km above the summit and drifted NE. Occasional larger ash explosions through May 2023 prompted PVMBG to issue Volcano Observatory Notice for Aviation (VONA) alerts (table 6); the Aviation Color Code remained at Orange throughout this period.
Table 6. Volcano Observatory Notice for Aviation (VONA) ash plume alerts for Ibu issued by PVMBG during October 2022-May 2023. Maximum height above the summit was estimated by a ground observer. VONAs in January-May 2023 all described the ash plumes as dense.
| Date |
Time (local) |
Max height above summit |
Direction |
| 17 Oct 2022 |
0858 |
800 m |
SW |
| 18 Oct 2022 |
1425 |
800 m |
S |
| 19 Oct 2022 |
2017 |
600 m |
SW |
| 21 Oct 2022 |
0916 |
800 m |
NW |
| 16 Jan 2023 |
1959 |
600 m |
NE |
| 22 Jan 2023 |
0942 |
1,000 m |
E |
| 29 Jan 2023 |
2138 |
1,000 m |
E |
| 10 May 2023 |
0940 |
800 m |
NW |
| 10 May 2023 |
2035 |
600 m |
E |
| 21 May 2023 |
2021 |
600 m |
W |
| 21 May 2023 |
2140 |
1,000 m |
W |
| 29 May 2023 |
1342 |
800 m |
N |
| 31 May 2023 |
1011 |
1,000 m |
SW |
Sentinel-2 L1C satellite images throughout the reporting period show two, sometimes three persistent thermal anomalies in the summit crater, with the most prominent hotspot from the top of a cone within the crater. Clear views were more common during March-April 2023, when a vent and lava flows on the NE flank of the intra-crater cone could be distinguished (figure 44). White-to-grayish emissions were also observed during brief periods when weather clouds allowed clear views.
The MIROVA space-based volcano hotspot detection system recorded almost daily thermal anomalies throughout the reporting period, though cloud cover often interfered with detections. Data from imaging spectroradiometers aboard NASA’s Aqua and Terra satellites and processed using the MODVOLC algorithm (MODIS-MODVOLC) recorded hotspots on one day during October 2022 and December 2022, two days in April 2023, three days in November 2022 and May 2023, and four days in March 2023.
Geologic Background. The truncated summit of Gunung Ibu stratovolcano along the NW coast of Halmahera Island has large nested summit craters. The inner crater, 1 km wide and 400 m deep, has contained several small crater lakes. The 1.2-km-wide outer crater is breached on the N, creating a steep-walled valley. A large cone grew ENE of the summit, and a smaller one to the WSW has fed a lava flow down the W flank. A group of maars is located below the N and W flanks. The first observed and recorded eruption was a small explosion from the summit crater in 1911. Eruptive activity began again in December 1998, producing a lava dome that eventually covered much of the floor of the inner summit crater along with ongoing explosive ash emissions.
Information Contacts: Pusat Vulkanologi dan Mitigasi Bencana Geologi (PVMBG, also known as Indonesian Center for Volcanology and Geological Hazard Mitigation, CVGHM), Jalan Diponegoro 57, Bandung 40122, Indonesia (URL: http://www.vsi.esdm.go.id/); MAGMA Indonesia (Multiplatform Application for Geohazard Mitigation and Assessment in Indonesia), Kementerian Energi dan Sumber Daya Mineral (URL: https://magma.esdm.go.id/v1); Copernicus Browser, Copernicus Data Space Ecosystem, European Space Agency (URL: https://dataspace.copernicus.eu/browser/); MIROVA (Middle InfraRed Observation of Volcanic Activity), a collaborative project between the Universities of Turin and Florence (Italy) supported by the Centre for Volcanic Risk of the Italian Civil Protection Department (URL: http://www.mirovaweb.it/); Hawai'i Institute of Geophysics and Planetology (HIGP) - MODVOLC Thermal Alerts System, School of Ocean and Earth Science and Technology (SOEST), Univ. of Hawai'i, 2525 Correa Road, Honolulu, HI 96822, USA (URL: http://modis.higp.hawaii.edu/).
Dukono
Indonesia
1.6992°N, 127.8783°E; summit elev. 1273 m
All times are local (unless otherwise noted)
Continuing ash emissions, SO2 plumes, and thermal signals during October 2022-May 2023
Dukono, a remote volcano on Indonesia’s Halmahera Island, has been erupting continuously since 1933, with frequent ash explosions and sulfur dioxide plumes (BGVN 46:11, 47:10). This activity continued during October 2022 through May 2023, based on reports from the Pusat Vulkanologi dan Mitigasi Bencana Geologi (PVMBG; also known as Indonesian Center for Volcanology and Geological Hazard Mitigation, CVGHM), the Darwin Volcanic Ash Advisory Centre (VAAC), and satellite data. During this period, the Alert Level remained at 2 (on a scale of 1-4) and the public was warned to remain outside of the 2-km exclusion zone. The highest reported plume of the period reached 9.4 km above the summit on 14 November 2022.
According to MAGMA Indonesia (a platform developed by PVMBG), white, gray, or dark plumes of variable densities were observed almost every day during the reporting period, except when fog obscured the volcano (figure 33). Plumes generally rose 25-450 m above the summit, but rose as high as 700-800 m on several days, somewhat lower than the maximum heights reached earlier in 2022 when plumes reached as high as 1 km. However, the Darwin VAAC reported that on 14 November 2022, a discrete ash plume rose 9.4 km above the summit (10.7 km altitude), accompanied by a strong hotspot and a sulfur dioxide signal observed in satellite imagery; a continuous ash plume that day and through the 15th rose to 2.1-2.4 km altitude and drifted NE.
Sentinel-2 images were obscured by weather clouds almost every viewing day during the reporting period. However, the few reasonably clear images showed a hotspot and white or gray emissions and plumes. Strong SO2 plumes from Dukono were present on many days during October 2022-May 2023, as detected using the TROPOMI instrument on the Sentinel-5P satellite (figure 34).
Geologic Background. Reports from this remote volcano in northernmost Halmahera are rare, but Dukono has been one of Indonesia's most active volcanoes. More-or-less continuous explosive eruptions, sometimes accompanied by lava flows, have occurred since 1933. During a major eruption in 1550 CE, a lava flow filled in the strait between Halmahera and the N-flank Gunung Mamuya cone. This complex volcano presents a broad, low profile with multiple summit peaks and overlapping craters. Malupang Wariang, 1 km SW of the summit crater complex, contains a 700 x 570 m crater that has also been active during historical time.
Information Contacts: Pusat Vulkanologi dan Mitigasi Bencana Geologi (PVMBG, also known as Indonesian Center for Volcanology and Geological Hazard Mitigation, CVGHM), Jalan Diponegoro 57, Bandung 40122, Indonesia (URL: http://www.vsi.esdm.go.id/); MAGMA Indonesia (Multiplatform Application for Geohazard Mitigation and Assessment in Indonesia), Kementerian Energi dan Sumber Daya Mineral (URL: https://magma.esdm.go.id/v1); Darwin Volcanic Ash Advisory Centre (VAAC), Bureau of Meteorology, Northern Territory Regional Office, PO Box 40050, Casuarina, NT 0811, Australia (URL: http://www.bom.gov.au/info/vaac/); NASA Global Sulfur Dioxide Monitoring Page, Atmospheric Chemistry and Dynamics Laboratory, NASA Goddard Space Flight Center (NASA/GSFC), 8800 Greenbelt Road, Goddard, Maryland, USA (URL: https://so2.gsfc.nasa.gov/); Sentinel Hub Playground (URL: https://www.sentinel-hub.com/explore/sentinel-playground).
Sabancaya
Peru
15.787°S, 71.857°W; summit elev. 5960 m
All times are local (unless otherwise noted)
Explosions, gas-and-ash plumes, and thermal activity persist during November 2022-April 2023
Sabancaya is located in Peru, NE of Ampato and SE of Hualca Hualca. Eruptions date back to 1750 and have been characterized by explosions, phreatic activity, ash plumes, and ashfall. The current eruption period began in November 2016 and has more recently consisted of daily explosions, gas-and-ash plumes, and thermal activity (BGVN 47:11). This report updates activity during November 2022 through April 2023 using information from Instituto Geophysico del Peru (IGP) that use weekly activity reports and various satellite data.
Intermittent low-to-moderate power thermal anomalies were reported by the MIROVA project during November 2022 through April 2023 (figure 119). There were few short gaps in thermal activity during mid-December 2022, late December-to-early January 2023, late January to mid-February, and late February. According to data recorded by the MODVOLC thermal algorithm, there were a total of eight thermal hotspots: three in November 2022, three in February 2023, one in March, and one in April. On clear weather days, some of this thermal anomaly was visible in infrared satellite imagery showing the active lava dome in the summit crater (figure 120). Almost daily moderate-to-strong sulfur dioxide plumes were recorded during the reporting period by the TROPOMI instrument on the Sentinel-5P satellite (figure 121). Many of these plumes exceeded 2 Dobson Units (DU) and drifted in multiple directions.
IGP reported that moderate activity during November and December 2022 continued; during November, an average number of explosions were reported each week: 30, 33, 36, and 35, and during December, it was 32, 40, 47, 52, and 67. Gas-and-ash plumes in November rose 3-3.5 km above the summit and drifted E, NE, SE, S, N, W, and SW. During December the gas-and-ash plumes rose 2-4 km above the summit and drifted in different directions. There were 1,259 volcanic earthquakes recorded during November and 1,693 during December. Seismicity also included volcano-tectonic-type events that indicate rock fracturing events. Slight inflation was observed in the N part of the volcano near Hualca Hualca (4 km N). Thermal activity was frequently reported in the crater at the active lava dome (figure 120).
Explosive activity continued during January and February 2023. The average number of explosions were reported each week during January (51, 50, 60, and 59) and February (43, 54, 51, and 50). Gas-and-ash plumes rose 1.6-2.9 km above the summit and drifted NW, SW, and W during January and rose 1.4-2.8 above the summit and drifted W, SW, E, SE, N, S, NW, and NE during February. IGP also detected 1,881 volcanic earthquakes during January and 1,661 during February. VT-type earthquakes were also reported. Minor inflation persisted near Hualca Hualca. Satellite imagery showed continuous thermal activity in the crater at the lava dome (figure 120).
During March, the average number of explosions each week was 46, 48, 31, 35, and 22 and during April, it was 29, 41, 31, and 27. Accompanying gas-and-ash plumes rose 1.7-2.6 km above the summit crater and drifted W, SW, NW, S, and SE during March. According to a Buenos Aires Volcano Ash Advisory Center (VAAC) notice, on 22 March at 1800 through 23 March an ash plume rose to 7 km altitude and drifted NW. By 0430 an ash plume rose to 7.6 km altitude and drifted W. On 24 and 26 March continuous ash emissions rose to 7.3 km altitude and drifted SW and on 28 March ash emissions rose to 7.6 km altitude. During April, gas-and-ash plumes rose 1.6-2.5 km above the summit and drifted W, SW, S, NW, NE, and E. Frequent volcanic earthquakes were recorded, with 1,828 in March and 1,077 in April, in addition to VT-type events. Thermal activity continued to be reported in the summit crater at the lava dome (figure 120).
Geologic Background. Sabancaya, located in the saddle NE of Ampato and SE of Hualca Hualca volcanoes, is the youngest of these volcanic centers and the only one to have erupted in historical time. The oldest of the three, Nevado Hualca Hualca, is of probable late-Pliocene to early Pleistocene age. The name Sabancaya (meaning "tongue of fire" in the Quechua language) first appeared in records in 1595 CE, suggesting activity prior to that date. Holocene activity has consisted of Plinian eruptions followed by emission of voluminous andesitic and dacitic lava flows, which form an extensive apron around the volcano on all sides but the south. Records of historical eruptions date back to 1750.
Information Contacts: Instituto Geofisico del Peru (IGP), Centro Vulcanológico Nacional (CENVUL), Calle Badajoz N° 169 Urb. Mayorazgo IV Etapa, Ate, Lima 15012, Perú (URL: https://www.igp.gob.pe/servicios/centro-vulcanologico-nacional/inicio); Buenos Aires Volcanic Ash Advisory Center (VAAC), Servicio Meteorológico Nacional-Fuerza Aérea Argentina, 25 de mayo 658, Buenos Aires, Argentina (URL: http://www.smn.gov.ar/vaac/buenosaires/inicio.php); MIROVA (Middle InfraRed Observation of Volcanic Activity), a collaborative project between the Universities of Turin and Florence (Italy) supported by the Centre for Volcanic Risk of the Italian Civil Protection Department (URL: http://www.mirovaweb.it/); Hawai'i Institute of Geophysics and Planetology (HIGP) - MODVOLC Thermal Alerts System, School of Ocean and Earth Science and Technology (SOEST), Univ. of Hawai'i, 2525 Correa Road, Honolulu, HI 96822, USA (URL: http://modis.higp.hawaii.edu/); NASA Global Sulfur Dioxide Monitoring Page, Atmospheric Chemistry and Dynamics Laboratory, NASA Goddard Space Flight Center (NASA/GSFC), 8800 Greenbelt Road, Goddard MD 20771, USA (URL: https://so2.gsfc.nasa.gov/); Copernicus Browser, Copernicus Data Space Ecosystem, European Space Agency (URL: https://dataspace.copernicus.eu/browser/).
Sheveluch
Russia
56.653°N, 161.36°E; summit elev. 3283 m
All times are local (unless otherwise noted)
Significant explosions destroyed part of the lava-dome complex during April 2023
Sheveluch (also spelled Shiveluch) in Kamchatka, has had at least 60 large eruptions during the last 10,000 years. The summit is truncated by a broad 9-km-wide caldera that is breached to the S, and many lava domes occur on the outer flanks. The lava dome complex was constructed within the large open caldera. Frequent collapses of the dome complex have produced debris avalanches; the resulting deposits cover much of the caldera floor. A major south-flank collapse during a 1964 Plinian explosion produced a scarp in which a “Young Sheveluch” dome began to form in 1980. Repeated episodes of dome formation and destruction since then have produced major and minor ash plumes, pyroclastic flows, block-and-ash flows, and “whaleback domes” of spine-like extrusions in 1993 and 2020 (BGVN 45:11). The current eruption period began in August 1999 and has more recently consisted of lava dome growth, explosions, ash plumes, and avalanches (BGVN 48:01). This report covers a significant explosive eruption during early-to-mid-April 2023 that generated a 20 km altitude ash plume, produced a strong sulfur dioxide plume, and destroyed part of the lava-dome complex; activity described during January through April 2023 use information primarily from the Kamchatka Volcanic Eruptions Response Team (KVERT) and various satellite data.
Satellite data. Activity during the majority of this reporting period was characterized by continued lava dome growth, strong fumarole activity, explosions, and hot avalanches. According to the MODVOLC Thermal Alerts System, 140 hotspots were detected through the reporting period, with 33 recorded in January 2023, 29 in February, 44 in March, and 34 in April. Frequent strong thermal activity was recorded during January 2023 through April, according to the MIROVA (Middle InfraRed Observation of Volcanic Activity) graph and resulted from the continuously growing lava dome (figure 94). A slightly stronger pulse in thermal activity was detected in early-to-mid-April, which represented the significant eruption that destroyed part of the lava-dome complex. Thermal anomalies were also visible in infrared satellite imagery at the summit crater (figure 95).
During January 2023 KVERT reported continued growth of the lava dome, accompanied by strong fumarolic activity, incandescence from the lava dome, explosions, ash plumes, and avalanches. Satellite data showed a daily thermal anomaly over the volcano. Video data showed ash plumes associated with collapses at the dome that generated avalanches that in turn produced ash plumes rising to 3.5 km altitude and drifting 40 km W on 4 January and rising to 7-7.5 km altitude and drifting 15 km SW on 5 January. A gas-and-steam plume containing some ash that was associated with avalanches rose to 5-6 km altitude and extended 52-92 km W on 7 January. Explosions that same day produced ash plumes that rose to 7-7.5 km altitude and drifted 10 km W. According to a Volcano Observatory Notice for Aviation (VONA) issued at 1344 on 19 January, explosions produced an ash cloud that was 15 x 25 km in size and rose to 9.6-10 km altitude, drifting 21-25 km W; as a result, the Aviation Color Code (ACC) was raised to Red (the highest level on a four-color scale). Another VONA issued at 1635 reported that no more ash plumes were observed, and the ACC was lowered to Orange (the second highest level on a four-color scale). On 22 January an ash plume from collapses and avalanches rose to 5 km altitude and drifted 25 km NE and SW; ash plumes associated with collapses extended 70 km NE on 27 and 31 January.
Lava dome growth, fumarolic activity, dome incandescence, and occasional explosions and avalanches continued during February and March. A daily thermal anomaly was visible in satellite data. Explosions on 1 February generated ash plumes that rose to 6.3-6.5 km altitude and extended 15 km NE. Video data showed an ash cloud from avalanches rising to 5.5 km altitude and drifting 5 km SE on 2 February. Satellite data showed gas-and-steam plumes containing some ash rose to 5-5.5 km altitude and drifted 68-110 km ENE and NE on 6 February, to 4.5-5 km altitude and drifted 35 km WNW on 22 February, and to 3.7-4 km altitude and drifted 47 km NE on 28 February. Scientists from the Kamchatka Volcanological Station (KVS) went on a field excursion on 25 February to document the growing lava dome, and although it was cloudy most of the day, nighttime incandescence was visible. Satellite data showed an ash plume extending up to 118 km E during 4-5 March. Video data from 1150 showed an ash cloud from avalanches rose to 3.7-5.5 km altitude and drifted 5-10 km ENE and E on 5 March. On 11 March an ash plume drifted 62 km E. On 27 March ash plumes rose to 3.5 km altitude and drifted 100 km E. Avalanches and constant incandescence at the lava dome was focused on the E and NE slopes on 28 March. A gas-and-steam plume containing some ash rose to 3.5 km altitude and moved 40 km E on 29 March. Ash plumes on 30 March rose to 3.5-3.7 km altitude and drifted 70 km NE.
Similar activity continued during April, with lava dome growth, strong fumarolic activity, incandescence in the dome, occasional explosions, and avalanches. A thermal anomaly persisted throughout the month. During 1-4 April weak ash plumes rose to 2.5-3 km altitude and extended 13-65 km SE and E.
Activity during 11 April 2023. The Institute of Volcanology and Seismology, Far Eastern Branch, Russian Academy of Sciences (IVS FEB RAS) reported a significant increase in seismicity around 0054 on 11 April, as reported by strong explosions detected on 11 April beginning at 0110 that sent ash plumes up to 7-10 km altitude and extended 100-435 km W, WNW, NNW, WSW, and SW. According to a Tokyo VAAC report the ash plume rose to 15.8 km altitude. By 0158 the plume extended over a 75 x 100 km area. According to an IVS FEB RAS report, the eruptive column was not vertical: the initial plume at 0120 on 11 April deviated to the NNE, at 0000 on 12 April, it drifted NW, and by 1900 it drifted SW. KVS reported that significant pulses of activity occurred at around 0200, 0320, and then a stronger phase around 0600. Levin Dmitry took a video from near Békés (3 km away) at around 0600 showing a rising plume; he also reported that a pyroclastic flow traveled across the road behind him as he left the area. According to IVS FEB RAS, the pyroclastic flow traveled several kilometers SSE, stopping a few hundred meters from a bridge on the road between Klyuchi and Petropavlovsk-Kamchatsky.
Ashfall was first observed in Klyuchi (45 km SW) at 0630, and a large, black ash plume blocked light by 0700. At 0729 KVERT issued a Volcano Observatory Notice for Aviation (VONA) raising the Aviation Color Code to Red (the highest level on a four-color scale). It also stated that a large ash plume had risen to 10 km altitude and drifted 100 km W. Near-constant lightning strikes were reported in the plume and sounds like thunderclaps were heard until about 1000. According to IVS FEB RAS the cloud was 200 km long and 76 km wide by 0830, and was spreading W at altitudes of 6-12 km. In the Klyuchi Village, the layer of both ash and snow reached 8.5 cm (figure 96); ashfall was also reported in Kozyrevsk (112 km SW) at 0930, Mayskoye, Anavgay, Atlasovo, Lazo, and Esso. Residents in Klyuchi reported continued darkness and ashfall at 1100. In some areas, ashfall was 6 cm deep and some residents reported dirty water coming from their plumbing. According to IVS FEB RAS, an ash cloud at 1150 rose to 5-20 km altitude and was 400 km long and 250 km wide, extending W. A VONA issued at 1155 reported that ash had risen to 10 km and drifted 340 km NNW and 240 km WSW. According to Simon Carn (Michigan Technological University), about 0.2 Tg of sulfur dioxide in the plume was measured in a satellite image from the TROPOMI instrument on the Sentinel-5P satellite acquired at 1343 that covered an area of about 189,000 km2 (figure 97). Satellite data at 1748 showed an ash plume that rose to 8 km altitude and drifted 430 km WSW and S, according to a VONA.
Activity during 12-15 April 2023. On 12 April at 0730 satellite images showed ash plumes rose to 7-8 km altitude and extended 600 km SW, 1,050 km ESE, and 1,300-3,000 km E. By 1710 that day, the explosions weakened. According to news sources, the ash-and-gas plumes drifted E toward the Aleutian Islands and reached the Gulf of Alaska by 13 April, causing flight disruptions. More than 100 flights involving Alaska airspace were cancelled due to the plume. Satellite data showed ash plumes rising to 4-5.5 km altitude and drifted 400-415 km SE and ESE on 13 April. KVS volcanologists observed the pyroclastic flow deposits and noted that steam rose from downed, smoldering trees. They also noted that the deposits were thin with very few large fragments, which differed from previous flows. The ash clouds traveled across the Pacific Ocean. Flight cancellations were also reported in NW Canada (British Columbia) during 13-14 April. During 14-15 April ash plumes rose to 6 km altitude and drifted 700 km NW.
Alaskan flight schedules were mostly back to normal by 15 April, with only minor delays and far less cancellations; a few cancellations continued to be reported in Canada. Clear weather on 15 April showed that most of the previous lava-dome complex was gone and a new crater roughly 1 km in diameter was observed (figure 98); gas-and-steam emissions were rising from this crater. Evidence suggested that there had been a directed blast to the SE, and pyroclastic flows traveled more than 20 km. An ash plume rose to 4.5-5.2 km altitude and drifted 93-870 km NW on 15 April.
Activity during 16-30 April 2023. Resuspended ash was lifted by the wind from the slopes and rose to 4 km altitude and drifted 224 km NW on 17 April. KVERT reported a plume of resuspended ash from the activity during 10-13 April on 19 April that rose to 3.5-4 km altitude and drifted 146-204 km WNW. During 21-22 April a plume stretched over the Scandinavian Peninsula. A gas-and-steam plume containing some ash rose to 3-3.5 km altitude and drifted 60 km SE on 30 April. A possible new lava dome was visible on the W slope of the volcano on 29-30 April (figure 99); satellite data showed two thermal anomalies, a bright one over the existing lava dome and a weaker one over the possible new one.
References. Girina, O., Loupian, E., Horvath, A., Melnikov, D., Manevich, A., Nuzhdaev, A., Bril, A., Ozerov, A., Kramareva, L., Sorokin, A., 2023, Analysis of the development of the paroxysmal eruption of Sheveluch volcano on April 10–13, 2023, based on data from various satellite systems, ??????????? ???????? ??? ?? ???????, 20(2).
Geologic Background. The high, isolated massif of Sheveluch volcano (also spelled Shiveluch) rises above the lowlands NNE of the Kliuchevskaya volcano group. The 1,300 km3 andesitic volcano is one of Kamchatka's largest and most active volcanic structures, with at least 60 large eruptions during the Holocene. The summit of roughly 65,000-year-old Stary Shiveluch is truncated by a broad 9-km-wide late-Pleistocene caldera breached to the south. Many lava domes occur on its outer flanks. The Molodoy Shiveluch lava dome complex was constructed during the Holocene within the large open caldera; Holocene lava dome extrusion also took place on the flanks of Stary Shiveluch. Widespread tephra layers from these eruptions have provided valuable time markers for dating volcanic events in Kamchatka. Frequent collapses of dome complexes, most recently in 1964, have produced debris avalanches whose deposits cover much of the floor of the breached caldera.
Information Contacts: Kamchatka Volcanic Eruptions Response Team (KVERT), Far Eastern Branch, Russian Academy of Sciences, 9 Piip Blvd., Petropavlovsk-Kamchatsky, 683006, Russia (URL: http://www.kscnet.ru/ivs/kvert/); Institute of Volcanology and Seismology, Far Eastern Branch, Russian Academy of Sciences (IVS FEB RAS), 9 Piip Blvd., Petropavlovsk-Kamchatsky 683006, Russia (URL: http://www.kscnet.ru/ivs/eng/); Kamchatka Volcanological Station, Kamchatka Branch of Geophysical Survey, (KB GS RAS), Klyuchi, Kamchatka Krai, Russia (URL: http://volkstat.ru/); Hawai'i Institute of Geophysics and Planetology (HIGP) - MODVOLC Thermal Alerts System, School of Ocean and Earth Science and Technology (SOEST), Univ. of Hawai'i, 2525 Correa Road, Honolulu, HI 96822, USA (URL: http://modis.higp.hawaii.edu/); MIROVA (Middle InfraRed Observation of Volcanic Activity), a collaborative project between the Universities of Turin and Florence (Italy) supported by the Centre for Volcanic Risk of the Italian Civil Protection Department (URL: http://www.mirovaweb.it/); Copernicus Browser, Copernicus Data Space Ecosystem, European Space Agency (URL: https://dataspace.copernicus.eu/browser/); Kam 24 News Agency, 683032, Kamchatka Territory, Petropavlovsk-Kamchatsky, Vysotnaya St., 2A (URL: https://kam24.ru/news/main/20230411/96657.html#.Cj5Jrky6.dpuf); Simon Carn, Geological and Mining Engineering and Sciences, Michigan Technological University, 1400 Townsend Drive, Houghton, MI 49931, USA (URL: http://www.volcarno.com/, Twitter: @simoncarn).
Bezymianny
Russia
55.972°N, 160.595°E; summit elev. 2882 m
All times are local (unless otherwise noted)
Explosions, ash plumes, lava flows, and avalanches during November 2022-April 2023
Bezymianny is located on the Kamchatka Peninsula of Russia as part of the Klyuchevskoy volcano group. Historic eruptions began in 1955 and have been characterized by dome growth, explosions, pyroclastic flows, ash plumes, and ashfall. During the 1955-56 eruption a large open crater was formed by collapse of the summit and an associated lateral blast. Subsequent episodic but ongoing lava-dome growth, accompanied by intermittent explosive activity and pyroclastic flows, has largely filled the 1956 crater. The current eruption period began in December 2016 and more recent activity has consisted of strong explosions, ash plumes, and thermal activity (BGVN 47:11). This report covers activity during November 2022 through April 2023, based on weekly and daily reports from the Kamchatka Volcano Eruptions Response Team (KVERT) and satellite data.
Activity during November and March 2023 was relatively low and mostly consisted of gas-and-steam emissions, occasional small collapses that generated avalanches along the lava dome slopes, and a persistent thermal anomaly over the volcano that was observed in satellite data on clear weather days. According to the Tokyo VAAC and KVERT, an explosion produced an ash plume that rose to 6 km altitude and drifted 25 km NE at 1825 on 29 March.
Gas-and-steam emissions, collapses generating avalanches, and thermal activity continued during April. According to two Volcano Observatory Notice for Aviation (VONA) issued on 2 and 6 April (local time) ash plumes rose to 3 km and 3.5-3.8 km altitude and drifted 35 km E and 140 km E, respectively. Satellite data from KVERT showed weak ash plumes extending up to 550 km E on 2 and 5-6 April.
A VONA issued at 0843 on 7 April described an ash plume that rose to 4.5-5 km altitude and drifted 250 km ESE. Later that day at 1326 satellite data showed an ash plume that rose to 5.5-6 km altitude and drifted 150 km ESE. A satellite image from 1600 showed an ash plume extending as far as 230 km ESE; KVERT noted that ash emissions were intensifying, likely due to avalanches from the growing lava dome. The Aviation Color Code (ACC) was raised to Red (the highest level on a four-color scale). At 1520 satellite data showed an ash plume rising to 5-5.5 km altitude and drifting 230 km ESE. That same day, Kamchatka Volcanological Station (KVS) volcanologists traveled to Ambon to collect ash; they reported that a notable eruption began at 1730, and within 20 minutes a large ash plume rose to 10 km altitude and drifted NW. KVERT reported that the strong explosive phase began at 1738. Video and satellite data taken at 1738 showed an ash plume that rose to 10-12 km altitude and drifted up to 2,800 km SE and E. Explosions were clearly audible 20 km away for 90 minutes, according to KVS. Significant amounts of ash fell at the Apakhonchich station, which turned the snow gray; ash continued to fall until the morning of 8 April. In a VONA issued at 0906 on 8 April, KVERT stated that the explosive eruption had ended; ash plumes had drifted 2,000 km E. The ACC was lowered to Orange (the third highest level on a four-color scale). The KVS team saw a lava flow on the active dome once the conditions were clear that same day (figure 53). On 20 April lava dome extrusion was reported; lava flows were noted on the flanks of the dome, and according to KVERT satellite data, a thermal anomaly was observed in the area. The ACC was lowered to Yellow (the second lowest on a four-color scale).
Satellite data showed an increase in thermal activity beginning in early April 2023. A total of 31 thermal hotspots were detected by the MODVOLC thermal algorithm on 4, 5, 7, and 12 April 2023. The elevated thermal activity resulted from an increase in explosive activity and the start of an active lava flow. The MIROVA (Middle InfraRed Observation of Volcanic Activity) volcano hotspot detection system based on the analysis of MODIS data also showed a pulse in thermal activity during the same time (figure 54). Infrared satellite imagery captured a continuous thermal anomaly at the summit crater, often accompanied by white gas-and-steam emissions (figure 55). On 4 April 2023 an active lava flow was observed descending the SE flank.
Geologic Background. The modern Bezymianny, much smaller than its massive neighbors Kamen and Kliuchevskoi on the Kamchatka Peninsula, was formed about 4,700 years ago over a late-Pleistocene lava-dome complex and an edifice built about 11,000-7,000 years ago. Three periods of intensified activity have occurred during the past 3,000 years. The latest period, which was preceded by a 1,000-year quiescence, began with the dramatic 1955-56 eruption. This eruption, similar to that of St. Helens in 1980, produced a large open crater that was formed by collapse of the summit and an associated lateral blast. Subsequent episodic but ongoing lava-dome growth, accompanied by intermittent explosive activity and pyroclastic flows, has largely filled the 1956 crater.
Information Contacts: Kamchatka Volcanic Eruptions Response Team (KVERT), Far Eastern Branch, Russian Academy of Sciences, 9 Piip Blvd., Petropavlovsk-Kamchatsky, 683006, Russia (URL: http://www.kscnet.ru/ivs/kvert/); Kamchatka Volcanological Station, Kamchatka Branch of Geophysical Survey, (KB GS RAS), Klyuchi, Kamchatka Krai, Russia (URL: http://volkstat.ru/); Hawai'i Institute of Geophysics and Planetology (HIGP) - MODVOLC Thermal Alerts System, School of Ocean and Earth Science and Technology (SOEST), Univ. of Hawai'i, 2525 Correa Road, Honolulu, HI 96822, USA (URL: http://modis.higp.hawaii.edu/); MIROVA (Middle InfraRed Observation of Volcanic Activity), a collaborative project between the Universities of Turin and Florence (Italy) supported by the Centre for Volcanic Risk of the Italian Civil Protection Department (URL: http://www.mirovaweb.it/); Copernicus Browser, Copernicus Data Space Ecosystem, European Space Agency (URL: https://dataspace.copernicus.eu/browser/).
Chikurachki
Russia
50.324°N, 155.461°E; summit elev. 1781 m
All times are local (unless otherwise noted)
New explosive eruption during late January-early February 2023
Chikurachki, located on Paramushir Island in the northern Kuriles, has had Plinian eruptions during the Holocene. Lava flows have reached the sea and formed capes on the NW coast; several young lava flows are also present on the E flank beneath a scoria deposit. Reported eruptions date back to 1690, with the most recent eruption period occurring during January through October 2022, characterized by occasional explosions, ash plumes, and thermal activity (BGVN 47:11). This report covers a new eruptive period during January through February 2023 that consisted of ash explosions and ash plumes, based on information from the Kamchatka Volcanic Eruptions Response Team (KVERT) and satellite data.
According to reports from KVERT, an explosive eruption began around 0630 on 29 January. Explosions generated ash plumes that rose to 3-3.5 km altitude and drifted 6-75 km SE and E, based on satellite data. As a result, the Aviation Color Code (ACC) was raised to Orange (the second highest level on a four-color scale). At 1406 and 1720 ash plumes were identified in satellite images that rose to 4.3 km altitude and extended 70 km E. By 2320 the ash plume had dissipated. A thermal anomaly was visible at the volcano on 31 January, according to a satellite image, and an ash plume was observed drifting 66 km NE.
Occasional explosions and ash plumes continued during early February. At 0850 on 1 February an ash plume rose to 3.5 km altitude and drifted 35 km NE. Satellite data showed an ash plume that rose to 3.2-3.5 km altitude and drifted 50 km NE at 1222 later that day (figure 22). A thermal anomaly was detected over the volcano during 5-6 February and ash plumes drifted as far as 125 km SE, E, and NE. Explosive events were reported at 0330 on 6 February that produced ash plumes rising to 4-4.5 km altitude and drifting 72-90 km N, NE, and ENE. KVERT noted that the last gas-and steam plume that contained some ash was observed on 8 February and drifted 55 km NE before the explosive eruption ended. The ACC was lowered to Yellow and then Green (the lowest level on a four-color scale) on 18 February.
Geologic Background. Chikurachki, the highest volcano on Paramushir Island in the northern Kuriles, is a relatively small cone constructed on a high Pleistocene edifice. Oxidized basaltic-to-andesitic scoria deposits covering the upper part of the young cone give it a distinctive red color. Frequent basaltic Plinian eruptions have occurred during the Holocene. Lava flows have reached the sea and formed capes on the NW coast; several young lava flows are also present on the E flank beneath a scoria deposit. The Tatarinov group of six volcanic centers is located immediately to the south, and the Lomonosov cinder cone group, the source of an early Holocene lava flow that reached the saddle between it and Fuss Peak to the west, lies at the southern end of the N-S-trending Chikurachki-Tatarinov complex. In contrast to the frequently active Chikurachki, the Tatarinov centers are extensively modified by erosion and have a more complex structure. Tephrochronology gives evidence of an eruption around 1690 CE from Tatarinov, although its southern cone contains a sulfur-encrusted crater with fumaroles that were active along the margin of a crater lake until 1959.
Information Contacts: Kamchatka Volcanic Eruptions Response Team (KVERT), Far East Division, Russian Academy of Sciences, 9 Piip Blvd., Petropavlovsk-Kamchatsky, 683006, Russia (URL: http://www.kscnet.ru/ivs/); Copernicus Browser, Copernicus Data Space Ecosystem, European Space Agency (URL: https://dataspace.copernicus.eu/browser/).
Marapi
Indonesia
0.38°S, 100.474°E; summit elev. 2885 m
All times are local (unless otherwise noted)
New explosive eruption with ash emissions during January-March 2023
Marapi in Sumatra, Indonesia, is a massive stratovolcano that rises 2 km above the Bukittinggi Plain in the Padang Highlands. A broad summit contains multiple partially overlapping summit craters constructed within the small 1.4-km-wide Bancah caldera and trending ENE-WSW, with volcanism migrating to the west. Since the end of the 18th century, more than 50 eruptions, typically characterized by small-to-moderate explosive activity, have been recorded. The previous eruption consisted of two explosions during April-May 2018, which caused ashfall to the SE (BGVN 43:06). This report covers a new eruption during January-March 2023, which included explosive events and ash emissions, as reported by Pusat Vulkanologi dan Mitigasi Bencana Geologi (PVMBG, also known as Indonesian Center for Volcanology and Geological Hazard Mitigation, CVGHM) and MAGMA Indonesia.
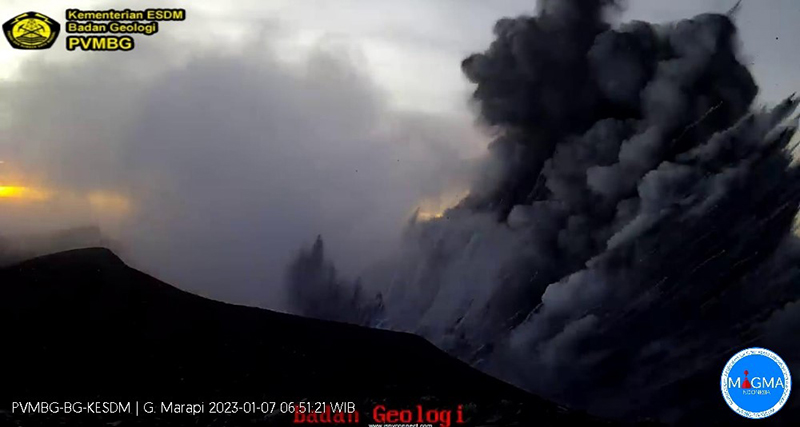
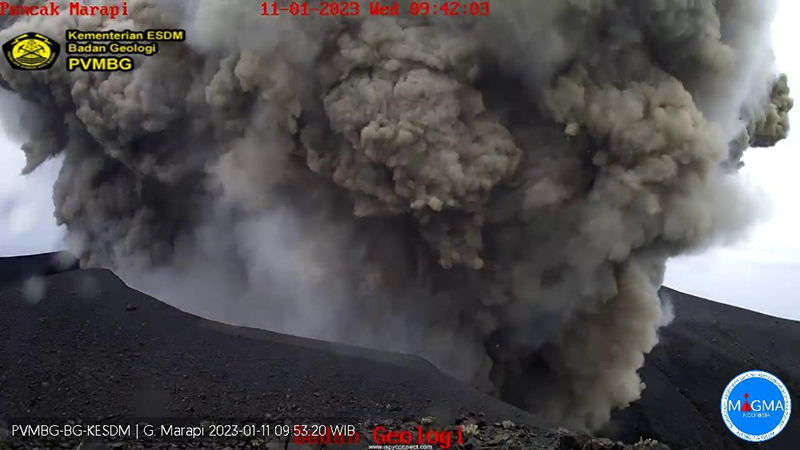
According to a press release issued by PVMBG and MAGMA Indonesia on 26 December, primary volcanic activity at Marapi consisted of white gas-and-steam puffs that rose 500-100 m above the summit during April-December 2022. On 25 December 2022 there was an increase in the number of deep volcanic earthquakes and summit inflation. White gas-and-steam emissions rose 80-158 m above the summit on 5 January. An explosive eruption began at 0611 on 7 January 2023, which generated white gas-and-steam emissions and gray ash emissions mixed with ejecta that rose 300 m above the summit and drifted SE (figure 10). According to ground observations, white-to-gray ash clouds during 0944-1034 rose 200-250 m above the summit and drifted SE and around 1451 emissions rose 200 m above the summit. Seismic signals indicated that eruptive events also occurred at 1135, 1144, 1230, 1715, and 1821, but no ash emissions were visually observed. On 8 January white-and-gray emissions rose 150-250 m above the summit that drifted E and SE. Seismic signals indicated eruptive events at 0447, 1038, and 1145, but again no ash emissions were visually observed on 8 January. White-to-gray ash plumes continued to be observed on clear weather days during 9-15, 18-21, 25, and 29-30 January, rising 100-1,000 m above the summit and drifted generally NE, SE, N, and E, based on ground observations (figure 11).
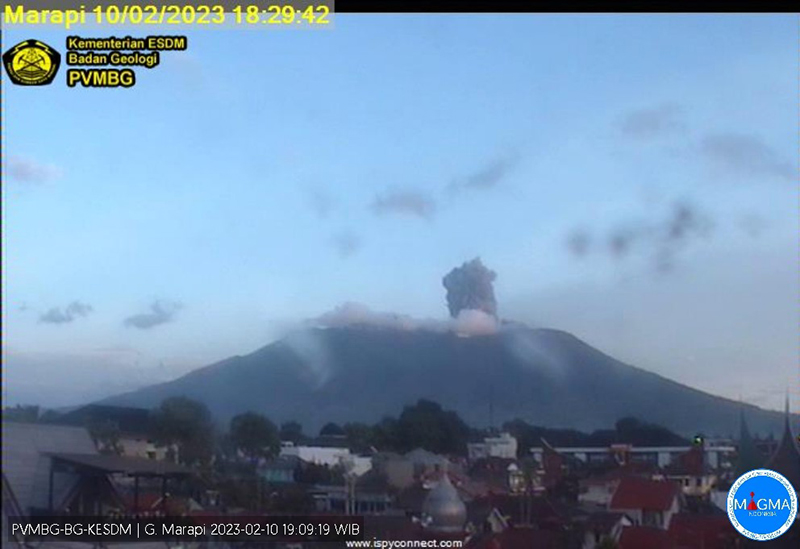
White-and-gray and brown emissions persisted in February, rising 50-500 m above the summit and drifting E, S, SW, N, NE, and W, though weather sometimes prevented clear views of the summit. An eruption at 1827 on 10 February produced a black ash plume that rose 400 m above the summit and drifted NE and E (figure 12). Similar activity was reported on clear weather days, with white gas-and-steam emissions rising 50 m above the summit on 9, 11-12, 20, and 27 March and drifted E, SE, SW, NE, E, and N. On 17 March white-and-gray emissions rose 400 m above the summit and drifted N and E.
Geologic Background. Gunung Marapi, not to be confused with the better-known Merapi volcano on Java, is Sumatra's most active volcano. This massive complex stratovolcano rises 2,000 m above the Bukittinggi Plain in the Padang Highlands. A broad summit contains multiple partially overlapping summit craters constructed within the small 1.4-km-wide Bancah caldera. The summit craters are located along an ENE-WSW line, with volcanism migrating to the west. More than 50 eruptions, typically consisting of small-to-moderate explosive activity, have been recorded since the end of the 18th century; no lava flows outside the summit craters have been reported in historical time.
Information Contacts: Pusat Vulkanologi dan Mitigasi Bencana Geologi (PVMBG, also known as Indonesian Center for Volcanology and Geological Hazard Mitigation, CVGHM), Jalan Diponegoro 57, Bandung 40122, Indonesia (URL: http://www.vsi.esdm.go.id/); MAGMA Indonesia, Kementerian Energi dan Sumber Daya Mineral (URL: https://magma.esdm.go.id/v1).
Kikai
Japan
30.793°N, 130.305°E; summit elev. 704 m
All times are local (unless otherwise noted)
Intermittent white gas-and-steam plumes, discolored water, and seismicity during May 2021-April 2023
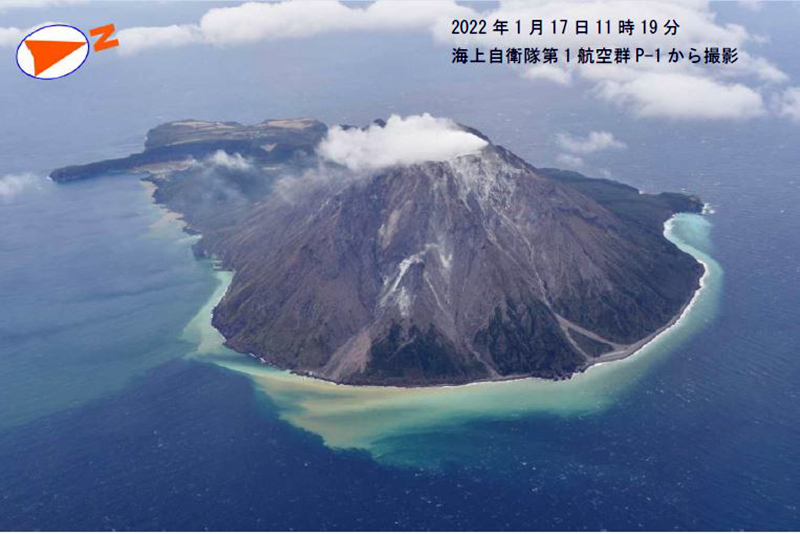
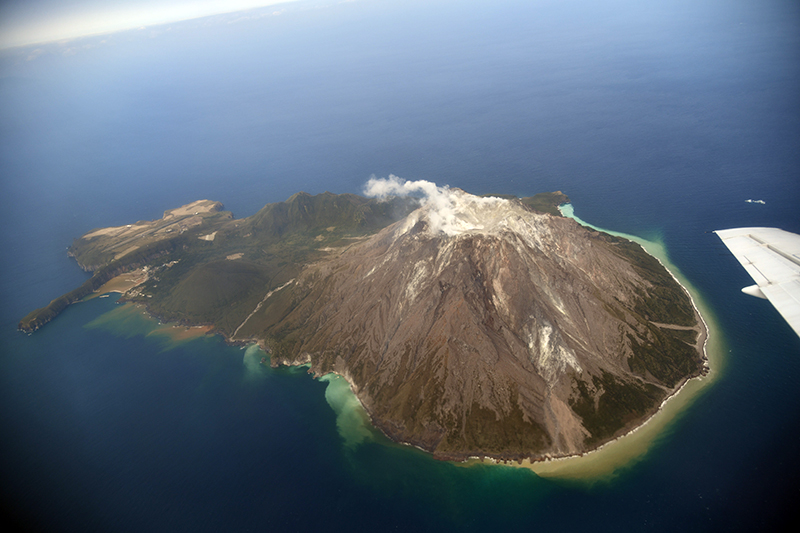
Kikai, located just S of the Ryukyu islands of Japan, contains a 19-km-wide mostly submarine caldera. The island of Satsuma Iwo Jima (also known as Satsuma-Iwo Jima and Tokara Iojima) is located at the NW caldera rim, as well as the island’s highest peak, Iodake. Its previous eruption period occurred on 6 October 2020 and was characterized by an explosion and thermal anomalies in the crater (BGVN 45:11). More recent activity has consisted of intermittent thermal activity and gas-and-steam plumes (BGVN 46:06). This report covers similar low-level activity including white gas-and-steam plumes, nighttime incandescence, seismicity, and discolored water during May 2021 through April 2023, using information from the Japan Meteorological Agency (JMA) and various satellite data. During this time, the Alert Level remained at a 2 (on a 5-level scale), according to JMA.
Activity was relatively low throughout the reporting period and has consisted of intermittent white gas-and-steam emissions that rose 200-1,400 m above the Iodake crater and nighttime incandescence was observed at the Iodake crater using a high-sensitivity surveillance camera. Each month, frequent volcanic earthquakes were detected, and sulfur dioxide masses were measured by the University of Tokyo Graduate School of Science, Kyoto University Disaster Prevention Research Institute, Mishima Village, and JMA (table 6).
Table 6. Summary of gas-and-steam plume heights, number of volcanic earthquakes detected, and amount of sulfur dioxide emissions in tons per day (t/d). Courtesy of JMA monthly reports.
| Month |
Max plume height (m) |
Volcanic earthquakes |
Sulfur dioxide emissions (t/d) |
| May 2021 |
400 |
162 |
900-1,300 |
| Jun 2021 |
800 |
117 |
500 |
| Jul 2021 |
1,400 |
324 |
800-1,500 |
| Aug 2021 |
1,000 |
235 |
700-1,000 |
| Sep 2021 |
800 |
194 |
500-1,100 |
| Oct 2021 |
800 |
223 |
600-800 |
| Nov 2021 |
900 |
200 |
400-900 |
| Dec 2021 |
1,000 |
161 |
500-1,800 |
| Jan 2022 |
1,000 |
164 |
600-1,100 |
| Feb 2022 |
1,000 |
146 |
500-1,600 |
| Mar 2022 |
1,200 |
171 |
500-1,200 |
| Apr 2022 |
1,000 |
144 |
600-1,000 |
| May 2022 |
1,200 |
126 |
300-500 |
| Jun 2022 |
1,000 |
154 |
400 |
| Jul 2022 |
1,300 |
153 |
600-1,100 |
| Aug 2022 |
1,100 |
109 |
600-1,500 |
| Sep 2022 |
1,000 |
170 |
900 |
| Oct 2022 |
800 |
249 |
700-1,200 |
| Nov 2022 |
800 |
198 |
800-1,200 |
| Dec 2022 |
700 |
116 |
600-1,500 |
| Jan 2023 |
800 |
146 |
500-1,400 |
| Feb 2023 |
800 |
135 |
600-800 |
| Mar 2023 |
1,100 |
94 |
500-600 |
| Apr 2023 |
800 |
82 |
500-700 |
Sentinel-2 satellite images show weak thermal anomalies at the Iodake crater on clear weather days, accompanied by white gas-and-steam emissions and occasional discolored water (figure 24). On 17 January 2022 JMA conducted an aerial overflight in cooperation with the Japan Maritime Self-Defense Force’s 1st Air Group, which confirmed a white gas-and-steam plume rising from the Iodake crater (figure 25). They also observed plumes from fumaroles rising from around the crater and on the E, SW, and N slopes. In addition, discolored water was reported near the coast around Iodake, which JMA stated was likely related to volcanic activity (figure 25). Similarly, an overflight taken on 11 January 2023 showed white gas-and-steam emissions rising from the Iodake crater, as well as discolored water that spread E from the coast around the island. On 14 February 2023 white fumaroles and discolored water were also captured during an overflight (figure 26).
Geologic Background. Multiple eruption centers have exhibited recent activity at Kikai, a mostly submerged, 19-km-wide caldera near the northern end of the Ryukyu Islands south of Kyushu. It was the source of one of the world's largest Holocene eruptions about 6,300 years ago when rhyolitic pyroclastic flows traveled across the sea for a total distance of 100 km to southern Kyushu, and ashfall reached the northern Japanese island of Hokkaido. The eruption devastated southern and central Kyushu, which remained uninhabited for several centuries. Post-caldera eruptions formed Iodake (or Iwo-dake) lava dome and Inamuradake scoria cone, as well as submarine lava domes. Recorded eruptions have occurred at or near Satsuma-Iojima (also known as Tokara-Iojima), a small 3 x 6 km island forming part of the NW caldera rim. Showa-Iojima lava dome (also known as Iojima-Shinto), a small island 2 km E of Satsuma-Iojima, was formed during submarine eruptions in 1934 and 1935. Mild-to-moderate explosive eruptions have occurred during the past few decades from Iodake, a rhyolitic lava dome at the eastern end of Satsuma-Iojima.
Information Contacts: Japan Meteorological Agency (JMA), Otemachi, 1-3-4, Chiyoda-ku Tokyo 100-8122, Japan (URL: http://www.jma.go.jp/jma/indexe.html); Japan Coast Guard (JCG) Volcano Database, Hydrographic and Oceanographic Department, 3-1-1, Kasumigaseki, Chiyoda-ku, Tokyo 100-8932, Japan (URL: https://www1.kaiho.mlit.go.jp/kaiikiDB/kaiyo30-2.htm); Copernicus Browser, Copernicus Data Space Ecosystem, European Space Agency (URL: https://dataspace.copernicus.eu/browser/).
Lewotolok (Indonesia) — May 2023  Cite this Report
Lewotolok
Indonesia
8.274°S, 123.508°E; summit elev. 1431 m
All times are local (unless otherwise noted)
Strombolian eruption continues through April 2023 with intermittent ash plumes
The current eruption at Lewotolok, in Indonesian’s Lesser Sunda Islands, began in late November 2020 and has included Strombolian explosions, occasional ash plumes, incandescent ejecta, intermittent thermal anomalies, and persistent white and white-and-gray emissions (BGVN 47:10). Similar activity continued during October 2022-April 2023, as described in this report based on information provided by Pusat Vulkanologi dan Mitigasi Bencana Geologi (PVMBG, also known as CVGHM, or the Center of Volcanology and Geological Hazard Mitigation), MAGMA Indonesia, the Darwin Volcanic Ash Advisory Centre (VAAC), and satellite data.
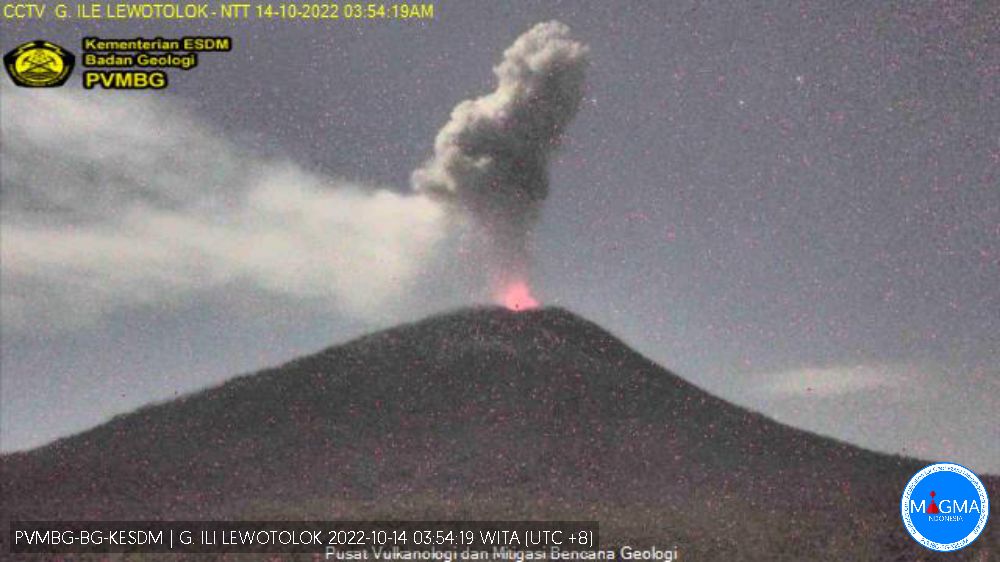
During most days in October 2022 white and white-gray emissions rose as high as 200-600 m above the summit. Webcam images often showed incandescence above the crater rim. At 0351 on 14 October, an explosion produced a dense ash plume that rose about 1.2 km above the summit and drifted SW (figure 43). After this event, activity subsided and remained low through the rest of the year, but with almost daily white emissions.
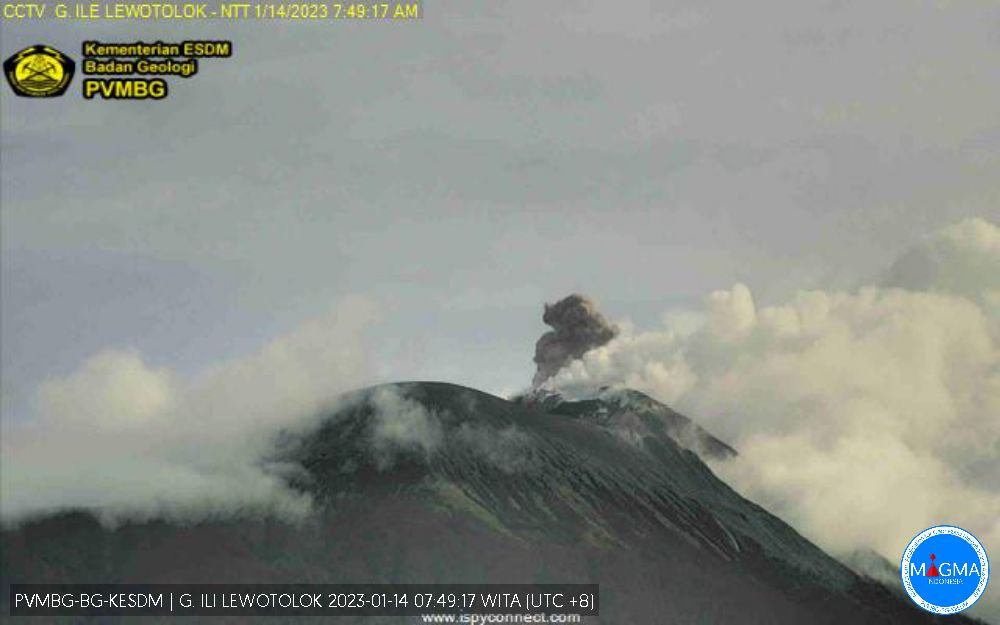
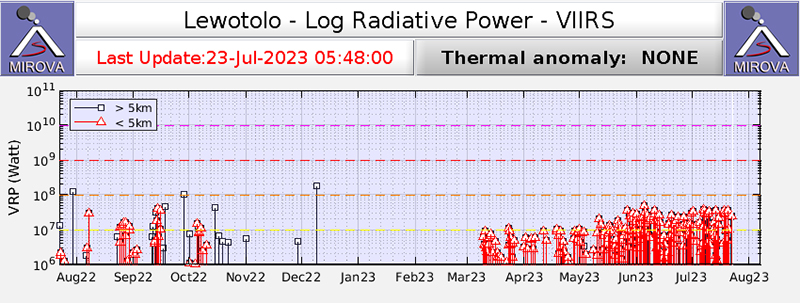
After more than two months of relative quiet, PVMBG reported that explosions at 0747 on 14 January 2023 and at 2055 on 16 January produced white-and-gray ash plumes that rose around 400 m above the summit and drifted E and SE (figure 44). During the latter half of January through April, almost daily white or white-and-gray emissions were observed rising 25-800 m above the summit, and nighttime webcam images often showed incandescent material being ejected above the summit crater. Strombolian activity was visible in webcam images at 2140 on 11 February, 0210 on 18 February, and during 22-28 March. Frequent hotspots were recorded by the MIROVA detection system starting in approximately the second week of March 2023 that progressively increased into April (figure 45).
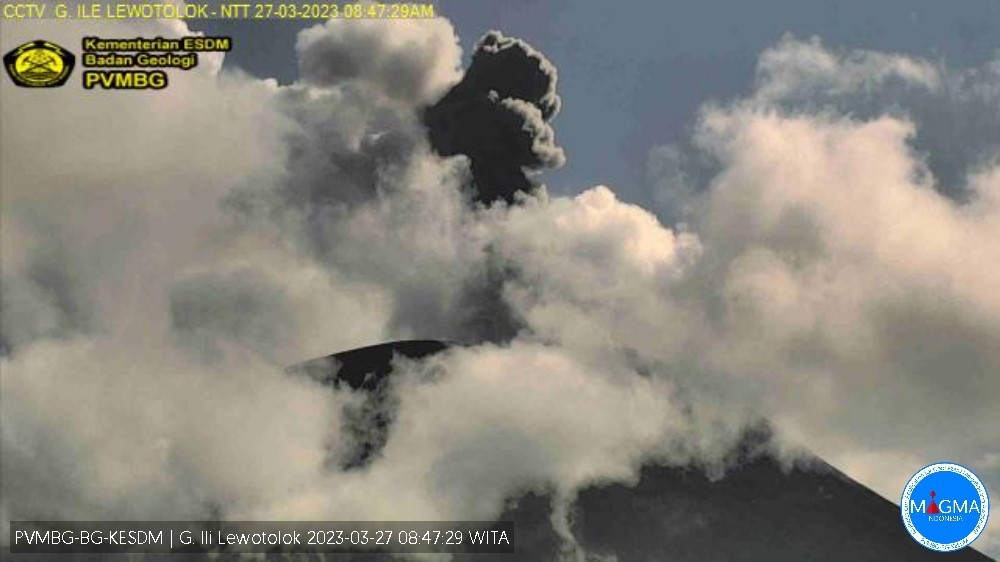
Explosions that produced dense ash plumes as high as 750 m above the summit were described in Volcano Observatory Notices for Aviation (VONA) at 0517, 1623, and 2016 on 22 March, at 1744 on 24 March, at 0103 on 26 March, at 0845 and 1604 on 27 March (figure 46), and at 0538 on 28 March. According to the Darwin VAAC, on 6 April another ash plume rose to 1.8 km altitude (about 370 m above the summit) and drifted N.
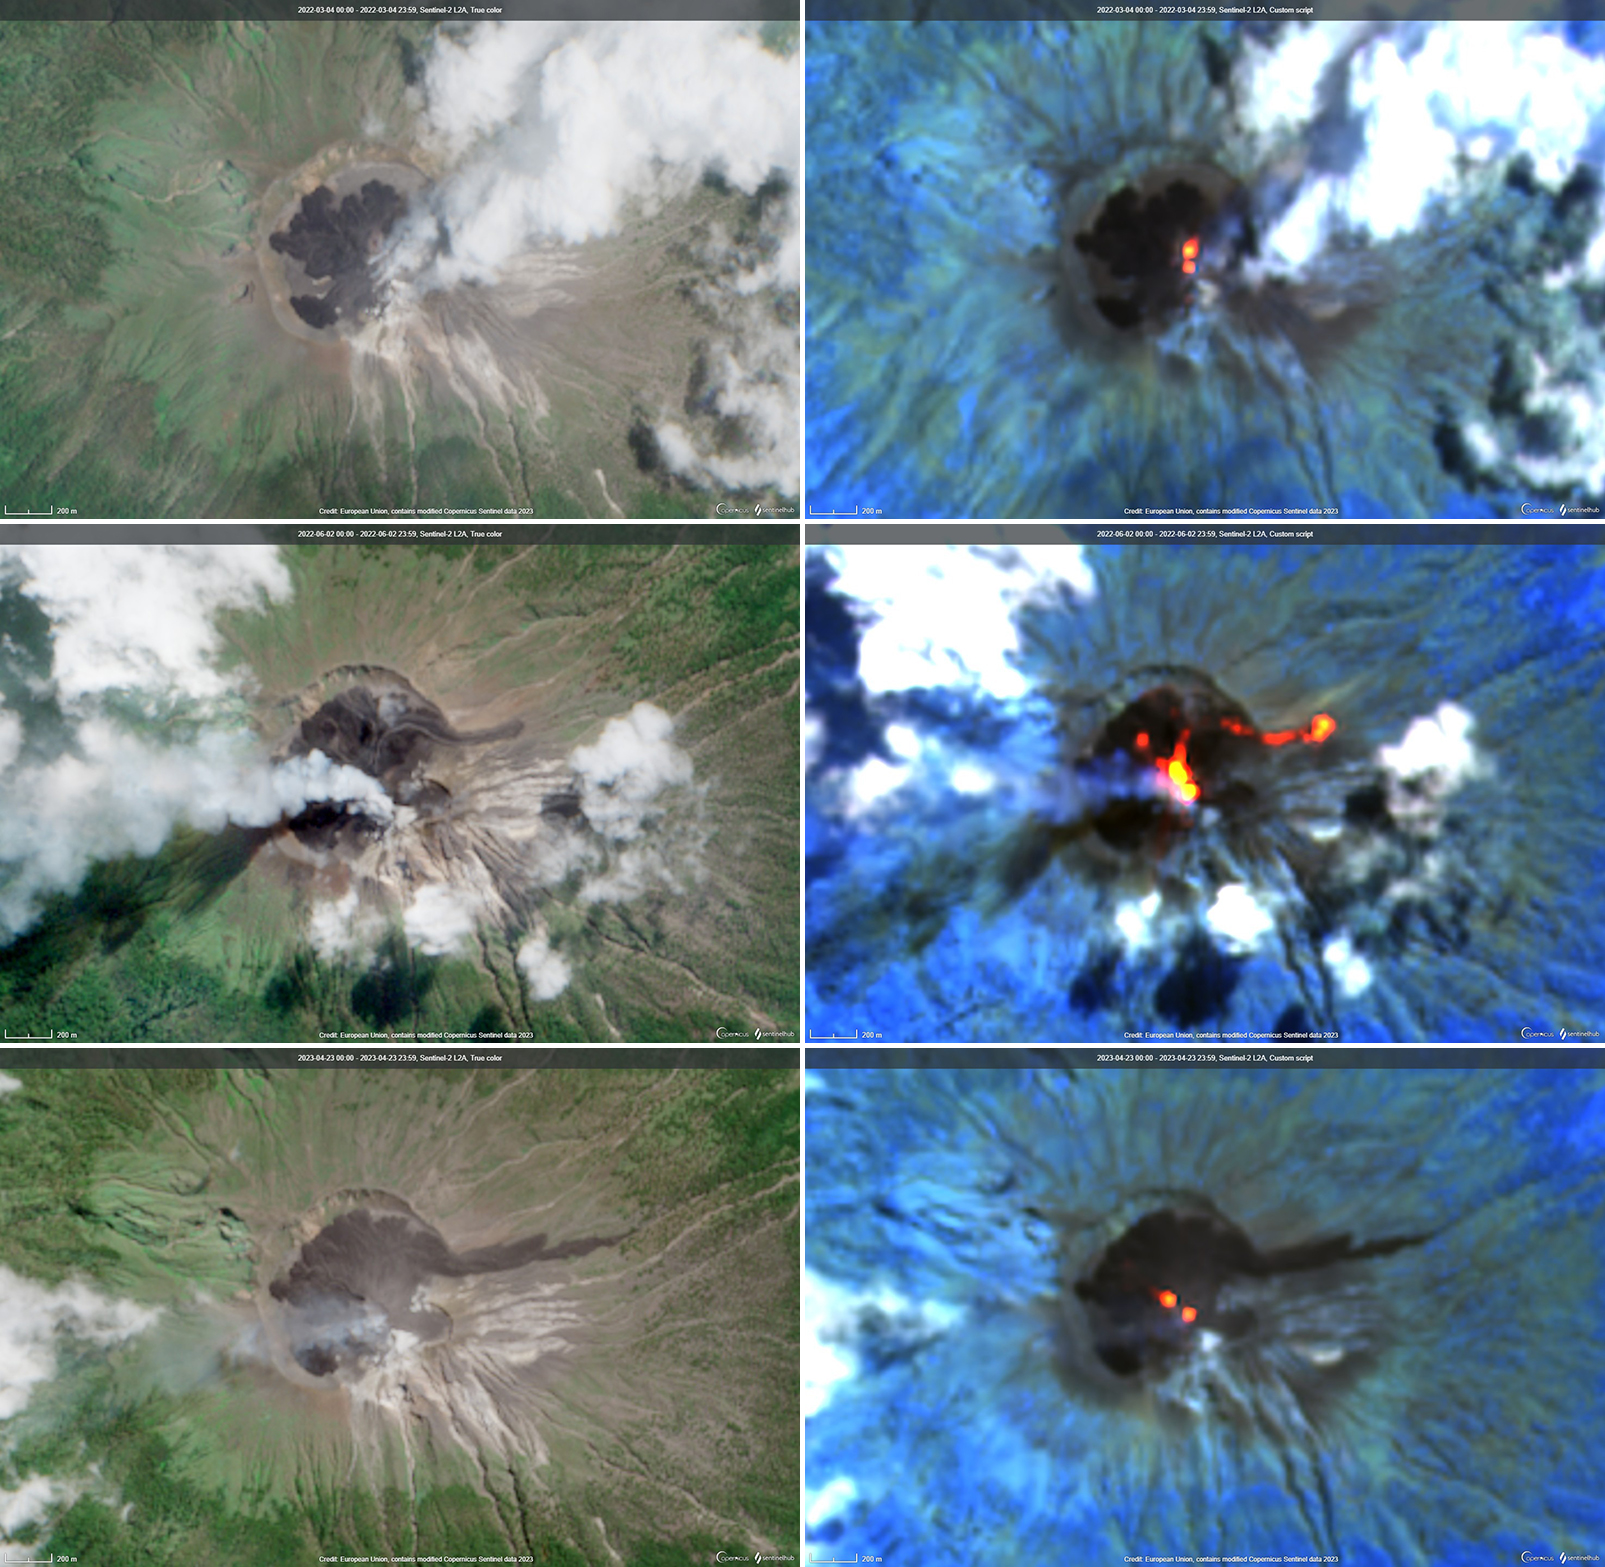
Sentinel-2 images over the previous year recorded thermal anomalies as well as the development of a lava flow that descended the NE flank beginning in June 2022 (figure 47). The volcano was often obscured by weather clouds, which also often hampered ground observations. Ash emissions were reported in March 2022 (BGVN 47:10), and clear imagery from 4 March 2022 showed recent lava flows confined to the crater, two thermal anomaly spots in the eastern part of the crater, and mainly white emissions from the SE. Thermal anomalies became stronger and more frequent in mid-May 2022, followed by strong Strombolian activity through June and July (BGVN 47:10); Sentinel-2 images on 2 June 2022 showed active lava flows within the crater and overflowing onto the NE flank. Clear images from 23 April 2023 (figure 47) show the extent of the cooled NE-flank lava flow, more extensive intra-crater flows, and two hotspots in slightly different locations compared to the previous March.
Geologic Background. The Lewotolok (or Lewotolo) stratovolcano occupies the eastern end of an elongated peninsula extending north into the Flores Sea, connected to Lembata (formerly Lomblen) Island by a narrow isthmus. It is symmetrical when viewed from the north and east. A small cone with a 130-m-wide crater constructed at the SE side of a larger crater forms the volcano's high point. Many lava flows have reached the coastline. Eruptions recorded since 1660 have consisted of explosive activity from the summit crater.
Information Contacts: Pusat Vulkanologi dan Mitigasi Bencana Geologi (PVMBG, also known as Indonesian Center for Volcanology and Geological Hazard Mitigation, CVGHM), Jalan Diponegoro 57, Bandung 40122, Indonesia (URL: http://www.vsi.esdm.go.id/); MAGMA Indonesia, Kementerian Energi dan Sumber Daya Mineral (URL: https://magma.esdm.go.id/v1); Darwin Volcanic Ash Advisory Centre (VAAC), Bureau of Meteorology, Northern Territory Regional Office, PO Box 40050, Casuarina, NT 0811, Australia (URL: http://www.bom.gov.au/info/vaac/); MIROVA (Middle InfraRed Observation of Volcanic Activity), a collaborative project between the Universities of Turin and Florence (Italy) supported by the Centre for Volcanic Risk of the Italian Civil Protection Department (URL: http://www.mirovaweb.it/); Copernicus Browser, Copernicus Data Space Ecosystem, European Space Agency (URL: https://dataspace.copernicus.eu/browser/).
Barren Island (India) — April 2023 Cite this Report
Barren Island
India
12.278°N, 93.858°E; summit elev. 354 m
All times are local (unless otherwise noted)
Thermal activity during December 2022-March 2023
Barren Island is part of a N-S-trending volcanic arc extending between Sumatra and Burma (Myanmar). The caldera, which is open to the sea on the west, was created during a major explosive eruption in the late Pleistocene that produced pyroclastic flow and surge deposits. Eruptions dating back to 1787, have changed the morphology of the pyroclastic cone in the center of the caldera, and lava flows that fill much of the caldera floor have reached the sea along the western coast. Previous activity was detected during mid-May 2022, consisting of intermittent thermal activity. This report covers June 2022 through March 2023, which included strong thermal activity beginning in late December 2022, based on various satellite data.
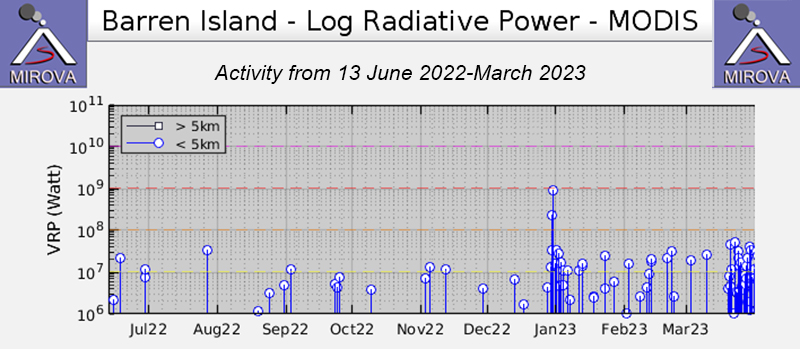
Activity was relatively quiet during June through late December 2022 and mostly consisted of low-power thermal anomalies, based on the MIROVA (Middle InfraRed Observation of Volcanic Activity) graph. During late December, a spike in both power and frequency of thermal anomalies was detected (figure 58). There was another pulse in thermal activity in mid-March, which consisted of more frequent and relatively strong anomalies.
The Suomi NPP/VIIRS sensor data showed five thermal alerts on 29 December 2022. The number of alerts increased to 19 on 30 December. According to the Darwin VAAC, ash plumes identified in satellite images captured at 2340 on 30 December and at 0050 on 31 December rose to 1.5 km altitude and drifted SW. The ash emissions dissipated by 0940. On 31 December, a large thermal anomaly was detected; based on a Sentinel-2 infrared satellite image, the anomaly was relatively strong and extended to the N (figure 59).
Thermal activity continued during January through March. Sentinel-2 infrared satellite data showed some thermal anomalies of varying intensity on clear weather days on 5, 10, 15, 20, and 30 January 2023, 9, 14, 19, and 24 February 2023, and 21, 26, and 31 March (figure 59). According to Suomi NPP/VIIRS sensor data, a total of 30 thermal anomalies were detected over 18 days on 2-3, 7, 9-14, 16-17, 20, 23, 25, and 28-31 January. The sensor data showed a total of six hotspots detected over six days on 1, 4-5, and 10-12 February. During March, a total of 33 hotspots were visible over 11 days on 20-31 March. Four MODVOLC thermal alerts were issued on 25, 27, and 29 March.
Geologic Background. Barren Island, a possession of India in the Andaman Sea about 135 km NE of Port Blair in the Andaman Islands, is the only historically active volcano along the N-S volcanic arc extending between Sumatra and Burma (Myanmar). It is the emergent summit of a volcano that rises from a depth of about 2250 m. The small, uninhabited 3-km-wide island contains a roughly 2-km-wide caldera with walls 250-350 m high. The caldera, which is open to the sea on the west, was created during a major explosive eruption in the late Pleistocene that produced pyroclastic-flow and -surge deposits. Historical eruptions have changed the morphology of the pyroclastic cone in the center of the caldera, and lava flows that fill much of the caldera floor have reached the sea along the western coast.
Information Contacts: Darwin Volcanic Ash Advisory Centre (VAAC), Bureau of Meteorology, Northern Territory Regional Office, PO Box 40050, Casuarina, NT 0811, Australia (URL: http://www.bom.gov.au/info/vaac/); MIROVA (Middle InfraRed Observation of Volcanic Activity), a collaborative project between the Universities of Turin and Florence (Italy) supported by the Centre for Volcanic Risk of the Italian Civil Protection Department (URL: http://www.mirovaweb.it/); Hawai'i Institute of Geophysics and Planetology (HIGP) - MODVOLC Thermal Alerts System, School of Ocean and Earth Science and Technology (SOEST), Univ. of Hawai'i, 2525 Correa Road, Honolulu, HI 96822, USA (URL: http://modis.higp.hawaii.edu/); Sentinel Hub Playground (URL: https://www.sentinel-hub.com/explore/sentinel-playground); NASA Worldview (URL: https://worldview.earthdata.nasa.gov/).
Search Bulletin Archive by Publication Date
Select a month and year from the drop-downs and click "Show Issue" to have that issue displayed in this tab.
The default month and year is the latest issue available.
Scientific Event Alert Network Bulletin - Volume 14, Number 01 (January 1989)
Managing Editor: Lindsay McClelland
Aira (Japan)
Explosions and ashfall decrease
Arenal (Costa Rica)
Explosions eject blocks to 1 km from crater
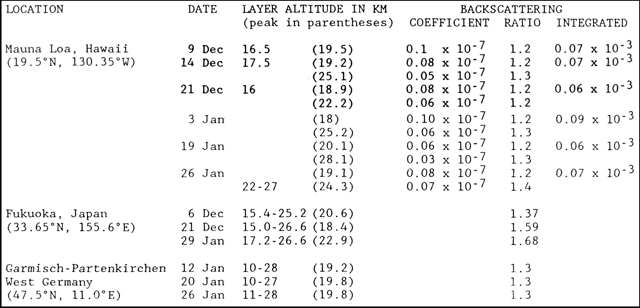
Atmospheric Effects (1980-1989) (Unknown)
Stratosphere injections unlikely from recent eruptions
Bagana (Papua New Guinea)
Avalanche breaches summit; lava drains from crater
Etna (Italy)
Strombolian activity from summit craters: inflation
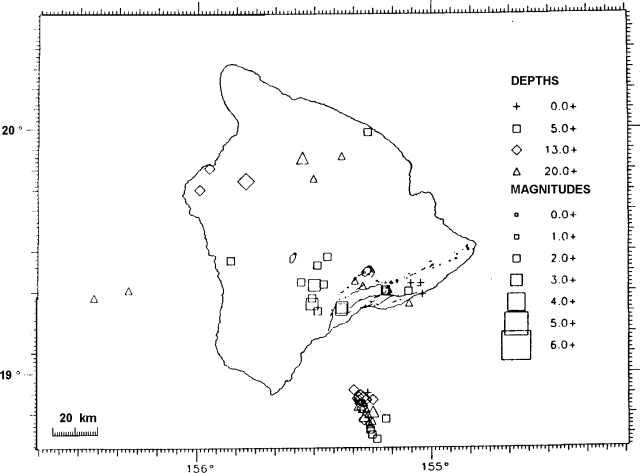
Kama'ehuakanaloa (United States)
Earthquake swarm may document magma intrusion
Kilauea (United States)
Lava flow remains active at seacoast and upslope
Langila (Papua New Guinea)
Ash emission; glow; explosion seismicity
Lengai, Ol Doinyo (Tanzania)
Aerial inspection reveals small new flows
Liamuiga (Saint Kitts and Nevis)
Seismicity re-intensifies slightly
Macdonald (France)
Eruptions seen from ship and submarine
Manam (Papua New Guinea)
Weak ash emission and glow
Poas (Costa Rica)
H2S emission kills plants; crater lake recedes rapidly
Rabaul (Papua New Guinea)
Seismicity declines; deformation low
Ruapehu (New Zealand)
December seismicity reviewed; lake temperature rises
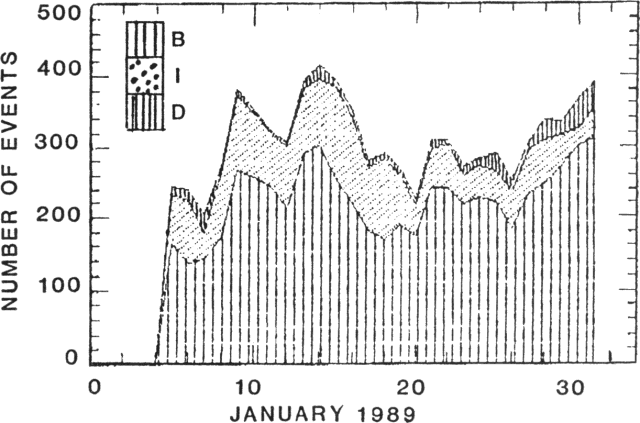
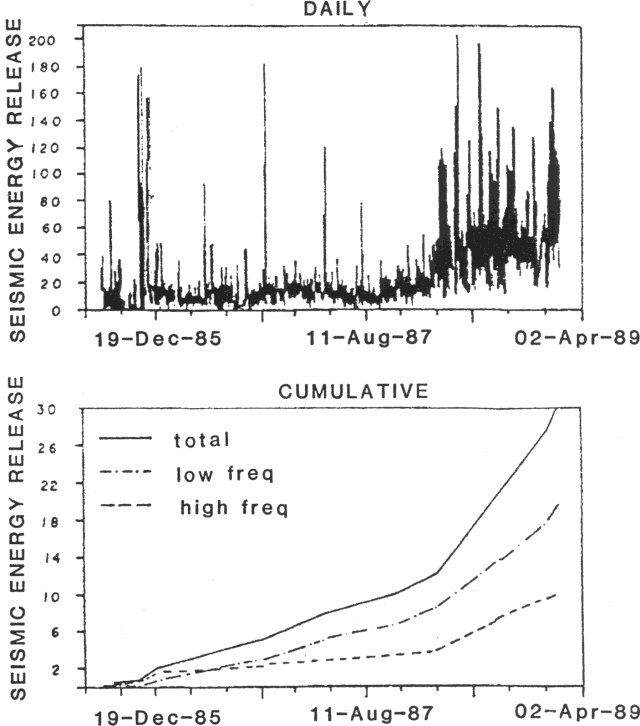
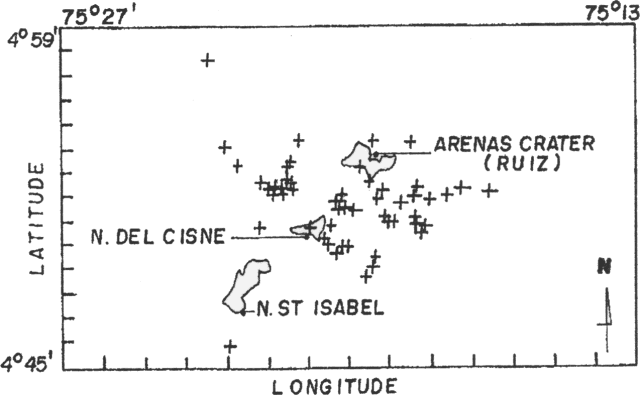
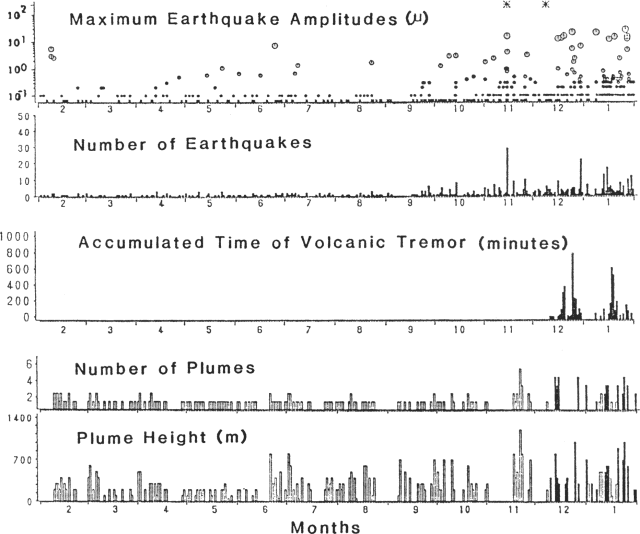
Ruiz, Nevado del (Colombia)
Seismic energy and number of event increase
Tokachidake (Japan)
Continued explosions (and partial evacuation)
Ulawun (Papua New Guinea)
Eruption ejects ash to 2 km
Vulcano (Italy)
CO2 in soil increases
Whakaari/White Island (New Zealand)
Vulcanian explosions; new crater
Aira
Japan
31.5772°N, 130.6589°E; summit elev. 1117 m
All times are local (unless otherwise noted)
Explosions and ashfall decrease
A total of 155 explosions were recorded in 1988, compared to 106 in 1987. Yearly ash accumulation at [KLMO] was 6,503 g/m2, an increase from 1987. No explosions were recorded . . . during December, but two occurred in January, at 0944 on the 26th and 1758 on the 28th. The second event, accompanied by a loud explosive sound and strong air shock, ejected an ash plume to 2000 m above the crater. Windshields of eight cars on the S part of the island were broken by lapilli from the explosion. Only 4 g/m2 of ash accumulated at [KLMO] during [December]. A seismometer 2.3 km NW of the volcano registered 28,283 earthquakes in 1988.
Geologic Background. The Aira caldera in the northern half of Kagoshima Bay contains the post-caldera Sakurajima volcano, one of Japan's most active. Eruption of the voluminous Ito pyroclastic flow accompanied formation of the 17 x 23 km caldera about 22,000 years ago. The smaller Wakamiko caldera was formed during the early Holocene in the NE corner of the caldera, along with several post-caldera cones. The construction of Sakurajima began about 13,000 years ago on the southern rim and built an island that was joined to the Osumi Peninsula during the major explosive and effusive eruption of 1914. Activity at the Kitadake summit cone ended about 4,850 years ago, after which eruptions took place at Minamidake. Frequent eruptions since the 8th century have deposited ash on the city of Kagoshima, located across Kagoshima Bay only 8 km from the summit. The largest recorded eruption took place during 1471-76.
Information Contacts: JMA.
Arenal (Costa Rica) — January 1989 Cite this Report
Arenal
Costa Rica
10.463°N, 84.703°W; summit elev. 1670 m
All times are local (unless otherwise noted)
Explosions eject blocks to 1 km from crater
Activity continued with sporadic explosions that were not accompanied by loud rumbling. Vibrations were occasionally felt on the volcano, but cloudy weather usually obscured the summit. Blocks fell as far as 1 km from the crater. On 10 January at 1442, several blocks struck near geologists working on the W flank, forming impact craters and burning plants.
Geologic Background. Conical Volcán Arenal is the youngest stratovolcano in Costa Rica and one of its most active. The 1670-m-high andesitic volcano towers above the eastern shores of Lake Arenal, which has been enlarged by a hydroelectric project. Arenal lies along a volcanic chain that has migrated to the NW from the late-Pleistocene Los Perdidos lava domes through the Pleistocene-to-Holocene Chato volcano, which contains a 500-m-wide, lake-filled summit crater. The earliest known eruptions of Arenal took place about 7000 years ago, and it was active concurrently with Cerro Chato until the activity of Chato ended about 3500 years ago. Growth of Arenal has been characterized by periodic major explosive eruptions at several-hundred-year intervals and periods of lava effusion that armor the cone. An eruptive period that began with a major explosive eruption in 1968 ended in December 2010; continuous explosive activity accompanied by slow lava effusion and the occasional emission of pyroclastic flows characterized the eruption from vents at the summit and on the upper western flank.
Information Contacts: J. Barquero and E. Fernández, OVSICORI.
Atmospheric Effects (1980-1989) (Unknown) — January 1989 Cite this Report
Atmospheric Effects (1980-1989)
Unknown
Unknown, Unknown; summit elev. m
All times are local (unless otherwise noted)
Stratosphere injections unlikely from recent eruptions
Lidar data from Hawaii, Japan, and Germany generally showed continuing low concentrations of stratospheric aerosols (figure 64. A broad layer centered at about 24 km altitude was detected over Mauna Loa, Hawaii on 26 January, but its profile was not characteristic of newly injected material. At Fukuoka, Japan, peak backscattering increased slightly in December and January, to levels last measured shortly after the May eruption of Banda Api, Indonesia.
No recent eruptions appear to have produced clouds that reached the stratosphere. Observations of the December-January eruption of Lonquimay, Chile from the ground and from weather satellites revealed no clouds exceeding 9 km altitude. Weather conditions hampered observations during the December-January eruption of Tokachi-dake, Japan, and no large eruption clouds were seen, although ash fell tens of kilometers away.
Geologic Background. The enormous aerosol cloud from the March-April 1982 eruption of Mexico's El Chichón persisted for years in the stratosphere, and led to the Atmospheric Effects section becoming a regular feature of the Bulletin. Descriptions of the initial dispersal of major eruption clouds remain with the individual eruption reports, but observations of long-term stratospheric aerosol loading will be found here.
Information Contacts: Thomas DeFoor, Mauna Loa Observatory, P.O. Box 275, Hilo, HI 96720 USA; Motowo Fujiwara, Physics Department, Fukuoka University, Jonan-ku, Fukuoka 814-01, Japan; Horst Jäger, Fraunhofer-Institut für Atmosphärische Umweltforschung, Kreuzeckbahnstrasse 19, D-8100 Garmisch-Partenkirchen, West Germany.
Bagana (Papua New Guinea) — January 1989 Cite this Report
Bagana
Papua New Guinea
6.137°S, 155.196°E; summit elev. 1855 m
All times are local (unless otherwise noted)
Avalanche breaches summit; lava drains from crater
"A minor collapse took place near the summit early on 22 January. The summit was reported to be glowing bright red at about 0430, then changed from red to yellow as it became even brighter. This activity culminated in an avalanche of incandescent boulders down the SE flank . . . . Shortly afterward, a large plume of ash and vapour developed. Inspections . . . on 28 January and 3 February revealed that structural failure had occurred at the outflow point of the lava flow on the E edge of the summit. The breach that was formed allowed rapid drainage of lava, forming a crater at Bagana's summit. The lava in the crater has a flat surface and appears to be flowing freely through the breach.
"It is concluded that the bright glow from the summit seen on 22 January resulted from the emergence of a pulse of hotter, more fluid lava which destabilized the edge of the dome and initiated the breaching."
Geologic Background. Bagana volcano, in a remote portion of central Bougainville Island, is frequently active. This massive symmetrical cone was largely constructed by an accumulation of viscous andesitic lava flows. The entire edifice could have been constructed in about 300 years at its present rate of lava production. Eruptive activity is characterized by non-explosive effusion of viscous lava that maintains a small lava dome in the summit crater, although occasional explosive activity produces pyroclastic flows. Lava flows with tongue-shaped lobes up to 50 m thick and prominent levees descend the flanks on all sides.
Information Contacts: C. McKee, H. Patia, and P. de Saint-Ours, RVO.
Etna
Italy
37.748°N, 14.999°E; summit elev. 3357 m
All times are local (unless otherwise noted)
Strombolian activity from summit craters: inflation
After the October 1986-February 1987 eruption, activity has been confined to the summit craters. In the following report, frequent observations by IIV personnel with help from Italian Alpine Club guides are supplemented by data from geologists who reoccupied ground deformation networks 20 May-24 June and 16 September-7 October.
Bocca Nuova. Since the end of April 1988, Strombolian activity and/or degassing has continued at varying intensity. Explosive vents were active at different points on the crater floor, 150-250 m below the rim. Lava fragments only rarely reached the crater rim. Ash and lapilli ejections were occasionally observed, especially during periods of stronger and more continuous activity. In May and June, small explosions or gas bursts could be heard deep within the crater at a rate of 30-50/minute, with larger explosions about every 5 minutes. Loudness of the explosions varied considerably; they usually were not audible 400 m from the crater, but on 23 June, 4 were heard from Rifugio Sapienza, 5.5 km S, between 1214 and 1226. In September and October, the explosion rate was 30-40/minute. Strombolian explosions from three active vents on the crater floor, roughly 150 m below the rim, were observed about once every 5 minutes. Louder series of explosions were heard up to 3 km away on 23 and 28 September and 1 October. During the night of 1-2 October, a few fresh bombs landed just outside the crater rim and the next day bombs were rising to ~ 10 m below the rim. Violent activity that included lava fountaining was observed from a distance on 31 January 1989 from 1930 to 2100. Bocca Nuova was relatively quiet in early February.
La Voragine. The vent was partially obstructed until July, with activity limited to weak gas emission. Strombolian activity of variable intensity then started at the bottom of the crater, at more than 250 m depth. Ejecta only rarely reached the rim. On 23 August between 1610 and 1650, a series of pyroclastic explosions ejected juvenile material (lava fragments, scoria, lapilli, and ash) to a few hundred meters height. The tephra fell mainly on the E flank, to 400 m from the rim. Explosive activity ceased completely from the end of August until the beginning of September. During visits on 28 September and 6 October, Strombolian explosions were occurring from vents that appeared to be higher in the crater than those at Bocca Nuova. About 30 explosions/minute were counted on the 28th, with ~1/minute strong enough to eject bombs visible to the geologists, who could see 50-80 m into the crater. At night on 2 October, no noises could be heard from the rim, although faint glow was visible. In early February 1989, little activity was occurring from the crater.
Southeast Crater. Gas emission, sometimes under pressure, continued from a vent near the center of this complex of cones and depressions. By 4 October the gas emission had strengthened, ejecting blocks, apparently from the wallrock, and sublimates. Weak and irregular Strombolian activity began in early October. A small new vent opened between 24 and 25 November E of the previous vent, ejecting ash and other tephra. Some of the explosions were fairly vigorous, as on 27 November. The activity changed gradually from ash ejection to a nearly continuous explosive Strombolian activity, with periods of greater and lesser intensity. At times, lava fragments reached 250 m height, falling within a few hundred meters of the crater. Similar Strombolian activity was continuing in early February 1989.
Northeast Crater. Only fumarolic activity was observed until the end of July, varying in intensity with weather conditions. A small vent opened inside this crater on 24 July and grew with time. Very hot pressurized gases emerged, particularly soon after the vent opened. The vent was glowing at night in September. Smoke rings were occasionally emitted in September and October, similar to those observed from Bocca Nuova early in its development.
The following deformation and seismic data are from J.B. Murray.
Despite the increased seismicity and deformation recorded February-April 1988 (13:03), the June levelling traverse showed an unusually small amount of movement since September 1987. Subsidence of recent lava around Northeast Crater was <2 cm, an order of magnitude less than usual and the smallest recorded since the line was installed in 1975. Inflation of 1.6 cm measured 3.5 km NE of the summit was also unusual. Recently active areas generally showed subsidence, with downward movement of slightly > 1 cm at the 1983, 1985, and September 1986 dikes, and isolated larger movements of -6.6 cm at the 1986-87 fissure and -19 cm at the edge of Southeast Crater. The very large amounts of subsidence measured in recent years in the Valle del Leone have diminished considerably.
A very different pattern was measured during the September traverse, with broad inflation centered just SW of Bocca Nuova. Inflation extended over the entire traverse, reaching +5.3 cm at the center when compared to the southern reference station 2.5 km away, or +8.5 cm compared to stations at the N end of the traverse, 5 km away. This inflation was the largest recorded at Etna when no eruption had occurred between measurements. Most dry-tilt stations showed typical small, more or less random, tilts of apparently local origin. However, 4 stations 4-9 km to the SW showed westerly tilts of 20-30 µrad, suggesting that inflation may extend farther in that direction. Murray noted that summit inflation preceding summit eruptions was measured in May 1976, June and September 1977, September 1978, July 1980, October 1983, September 1984, and June 1986. Inflation episodes centered just SW of the summit have tended to precede Southeast Crater activity.
Small local shocks that were apparently related to summit activity were detected optically during measurements of the levelling line and dry tilt stations. Using the automatic level, relative amplitudes were obtained by noting the amount of crosshair movement against the levelling rod and correcting for distance. In June, seismicity was very quiet, with only four events noted in a week of levelling, all within 450 m of Bocca Nuova. The largest had an amplitude of ~ 60 µrad.
In September and October, seismicity had increased dramatically. On 23 September, 73 shocks were noted in 1 hour while levelling W of Bocca Nuova at a mean distance of 330 m from the rim. The shocks were much stronger than in June, with largest amplitudes reaching 250 µrad. Seismic events were detected as much as 4.6 km from the summit. W of Piccolo Rifugio, ~ 3 km from the summit, three shocks were detected in 1 hour, the largest of 35 µrad.
Geologic Background. Mount Etna, towering above Catania on the island of Sicily, has one of the world's longest documented records of volcanism, dating back to 1500 BCE. Historical lava flows of basaltic composition cover much of the surface of this massive volcano, whose edifice is the highest and most voluminous in Italy. The Mongibello stratovolcano, truncated by several small calderas, was constructed during the late Pleistocene and Holocene over an older shield volcano. The most prominent morphological feature of Etna is the Valle del Bove, a 5 x 10 km caldera open to the east. Two styles of eruptive activity typically occur, sometimes simultaneously. Persistent explosive eruptions, sometimes with minor lava emissions, take place from one or more summit craters. Flank vents, typically with higher effusion rates, are less frequently active and originate from fissures that open progressively downward from near the summit (usually accompanied by Strombolian eruptions at the upper end). Cinder cones are commonly constructed over the vents of lower-flank lava flows. Lava flows extend to the foot of the volcano on all sides and have reached the sea over a broad area on the SE flank.
Information Contacts: R. Romano, T. Caltabiano, and O. Consoli, IIV; J. Murray and D. Norman, Dept of Photogrammetry and Surveying, Univ College London; D. Décobecq, Paris; J. Miller, T. Elliott, and B. Van Wyk de Vries, Open Univ; B. Bone, Lancaster.
Kama'ehuakanaloa (United States) — January 1989 Cite this Report
Kama'ehuakanaloa
United States
18.92°N, 155.27°W; summit elev. -975 m
All times are local (unless otherwise noted)
Earthquake swarm may document magma intrusion
An earthquake swarm, detected 24 January 1989 from 0736 to 1009, included 12 relatively large events (M 2.5-3.6) and 15 smaller events (M 1.3-2.5) superimposed on continuous background tremor (figure 3). Ten events (M 1.5-2.3) of relatively high frequencies followed during the remainder of the day, then declined. After four events [of M 1.3-2.5] on the 25th, only sporadic seismicity [consisting of four more events during 26-31 January of M 1.2-2.9] was recorded. Frequencies were characteristic of tectonic-type events, suggesting to USGS geophysicists that they may have marked an intrusive episode, but probably not an eruption. Depth control was limited, since the nearest seismic station is on the S coast of Hawaii, >30 km away.
Geologic Background. The Kama’ehuakanaloa seamount, previously known as Loihi, lies about 35 km off the SE coast of the island of Hawaii. This youngest volcano of the Hawaiian chain has an elongated morphology dominated by two curving rift zones extending north and south of the summit. The summit region contains a caldera about 3 x 4 km and exhibits numerous lava cones, the highest of which is about 975 m below the ocean surface. The summit platform also includes two well-defined pit craters, sediment-free glassy lava, and low-temperature hydrothermal venting. An arcuate chain of small cones on the western edge of the summit extends north and south of the pit craters and merges into the crests prominent rift zones. Seismicity indicates a magmatic system distinct from that of Kilauea. During 1996 a new pit crater formed at the summit, and lava flows were erupted. Continued volcanism is expected to eventually build a new island; time estimates for the summit to reach the ocean surface range from roughly 10,000 to 100,000 years.
Information Contacts: R. Koyanagi, USGS Hawaiian Volcano Observatory.
Kilauea (United States) — January 1989 Cite this Report
Kilauea
United States
19.421°N, 155.287°W; summit elev. 1222 m
All times are local (unless otherwise noted)
Lava flow remains active at seacoast and upslope
During January, an estimated 70% of the lava that emerged from the Kupaianaha lava pond entered the ocean via the W tube system . . . . The pond level averaged 20-25 m below the rim all month. Two flows that branched from the main tube system at 440-425 m completely roofed over during the month but fed surface breakouts at low elevations. The terminus of the first flow was near the N edge of the 1986 Kapa'ahu kipuka at 35 m elevation. The second flow followed the E edge of the 1986-89 lava field during early January. By the 23rd, the main terminus had advanced onto grassland and was 800 m upslope of Hwy 130. The 150-m-wide terminus did not advance after the 23rd, but the flow remained active upslope. Active lava was also sighted several times in the bottom of Pu`u `O`o.
Output from the tube system at the coast continued to build an active lava bench, which measured 535 x 115 m on 5 January. Lava entered the bench at one main entry point and at two smaller outlets to the E. From 5 to 9 January, 20% of the bench was destroyed by small collapses. On the 11th, a steam jetting event from the tube on the bench deposited spatter 150 m inland. On the 20th, three littoral cones (~1-2 m) were forming on the bench. A major collapse on the 23rd at 0844 removed the bench's W half, causing an explosion that threw 10-50-cm blocks 40-50 m inland. On 24 January, spatter explosions built cones 2 m high on the remaining portion of the bench, which began to rebuild on the 26th. Growth continued until the end of the month.
Low-level tremor . . . continued in the middle East rift zone and at the flow front near Kupapau Point. Tremor was generally steady except 5-9 January when amplitude fluctuated at intervals varying from minutes to several hours. A series of rockfall and acoustic signals, caused by the major bench collapse on 23 January, was recorded . . . from 0820-0948. The number of microearthquakes was about average in the summit region and East rift zone.
Geologic Background. Kilauea overlaps the E flank of the massive Mauna Loa shield volcano in the island of Hawaii. Eruptions are prominent in Polynesian legends; written documentation since 1820 records frequent summit and flank lava flow eruptions interspersed with periods of long-term lava lake activity at Halemaumau crater in the summit caldera until 1924. The 3 x 5 km caldera was formed in several stages about 1,500 years ago and during the 18th century; eruptions have also originated from the lengthy East and Southwest rift zones, which extend to the ocean in both directions. About 90% of the surface of the basaltic shield volcano is formed of lava flows less than about 1,100 years old; 70% of the surface is younger than 600 years. The long-term eruption from the East rift zone between 1983 and 2018 produced lava flows covering more than 100 km2, destroyed hundreds of houses, and added new coastline.
Information Contacts: C. Heliker and R. Koyanagi, HVO.
Langila (Papua New Guinea) — January 1989 Cite this Report
Langila
Papua New Guinea
5.525°S, 148.42°E; summit elev. 1330 m
All times are local (unless otherwise noted)
Ash emission; glow; explosion seismicity
"Activity increased slightly on 26 December and continued into January. A number of low-frequency explosion earthquakes (2-9) were recorded daily, some of which were accompanied by loud detonations heard at the the observation post . . . . Weak to loud rumbling noises were often heard and moderate pale-grey ash and vapour clouds were released from Crater 2. Weak red glow was observed at the summit on the nights of 4 and 9-11 January, by which time the number of explosion shocks had decreased to 1-3/day. One louder Vulcanian explosion took place on the 11th, producing a thick dark ash column. Weak red glow was observed again on the nights of 15-16 January and occasional weak rumbling noises were heard until the 21st. Occasional weak vapour emissions were observed from Crater 3 on the 4-5th, 10-11th, 13th, and 22nd."
Geologic Background. Langila, one of the most active volcanoes of New Britain, consists of a group of four small overlapping composite basaltic-andesitic cones on the lower E flank of the extinct Talawe volcano in the Cape Gloucester area of NW New Britain. A rectangular, 2.5-km-long crater is breached widely to the SE; Langila was constructed NE of the breached crater of Talawe. An extensive lava field reaches the coast on the N and NE sides of Langila. Frequent mild-to-moderate explosive eruptions, sometimes accompanied by lava flows, have been recorded since the 19th century from three active craters at the summit. The youngest and smallest crater (no. 3 crater) was formed in 1960 and has a diameter of 150 m.
Information Contacts: C. McKee, H. Patia, and P. de Saint-Ours, RVO.
Ol Doinyo Lengai (Tanzania) — January 1989 Cite this Report
Ol Doinyo Lengai
Tanzania
2.764°S, 35.914°E; summit elev. 2962 m
All times are local (unless otherwise noted)
Aerial inspection reveals small new flows
During . . . 22-25 November 1988 . . . the N crater [was] mapped by pacing and prismatic compass (figure 12). An aerial inspection from 0730-0800 on 14 December 1988 revealed small fresh flows (1-2 days old) . . . from the W side of T5/T9 . . . . [Vent T11] appeared cold and hard. The inner nested cone that was forming [on] 25 November had not grown significantly. No new lava had entered the S crater. Fumarolic activity continued around the crater rim, saddle, and crater walls.
Geologic Background. The symmetrical Ol Doinyo Lengai is the only volcano known to have erupted carbonatite tephras and lavas in historical time. The prominent stratovolcano, known to the Maasai as "The Mountain of God," rises abruptly above the broad plain south of Lake Natron in the Gregory Rift Valley. The cone-building stage ended about 15,000 years ago and was followed by periodic ejection of natrocarbonatitic and nephelinite tephra during the Holocene. Historical eruptions have consisted of smaller tephra ejections and emission of numerous natrocarbonatitic lava flows on the floor of the summit crater and occasionally down the upper flanks. The depth and morphology of the northern crater have changed dramatically during the course of historical eruptions, ranging from steep crater walls about 200 m deep in the mid-20th century to shallow platforms mostly filling the crater. Long-term lava effusion in the summit crater beginning in 1983 had by the turn of the century mostly filled the northern crater; by late 1998 lava had begun overflowing the crater rim.
Information Contacts: C. Nyamweru, Kenyatta Univ.
Liamuiga (Saint Kitts and Nevis) — January 1989 Cite this Report
Liamuiga
Saint Kitts and Nevis
17.37°N, 62.8°W; summit elev. 1156 m
All times are local (unless otherwise noted)
Seismicity re-intensifies slightly
The earthquake swarm . . . intensified slightly in January. As of 22 January, 15 local earthquakes had been registered during the month, four of which were felt on 18 January. Records from the seismographs installed in October confirmed that these events originated at depths of 3-5 km directly beneath and slightly W of the crater. The slightly shallower focal depths compared with the earlier events may reflect better depth control. Keith Rowley inspected the crater on 19 January. There were no significant changes. An additional seismograph station was established at Mt. Pleasant, 3 km N of the crater, on 20 January.
Geologic Background. Mount Liamuiga volcano, comprising the NW end of St. Kitts Island, contains a steep-walled, 1-km-wide summit crater, which contained a shallow lake until 1959. Two lava domes are located on the upper W flank, and intrusion of a 3rd dome, Brimstone Hill, on the lower SW flank uplifted a Pleistocene limestone block. Liamuiga, sometimes referred to as Mount Misery, is the youngest of three NW-migrating volcanic centers on St. Kitts. Its most recent major eruptions less than 2,000 years ago produced pyroclastic flows and mudflows whose deposits underlie populated coastal areas. Reports of possible eruptions in 1692 and 1843 are considered uncertain. An earthquake swarm from late 1988 to early 1989 caused small landslides in the summit crater; another earthquake swarm took place in 1999-2000. Active fumaroles are found in the summit crater.
Information Contacts: J. Shepherd, K. Rowley, and L. Lynch, UWI.
Macdonald (France) — January 1989 Cite this Report
Macdonald
France
28.98°S, 140.25°W; summit elev. -39 m
All times are local (unless otherwise noted)
Eruptions seen from ship and submarine
The volcano entered a new eruptive phase 19-20 January after 2 weeks of quiet. T-waves from a series of explosions were registered by the RSP. After 3 days without activity, eruptions began just as the support ship for a joint French-German oceanographic study of hot spots in the Society and Austral Islands (with the submersible Cyana) arrived . . . . On 24 January at [0345], flashes of light, probably resulting from gas combustion within surface bubbles, accompanied a strong H2S odor. Bubbling at the sea surface emitted water vapor and H2S gas [at 0400-0430 and 0530-0600]. A green slick formed on the ocean surface, rapidly growing to nearly 2 km, while the seismic station at Papeete detected explosion signals from Macdonald. The green slick (apparently 5-25 m thick) drifted away . . . at roughly 0.5 km/hour and disappeared during the following night.
No surface activity was observed early 25 January, but the seismic network registered small signals. At [1215], the appearance of a green surface slick coincided with an explosive event recognized on the seismographs. The slick was composed of floating patches of foam, volcanic ash, and orange-yellow bits of sulfur with dark grey interiors. Numerous dead fish floated on the ocean surface in and around the slick, their gills choked with volcanic ash.
No further activity was observed at Macdonald until 27 January. At [1400], sprays of water and vapor were observed on the sea surface as Cyana was submerging to study the volcano. These were accompanied by large black bubbles of foam, composed of an emulsion of volcanic ash and gas, iron sulfide, and steam. The bubbles exploded at the surface, emitting a large volume of gas. Degassing from fissures at the base of one of the craters was observed from Cyana at the sea bottom. Similar surface activity occurred again [at 1730-1900], accompanied by short, red flashes.
At [0435] the next day, three green surface slicks formed, accompanied by large explosions that were felt on the support ship. Many explosive events that were registered on board the ship by a 3.5 kHz echosounder were also recorded at the RSP in Tahiti. By the time the eruption ended at [1501], a number of events had been detected by the echosounder during surface activity. Two additional dives by Cyana allowed reconnaissance studies of Macdonald's volcanic structures between 1,500 m depth and the summit, 50 m below sea level. During the eruption, 16 sets of water samples (each consisting of 12 samples from different depths) were taken. While the support vessel was in the area, a hydrophone was deployed, recording all underwater acoustic events. (see figure 1)
Geologic Background. Discovered by the detection of teleseismic waves in 1967, Macdonald seamount (also known as Tamarii seamount) rises from a depth of about 1,800 m to within 27 m of the ocean surface at the eastern end of the Austral Islands. The basaltic submarine volcano marks the site of a hotspot that was the source of the Austral-Cook island chain. The summit, named after volcanologist Gordon Macdonald, consists of a flat plateau about 100 x 150 m wide with an average depth of about 40 m. The summit plateau is capped with spatter cones that form steep-sided pinnacles. Most eruptions have been seismically detected, but in 1987 and 1989 pumice emission was observed from research vessels. Pumice rafts observed in the South Pacific in 1928 and 1936 may also have originated here.
Information Contacts: J-L. Cheminée, IPGP; P. Stoffers, Christian-Albrechts Univ zu Kiel, Germany; J. Talandier, LDG Tahiti; G. MacMurtry, Univ of Hawaii; H. Richnow, Univ Hamburg, Germany; N. Binard, Lab de Géologie Marin, France; R. Huber, Univ Regensburg, Germany; E. Okal, Northwestern Univ, IL.
Manam (Papua New Guinea) — January 1989 Cite this Report
Manam
Papua New Guinea
4.08°S, 145.037°E; summit elev. 1807 m
All times are local (unless otherwise noted)
Weak ash emission and glow
"Activity continued at a low level during January with weak to moderate emissions of white vapour. Emissions from Southern Crater were accompanied by small amounts of grey ash on the 9th, 23rd, and 24th, and blue vapour on the 18th, 19th and 24th. Deep rumbling noises from this crater were often heard and weak fluctuating glow was observed on the 8th, 30th, and 31st. Seismicity remained at a low-moderate level with 700-1,200 small B-type volcanic events recorded daily. No significant tilt change was recorded."
Geologic Background. The 10-km-wide island of Manam, lying 13 km off the northern coast of mainland Papua New Guinea, is one of the country's most active volcanoes. Four large radial valleys extend from the unvegetated summit of the conical basaltic-andesitic stratovolcano to its lower flanks. These valleys channel lava flows and pyroclastic avalanches that have sometimes reached the coast. Five small satellitic centers are located near the island's shoreline on the northern, southern, and western sides. Two summit craters are present; both are active, although most observed eruptions have originated from the southern crater, concentrating eruptive products during much of the past century into the SE valley. Frequent eruptions, typically of mild-to-moderate scale, have been recorded since 1616. Occasional larger eruptions have produced pyroclastic flows and lava flows that reached flat-lying coastal areas and entered the sea, sometimes impacting populated areas.
Information Contacts: C. McKee, H. Patia, and P. de Saint-Ours, RVO.
Poas (Costa Rica) — January 1989 Cite this Report
Poas
Costa Rica
10.2°N, 84.233°W; summit elev. 2697 m
All times are local (unless otherwise noted)
H2S emission kills plants; crater lake recedes rapidly
The crater lake has continued to recede and by February 1989 its level was ~12 m lower than on 24 June. During fieldwork on 7 February, the lake was bubbling vigorously and had a temperature of 85°C. Suspended sediment gave it a gray-black color; filtered lake water was yellow-green. Areas of higher heat flow and/or more intense fumarolic activity were indicated by mud plumes >1 m high. Geyser-type eruptions were not observed, and reportedly ended in October. Blocks of altered scoria that approached 3 x 2 x 1.5 m floated on the lake surface, tracing the paths of convection currents (figure 7).
Temperatures of fumaroles on the 1953-55 [dome] decreased from 200-275°C in October 1988 to 64-94°C in February 1989. Fumaroles on lake sediment terraces vented directly into the atmosphere or mixed with water draining from the surrounding crater walls. Hot pools in streams (temperatures 35-71°C) and small mud pots formed and disappeared. The pools were often coated with a layer of precipitated dark green sulfur. Fumaroles on the exposed lake bottom were no hotter than 94°C. They emitted large quantities of H2S, changing the composition of the crater gas plume, which was blown W and SW by strong winds. Reports from SW-flank towns (Grecia, Sarchi, and Naranjo; 17, 18, and 19 km from the crater) indicated that the plume has become more toxic, burning trees and plants closer to the volcano and leaving them dead or dying. Vegetation was damaged in forests, grassland, and some agricultural land, principally in the towns of San Luis and Trojas de Grecia, 11 km SW of the crater. Residents of those towns suffered from eye and throat irritation. Fogs reportedly coated cars and houses with fine sulfur particles, similar to coatings that affected a rain gauge in the crater downwind of the plume. During periods of higher lake level, the H2S had emerged into the lake where it was oxidized to sulfur and H2SO4, so less had reached the atmosphere.
Park personnel reported small explosions during the afternoon of 3 February and at about 0700 on 6 February. The cause of the explosions may have been venting from two small pyroclastic cones composed entirely of sulfur. The larger of the two cones was ~1 m high, and they were separated by a large hole that was the site of vigorous fumarolic activity. Particles of bright yellow pyroclastic sulfur covered ~500 m2 on the NE part of the crater floor.
January 1989 seismicity was the most active of the past 2 years (figure 8). The number of events averaged 307/day at Red Sismológico Nacional station VPS-2, roughly 1 km NW of the lake. The bulk of the events were of low frequency with depths that did not exceed 1 km.
Geologic Background. The broad vegetated edifice of Poás, one of the most active volcanoes of Costa Rica, contains three craters along a N-S line. The frequently visited multi-hued summit crater lakes of the basaltic-to-dacitic volcano are easily accessible by vehicle from the nearby capital city of San José. A N-S-trending fissure cutting the complex stratovolcano extends to the lower N flank, where it has produced the Congo stratovolcano and several lake-filled maars. The southernmost of the two summit crater lakes, Botos, last erupted about 7,500 years ago. The more prominent geothermally heated northern lake, Laguna Caliente, is one of the world's most acidic natural lakes, with a pH of near zero. It has been the site of frequent phreatic and phreatomagmatic eruptions since an eruption was reported in 1828. Eruptions often include geyser-like ejections of crater-lake water.
Information Contacts: Gary Rowe and Susan Brantley, Pennsylvania State Univ, USA; José Francisco Fernández, Chemistry Laboratory, Instituto Costarricense de Electricidad, San José, Costa Rica; Mario Fernández and Luis Diego Morales, Univ de Costa Rica, San José, Costa Rica; R. Barquero and Guillermo Alvarado, ICE; J. Barquero and E. Fernández, OVSICORI.
Rabaul (Papua New Guinea) — January 1989 Cite this Report
Rabaul
Papua New Guinea
4.2459°S, 152.1937°E; summit elev. 688 m
All times are local (unless otherwise noted)
Seismicity declines; deformation low
"Seismicity continued to decline in January. The total number of caldera earthquakes was 95. On most days only a few events were recorded, but 21 earthquakes occurred on the 31st. Only six events could be located. These occurred mainly on the NW and NE parts of the caldera seismic zone. Ground deformation rates remained low. No significant elevation or tilt changes were recorded, and EDM data showed no clear trends."
Geologic Background. The low-lying Rabaul caldera on the tip of the Gazelle Peninsula at the NE end of New Britain forms a broad sheltered harbor utilized by what was the island's largest city prior to a major eruption in 1994. The outer flanks of the asymmetrical shield volcano are formed by thick pyroclastic-flow deposits. The 8 x 14 km caldera is widely breached on the east, where its floor is flooded by Blanche Bay and was formed about 1,400 years ago. An earlier caldera-forming eruption about 7,100 years ago is thought to have originated from Tavui caldera, offshore to the north. Three small stratovolcanoes lie outside the N and NE caldera rims. Post-caldera eruptions built basaltic-to-dacitic pyroclastic cones on the caldera floor near the NE and W caldera walls. Several of these, including Vulcan cone, which was formed during a large eruption in 1878, have produced major explosive activity during historical time. A powerful explosive eruption in 1994 occurred simultaneously from Vulcan and Tavurvur volcanoes and forced the temporary abandonment of Rabaul city.
Information Contacts: C. McKee, H. Patia, and P. de Saint-Ours, RVO.
Ruapehu (New Zealand) — January 1989 Cite this Report
Ruapehu
New Zealand
39.28°S, 175.57°E; summit elev. 2797 m
All times are local (unless otherwise noted)
December seismicity reviewed; lake temperature rises
J.H. Latter reports that the [8 December] eruption was preceded by nearly continuous [weak, high-frequency (3-4 Hz)] volcanic tremor that began gradually on 2 December. At 0806 on the morning of the eruption, high-frequency tectonic earthquakes began [in the roof- and wall-rocks surrounding the source of volcanic earthquakes below Crater Lake]. Volcanic earthquake sequences were recorded 0844-0850 and 0903-0911 (before the eruption) and at 1010 (1-2 minutes after the eruption). Events of the main sequence at 1010 were initially relatively deep, but migrated upwards in < 10 seconds to within a short distance of the surface, just N of the lake. Tremor was strongest after the eruption from 1100 to 1500 and continued until 16 December. After about 18 December, seismicity gradually decreased to background levels. However, at about noon on 10 January, a series of sporadic, powerful, tremor episodes began, suggesting renewed gas movement.
Field observations 16 December showed little change in lake temperature or chemistry (Mg and Cl contents) since the eruption; however, effervescing rapids at the outflow area suggested a relatively high CO2 content. Slight convection in the lake on the morning of the 16th had increased to a slow continuous upwelling from the central vent by afternoon. The lake temperature was 14°C.
On 11 January, the N vent area was convecting with unusual strength, and six upwelling cells produced yellow sulfur slicks. At about 1400, strong convection began over the central vent. Lake temperature had increased to 27°C. Mg/Cl had increased by 0.007 since the 8 December eruption. This increase suggested that deeper, hotter fluids had been discharged into the lake, or that upper-level vent rocks had been exposed to more reactive fluids. Deformation remained low. On 13 January at 1230, ski lift personnel saw steam rising above the volcano. Geologists noted that on eight occasions since 1980, small phreatic/hydrothermal eruptions have followed within 3-7 weeks of episodes of rapid lake heating (at 15-20°C/month). The most recent occurred July-August 1987 and March-April 1988.
Geologic Background. Ruapehu, one of New Zealand's most active volcanoes, is a complex stratovolcano constructed during at least four cone-building episodes dating back to about 200,000 years ago. The dominantly andesitic 110 km3 volcanic massif is elongated in a NNE-SSW direction and surrounded by another 100 km3 ring plain of volcaniclastic debris, including the NW-flank Murimoto debris-avalanche deposit. A series of subplinian eruptions took place between about 22,600 and 10,000 years ago, but pyroclastic flows have been infrequent. The broad summait area and flank contain at least six vents active during the Holocene. Frequent mild-to-moderate explosive eruptions have been recorded from the Te Wai a-Moe (Crater Lake) vent, and tephra characteristics suggest that the crater lake may have formed as recently as 3,000 years ago. Lahars resulting from phreatic eruptions at the summit crater lake are a hazard to a ski area on the upper flanks and lower river valleys.
Information Contacts: J. Latter, DSIR Geophysics, Wellington; B. Christenson and S. Sherburn, DSIR Wairakei; P. Otway, NZGS Wairakei.
Nevado del Ruiz (Colombia) — January 1989 Cite this Report
Nevado del Ruiz
Colombia
4.892°N, 75.324°W; summit elev. 5279 m
All times are local (unless otherwise noted)
Seismic energy and number of event increase
During January, total seismic energy release increased (figure 24a), as did the number of low- and high-frequency events (figure 24b). Most of the high-frequency seismicity was centered in an elongate NW-SE zone between Arenas Crater and Nevado del Cisne (figure 25). Focal depths generally ranged from 0.5 to 4.5 km. Swarms of long-period events occurred on the 17th and 29th, but their energy release was relatively low. Brief increases in the intensity of shallow tremor were usually associated with small ash emissions. A different type of tremor occurred 2-3 January; with a monochromatic signal, a dominant period of 0.35-0.45 seconds, and low energy. During the month, deformation did not exceed 10 µrad except at Molinas station (4 km NW of Arenas crater), which was affected by rainfall.
Geologic Background. Nevado del Ruiz is a broad, glacier-covered volcano in central Colombia that covers more than 200 km2. Three major edifices, composed of andesitic and dacitic lavas and andesitic pyroclastics, have been constructed since the beginning of the Pleistocene. The modern cone consists of a broad cluster of lava domes built within the caldera of an older edifice. The 1-km-wide, 240-m-deep Arenas crater occupies the summit. The prominent La Olleta pyroclastic cone located on the SW flank may also have been active in historical time. Steep headwalls of massive landslides cut the flanks. Melting of its summit icecap during historical eruptions, which date back to the 16th century, has resulted in devastating lahars, including one in 1985 that was South America's deadliest eruption.
Information Contacts: C. Carvajal and F. Muñoz, INGEOMINAS, Manizales.
Tokachidake (Japan) — January 1989 Cite this Report
Tokachidake
Japan
43.418°N, 142.686°E; summit elev. 2077 m
All times are local (unless otherwise noted)
Continued explosions (and partial evacuation)
By 8 February, 20 eruptive episodes had occurred from crater 62-2 (figure 3). During January, crater 62-2 emitted steam with occasional small amounts of gray ash. Red glow from the crater was seen almost every night from JMA's Tokachi-dake Volcano Observatory. White plumes continuously rose a few tens of meters from craters 62-0 and 62-1. Red glow in Taisho Crater was often seen 8-14 January. Residents of the Shirogane area (6 km NW) have remained evacuated since the 24-25 December eruption.
Seismicity was at a high level during the second half of January. A seismometer (4.5 km NNW of the volcano) registered 126 volcanic earthquakes during the month, an increase from 104 in December. Volcanic tremor episodes with amplitudes of about 0.1 µm were intermittently recorded by the same seismometer. An earthquake swarm, centered ~25 km E of the volcano, began on 14 January. Some of the events were felt at the observatory. The strongest had an intensity of III on 14 January.
The following is a summary of eruptive activity during the report period:
16 January at 1855: the eruption was accompanied by an earthquake felt at Intensity I at the Observatory. Ash fell as far E as Nukabira, 45 km away. Cloudy weather prevented plume observation. A field survey on 18 January revealed that a pyroclastic flow had advanced 1 km down the NW flank, along the same route as the mudflow caused by the 24-25 December eruption.
20 January, 0322: The eruption was accompanied by a weak explosion sound and incandescent column. Low-frequency volcanic tremor began 2 minutes before the eruption on the Hokkaido Univ seismometer at Hinangoya, 1 km ENE of the 1962 craters. Ash fell 30 km E of the volcano. A 900-m-high, grayish-white plume was seen from the Observatory at 0700.
[An explosion on 22 January is listed in 14:2].
24 January, 1224: The highest plume of the month reached 1,000 m above the crater.
28 January, 0518, 0611, and 0700: three explosions were accompanied by air shocks. Explosion sounds were heard at Shirogane hot spring, 6 km from the crater. Cloudy weather prevented plume observation. Slight ashfall was observed as far as 80 km SE of the volcano.
1 February, 1818: Low-frequency earthquakes were recorded at Hinangoya at 1700, preceding the eruption. Ash fell 70 km E.
4 February, 0038: Ash fell 100 km from the volcano.
[See 14:2 for explosions 6-7 February].
8 February, 0402: An eruption was accompanied by an explosion sound and incandescent column. A small pyroclastic flow descended from the crater.
Geologic Background. Tokachidake volcano consists of a group of dominantly andesitic stratovolcanoes and lava domes arranged on a NE-SW line above a plateau of welded Pleistocene tuffs in central Hokkaido. Numerous explosion craters and cinder cones are located on the upper flanks of the small stratovolcanoes, with the youngest Holocene centers located at the NW end of the chain. Frequent historical eruptions, consisting mostly of mild-to-moderate phreatic explosions, have been recorded since the mid-19th century. Two larger eruptions occurred in 1926 and 1962. Partial cone collapse of the western flank during the 1926 eruption produced a disastrous debris avalanche and mudflow.
Information Contacts: JMA.
Ulawun (Papua New Guinea) — January 1989 Cite this Report
Ulawun
Papua New Guinea
5.05°S, 151.33°E; summit elev. 2334 m
All times are local (unless otherwise noted)
Eruption ejects ash to 2 km
"A mild eruption took place between 1 and 10 January. Frequent ejections of dark grey ash were observed rising as much as 2 km above the summit. These produced light ashfalls on the SE side of the volcano. Bright red glow from the summit crater was observed during the ejections. During the eruption, visible activity often coincided with regular periods of low-amplitude, high-frequency tremor. Included in the tremor were discrete B-type events. This pattern of seismicity had begun on 26 October 1988. There was a slow, irregular increase in amplitude through November and early December, but a significant increase took place in mid-late December. Seismicity declined during the eruption."
"Dry tilt and EDM measurements were carried out on 2 and 12 January. Compared with the previous tilt measurements in June 1988 (SEAN 13:06), inflationary tilts of as much as 19 µrad had accumulated by 2 January. Further inflation of up to 16 µrad took place between 2 and 12 January. These tilt changes were recorded at stations within a few km of the summit. EDM measurements were inconsistent. From 11 January, mainly white vapour emissions from the summit crater were observed. On some days, emissions appeared to contain ash. The pattern of regular periods of seismic tremor disappeared and was replaced by occasional small B-type events.
"There are some indications that the eruption was phreatomagmatic. Microscopic examination of ash samples indicates that the ash is very fine grained with a large proportion of accessory material. However, some fresh dark glass is also present. Secondly, the significant increase in seismicity in mid-late December coincided with a period of heavy rainfall that may have triggered the eruption. On the basis of tilt measurements, it is speculated that a magmatic eruption could still take place, although it is not considered to be imminent."
Geologic Background. The symmetrical basaltic-to-andesitic Ulawun stratovolcano is the highest volcano of the Bismarck arc, and one of Papua New Guinea's most frequently active. The volcano, also known as the Father, rises above the N coast of the island of New Britain across a low saddle NE of Bamus volcano, the South Son. The upper 1,000 m is unvegetated. A prominent E-W escarpment on the south may be the result of large-scale slumping. Satellitic cones occupy the NW and E flanks. A steep-walled valley cuts the NW side, and a flank lava-flow complex lies to the south of this valley. Historical eruptions date back to the beginning of the 18th century. Twentieth-century eruptions were mildly explosive until 1967, but after 1970 several larger eruptions produced lava flows and basaltic pyroclastic flows, greatly modifying the summit crater.
Information Contacts: C. McKee, H. Patia, and P. de Saint-Ours, RVO.
Vulcano
Italy
38.404°N, 14.962°E; summit elev. 500 m
All times are local (unless otherwise noted)
CO2 in soil increases
CO2 concentrations in soil near Vulcano's summit crater increased substantially between measurements in October 1987 and November 1988 (table 1), correlated with increased fumarolic activity. Changes in concentrations and flow rates of CO2 gas have been correlated to volcanic activity by Elskens, Tazieff, and Tonai (1969).
Table 1. CO2 soil concentrations near Vulcano's summit crater, in mole %. Equipment, sites, and the person making the measurements were all identical for both data sets.
| Location |
October 1987 |
November 1988 |
| Flat crater bottom |
0.1 |
60-80 |
| N trail from bottom of rim |
0.1-0.5 |
10-40 |
| W and N rims |
0.1 |
7-22 |
| S and E rims |
1.6 |
4-30 |
Reference. Elskens, I., Tazieff, H., and Tonai, F., 1969, investigations nouvelles sur les gaz volcaniques: BV, v. 32, no. 3, p. 523-575.
Geologic Background. The word volcano is derived from Vulcano stratovolcano in Italy's Aeolian Islands. Vulcano was constructed during six stages over the past 136,000 years. Two overlapping calderas, the 2.5-km-wide Caldera del Piano on the SE and the 4-km-wide Caldera della Fossa on the NW, were formed at about 100,000 and 24,000-15,000 years ago, respectively, and volcanism has migrated north over time. La Fossa cone, active throughout the Holocene and the location of most historical eruptions, occupies the 3-km-wide Caldera della Fossa at the NW end of the elongated 3 x 7 km island. The Vulcanello lava platform is a low, roughly circular peninsula on the northern tip of Vulcano that was formed as an island beginning more than 2,000 years ago and was connected to the main island in about 1550 CE. Vulcanello is capped by three pyroclastic cones and was active intermittently until the 16th century. Explosive activity took place at the Fossa cone from 1898 to 1900.
Information Contacts: R.X. Faivre Pierret, DPT/SPIN/LESI CEA CEN, Grenoble, France; F. Le Guern, CNRS, CFR, CEN, Saclay, France.
Whakaari/White Island (New Zealand) — January 1989 Cite this Report
Whakaari/White Island
New Zealand
37.52°S, 177.18°E; summit elev. 294 m
All times are local (unless otherwise noted)
Vulcanian explosions; new crater
No unusual activity had been reported in the month following 2 December fieldwork. On 4 January, tourists found a few small lava bombs near the 1978 Crater rim. The previously active (Hitchhiker) vent emitted a pink plume containing fine ash. Between the 4th and the next visit at about 0800 on 12 January, a new pit vent had formed S of Congress Crater in 1978 Crater (figure 10). Both the new vent (named R.F.) and Hitchhiker vent emitted white steam plumes. At 1000, an incandescent jet was noted in the Blue Duck fumarole area, 200 m away.
When geologists visited the crater on 14 January, the new vent was emitting voluminous clouds of light brown-red ash and appeared to be ~40 m in diameter. At 1039, a discrete eruption ejected a convoluting ash column to 1,500 m. Ash fell E into the sea. There was no emission from Hitchhiker vent. Light red-brown ash coated the E end of the island and reached 17 cm thickness at the 1978 Crater rim. Fumarole temperatures were similar to those measured 2 December. A vent (N of Fumarole 6) that had enlarged to 2 m in diameter and was surrounded by small blocks, may have been the source of the small eruption seen 12 January. Several similar eruptions were observed from Whakatane (50 km SSW) 14 and 15 January. The 12-14 January eruptions were among the largest since 1980.
Only limited seismic data were available after 2 December. Early December seismic records were dominated by weak, continuous, medium- to high-frequency volcanic tremor and small A-type volcanic events. After 4 January, microearthquake activity declined to a maximum of ~2,500/day, B-type events were rare, and A-types increased. Explosion earthquakes were registered 4 December and 7 January.
Geologic Background. The uninhabited Whakaari/White Island is the 2 x 2.4 km emergent summit of a 16 x 18 km submarine volcano in the Bay of Plenty about 50 km offshore of North Island. The island consists of two overlapping andesitic-to-dacitic stratovolcanoes. The SE side of the crater is open at sea level, with the recent activity centered about 1 km from the shore close to the rear crater wall. Volckner Rocks, sea stacks that are remnants of a lava dome, lie 5 km NW. Descriptions of volcanism since 1826 have included intermittent moderate phreatic, phreatomagmatic, and Strombolian eruptions; activity there also forms a prominent part of Maori legends. The formation of many new vents during the 19th and 20th centuries caused rapid changes in crater floor topography. Collapse of the crater wall in 1914 produced a debris avalanche that buried buildings and workers at a sulfur-mining project. Explosive activity in December 2019 took place while tourists were present, resulting in many fatalities. The official government name Whakaari/White Island is a combination of the full Maori name of Te Puia o Whakaari ("The Dramatic Volcano") and White Island (referencing the constant steam plume) given by Captain James Cook in 1769.
Information Contacts: B. Scott and I. Nairn, NZGS Rotorua.