Recently Published Bulletin Reports
Kadovar (Papua New Guinea) An ash plume and weak thermal anomaly during May 2023
San Miguel (El Salvador) Small gas-and-ash explosions during March and May 2023
Ebeko (Russia) Continued explosions, ash plumes, and ashfall during October 2022-May 2023
Home Reef (Tonga) Discolored plumes continued during November 2022-April 2023
Semisopochnoi (United States) Occasional explosions, ash deposits, and gas-and-steam plumes during December 2022-May 2023
Ambae (Vanuatu) New lava flow, ash plumes, and sulfur dioxide plumes during February-May 2023
Ibu (Indonesia) Daily ash explosions continue, along with thermal anomalies in the crater, October 2022-May 2023
Dukono (Indonesia) Continuing ash emissions, SO2 plumes, and thermal signals during October 2022-May 2023
Sabancaya (Peru) Explosions, gas-and-ash plumes, and thermal activity persist during November 2022-April 2023
Sheveluch (Russia) Significant explosions destroyed part of the lava-dome complex during April 2023
Bezymianny (Russia) Explosions, ash plumes, lava flows, and avalanches during November 2022-April 2023
Chikurachki (Russia) New explosive eruption during late January-early February 2023
Kadovar (Papua New Guinea) — June 2023  Cite this Report
Kadovar
Papua New Guinea
3.608°S, 144.588°E; summit elev. 365 m
All times are local (unless otherwise noted)
An ash plume and weak thermal anomaly during May 2023
Kadovar is a 2-km-wide island that is the emergent summit of a Bismarck Sea stratovolcano. It lies off the coast of New Guinea, about 25 km N of the mouth of the Sepik River. Prior to an eruption that began in 2018, a lava dome formed the high point of the volcano, filling an arcuate landslide scarp open to the S. Submarine debris-avalanche deposits occur to the S of the island. The current eruption began in January 2018 and has comprised lava effusion from vents at the summit and at the E coast; more recent activity has consisted of ash plumes, weak thermal activity, and gas-and-steam plumes (BGVN 48:02). This report covers activity during February through May 2023 using information from the Darwin Volcanic Ash Advisory Center (VAAC) and satellite data.
Activity during the reporting period was relatively low and mainly consisted of white gas-and-steam plumes that were visible in natural color satellite images on clear weather days (figure 67). According to a Darwin VAAC report, at 2040 on 6 May an ash plume rose to 4.6 km altitude and drifted W; by 2300 the plume had dissipated. MODIS satellite instruments using the MODVOLC thermal algorithm detected a single thermal hotspot on the SE side of the island on 7 May. Weak thermal activity was also detected in a satellite image on the E side of the island on 14 May, accompanied by a white gas-and-steam plume that drifted SE (figure 68).
Geologic Background. The 2-km-wide island of Kadovar is the emergent summit of a Bismarck Sea stratovolcano of Holocene age. It is part of the Schouten Islands, and lies off the coast of New Guinea, about 25 km N of the mouth of the Sepik River. Prior to an eruption that began in 2018, a lava dome formed the high point of the andesitic volcano, filling an arcuate landslide scarp open to the south; submarine debris-avalanche deposits occur in that direction. Thick lava flows with columnar jointing forms low cliffs along the coast. The youthful island lacks fringing or offshore reefs. A period of heightened thermal phenomena took place in 1976. An eruption began in January 2018 that included lava effusion from vents at the summit and at the E coast.
Information Contacts: Darwin Volcanic Ash Advisory Centre (VAAC), Bureau of Meteorology, Northern Territory Regional Office, PO Box 40050, Casuarina, NT 0811, Australia (URL: http://www.bom.gov.au/info/vaac/); Hawai'i Institute of Geophysics and Planetology (HIGP) - MODVOLC Thermal Alerts System, School of Ocean and Earth Science and Technology (SOEST), Univ. of Hawai'i, 2525 Correa Road, Honolulu, HI 96822, USA (URL: http://modis.higp.hawaii.edu/); Copernicus Browser, Copernicus Data Space Ecosystem, European Space Agency (URL: https://dataspace.copernicus.eu/browser/).
San Miguel (El Salvador) — June 2023 Cite this Report
San Miguel
El Salvador
13.434°N, 88.269°W; summit elev. 2130 m
All times are local (unless otherwise noted)
Small gas-and-ash explosions during March and May 2023
San Miguel in El Salvador is a broad, deep crater complex that has been frequently modified by eruptions recorded since the early 16th century and consists of the summit known locally as Chaparrastique. Flank eruptions have produced lava flows that extended to the N, NE, and SE during the 17-19th centuries. The most recent activity has consisted of minor ash eruptions from the summit crater. The current eruption period began in November 2022 and has been characterized by frequent phreatic explosions, gas-and-ash emissions, and sulfur dioxide plumes (BGVN 47:12). This report describes small gas-and-ash explosions during December 2022 through May 2023 based on special reports from the Ministero de Medio Ambiente y Recursos Naturales (MARN).
Activity has been relatively low since the last recorded explosions on 29 November 2022. Seismicity recorded by the San Miguel Volcano Station (VSM) located on the N flank at 1.7 km elevation had decreased by 7 December. Sulfur dioxide gas measurements taken with DOAS (Differential Optical Absorption Spectroscopy) mobile equipment were below typical previously recorded values: 300 tons per day (t/d). During December, small explosions were recorded by the seismic network and manifested as gas-and-steam emissions.
Gas-and-ash explosions in the crater occurred during January 2023, which were recorded by the seismic network. Sulfur dioxide values remained low, between 300-400 t/d through 10 March. At 0817 on 14 January a gas-and-ash emission was visible in webcam images, rising just above the crater rim. Some mornings during February, small gas-and-steam plumes were visible in the crater. On 7 March at 2252 MARN noted an increase in degassing from the central crater; gas emissions were constantly observed through the early morning hours on 8 March. During the early morning of 8 March through the afternoon on 9 March, 12 emissions were registered, some accompanied by ash. The last gas-and-ash emission was recorded at 1210 on 9 March; very fine ashfall was reported in El Tránsito (10 km S), La Morita (6 km W), and La Piedrita (3 km W). The smell of sulfur was reported in Piedra Azul (5 km SW). On 16 March MARN reported that gas-and-steam emissions decreased.
Low degassing and very low seismicity were reported during April; no explosions have been detected between 9 March and 27 May. The sulfur dioxide emissions remained between 350-400 t/d; during 13-20 April sulfur dioxide values fluctuated between 30-300 t/d. Activity remained low through most of May; on 23 May seismicity increased. An explosion was detected at 1647 on 27 May generated a gas-and-ash plume that rose 700 m high (figure 32); a decrease in seismicity and gas emissions followed. The DOAS station installed on the W flank recorded sulfur dioxide values that reached 400 t/d on 27 May; subsequent measurements showed a decrease to 268 t/d on 28 May and 100 t/d on 29 May.
Geologic Background. The symmetrical cone of San Miguel, one of the most active volcanoes in El Salvador, rises from near sea level to form one of the country's most prominent landmarks. A broad, deep, crater complex that has been frequently modified by eruptions recorded since the early 16th century caps the truncated unvegetated summit, also known locally as Chaparrastique. Flanks eruptions of the basaltic-andesitic volcano have produced many lava flows, including several during the 17th-19th centuries that extended to the N, NE, and SE. The SE-flank flows are the largest and form broad, sparsely vegetated lava fields crossed by highways and a railroad skirting the base of the volcano. Flank vent locations have migrated higher on the edifice during historical time, and the most recent activity has consisted of minor ash eruptions from the summit crater.
Information Contacts: Ministero de Medio Ambiente y Recursos Naturales (MARN), Km. 5½ Carretera a Nueva San Salvador, Avenida las Mercedes, San Salvador, El Salvador (URL: http://www.snet.gob.sv/ver/vulcanologia).
Ebeko
Russia
50.686°N, 156.014°E; summit elev. 1103 m
All times are local (unless otherwise noted)
Continued explosions, ash plumes, and ashfall during October 2022-May 2023
Ebeko, located on the N end of Paramushir Island in the Kuril Islands, consists of three summit craters along a SSW-NNE line at the northern end of a complex of five volcanic cones. Eruptions date back to the late 18th century and have been characterized as small-to-moderate explosions from the summit crater, accompanied by intense fumarolic activity. The current eruption period began in June 2022 and has recently consisted of frequent explosions, ash plumes, and thermal activity (BGVN 47:10). This report covers similar activity during October 2022 through May 2023, based on information from the Kamchatka Volcanic Eruptions Response Team (KVERT) and satellite data.
Activity during October consisted of explosive activity, ash plumes, and occasional thermal anomalies. Visual data by volcanologists from Severo-Kurilsk showed explosions producing ash clouds up to 2.1-3 km altitude which drifted E, N, NE, and SE during 1-8, 10, 16, and 18 October. KVERT issued several Volcano Observatory Notices for Aviation (VONA) on 7, 13-15, and 27 October 2022, stating that explosions generated ash plumes that rose to 2.3-4 km altitude and drifted 5 km E, NE, and SE. Ashfall was reported in Severo-Kurilsk (Paramushir Island, about 7 km E) on 7 and 13 October. Satellite data showed a thermal anomaly over the volcano on 15-16 October. Visual data showed ash plumes rising to 2.5-3.6 km altitude on 22, 25-29, and 31 October and moving NE due to constant explosions.
Similar activity continued during November, with explosions, ash plumes, and ashfall occurring. KVERT issued VONAs on 1-2, 4, 6-7, 9, 13, and 16 November that reported explosions and resulting ash plumes that rose to 1.7-3.6 km altitude and drifted 3-5 km SE, ESE, E, and NE. On 1 November ash plumes extended as far as 110 km SE. On 5, 8, 12, and 24-25 November explosions and ash plumes rose to 2-3.1 km altitude and drifted N and E. Ashfall was observed in Severo-Kurilsk on 7 and 16 November. A thermal anomaly was visible during 1-4, 16, and 20 November. Explosions during 26 November rose as high as 2.7 km altitude and drifted NE (figure 45).
Explosions and ash plumes continued to occur in December. During 1-2 and 4 December volcanologists from Severo-Kurilsk observed explosions that sent ash to 1.9-2.5 km altitude and drifted NE and SE (figure 46). VONAs were issued on 5, 9, and 16 December reporting that explosions generated ash plumes rising to 1.9 km, 2.6 km, and 2.4 km altitude and drifted 5 km SE, E, and NE, respectively. A thermal anomaly was visible in satellite imagery on 16 December. On 18 and 27-28 December explosions produced ash plumes that rose to 2.5 km altitude and drifted NE and SE. On 31 December an ash plume rose to 2 km altitude and drifted NE.
Explosions continued during January 2023, based on visual observations by volcanologists from Severo-Kurilsk. During 1-7 January explosions generated ash plumes that rose to 4 km altitude and drifted NE, E, W, and SE. According to VONAs issued by KVERT on 2, 4, 10, and 23 January, explosions produced ash plumes that rose to 2-4 km altitude and drifted 5 km N, NE, E, and ENE; the ash plume that rose to 4 km altitude occurred on 10 January (figure 47). Satellite data showed a thermal anomaly during 3-4, 10, 13, 16, 21, 22, and 31 January. KVERT reported that an ash cloud on 4 January moved 12 km NE. On 6 and 9-11 January explosions sent ash plumes to 4.5 km altitude and drifted W and ESE. On 13 January an ash plume rose to 3 km altitude and drifted SE. During 20-24 January ash plumes from explosions rose to 3.7 km altitude and drifted SE, N, and NE. On 21 January the ash plume drifted as far as 40 km NE. During 28-29 and 31 January and 1 February ash plumes rose to 4 km altitude and drifted NE.
During February, explosions, ash plumes, and ashfall were reported. During 1, 4-5 and 7-8 February explosions generated ash plumes that rose to 4.5 km altitude and drifted E and NE; ashfall was observed on 5 and 8 February. On 6 February an explosion produced an ash plume that rose to 3 km altitude and drifted 7 km E, causing ashfall in Severo-Kurilsk. A thermal anomaly was visible in satellite data on 8, 9, 13, and 21 February. Explosions on 9 and 12-13 February produced ash plumes that rose to 4 km altitude and drifted E and NE; the ash cloud on 12 February extended as far as 45 km E. On 22 February explosions sent ash to 3 km altitude that drifted E. During 24 and 26-27 February ash plumes rose to 4 km altitude and drifted E. On 28 February an explosion sent ash to 2.5-3 km altitude and drifted 5 km E; ashfall was observed in Severo-Kurilsk.
Activity continued during March; visual observations showed that explosions generated ash plumes that rose to 3.6 km altitude on 3, 5-7, and 9-12 March and drifted E, NE, and NW. Thermal anomalies were visible on 10, 13, and 29-30 March in satellite imagery. On 18, 21-23, 26, and 29-30 March explosions produced ash plumes that rose to 2.8 km altitude and drifted NE and E; the ash plumes during 22-23 March extended up to 76 km E. A VONA issued on 21 March reported an explosion that produced an ash plume that rose to 2.8 km altitude and drifted 5 km E. Another VONA issued on 23 March reported that satellite data showed an ash plume rising to 3 km altitude and drifted 14 km E.
Explosions during April continued to generate ash plumes. On 1 and 4 April an ash plume rose to 2.8-3.5 km altitude and drifted SE and NE. A thermal anomaly was visible in satellite imagery during 1-6 April. Satellite data showed ash plumes and clouds rising to 2-3 km altitude and drifting up to 12 km SW and E on 3 and 6 April (figure 48). KVERT issued VONAs on 3, 5, 14, 16 April describing explosions that produced ash plumes rising to 3 km, 3.5 km, 3.5 km, and 3 km altitude and drifting 5 km S, 5 km NE and SE, 72 km NNE, and 5 km NE, respectively. According to satellite data, the resulting ash cloud from the explosion on 14 April was 25 x 7 km in size and drifted 72-104 km NNE during 14-15 April. According to visual data by volcanologists from Severo-Kurilsk explosions sent ash up to 3.5 km altitude that drifted NE and E during 15-16, 22, 25-26, and 29 April.
The explosive eruption continued during May. Explosions during 3-4, 6-7, and 9-10 May generated ash plumes that rose to 4 km altitude and drifted SW and E. Satellite data showed a thermal anomaly on 3, 9, 13-14, and 24 May. During 12-16, 23-25, and 27-28 May ash plumes rose to 3.5 km altitude and drifted in different directions due to explosions. Two VONA notices were issued on 16 and 25 May, describing explosions that generated ash plumes rising to 3 km and 3.5 km altitude, respectively and extending 5 km E. The ash cloud on 25 May drifted 75 km SE.
Thermal activity in the summit crater, occasionally accompanied by ash plumes and ash deposits on the SE and E flanks due to frequent explosions, were visible in infrared and true color satellite images (figure 49).
Geologic Background. The flat-topped summit of the central cone of Ebeko volcano, one of the most active in the Kuril Islands, occupies the northern end of Paramushir Island. Three summit craters located along a SSW-NNE line form Ebeko volcano proper, at the northern end of a complex of five volcanic cones. Blocky lava flows extend west from Ebeko and SE from the neighboring Nezametnyi cone. The eastern part of the southern crater contains strong solfataras and a large boiling spring. The central crater is filled by a lake about 20 m deep whose shores are lined with steaming solfataras; the northern crater lies across a narrow, low barrier from the central crater and contains a small, cold crescentic lake. Historical activity, recorded since the late-18th century, has been restricted to small-to-moderate explosive eruptions from the summit craters. Intense fumarolic activity occurs in the summit craters, on the outer flanks of the cone, and in lateral explosion craters.
Information Contacts: Kamchatka Volcanic Eruptions Response Team (KVERT), Far Eastern Branch, Russian Academy of Sciences, 9 Piip Blvd., Petropavlovsk-Kamchatsky, 683006, Russia (URL: http://www.kscnet.ru/ivs/kvert/); MIROVA (Middle InfraRed Observation of Volcanic Activity), a collaborative project between the Universities of Turin and Florence (Italy) supported by the Centre for Volcanic Risk of the Italian Civil Protection Department (URL: http://www.mirovaweb.it/); Copernicus Browser, Copernicus Data Space Ecosystem, European Space Agency (URL: https://dataspace.copernicus.eu/browser/).
Home Reef
Tonga
18.992°S, 174.775°W; summit elev. -10 m
All times are local (unless otherwise noted)
Discolored plumes continued during November 2022-April 2023
Home Reef is a submarine volcano located in the central Tonga islands between Lateiki (Metis Shoal) and Late Island. The first recorded eruption occurred in the mid-19th century, when an ephemeral island formed. An eruption in 1984 produced a 12-km-high eruption plume, a large volume of floating pumice, and an ephemeral island 500 x 1,500 m wide, with cliffs 30-50 m high that enclosed a water-filled crater. Another island-forming eruption in 2006 produced widespread pumice rafts that drifted as far as Australia; by 2008 the island had eroded below sea level. The previous eruption occurred during October 2022 and was characterized by a new island-forming eruption, lava effusion, ash plumes, discolored water, and gas-and-steam plumes (BGVN 47:11). This report covers discolored water plumes during November 2022 through April 2023 using satellite data.
Discolored plumes continued during the reporting period and were observed in true color satellite images on clear weather days. Satellite images show light green-yellow discolored water extending W on 8 and 28 November 2022 (figure 31), and SW on 18 November. Light green-yellow plumes extended W on 3 December, S on 13 December, SW on 18 December, and W and S on 23 December (figure 31). On 12 January 2023 discolored green-yellow plumes extended to the NE, E, SE, and N. The plume moved SE on 17 January and NW on 22 January. Faint discolored water in February was visible moving NE on 1 February. A discolored plume extended NW on 8 and 28 March and NW on 13 March (figure 31). During April, clear weather showed green-blue discolored plumes moving S on 2 April, W on 7 April, and NE and S on 12 April. A strong green-yellow discolored plume extended E and NE on 22 April for several kilometers (figure 31).
Geologic Background. Home Reef, a submarine volcano midway between Metis Shoal and Late Island in the central Tonga islands, was first reported active in the mid-19th century, when an ephemeral island formed. An eruption in 1984 produced a 12-km-high eruption plume, large amounts of floating pumice, and an ephemeral 500 x 1,500 m island, with cliffs 30-50 m high that enclosed a water-filled crater. In 2006 an island-forming eruption produced widespread dacitic pumice rafts that drifted as far as Australia. Another island was built during a September-October 2022 eruption.
Information Contacts: Copernicus Browser, Copernicus Data Space Ecosystem, European Space Agency (URL: https://dataspace.copernicus.eu/browser/).
Semisopochnoi (United States) — June 2023 Cite this Report
Semisopochnoi
United States
51.93°N, 179.58°E; summit elev. 1221 m
All times are local (unless otherwise noted)
Occasional explosions, ash deposits, and gas-and-steam plumes during December 2022-May 2023
Semisopochnoi is located in the western Aleutians, is 20-km-wide at sea level, and contains an 8-km-wide caldera. The three-peaked Mount Young (formerly Cerberus) was constructed within the caldera during the Holocene. Each of these peaks contains a summit crater; the lava flows on the N flank appear younger than those on the S side. The current eruption period began in early February 2021 and has more recently consisted of intermittent explosions and ash emissions (BGVN 47:12). This report updates activity during December 2022 through May 2023 using daily, weekly, and special reports from the Alaska Volcano Observatory (AVO). AVO monitors the volcano using local seismic and infrasound sensors, satellite data, web cameras, and remote infrasound and lightning networks.
Activity during most of December 2022 was relatively quiet; according to AVO no eruptive or explosive activity was observed since 7 November 2022. Intermittent tremor and occasional small earthquakes were observed in geophysical data. Continuous gas-and-steam emissions were observed from the N crater of Mount Young in webcam images on clear weather days (figure 25). On 24 December, there was a slight increase in earthquake activity and several small possible explosion signals were detected in infrasound data. Eruptive activity resumed on 27 December at the N crater of Mount Young; AVO issued a Volcano Activity Notice (VAN) that reported minor ash deposits on the flanks of Mount Young that extended as far as 1 km from the vent, according to webcam images taken during 27-28 December (figure 26). No ash plumes were observed in webcam or satellite imagery, but a persistent gas-and-steam plume that might have contained some ash rose to 1.5 km altitude. As a result, AVO raised the Aviation Color Code (ACC) to Orange (the second highest level on a four-color scale) and the Volcano Alert Level (VAL) to Watch (the second highest level on a four-level scale). Possible explosions were detected during 21 December 2022 through 1 January 2023 and seismic tremor was recorded during 30-31 December.
During January 2023 eruptive activity continued at the active N crater of Mount Young. Minor ash deposits were observed on the flanks, extending about 2 km SSW, based on webcam images from 1 and 3 January. A possible explosion occurred during 1-2 January based on elevated seismicity recorded on local seismometers and an infrasound signal recorded minutes later by an array at Adak. Though no ash plumes were observed in webcam or satellite imagery, a persistent gas-and-steam plume rose to 1.5 km altitude that might have carried minor traces of ash. Ash deposits were accompanied by periods of elevated seismicity and infrasound signals from the local geophysical network, which AVO reported were likely due to weak explosive activity. Low-level explosive activity was also detected during 2-3 January, with minor gas-and-steam emissions and a new ash deposit that was visible in webcam images. Low-level explosive activity was detected in geophysical data during 4-5 January, with elevated seismicity and infrasound signals observed on local stations. Volcanic tremor was detected during 7-9 January and very weak explosive activity was detected in seismic and infrasound data on 9 January. Weak seismic and infrasound signals were recorded on 17 January, which indicated minor explosive activity, but no ash emissions were observed in clear webcam images; a gas-and-steam plume continued to rise to 1.5 km altitude. During 29-30 January, ash deposits near the summit were observed on fresh snow, according to webcam images.
The active N cone at Mount Young continued to produce a gas-and-steam plume during February, but no ash emissions or explosive events were detected. Seismicity remained elevated with faint tremor during early February. Gas-and-steam emissions from the N crater were observed in clear webcam images on 11-13 and 16 February; no explosive activity was detected in seismic, infrasound, or satellite data. Seismicity has also decreased, with no significant seismic tremor observed since 25 January. Therefore, the ACC was lowered to Yellow (the second lowest level on a four-color scale) and the VAL was lowered to Advisory (the second lowest level on a four-color scale) on 22 February.
Gas-and-steam emissions persisted during March from the N cone of Mount Young, based on clear webcam images. A few brief episodes of weak tremor were detected in seismic data, although seismicity decreased over the month. A gas-and-steam plume detected in satellite data extended 150 km on 18 March. Low-level ash emissions from the N cone at Mount Young were observed in several webcam images during 18-19 March, in addition to small explosions and volcanic tremor. The ACC was raised to Orange and the VAL increased to Watch on 19 March. A small explosion was detected in seismic and infrasound data on 21 March.
Low-level unrest continued during April, although cloudy weather often obscured views of the summit; periods of seismic tremor and local earthquakes were recorded. During 3-4 April a gas-and-steam plume was visible traveling more than 200 km overnight; no ash was evident in the plume, according to AVO. A gas-and-steam plume was observed during 4-6 April that extended 400 km but did not seem to contain ash. Small explosions were detected in seismic and infrasound data on 5 April. Occasional clear webcam images showed continuing gas-and-steam emissions rose from Mount Young, but no ash deposits were observed on the snow. On 19 April small explosions and tremor were detected in seismic and infrasound data. A period of seismic tremor was detected during 22-25 April, with possible weak explosions on 25 April. Ash deposits were visible near the crater rim, but it was unclear if these deposits were recent or due to older deposits.
Occasional small earthquakes were recorded during May, but there were no signs of explosive activity seen in geophysical data. Gas-and-steam emissions continued from the N crater of Mount Young, based on webcam images, and seismicity remained slightly elevated. A new, light ash deposit was visible during the morning of 5 May on fresh snow on the NW flank of Mount Young. During 10 May periods of volcanic tremor were observed. The ACC was lowered to Yellow and the VAL to Advisory on 17 May due to no additional evidence of activity.
Geologic Background. Semisopochnoi, the largest subaerial volcano of the western Aleutians, is 20 km wide at sea level and contains an 8-km-wide caldera. It formed as a result of collapse of a low-angle, dominantly basaltic volcano following the eruption of a large volume of dacitic pumice. The high point of the island is Anvil Peak, a double-peaked late-Pleistocene cone that forms much of the island's northern part. The three-peaked Mount Cerberus (renamed Mount Young in 2023) was constructed within the caldera during the Holocene. Each of the peaks contains a summit crater; lava flows on the N flank appear younger than those on the south side. Other post-caldera volcanoes include the symmetrical Sugarloaf Peak SSE of the caldera and Lakeshore Cone, a small cinder cone at the edge of Fenner Lake in the NE part of the caldera. Most documented eruptions have originated from Young, although Coats (1950) considered that both Sugarloaf and Lakeshore Cone could have been recently active.
Information Contacts: Alaska Volcano Observatory (AVO), a cooperative program of a) U.S. Geological Survey, 4200 University Drive, Anchorage, AK 99508-4667 USA (URL: https://avo.alaska.edu/), b) Geophysical Institute, University of Alaska, PO Box 757320, Fairbanks, AK 99775-7320, USA, and c) Alaska Division of Geological & Geophysical Surveys, 794 University Ave., Suite 200, Fairbanks, AK 99709, USA (URL: http://dggs.alaska.gov/).
Ambae
Vanuatu
15.389°S, 167.835°E; summit elev. 1496 m
All times are local (unless otherwise noted)
New lava flow, ash plumes, and sulfur dioxide plumes during February-May 2023
Ambae, also known as Aoba, is a large basaltic shield volcano in Vanuatu. A broad pyroclastic cone containing three crater lakes (Manaro Ngoru, Voui, and Manaro Lakua) is located at the summit within the youngest of at least two nested calderas. Periodic phreatic and pyroclastic explosions have been reported since the 16th century. A large eruption more than 400 years ago resulted in a volcanic cone within the summit crater that is now filled by Lake Voui; the similarly sized Lake Manaro fills the western third of the caldera. The previous eruption ended in August 2022 that was characterized by gas-and-steam and ash emissions and explosions of wet tephra (BGVN 47:10). This report covers a new eruption during February through May 2023 that consisted of a new lava flow, ash plumes, and sulfur dioxide emissions, using information from the Vanuatu Meteorology and Geo-Hazards Department (VMGD) and satellite data.
During the reporting period, the Alert Level remained at a 2 (on a scale of 0-5), which has been in place since December 2021. Activity during October 2022 through March 2023 remained relatively low and mostly consisted of gas-and-steam emissions in Lake Voui. VMGD reported that at 1300 on 15 November a satellite image captured a strong amount of sulfur dioxide rising above the volcano (figure 99), and that seismicity slightly increased. The southern and northern part of the island reported a strong sulfur dioxide smell and heard explosions. On 20 February 2023 a gas-and-ash plume rose 1.3 km above the summit and drifted SSW, according to a webcam image (figure 100). Gas-and-steam and possibly ash emissions continued on 23 February and volcanic earthquakes were recorded by the seismic network.
During April, volcanic earthquakes and gas-and-steam and ash emissions were reported from the cone in Lake Voui. VMGD reported that activity increased during 5-7 April; high gas-and-steam and ash plumes were visible, accompanied by nighttime incandescence. According to a Wellington VAAC report, a low-level ash plume rose as high as 2.5 km above the summit and drifted W and SW on 5 April, based on satellite imagery. Reports in Saratamata stated that a dark ash plume drifted to the WSW, but no loud explosion was heard. Webcam images from 2100 showed incandescence above the crater and reflected in the clouds. According to an aerial survey, field observations, and satellite data, water was no longer present in the lake. A lava flow was reported effusing from the vent and traveling N into the dry Lake Voui, which lasted three days. The next morning at 0745 on 6 April a gas-and-steam and ash plume rose 5.4 km above the summit and drifted ESE, based on information from VMGD (figure 101). The Wellington VAAC also reported that light ashfall was observed on the island. Intermittent gas-and-steam and ash emissions were visible on 7 April, some of which rose to an estimated 3 km above the summit and drifted E. Webcam images during 0107-0730 on 7 April showed continuing ash emissions. A gas-and-steam and ash plume rose 695 m above the summit crater at 0730 on 19 April and drifted ESE, based on a webcam image (figure 102).
According to visual and infrared satellite data, water was visible in Lake Voui as late as 24 March 2023 (figure 103). The vent in the caldera showed a gas-and-steam plume drifted SE. On 3 April thermal activity was first detected, accompanied by a gas-and-ash plume that drifted W (figure 103). The lava flow moved N within the dry lake and was shown cooling by 8 April. By 23 April much of the water in the lake had returned. Occasional sulfur dioxide plumes were detected by the TROPOMI instrument on the Sentinel-5P satellite that exceeded 2 Dobson Units (DU) and drifted in different directions (figure 104).
Geologic Background. The island of Ambae, also known as Aoba, is a massive 2,500 km3 basaltic shield that is the most voluminous volcano of the New Hebrides archipelago. A pronounced NE-SW-trending rift zone with numerous scoria cones gives the 16 x 38 km island an elongated form. A broad pyroclastic cone containing three crater lakes (Manaro Ngoru, Voui, and Manaro Lakua) is located at the summit within the youngest of at least two nested calderas, the largest of which is 6 km in diameter. That large central edifice is also called Manaro Voui or Lombenben volcano. Post-caldera explosive eruptions formed the summit craters about 360 years ago. A tuff cone was constructed within Lake Voui (or Vui) about 60 years later. The latest known flank eruption, about 300 years ago, destroyed the population of the Nduindui area near the western coast.
Information Contacts: Geo-Hazards Division, Vanuatu Meteorology and Geo-Hazards Department (VMGD), Ministry of Climate Change Adaptation, Meteorology, Geo-Hazards, Energy, Environment and Disaster Management, Private Mail Bag 9054, Lini Highway, Port Vila, Vanuatu (URL: http://www.vmgd.gov.vu/, https://www.facebook.com/VanuatuGeohazardsObservatory/); Wellington Volcanic Ash Advisory Centre (VAAC), Meteorological Service of New Zealand Ltd (MetService), PO Box 722, Wellington, New Zealand (URL: http://www.metservice.com/vaac/, http://www.ssd.noaa.gov/VAAC/OTH/NZ/messages.html); MIROVA (Middle InfraRed Observation of Volcanic Activity), a collaborative project between the Universities of Turin and Florence (Italy) supported by the Centre for Volcanic Risk of the Italian Civil Protection Department (URL: http://www.mirovaweb.it/); Global Sulfur Dioxide Monitoring Page, Atmospheric Chemistry and Dynamics Laboratory, NASA Goddard Space Flight Center (NASA/GSFC), 8800 Greenbelt Road, Goddard, Maryland, USA (URL: https://so2.gsfc.nasa.gov/); Copernicus Browser, Copernicus Data Space Ecosystem, European Space Agency (URL: https://dataspace.copernicus.eu/browser/).
Ibu
Indonesia
1.488°N, 127.63°E; summit elev. 1325 m
All times are local (unless otherwise noted)
Daily ash explosions continue, along with thermal anomalies in the crater, October 2022-May 2023
Persistent eruptive activity since April 2008 at Ibu, a stratovolcano on Indonesian’s Halmahera Island, has consisted of daily explosive ash emissions and plumes, along with observations of thermal anomalies (BGVN 47:04). The current eruption continued during October 2022-May 2023, described below, based on advisories issued by the Pusat Vulkanologi dan Mitigasi Bencana Geologi (PVMBG, also known as Indonesian Center for Volcanology and Geological Hazard Mitigation, CVGHM), daily reports by MAGMA Indonesia (a PVMBG platform), and the Darwin Volcanic Ash Advisory Centre (VAAC), and various satellite data. The Alert Level during the reporting period remained at 2 (on a scale of 1-4), except raised briefly to 3 on 27 May, and the public was warned to stay at least 2 km away from the active crater and 3.5 km away on the N side of the volcano.
According to MAGMA Indonesia, during October 2022-May 2023, daily gray-and-white ash plumes of variable densities rose 200-1,000 m above the summit and drifted in multiple directions. On 30 October and 11 November, plumes rose a maximum of 2 km and 1.5 km above the summit, respectively (figures 42 and 43). According to the Darwin VAAC, discrete ash emissions on 13 November rose to 2.1 km altitude, or 800 m above the summit, and drifted W, and multiple ash emissions on 15 November rose 1.4 km above the summit and drifted NE. Occasional larger ash explosions through May 2023 prompted PVMBG to issue Volcano Observatory Notice for Aviation (VONA) alerts (table 6); the Aviation Color Code remained at Orange throughout this period.
Table 6. Volcano Observatory Notice for Aviation (VONA) ash plume alerts for Ibu issued by PVMBG during October 2022-May 2023. Maximum height above the summit was estimated by a ground observer. VONAs in January-May 2023 all described the ash plumes as dense.
| Date |
Time (local) |
Max height above summit |
Direction |
| 17 Oct 2022 |
0858 |
800 m |
SW |
| 18 Oct 2022 |
1425 |
800 m |
S |
| 19 Oct 2022 |
2017 |
600 m |
SW |
| 21 Oct 2022 |
0916 |
800 m |
NW |
| 16 Jan 2023 |
1959 |
600 m |
NE |
| 22 Jan 2023 |
0942 |
1,000 m |
E |
| 29 Jan 2023 |
2138 |
1,000 m |
E |
| 10 May 2023 |
0940 |
800 m |
NW |
| 10 May 2023 |
2035 |
600 m |
E |
| 21 May 2023 |
2021 |
600 m |
W |
| 21 May 2023 |
2140 |
1,000 m |
W |
| 29 May 2023 |
1342 |
800 m |
N |
| 31 May 2023 |
1011 |
1,000 m |
SW |
Sentinel-2 L1C satellite images throughout the reporting period show two, sometimes three persistent thermal anomalies in the summit crater, with the most prominent hotspot from the top of a cone within the crater. Clear views were more common during March-April 2023, when a vent and lava flows on the NE flank of the intra-crater cone could be distinguished (figure 44). White-to-grayish emissions were also observed during brief periods when weather clouds allowed clear views.
The MIROVA space-based volcano hotspot detection system recorded almost daily thermal anomalies throughout the reporting period, though cloud cover often interfered with detections. Data from imaging spectroradiometers aboard NASA’s Aqua and Terra satellites and processed using the MODVOLC algorithm (MODIS-MODVOLC) recorded hotspots on one day during October 2022 and December 2022, two days in April 2023, three days in November 2022 and May 2023, and four days in March 2023.
Geologic Background. The truncated summit of Gunung Ibu stratovolcano along the NW coast of Halmahera Island has large nested summit craters. The inner crater, 1 km wide and 400 m deep, has contained several small crater lakes. The 1.2-km-wide outer crater is breached on the N, creating a steep-walled valley. A large cone grew ENE of the summit, and a smaller one to the WSW has fed a lava flow down the W flank. A group of maars is located below the N and W flanks. The first observed and recorded eruption was a small explosion from the summit crater in 1911. Eruptive activity began again in December 1998, producing a lava dome that eventually covered much of the floor of the inner summit crater along with ongoing explosive ash emissions.
Information Contacts: Pusat Vulkanologi dan Mitigasi Bencana Geologi (PVMBG, also known as Indonesian Center for Volcanology and Geological Hazard Mitigation, CVGHM), Jalan Diponegoro 57, Bandung 40122, Indonesia (URL: http://www.vsi.esdm.go.id/); MAGMA Indonesia (Multiplatform Application for Geohazard Mitigation and Assessment in Indonesia), Kementerian Energi dan Sumber Daya Mineral (URL: https://magma.esdm.go.id/v1); Copernicus Browser, Copernicus Data Space Ecosystem, European Space Agency (URL: https://dataspace.copernicus.eu/browser/); MIROVA (Middle InfraRed Observation of Volcanic Activity), a collaborative project between the Universities of Turin and Florence (Italy) supported by the Centre for Volcanic Risk of the Italian Civil Protection Department (URL: http://www.mirovaweb.it/); Hawai'i Institute of Geophysics and Planetology (HIGP) - MODVOLC Thermal Alerts System, School of Ocean and Earth Science and Technology (SOEST), Univ. of Hawai'i, 2525 Correa Road, Honolulu, HI 96822, USA (URL: http://modis.higp.hawaii.edu/).
Dukono
Indonesia
1.6992°N, 127.8783°E; summit elev. 1273 m
All times are local (unless otherwise noted)
Continuing ash emissions, SO2 plumes, and thermal signals during October 2022-May 2023
Dukono, a remote volcano on Indonesia’s Halmahera Island, has been erupting continuously since 1933, with frequent ash explosions and sulfur dioxide plumes (BGVN 46:11, 47:10). This activity continued during October 2022 through May 2023, based on reports from the Pusat Vulkanologi dan Mitigasi Bencana Geologi (PVMBG; also known as Indonesian Center for Volcanology and Geological Hazard Mitigation, CVGHM), the Darwin Volcanic Ash Advisory Centre (VAAC), and satellite data. During this period, the Alert Level remained at 2 (on a scale of 1-4) and the public was warned to remain outside of the 2-km exclusion zone. The highest reported plume of the period reached 9.4 km above the summit on 14 November 2022.
According to MAGMA Indonesia (a platform developed by PVMBG), white, gray, or dark plumes of variable densities were observed almost every day during the reporting period, except when fog obscured the volcano (figure 33). Plumes generally rose 25-450 m above the summit, but rose as high as 700-800 m on several days, somewhat lower than the maximum heights reached earlier in 2022 when plumes reached as high as 1 km. However, the Darwin VAAC reported that on 14 November 2022, a discrete ash plume rose 9.4 km above the summit (10.7 km altitude), accompanied by a strong hotspot and a sulfur dioxide signal observed in satellite imagery; a continuous ash plume that day and through the 15th rose to 2.1-2.4 km altitude and drifted NE.
Sentinel-2 images were obscured by weather clouds almost every viewing day during the reporting period. However, the few reasonably clear images showed a hotspot and white or gray emissions and plumes. Strong SO2 plumes from Dukono were present on many days during October 2022-May 2023, as detected using the TROPOMI instrument on the Sentinel-5P satellite (figure 34).
Geologic Background. Reports from this remote volcano in northernmost Halmahera are rare, but Dukono has been one of Indonesia's most active volcanoes. More-or-less continuous explosive eruptions, sometimes accompanied by lava flows, have occurred since 1933. During a major eruption in 1550 CE, a lava flow filled in the strait between Halmahera and the N-flank Gunung Mamuya cone. This complex volcano presents a broad, low profile with multiple summit peaks and overlapping craters. Malupang Wariang, 1 km SW of the summit crater complex, contains a 700 x 570 m crater that has also been active during historical time.
Information Contacts: Pusat Vulkanologi dan Mitigasi Bencana Geologi (PVMBG, also known as Indonesian Center for Volcanology and Geological Hazard Mitigation, CVGHM), Jalan Diponegoro 57, Bandung 40122, Indonesia (URL: http://www.vsi.esdm.go.id/); MAGMA Indonesia (Multiplatform Application for Geohazard Mitigation and Assessment in Indonesia), Kementerian Energi dan Sumber Daya Mineral (URL: https://magma.esdm.go.id/v1); Darwin Volcanic Ash Advisory Centre (VAAC), Bureau of Meteorology, Northern Territory Regional Office, PO Box 40050, Casuarina, NT 0811, Australia (URL: http://www.bom.gov.au/info/vaac/); NASA Global Sulfur Dioxide Monitoring Page, Atmospheric Chemistry and Dynamics Laboratory, NASA Goddard Space Flight Center (NASA/GSFC), 8800 Greenbelt Road, Goddard, Maryland, USA (URL: https://so2.gsfc.nasa.gov/); Sentinel Hub Playground (URL: https://www.sentinel-hub.com/explore/sentinel-playground).
Sabancaya
Peru
15.787°S, 71.857°W; summit elev. 5960 m
All times are local (unless otherwise noted)
Explosions, gas-and-ash plumes, and thermal activity persist during November 2022-April 2023
Sabancaya is located in Peru, NE of Ampato and SE of Hualca Hualca. Eruptions date back to 1750 and have been characterized by explosions, phreatic activity, ash plumes, and ashfall. The current eruption period began in November 2016 and has more recently consisted of daily explosions, gas-and-ash plumes, and thermal activity (BGVN 47:11). This report updates activity during November 2022 through April 2023 using information from Instituto Geophysico del Peru (IGP) that use weekly activity reports and various satellite data.
Intermittent low-to-moderate power thermal anomalies were reported by the MIROVA project during November 2022 through April 2023 (figure 119). There were few short gaps in thermal activity during mid-December 2022, late December-to-early January 2023, late January to mid-February, and late February. According to data recorded by the MODVOLC thermal algorithm, there were a total of eight thermal hotspots: three in November 2022, three in February 2023, one in March, and one in April. On clear weather days, some of this thermal anomaly was visible in infrared satellite imagery showing the active lava dome in the summit crater (figure 120). Almost daily moderate-to-strong sulfur dioxide plumes were recorded during the reporting period by the TROPOMI instrument on the Sentinel-5P satellite (figure 121). Many of these plumes exceeded 2 Dobson Units (DU) and drifted in multiple directions.
IGP reported that moderate activity during November and December 2022 continued; during November, an average number of explosions were reported each week: 30, 33, 36, and 35, and during December, it was 32, 40, 47, 52, and 67. Gas-and-ash plumes in November rose 3-3.5 km above the summit and drifted E, NE, SE, S, N, W, and SW. During December the gas-and-ash plumes rose 2-4 km above the summit and drifted in different directions. There were 1,259 volcanic earthquakes recorded during November and 1,693 during December. Seismicity also included volcano-tectonic-type events that indicate rock fracturing events. Slight inflation was observed in the N part of the volcano near Hualca Hualca (4 km N). Thermal activity was frequently reported in the crater at the active lava dome (figure 120).
Explosive activity continued during January and February 2023. The average number of explosions were reported each week during January (51, 50, 60, and 59) and February (43, 54, 51, and 50). Gas-and-ash plumes rose 1.6-2.9 km above the summit and drifted NW, SW, and W during January and rose 1.4-2.8 above the summit and drifted W, SW, E, SE, N, S, NW, and NE during February. IGP also detected 1,881 volcanic earthquakes during January and 1,661 during February. VT-type earthquakes were also reported. Minor inflation persisted near Hualca Hualca. Satellite imagery showed continuous thermal activity in the crater at the lava dome (figure 120).
During March, the average number of explosions each week was 46, 48, 31, 35, and 22 and during April, it was 29, 41, 31, and 27. Accompanying gas-and-ash plumes rose 1.7-2.6 km above the summit crater and drifted W, SW, NW, S, and SE during March. According to a Buenos Aires Volcano Ash Advisory Center (VAAC) notice, on 22 March at 1800 through 23 March an ash plume rose to 7 km altitude and drifted NW. By 0430 an ash plume rose to 7.6 km altitude and drifted W. On 24 and 26 March continuous ash emissions rose to 7.3 km altitude and drifted SW and on 28 March ash emissions rose to 7.6 km altitude. During April, gas-and-ash plumes rose 1.6-2.5 km above the summit and drifted W, SW, S, NW, NE, and E. Frequent volcanic earthquakes were recorded, with 1,828 in March and 1,077 in April, in addition to VT-type events. Thermal activity continued to be reported in the summit crater at the lava dome (figure 120).
Geologic Background. Sabancaya, located in the saddle NE of Ampato and SE of Hualca Hualca volcanoes, is the youngest of these volcanic centers and the only one to have erupted in historical time. The oldest of the three, Nevado Hualca Hualca, is of probable late-Pliocene to early Pleistocene age. The name Sabancaya (meaning "tongue of fire" in the Quechua language) first appeared in records in 1595 CE, suggesting activity prior to that date. Holocene activity has consisted of Plinian eruptions followed by emission of voluminous andesitic and dacitic lava flows, which form an extensive apron around the volcano on all sides but the south. Records of historical eruptions date back to 1750.
Information Contacts: Instituto Geofisico del Peru (IGP), Centro Vulcanológico Nacional (CENVUL), Calle Badajoz N° 169 Urb. Mayorazgo IV Etapa, Ate, Lima 15012, Perú (URL: https://www.igp.gob.pe/servicios/centro-vulcanologico-nacional/inicio); Buenos Aires Volcanic Ash Advisory Center (VAAC), Servicio Meteorológico Nacional-Fuerza Aérea Argentina, 25 de mayo 658, Buenos Aires, Argentina (URL: http://www.smn.gov.ar/vaac/buenosaires/inicio.php); MIROVA (Middle InfraRed Observation of Volcanic Activity), a collaborative project between the Universities of Turin and Florence (Italy) supported by the Centre for Volcanic Risk of the Italian Civil Protection Department (URL: http://www.mirovaweb.it/); Hawai'i Institute of Geophysics and Planetology (HIGP) - MODVOLC Thermal Alerts System, School of Ocean and Earth Science and Technology (SOEST), Univ. of Hawai'i, 2525 Correa Road, Honolulu, HI 96822, USA (URL: http://modis.higp.hawaii.edu/); NASA Global Sulfur Dioxide Monitoring Page, Atmospheric Chemistry and Dynamics Laboratory, NASA Goddard Space Flight Center (NASA/GSFC), 8800 Greenbelt Road, Goddard MD 20771, USA (URL: https://so2.gsfc.nasa.gov/); Copernicus Browser, Copernicus Data Space Ecosystem, European Space Agency (URL: https://dataspace.copernicus.eu/browser/).
Sheveluch
Russia
56.653°N, 161.36°E; summit elev. 3283 m
All times are local (unless otherwise noted)
Significant explosions destroyed part of the lava-dome complex during April 2023
Sheveluch (also spelled Shiveluch) in Kamchatka, has had at least 60 large eruptions during the last 10,000 years. The summit is truncated by a broad 9-km-wide caldera that is breached to the S, and many lava domes occur on the outer flanks. The lava dome complex was constructed within the large open caldera. Frequent collapses of the dome complex have produced debris avalanches; the resulting deposits cover much of the caldera floor. A major south-flank collapse during a 1964 Plinian explosion produced a scarp in which a “Young Sheveluch” dome began to form in 1980. Repeated episodes of dome formation and destruction since then have produced major and minor ash plumes, pyroclastic flows, block-and-ash flows, and “whaleback domes” of spine-like extrusions in 1993 and 2020 (BGVN 45:11). The current eruption period began in August 1999 and has more recently consisted of lava dome growth, explosions, ash plumes, and avalanches (BGVN 48:01). This report covers a significant explosive eruption during early-to-mid-April 2023 that generated a 20 km altitude ash plume, produced a strong sulfur dioxide plume, and destroyed part of the lava-dome complex; activity described during January through April 2023 use information primarily from the Kamchatka Volcanic Eruptions Response Team (KVERT) and various satellite data.
Satellite data. Activity during the majority of this reporting period was characterized by continued lava dome growth, strong fumarole activity, explosions, and hot avalanches. According to the MODVOLC Thermal Alerts System, 140 hotspots were detected through the reporting period, with 33 recorded in January 2023, 29 in February, 44 in March, and 34 in April. Frequent strong thermal activity was recorded during January 2023 through April, according to the MIROVA (Middle InfraRed Observation of Volcanic Activity) graph and resulted from the continuously growing lava dome (figure 94). A slightly stronger pulse in thermal activity was detected in early-to-mid-April, which represented the significant eruption that destroyed part of the lava-dome complex. Thermal anomalies were also visible in infrared satellite imagery at the summit crater (figure 95).
During January 2023 KVERT reported continued growth of the lava dome, accompanied by strong fumarolic activity, incandescence from the lava dome, explosions, ash plumes, and avalanches. Satellite data showed a daily thermal anomaly over the volcano. Video data showed ash plumes associated with collapses at the dome that generated avalanches that in turn produced ash plumes rising to 3.5 km altitude and drifting 40 km W on 4 January and rising to 7-7.5 km altitude and drifting 15 km SW on 5 January. A gas-and-steam plume containing some ash that was associated with avalanches rose to 5-6 km altitude and extended 52-92 km W on 7 January. Explosions that same day produced ash plumes that rose to 7-7.5 km altitude and drifted 10 km W. According to a Volcano Observatory Notice for Aviation (VONA) issued at 1344 on 19 January, explosions produced an ash cloud that was 15 x 25 km in size and rose to 9.6-10 km altitude, drifting 21-25 km W; as a result, the Aviation Color Code (ACC) was raised to Red (the highest level on a four-color scale). Another VONA issued at 1635 reported that no more ash plumes were observed, and the ACC was lowered to Orange (the second highest level on a four-color scale). On 22 January an ash plume from collapses and avalanches rose to 5 km altitude and drifted 25 km NE and SW; ash plumes associated with collapses extended 70 km NE on 27 and 31 January.
Lava dome growth, fumarolic activity, dome incandescence, and occasional explosions and avalanches continued during February and March. A daily thermal anomaly was visible in satellite data. Explosions on 1 February generated ash plumes that rose to 6.3-6.5 km altitude and extended 15 km NE. Video data showed an ash cloud from avalanches rising to 5.5 km altitude and drifting 5 km SE on 2 February. Satellite data showed gas-and-steam plumes containing some ash rose to 5-5.5 km altitude and drifted 68-110 km ENE and NE on 6 February, to 4.5-5 km altitude and drifted 35 km WNW on 22 February, and to 3.7-4 km altitude and drifted 47 km NE on 28 February. Scientists from the Kamchatka Volcanological Station (KVS) went on a field excursion on 25 February to document the growing lava dome, and although it was cloudy most of the day, nighttime incandescence was visible. Satellite data showed an ash plume extending up to 118 km E during 4-5 March. Video data from 1150 showed an ash cloud from avalanches rose to 3.7-5.5 km altitude and drifted 5-10 km ENE and E on 5 March. On 11 March an ash plume drifted 62 km E. On 27 March ash plumes rose to 3.5 km altitude and drifted 100 km E. Avalanches and constant incandescence at the lava dome was focused on the E and NE slopes on 28 March. A gas-and-steam plume containing some ash rose to 3.5 km altitude and moved 40 km E on 29 March. Ash plumes on 30 March rose to 3.5-3.7 km altitude and drifted 70 km NE.
Similar activity continued during April, with lava dome growth, strong fumarolic activity, incandescence in the dome, occasional explosions, and avalanches. A thermal anomaly persisted throughout the month. During 1-4 April weak ash plumes rose to 2.5-3 km altitude and extended 13-65 km SE and E.
Activity during 11 April 2023. The Institute of Volcanology and Seismology, Far Eastern Branch, Russian Academy of Sciences (IVS FEB RAS) reported a significant increase in seismicity around 0054 on 11 April, as reported by strong explosions detected on 11 April beginning at 0110 that sent ash plumes up to 7-10 km altitude and extended 100-435 km W, WNW, NNW, WSW, and SW. According to a Tokyo VAAC report the ash plume rose to 15.8 km altitude. By 0158 the plume extended over a 75 x 100 km area. According to an IVS FEB RAS report, the eruptive column was not vertical: the initial plume at 0120 on 11 April deviated to the NNE, at 0000 on 12 April, it drifted NW, and by 1900 it drifted SW. KVS reported that significant pulses of activity occurred at around 0200, 0320, and then a stronger phase around 0600. Levin Dmitry took a video from near Békés (3 km away) at around 0600 showing a rising plume; he also reported that a pyroclastic flow traveled across the road behind him as he left the area. According to IVS FEB RAS, the pyroclastic flow traveled several kilometers SSE, stopping a few hundred meters from a bridge on the road between Klyuchi and Petropavlovsk-Kamchatsky.
Ashfall was first observed in Klyuchi (45 km SW) at 0630, and a large, black ash plume blocked light by 0700. At 0729 KVERT issued a Volcano Observatory Notice for Aviation (VONA) raising the Aviation Color Code to Red (the highest level on a four-color scale). It also stated that a large ash plume had risen to 10 km altitude and drifted 100 km W. Near-constant lightning strikes were reported in the plume and sounds like thunderclaps were heard until about 1000. According to IVS FEB RAS the cloud was 200 km long and 76 km wide by 0830, and was spreading W at altitudes of 6-12 km. In the Klyuchi Village, the layer of both ash and snow reached 8.5 cm (figure 96); ashfall was also reported in Kozyrevsk (112 km SW) at 0930, Mayskoye, Anavgay, Atlasovo, Lazo, and Esso. Residents in Klyuchi reported continued darkness and ashfall at 1100. In some areas, ashfall was 6 cm deep and some residents reported dirty water coming from their plumbing. According to IVS FEB RAS, an ash cloud at 1150 rose to 5-20 km altitude and was 400 km long and 250 km wide, extending W. A VONA issued at 1155 reported that ash had risen to 10 km and drifted 340 km NNW and 240 km WSW. According to Simon Carn (Michigan Technological University), about 0.2 Tg of sulfur dioxide in the plume was measured in a satellite image from the TROPOMI instrument on the Sentinel-5P satellite acquired at 1343 that covered an area of about 189,000 km2 (figure 97). Satellite data at 1748 showed an ash plume that rose to 8 km altitude and drifted 430 km WSW and S, according to a VONA.
Activity during 12-15 April 2023. On 12 April at 0730 satellite images showed ash plumes rose to 7-8 km altitude and extended 600 km SW, 1,050 km ESE, and 1,300-3,000 km E. By 1710 that day, the explosions weakened. According to news sources, the ash-and-gas plumes drifted E toward the Aleutian Islands and reached the Gulf of Alaska by 13 April, causing flight disruptions. More than 100 flights involving Alaska airspace were cancelled due to the plume. Satellite data showed ash plumes rising to 4-5.5 km altitude and drifted 400-415 km SE and ESE on 13 April. KVS volcanologists observed the pyroclastic flow deposits and noted that steam rose from downed, smoldering trees. They also noted that the deposits were thin with very few large fragments, which differed from previous flows. The ash clouds traveled across the Pacific Ocean. Flight cancellations were also reported in NW Canada (British Columbia) during 13-14 April. During 14-15 April ash plumes rose to 6 km altitude and drifted 700 km NW.
Alaskan flight schedules were mostly back to normal by 15 April, with only minor delays and far less cancellations; a few cancellations continued to be reported in Canada. Clear weather on 15 April showed that most of the previous lava-dome complex was gone and a new crater roughly 1 km in diameter was observed (figure 98); gas-and-steam emissions were rising from this crater. Evidence suggested that there had been a directed blast to the SE, and pyroclastic flows traveled more than 20 km. An ash plume rose to 4.5-5.2 km altitude and drifted 93-870 km NW on 15 April.
Activity during 16-30 April 2023. Resuspended ash was lifted by the wind from the slopes and rose to 4 km altitude and drifted 224 km NW on 17 April. KVERT reported a plume of resuspended ash from the activity during 10-13 April on 19 April that rose to 3.5-4 km altitude and drifted 146-204 km WNW. During 21-22 April a plume stretched over the Scandinavian Peninsula. A gas-and-steam plume containing some ash rose to 3-3.5 km altitude and drifted 60 km SE on 30 April. A possible new lava dome was visible on the W slope of the volcano on 29-30 April (figure 99); satellite data showed two thermal anomalies, a bright one over the existing lava dome and a weaker one over the possible new one.
References. Girina, O., Loupian, E., Horvath, A., Melnikov, D., Manevich, A., Nuzhdaev, A., Bril, A., Ozerov, A., Kramareva, L., Sorokin, A., 2023, Analysis of the development of the paroxysmal eruption of Sheveluch volcano on April 10–13, 2023, based on data from various satellite systems, ??????????? ???????? ??? ?? ???????, 20(2).
Geologic Background. The high, isolated massif of Sheveluch volcano (also spelled Shiveluch) rises above the lowlands NNE of the Kliuchevskaya volcano group. The 1,300 km3 andesitic volcano is one of Kamchatka's largest and most active volcanic structures, with at least 60 large eruptions during the Holocene. The summit of roughly 65,000-year-old Stary Shiveluch is truncated by a broad 9-km-wide late-Pleistocene caldera breached to the south. Many lava domes occur on its outer flanks. The Molodoy Shiveluch lava dome complex was constructed during the Holocene within the large open caldera; Holocene lava dome extrusion also took place on the flanks of Stary Shiveluch. Widespread tephra layers from these eruptions have provided valuable time markers for dating volcanic events in Kamchatka. Frequent collapses of dome complexes, most recently in 1964, have produced debris avalanches whose deposits cover much of the floor of the breached caldera.
Information Contacts: Kamchatka Volcanic Eruptions Response Team (KVERT), Far Eastern Branch, Russian Academy of Sciences, 9 Piip Blvd., Petropavlovsk-Kamchatsky, 683006, Russia (URL: http://www.kscnet.ru/ivs/kvert/); Institute of Volcanology and Seismology, Far Eastern Branch, Russian Academy of Sciences (IVS FEB RAS), 9 Piip Blvd., Petropavlovsk-Kamchatsky 683006, Russia (URL: http://www.kscnet.ru/ivs/eng/); Kamchatka Volcanological Station, Kamchatka Branch of Geophysical Survey, (KB GS RAS), Klyuchi, Kamchatka Krai, Russia (URL: http://volkstat.ru/); Hawai'i Institute of Geophysics and Planetology (HIGP) - MODVOLC Thermal Alerts System, School of Ocean and Earth Science and Technology (SOEST), Univ. of Hawai'i, 2525 Correa Road, Honolulu, HI 96822, USA (URL: http://modis.higp.hawaii.edu/); MIROVA (Middle InfraRed Observation of Volcanic Activity), a collaborative project between the Universities of Turin and Florence (Italy) supported by the Centre for Volcanic Risk of the Italian Civil Protection Department (URL: http://www.mirovaweb.it/); Copernicus Browser, Copernicus Data Space Ecosystem, European Space Agency (URL: https://dataspace.copernicus.eu/browser/); Kam 24 News Agency, 683032, Kamchatka Territory, Petropavlovsk-Kamchatsky, Vysotnaya St., 2A (URL: https://kam24.ru/news/main/20230411/96657.html#.Cj5Jrky6.dpuf); Simon Carn, Geological and Mining Engineering and Sciences, Michigan Technological University, 1400 Townsend Drive, Houghton, MI 49931, USA (URL: http://www.volcarno.com/, Twitter: @simoncarn).
Bezymianny
Russia
55.972°N, 160.595°E; summit elev. 2882 m
All times are local (unless otherwise noted)
Explosions, ash plumes, lava flows, and avalanches during November 2022-April 2023
Bezymianny is located on the Kamchatka Peninsula of Russia as part of the Klyuchevskoy volcano group. Historic eruptions began in 1955 and have been characterized by dome growth, explosions, pyroclastic flows, ash plumes, and ashfall. During the 1955-56 eruption a large open crater was formed by collapse of the summit and an associated lateral blast. Subsequent episodic but ongoing lava-dome growth, accompanied by intermittent explosive activity and pyroclastic flows, has largely filled the 1956 crater. The current eruption period began in December 2016 and more recent activity has consisted of strong explosions, ash plumes, and thermal activity (BGVN 47:11). This report covers activity during November 2022 through April 2023, based on weekly and daily reports from the Kamchatka Volcano Eruptions Response Team (KVERT) and satellite data.
Activity during November and March 2023 was relatively low and mostly consisted of gas-and-steam emissions, occasional small collapses that generated avalanches along the lava dome slopes, and a persistent thermal anomaly over the volcano that was observed in satellite data on clear weather days. According to the Tokyo VAAC and KVERT, an explosion produced an ash plume that rose to 6 km altitude and drifted 25 km NE at 1825 on 29 March.
Gas-and-steam emissions, collapses generating avalanches, and thermal activity continued during April. According to two Volcano Observatory Notice for Aviation (VONA) issued on 2 and 6 April (local time) ash plumes rose to 3 km and 3.5-3.8 km altitude and drifted 35 km E and 140 km E, respectively. Satellite data from KVERT showed weak ash plumes extending up to 550 km E on 2 and 5-6 April.
A VONA issued at 0843 on 7 April described an ash plume that rose to 4.5-5 km altitude and drifted 250 km ESE. Later that day at 1326 satellite data showed an ash plume that rose to 5.5-6 km altitude and drifted 150 km ESE. A satellite image from 1600 showed an ash plume extending as far as 230 km ESE; KVERT noted that ash emissions were intensifying, likely due to avalanches from the growing lava dome. The Aviation Color Code (ACC) was raised to Red (the highest level on a four-color scale). At 1520 satellite data showed an ash plume rising to 5-5.5 km altitude and drifting 230 km ESE. That same day, Kamchatka Volcanological Station (KVS) volcanologists traveled to Ambon to collect ash; they reported that a notable eruption began at 1730, and within 20 minutes a large ash plume rose to 10 km altitude and drifted NW. KVERT reported that the strong explosive phase began at 1738. Video and satellite data taken at 1738 showed an ash plume that rose to 10-12 km altitude and drifted up to 2,800 km SE and E. Explosions were clearly audible 20 km away for 90 minutes, according to KVS. Significant amounts of ash fell at the Apakhonchich station, which turned the snow gray; ash continued to fall until the morning of 8 April. In a VONA issued at 0906 on 8 April, KVERT stated that the explosive eruption had ended; ash plumes had drifted 2,000 km E. The ACC was lowered to Orange (the third highest level on a four-color scale). The KVS team saw a lava flow on the active dome once the conditions were clear that same day (figure 53). On 20 April lava dome extrusion was reported; lava flows were noted on the flanks of the dome, and according to KVERT satellite data, a thermal anomaly was observed in the area. The ACC was lowered to Yellow (the second lowest on a four-color scale).
Satellite data showed an increase in thermal activity beginning in early April 2023. A total of 31 thermal hotspots were detected by the MODVOLC thermal algorithm on 4, 5, 7, and 12 April 2023. The elevated thermal activity resulted from an increase in explosive activity and the start of an active lava flow. The MIROVA (Middle InfraRed Observation of Volcanic Activity) volcano hotspot detection system based on the analysis of MODIS data also showed a pulse in thermal activity during the same time (figure 54). Infrared satellite imagery captured a continuous thermal anomaly at the summit crater, often accompanied by white gas-and-steam emissions (figure 55). On 4 April 2023 an active lava flow was observed descending the SE flank.
Geologic Background. The modern Bezymianny, much smaller than its massive neighbors Kamen and Kliuchevskoi on the Kamchatka Peninsula, was formed about 4,700 years ago over a late-Pleistocene lava-dome complex and an edifice built about 11,000-7,000 years ago. Three periods of intensified activity have occurred during the past 3,000 years. The latest period, which was preceded by a 1,000-year quiescence, began with the dramatic 1955-56 eruption. This eruption, similar to that of St. Helens in 1980, produced a large open crater that was formed by collapse of the summit and an associated lateral blast. Subsequent episodic but ongoing lava-dome growth, accompanied by intermittent explosive activity and pyroclastic flows, has largely filled the 1956 crater.
Information Contacts: Kamchatka Volcanic Eruptions Response Team (KVERT), Far Eastern Branch, Russian Academy of Sciences, 9 Piip Blvd., Petropavlovsk-Kamchatsky, 683006, Russia (URL: http://www.kscnet.ru/ivs/kvert/); Kamchatka Volcanological Station, Kamchatka Branch of Geophysical Survey, (KB GS RAS), Klyuchi, Kamchatka Krai, Russia (URL: http://volkstat.ru/); Hawai'i Institute of Geophysics and Planetology (HIGP) - MODVOLC Thermal Alerts System, School of Ocean and Earth Science and Technology (SOEST), Univ. of Hawai'i, 2525 Correa Road, Honolulu, HI 96822, USA (URL: http://modis.higp.hawaii.edu/); MIROVA (Middle InfraRed Observation of Volcanic Activity), a collaborative project between the Universities of Turin and Florence (Italy) supported by the Centre for Volcanic Risk of the Italian Civil Protection Department (URL: http://www.mirovaweb.it/); Copernicus Browser, Copernicus Data Space Ecosystem, European Space Agency (URL: https://dataspace.copernicus.eu/browser/).
Chikurachki
Russia
50.324°N, 155.461°E; summit elev. 1781 m
All times are local (unless otherwise noted)
New explosive eruption during late January-early February 2023
Chikurachki, located on Paramushir Island in the northern Kuriles, has had Plinian eruptions during the Holocene. Lava flows have reached the sea and formed capes on the NW coast; several young lava flows are also present on the E flank beneath a scoria deposit. Reported eruptions date back to 1690, with the most recent eruption period occurring during January through October 2022, characterized by occasional explosions, ash plumes, and thermal activity (BGVN 47:11). This report covers a new eruptive period during January through February 2023 that consisted of ash explosions and ash plumes, based on information from the Kamchatka Volcanic Eruptions Response Team (KVERT) and satellite data.
According to reports from KVERT, an explosive eruption began around 0630 on 29 January. Explosions generated ash plumes that rose to 3-3.5 km altitude and drifted 6-75 km SE and E, based on satellite data. As a result, the Aviation Color Code (ACC) was raised to Orange (the second highest level on a four-color scale). At 1406 and 1720 ash plumes were identified in satellite images that rose to 4.3 km altitude and extended 70 km E. By 2320 the ash plume had dissipated. A thermal anomaly was visible at the volcano on 31 January, according to a satellite image, and an ash plume was observed drifting 66 km NE.
Occasional explosions and ash plumes continued during early February. At 0850 on 1 February an ash plume rose to 3.5 km altitude and drifted 35 km NE. Satellite data showed an ash plume that rose to 3.2-3.5 km altitude and drifted 50 km NE at 1222 later that day (figure 22). A thermal anomaly was detected over the volcano during 5-6 February and ash plumes drifted as far as 125 km SE, E, and NE. Explosive events were reported at 0330 on 6 February that produced ash plumes rising to 4-4.5 km altitude and drifting 72-90 km N, NE, and ENE. KVERT noted that the last gas-and steam plume that contained some ash was observed on 8 February and drifted 55 km NE before the explosive eruption ended. The ACC was lowered to Yellow and then Green (the lowest level on a four-color scale) on 18 February.
Geologic Background. Chikurachki, the highest volcano on Paramushir Island in the northern Kuriles, is a relatively small cone constructed on a high Pleistocene edifice. Oxidized basaltic-to-andesitic scoria deposits covering the upper part of the young cone give it a distinctive red color. Frequent basaltic Plinian eruptions have occurred during the Holocene. Lava flows have reached the sea and formed capes on the NW coast; several young lava flows are also present on the E flank beneath a scoria deposit. The Tatarinov group of six volcanic centers is located immediately to the south, and the Lomonosov cinder cone group, the source of an early Holocene lava flow that reached the saddle between it and Fuss Peak to the west, lies at the southern end of the N-S-trending Chikurachki-Tatarinov complex. In contrast to the frequently active Chikurachki, the Tatarinov centers are extensively modified by erosion and have a more complex structure. Tephrochronology gives evidence of an eruption around 1690 CE from Tatarinov, although its southern cone contains a sulfur-encrusted crater with fumaroles that were active along the margin of a crater lake until 1959.
Information Contacts: Kamchatka Volcanic Eruptions Response Team (KVERT), Far East Division, Russian Academy of Sciences, 9 Piip Blvd., Petropavlovsk-Kamchatsky, 683006, Russia (URL: http://www.kscnet.ru/ivs/); Copernicus Browser, Copernicus Data Space Ecosystem, European Space Agency (URL: https://dataspace.copernicus.eu/browser/).
Search Bulletin Archive by Publication Date
Select a month and year from the drop-downs and click "Show Issue" to have that issue displayed in this tab.
The default month and year is the latest issue available.
Bulletin of the Global Volcanism Network - Volume 15, Number 10 (October 1990)
Managing Editor: Lindsay McClelland
Additional Reports (Unknown)
Fiji: 30-km zone of pumice from unknown source
Agrigan (United States)
Strong thermal activity but no unusual seismicity
Aira (Japan)
Explosions decline, but non-explosive ash emission continues
Akan (Japan)
Earthquakes increase but steam emission unchanged
Anatahan (United States)
Crater lake refills; little deformation or seismicity
Arenal (Costa Rica)
Strombolian activity; lava flows; small nuées ardentes
Asamayama (Japan)
Seismicity declines slightly
Asosan (Japan)
Weak ash emission and glow; increased tremor
Eldey (Iceland)
Strong seismicity; turbid water and hydrothermal area but no new lava detected
Etna (Italy)
Strombolian activity and lava fountaining from central craters; earthquakes and tremor; deformation
Farallon de Pajaros (United States)
Vigorous fuming
Galeras (Colombia)
Ash emitted; seismicity declines slightly
Hargy (Papua New Guinea)
Weak fumarolic emissions
Izu-Oshima (Japan)
Seismicity and steam emission decline
Kilauea (United States)
Lava continues to flow into sea; more homes destroyed
Kusatsu-Shiranesan (Japan)
Continued high seismicity but no surface changes
Langila (Papua New Guinea)
Occasional ash emission; explosion sounds; glow
Lengai, Ol Doinyo (Tanzania)
Continued summit lava production from several vents
Manam (Papua New Guinea)
Weak vapor emission; earthquakes decline
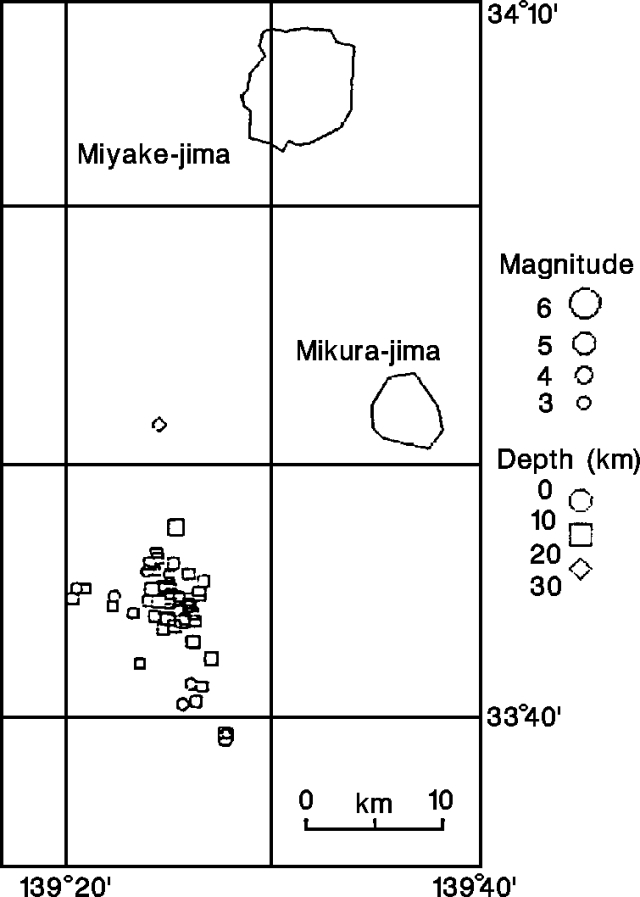
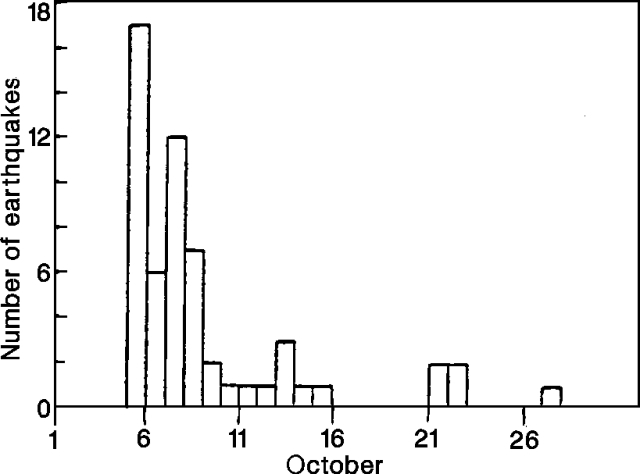
Mikura Seamount (Japan)
Three bursts of seismicity near Mikura Seamount
Pagan (United States)
Strong SO2-rich plume but no significant deformation or earthquake activity
Poas (Costa Rica)
Fumarolic activity and seismicity continue; minor inflation
Rabaul (Papua New Guinea)
Seismicity remains low; no significant deformation
Redoubt (United States)
Minor gas/ash emissions and tremor
Ruapehu (New Zealand)
Crater Lake temperatures rise then fall; seismicity remains low; deflation
Ruiz, Nevado del (Colombia)
Small ash emissions and seismicity
St. Helens (United States)
Explosion from N side of lava dome; ash plume and small mudflow
Stromboli (Italy)
Strong tephra ejection; increased seismicity
Ulawun (Papua New Guinea)
Vapor emission; weak seismicity
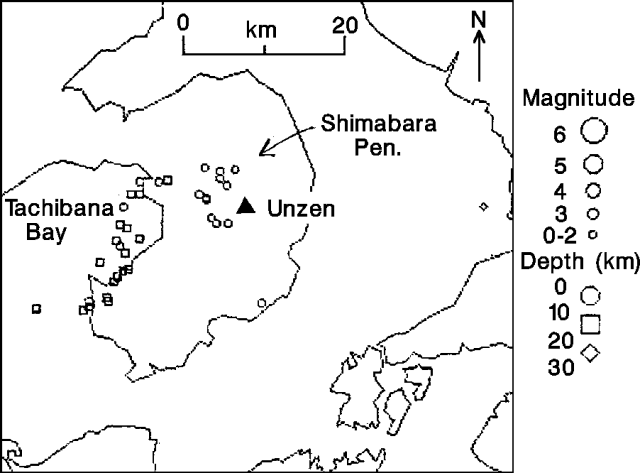
Unzendake (Japan)
Small gas/ash eruption follows several months of increased seismicity
Whakaari/White Island (New Zealand)
Strong thermal activity but no new eruptions
Witori (Papua New Guinea)
Mild summit and flank fumarolic activity
Additional Reports (Unknown) — October 1990 Cite this Report
Additional Reports
Unknown
Unknown, Unknown; summit elev. m
All times are local (unless otherwise noted)
Fiji: 30-km zone of pumice from unknown source
An "underwater explosion" and "pumice swirl" ~30 km wide were reported at 19.10°S, 175.41°E (200 km SW of Nadi, Fiji) on 16 October at 1058 from Air Pacific flight 914 (Nadi to Sydney, Australia). At 1450, the crew of a second Air Pacific flight (enroute from Auckland, New Zealand) noted pumice visible in the sea 130 km from Nadi (on the W coast of Fiji's largest island, Viti Levu) [see also 15:11-12].
Although no historical volcanism has been reported near the observation site, the area is near a spreading center described by Gill and Whelan (1989). Another possible source of the pumice is Monowai Seamount (25.92°S, 177.15°W), 1,100 km to the ESE, where submarine activity was observed from the HMNZS Tui on 13 August. On 30 May-18 June and 5-7 September, the Polynesian Seismic Net recorded T-phase activity, centered in the Monowai area, that had characteristics typical of shallow submarine eruptions.
Reference. Gill, J., and Whelan, P., 1989, Early rifting of an oceanic island arc (Fiji) Produced shoshonitic to tholeiitic basalts: JGR, v. 94, no. B4, p. 4561-4578.
Geologic Background. Reports of floating pumice from an unknown source, hydroacoustic signals, or possible eruption plumes seen in satellite imagery.
Information Contacts: J. Latter, DSIR Geophysics, Wellington.
Agrigan (United States) — October 1990 Cite this Report
Agrigan
United States
18.77°N, 145.67°E; summit elev. 965 m
All times are local (unless otherwise noted)
Strong thermal activity but no unusual seismicity
A seven-member team of USGS volcanologists visited the CNMI 24 September-6 October at the request of the Office of Civil Defense. The following is from a report by Richard Moore.
"On Agrigan, the team established a new EDM network within the summit caldera, and hope to remeasure it in 1991. At that time, geologic investigations terminated by tropical storm Hattie on 2 October 1990 would be continued.
"A revolving drum seismograph operated continuously 28 September-1 October at a village near the coast, and a portable seismograph operated intermittently 28-29 September at several sites on the caldera floor, recorded no sustained microearthquake activity or volcanic tremor on Agrigan.
"The team discovered a boiling hot spring, associated terrace deposits, and solfataras at the 1917 eruption vent (Agrigan's most recent) on the floor of the 1.5-km-diameter caldera. Steam was being emitted from several areas at the base of the caldera wall. Temperatures of the boiling hot spring and 25 solfataras measured by thermocouple were all 98°C. Water from the hot spring had a pH of 2.0. Chemical analysis of the water is in progress. Several measurements (using Kitagawa and Draeger tubes) of the abundances of various gases emitted by the solfataras are summarized in table 1.
Table 1. Range in compositions of gas samples collected at Agrigan, September-October 1990. Courtesy of Richard Moore.
| Gas |
Abundance |
| HCl |
200 - 320 ppm |
| CO |
0 - 3 ppm |
| CO2 |
>3% |
| H2S |
1900 - >2000 ppm |
| SO2 |
>400 ppm |
"The team found no evidence of new fuming on Agrigan (suggested by reports in August and cause of the island's evacuation; 15:7). Hot spring terraces composed of siliceous sinter covered an area of ~20 x 7 m2 below the boiling hot spring. The terraces are now mostly dry, with current deposition of silica limited to a few square meters adjacent to the hot spring, suggesting that activity was more vigorous sometime in the past. However, fluctuations in the volume of flow from the spring may occur as a result of seasonal variations in rainfall."
Geologic Background. The highest of the Marianas arc volcanoes, Agrigan contains a 500-m-deep, flat-floored caldera. The elliptical island is 8 km long; its summit is the top of a massive 4000-m-high submarine volcano. Deep radial valleys dissect the flanks of the thickly vegetated stratovolcano. The elongated caldera is 1 x 2 km wide and is breached to the NW, from where a prominent lava flow extends to the coast and forms a lava delta. The caldera floor is surfaced by fresh-looking lava flows and also contains two cones that may have formed during the only historical eruption in 1917. This eruption deposited large blocks and 3 m of ash and lapilli on a village on the SE coast, prompting its evacuation.
Information Contacts: R. Moore, USGS; R. Koyanagi and M. Sako, HVO.
Aira
Japan
31.5772°N, 130.6589°E; summit elev. 1117 m
All times are local (unless otherwise noted)
Explosions decline, but non-explosive ash emission continues
Minami-dake cone exploded once in October, on the 4th, following 37 days of quiescence. No additional explosions had occurred as of 14 November. The October explosion was the 113th of 1990 and caused no damage. The maximum ash plume height, 3,500 m above the crater, occurred during a quiet emission on the 2nd. A monthly total of 130 g/m2 of ash was deposited 10 km W of the crater . . . .
Geologic Background. The Aira caldera in the northern half of Kagoshima Bay contains the post-caldera Sakurajima volcano, one of Japan's most active. Eruption of the voluminous Ito pyroclastic flow accompanied formation of the 17 x 23 km caldera about 22,000 years ago. The smaller Wakamiko caldera was formed during the early Holocene in the NE corner of the caldera, along with several post-caldera cones. The construction of Sakurajima began about 13,000 years ago on the southern rim and built an island that was joined to the Osumi Peninsula during the major explosive and effusive eruption of 1914. Activity at the Kitadake summit cone ended about 4,850 years ago, after which eruptions took place at Minamidake. Frequent eruptions since the 8th century have deposited ash on the city of Kagoshima, located across Kagoshima Bay only 8 km from the summit. The largest recorded eruption took place during 1471-76.
Information Contacts: JMA.
Akan
Japan
43.384°N, 144.013°E; summit elev. 1499 m
All times are local (unless otherwise noted)
Earthquakes increase but steam emission unchanged
The October total of recorded earthquakes was 202, an increase from 144 in September. Steam emission remained unchanged, reaching 600 m height during October. Seismicity has been at high levels for the last 3 years, since the eruption of January-February 1988.
Geologic Background. Akan is a 13 x 24 km caldera located immediately SW of Kussharo caldera. The elongated, irregular outline of the caldera rim reflects its incremental formation during major explosive eruptions from the early to mid-Pleistocene. Growth of four post-caldera stratovolcanoes, three at the SW end of the caldera and the other at the NE side, has restricted the size of the caldera lake. Conical Oakandake was frequently active during the Holocene. The 1-km-wide Nakamachineshiri crater of Meakandake was formed during a major pumice-and-scoria eruption about 13,500 years ago. Within the Akan volcanic complex, only the Meakandake group, east of Lake Akan, has been historically active, producing mild phreatic eruptions since the beginning of the 19th century. Meakandake is composed of nine overlapping cones. The main cone of Meakandake proper has a triple crater at its summit. Historical eruptions at Meakandake have consisted of minor phreatic explosions, but four major magmatic eruptions including pyroclastic flows have occurred during the Holocene.
Information Contacts: JMA.
Anatahan (United States) — October 1990 Cite this Report
Anatahan
United States
16.35°N, 145.67°E; summit elev. 790 m
All times are local (unless otherwise noted)
Crater lake refills; little deformation or seismicity
A seven-member team of USGS volcanologists visited the CNMI 24 September-6 October at the request of the Office of Civil Defense. The team installed [a seismic station] on Anatahan . . .; data are telemetered to Saipan and recorded at Civil Defense headquarters. Quoted material below is from a report by Richard Moore.
"No significant earthquakes have occurred on Anatahan since installation of the seismic and telemetry system on 29 September. Reoccupation of the EDM network established in April showed small changes in line lengths, in accord with the lack of local seismicity. The lake in the eastern crater . . . was full again on 1 October 1990. The water was discolored, but not boiling."
Felt seismicity 30 March-1 April and turbulence in the crater lake of Anatahan prompted the evacuation of Anatahan Island. The island has remained uninhabited since 4 April.
Geologic Background. The elongate, 9-km-long island of Anatahan in the central Mariana Islands consists of a large stratovolcano with a 2.3 x 5 km compound summit caldera. The larger western portion of the caldera is 2.3 x 3 km wide, and its western rim forms the island's high point. Ponded lava flows overlain by pyroclastic deposits fill the floor of the western caldera, whose SW side is cut by a fresh-looking smaller crater. The 2-km-wide eastern portion of the caldera contained a steep-walled inner crater whose floor prior to the 2003 eruption was only 68 m above sea level. A submarine cone, named NE Anatahan, rises to within 460 m of the sea surface on the NE flank, and numerous other submarine vents are found on the NE-to-SE flanks. Sparseness of vegetation on the most recent lava flows had indicated that they were of Holocene age, but the first historical eruption did not occur until May 2003, when a large explosive eruption took place forming a new crater inside the eastern caldera.
Information Contacts: R. Moore, USGS; R. Koyanagi and M. Sako, HVO.
Arenal (Costa Rica) — October 1990 Cite this Report
Arenal
Costa Rica
10.463°N, 84.703°W; summit elev. 1670 m
All times are local (unless otherwise noted)
Strombolian activity; lava flows; small nuées ardentes
Strombolian activity and lava production continued, and occasional small nuées ardentes were observed during October. An average of 18 explosions (with three or four strong events) were recorded daily (figure 31) . . . . Explosions ejected blocks and bombs that were deposited to ~1 km from the crater, and produced ash columns 1 km high. White and occasionally bluish gas plumes were carried NW, W, and SW; acid rain continued to cause damage. At the end of October, two blocky lava flows were observed extending down the NW and SW flanks.
Tremor was nearly continuous, averaging 23 hours/day (figure 31), and increased in intensity towards the end of the month as the number of explosions decreased. Deformation measurements indicated continued deflation of the volcano since 1986, with occasional pulses of inflation during explosive stages (figure 32). The area around the active summit crater (C) continued to grow by accumulation of pyroclastic materials. The rate of this accumulation, which totaled 9 m from early 1987 through May 1988, has decreased (figure 33).
Geologic Background. Conical Volcán Arenal is the youngest stratovolcano in Costa Rica and one of its most active. The 1670-m-high andesitic volcano towers above the eastern shores of Lake Arenal, which has been enlarged by a hydroelectric project. Arenal lies along a volcanic chain that has migrated to the NW from the late-Pleistocene Los Perdidos lava domes through the Pleistocene-to-Holocene Chato volcano, which contains a 500-m-wide, lake-filled summit crater. The earliest known eruptions of Arenal took place about 7000 years ago, and it was active concurrently with Cerro Chato until the activity of Chato ended about 3500 years ago. Growth of Arenal has been characterized by periodic major explosive eruptions at several-hundred-year intervals and periods of lava effusion that armor the cone. An eruptive period that began with a major explosive eruption in 1968 ended in December 2010; continuous explosive activity accompanied by slow lava effusion and the occasional emission of pyroclastic flows characterized the eruption from vents at the summit and on the upper western flank.
Information Contacts: J. Barquero, V. Barboza, E. Fernández, and R. van der Laat, OVSICORI; G. Soto and R. Barquero, ICE.
Asamayama (Japan) — October 1990 Cite this Report
Asamayama
Japan
36.406°N, 138.523°E; summit elev. 2568 m
All times are local (unless otherwise noted)
Seismicity declines slightly
High seismicity . . . continued through October, but declined slightly from previous months. A monthly total of 105 earthquakes and 19 tremor episodes were recorded, declining from 206 and 24 respectively in September. Seismicity was continuing to decline as of 14 November.
Geologic Background. Asamayama, Honshu's most active volcano, overlooks the resort town of Karuizawa, 140 km NW of Tokyo. The volcano is located at the junction of the Izu-Marianas and NE Japan volcanic arcs. The modern Maekake cone forms the summit and is situated east of the remnant of an older andesitic volcano, Kurofuyama, which was destroyed by a late-Pleistocene landslide about 20,000 years before present (BP). Growth of a dacitic shield volcano was accompanied by pumiceous pyroclastic flows, the largest of which occurred about 14,000-11,000 BP, and by growth of the Ko-Asamayama lava dome on the east flank. Maekake, capped by the Kamayama pyroclastic cone that forms the present summit, is probably only a few thousand years old and has observed activity dating back at least to the 11th century CE. Maekake has had several major Plinian eruptions, the last two of which occurred in 1108 (Asamayama's largest Holocene eruption) and 1783 CE.
Information Contacts: JMA.
Asosan
Japan
32.8849°N, 131.085°E; summit elev. 1592 m
All times are local (unless otherwise noted)
Weak ash emission and glow; increased tremor
No ash was erupted during October . . . . Crater 1 . . . continued to emit white steam that rose to 900 m above the crater. Weak ash emission was observed on 13 November, and glow from vents on the crater bottom was seen during fieldwork that night. The amplitude and number of volcanic tremor episodes increased in late October, reaching levels similar to September's and continuing at those levels through early November.
Geologic Background. The 24-km-wide Asosan caldera was formed during four major explosive eruptions from 300,000 to 90,000 years ago. These produced voluminous pyroclastic flows that covered much of Kyushu. The last of these, the Aso-4 eruption, produced more than 600 km3 of airfall tephra and pyroclastic-flow deposits. A group of 17 central cones was constructed in the middle of the caldera, one of which, Nakadake, is one of Japan's most active volcanoes. It was the location of Japan's first documented historical eruption in 553 CE. The Nakadake complex has remained active throughout the Holocene. Several other cones have been active during the Holocene, including the Kometsuka scoria cone as recently as about 210 CE. Historical eruptions have largely consisted of basaltic to basaltic-andesite ash emission with periodic strombolian and phreatomagmatic activity. The summit crater of Nakadake is accessible by toll road and cable car, and is one of Kyushu's most popular tourist destinations.
Information Contacts: JMA.
Eldey
Iceland
63.733°N, 23°W; summit elev. 70 m
All times are local (unless otherwise noted)
Strong seismicity; turbid water and hydrothermal area but no new lava detected
The following is a report from Páll Einarsson. "An intense earthquake swarm started on the N part of the Reykjanes Ridge on 30 October (figure 3). The first event recorded by seismographs in Iceland occurred at 1021 and had a magnitude of 3.5. Smaller events occurred at 1052 and 1152. The epicenters cannot be located accurately, but appear to be near 63°N, or ~180 km SW of Reykjavík. At 1229, activity in this area increased dramatically, and for the next 19 hours hundreds of earthquakes were recorded. The largest events approached M 5 and at least 14 were of M 4 or larger. For large parts of this time, the seismographs showed continuous motion due to the dense sequence of small and large earthquakes. However, motion resembling volcanic tremor could not be identified.
"The intense activity came to a rather abrupt halt at about 0800 on 31 October, but activity at a lower level continued, gradually diminishing. A temporary increase occurred 5-6 November (figure 4).
"A second swarm started 3 November closer to Iceland, near 63.7°N. It began at 1426 with an event of M 3.8. Thirty events were recorded in the area that day, and five events the following day. This swarm was small and short-lived, and probably unrelated to the first one.
"The question of whether or not the swarm at 63°N is related to intrusive or extrusive activity at the sea floor cannot be answered from the available seismic data. Earthquake swarms are common on the Reykjanes Ridge and its landward continuation on the Reykjanes Peninsula. None of the recent swarms on the peninsula have been accompanied by eruptive activity, and they do not resemble the seismic swarms that accompany magmatic intrusions in the Krafla area along the rift zone in NE Iceland. Intrusion tremor, commonly observed at Krafla, has not been recorded during the swarms on the Reykjanes Peninsula despite a relatively dense seismograph network there.
"The current swarm at 63°N is unusual in both intensity and duration. The large distance to the nearest seismograph (roughly 150 km) means that intrusion and extrusion tremor could have occurred without being observed. Some characteristics of the swarm - for example the slow beginning, the high density of events at its culmination, and the abrupt end - in some respects resemble those of some of the Krafla eruptive events. If an analogy is drawn, one could speculate that the intense part of the swarm accompanied an intrusion of magma and that a dyke propagated for 19 hours. If an eruption occurred, it most likely began at about 0800 on 31 October when the seismic activity suddenly dropped to a lower level. Eruptive activity may have ended on 5 November, when there was a temporary increase in earthquakes."
A U.S. Navy P3 aircraft overflew the swarm area on 2 November between 1000 and 1400. Five sonobuoys were deployed; the central sonobuoy (at 63°15'40"N, 24°11'52") detected 50 Hz noise at 97 dB; sound intensity at four others (~ 9 km N, S, E, and W) was about 85 dB.
The following is from Jón Olafsson. "In response to the earthquake swarm on the Reykjanes Ridge, an international team assembled in Reykjavík on 2 November, sailing at midnight on the RV Bjarni Saemundsson of Iceland's Marine Research Institute.
"Investigations were concentrated on the area of the ridge crest between 62.9°N and 63.3°N, where the water depth ranged from 100 to 500 m. The ship is equipped with echosounders, sonar, and a CTD (Conductivity-Temperature-Depth) + light transmissometer with a rosette for water column sampling. On board were sonobuoys (provided by the U.S. Navy), equipment for analysis of dissolved silica, and a bottom dredge. Signs of possible eruptive activity were sought by deployment of sonobuoys, and water sampling on sections along and to the sides of the ridge crest. No signs could be detected of explosive activity of the type that created Surtsey in 1963, which would have given rise to extensive silica anomalies. However, the water above a segment of the ridge centered at 63.1°N showed some anomalous properties, particularly decreased light transmissivity and water column stability. A hydrothermal region was discovered near the summit of a seamount in this region, but has most likely been there beforehand, judging from previous information from fishermen. On the afternoon of 5 November, two nearby earthquake shocks were felt on the ship. Reports of earthquakes also came from deep-sea trawlers in this region, confirming that the research effort was in the region of seismic activity. Twelve dredge hauls brought up some fresh basalts but none were newly erupted.
"The ship returned to Reykjavík on 6 November with water samples for analysis of helium isotopes, manganese, methane, and hydrogen. Processing of these samples and the instrument records will be conducted in the UK, Iceland, and USA."
Locations of four of the largest earthquakes in the swarm were determined at the U.S. National Earthquake Information Center on 4 November (table 2). Arrival time values were obtained from the NEIC database, and from two seismic stations in Iceland (~150 and 250 km from the epicentral area), reported by Páll Einarsson. The following is from Eric Bergman.
Table 2. Relocations of four large earthquakes from the Reykjanes Ridge swarm, 30-31 October 1990. Courtesy of Eric Bergman.
| Date |
Time |
Latitude |
Longitude |
Magnitude (mb) |
| 30 Oct 1990 |
1307 |
62.95 ± 0.08°N |
24.60 ± 0.07°W |
4.7 |
| 30 Oct 1990 |
1403 |
63.06 ± 0.06°N |
24.64 ± 0.07°W |
5.0 |
| 30 Oct 1990 |
1915 |
63.11 ± 0.08°N |
24.75 ± 0.10°W |
4.7 |
| 31 Oct 1990 |
0658 |
63.17 ± 0.06°N |
24.64 ± 0.07°W |
4.6 |
"The swarm events were relocated as part of a multiple-event relocation analysis for earthquakes on the Reykjanes Ridge between 62.5°N and 63.5°N. In all, 30 well-recorded earthquakes were relocated, using the hypocentroidal decomposition technique. Locations were estimated using the 1968 Herrin tables for P-wave travel times, except for the two Icelandic stations. Because the Herrin tables assume a thick continental crust, the theoretical travel times are longer than the true travel times for these phases, which propagate predominantly as refracted waves along the oceanic Moho with a velocity of around 8 km/s. Theoretical travel times for the two Icelandic stations were calculated by dividing the epicentral distance by 8.0 km/s. This admittedly crude estimate is a substantial improvement over the standard tables and is in good agreement with other data. No station corrections were used in the relocation. All focal depths were fixed at 10 km, consistent with many studies of the depth distribution of mid-ocean ridge seismicity. Further work is needed to refine this type of analysis, and it should be recognized that the locations reported here are to some extent biased by these assumptions. The results of the analysis will also change as more arrival data accumulate."
Reference. Perry, R.K., Fleming, H.S., Cherkis, N.Z., Feden, R.H., and Vogt, P.R., 1980, Bathymetry of the Norwegian-Greenland and western Barents Seas: U.S. Naval Research Laboratory-Acoustics Division, map and chart series MC-21
Geologic Background. The Eldey volcanic system is located on the northernmost part of the Reykjanes Ridge and is submarine with the exception of Eldey Island and the skerries (small rocky islands) Eldeyjardrangur, Geirfugladrangur, and Geirfuglasker. Maximum water depth within the system is about 250 m. Eldey has been moderately active in Holocene time. Characteristic activity consists of explosive submarine basaltic eruptions. Six small eruptions have been located within this system during the last 1,100 years, the last occurring in 1926 CE.
Information Contacts: P. Einarsson, Univ of Iceland; J. Olafsson, Marine Research Institute; E. Bergman, NEIC; P. Vogt, Naval Research Laboratory; T. Stroh, Univ of Washington. Scientific team on the RV Bjarni Saemundsson: Jón Olafsson, Icelandic Marine Research Institute (leader); Johnson R. Cann, Univ of Leeds (deputy leader); Kjartan Thors, S. Kristmansson, and Jón Benjaminsson, Icelandic Marine Research Institute; David Francis, Univ of Leeds; Cherry Walker, Univ of Durham; and Marie de Angelis, State Univ of New York, Stony Brook. Sponsoring Institutions: Icelandic Marine Research Institute; Natural Environmental Research Council, UK; and RIDGE Office, National Science Foundation, USA.
Etna
Italy
37.748°N, 14.999°E; summit elev. 3357 m
All times are local (unless otherwise noted)
Strombolian activity and lava fountaining from central craters; earthquakes and tremor; deformation
The following, from IIV, covers April-September 1990.
Summit crater activity. Eruptive activity was at Bocca Nuova and La Voragine, while only degassing was observed at the SE and NE subterminal craters. At the beginning of July, the mild degassing that had characterized the central vents during previous months evolved to Strombolian activity, sporadically ejecting juvenile products that reached the rim of Bocca Nuova. An intense eruptive episode began at Bocca Nuova on 7 August at about 1130, lasting for ~ 40 minutes. Strong Strombolian activity alternated with lava fountaining, producing a thick deposit (~10 cm maximum) of vesiculated scoria and Pele's Hair that accumulated on the N and NW sides of the crater rim. Wind carried lighter tephra 10 km NE, where it reached the villages of Vena and Presa (figure 38). Weak Strombolian activity followed, stopping early the next day. During the same period, La Voragine was limited to moderate Strombolian activity that stopped on 8 August. Increased tremor amplitude was recorded during the night of 7-8 August (see below), then tremor declined to low levels.
Collapse of part of the wall between Bocca Nuova and La Voragine 9-10 August produced a landslide deposit that covered pre-existing vents on Bocca Nuova's floor. This deposit was soon penetrated by explosive activity, which formed two new vents characterized by weak Strombolian activity.
Throughout this period, activity at the SE subterminal crater remained limited to degassing. However, a considerable enlargement of the vent was observed in June, accompanied by strong incandescence of the inner walls. The temperature of the fumarolic gas, measured 8 August, reached 615°C. By the end of August, a larger degassing vent (~ 10 m across) had formed on the crater floor where fumarolic activity had previously been most intense. This vent produced only strong gas emission, without explosive episodes. Activity at the summit craters was limited to degassing of variable intensity in September.
Fault seismicity. Seismicity alternated between phases of relative quiet (April-June, September) and moderate to intense activity (July-August).
Moderate activity April-June was broken by four seismic sequences that occurred 25 April, 17-18 May, and 1-2 and 30 June (figure 39b). Seismic energy release (figure 39a) was also moderate (maximum M 3.0 on 17 May) and a total of 101 shocks of M >= 1 were recorded. The April-May seismicity mainly affected the W sector of the volcano, with seismic activity moving to the E (Valle del Bove) and NE flanks in June (figure 40). Average focal depths were ~15 km, except for the 1 June sequence, which had a focal zone at a depth of <=10 km (figure 41).
During the next two months, the most significant seismic episodes took place on 3 and 8 July, and 27 August. These sequences plus a general increase in background activity caused a significant change in the slope of the cumulative strain release curve. Energy associated with single events remained moderate, never exceeding M 3.1. The total of 148 events recorded in July decreased to 97 in August. The upper NE flank (10-25 km depth) and the Valle del Bove (6-12 km depth) were the areas most affected.
Another seismic sequence (78 events of M >= 1) occurred on the NW flank on 3 September; the average calculated focal depth was about 24 ± 4 km. Seismic activity then returned to moderate levels for the rest of the month.
Volcanic tremor. During April, May, and the first part of June, volcanic tremor amplitude recorded at a reference station (ESP) on the S flank fluctuated from low to moderate values (7-20 mV/_Hz). Beginning in the second half of June, an amplitude increase was observed (20-30 mV/_Hz) that lasted until 7 August. During the night of 7-8 August, a sudden further increase in tremor amplitude coincided with the violent Strombolian activity from Bocca Nuova (see above). After this episode, tremor amplitude returned to low levels (5-8 mV/_Hz), remaining at similar values until the end of September.
Ground deformation. EDM measurements were performed on two geodimeter networks, on the S and SW flanks. The southern network was measured in June, about a year after the last measurement in May 1989. The area covered by the network includes part of the main fracture system that affected the SE flank during the September-October 1989 eruption (14:8-10). Comparisons between May 1989 and June 1990 data showed significant distance variations, mostly for lines in the higher altitude sector of the network. The resulting deformation pattern was characterized by a significant areal contraction. The deformation ellipse was strongly polarized with the minimum extension axis (contraction) trending approximately N29°E. The southwestern EDM network was reoccupied in July, showing only minor slope distance variations from the previous measurements in June 1989. A weak areal contraction was observed. The calculated deformation ellipse had a minimum extension axis (contraction) striking approximately N7°E.
Tilt data were collected at a biaxial borehole station (SPC) on the S flank, close to the ESP seismic station. Recording was interrupted early April-early June by vandalism. The radial component indicated continuous inflation of the volcanic edifice from the beginning of July until early September, closely paralleling the seismic strain release (figure 39a). During the same period, the tangential component remained nearly flat, showing fluctuations within the confidence limit of about ± 2 µrads.
Geologic Background. Mount Etna, towering above Catania on the island of Sicily, has one of the world's longest documented records of volcanism, dating back to 1500 BCE. Historical lava flows of basaltic composition cover much of the surface of this massive volcano, whose edifice is the highest and most voluminous in Italy. The Mongibello stratovolcano, truncated by several small calderas, was constructed during the late Pleistocene and Holocene over an older shield volcano. The most prominent morphological feature of Etna is the Valle del Bove, a 5 x 10 km caldera open to the east. Two styles of eruptive activity typically occur, sometimes simultaneously. Persistent explosive eruptions, sometimes with minor lava emissions, take place from one or more summit craters. Flank vents, typically with higher effusion rates, are less frequently active and originate from fissures that open progressively downward from near the summit (usually accompanied by Strombolian eruptions at the upper end). Cinder cones are commonly constructed over the vents of lower-flank lava flows. Lava flows extend to the foot of the volcano on all sides and have reached the sea over a broad area on the SE flank.
Information Contacts: IIV.
Farallon de Pajaros (United States) — October 1990 Cite this Report
Farallon de Pajaros
United States
20.546°N, 144.893°E; summit elev. 337 m
All times are local (unless otherwise noted)
Vigorous fuming
"Photographs taken by Civil Defense personnel in early August 1990 from a fixed-wing airplane showed vigorous fuming."
Geologic Background. The small 2-km-wide island of Farallon de Pajaros (also known as Uracas) is the northernmost and most active volcano of the Mariana Islands. Its relatively frequent eruptions dating back to the mid-19th century have caused the andesitic volcano to be referred to as the "Lighthouse of the western Pacific." The symmetrical, sparsely vegetated summit is the central cone within a small caldera cutting an older edifice, remnants of which are seen on the SE and southern sides near the coast. Flank fissures have fed lava flows that form platforms along the coast. Eruptions have been recorded from both summit and flank vents.
Information Contacts: R. Moore, USGS; R. Koyanagi and M. Sako, HVO.
Galeras (Colombia) — October 1990 Cite this Report
Galeras
Colombia
1.22°N, 77.37°W; summit elev. 4276 m
All times are local (unless otherwise noted)
Ash emitted; seismicity declines slightly
Seismicity decreased slightly during October. One high-frequency earthquake (M 2.8) was felt in Pasto (10 km E) on 5 October. Earthquakes were centered in distinct zones: under, NE, and E of the crater. Low-frequency earthquakes remained at low levels of occurrence and energy. Spasmodic tremor was variable, and was associated with ash emissions on 17 and 18 October.
Deformation measurements showed little change, although dry tiltmeters continued to show low levels of deformation with an inflationary trend. Electronic tilt 2 km E of the crater (Peladitos station) showed changes of 1-8 Nrad.
The SO2 flux, measured by COSPEC, decreased slightly from 2,378 t/d on 1 October, to 1,994 t/d at the end of the month.
Geologic Background. Galeras, a stratovolcano with a large breached caldera located immediately west of the city of Pasto, is one of Colombia's most frequently active volcanoes. The dominantly andesitic complex has been active for more than 1 million years, and two major caldera collapse eruptions took place during the late Pleistocene. Long-term extensive hydrothermal alteration has contributed to large-scale edifice collapse on at least three occasions, producing debris avalanches that swept to the west and left a large open caldera inside which the modern cone has been constructed. Major explosive eruptions since the mid-Holocene have produced widespread tephra deposits and pyroclastic flows that swept all but the southern flanks. A central cone slightly lower than the caldera rim has been the site of numerous small-to-moderate eruptions since the time of the Spanish conquistadors.
Information Contacts: INGEOMINAS-OVP.
Hargy (Papua New Guinea) — October 1990 Cite this Report
Hargy
Papua New Guinea
5.33°S, 151.1°E; summit elev. 1148 m
All times are local (unless otherwise noted)
Weak fumarolic emissions
"Weak fumarolic emissions were noted from the SE side of the W summit crater during an overflight in early September. No unusual activity was observed."
Geologic Background. This little-known volcano is one of several major calderas on the island of New Britain. The 10 x 12 km Hargy caldera, whose floor is 150 m above sea level, contains an inner caldera with a steep west-facing wall. A caldera lake on the SE side drains through a narrow gap in the northern caldera wall. The latest caldera-forming eruption of Hargy volcano took place about 11,000 years ago. The dacitic Galloseulo lava cone rises above and partially overtops the western rim of the caldera. A double crater occupies a larger 700-m-wide crater. Numerous small eruptions have taken place at Galloseulo over the past 7000 years, the last occurring about 1000 years ago.
Information Contacts: C. McKee and I. Itikarai, RVO.
Izu-Oshima (Japan) — October 1990 Cite this Report
Izu-Oshima
Japan
34.724°N, 139.394°E; summit elev. 746 m
All times are local (unless otherwise noted)
Seismicity and steam emission decline
Activity decreased, following ash emissions on 4 October . . . . Seismicity and steam emission declined rapidly following the 4 October activity, and no subsequent ash emissions had occurred as of 14 November. No tremor episodes were recorded during October.
Geologic Background. Izu-Oshima volcano in Sagami Bay, east of the Izu Peninsula, is the northernmost of the Izu Islands. The broad, low stratovolcano forms an 11 x 13 km island constructed over the remnants of three older dissected stratovolcanoes. It is capped by a 4-km-wide caldera with a central cone, Miharayama, that has been the site of numerous recorded eruptions datining back to the 7th century CE. More than 40 cones are located within the caldera and along two parallel rift zones trending NNW-SSE. Although it is a dominantly basaltic volcano, strong explosive activity has occurred at intervals of 100-150 years throughout the past few thousand years. A major eruption in 1986 produced spectacular lava fountains up to 1,600 m high and a 16-km-high eruption column; more than 12,000 people were evacuated from the island.
Information Contacts: JMA.
Kilauea (United States) — October 1990 Cite this Report
Kilauea
United States
19.421°N, 155.287°W; summit elev. 1222 m
All times are local (unless otherwise noted)
Lava continues to flow into sea; more homes destroyed
Lava . . . moved down the S flank and continued to enter the ocean during October (figure 73). At the beginning of the month, lava from a persistent tube system along the E side of the flow field formed a coastal front 750 m wide (in the Kaimu area; figure 72). The E margin of the flow advanced along the coast in front of the Kalapana Shores subdivision, which had been evacuated by the beginning of October. Lava breakouts destroyed two homes in the subdivision on 7 October. By mid-October, lava had nearly reached the W edge of the 1750 flow, > 500 m E of the former Kaimu Bay, and ocean entries were active along a front 1 km wide. A lava breakout from the flow's main ("Woodchip") tube at ~40 m elevation destroyed a home in the upper Kalapana Gardens subdivision on 15 October. A low to moderate number of intermediate-depth long-period earthquakes were evident from the beginning of the month. These peaked 6-7 October when almost 100 were counted, then subsided about 10 October.
Flows that emerged from the inflated area at the base of Kupaianaha's shield in early October moved down the W side of the flow field, the most active as channelized aa that reached relatively level terrain near the coast on 12 October. By the 15th, the distal end of the flow was pahoehoe and had advanced to below 30 m elevation. Less-active lobes of the same flow were observed upslope in Royal Gardens subdivision, but did not destroy any of the subdivision's remaining homes. Lava reached the ocean on 20 October along the W side of the flow field (near Kupapau Point) and was moving through newly formed tubes by the 22nd. A large lava breakout on the E side of the flow field destroyed another home in Kalapana Gardens on 19 October, while activity declined at the coast to only two small entries.
On 22 October a flurry of long-period events occurred between 0500 and 0800, averaging ~30/hour. Long-period seismicity increased again at about 2100, accompanied by summit tremor. The number of intermediate-depth long-period earthquakes, which had resumed in mid-October, peaked at about 380 on the 23rd. That day, lava movement viewed through a skylight at ~350 m elevation was slower than it had been in the past several weeks, and a decline in activity at all coastal entries was evident by 24 October. However, a new lobe from the E side of the flow field reached the ocean on the 24th (at Hakuma Point), an entry that remained intermittently active through early November, and lava that had moved through Royal Gardens in mid-October entered the sea 29 October on the W side of the flow field (just E of Wahaula). By 31 October, lava was flowing into the ocean at several points in the Wahaula area along a front 700 m wide, and the flow feeding this entry was moving through tubes upslope. . . . Intermediate-depth long-period seismicity declined from its peak on 23 October to a few tens of events/day at the end of the month, and dropped further in early November.
A lava pond was seen on 31 October in the base of Pu`u `O`o Crater, where a pair of lava ponds had been active in August and September. Lava at Kupaianaha remained deep in the vent and covered by a frozen crust.
Geologic Background. Kilauea overlaps the E flank of the massive Mauna Loa shield volcano in the island of Hawaii. Eruptions are prominent in Polynesian legends; written documentation since 1820 records frequent summit and flank lava flow eruptions interspersed with periods of long-term lava lake activity at Halemaumau crater in the summit caldera until 1924. The 3 x 5 km caldera was formed in several stages about 1,500 years ago and during the 18th century; eruptions have also originated from the lengthy East and Southwest rift zones, which extend to the ocean in both directions. About 90% of the surface of the basaltic shield volcano is formed of lava flows less than about 1,100 years old; 70% of the surface is younger than 600 years. The long-term eruption from the East rift zone between 1983 and 2018 produced lava flows covering more than 100 km2, destroyed hundreds of houses, and added new coastline.
Information Contacts: T. Moulds and P. Okubo, HVO.
Kusatsu-Shiranesan (Japan) — October 1990 Cite this Report
Kusatsu-Shiranesan
Japan
36.618°N, 138.528°E; summit elev. 2165 m
All times are local (unless otherwise noted)
Continued high seismicity but no surface changes
Seismicity has remained at high levels... (figure 4). During October, 213 earthquakes (up from 184 in September) and 29 tremor episodes... were recorded. Tremor amplitudes were similar to previous months. Earthquakes were centered 1 km E of... Yugama Crater. Seismicity remained similar as of 14 November. No changes in surface activity were observed.
Geologic Background. The Kusatsu-Shiranesan complex, located immediately north of Asama volcano, consists of a series of overlapping pyroclastic cones and three crater lakes. The andesitic-to-dacitic volcano was formed in three eruptive stages beginning in the early to mid-Pleistocene. The Pleistocene Oshi pyroclastic flow produced extensive welded tuffs and non-welded pumice that covers much of the E, S, and SW flanks. The latest eruptive stage began about 14,000 years ago. Historical eruptions have consisted of phreatic explosions from the acidic crater lakes or their margins. Fumaroles and hot springs that dot the flanks have strongly acidified many rivers draining from the volcano. The crater was the site of active sulfur mining for many years during the 19th and 20th centuries.
Information Contacts: JMA.
Langila (Papua New Guinea) — October 1990 Cite this Report
Langila
Papua New Guinea
5.525°S, 148.42°E; summit elev. 1330 m
All times are local (unless otherwise noted)
Occasional ash emission; explosion sounds; glow
"Activity returned to a low level in October . . . . Emissions from Crater 3 consisted mainly of occasional weak to moderate, white and grey, ash and vapour clouds. Deep, low, explosion and rumbling noises were heard on 6 and 7 October, respectively. Weak steady glow was observed on the 6th and the 9th. Activity at Crater 3 was somewhat subdued during the last week of October. Crater 2 released weak and occasionally moderate white and at times blue vapour throughout the month. Deep weak rumbling noises were heard between 16 and 28 October and steady weak glow was seen throughout the month."
Geologic Background. Langila, one of the most active volcanoes of New Britain, consists of a group of four small overlapping composite basaltic-andesitic cones on the lower E flank of the extinct Talawe volcano in the Cape Gloucester area of NW New Britain. A rectangular, 2.5-km-long crater is breached widely to the SE; Langila was constructed NE of the breached crater of Talawe. An extensive lava field reaches the coast on the N and NE sides of Langila. Frequent mild-to-moderate explosive eruptions, sometimes accompanied by lava flows, have been recorded since the 19th century from three active craters at the summit. The youngest and smallest crater (no. 3 crater) was formed in 1960 and has a diameter of 150 m.
Information Contacts: C. McKee and I. Itikarai, RVO.
Ol Doinyo Lengai (Tanzania) — October 1990 Cite this Report
Ol Doinyo Lengai
Tanzania
2.764°S, 35.914°E; summit elev. 2962 m
All times are local (unless otherwise noted)
Continued summit lava production from several vents
A group of scientists visited . . . 7-8 August, and were the first to reach the crater floor since June-July 1988.
"Considerable activity in the N crater was observed between March and August, concentrated around the centers T5/T9 and at the E end of the T4/T7 ridge (figure 18). No vent opened S of the saddle between the two craters (M1M2), but lava continued to flow S and the area of lava occupying the floor of the S depression increased slightly. Emission of steam and sulfur fumes continued, particularly N and E of the crater walls and E rim. No eruption of lava on the crater walls or rim had occurred since the formation of features C1, D, and the cluster of cones at A3/A5 (all pre-1988; 13:01). However, the top of T5/T9... reached the level of the E crater rim.
"At 0830 on 7 August, when the party... reached the E crater rim, shimmering heat was observed rising from the top of T5/T9, and there was noise like ocean surf from a small vent on the E end of T4/T7. There was an occasional spatter of fine fragments as lava splashed out of the top of T14.
"Two large cones, T14 and T14A, are located on the E edge of ridge T4/T7. On the N slope of T14A, younger, dark gray material was visible overlying the heavily weathered brown material that formed the surface of the ridge in May. When first seen at about 0830, T14 was pale gray to white, with a few small vertical cracks on its upper slopes. During the morning, the noise of moving lava continued, with some episodes of silence. By 1200, parts of the cone's top cracked and bulged when lava bubbles burst within it. Between 1240 and 1307, part of the upper slope of the cone collapsed and there was a relatively violent eruption from a SW-facing vent near the top of the cone. Liquid lava was ejected to 10 m above the top of the cone, and also spilled over the edge of the vent, 10 m above the surrounding crater floor.
"Vigorous activity continued for much of the afternoon; occasionally there were 7-10 bursts (sprays) of lava in a 20-second period. At times the lava was thrown up from the vent, and at others it surged over the edge. Periodically, three separate tongues of lava were visible, following each other down the slope of the cone. The flows did not extend any distance away from the base of the cone, and the volumes of lava erupted were very small. After about 1500, the rate of activity gradually slowed, but it continued until at least 1900, when several large clots of lava were thrown as much as 40 m W of T14 (onto the slopes of T14A). Observation ceased at about 2000 and resumed at 0730 on 8 August. Little overnight change was apparent. On the morning of the 8th, moving lava was audible deep below T14, shimmering heat rose from the open vent of T14A, and steam came from the W end of T4/T7 (the oldest part of this feature).
"The tallest cone, T5/T9, extended up 30 m to a single peak, without a large open vent. It had not changed since the 9 July overflight. The slopes were mostly pale grey to white, with slight darkening by fumes at the very top, from which shimmering heat was rising. An open vent over 2 m across (H6) was still visible on the N slope of T5/T9, but there was no sign of activity.
"A low dome or 'blister,' T15, was located a few meters from H6 and... was the source of shimmering heat and noise of moving lava. A flow (F18), that had escaped N and W from this vent had reached the W wall of the crater (probably within 1 or 2 days of the 7 August visit). This flow was smooth, mostly dark brown, and still slightly warm on the 7th; cracking sounds could still be heard from below its surface.
"Cone T10 was almost entirely covered by lava from T5/T9;
"No sign of new effusion was visible at cones T8 or T11. The upper slopes of T8 were stained by considerable amounts of sulfur, and partial collapse of a small section of its lower W slope had occurred. Steam and sulfur fumes were being emitted from T11. In the center of the cone, a hole 2 m across (base not visible) contained bright yellow-orange stalactites, some >50 cm long. The overhanging N slope of the cone had not changed much since late 1988.
"Strong fumaroles were found on the W wall (around D and A5), on the N wall (near C1), and on the E wall, where extensive sulfur staining was present. Small steam sources were also found on the walls of the S depression. In general, emission of steam was very strong . . . .
"The saddle between the two craters, M1/M2, had possibly widened with increased flow of lava from N to S. No vents have opened in the S depression. Patches of burned vegetation have resulted on the S slopes, probably set afire by the heat from lava when it flowed against the surrounding slope, as observed in November 1988."
Geologic Background. The symmetrical Ol Doinyo Lengai is the only volcano known to have erupted carbonatite tephras and lavas in historical time. The prominent stratovolcano, known to the Maasai as "The Mountain of God," rises abruptly above the broad plain south of Lake Natron in the Gregory Rift Valley. The cone-building stage ended about 15,000 years ago and was followed by periodic ejection of natrocarbonatitic and nephelinite tephra during the Holocene. Historical eruptions have consisted of smaller tephra ejections and emission of numerous natrocarbonatitic lava flows on the floor of the summit crater and occasionally down the upper flanks. The depth and morphology of the northern crater have changed dramatically during the course of historical eruptions, ranging from steep crater walls about 200 m deep in the mid-20th century to shallow platforms mostly filling the crater. Long-term lava effusion in the summit crater beginning in 1983 had by the turn of the century mostly filled the northern crater; by late 1998 lava had begun overflowing the crater rim.
Information Contacts: C. Nyamweru, Kenyatta Univ.
Manam (Papua New Guinea) — October 1990 Cite this Report
Manam
Papua New Guinea
4.08°S, 145.037°E; summit elev. 1807 m
All times are local (unless otherwise noted)
Weak vapor emission; earthquakes decline
"Activity declined further in October. Both craters intermittently released very weak emissions of thin white vapour. No noises or glow were observed from either crater. The decline in daily earthquake totals . . . continued in October and by the end of the month averaged only ~150 (compared to ~1,200 during former inter-eruptive periods). The amplitude of these events also decreased to a very low level. No significant changes were observed in tilt measurements."
Geologic Background. The 10-km-wide island of Manam, lying 13 km off the northern coast of mainland Papua New Guinea, is one of the country's most active volcanoes. Four large radial valleys extend from the unvegetated summit of the conical basaltic-andesitic stratovolcano to its lower flanks. These valleys channel lava flows and pyroclastic avalanches that have sometimes reached the coast. Five small satellitic centers are located near the island's shoreline on the northern, southern, and western sides. Two summit craters are present; both are active, although most observed eruptions have originated from the southern crater, concentrating eruptive products during much of the past century into the SE valley. Frequent eruptions, typically of mild-to-moderate scale, have been recorded since 1616. Occasional larger eruptions have produced pyroclastic flows and lava flows that reached flat-lying coastal areas and entered the sea, sometimes impacting populated areas.
Information Contacts: C. McKee and I. Itikarai, RVO.
Mikura Seamount (Japan) — October 1990 Cite this Report
Mikura Seamount
Japan
33.725°N, 139.408°E; summit elev. -321 m
All times are local (unless otherwise noted)
Three bursts of seismicity near Mikura Seamount
A swarm of earthquakes began at 0624 on 5 October 1990, in the sea ~20 km SW of Mikura-jima Island (figure 3). A second burst occurred 13 October, following a gradual decline from the 5th, and a third burst occurred on 21 October (figure 4). A total of about 30 shocks were felt by residents on Mikura-jima and nine were felt on Miyake-jima Island (at Miyake-jima Weather Station), ~40 km NNE of the epicentral area. The largest event was M 4.3 and occurred on 27 October. Depths of most of the located events ranged from 20 to 30 km, although depth control was poor.
The swarm occurred in the vicinity of Mikura Seamount, a cone-shaped feature with a summit ~300 m below sea level and 1,400 m above the surrounding sea floor. No surface phenomena were reported in the area in October, nor have any been reported in historical time. The last swarm near this site took place in December 1982, and was more vigorous, including one M 6.4 event.
Information Contacts: JMA.
Pagan (United States) — October 1990 Cite this Report
Pagan
United States
18.13°N, 145.8°E; summit elev. 570 m
All times are local (unless otherwise noted)
Strong SO2-rich plume but no significant deformation or earthquake activity
A seven-member team of USGS volcanologists visited the CNMI 24 September-6 October at the request of the Office of Civil Defense. The team installed [a seismic station on] Pagan; data are telemetered to Saipan and recorded at Civil Defense headquarters. Quoted material below is from a report by Richard Moore.
"Remeasurements of the distances between two permanent glass reflectors installed in 1983 on the SW flank showed no significant changes in line lengths since 1984. Seismic data telemetered to Saipan showed no significant earthquake activity on Pagan after installation of the station in early October. Most of the abandoned village has been destroyed by alluvial debris derived from 1981 and younger rocks. Eruptions less vigorous than that of 15 May 1981 occurred intermittently from late May 1981 until October 1988. The USGS team observed a prominent SO2-bearing plume emitted from Pagan 28 September-3 October."
Geologic Background. Pagan Island, the largest and one of the most active of the Mariana Islands volcanoes, consists of two stratovolcanoes connected by a narrow isthmus. Both North and South Pagan stratovolcanoes were constructed within calderas, 7 and 4 km in diameter, respectively. North Pagan at the NE end of the island rises above the flat floor of the northern caldera, which may have formed less than 1,000 years ago. South Pagan is a stratovolcano with an elongated summit containing four distinct craters. Almost all of the recorded eruptions, which date back to the 17th century, have originated from North Pagan. The largest eruption during historical time took place in 1981 and prompted the evacuation of the sparsely populated island.
Information Contacts: R. Moore, USGS; R. Koyanagi and M. Sako, HVO.
Poas (Costa Rica) — October 1990 Cite this Report
Poas
Costa Rica
10.2°N, 84.233°W; summit elev. 2697 m
All times are local (unless otherwise noted)
Fumarolic activity and seismicity continue; minor inflation
Vigorous fumarolic activity continued during October. The crater lake level, which had been dropping during August and September, rose 2 m due to heavy rainfall, but began to fall again at the end of the month. Fumarolic activity within the lake remained similar to previous months; in the SE part of the lake, a small pool of sulfur remained visible. Temperatures of up to 80°C were recorded in the crater lake, 17°C in the peripheral cold water springs, and 91°C from the 1953-55 dome fumaroles. On 13 September, rain water had a pH of 2.7 at the dome and 3.2 at the crater rim.
Daily averages of 250 low-frequency earthquakes (<2.5 Hz) were recorded, similar to levels in May. A maximum of 373 events was recorded 28 October (figure 34). High-frequency earthquakes were rare. Only three were locatable (M 2.2-2.6), the largest felt by local residents. Short tremor episodes (<6 hour durations), less frequent than in August and September, were also occasionally recorded.
Periodic S radial inflation was measured in 1990 through early November (figure 35); the general trend was one of minor inflation relative to the 1989 baseline. Inflation in April-May coincided with eruptions of sediment from the bottom of the lake. Deformation measurements by EDM (1 km S of the crater) registered several different inflationary peaks that geologists believed were influenced by local disturbances such as subsoil water or changes in temperature.
Geologic Background. The broad vegetated edifice of Poás, one of the most active volcanoes of Costa Rica, contains three craters along a N-S line. The frequently visited multi-hued summit crater lakes of the basaltic-to-dacitic volcano are easily accessible by vehicle from the nearby capital city of San José. A N-S-trending fissure cutting the complex stratovolcano extends to the lower N flank, where it has produced the Congo stratovolcano and several lake-filled maars. The southernmost of the two summit crater lakes, Botos, last erupted about 7,500 years ago. The more prominent geothermally heated northern lake, Laguna Caliente, is one of the world's most acidic natural lakes, with a pH of near zero. It has been the site of frequent phreatic and phreatomagmatic eruptions since an eruption was reported in 1828. Eruptions often include geyser-like ejections of crater-lake water.
Information Contacts: J. Barquero, V. Barboza, E. Fernández, and R. van der Laat, OVSICORI; G. Soto and R. Barquero, ICE.
Rabaul (Papua New Guinea) — October 1990 Cite this Report
Rabaul
Papua New Guinea
4.2459°S, 152.1937°E; summit elev. 688 m
All times are local (unless otherwise noted)
Seismicity remains low; no significant deformation
"Seismicity remained at a low level in October. The total number of events recorded was 101 . . . . All events were of ML <=1. Only two were locatable, on the N and W sides of the caldera seismic zone. No significant changes were observed from levelling, EDM, tilt, tide gauge, and gravity measurements."
Geologic Background. The low-lying Rabaul caldera on the tip of the Gazelle Peninsula at the NE end of New Britain forms a broad sheltered harbor utilized by what was the island's largest city prior to a major eruption in 1994. The outer flanks of the asymmetrical shield volcano are formed by thick pyroclastic-flow deposits. The 8 x 14 km caldera is widely breached on the east, where its floor is flooded by Blanche Bay and was formed about 1,400 years ago. An earlier caldera-forming eruption about 7,100 years ago is thought to have originated from Tavui caldera, offshore to the north. Three small stratovolcanoes lie outside the N and NE caldera rims. Post-caldera eruptions built basaltic-to-dacitic pyroclastic cones on the caldera floor near the NE and W caldera walls. Several of these, including Vulcan cone, which was formed during a large eruption in 1878, have produced major explosive activity during historical time. A powerful explosive eruption in 1994 occurred simultaneously from Vulcan and Tavurvur volcanoes and forced the temporary abandonment of Rabaul city.
Information Contacts: C. McKee and I. Itikarai, RVO.
Redoubt (United States) — October 1990 Cite this Report
Redoubt
United States
60.485°N, 152.742°W; summit elev. 3108 m
All times are local (unless otherwise noted)
Minor gas/ash emissions and tremor
The following report covers the period 1 August-12 November. "The last explosive event at Redoubt, on 21 April, generated an ash plume to 7.5-9 km and a small N flank pyroclastic flow. A portion of the existing lava dome was destroyed during this event. Dome growth continued until approximately mid-June, punctuated only by occasional small rockfalls off the dome's N face. The estimated volume of the current lava dome is 10-15 x 106 m3. Field crews have observed consistent fumarolic activity from the dome's S side, summit, and E and W margins. An early September search for high-temperature fumaroles on the dome's accessible N face was unsuccessful. COSPEC measurements documented a steady decline in SO2 emission from an average of 1,000-2,400 t/d in early August to 160-590 t/d in October and early November.
"Seismicity beneath Redoubt diminished over the summer and into the fall, but remained elevated relative to pre-eruption levels. In early November, low-level tremor was observed for the first time since April, associated with increased steaming on the lava dome and occasional minor steam and ash emissions.
October steam and ash emissions. "Beginning in late August, AVO seismologists noted intermittent bursts of seismicity containing multiple phases and extended codas on flank stations. These bursts occurred at rates of one to several/day, but no relationship between them and eruptive activity was established until 29 October, when AVO received a pilot report of ash on the snow-covered flanks of Redoubt. The ash deposit was thin (< 0.5 mm) and did not extend beyond the base of the volcano (a lateral distance of about 5 km). The deposit must have been emplaced since 27 October, the date of last overflight prior to the pilot report. On 30 October at 1637, a small seismic event lasting 7-8 minutes was recorded on flank stations. Within 30 minutes, personnel at the Drift River oil terminal and an AVO crew in a helicopter reported a small, diffuse ash cloud drifting E of the summit. The cumulative tephra deposit from the late October events is very fine-grained, consisting primarily of plagioclase and a minor amount of altered and unaltered mafic crystals.
"The steam and ash emissions have thus far produced plumes that rise at most 300-600 m above the summit, and only minor amounts of ash have been deposited outside the summit crater. They are reminiscent of the 'gas and ash emissions' documented at Mt. St. Helens between 1981 and 1986, and are interpreted to reflect increasing access of meltwater to hot interior dome rocks. Their onset in late summer approximately coincided with the beginning of snowfall high on the volcano and may reflect some seasonal control related to the increasing availability of snowmelt. Alternatively, the quiescent dome may have cooled and fractured sufficiently to allow ingress of greater amounts of water to its hot interior.
Early November seismo-phreatic crisis. "On 5 November, AVO seismologists noted low-amplitude tremor on flank stations. During the next week, tremor fluctuated in intensity several times. More intense periods appeared to follow the 'emissions' described above. No concurrent change was observed in the occurrence of long-period events or volcano-tectonic earthquakes.
"Observations of the dome from fixed wing aircraft 6-8 November revealed no sign of avalanching or large-scale changes in dome morphology. Fumarolic activity appeared heightened compared to the previous week and new steaming was observed on the dome's N flank.
"An 8 November COSPEC flight measured SO2 emission of 580 t/d, consistent with results of the past few weeks. Continuing phreatic activity, in the form of steam emissions that occasionally contain ash, is expected."
Further Reference. Brantley, S., ed., 1990, The eruption of Redoubt volcano, Alaska, December 14, 1989-August 31, 1990: USGS Circular 1061, 33 p.
Geologic Background. Redoubt is a glacier-covered stratovolcano with a breached summit crater in Lake Clark National Park about 170 km SW of Anchorage. Next to Mount Spurr, Redoubt has been the most active Holocene volcano in the upper Cook Inlet. The volcano was constructed beginning about 890,000 years ago over Mesozoic granitic rocks of the Alaska-Aleutian Range batholith. Collapse of the summit 13,000-10,500 years ago produced a major debris avalanche that reached Cook Inlet. Holocene activity has included the emplacement of a large debris avalanche and clay-rich lahars that dammed Lake Crescent on the south side and reached Cook Inlet about 3,500 years ago. Eruptions during the past few centuries have affected only the Drift River drainage on the north. Historical eruptions have originated from a vent at the north end of the 1.8-km-wide breached summit crater. The 1989-90 eruption had severe economic impact on the Cook Inlet region and affected air traffic far beyond the volcano.
Information Contacts: AVO Staff.
Ruapehu (New Zealand) — October 1990 Cite this Report
Ruapehu
New Zealand
39.28°S, 175.57°E; summit elev. 2797 m
All times are local (unless otherwise noted)
Crater Lake temperatures rise then fall; seismicity remains low; deflation
Fieldwork on 11 and 26 September, and 9 October, monitored changes in deformation and in Crater Lake. The lake appeared gray, with upwelling occurring over the N vents during all three visits, over the central vents on 11 September (when visibility was poor), and on rare occasions on 9 October. Yellow slicks were observed over the central vents on 26 September and 9 October. Undercutting of snow along the shore of the lake (around 1 m above lake level) and the wide channel cut through snow at the outlet, suggested that a surge (potentially related to minor phreatic activity) had occurred sometime before new snow (which may have fallen on 8 September) re-covered part of the exposed area.
Water temperatures increased to a maximum of 35°C by the end of September ... then decreased to 31°C by 9 October (figure 9). Lake Mg/Cl ratios were 0.052 on 26 September and 0.053 on 9 October, slightly higher than 22 August (0.051).
Seismicity has remained at very low levels since late August. A few small earthquakes (M <= 2.5) were recorded (instrument failure prevented monitoring 28 September-3 October). Tremor amplitude was low, except on 14-15 September when moderate amplitudes were recorded (figure 10).
Deformation measurements showed that the decrease in crater width that began in early September continued through early October, although distances had not yet returned to pre-inflation, early July values (figures 9 and 11).
Geologic Background. Ruapehu, one of New Zealand's most active volcanoes, is a complex stratovolcano constructed during at least four cone-building episodes dating back to about 200,000 years ago. The dominantly andesitic 110 km3 volcanic massif is elongated in a NNE-SSW direction and surrounded by another 100 km3 ring plain of volcaniclastic debris, including the NW-flank Murimoto debris-avalanche deposit. A series of subplinian eruptions took place between about 22,600 and 10,000 years ago, but pyroclastic flows have been infrequent. The broad summait area and flank contain at least six vents active during the Holocene. Frequent mild-to-moderate explosive eruptions have been recorded from the Te Wai a-Moe (Crater Lake) vent, and tephra characteristics suggest that the crater lake may have formed as recently as 3,000 years ago. Lahars resulting from phreatic eruptions at the summit crater lake are a hazard to a ski area on the upper flanks and lower river valleys.
Information Contacts: B. Scott and I. Nairn, DSIR Rotorua; P. Otway and S. Sherburn, DSIR Wairakei; J. Allen and R. O'Brien, Dept of Conservation, Whakapapa.
Nevado del Ruiz (Colombia) — October 1990 Cite this Report
Nevado del Ruiz
Colombia
4.892°N, 75.324°W; summit elev. 5279 m
All times are local (unless otherwise noted)
Small ash emissions and seismicity
Many small ash emissions occurred during October, although seismicity remained at low levels. Two small swarms of high-frequency earthquakes were recorded on 14 and 22 October. Tremor episodes (2 cm2 maximum reduced displacement) were prominent and were occasionally associated with small ash emissions. Although EDM measurements showed important changes, dry-tilt did not show ground deformation. Similarly, EDM indicated 6.6 µrad of deformation at one station during September, while dry-tilt did not show any significant changes. The average SO2 flux for the month, measured by COSPEC, was 1,630 t/d, compared to 2,448 t/d in September.
Geologic Background. Nevado del Ruiz is a broad, glacier-covered volcano in central Colombia that covers more than 200 km2. Three major edifices, composed of andesitic and dacitic lavas and andesitic pyroclastics, have been constructed since the beginning of the Pleistocene. The modern cone consists of a broad cluster of lava domes built within the caldera of an older edifice. The 1-km-wide, 240-m-deep Arenas crater occupies the summit. The prominent La Olleta pyroclastic cone located on the SW flank may also have been active in historical time. Steep headwalls of massive landslides cut the flanks. Melting of its summit icecap during historical eruptions, which date back to the 16th century, has resulted in devastating lahars, including one in 1985 that was South America's deadliest eruption.
Information Contacts: C. Carvajal, INGEOMINAS, Manizales.
St. Helens (United States) — October 1990 Cite this Report
St. Helens
United States
46.2°N, 122.18°W; summit elev. 2549 m
All times are local (unless otherwise noted)
Explosion from N side of lava dome; ash plume and small mudflow
At 0207 on 5 November, the start of a brief explosive episode and ash emission was signalled by 2 minutes of low-amplitude seismicity, followed by an increase to high-amplitude seismicity and the failure of several sensors on the summit dome. Pilots reported the plume at altitudes of ~7.5-9 km traveling SE at 90-110 km/hr; ash was reported as far as Fossil, Oregon (~200 km SE). Strong seismicity lasted for 6 minutes, then decreased to normal levels over the following 2-3 hours.
Geologists visiting the crater that day found that the explosive activity took place at a vent on the N side of the lava dome. Two seismic stations and a steel tower were destroyed, but others continued to function. Hot dome blocks and finer-grained material blanketed the snow on the crater floor, NW and N of the dome; blocks up to 2 m in diameter were scattered on the lower part of the W crater wall (NW of the dome). Rock avalanches and hot debris from the explosions moved down the N side of the dome and across the crater floor, abrading and melting snow and ice. The resultant small debris flow traveled out of the crater into the North Fork of the Toutle River, where it formed a small mudflow that extended 16-19 km.
Fine tephra was collected from the extreme limit of deposition, but had not yet been analyzed at press time. Small quantities of fresh-appearing glass had been found in tephra emitted on 6 January (SEAN 14:12).
No precursory events to the 5 November activity have been identified, although two distinctive "cigar-shaped" events (closely spaced, small, shallow earthquakes with concurrent tremor) lasting several hours were recorded 25 and 26 October. Similar signals were associated with the 6 January ash emission, and were recorded 24 September, when no ash was emitted. These signals have been identified at Old Faithful Geyser (Yellowstone Caldera, USA), and Ruiz (Colombia), where they are thought to represent hydrothermal venting or near-surface movement of fluids.
The 5 November ash emission was very similar to the previous explosive events on [6] December and 6 January (SEAN 14:11 and 14:12). An event on 25 April produced similar explosion-type seismic signals, but bad weather prevented observations and no ash or eruption plume was reported (BGVN 15:04). Each of the events was short-lived (up to 18 hours) and produced little ash. Although the January episode also caused rock and snow avalanches, the November activity was the first to produce a mudflow in the last two years.
Geologic Background. Prior to 1980, Mount St. Helens was a conical volcano sometimes known as the Fujisan of America. During the 1980 eruption the upper 400 m of the summit was removed by slope failure, leaving a 2 x 3.5 km breached crater now partially filled by a lava dome. There have been nine major eruptive periods beginning about 40-50,000 years ago, and it has been the most active volcano in the Cascade Range during the Holocene. Prior to 2,200 years ago, tephra, lava domes, and pyroclastic flows were erupted, forming the older edifice, but few lava flows extended beyond the base of the volcano. The modern edifice consists of basaltic as well as andesitic and dacitic products from summit and flank vents. Eruptions in the 19th century originated from the Goat Rocks area on the N flank, and were witnessed by early settlers.
Information Contacts: W. Scott and S. Brantley, CVO; SAB.
Stromboli (Italy) — October 1990 Cite this Report
Stromboli
Italy
38.789°N, 15.213°E; summit elev. 924 m
All times are local (unless otherwise noted)
Strong tephra ejection; increased seismicity
At the end of August, explosive activity in Crater 1 became nearly continuous and tremor amplitude increased. The monthly average tremor amplitude was twice as high in September as in August. The daily number of events that saturated seismometers oscillated around a mean of 30 until 20 September before rapidly decreasing (figure 9). Saturating events and tremor amplitude reached a minimum during the first week in October, then remained at levels similar to those preceding the strong activity in the second half of July.
Volcano guides reported the following activity. 1-6 September: Ejection of hot lapilli was continuous from vents 1 and 2 in crater C1 (figure 10). Violent explosions with ash emission (150-200 m high) occurred from C3. 7-12 September: Activity was similar from C1 and C3. Block ejection and gas emission took place from C2. 13-20 September: Ejection of hot lapilli and noisy gas emission occurred from C1, while continuous minor explosions ejected small blocks from C2. Tephra was filling C3, where 4 new vents were forming on 15 September. 21 September-4 October: Most activity was concentrated in C1 and C3, with frequent explosions ejecting hot lapilli to as high as 200 m.
Geologists visited the summit area 4-10 October. The activity was more vigorous than had been seen during 25 years of study at Stromboli. Strong explosions at 15-20-minute intervals fed powerful brown ash emissions that reached about 300 m height (from vent 4 of C3). Nearly continuous bomb ejection from vent 1 of C1 was evident at night and gases were red. Stronger explosions were synchronous from many of the vents in the 3 craters. Lava spilled out every few tenths of a second from one small cone (1) in C3. One vent (3) in C1 ejected gas nearly every second. Fumarolic activity was very intense, especially from the W rim of C3. At least 3 new vents had formed (3 in C1 and 2 & 3 in C3) with continuous whistling and rare explosions.
11-16 October: Activity continued, but with an apparent slight decline. 17-28 October: Observations from the summit area were not available, but seismicity and reports from a village at the foot of the volcano suggested decreasing activity.
Geologic Background. Spectacular incandescent nighttime explosions at Stromboli have long attracted visitors to the "Lighthouse of the Mediterranean" in the NE Aeolian Islands. This volcano has lent its name to the frequent mild explosive activity that has characterized its eruptions throughout much of historical time. The small island is the emergent summit of a volcano that grew in two main eruptive cycles, the last of which formed the western portion of the island. The Neostromboli eruptive period took place between about 13,000 and 5,000 years ago. The active summit vents are located at the head of the Sciara del Fuoco, a prominent scarp that formed about 5,000 years ago due to a series of slope failures which extends to below sea level. The modern volcano has been constructed within this scarp, which funnels pyroclastic ejecta and lava flows to the NW. Essentially continuous mild Strombolian explosions, sometimes accompanied by lava flows, have been recorded for more than a millennium.
Information Contacts: M. Riuscetti, Univ di Udine.
Ulawun (Papua New Guinea) — October 1990 Cite this Report
Ulawun
Papua New Guinea
5.05°S, 151.33°E; summit elev. 2334 m
All times are local (unless otherwise noted)
Vapor emission; weak seismicity
"Activity remained at a low level in October. Emissions from the summit crater consisted mainly of white vapour released at moderate rates. Seismic activity remained at a very low level."
Geologic Background. The symmetrical basaltic-to-andesitic Ulawun stratovolcano is the highest volcano of the Bismarck arc, and one of Papua New Guinea's most frequently active. The volcano, also known as the Father, rises above the N coast of the island of New Britain across a low saddle NE of Bamus volcano, the South Son. The upper 1,000 m is unvegetated. A prominent E-W escarpment on the south may be the result of large-scale slumping. Satellitic cones occupy the NW and E flanks. A steep-walled valley cuts the NW side, and a flank lava-flow complex lies to the south of this valley. Historical eruptions date back to the beginning of the 18th century. Twentieth-century eruptions were mildly explosive until 1967, but after 1970 several larger eruptions produced lava flows and basaltic pyroclastic flows, greatly modifying the summit crater.
Information Contacts: C. McKee and I. Itikarai, RVO.
Unzendake (Japan) — October 1990 Cite this Report
Unzendake
Japan
32.761°N, 130.299°E; summit elev. 1483 m
All times are local (unless otherwise noted)
Small gas/ash eruption follows several months of increased seismicity
Seismicity increased during October, with a monthly total of 549 recorded events (up from 251 in September); 15 shocks were felt 3.9 km SW of the volcano (at UWS). Earthquake swarms occurred on the 17th, 23rd, and 31st, and during the night of 13-14 November, when four shocks were felt at the weather station. Epicenters were located roughly in two groups, one in the central part of the Shimabara peninsula, the other in the sea about 15 km W of the summit (figure 6). The seismicity in the central part of the peninsula was the first there since July. Previous swarms were generally centered at sea.
Tremor resumed on 10 October after 20 days of absence, and as many as 10 episodes/day were recorded through the end of the month. The monthly total of 81 tremor episodes was an increase from 42 in September. Tremor amplitudes were similar to previous months.
Weak, continuous tremor started on seismographs near the volcano at 0322 on 17 November. By dawn (around 0600), an eruption had already begun and residents saw a white plume rising from the volcano; the exact start time of the eruption was unknown. An air and ground survey by JMA and Kyushu Univ revealed that two steam plumes were being continuously erupted from new E flank vents; one was [650] m E of the summit (Fugen-dake), the other about 100 m S of the first vent. The steam plumes were about 300 m high and occasionally contained ash. Weak ashfall was noted downwind. No explosion sounds were heard, and no clear shocks were recorded by seismographs. The amplitude of continuous tremor gradually declined during the day, fading away at around 1900. Steam was still being erupted from one of the vents the next day, and was continuing, but declining, through 19 November. Seismicity was unchanged after the eruption. No damage was reported.
Geologic Background. The massive Unzendake volcanic complex comprises much of the Shimabara Peninsula east of the city of Nagasaki. An E-W graben, 30-40 km long, extends across the peninsula. Three large stratovolcanoes with complex structures, Kinugasa on the north, Fugen-dake at the east-center, and Kusenbu on the south, form topographic highs on the broad peninsula. Fugendake and Mayuyama volcanoes in the east-central portion of the andesitic-to-dacitic volcanic complex have been active during the Holocene. The Mayuyama lava dome complex, located along the eastern coast west of Shimabara City, formed about 4000 years ago and was the source of a devastating 1792 CE debris avalanche and tsunami. Historical eruptive activity has been restricted to the summit and flanks of Fugendake. The latest activity during 1990-95 formed a lava dome at the summit, accompanied by pyroclastic flows that caused fatalities and damaged populated areas near Shimabara City.
Information Contacts: JMA.
Whakaari/White Island (New Zealand) — October 1990 Cite this Report
Whakaari/White Island
New Zealand
37.52°S, 177.18°E; summit elev. 294 m
All times are local (unless otherwise noted)
Strong thermal activity but no new eruptions
During a brief 17 October visit to the rim of 1978/90 Crater complex, white steam emissions were relatively voluminous. A lake had been re-established in the SE portion (R.F. Crater). The vent observed 3 October under the SW wall was apparently still present, although viewing conditions were poor. The margins of TV1 Crater appeared unchanged, and it was emitting white steam at low pressure. Strong, audible fumaroles were present in the area NW of the 20-m-high non-extrusive rock spine (first seen on 30 August and located 15 m W of TV1 Crater), where transparent vapors emerged from the crater floor, condensing to white steam above. East of 1978/90 Crater, Donald Duck vent was emitting wispy white vapor and its floor and vent area were clearly visible.
There was no evidence for further eruptive activity since 3 October from within 1978/90 Crater, TV1 Crater, or Donald Duck Crater.
Geologic Background. The uninhabited Whakaari/White Island is the 2 x 2.4 km emergent summit of a 16 x 18 km submarine volcano in the Bay of Plenty about 50 km offshore of North Island. The island consists of two overlapping andesitic-to-dacitic stratovolcanoes. The SE side of the crater is open at sea level, with the recent activity centered about 1 km from the shore close to the rear crater wall. Volckner Rocks, sea stacks that are remnants of a lava dome, lie 5 km NW. Descriptions of volcanism since 1826 have included intermittent moderate phreatic, phreatomagmatic, and Strombolian eruptions; activity there also forms a prominent part of Maori legends. The formation of many new vents during the 19th and 20th centuries caused rapid changes in crater floor topography. Collapse of the crater wall in 1914 produced a debris avalanche that buried buildings and workers at a sulfur-mining project. Explosive activity in December 2019 took place while tourists were present, resulting in many fatalities. The official government name Whakaari/White Island is a combination of the full Maori name of Te Puia o Whakaari ("The Dramatic Volcano") and White Island (referencing the constant steam plume) given by Captain James Cook in 1769.
Information Contacts: B. Scott, DSIR, Rotorua; S. Sherburn, DSIR, Wairakei.
Witori (Papua New Guinea) — October 1990 Cite this Report
Witori
Papua New Guinea
5.5745°S, 150.5161°E; summit elev. 724 m
All times are local (unless otherwise noted)
Mild summit and flank fumarolic activity
"Emissions from the summit crater were very weak during an overflight in early September. Mild fumarolic emissions were noted from the NW flank of Pago."
Geologic Background. The active Pago cone has grown within the Witori caldera (5.5 x 7.5 km) on the northern coast of central New Britain contains the active Pago cone. The gently sloping outer caldera flanks consist primarily of dacitic pyroclastic-flow and airfall deposits produced during a series of five major explosive eruptions from about 5,600 to 1,200 years ago, many of which may have been associated with caldera formation. Pago cone may have formed less than 350 years ago; it has grown to a height above the caldera rim, and a series of ten dacitic lava flows from it covers much of the caldera floor. The youngest of these was erupted during 2002-2003 from vents extending from the summit nearly to the NW caldera wall. The Buru caldera cuts the SW flank.
Information Contacts: C. McKee and I. Itikarai, RVO.