Recently Published Bulletin Reports
Kadovar (Papua New Guinea) An ash plume and weak thermal anomaly during May 2023
San Miguel (El Salvador) Small gas-and-ash explosions during March and May 2023
Ebeko (Russia) Continued explosions, ash plumes, and ashfall during October 2022-May 2023
Home Reef (Tonga) Discolored plumes continued during November 2022-April 2023
Semisopochnoi (United States) Occasional explosions, ash deposits, and gas-and-steam plumes during December 2022-May 2023
Ambae (Vanuatu) New lava flow, ash plumes, and sulfur dioxide plumes during February-May 2023
Ibu (Indonesia) Daily ash explosions continue, along with thermal anomalies in the crater, October 2022-May 2023
Dukono (Indonesia) Continuing ash emissions, SO2 plumes, and thermal signals during October 2022-May 2023
Sabancaya (Peru) Explosions, gas-and-ash plumes, and thermal activity persist during November 2022-April 2023
Sheveluch (Russia) Significant explosions destroyed part of the lava-dome complex during April 2023
Bezymianny (Russia) Explosions, ash plumes, lava flows, and avalanches during November 2022-April 2023
Chikurachki (Russia) New explosive eruption during late January-early February 2023
Kadovar (Papua New Guinea) — June 2023  Cite this Report
Kadovar
Papua New Guinea
3.608°S, 144.588°E; summit elev. 365 m
All times are local (unless otherwise noted)
An ash plume and weak thermal anomaly during May 2023
Kadovar is a 2-km-wide island that is the emergent summit of a Bismarck Sea stratovolcano. It lies off the coast of New Guinea, about 25 km N of the mouth of the Sepik River. Prior to an eruption that began in 2018, a lava dome formed the high point of the volcano, filling an arcuate landslide scarp open to the S. Submarine debris-avalanche deposits occur to the S of the island. The current eruption began in January 2018 and has comprised lava effusion from vents at the summit and at the E coast; more recent activity has consisted of ash plumes, weak thermal activity, and gas-and-steam plumes (BGVN 48:02). This report covers activity during February through May 2023 using information from the Darwin Volcanic Ash Advisory Center (VAAC) and satellite data.
Activity during the reporting period was relatively low and mainly consisted of white gas-and-steam plumes that were visible in natural color satellite images on clear weather days (figure 67). According to a Darwin VAAC report, at 2040 on 6 May an ash plume rose to 4.6 km altitude and drifted W; by 2300 the plume had dissipated. MODIS satellite instruments using the MODVOLC thermal algorithm detected a single thermal hotspot on the SE side of the island on 7 May. Weak thermal activity was also detected in a satellite image on the E side of the island on 14 May, accompanied by a white gas-and-steam plume that drifted SE (figure 68).
Geologic Background. The 2-km-wide island of Kadovar is the emergent summit of a Bismarck Sea stratovolcano of Holocene age. It is part of the Schouten Islands, and lies off the coast of New Guinea, about 25 km N of the mouth of the Sepik River. Prior to an eruption that began in 2018, a lava dome formed the high point of the andesitic volcano, filling an arcuate landslide scarp open to the south; submarine debris-avalanche deposits occur in that direction. Thick lava flows with columnar jointing forms low cliffs along the coast. The youthful island lacks fringing or offshore reefs. A period of heightened thermal phenomena took place in 1976. An eruption began in January 2018 that included lava effusion from vents at the summit and at the E coast.
Information Contacts: Darwin Volcanic Ash Advisory Centre (VAAC), Bureau of Meteorology, Northern Territory Regional Office, PO Box 40050, Casuarina, NT 0811, Australia (URL: http://www.bom.gov.au/info/vaac/); Hawai'i Institute of Geophysics and Planetology (HIGP) - MODVOLC Thermal Alerts System, School of Ocean and Earth Science and Technology (SOEST), Univ. of Hawai'i, 2525 Correa Road, Honolulu, HI 96822, USA (URL: http://modis.higp.hawaii.edu/); Copernicus Browser, Copernicus Data Space Ecosystem, European Space Agency (URL: https://dataspace.copernicus.eu/browser/).
San Miguel (El Salvador) — June 2023 Cite this Report
San Miguel
El Salvador
13.434°N, 88.269°W; summit elev. 2130 m
All times are local (unless otherwise noted)
Small gas-and-ash explosions during March and May 2023
San Miguel in El Salvador is a broad, deep crater complex that has been frequently modified by eruptions recorded since the early 16th century and consists of the summit known locally as Chaparrastique. Flank eruptions have produced lava flows that extended to the N, NE, and SE during the 17-19th centuries. The most recent activity has consisted of minor ash eruptions from the summit crater. The current eruption period began in November 2022 and has been characterized by frequent phreatic explosions, gas-and-ash emissions, and sulfur dioxide plumes (BGVN 47:12). This report describes small gas-and-ash explosions during December 2022 through May 2023 based on special reports from the Ministero de Medio Ambiente y Recursos Naturales (MARN).
Activity has been relatively low since the last recorded explosions on 29 November 2022. Seismicity recorded by the San Miguel Volcano Station (VSM) located on the N flank at 1.7 km elevation had decreased by 7 December. Sulfur dioxide gas measurements taken with DOAS (Differential Optical Absorption Spectroscopy) mobile equipment were below typical previously recorded values: 300 tons per day (t/d). During December, small explosions were recorded by the seismic network and manifested as gas-and-steam emissions.
Gas-and-ash explosions in the crater occurred during January 2023, which were recorded by the seismic network. Sulfur dioxide values remained low, between 300-400 t/d through 10 March. At 0817 on 14 January a gas-and-ash emission was visible in webcam images, rising just above the crater rim. Some mornings during February, small gas-and-steam plumes were visible in the crater. On 7 March at 2252 MARN noted an increase in degassing from the central crater; gas emissions were constantly observed through the early morning hours on 8 March. During the early morning of 8 March through the afternoon on 9 March, 12 emissions were registered, some accompanied by ash. The last gas-and-ash emission was recorded at 1210 on 9 March; very fine ashfall was reported in El Tránsito (10 km S), La Morita (6 km W), and La Piedrita (3 km W). The smell of sulfur was reported in Piedra Azul (5 km SW). On 16 March MARN reported that gas-and-steam emissions decreased.
Low degassing and very low seismicity were reported during April; no explosions have been detected between 9 March and 27 May. The sulfur dioxide emissions remained between 350-400 t/d; during 13-20 April sulfur dioxide values fluctuated between 30-300 t/d. Activity remained low through most of May; on 23 May seismicity increased. An explosion was detected at 1647 on 27 May generated a gas-and-ash plume that rose 700 m high (figure 32); a decrease in seismicity and gas emissions followed. The DOAS station installed on the W flank recorded sulfur dioxide values that reached 400 t/d on 27 May; subsequent measurements showed a decrease to 268 t/d on 28 May and 100 t/d on 29 May.
Geologic Background. The symmetrical cone of San Miguel, one of the most active volcanoes in El Salvador, rises from near sea level to form one of the country's most prominent landmarks. A broad, deep, crater complex that has been frequently modified by eruptions recorded since the early 16th century caps the truncated unvegetated summit, also known locally as Chaparrastique. Flanks eruptions of the basaltic-andesitic volcano have produced many lava flows, including several during the 17th-19th centuries that extended to the N, NE, and SE. The SE-flank flows are the largest and form broad, sparsely vegetated lava fields crossed by highways and a railroad skirting the base of the volcano. Flank vent locations have migrated higher on the edifice during historical time, and the most recent activity has consisted of minor ash eruptions from the summit crater.
Information Contacts: Ministero de Medio Ambiente y Recursos Naturales (MARN), Km. 5½ Carretera a Nueva San Salvador, Avenida las Mercedes, San Salvador, El Salvador (URL: http://www.snet.gob.sv/ver/vulcanologia).
Ebeko
Russia
50.686°N, 156.014°E; summit elev. 1103 m
All times are local (unless otherwise noted)
Continued explosions, ash plumes, and ashfall during October 2022-May 2023
Ebeko, located on the N end of Paramushir Island in the Kuril Islands, consists of three summit craters along a SSW-NNE line at the northern end of a complex of five volcanic cones. Eruptions date back to the late 18th century and have been characterized as small-to-moderate explosions from the summit crater, accompanied by intense fumarolic activity. The current eruption period began in June 2022 and has recently consisted of frequent explosions, ash plumes, and thermal activity (BGVN 47:10). This report covers similar activity during October 2022 through May 2023, based on information from the Kamchatka Volcanic Eruptions Response Team (KVERT) and satellite data.
Activity during October consisted of explosive activity, ash plumes, and occasional thermal anomalies. Visual data by volcanologists from Severo-Kurilsk showed explosions producing ash clouds up to 2.1-3 km altitude which drifted E, N, NE, and SE during 1-8, 10, 16, and 18 October. KVERT issued several Volcano Observatory Notices for Aviation (VONA) on 7, 13-15, and 27 October 2022, stating that explosions generated ash plumes that rose to 2.3-4 km altitude and drifted 5 km E, NE, and SE. Ashfall was reported in Severo-Kurilsk (Paramushir Island, about 7 km E) on 7 and 13 October. Satellite data showed a thermal anomaly over the volcano on 15-16 October. Visual data showed ash plumes rising to 2.5-3.6 km altitude on 22, 25-29, and 31 October and moving NE due to constant explosions.
Similar activity continued during November, with explosions, ash plumes, and ashfall occurring. KVERT issued VONAs on 1-2, 4, 6-7, 9, 13, and 16 November that reported explosions and resulting ash plumes that rose to 1.7-3.6 km altitude and drifted 3-5 km SE, ESE, E, and NE. On 1 November ash plumes extended as far as 110 km SE. On 5, 8, 12, and 24-25 November explosions and ash plumes rose to 2-3.1 km altitude and drifted N and E. Ashfall was observed in Severo-Kurilsk on 7 and 16 November. A thermal anomaly was visible during 1-4, 16, and 20 November. Explosions during 26 November rose as high as 2.7 km altitude and drifted NE (figure 45).
Explosions and ash plumes continued to occur in December. During 1-2 and 4 December volcanologists from Severo-Kurilsk observed explosions that sent ash to 1.9-2.5 km altitude and drifted NE and SE (figure 46). VONAs were issued on 5, 9, and 16 December reporting that explosions generated ash plumes rising to 1.9 km, 2.6 km, and 2.4 km altitude and drifted 5 km SE, E, and NE, respectively. A thermal anomaly was visible in satellite imagery on 16 December. On 18 and 27-28 December explosions produced ash plumes that rose to 2.5 km altitude and drifted NE and SE. On 31 December an ash plume rose to 2 km altitude and drifted NE.
Explosions continued during January 2023, based on visual observations by volcanologists from Severo-Kurilsk. During 1-7 January explosions generated ash plumes that rose to 4 km altitude and drifted NE, E, W, and SE. According to VONAs issued by KVERT on 2, 4, 10, and 23 January, explosions produced ash plumes that rose to 2-4 km altitude and drifted 5 km N, NE, E, and ENE; the ash plume that rose to 4 km altitude occurred on 10 January (figure 47). Satellite data showed a thermal anomaly during 3-4, 10, 13, 16, 21, 22, and 31 January. KVERT reported that an ash cloud on 4 January moved 12 km NE. On 6 and 9-11 January explosions sent ash plumes to 4.5 km altitude and drifted W and ESE. On 13 January an ash plume rose to 3 km altitude and drifted SE. During 20-24 January ash plumes from explosions rose to 3.7 km altitude and drifted SE, N, and NE. On 21 January the ash plume drifted as far as 40 km NE. During 28-29 and 31 January and 1 February ash plumes rose to 4 km altitude and drifted NE.
During February, explosions, ash plumes, and ashfall were reported. During 1, 4-5 and 7-8 February explosions generated ash plumes that rose to 4.5 km altitude and drifted E and NE; ashfall was observed on 5 and 8 February. On 6 February an explosion produced an ash plume that rose to 3 km altitude and drifted 7 km E, causing ashfall in Severo-Kurilsk. A thermal anomaly was visible in satellite data on 8, 9, 13, and 21 February. Explosions on 9 and 12-13 February produced ash plumes that rose to 4 km altitude and drifted E and NE; the ash cloud on 12 February extended as far as 45 km E. On 22 February explosions sent ash to 3 km altitude that drifted E. During 24 and 26-27 February ash plumes rose to 4 km altitude and drifted E. On 28 February an explosion sent ash to 2.5-3 km altitude and drifted 5 km E; ashfall was observed in Severo-Kurilsk.
Activity continued during March; visual observations showed that explosions generated ash plumes that rose to 3.6 km altitude on 3, 5-7, and 9-12 March and drifted E, NE, and NW. Thermal anomalies were visible on 10, 13, and 29-30 March in satellite imagery. On 18, 21-23, 26, and 29-30 March explosions produced ash plumes that rose to 2.8 km altitude and drifted NE and E; the ash plumes during 22-23 March extended up to 76 km E. A VONA issued on 21 March reported an explosion that produced an ash plume that rose to 2.8 km altitude and drifted 5 km E. Another VONA issued on 23 March reported that satellite data showed an ash plume rising to 3 km altitude and drifted 14 km E.
Explosions during April continued to generate ash plumes. On 1 and 4 April an ash plume rose to 2.8-3.5 km altitude and drifted SE and NE. A thermal anomaly was visible in satellite imagery during 1-6 April. Satellite data showed ash plumes and clouds rising to 2-3 km altitude and drifting up to 12 km SW and E on 3 and 6 April (figure 48). KVERT issued VONAs on 3, 5, 14, 16 April describing explosions that produced ash plumes rising to 3 km, 3.5 km, 3.5 km, and 3 km altitude and drifting 5 km S, 5 km NE and SE, 72 km NNE, and 5 km NE, respectively. According to satellite data, the resulting ash cloud from the explosion on 14 April was 25 x 7 km in size and drifted 72-104 km NNE during 14-15 April. According to visual data by volcanologists from Severo-Kurilsk explosions sent ash up to 3.5 km altitude that drifted NE and E during 15-16, 22, 25-26, and 29 April.
The explosive eruption continued during May. Explosions during 3-4, 6-7, and 9-10 May generated ash plumes that rose to 4 km altitude and drifted SW and E. Satellite data showed a thermal anomaly on 3, 9, 13-14, and 24 May. During 12-16, 23-25, and 27-28 May ash plumes rose to 3.5 km altitude and drifted in different directions due to explosions. Two VONA notices were issued on 16 and 25 May, describing explosions that generated ash plumes rising to 3 km and 3.5 km altitude, respectively and extending 5 km E. The ash cloud on 25 May drifted 75 km SE.
Thermal activity in the summit crater, occasionally accompanied by ash plumes and ash deposits on the SE and E flanks due to frequent explosions, were visible in infrared and true color satellite images (figure 49).
Geologic Background. The flat-topped summit of the central cone of Ebeko volcano, one of the most active in the Kuril Islands, occupies the northern end of Paramushir Island. Three summit craters located along a SSW-NNE line form Ebeko volcano proper, at the northern end of a complex of five volcanic cones. Blocky lava flows extend west from Ebeko and SE from the neighboring Nezametnyi cone. The eastern part of the southern crater contains strong solfataras and a large boiling spring. The central crater is filled by a lake about 20 m deep whose shores are lined with steaming solfataras; the northern crater lies across a narrow, low barrier from the central crater and contains a small, cold crescentic lake. Historical activity, recorded since the late-18th century, has been restricted to small-to-moderate explosive eruptions from the summit craters. Intense fumarolic activity occurs in the summit craters, on the outer flanks of the cone, and in lateral explosion craters.
Information Contacts: Kamchatka Volcanic Eruptions Response Team (KVERT), Far Eastern Branch, Russian Academy of Sciences, 9 Piip Blvd., Petropavlovsk-Kamchatsky, 683006, Russia (URL: http://www.kscnet.ru/ivs/kvert/); MIROVA (Middle InfraRed Observation of Volcanic Activity), a collaborative project between the Universities of Turin and Florence (Italy) supported by the Centre for Volcanic Risk of the Italian Civil Protection Department (URL: http://www.mirovaweb.it/); Copernicus Browser, Copernicus Data Space Ecosystem, European Space Agency (URL: https://dataspace.copernicus.eu/browser/).
Home Reef
Tonga
18.992°S, 174.775°W; summit elev. -10 m
All times are local (unless otherwise noted)
Discolored plumes continued during November 2022-April 2023
Home Reef is a submarine volcano located in the central Tonga islands between Lateiki (Metis Shoal) and Late Island. The first recorded eruption occurred in the mid-19th century, when an ephemeral island formed. An eruption in 1984 produced a 12-km-high eruption plume, a large volume of floating pumice, and an ephemeral island 500 x 1,500 m wide, with cliffs 30-50 m high that enclosed a water-filled crater. Another island-forming eruption in 2006 produced widespread pumice rafts that drifted as far as Australia; by 2008 the island had eroded below sea level. The previous eruption occurred during October 2022 and was characterized by a new island-forming eruption, lava effusion, ash plumes, discolored water, and gas-and-steam plumes (BGVN 47:11). This report covers discolored water plumes during November 2022 through April 2023 using satellite data.
Discolored plumes continued during the reporting period and were observed in true color satellite images on clear weather days. Satellite images show light green-yellow discolored water extending W on 8 and 28 November 2022 (figure 31), and SW on 18 November. Light green-yellow plumes extended W on 3 December, S on 13 December, SW on 18 December, and W and S on 23 December (figure 31). On 12 January 2023 discolored green-yellow plumes extended to the NE, E, SE, and N. The plume moved SE on 17 January and NW on 22 January. Faint discolored water in February was visible moving NE on 1 February. A discolored plume extended NW on 8 and 28 March and NW on 13 March (figure 31). During April, clear weather showed green-blue discolored plumes moving S on 2 April, W on 7 April, and NE and S on 12 April. A strong green-yellow discolored plume extended E and NE on 22 April for several kilometers (figure 31).
Geologic Background. Home Reef, a submarine volcano midway between Metis Shoal and Late Island in the central Tonga islands, was first reported active in the mid-19th century, when an ephemeral island formed. An eruption in 1984 produced a 12-km-high eruption plume, large amounts of floating pumice, and an ephemeral 500 x 1,500 m island, with cliffs 30-50 m high that enclosed a water-filled crater. In 2006 an island-forming eruption produced widespread dacitic pumice rafts that drifted as far as Australia. Another island was built during a September-October 2022 eruption.
Information Contacts: Copernicus Browser, Copernicus Data Space Ecosystem, European Space Agency (URL: https://dataspace.copernicus.eu/browser/).
Semisopochnoi (United States) — June 2023 Cite this Report
Semisopochnoi
United States
51.93°N, 179.58°E; summit elev. 1221 m
All times are local (unless otherwise noted)
Occasional explosions, ash deposits, and gas-and-steam plumes during December 2022-May 2023
Semisopochnoi is located in the western Aleutians, is 20-km-wide at sea level, and contains an 8-km-wide caldera. The three-peaked Mount Young (formerly Cerberus) was constructed within the caldera during the Holocene. Each of these peaks contains a summit crater; the lava flows on the N flank appear younger than those on the S side. The current eruption period began in early February 2021 and has more recently consisted of intermittent explosions and ash emissions (BGVN 47:12). This report updates activity during December 2022 through May 2023 using daily, weekly, and special reports from the Alaska Volcano Observatory (AVO). AVO monitors the volcano using local seismic and infrasound sensors, satellite data, web cameras, and remote infrasound and lightning networks.
Activity during most of December 2022 was relatively quiet; according to AVO no eruptive or explosive activity was observed since 7 November 2022. Intermittent tremor and occasional small earthquakes were observed in geophysical data. Continuous gas-and-steam emissions were observed from the N crater of Mount Young in webcam images on clear weather days (figure 25). On 24 December, there was a slight increase in earthquake activity and several small possible explosion signals were detected in infrasound data. Eruptive activity resumed on 27 December at the N crater of Mount Young; AVO issued a Volcano Activity Notice (VAN) that reported minor ash deposits on the flanks of Mount Young that extended as far as 1 km from the vent, according to webcam images taken during 27-28 December (figure 26). No ash plumes were observed in webcam or satellite imagery, but a persistent gas-and-steam plume that might have contained some ash rose to 1.5 km altitude. As a result, AVO raised the Aviation Color Code (ACC) to Orange (the second highest level on a four-color scale) and the Volcano Alert Level (VAL) to Watch (the second highest level on a four-level scale). Possible explosions were detected during 21 December 2022 through 1 January 2023 and seismic tremor was recorded during 30-31 December.
During January 2023 eruptive activity continued at the active N crater of Mount Young. Minor ash deposits were observed on the flanks, extending about 2 km SSW, based on webcam images from 1 and 3 January. A possible explosion occurred during 1-2 January based on elevated seismicity recorded on local seismometers and an infrasound signal recorded minutes later by an array at Adak. Though no ash plumes were observed in webcam or satellite imagery, a persistent gas-and-steam plume rose to 1.5 km altitude that might have carried minor traces of ash. Ash deposits were accompanied by periods of elevated seismicity and infrasound signals from the local geophysical network, which AVO reported were likely due to weak explosive activity. Low-level explosive activity was also detected during 2-3 January, with minor gas-and-steam emissions and a new ash deposit that was visible in webcam images. Low-level explosive activity was detected in geophysical data during 4-5 January, with elevated seismicity and infrasound signals observed on local stations. Volcanic tremor was detected during 7-9 January and very weak explosive activity was detected in seismic and infrasound data on 9 January. Weak seismic and infrasound signals were recorded on 17 January, which indicated minor explosive activity, but no ash emissions were observed in clear webcam images; a gas-and-steam plume continued to rise to 1.5 km altitude. During 29-30 January, ash deposits near the summit were observed on fresh snow, according to webcam images.
The active N cone at Mount Young continued to produce a gas-and-steam plume during February, but no ash emissions or explosive events were detected. Seismicity remained elevated with faint tremor during early February. Gas-and-steam emissions from the N crater were observed in clear webcam images on 11-13 and 16 February; no explosive activity was detected in seismic, infrasound, or satellite data. Seismicity has also decreased, with no significant seismic tremor observed since 25 January. Therefore, the ACC was lowered to Yellow (the second lowest level on a four-color scale) and the VAL was lowered to Advisory (the second lowest level on a four-color scale) on 22 February.
Gas-and-steam emissions persisted during March from the N cone of Mount Young, based on clear webcam images. A few brief episodes of weak tremor were detected in seismic data, although seismicity decreased over the month. A gas-and-steam plume detected in satellite data extended 150 km on 18 March. Low-level ash emissions from the N cone at Mount Young were observed in several webcam images during 18-19 March, in addition to small explosions and volcanic tremor. The ACC was raised to Orange and the VAL increased to Watch on 19 March. A small explosion was detected in seismic and infrasound data on 21 March.
Low-level unrest continued during April, although cloudy weather often obscured views of the summit; periods of seismic tremor and local earthquakes were recorded. During 3-4 April a gas-and-steam plume was visible traveling more than 200 km overnight; no ash was evident in the plume, according to AVO. A gas-and-steam plume was observed during 4-6 April that extended 400 km but did not seem to contain ash. Small explosions were detected in seismic and infrasound data on 5 April. Occasional clear webcam images showed continuing gas-and-steam emissions rose from Mount Young, but no ash deposits were observed on the snow. On 19 April small explosions and tremor were detected in seismic and infrasound data. A period of seismic tremor was detected during 22-25 April, with possible weak explosions on 25 April. Ash deposits were visible near the crater rim, but it was unclear if these deposits were recent or due to older deposits.
Occasional small earthquakes were recorded during May, but there were no signs of explosive activity seen in geophysical data. Gas-and-steam emissions continued from the N crater of Mount Young, based on webcam images, and seismicity remained slightly elevated. A new, light ash deposit was visible during the morning of 5 May on fresh snow on the NW flank of Mount Young. During 10 May periods of volcanic tremor were observed. The ACC was lowered to Yellow and the VAL to Advisory on 17 May due to no additional evidence of activity.
Geologic Background. Semisopochnoi, the largest subaerial volcano of the western Aleutians, is 20 km wide at sea level and contains an 8-km-wide caldera. It formed as a result of collapse of a low-angle, dominantly basaltic volcano following the eruption of a large volume of dacitic pumice. The high point of the island is Anvil Peak, a double-peaked late-Pleistocene cone that forms much of the island's northern part. The three-peaked Mount Cerberus (renamed Mount Young in 2023) was constructed within the caldera during the Holocene. Each of the peaks contains a summit crater; lava flows on the N flank appear younger than those on the south side. Other post-caldera volcanoes include the symmetrical Sugarloaf Peak SSE of the caldera and Lakeshore Cone, a small cinder cone at the edge of Fenner Lake in the NE part of the caldera. Most documented eruptions have originated from Young, although Coats (1950) considered that both Sugarloaf and Lakeshore Cone could have been recently active.
Information Contacts: Alaska Volcano Observatory (AVO), a cooperative program of a) U.S. Geological Survey, 4200 University Drive, Anchorage, AK 99508-4667 USA (URL: https://avo.alaska.edu/), b) Geophysical Institute, University of Alaska, PO Box 757320, Fairbanks, AK 99775-7320, USA, and c) Alaska Division of Geological & Geophysical Surveys, 794 University Ave., Suite 200, Fairbanks, AK 99709, USA (URL: http://dggs.alaska.gov/).
Ambae
Vanuatu
15.389°S, 167.835°E; summit elev. 1496 m
All times are local (unless otherwise noted)
New lava flow, ash plumes, and sulfur dioxide plumes during February-May 2023
Ambae, also known as Aoba, is a large basaltic shield volcano in Vanuatu. A broad pyroclastic cone containing three crater lakes (Manaro Ngoru, Voui, and Manaro Lakua) is located at the summit within the youngest of at least two nested calderas. Periodic phreatic and pyroclastic explosions have been reported since the 16th century. A large eruption more than 400 years ago resulted in a volcanic cone within the summit crater that is now filled by Lake Voui; the similarly sized Lake Manaro fills the western third of the caldera. The previous eruption ended in August 2022 that was characterized by gas-and-steam and ash emissions and explosions of wet tephra (BGVN 47:10). This report covers a new eruption during February through May 2023 that consisted of a new lava flow, ash plumes, and sulfur dioxide emissions, using information from the Vanuatu Meteorology and Geo-Hazards Department (VMGD) and satellite data.
During the reporting period, the Alert Level remained at a 2 (on a scale of 0-5), which has been in place since December 2021. Activity during October 2022 through March 2023 remained relatively low and mostly consisted of gas-and-steam emissions in Lake Voui. VMGD reported that at 1300 on 15 November a satellite image captured a strong amount of sulfur dioxide rising above the volcano (figure 99), and that seismicity slightly increased. The southern and northern part of the island reported a strong sulfur dioxide smell and heard explosions. On 20 February 2023 a gas-and-ash plume rose 1.3 km above the summit and drifted SSW, according to a webcam image (figure 100). Gas-and-steam and possibly ash emissions continued on 23 February and volcanic earthquakes were recorded by the seismic network.
During April, volcanic earthquakes and gas-and-steam and ash emissions were reported from the cone in Lake Voui. VMGD reported that activity increased during 5-7 April; high gas-and-steam and ash plumes were visible, accompanied by nighttime incandescence. According to a Wellington VAAC report, a low-level ash plume rose as high as 2.5 km above the summit and drifted W and SW on 5 April, based on satellite imagery. Reports in Saratamata stated that a dark ash plume drifted to the WSW, but no loud explosion was heard. Webcam images from 2100 showed incandescence above the crater and reflected in the clouds. According to an aerial survey, field observations, and satellite data, water was no longer present in the lake. A lava flow was reported effusing from the vent and traveling N into the dry Lake Voui, which lasted three days. The next morning at 0745 on 6 April a gas-and-steam and ash plume rose 5.4 km above the summit and drifted ESE, based on information from VMGD (figure 101). The Wellington VAAC also reported that light ashfall was observed on the island. Intermittent gas-and-steam and ash emissions were visible on 7 April, some of which rose to an estimated 3 km above the summit and drifted E. Webcam images during 0107-0730 on 7 April showed continuing ash emissions. A gas-and-steam and ash plume rose 695 m above the summit crater at 0730 on 19 April and drifted ESE, based on a webcam image (figure 102).
According to visual and infrared satellite data, water was visible in Lake Voui as late as 24 March 2023 (figure 103). The vent in the caldera showed a gas-and-steam plume drifted SE. On 3 April thermal activity was first detected, accompanied by a gas-and-ash plume that drifted W (figure 103). The lava flow moved N within the dry lake and was shown cooling by 8 April. By 23 April much of the water in the lake had returned. Occasional sulfur dioxide plumes were detected by the TROPOMI instrument on the Sentinel-5P satellite that exceeded 2 Dobson Units (DU) and drifted in different directions (figure 104).
Geologic Background. The island of Ambae, also known as Aoba, is a massive 2,500 km3 basaltic shield that is the most voluminous volcano of the New Hebrides archipelago. A pronounced NE-SW-trending rift zone with numerous scoria cones gives the 16 x 38 km island an elongated form. A broad pyroclastic cone containing three crater lakes (Manaro Ngoru, Voui, and Manaro Lakua) is located at the summit within the youngest of at least two nested calderas, the largest of which is 6 km in diameter. That large central edifice is also called Manaro Voui or Lombenben volcano. Post-caldera explosive eruptions formed the summit craters about 360 years ago. A tuff cone was constructed within Lake Voui (or Vui) about 60 years later. The latest known flank eruption, about 300 years ago, destroyed the population of the Nduindui area near the western coast.
Information Contacts: Geo-Hazards Division, Vanuatu Meteorology and Geo-Hazards Department (VMGD), Ministry of Climate Change Adaptation, Meteorology, Geo-Hazards, Energy, Environment and Disaster Management, Private Mail Bag 9054, Lini Highway, Port Vila, Vanuatu (URL: http://www.vmgd.gov.vu/, https://www.facebook.com/VanuatuGeohazardsObservatory/); Wellington Volcanic Ash Advisory Centre (VAAC), Meteorological Service of New Zealand Ltd (MetService), PO Box 722, Wellington, New Zealand (URL: http://www.metservice.com/vaac/, http://www.ssd.noaa.gov/VAAC/OTH/NZ/messages.html); MIROVA (Middle InfraRed Observation of Volcanic Activity), a collaborative project between the Universities of Turin and Florence (Italy) supported by the Centre for Volcanic Risk of the Italian Civil Protection Department (URL: http://www.mirovaweb.it/); Global Sulfur Dioxide Monitoring Page, Atmospheric Chemistry and Dynamics Laboratory, NASA Goddard Space Flight Center (NASA/GSFC), 8800 Greenbelt Road, Goddard, Maryland, USA (URL: https://so2.gsfc.nasa.gov/); Copernicus Browser, Copernicus Data Space Ecosystem, European Space Agency (URL: https://dataspace.copernicus.eu/browser/).
Ibu
Indonesia
1.488°N, 127.63°E; summit elev. 1325 m
All times are local (unless otherwise noted)
Daily ash explosions continue, along with thermal anomalies in the crater, October 2022-May 2023
Persistent eruptive activity since April 2008 at Ibu, a stratovolcano on Indonesian’s Halmahera Island, has consisted of daily explosive ash emissions and plumes, along with observations of thermal anomalies (BGVN 47:04). The current eruption continued during October 2022-May 2023, described below, based on advisories issued by the Pusat Vulkanologi dan Mitigasi Bencana Geologi (PVMBG, also known as Indonesian Center for Volcanology and Geological Hazard Mitigation, CVGHM), daily reports by MAGMA Indonesia (a PVMBG platform), and the Darwin Volcanic Ash Advisory Centre (VAAC), and various satellite data. The Alert Level during the reporting period remained at 2 (on a scale of 1-4), except raised briefly to 3 on 27 May, and the public was warned to stay at least 2 km away from the active crater and 3.5 km away on the N side of the volcano.
According to MAGMA Indonesia, during October 2022-May 2023, daily gray-and-white ash plumes of variable densities rose 200-1,000 m above the summit and drifted in multiple directions. On 30 October and 11 November, plumes rose a maximum of 2 km and 1.5 km above the summit, respectively (figures 42 and 43). According to the Darwin VAAC, discrete ash emissions on 13 November rose to 2.1 km altitude, or 800 m above the summit, and drifted W, and multiple ash emissions on 15 November rose 1.4 km above the summit and drifted NE. Occasional larger ash explosions through May 2023 prompted PVMBG to issue Volcano Observatory Notice for Aviation (VONA) alerts (table 6); the Aviation Color Code remained at Orange throughout this period.
Table 6. Volcano Observatory Notice for Aviation (VONA) ash plume alerts for Ibu issued by PVMBG during October 2022-May 2023. Maximum height above the summit was estimated by a ground observer. VONAs in January-May 2023 all described the ash plumes as dense.
| Date |
Time (local) |
Max height above summit |
Direction |
| 17 Oct 2022 |
0858 |
800 m |
SW |
| 18 Oct 2022 |
1425 |
800 m |
S |
| 19 Oct 2022 |
2017 |
600 m |
SW |
| 21 Oct 2022 |
0916 |
800 m |
NW |
| 16 Jan 2023 |
1959 |
600 m |
NE |
| 22 Jan 2023 |
0942 |
1,000 m |
E |
| 29 Jan 2023 |
2138 |
1,000 m |
E |
| 10 May 2023 |
0940 |
800 m |
NW |
| 10 May 2023 |
2035 |
600 m |
E |
| 21 May 2023 |
2021 |
600 m |
W |
| 21 May 2023 |
2140 |
1,000 m |
W |
| 29 May 2023 |
1342 |
800 m |
N |
| 31 May 2023 |
1011 |
1,000 m |
SW |
Sentinel-2 L1C satellite images throughout the reporting period show two, sometimes three persistent thermal anomalies in the summit crater, with the most prominent hotspot from the top of a cone within the crater. Clear views were more common during March-April 2023, when a vent and lava flows on the NE flank of the intra-crater cone could be distinguished (figure 44). White-to-grayish emissions were also observed during brief periods when weather clouds allowed clear views.
The MIROVA space-based volcano hotspot detection system recorded almost daily thermal anomalies throughout the reporting period, though cloud cover often interfered with detections. Data from imaging spectroradiometers aboard NASA’s Aqua and Terra satellites and processed using the MODVOLC algorithm (MODIS-MODVOLC) recorded hotspots on one day during October 2022 and December 2022, two days in April 2023, three days in November 2022 and May 2023, and four days in March 2023.
Geologic Background. The truncated summit of Gunung Ibu stratovolcano along the NW coast of Halmahera Island has large nested summit craters. The inner crater, 1 km wide and 400 m deep, has contained several small crater lakes. The 1.2-km-wide outer crater is breached on the N, creating a steep-walled valley. A large cone grew ENE of the summit, and a smaller one to the WSW has fed a lava flow down the W flank. A group of maars is located below the N and W flanks. The first observed and recorded eruption was a small explosion from the summit crater in 1911. Eruptive activity began again in December 1998, producing a lava dome that eventually covered much of the floor of the inner summit crater along with ongoing explosive ash emissions.
Information Contacts: Pusat Vulkanologi dan Mitigasi Bencana Geologi (PVMBG, also known as Indonesian Center for Volcanology and Geological Hazard Mitigation, CVGHM), Jalan Diponegoro 57, Bandung 40122, Indonesia (URL: http://www.vsi.esdm.go.id/); MAGMA Indonesia (Multiplatform Application for Geohazard Mitigation and Assessment in Indonesia), Kementerian Energi dan Sumber Daya Mineral (URL: https://magma.esdm.go.id/v1); Copernicus Browser, Copernicus Data Space Ecosystem, European Space Agency (URL: https://dataspace.copernicus.eu/browser/); MIROVA (Middle InfraRed Observation of Volcanic Activity), a collaborative project between the Universities of Turin and Florence (Italy) supported by the Centre for Volcanic Risk of the Italian Civil Protection Department (URL: http://www.mirovaweb.it/); Hawai'i Institute of Geophysics and Planetology (HIGP) - MODVOLC Thermal Alerts System, School of Ocean and Earth Science and Technology (SOEST), Univ. of Hawai'i, 2525 Correa Road, Honolulu, HI 96822, USA (URL: http://modis.higp.hawaii.edu/).
Dukono
Indonesia
1.6992°N, 127.8783°E; summit elev. 1273 m
All times are local (unless otherwise noted)
Continuing ash emissions, SO2 plumes, and thermal signals during October 2022-May 2023
Dukono, a remote volcano on Indonesia’s Halmahera Island, has been erupting continuously since 1933, with frequent ash explosions and sulfur dioxide plumes (BGVN 46:11, 47:10). This activity continued during October 2022 through May 2023, based on reports from the Pusat Vulkanologi dan Mitigasi Bencana Geologi (PVMBG; also known as Indonesian Center for Volcanology and Geological Hazard Mitigation, CVGHM), the Darwin Volcanic Ash Advisory Centre (VAAC), and satellite data. During this period, the Alert Level remained at 2 (on a scale of 1-4) and the public was warned to remain outside of the 2-km exclusion zone. The highest reported plume of the period reached 9.4 km above the summit on 14 November 2022.
According to MAGMA Indonesia (a platform developed by PVMBG), white, gray, or dark plumes of variable densities were observed almost every day during the reporting period, except when fog obscured the volcano (figure 33). Plumes generally rose 25-450 m above the summit, but rose as high as 700-800 m on several days, somewhat lower than the maximum heights reached earlier in 2022 when plumes reached as high as 1 km. However, the Darwin VAAC reported that on 14 November 2022, a discrete ash plume rose 9.4 km above the summit (10.7 km altitude), accompanied by a strong hotspot and a sulfur dioxide signal observed in satellite imagery; a continuous ash plume that day and through the 15th rose to 2.1-2.4 km altitude and drifted NE.
Sentinel-2 images were obscured by weather clouds almost every viewing day during the reporting period. However, the few reasonably clear images showed a hotspot and white or gray emissions and plumes. Strong SO2 plumes from Dukono were present on many days during October 2022-May 2023, as detected using the TROPOMI instrument on the Sentinel-5P satellite (figure 34).
Geologic Background. Reports from this remote volcano in northernmost Halmahera are rare, but Dukono has been one of Indonesia's most active volcanoes. More-or-less continuous explosive eruptions, sometimes accompanied by lava flows, have occurred since 1933. During a major eruption in 1550 CE, a lava flow filled in the strait between Halmahera and the N-flank Gunung Mamuya cone. This complex volcano presents a broad, low profile with multiple summit peaks and overlapping craters. Malupang Wariang, 1 km SW of the summit crater complex, contains a 700 x 570 m crater that has also been active during historical time.
Information Contacts: Pusat Vulkanologi dan Mitigasi Bencana Geologi (PVMBG, also known as Indonesian Center for Volcanology and Geological Hazard Mitigation, CVGHM), Jalan Diponegoro 57, Bandung 40122, Indonesia (URL: http://www.vsi.esdm.go.id/); MAGMA Indonesia (Multiplatform Application for Geohazard Mitigation and Assessment in Indonesia), Kementerian Energi dan Sumber Daya Mineral (URL: https://magma.esdm.go.id/v1); Darwin Volcanic Ash Advisory Centre (VAAC), Bureau of Meteorology, Northern Territory Regional Office, PO Box 40050, Casuarina, NT 0811, Australia (URL: http://www.bom.gov.au/info/vaac/); NASA Global Sulfur Dioxide Monitoring Page, Atmospheric Chemistry and Dynamics Laboratory, NASA Goddard Space Flight Center (NASA/GSFC), 8800 Greenbelt Road, Goddard, Maryland, USA (URL: https://so2.gsfc.nasa.gov/); Sentinel Hub Playground (URL: https://www.sentinel-hub.com/explore/sentinel-playground).
Sabancaya
Peru
15.787°S, 71.857°W; summit elev. 5960 m
All times are local (unless otherwise noted)
Explosions, gas-and-ash plumes, and thermal activity persist during November 2022-April 2023
Sabancaya is located in Peru, NE of Ampato and SE of Hualca Hualca. Eruptions date back to 1750 and have been characterized by explosions, phreatic activity, ash plumes, and ashfall. The current eruption period began in November 2016 and has more recently consisted of daily explosions, gas-and-ash plumes, and thermal activity (BGVN 47:11). This report updates activity during November 2022 through April 2023 using information from Instituto Geophysico del Peru (IGP) that use weekly activity reports and various satellite data.
Intermittent low-to-moderate power thermal anomalies were reported by the MIROVA project during November 2022 through April 2023 (figure 119). There were few short gaps in thermal activity during mid-December 2022, late December-to-early January 2023, late January to mid-February, and late February. According to data recorded by the MODVOLC thermal algorithm, there were a total of eight thermal hotspots: three in November 2022, three in February 2023, one in March, and one in April. On clear weather days, some of this thermal anomaly was visible in infrared satellite imagery showing the active lava dome in the summit crater (figure 120). Almost daily moderate-to-strong sulfur dioxide plumes were recorded during the reporting period by the TROPOMI instrument on the Sentinel-5P satellite (figure 121). Many of these plumes exceeded 2 Dobson Units (DU) and drifted in multiple directions.
IGP reported that moderate activity during November and December 2022 continued; during November, an average number of explosions were reported each week: 30, 33, 36, and 35, and during December, it was 32, 40, 47, 52, and 67. Gas-and-ash plumes in November rose 3-3.5 km above the summit and drifted E, NE, SE, S, N, W, and SW. During December the gas-and-ash plumes rose 2-4 km above the summit and drifted in different directions. There were 1,259 volcanic earthquakes recorded during November and 1,693 during December. Seismicity also included volcano-tectonic-type events that indicate rock fracturing events. Slight inflation was observed in the N part of the volcano near Hualca Hualca (4 km N). Thermal activity was frequently reported in the crater at the active lava dome (figure 120).
Explosive activity continued during January and February 2023. The average number of explosions were reported each week during January (51, 50, 60, and 59) and February (43, 54, 51, and 50). Gas-and-ash plumes rose 1.6-2.9 km above the summit and drifted NW, SW, and W during January and rose 1.4-2.8 above the summit and drifted W, SW, E, SE, N, S, NW, and NE during February. IGP also detected 1,881 volcanic earthquakes during January and 1,661 during February. VT-type earthquakes were also reported. Minor inflation persisted near Hualca Hualca. Satellite imagery showed continuous thermal activity in the crater at the lava dome (figure 120).
During March, the average number of explosions each week was 46, 48, 31, 35, and 22 and during April, it was 29, 41, 31, and 27. Accompanying gas-and-ash plumes rose 1.7-2.6 km above the summit crater and drifted W, SW, NW, S, and SE during March. According to a Buenos Aires Volcano Ash Advisory Center (VAAC) notice, on 22 March at 1800 through 23 March an ash plume rose to 7 km altitude and drifted NW. By 0430 an ash plume rose to 7.6 km altitude and drifted W. On 24 and 26 March continuous ash emissions rose to 7.3 km altitude and drifted SW and on 28 March ash emissions rose to 7.6 km altitude. During April, gas-and-ash plumes rose 1.6-2.5 km above the summit and drifted W, SW, S, NW, NE, and E. Frequent volcanic earthquakes were recorded, with 1,828 in March and 1,077 in April, in addition to VT-type events. Thermal activity continued to be reported in the summit crater at the lava dome (figure 120).
Geologic Background. Sabancaya, located in the saddle NE of Ampato and SE of Hualca Hualca volcanoes, is the youngest of these volcanic centers and the only one to have erupted in historical time. The oldest of the three, Nevado Hualca Hualca, is of probable late-Pliocene to early Pleistocene age. The name Sabancaya (meaning "tongue of fire" in the Quechua language) first appeared in records in 1595 CE, suggesting activity prior to that date. Holocene activity has consisted of Plinian eruptions followed by emission of voluminous andesitic and dacitic lava flows, which form an extensive apron around the volcano on all sides but the south. Records of historical eruptions date back to 1750.
Information Contacts: Instituto Geofisico del Peru (IGP), Centro Vulcanológico Nacional (CENVUL), Calle Badajoz N° 169 Urb. Mayorazgo IV Etapa, Ate, Lima 15012, Perú (URL: https://www.igp.gob.pe/servicios/centro-vulcanologico-nacional/inicio); Buenos Aires Volcanic Ash Advisory Center (VAAC), Servicio Meteorológico Nacional-Fuerza Aérea Argentina, 25 de mayo 658, Buenos Aires, Argentina (URL: http://www.smn.gov.ar/vaac/buenosaires/inicio.php); MIROVA (Middle InfraRed Observation of Volcanic Activity), a collaborative project between the Universities of Turin and Florence (Italy) supported by the Centre for Volcanic Risk of the Italian Civil Protection Department (URL: http://www.mirovaweb.it/); Hawai'i Institute of Geophysics and Planetology (HIGP) - MODVOLC Thermal Alerts System, School of Ocean and Earth Science and Technology (SOEST), Univ. of Hawai'i, 2525 Correa Road, Honolulu, HI 96822, USA (URL: http://modis.higp.hawaii.edu/); NASA Global Sulfur Dioxide Monitoring Page, Atmospheric Chemistry and Dynamics Laboratory, NASA Goddard Space Flight Center (NASA/GSFC), 8800 Greenbelt Road, Goddard MD 20771, USA (URL: https://so2.gsfc.nasa.gov/); Copernicus Browser, Copernicus Data Space Ecosystem, European Space Agency (URL: https://dataspace.copernicus.eu/browser/).
Sheveluch
Russia
56.653°N, 161.36°E; summit elev. 3283 m
All times are local (unless otherwise noted)
Significant explosions destroyed part of the lava-dome complex during April 2023
Sheveluch (also spelled Shiveluch) in Kamchatka, has had at least 60 large eruptions during the last 10,000 years. The summit is truncated by a broad 9-km-wide caldera that is breached to the S, and many lava domes occur on the outer flanks. The lava dome complex was constructed within the large open caldera. Frequent collapses of the dome complex have produced debris avalanches; the resulting deposits cover much of the caldera floor. A major south-flank collapse during a 1964 Plinian explosion produced a scarp in which a “Young Sheveluch” dome began to form in 1980. Repeated episodes of dome formation and destruction since then have produced major and minor ash plumes, pyroclastic flows, block-and-ash flows, and “whaleback domes” of spine-like extrusions in 1993 and 2020 (BGVN 45:11). The current eruption period began in August 1999 and has more recently consisted of lava dome growth, explosions, ash plumes, and avalanches (BGVN 48:01). This report covers a significant explosive eruption during early-to-mid-April 2023 that generated a 20 km altitude ash plume, produced a strong sulfur dioxide plume, and destroyed part of the lava-dome complex; activity described during January through April 2023 use information primarily from the Kamchatka Volcanic Eruptions Response Team (KVERT) and various satellite data.
Satellite data. Activity during the majority of this reporting period was characterized by continued lava dome growth, strong fumarole activity, explosions, and hot avalanches. According to the MODVOLC Thermal Alerts System, 140 hotspots were detected through the reporting period, with 33 recorded in January 2023, 29 in February, 44 in March, and 34 in April. Frequent strong thermal activity was recorded during January 2023 through April, according to the MIROVA (Middle InfraRed Observation of Volcanic Activity) graph and resulted from the continuously growing lava dome (figure 94). A slightly stronger pulse in thermal activity was detected in early-to-mid-April, which represented the significant eruption that destroyed part of the lava-dome complex. Thermal anomalies were also visible in infrared satellite imagery at the summit crater (figure 95).
During January 2023 KVERT reported continued growth of the lava dome, accompanied by strong fumarolic activity, incandescence from the lava dome, explosions, ash plumes, and avalanches. Satellite data showed a daily thermal anomaly over the volcano. Video data showed ash plumes associated with collapses at the dome that generated avalanches that in turn produced ash plumes rising to 3.5 km altitude and drifting 40 km W on 4 January and rising to 7-7.5 km altitude and drifting 15 km SW on 5 January. A gas-and-steam plume containing some ash that was associated with avalanches rose to 5-6 km altitude and extended 52-92 km W on 7 January. Explosions that same day produced ash plumes that rose to 7-7.5 km altitude and drifted 10 km W. According to a Volcano Observatory Notice for Aviation (VONA) issued at 1344 on 19 January, explosions produced an ash cloud that was 15 x 25 km in size and rose to 9.6-10 km altitude, drifting 21-25 km W; as a result, the Aviation Color Code (ACC) was raised to Red (the highest level on a four-color scale). Another VONA issued at 1635 reported that no more ash plumes were observed, and the ACC was lowered to Orange (the second highest level on a four-color scale). On 22 January an ash plume from collapses and avalanches rose to 5 km altitude and drifted 25 km NE and SW; ash plumes associated with collapses extended 70 km NE on 27 and 31 January.
Lava dome growth, fumarolic activity, dome incandescence, and occasional explosions and avalanches continued during February and March. A daily thermal anomaly was visible in satellite data. Explosions on 1 February generated ash plumes that rose to 6.3-6.5 km altitude and extended 15 km NE. Video data showed an ash cloud from avalanches rising to 5.5 km altitude and drifting 5 km SE on 2 February. Satellite data showed gas-and-steam plumes containing some ash rose to 5-5.5 km altitude and drifted 68-110 km ENE and NE on 6 February, to 4.5-5 km altitude and drifted 35 km WNW on 22 February, and to 3.7-4 km altitude and drifted 47 km NE on 28 February. Scientists from the Kamchatka Volcanological Station (KVS) went on a field excursion on 25 February to document the growing lava dome, and although it was cloudy most of the day, nighttime incandescence was visible. Satellite data showed an ash plume extending up to 118 km E during 4-5 March. Video data from 1150 showed an ash cloud from avalanches rose to 3.7-5.5 km altitude and drifted 5-10 km ENE and E on 5 March. On 11 March an ash plume drifted 62 km E. On 27 March ash plumes rose to 3.5 km altitude and drifted 100 km E. Avalanches and constant incandescence at the lava dome was focused on the E and NE slopes on 28 March. A gas-and-steam plume containing some ash rose to 3.5 km altitude and moved 40 km E on 29 March. Ash plumes on 30 March rose to 3.5-3.7 km altitude and drifted 70 km NE.
Similar activity continued during April, with lava dome growth, strong fumarolic activity, incandescence in the dome, occasional explosions, and avalanches. A thermal anomaly persisted throughout the month. During 1-4 April weak ash plumes rose to 2.5-3 km altitude and extended 13-65 km SE and E.
Activity during 11 April 2023. The Institute of Volcanology and Seismology, Far Eastern Branch, Russian Academy of Sciences (IVS FEB RAS) reported a significant increase in seismicity around 0054 on 11 April, as reported by strong explosions detected on 11 April beginning at 0110 that sent ash plumes up to 7-10 km altitude and extended 100-435 km W, WNW, NNW, WSW, and SW. According to a Tokyo VAAC report the ash plume rose to 15.8 km altitude. By 0158 the plume extended over a 75 x 100 km area. According to an IVS FEB RAS report, the eruptive column was not vertical: the initial plume at 0120 on 11 April deviated to the NNE, at 0000 on 12 April, it drifted NW, and by 1900 it drifted SW. KVS reported that significant pulses of activity occurred at around 0200, 0320, and then a stronger phase around 0600. Levin Dmitry took a video from near Békés (3 km away) at around 0600 showing a rising plume; he also reported that a pyroclastic flow traveled across the road behind him as he left the area. According to IVS FEB RAS, the pyroclastic flow traveled several kilometers SSE, stopping a few hundred meters from a bridge on the road between Klyuchi and Petropavlovsk-Kamchatsky.
Ashfall was first observed in Klyuchi (45 km SW) at 0630, and a large, black ash plume blocked light by 0700. At 0729 KVERT issued a Volcano Observatory Notice for Aviation (VONA) raising the Aviation Color Code to Red (the highest level on a four-color scale). It also stated that a large ash plume had risen to 10 km altitude and drifted 100 km W. Near-constant lightning strikes were reported in the plume and sounds like thunderclaps were heard until about 1000. According to IVS FEB RAS the cloud was 200 km long and 76 km wide by 0830, and was spreading W at altitudes of 6-12 km. In the Klyuchi Village, the layer of both ash and snow reached 8.5 cm (figure 96); ashfall was also reported in Kozyrevsk (112 km SW) at 0930, Mayskoye, Anavgay, Atlasovo, Lazo, and Esso. Residents in Klyuchi reported continued darkness and ashfall at 1100. In some areas, ashfall was 6 cm deep and some residents reported dirty water coming from their plumbing. According to IVS FEB RAS, an ash cloud at 1150 rose to 5-20 km altitude and was 400 km long and 250 km wide, extending W. A VONA issued at 1155 reported that ash had risen to 10 km and drifted 340 km NNW and 240 km WSW. According to Simon Carn (Michigan Technological University), about 0.2 Tg of sulfur dioxide in the plume was measured in a satellite image from the TROPOMI instrument on the Sentinel-5P satellite acquired at 1343 that covered an area of about 189,000 km2 (figure 97). Satellite data at 1748 showed an ash plume that rose to 8 km altitude and drifted 430 km WSW and S, according to a VONA.
Activity during 12-15 April 2023. On 12 April at 0730 satellite images showed ash plumes rose to 7-8 km altitude and extended 600 km SW, 1,050 km ESE, and 1,300-3,000 km E. By 1710 that day, the explosions weakened. According to news sources, the ash-and-gas plumes drifted E toward the Aleutian Islands and reached the Gulf of Alaska by 13 April, causing flight disruptions. More than 100 flights involving Alaska airspace were cancelled due to the plume. Satellite data showed ash plumes rising to 4-5.5 km altitude and drifted 400-415 km SE and ESE on 13 April. KVS volcanologists observed the pyroclastic flow deposits and noted that steam rose from downed, smoldering trees. They also noted that the deposits were thin with very few large fragments, which differed from previous flows. The ash clouds traveled across the Pacific Ocean. Flight cancellations were also reported in NW Canada (British Columbia) during 13-14 April. During 14-15 April ash plumes rose to 6 km altitude and drifted 700 km NW.
Alaskan flight schedules were mostly back to normal by 15 April, with only minor delays and far less cancellations; a few cancellations continued to be reported in Canada. Clear weather on 15 April showed that most of the previous lava-dome complex was gone and a new crater roughly 1 km in diameter was observed (figure 98); gas-and-steam emissions were rising from this crater. Evidence suggested that there had been a directed blast to the SE, and pyroclastic flows traveled more than 20 km. An ash plume rose to 4.5-5.2 km altitude and drifted 93-870 km NW on 15 April.
Activity during 16-30 April 2023. Resuspended ash was lifted by the wind from the slopes and rose to 4 km altitude and drifted 224 km NW on 17 April. KVERT reported a plume of resuspended ash from the activity during 10-13 April on 19 April that rose to 3.5-4 km altitude and drifted 146-204 km WNW. During 21-22 April a plume stretched over the Scandinavian Peninsula. A gas-and-steam plume containing some ash rose to 3-3.5 km altitude and drifted 60 km SE on 30 April. A possible new lava dome was visible on the W slope of the volcano on 29-30 April (figure 99); satellite data showed two thermal anomalies, a bright one over the existing lava dome and a weaker one over the possible new one.
References. Girina, O., Loupian, E., Horvath, A., Melnikov, D., Manevich, A., Nuzhdaev, A., Bril, A., Ozerov, A., Kramareva, L., Sorokin, A., 2023, Analysis of the development of the paroxysmal eruption of Sheveluch volcano on April 10–13, 2023, based on data from various satellite systems, ??????????? ???????? ??? ?? ???????, 20(2).
Geologic Background. The high, isolated massif of Sheveluch volcano (also spelled Shiveluch) rises above the lowlands NNE of the Kliuchevskaya volcano group. The 1,300 km3 andesitic volcano is one of Kamchatka's largest and most active volcanic structures, with at least 60 large eruptions during the Holocene. The summit of roughly 65,000-year-old Stary Shiveluch is truncated by a broad 9-km-wide late-Pleistocene caldera breached to the south. Many lava domes occur on its outer flanks. The Molodoy Shiveluch lava dome complex was constructed during the Holocene within the large open caldera; Holocene lava dome extrusion also took place on the flanks of Stary Shiveluch. Widespread tephra layers from these eruptions have provided valuable time markers for dating volcanic events in Kamchatka. Frequent collapses of dome complexes, most recently in 1964, have produced debris avalanches whose deposits cover much of the floor of the breached caldera.
Information Contacts: Kamchatka Volcanic Eruptions Response Team (KVERT), Far Eastern Branch, Russian Academy of Sciences, 9 Piip Blvd., Petropavlovsk-Kamchatsky, 683006, Russia (URL: http://www.kscnet.ru/ivs/kvert/); Institute of Volcanology and Seismology, Far Eastern Branch, Russian Academy of Sciences (IVS FEB RAS), 9 Piip Blvd., Petropavlovsk-Kamchatsky 683006, Russia (URL: http://www.kscnet.ru/ivs/eng/); Kamchatka Volcanological Station, Kamchatka Branch of Geophysical Survey, (KB GS RAS), Klyuchi, Kamchatka Krai, Russia (URL: http://volkstat.ru/); Hawai'i Institute of Geophysics and Planetology (HIGP) - MODVOLC Thermal Alerts System, School of Ocean and Earth Science and Technology (SOEST), Univ. of Hawai'i, 2525 Correa Road, Honolulu, HI 96822, USA (URL: http://modis.higp.hawaii.edu/); MIROVA (Middle InfraRed Observation of Volcanic Activity), a collaborative project between the Universities of Turin and Florence (Italy) supported by the Centre for Volcanic Risk of the Italian Civil Protection Department (URL: http://www.mirovaweb.it/); Copernicus Browser, Copernicus Data Space Ecosystem, European Space Agency (URL: https://dataspace.copernicus.eu/browser/); Kam 24 News Agency, 683032, Kamchatka Territory, Petropavlovsk-Kamchatsky, Vysotnaya St., 2A (URL: https://kam24.ru/news/main/20230411/96657.html#.Cj5Jrky6.dpuf); Simon Carn, Geological and Mining Engineering and Sciences, Michigan Technological University, 1400 Townsend Drive, Houghton, MI 49931, USA (URL: http://www.volcarno.com/, Twitter: @simoncarn).
Bezymianny
Russia
55.972°N, 160.595°E; summit elev. 2882 m
All times are local (unless otherwise noted)
Explosions, ash plumes, lava flows, and avalanches during November 2022-April 2023
Bezymianny is located on the Kamchatka Peninsula of Russia as part of the Klyuchevskoy volcano group. Historic eruptions began in 1955 and have been characterized by dome growth, explosions, pyroclastic flows, ash plumes, and ashfall. During the 1955-56 eruption a large open crater was formed by collapse of the summit and an associated lateral blast. Subsequent episodic but ongoing lava-dome growth, accompanied by intermittent explosive activity and pyroclastic flows, has largely filled the 1956 crater. The current eruption period began in December 2016 and more recent activity has consisted of strong explosions, ash plumes, and thermal activity (BGVN 47:11). This report covers activity during November 2022 through April 2023, based on weekly and daily reports from the Kamchatka Volcano Eruptions Response Team (KVERT) and satellite data.
Activity during November and March 2023 was relatively low and mostly consisted of gas-and-steam emissions, occasional small collapses that generated avalanches along the lava dome slopes, and a persistent thermal anomaly over the volcano that was observed in satellite data on clear weather days. According to the Tokyo VAAC and KVERT, an explosion produced an ash plume that rose to 6 km altitude and drifted 25 km NE at 1825 on 29 March.
Gas-and-steam emissions, collapses generating avalanches, and thermal activity continued during April. According to two Volcano Observatory Notice for Aviation (VONA) issued on 2 and 6 April (local time) ash plumes rose to 3 km and 3.5-3.8 km altitude and drifted 35 km E and 140 km E, respectively. Satellite data from KVERT showed weak ash plumes extending up to 550 km E on 2 and 5-6 April.
A VONA issued at 0843 on 7 April described an ash plume that rose to 4.5-5 km altitude and drifted 250 km ESE. Later that day at 1326 satellite data showed an ash plume that rose to 5.5-6 km altitude and drifted 150 km ESE. A satellite image from 1600 showed an ash plume extending as far as 230 km ESE; KVERT noted that ash emissions were intensifying, likely due to avalanches from the growing lava dome. The Aviation Color Code (ACC) was raised to Red (the highest level on a four-color scale). At 1520 satellite data showed an ash plume rising to 5-5.5 km altitude and drifting 230 km ESE. That same day, Kamchatka Volcanological Station (KVS) volcanologists traveled to Ambon to collect ash; they reported that a notable eruption began at 1730, and within 20 minutes a large ash plume rose to 10 km altitude and drifted NW. KVERT reported that the strong explosive phase began at 1738. Video and satellite data taken at 1738 showed an ash plume that rose to 10-12 km altitude and drifted up to 2,800 km SE and E. Explosions were clearly audible 20 km away for 90 minutes, according to KVS. Significant amounts of ash fell at the Apakhonchich station, which turned the snow gray; ash continued to fall until the morning of 8 April. In a VONA issued at 0906 on 8 April, KVERT stated that the explosive eruption had ended; ash plumes had drifted 2,000 km E. The ACC was lowered to Orange (the third highest level on a four-color scale). The KVS team saw a lava flow on the active dome once the conditions were clear that same day (figure 53). On 20 April lava dome extrusion was reported; lava flows were noted on the flanks of the dome, and according to KVERT satellite data, a thermal anomaly was observed in the area. The ACC was lowered to Yellow (the second lowest on a four-color scale).
Satellite data showed an increase in thermal activity beginning in early April 2023. A total of 31 thermal hotspots were detected by the MODVOLC thermal algorithm on 4, 5, 7, and 12 April 2023. The elevated thermal activity resulted from an increase in explosive activity and the start of an active lava flow. The MIROVA (Middle InfraRed Observation of Volcanic Activity) volcano hotspot detection system based on the analysis of MODIS data also showed a pulse in thermal activity during the same time (figure 54). Infrared satellite imagery captured a continuous thermal anomaly at the summit crater, often accompanied by white gas-and-steam emissions (figure 55). On 4 April 2023 an active lava flow was observed descending the SE flank.
Geologic Background. The modern Bezymianny, much smaller than its massive neighbors Kamen and Kliuchevskoi on the Kamchatka Peninsula, was formed about 4,700 years ago over a late-Pleistocene lava-dome complex and an edifice built about 11,000-7,000 years ago. Three periods of intensified activity have occurred during the past 3,000 years. The latest period, which was preceded by a 1,000-year quiescence, began with the dramatic 1955-56 eruption. This eruption, similar to that of St. Helens in 1980, produced a large open crater that was formed by collapse of the summit and an associated lateral blast. Subsequent episodic but ongoing lava-dome growth, accompanied by intermittent explosive activity and pyroclastic flows, has largely filled the 1956 crater.
Information Contacts: Kamchatka Volcanic Eruptions Response Team (KVERT), Far Eastern Branch, Russian Academy of Sciences, 9 Piip Blvd., Petropavlovsk-Kamchatsky, 683006, Russia (URL: http://www.kscnet.ru/ivs/kvert/); Kamchatka Volcanological Station, Kamchatka Branch of Geophysical Survey, (KB GS RAS), Klyuchi, Kamchatka Krai, Russia (URL: http://volkstat.ru/); Hawai'i Institute of Geophysics and Planetology (HIGP) - MODVOLC Thermal Alerts System, School of Ocean and Earth Science and Technology (SOEST), Univ. of Hawai'i, 2525 Correa Road, Honolulu, HI 96822, USA (URL: http://modis.higp.hawaii.edu/); MIROVA (Middle InfraRed Observation of Volcanic Activity), a collaborative project between the Universities of Turin and Florence (Italy) supported by the Centre for Volcanic Risk of the Italian Civil Protection Department (URL: http://www.mirovaweb.it/); Copernicus Browser, Copernicus Data Space Ecosystem, European Space Agency (URL: https://dataspace.copernicus.eu/browser/).
Chikurachki
Russia
50.324°N, 155.461°E; summit elev. 1781 m
All times are local (unless otherwise noted)
New explosive eruption during late January-early February 2023
Chikurachki, located on Paramushir Island in the northern Kuriles, has had Plinian eruptions during the Holocene. Lava flows have reached the sea and formed capes on the NW coast; several young lava flows are also present on the E flank beneath a scoria deposit. Reported eruptions date back to 1690, with the most recent eruption period occurring during January through October 2022, characterized by occasional explosions, ash plumes, and thermal activity (BGVN 47:11). This report covers a new eruptive period during January through February 2023 that consisted of ash explosions and ash plumes, based on information from the Kamchatka Volcanic Eruptions Response Team (KVERT) and satellite data.
According to reports from KVERT, an explosive eruption began around 0630 on 29 January. Explosions generated ash plumes that rose to 3-3.5 km altitude and drifted 6-75 km SE and E, based on satellite data. As a result, the Aviation Color Code (ACC) was raised to Orange (the second highest level on a four-color scale). At 1406 and 1720 ash plumes were identified in satellite images that rose to 4.3 km altitude and extended 70 km E. By 2320 the ash plume had dissipated. A thermal anomaly was visible at the volcano on 31 January, according to a satellite image, and an ash plume was observed drifting 66 km NE.
Occasional explosions and ash plumes continued during early February. At 0850 on 1 February an ash plume rose to 3.5 km altitude and drifted 35 km NE. Satellite data showed an ash plume that rose to 3.2-3.5 km altitude and drifted 50 km NE at 1222 later that day (figure 22). A thermal anomaly was detected over the volcano during 5-6 February and ash plumes drifted as far as 125 km SE, E, and NE. Explosive events were reported at 0330 on 6 February that produced ash plumes rising to 4-4.5 km altitude and drifting 72-90 km N, NE, and ENE. KVERT noted that the last gas-and steam plume that contained some ash was observed on 8 February and drifted 55 km NE before the explosive eruption ended. The ACC was lowered to Yellow and then Green (the lowest level on a four-color scale) on 18 February.
Geologic Background. Chikurachki, the highest volcano on Paramushir Island in the northern Kuriles, is a relatively small cone constructed on a high Pleistocene edifice. Oxidized basaltic-to-andesitic scoria deposits covering the upper part of the young cone give it a distinctive red color. Frequent basaltic Plinian eruptions have occurred during the Holocene. Lava flows have reached the sea and formed capes on the NW coast; several young lava flows are also present on the E flank beneath a scoria deposit. The Tatarinov group of six volcanic centers is located immediately to the south, and the Lomonosov cinder cone group, the source of an early Holocene lava flow that reached the saddle between it and Fuss Peak to the west, lies at the southern end of the N-S-trending Chikurachki-Tatarinov complex. In contrast to the frequently active Chikurachki, the Tatarinov centers are extensively modified by erosion and have a more complex structure. Tephrochronology gives evidence of an eruption around 1690 CE from Tatarinov, although its southern cone contains a sulfur-encrusted crater with fumaroles that were active along the margin of a crater lake until 1959.
Information Contacts: Kamchatka Volcanic Eruptions Response Team (KVERT), Far East Division, Russian Academy of Sciences, 9 Piip Blvd., Petropavlovsk-Kamchatsky, 683006, Russia (URL: http://www.kscnet.ru/ivs/); Copernicus Browser, Copernicus Data Space Ecosystem, European Space Agency (URL: https://dataspace.copernicus.eu/browser/).
Search Bulletin Archive by Publication Date
Select a month and year from the drop-downs and click "Show Issue" to have that issue displayed in this tab.
The default month and year is the latest issue available.
Bulletin of the Global Volcanism Network - Volume 16, Number 11 (November 1991)
Managing Editor: Lindsay McClelland
Aira (Japan)
Continued explosions
Akutan (United States)
Summit tephra emission
Arenal (Costa Rica)
Strombolian explosions and block lava
Colima (Mexico)
B-type earthquakes and avalanche events
Etna (Italy)
Brief SE-flank fissure eruption
Galeras (Colombia)
Continued deformation and seismicity; dome petrology
Gamalama (Indonesia)
Seismicity increases but no change in surface activity
Hudson, Cerro (Chile)
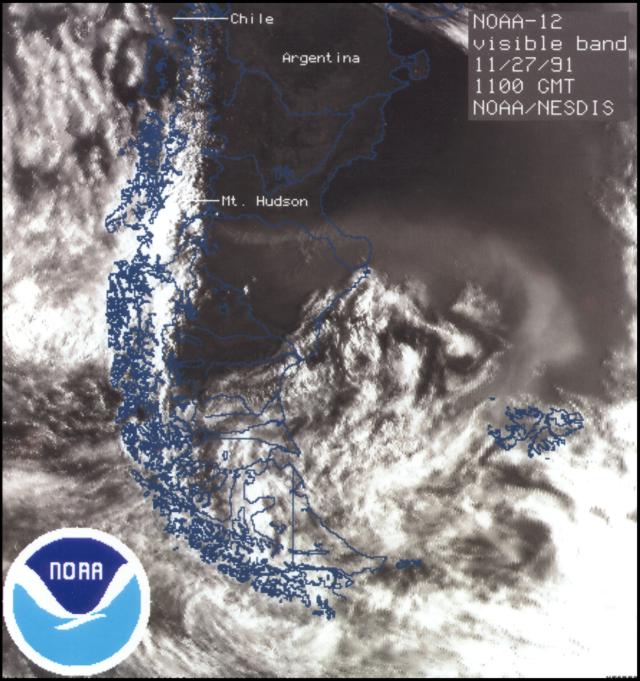
Large plumes on satellite images, probably wind-blown August tephra
Irazu (Costa Rica)
Fumarolic activity declines
Karkar (Papua New Guinea)
Thermal areas shrink; continued deflation
Kilauea (United States)
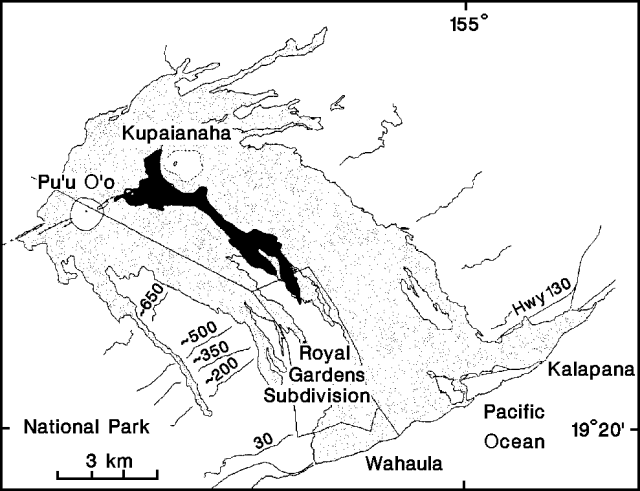
Lava from new east rift fissure vents
Kirishimayama (Japan)
Increased seismicity; gas emission
Lamington (Papua New Guinea)
Long-term decline in thermal activity
Langila (Papua New Guinea)
Ash clouds; incandescent tephra
Lewotobi (Indonesia)
Continued gas emission
Lokon-Empung (Indonesia)
Moderate explosions continue
Mahawu (Indonesia)
Increased thermal activity
Manam (Papua New Guinea)
Weak ash emission continues but incandescent tephra ejection stops; little deformation
Merapi (Indonesia)
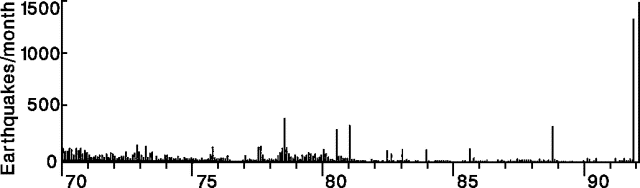
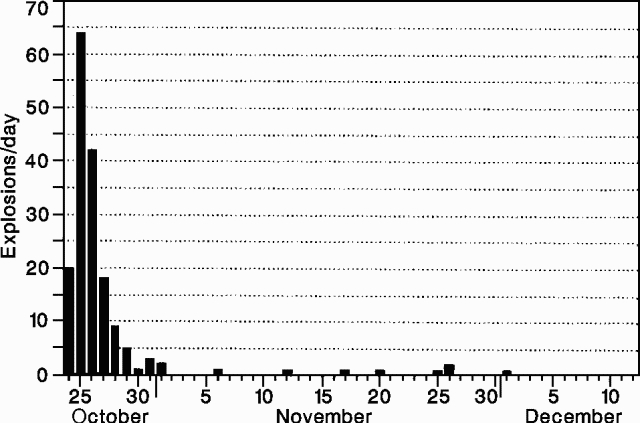
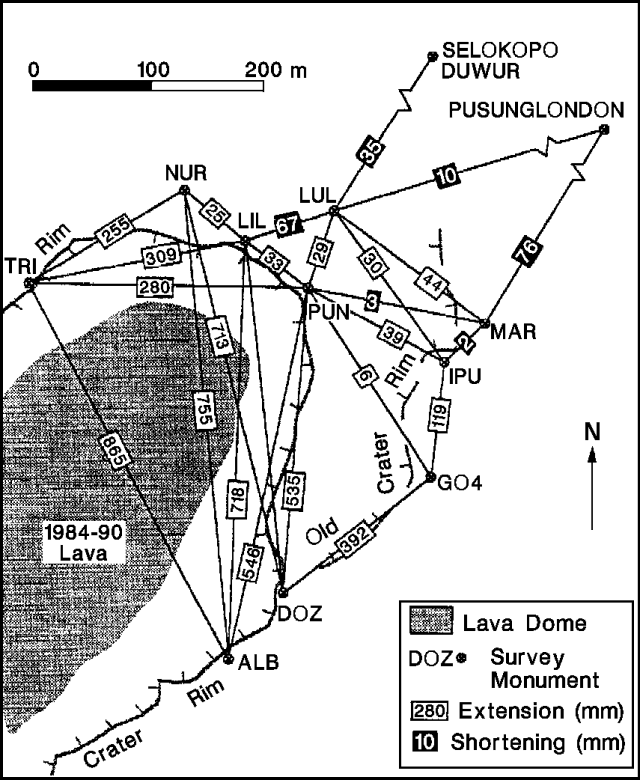
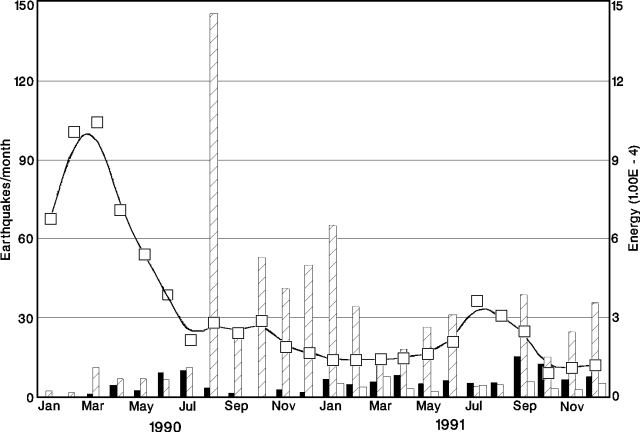
Degassing but no apparent lava dome growth; deformation data from 1988-90 and seismicity from 1990-91
Pacaya (Guatemala)
Small explosions and lava flow
Poas (Costa Rica)
Phreatic explosions end; sulfur emission from crater lake
Rabaul (Papua New Guinea)
Slight increase in seismicity
Ruiz, Nevado del (Colombia)
Seismicity weak; no deformation evident
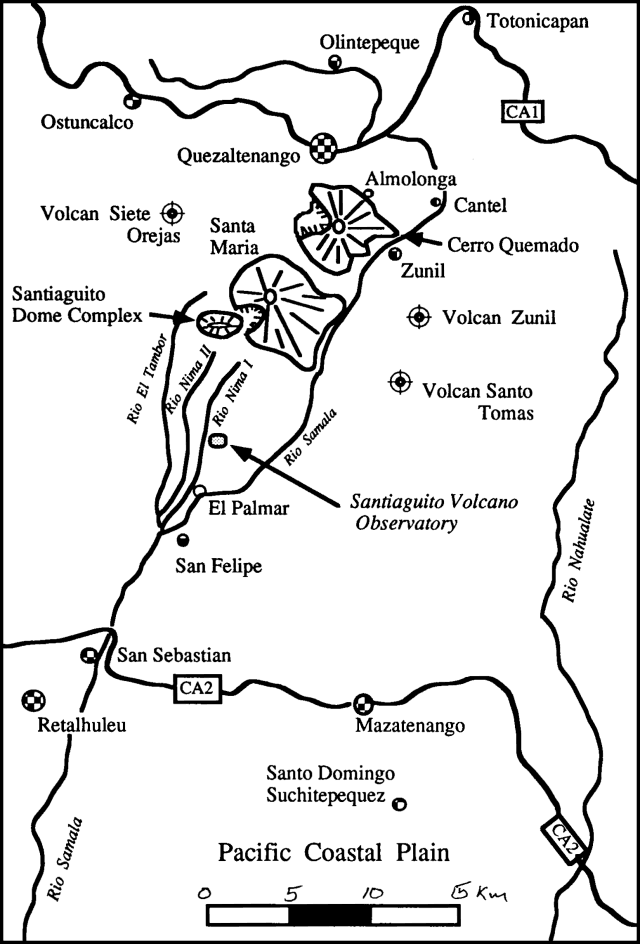
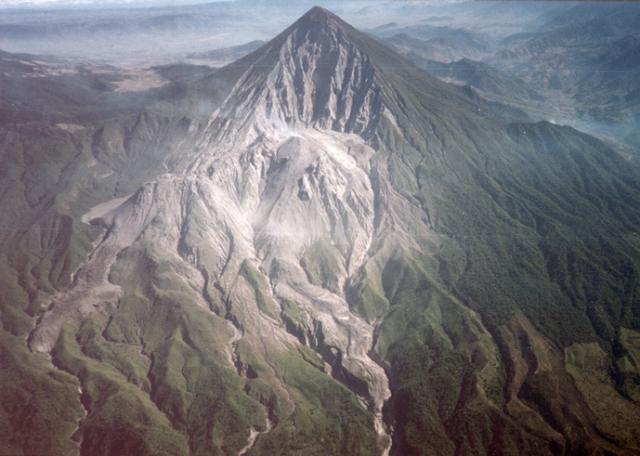
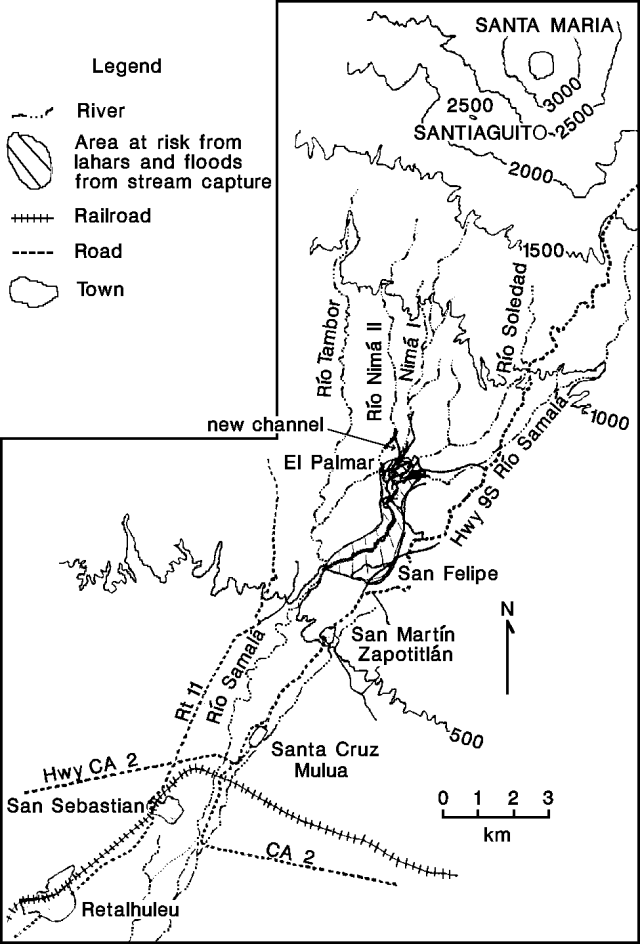
Santa Maria (Guatemala)
Explosions and block lava flow; continued lahar-induced changes in S-flank drainages
Semeru (Indonesia)
More frequent explosions and tremor; lava avalanches
Soputan (Indonesia)
Incandescent ejecta; tremor
Unzendake (Japan)
Continued lava extrusion; fewer pyroclastic flows
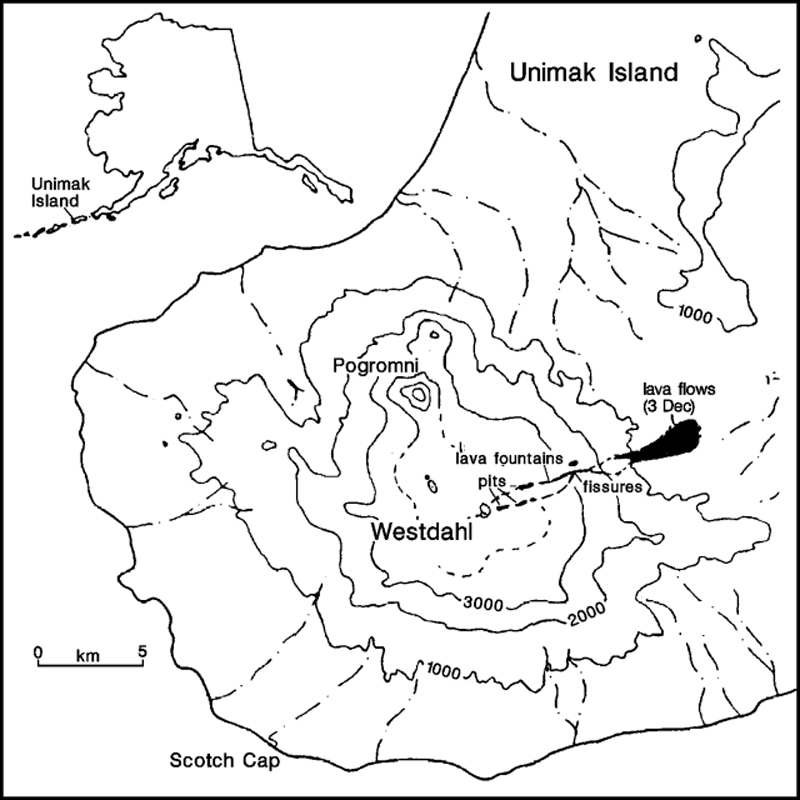
Westdahl (United States)
Lava flows and tephra from 8-km NE-flank fissure
Whakaari/White Island (New Zealand)
Tephra emission continues from new crater
Yasur (Vanuatu)
Strombolian activity and/or small lava lakes at four vents
Aira
Japan
31.5772°N, 130.6589°E; summit elev. 1117 m
All times are local (unless otherwise noted)
Continued explosions
Fifteen explosions were recorded in November . . . . A car windshield was cracked by lapilli from the month's highest ash cloud (3,000 m), emitted at 1245 on 18 November. A total of 332 g/m2 of ash was deposited [at KLMO] in November . . . . Swarms of volcanic earthquakes were recorded on 3, 5, 10, 19, and 28 November.
Geologic Background. The Aira caldera in the northern half of Kagoshima Bay contains the post-caldera Sakurajima volcano, one of Japan's most active. Eruption of the voluminous Ito pyroclastic flow accompanied formation of the 17 x 23 km caldera about 22,000 years ago. The smaller Wakamiko caldera was formed during the early Holocene in the NE corner of the caldera, along with several post-caldera cones. The construction of Sakurajima began about 13,000 years ago on the southern rim and built an island that was joined to the Osumi Peninsula during the major explosive and effusive eruption of 1914. Activity at the Kitadake summit cone ended about 4,850 years ago, after which eruptions took place at Minamidake. Frequent eruptions since the 8th century have deposited ash on the city of Kagoshima, located across Kagoshima Bay only 8 km from the summit. The largest recorded eruption took place during 1471-76.
Information Contacts: JMA.
Akutan (United States) — November 1991 Cite this Report
Akutan
United States
54.134°N, 165.986°W; summit elev. 1303 m
All times are local (unless otherwise noted)
Summit tephra emission
Summit tephra emissions resumed in mid-September . . . . Observer's initials, in brackets, follow their information in the chronology below.
15 September: Voluminous black emissions rose ~300 m from the summit cone between 0800 and 0900. White steam with some black material was briefly emitted shortly after 0900 [F/R].
27 September: Dark gray, billowing plume to roughly 2,500 m altitude seen from an aircraft during the morning [DT]. Clouds obscured the volcano during the afternoon.
29 September: Small tephra plume to <2,500 m altitude seen from an aircraft at 1315 [JR]. Six brief tephra emissions, the first three at 1517, 1520, and 1535, fed black to light-brown plumes that rose to an estimated 3,000 m within a minute [MO]. Black plume emission was observed for 3 minutes at about 1800 [T]. Another plume rose ~4,500 m sometime between 2000 and 2100 [MO]. Snow on the volcano remained white that evening, but was ash-covered by the next afternoon, when some fine ash was evident on flat surfaces 12.5 km E of the volcano (in Akutan village) [MO & BJ].
11 October: Plumes rose briefly to about 2,400 m and 2,100 m altitudes at 1030 and 1100, respectively [DT].
13 October: Trace of ash fell on Akutan village. Ash was seen falling through clouds on the W end of Akutan Bay [MO].
14 October: Emission of gas and black ash was nearly continuous, to roughly 1,000 m above the summit. Larger explosive episodes occurred approximately hourly; the first was observed at 0935 (shortly after dawn), rising 1,500-1,800 m above the volcano [MO & NS]. Six dark plumes rose at least 500 m above the volcano between 1530 and 1730 [BJ]. One, at 1721, reached 1,500 m above the summit [JW].
18 October: Continuous steaming, with emission of at least 6 dark short-lived plumes to 450-600 m height [MO].
19 October: Ash blackened snow down to the snow-line (at about 300 m altitude) [BJ].
30 October: White gas plume about 600 m high emitted between 0800 and 1000. No gas emission was evident between 1300 and 1500, but ash had fallen N of the crater rim since the last snow, 2 days earlier [ML].
Observers (initials in brackets): F/R - unidentified fisherman aboard the Richards (Seattle); DT and JR - Darren Talmadge and Jodeann Ryan, MarkAir; MO, BJ, and ML - Mark Owen, Bret Joines, and Michael Lockhart, Trident Seafood; T - crew of the Tarpon (Petropavlovsk-Kamchatsky); NS - Nick Sias (Peninsula Airways); JW - Jack Wood, OESI Corp.
Geologic Background. Akutan contains a 2-km-wide caldera with a large cinder cone in the NE part of the caldera that has been the source of frequent explosive eruptions and occasional lava effusion that covers the caldera floor. An older, largely buried caldera was formed during the late Pleistocene or early Holocene. Two volcanic centers are located on the NW flank. Lava Peak is of Pleistocene age, and a cinder cone lower on the flank produced a lava flow in 1852 that extended the shoreline of the island and forms Lava Point. The 60-365 m deep younger caldera was formed during a major explosive eruption about 1,600 years ago and contains at least three lakes. A lava flow in 1978 traveled through a narrow breach in the north caldera rim almost to the coast. Fumaroles occur at the base of the caldera cinder cone, and hot springs are located NE of the caldera at the head of Hot Springs Bay valley and along the shores of Hot Springs Bay.
Information Contacts: J. Reeder, ADGGS.
Arenal (Costa Rica) — November 1991 Cite this Report
Arenal
Costa Rica
10.463°N, 84.703°W; summit elev. 1670 m
All times are local (unless otherwise noted)
Strombolian explosions and block lava
Lava and tephra emission continued in November from Crater C. The flow observed on the SW flank in September-October reached 850 m elevation. Strombolian explosions ejected ash, bombs, and blocks, producing 1-km-high columns and vibrating windows 2.7 km S of the crater (at Observatorio Vulcanológico y Biológico de la Finca La Macadamia). Gas and ash clouds were carried predominantly NW, W, and SW. Fumarolic activity continued in the summit crater (D).
Geologic Background. Conical Volcán Arenal is the youngest stratovolcano in Costa Rica and one of its most active. The 1670-m-high andesitic volcano towers above the eastern shores of Lake Arenal, which has been enlarged by a hydroelectric project. Arenal lies along a volcanic chain that has migrated to the NW from the late-Pleistocene Los Perdidos lava domes through the Pleistocene-to-Holocene Chato volcano, which contains a 500-m-wide, lake-filled summit crater. The earliest known eruptions of Arenal took place about 7000 years ago, and it was active concurrently with Cerro Chato until the activity of Chato ended about 3500 years ago. Growth of Arenal has been characterized by periodic major explosive eruptions at several-hundred-year intervals and periods of lava effusion that armor the cone. An eruptive period that began with a major explosive eruption in 1968 ended in December 2010; continuous explosive activity accompanied by slow lava effusion and the occasional emission of pyroclastic flows characterized the eruption from vents at the summit and on the upper western flank.
Information Contacts: E. Fernández and J. Barquero, OVSICORI.
Colima
Mexico
19.514°N, 103.62°W; summit elev. 3850 m
All times are local (unless otherwise noted)
B-type earthquakes and avalanche events
August seismicity included 79 B-type events with recorded amplitudes exceeding 15 mm. A few moderate Merapi-type avalanches were seismically recorded, but weather conditions prevented visual observations. The longest series of avalanches lasted 1.5 hours on 20 August, 30 minutes on 28 August, and 2 hours on 30 August. Total seismic activity and the number of Merapi-type avalanches decreased significantly in September, but rose in October, with seismicity returning to near August levels.
Seismic monitoring was somewhat impaired by lightning damage and lack of sunlight to charge the instruments' solar batteries. All of the RESCO stations were repaired by 24 August with the support of a Ministry of Defense helicopter. Additional lightning damage was repaired by 26 October, and all RESCO stations were operative as of early December.
Geologic Background. The Colima complex is the most prominent volcanic center of the western Mexican Volcanic Belt. It consists of two southward-younging volcanoes, Nevado de Colima (the high point of the complex) on the north and the historically active Volcán de Colima at the south. A group of late-Pleistocene cinder cones is located on the floor of the Colima graben west and east of the complex. Volcán de Colima (also known as Volcán Fuego) is a youthful stratovolcano constructed within a 5-km-wide scarp, breached to the south, that has been the source of large debris avalanches. Major slope failures have occurred repeatedly from both the Nevado and Colima cones, producing thick debris-avalanche deposits on three sides of the complex. Frequent recorded eruptions date back to the 16th century. Occasional major explosive eruptions have destroyed the summit (most recently in 1913) and left a deep, steep-sided crater that was slowly refilled and then overtopped by lava dome growth.
Information Contacts: A. Nava, F.J. Núñez-Cornú, G. Reyes, J. Flores, R. Saucedo, H. Tamez, J. Hernández, A. Cortés, C. Valencia, and R. García-Arthur, CICT, Universidad de Colima; Z. Jiménez and S. de la Cruz-Reyna, UNAM
Etna
Italy
37.748°N, 14.999°E; summit elev. 3357 m
All times are local (unless otherwise noted)
Brief SE-flank fissure eruption
Lava emerged from a fissure at 3,000 m altitude, apparently on the SE flank, for about an hour on 14 December. Light ashfalls occurred on small villages below the fissure. The eruption was preceded by hundreds of small earthquakes.
Geologic Background. Mount Etna, towering above Catania on the island of Sicily, has one of the world's longest documented records of volcanism, dating back to 1500 BCE. Historical lava flows of basaltic composition cover much of the surface of this massive volcano, whose edifice is the highest and most voluminous in Italy. The Mongibello stratovolcano, truncated by several small calderas, was constructed during the late Pleistocene and Holocene over an older shield volcano. The most prominent morphological feature of Etna is the Valle del Bove, a 5 x 10 km caldera open to the east. Two styles of eruptive activity typically occur, sometimes simultaneously. Persistent explosive eruptions, sometimes with minor lava emissions, take place from one or more summit craters. Flank vents, typically with higher effusion rates, are less frequently active and originate from fissures that open progressively downward from near the summit (usually accompanied by Strombolian eruptions at the upper end). Cinder cones are commonly constructed over the vents of lower-flank lava flows. Lava flows extend to the foot of the volcano on all sides and have reached the sea over a broad area on the SE flank.
Information Contacts: AP.
Galeras (Colombia) — November 1991 Cite this Report
Galeras
Colombia
1.22°N, 77.37°W; summit elev. 4276 m
All times are local (unless otherwise noted)
Continued deformation and seismicity; dome petrology
Seismicity remained at very high levels in November, with peaks in the number and intensity of long-period events on the 19th (figure 49). The average earthquake rate dropped briefly in early November, before returning to late-October levels. High-frequency seismicity, rare during November, showed a small increase centered beneath the volcano's W sector, near the end of the month. One shock was felt nearby (at the Galeras Military Base) on 18 November at 0627, and was associated with a tremor episode. Low-frequency (1-2 Hz) tremor bands, with 6 mm amplitudes, were recorded on 10 and 19 November; spasmodic tremor fluctuated, reaching a peak on 20 November.
The electronic tiltmeters located 0.9 km E ("Crater") and 2 km E ("Peladitos") of the crater showed continued inflation through 18 November, when a sudden change occurred (see figure 58), coinciding with a minimum in the reduced displacement of the long-period events. Inflation resumed at Crater Station, but measurements at Peladitos Station showed little change.
The dome in the summit crater was still growing in mid-November, as frequent explosions continued. Preliminary analyses of a block believed to have been ejected from the dome by an explosion show it to be a 2-pyroxene andesite. The rock is highly crystalline (>50% crystals), containing abundant plagioclase, and lesser clinopyroxene, orthopyroxene, titanomagnetite, and possible relict olivine. The glass is generally brown, and somewhat vesicular. Geologists noted that the rhyolitic glass composition and high crystallinity indicate a high degree of differentiation and high magma viscosity, consistent with the dome being part of an older gas-poor magma body forced upward by new magma that has not yet reached the surface.
Geologic Background. Galeras, a stratovolcano with a large breached caldera located immediately west of the city of Pasto, is one of Colombia's most frequently active volcanoes. The dominantly andesitic complex has been active for more than 1 million years, and two major caldera collapse eruptions took place during the late Pleistocene. Long-term extensive hydrothermal alteration has contributed to large-scale edifice collapse on at least three occasions, producing debris avalanches that swept to the west and left a large open caldera inside which the modern cone has been constructed. Major explosive eruptions since the mid-Holocene have produced widespread tephra deposits and pyroclastic flows that swept all but the southern flanks. A central cone slightly lower than the caldera rim has been the site of numerous small-to-moderate eruptions since the time of the Spanish conquistadors.
Information Contacts: INGEOMINAS-OVP; J. Stix, Univ de Montréal.
Gamalama (Indonesia) — November 1991 Cite this Report
Gamalama
Indonesia
0.81°N, 127.3322°E; summit elev. 1714 m
All times are local (unless otherwise noted)
Seismicity increases but no change in surface activity
Increased volcanic seismicity was recorded in early December, with the number of events rising from 24/day in the first week to 32/day the second week of the month. Typically, no more than five volcanic earthquakes are recorded daily at Gamalama. Surface activity was limited to low-pressure emission of vapor, rising 100-150 m above the crater rim.
Geologic Background. Gamalama is a near-conical stratovolcano that comprises the entire island of Ternate off the western coast of Halmahera, and is one of Indonesia's most active volcanoes. The island was a major regional center in the Portuguese and Dutch spice trade for several centuries, which contributed to the extensive documentation of activity. Three cones, progressively younger to the north, form the summit. Several maars and vents define a rift zone, parallel to the Halmahera island arc, that cuts the volcano; the S-flank Ngade maar formed after about 14,500–13,000 cal. BP (Faral et al., 2022). Eruptions, recorded frequently since the 16th century, typically originated from the summit craters, although flank eruptions have occurred in 1763, 1770, 1775, and 1962-63.
Information Contacts: VSI.
Cerro Hudson (Chile) — November 1991 Cite this Report
Cerro Hudson
Chile
45.9°S, 72.97°W; summit elev. 1905 m
All times are local (unless otherwise noted)
Large plumes on satellite images, probably wind-blown August tephra
Satellite images on 27 November revealed extensive gray plumes extending from the vicinity of Hudson more than 1,000 km across southern Argentina and the western Atlantic Ocean (figure 7). The next day, ash could be tracked over the Atlantic to beyond 40°W. Additional, smaller plumes were seen on 3 December satellite images. Although the plumes appeared to have been generated by new eruptive activity, observers near the volcano saw no tephra ejection and seismic instruments detected no change from background seismicity. These ash clouds were probably generated as strong winds remobilized fine ash from the August eruption. The press reported heavy ashfall at Mar del Plata, on Argentina's Atlantic coast >1,500 km NE of Hudson, on 2-3 December. All flights from nearby Camet airport were cancelled because of reduced visibility and mounds of ash blocking runways.
High winds and limited post-eruption rainfall may combine to make Hudson's ash deposits particularly mobile. During a flight into a town (Chile Chico) roughly 100 km SE of Hudson shortly after the eruption, Norman Banks observed an estimated 100-200 large dust devils that were simultaneously carrying ash to ~ 4,500 m altitude, where their swirling winds were dispersed by a shear layer. Above the shear layer, ash obscured the ground, and visibility was only an estimated 2 km at ground level.
Geologic Background. The ice-filled, 10-km-wide caldera of Cerro Hudson volcano was not recognized until its first 20th-century eruption in 1971. It is the southernmost volcano in the Chilean Andes, related to subduction of the Nazca plate beneath the South American plate. The massive volcano covers an area of 300 km2. The compound caldera is drained through a breach on its NW rim, which has been the source of mudflows down the Río de Los Huemeles. Two cinder cones occur N of the volcano and others occupy the SW and SE flanks. This volcano has been the source of several major Holocene explosive eruptions. An eruption about 6,700 years ago was one of the largest known in the southern Andes during the Holocene; another eruption about 3,600 years ago also produced more than 10 km3 of tephra. An eruption in 1991 formed a new 800-m-wide crater in the SW portion of the caldera.
Information Contacts: SAB; G. Stephens, NOAA/NESDIS; N. Banks, USGS; Buenos AiresHerald.
Irazu (Costa Rica) — November 1991 Cite this Report
Irazu
Costa Rica
9.979°N, 83.852°W; summit elev. 3436 m
All times are local (unless otherwise noted)
Fumarolic activity declines
The turquoise-green crater lake continued to rise in November. Fumarolic activity, concentrated in the N part of the crater, diminished considerably, and stopped entirely at some sites. Some submerged fumaroles persisted subaqueously. A fumarole in the NW part of the crater had a temperature of 90°C and a condensate pH of 3.5, both similar to measurements during the previous 2 months.
Geologic Background. The massive Irazú volcano in Costa Rica, immediately E of the capital city of San José, covers an area of 500 km2 and is vegetated to within a few hundred meters of its broad summit crater complex. At least 10 satellitic cones are located on its S flank. No lava effusion is known since the eruption of the Cervantes lava flows from S-flank vents about 14,000 years ago, and all known Holocene eruptions have been explosive. The focus of eruptions at the summit crater complex has migrated to the W towards the main crater, which contains a small lake. The first well-documented eruption occurred in 1723, and frequent explosive eruptions have occurred since. Ashfall from the last major eruption during 1963-65 caused significant disruption to San José and surrounding areas. Phreatic activity reported in 1994 may have been a landslide event from the fumarolic area on the NW summit (Fallas et al., 2018).
Information Contacts: E. Fernández and J. Barquero, OVSICORI.
Karkar (Papua New Guinea) — November 1991 Cite this Report
Karkar
Papua New Guinea
4.647°S, 145.976°E; summit elev. 1839 m
All times are local (unless otherwise noted)
Thermal areas shrink; continued deflation
"An inspection of Karkar was carried out on 8-11 November. Over the last few years, the areas of fumarolic activity have been in recession; the maximum temperature measured during the 1991 survey was 84°C. Cracks up to 10 cm wide had developed across Bagiai cone and seemed related to gravitational instability. This was most noticeable on Bagiai's SE flank, which borders on the 1979 crater.
"EDM and levelling lines and tilt arrays were re-surveyed. The clearest change since the last survey (in November 1990) was shown by the levelling measurements, which indicated a slight (-12 mm) but consistent subsidence in the center of the caldera floor relative to its outer margin. Steady subsidence of the central caldera floor has been recorded over the last 7 years by both levelling measurements and radial tilt vectors (typically -20 µrad/year). Changes along the EDM lines across the summit caldera were inconclusive, as they were within the uncertainty range of the measuring instrument.
"The overall picture gained over the last few years of measurement at Karkar is of a gradual progression into dormancy. As in previous years, vegetation was rapidly being re-established on the caldera floor and walls, on Bagiai cone, and in the crater produced by the 1979 eruption."
Geologic Background. Karkar is a 19 x 25 km forest-covered island that is truncated by two nested summit calderas. The 5.5 km outer caldera was formed during one or more eruptions, the last of which occurred 9,000 years ago. The steep-walled 300-m-deep, 3.2 km diameter, inner caldera was formed sometime between 1,500 and 800 years ago. Cones are present on the N and S flanks of this basaltic-to-andesitic volcano; a linear array of small cones extends from the northern rim of the outer caldera nearly to the coast. Recorded eruptions date back to 1643 from Bagiai, a pyroclastic cone constructed within the inner caldera, the floor of which is covered by young, mostly unvegetated andesitic lava flows.
Information Contacts: B. Talai and C. McKee, RVO.
Kilauea (United States) — November 1991 Cite this Report
Kilauea
United States
19.421°N, 155.287°W; summit elev. 1222 m
All times are local (unless otherwise noted)
Lava from new east rift fissure vents
Episode 49 (E-49). A line of fissures opened between the East rift zone's Pu`u `O`o and Kupaianaha vents early on 8 November, feeding lava fountains 1-3 m high [through 26 November]. The first fissure opened shortly before 0445 at the base of Pu`u `O`o cone, and others began opening progressively eastward (downrift), with the last developing around 0500 at the base of Kupaianaha shield. The first fissure had stopped erupting by 0930, after producing a small amount of pahoehoe lava. Fountain heights from the remaining en-echelon fissures progressively increased eastward. Fissures immediately uprift of 1123 cone (Pu'u Halulu, built during the first episode of the eruption in January 1983: figure 83) closely followed the line of fissures that formed during E-48 in July 1986 (11:7). That episode broke a pattern of brief, regularly recurring periods of vigorous lava production at Pu`u `O`o and culminated in the building of Kupaianaha shield.
By 1100 on 8 November, fountaining uprift of 1123 cone had subsided to quiet upwelling, feeding pahoehoe lava that advanced SE. Large channelized pahoehoe flows (changing to aa at their distal ends) emerged from the central fissures, near and immediately downrift of 1123 cone, abutting channelized pahoehoe flows from the E fissures. The flow from the easternmost fissure moved N and ponded against the base of Kupaianaha shield by 0950 (figure 83). Other flows from the E fissures moved SE along the edge of the Kupaianaha flow field, reaching ~640 m (2,100 ft) elevation by 1600.
Lava continued to pond near the new vents through the night. By early the next morning, lava from most of the vents had merged into a large channelized aa flow with a terminus near 630 m (2,080 ft) elevation. Only the fissures downrift of 1123 cone were active by the afternoon. Tubes had developed over lava channels near the 1123 fissures, although the frequent spatter activity occasionally ruptured tube roofs and formed small spatter cones near channel heads. Ponded lava covered the eastern fissures.
By 10 November, lava ponded N of the rift began to drain southward, adding to the volume of the flow moving SE. The channel head of the SE-moving flow was nearly 75 m wide, narrowing to ~30 m wide downslope. The flow surged between 1000 on 10 November and 1800 the next day, advancing nearly 4 km and entering the upper portion of the Royal Gardens subdivision. Eastern vent fountains reappeared with the draining of lava that had ponded next to the vents. By the 12th, all activity was confined to a single vent near the E end of the fissure system.
During the next week, the flow widened considerably and channel morphology changed frequently, but the flow front did not advance farther into Royal Gardens. On 18 November, tubes covered the immediate vent area, pahoehoe flowed in the channel to 610 m, then sluggish aa to 550 m. The channel appeared empty the next day, with small aa breakouts emerging from an apparent tube below the crusted channel floor at ~550 m elevation. Two new flows broke out near the vent area that day, but they did not advance far and stagnated within a few days. In the last reports of episode-49 activity, helicopter pilots observed ponded lava and lava moving in a vent-area skylight on 22-25 November, and a sluggish aa flow was seen in the channel on the 26th.
Effects of episode 49 on Pu`u `O`o. The lava pond in Pu`u `O`o crater was ~55 m below the rim between 1 and 4 November. Within a few hours of the onset of E-49 on 8 November, a large dust plume billowed from the crater, and by 0745, helicopter pilots reported that the lava pond had completely drained. At 1025, however, geologists observed an active lava pond ~85 m below the rim of Pu`u `O`o, while the crater floor appeared to remain at its previous level of 46 m below the rim. Rockfalls occurred regularly as the walls confining the pond collapsed. The lava pond seemed to remain active until a series of rockfalls occurred on 11 November, apparently caused by removal of lava and the resulting collapse of the crater floor, leaving a pile of rubble 72-118 m below the rim.
Continued lava production from Kupaianaha vent. Lava originating at Kupaianaha vent has built an extensive flow field since activity began there in July 1986. A well-developed tube system carries Kupaianaha's lava down Kīlauea's S flank toward the sea, with breakouts from tubes feeding surface flows. The small breakouts noted in Royal Gardens subdivision during the first week in November continued for several days after the onset of E-49 fissure activity, but were less frequent. No surface lava from the main (Wahaula) tube was observed on . . . 15-21 November. During that period, the level of lava in a persistent skylight at 655 m (2,150 ft) altitude dropped from ~11 m to ~20 m below the rim. Within the tube, the flow surface had begun to form a crust. Lava continued to move under the crust, but at a reduced rate. On 21 November, a spiny pahoehoe flow broke out of the Wahaula tube at ~550 m (1,820 ft) elevation and advanced ~200 m. Six days later, two new spiny pahoehoe flows emerged from large tumuli on the tube. Geologists speculated that the tube may have been stressed by the E-49 aa flow that passed directly over it downslope at 520 m (1,720 ft) altitude.
Geologic Background. Kilauea overlaps the E flank of the massive Mauna Loa shield volcano in the island of Hawaii. Eruptions are prominent in Polynesian legends; written documentation since 1820 records frequent summit and flank lava flow eruptions interspersed with periods of long-term lava lake activity at Halemaumau crater in the summit caldera until 1924. The 3 x 5 km caldera was formed in several stages about 1,500 years ago and during the 18th century; eruptions have also originated from the lengthy East and Southwest rift zones, which extend to the ocean in both directions. About 90% of the surface of the basaltic shield volcano is formed of lava flows less than about 1,100 years old; 70% of the surface is younger than 600 years. The long-term eruption from the East rift zone between 1983 and 2018 produced lava flows covering more than 100 km2, destroyed hundreds of houses, and added new coastline.
Information Contacts: T. Mattox, HVO.
Kirishimayama (Japan) — November 1991 Cite this Report
Kirishimayama
Japan
31.934°N, 130.862°E; summit elev. 1700 m
All times are local (unless otherwise noted)
Increased seismicity; gas emission
A swarm of microearthquakes began at around 2300 on 13 November beneath Shinmoe-dake cone. The number of earthquakes increased sharply the next day, and seismicity remained elevated until the morning of 26 November, with the exception of two brief quiet periods on 19-20 and 23-24 November (figure 2). Seismicity reached the highest level since the start of monitoring in 1965 (figure 3), while episodic and continuous volcanic tremor were recorded for the first time. Five volcanic tremor episodes were recorded 13-23 November, ranging from 0.2 to 2.5 µm in amplitude and 1-7 minutes in duration. Continuous weak volcanic tremor (0.1 µm amplitude) began at 0305 on 26 November.
Steam emission was first reported by tourists on 24 November, and confirmed during an overflight the following day. The plume rose 200-500 m from fumaroles on the E inner wall of the main crater; previous steam emission, last observed in 1990, had usually reached only a few meters high. Tremor and steam emissions continued as of 16 December.
Geologic Background. Kirishimayama is a large group of more than 20 Quaternary volcanoes located north of Kagoshima Bay. The late-Pleistocene to Holocene dominantly andesitic group consists of stratovolcanoes, pyroclastic cones, maars, and underlying shield volcanoes located over an area of 20 x 30 km. The larger stratovolcanoes are scattered throughout the field, with the centrally located Karakunidake being the highest. Onamiike and Miike, the two largest maars, are located SW of Karakunidake and at its far eastern end, respectively. Holocene eruptions have been concentrated along an E-W line of vents from Miike to Ohachi, and at Shinmoedake to the NE. Frequent small-to-moderate explosive eruptions have been recorded since the 8th century.
Information Contacts: JMA.
Lamington (Papua New Guinea) — November 1991 Cite this Report
Lamington
Papua New Guinea
8.95°S, 148.15°E; summit elev. 1680 m
All times are local (unless otherwise noted)
Long-term decline in thermal activity
"A brief aerial and ground inspection was carried out at the summit on 12 October. Most of the 1951 summit crater dome had a dense canopy of vegetation, broken only by a number of thermal areas scattered around the summit. Weak vapour emission was noted from fumaroles. Temperatures were measured in one of the larger thermal areas; the highest reading was 93°C. In 1973, the highest temperature recorded in the same thermal area was 362°C. This temperature decrease is consistent with the visual impression of declining activity. Seismic surveillance from a station near the summit was suspended in 1989; measurements in November revealed no volcanic seismicity."
Geologic Background. Lamington is an andesitic stratovolcano with a 1.3-km-wide breached summit crater containing a lava dome that rises above the coastal plain of the Papuan Peninsula of New Guinea north of the Owen Stanley Range. A summit complex of lava domes and crater remnants tops a low-angle base of volcaniclastic deposits dissected by radial valleys. A prominent broad "avalanche valley" extends northward from the breached crater. Ash layers from two early Holocene eruptions have been identified. In 1951 a powerful explosive eruption produced pyroclastic flows and surges that swept all sides of the volcano, killing nearly 3,000 people. The eruption concluded with growth of a 560-m-high lava dome in the summit crater.
Information Contacts: B. Talai and C. McKee, RVO.
Langila (Papua New Guinea) — November 1991 Cite this Report
Langila
Papua New Guinea
5.525°S, 148.42°E; summit elev. 1330 m
All times are local (unless otherwise noted)
Ash clouds; incandescent tephra
"Activity at Crater 2 remained moderately strong, while a slight decline was evident at Crater 3. Crater 2 activity consisted of continuous emission of pale ash clouds accompanied by occasional low rumbling noises. From 17 November onward, activity increased with occasional forceful eruptions of grey ash clouds, rising several kilometres above the crater, accompanied by loud or deep rumbling and explosion noises. Light ashfalls were recorded on 17, 25, and 28 November in coastal areas 10 km downwind . . . . Steady weak night glow was visible over the crater during the first half of the month, and ejections of glowing lava fragments to ~100 m above the crater rim were observed 17-26 November.
"Crater 3 activity was characterized by gentle pale-grey and blue emissions, and occasional sudden explosive ejections of thick grey ash clouds. Explosion sounds were heard 1-9 and 13-14 November. No night glow was observed.
"There was a further drop in Langila's seismic activity in November as a result of the decline in Crater 3 activity. The summit seismometer continued to record discontinuous tremor-like signals until 23 November. The daily totals of discrete events ranged from 1 to 28."
Geologic Background. Langila, one of the most active volcanoes of New Britain, consists of a group of four small overlapping composite basaltic-andesitic cones on the lower E flank of the extinct Talawe volcano in the Cape Gloucester area of NW New Britain. A rectangular, 2.5-km-long crater is breached widely to the SE; Langila was constructed NE of the breached crater of Talawe. An extensive lava field reaches the coast on the N and NE sides of Langila. Frequent mild-to-moderate explosive eruptions, sometimes accompanied by lava flows, have been recorded since the 19th century from three active craters at the summit. The youngest and smallest crater (no. 3 crater) was formed in 1960 and has a diameter of 150 m.
Information Contacts: B. Talai and C. McKee, RVO.
Lewotobi (Indonesia) — November 1991 Cite this Report
Lewotobi
Indonesia
8.542°S, 122.775°E; summit elev. 1703 m
All times are local (unless otherwise noted)
Continued gas emission
Degassing has continued since October, sometimes punctuated by ash ejection reaching 50-150 m above the crater. The number of degassing earthquakes dropped slightly from 246 during the first week of December to 233 in the second week. One B-type volcanic earthquake was recorded during the two-week period.
Geologic Background. The Lewotobi edifice in eastern Flores Island is composed of the two adjacent Lewotobi Laki-laki and Lewotobi Perempuan stratovolcanoes (the "husband and wife"). Their summits are less than 2 km apart along a NW-SE line. The conical Laki-laki to the NW has been frequently active during the 19th and 20th centuries, while the taller and broader Perempuan has had observed eruptions in 1921 and 1935. Small lava domes have grown during the 20th century in both of the summit craters, which are open to the north. A prominent cone, Iliwokar, occurs on the E flank of Perampuan.
Information Contacts: VSI.
Lokon-Empung (Indonesia) — November 1991 Cite this Report
Lokon-Empung
Indonesia
1.358°N, 124.792°E; summit elev. 1580 m
All times are local (unless otherwise noted)
Moderate explosions continue
Since the end of the vigorous activity that began on 24 October, 16 explosions from the active Tompaluan Crater have been recorded (figure 2). Ash column heights ranged from 200 m to >250 m above the rim of Tompaluan . . . . The most recent recorded explosion, on 1 December at 1717, was preceded by tremor that morning and the previous day. The press described an apparently unrecorded ash emission episode that produced a 300-m plume during the morning of 11 December. Gas rose to 200-300 m height between explosions. Local seismicity continued at somewhat reduced rates (figure 3).
VSI warned that additional explosions were still anticipated, and the area designated by their 1986 hazard map remained at risk. The press reported that [~10,000] people had fled the 24 October activity, but most had returned home by early December.
Geologic Background. The Lokong-Empung volcanic complex, rising above the plain of Tondano in North Sulawesi, includes four peaks and an active crater. Lokon, the highest peak, has a flat craterless top. The morphologically younger Empung cone 2 km NE has a 400-m-wide, 150-m-deep crater that erupted last in the 18th century. A ridge extending 3 km WNW from Lokon includes the Tatawiran and Tetempangan peaks. All eruptions since 1829 have originated from Tompaluan, a 150 x 250 m crater in the saddle between Lokon and Empung. These eruptions have primarily produced small-to-moderate ash plumes that sometimes damaged croplands and houses, but lava-dome growth and pyroclastic flows have also occurred.
Information Contacts: VSI; UPI.
Mahawu (Indonesia) — November 1991 Cite this Report
Mahawu
Indonesia
1.352°N, 124.865°E; summit elev. 1299 m
All times are local (unless otherwise noted)
Increased thermal activity
Mahawu began to show signs of renewed activity in mid-Nov, about a month after the eruption of Lokon-Empung, 7 km WNW. Temperatures increased at the solfataras and fumaroles in and around the crater lake, and a vapor column rose 50-200 m above the crater. Although no magmatic eruption was observed, mud boiling from the base of the crater lake generated tremor with 1-2 mm amplitude. No volcanic tremor was detected. As of mid-Dec, degassing episodes were decreasing in number and intensity.
Geologic Background. The elongated Mahawu volcano immediately east of Lokon-Empung volcano is the northernmost of a series of young volcanoes along a SSW-NNE line near the margin of the Quaternary Tondano caldera. Mahawu is capped by a 180-m-wide, 140-m-deep crater that sometimes contains a small crater lake, and has two pyroclastic cones on its N flank. Historical activity has been restricted to occasional small explosive eruptions recorded since 1789. In 1994 fumaroles, mudpots, and small geysers were observed along the shores of a greenish-colored crater lake.
Information Contacts: VSI.
Manam (Papua New Guinea) — November 1991 Cite this Report
Manam
Papua New Guinea
4.08°S, 145.037°E; summit elev. 1807 m
All times are local (unless otherwise noted)
Weak ash emission continues but incandescent tephra ejection stops; little deformation
Low levels of activity persisted in September-November, with weak white vapor emissions from Main Crater, and occasional gray ash emissions from Southern Crater. Incandescent tephra rose to ~50 m above the rim on 12 September, and to 80-120 m height on 17, 19, 21, and 23 October. No night glow was observed in November. Occasional weak rumbling noises were heard during October, and on 14, 20, and 24-25 November. Fine ashfall was reported on parts of the island on 18, 23-24, and 26-28 October; less-intense ash emissions occurred during the first half of September and the second half of November. Seismic activity remained at moderate levels, decreasing slightly in September, with small increases noted in mid-October and 10-12 November.
"A survey of Manam was carried out on 12 November. Changes along the EDM lines radial to the 1,750-m-high cone since the last survey (November 1990) were inconclusive, but could be interpreted as reflecting a slight deflation of the N flank (i.e. around Main Crater, the activity of which has markedly declined since a short period of stronger activity there in March-April 1991) and a slight inflation of the SW flank (i.e. around the mildly active Southern Crater). Dry-tilt stations are apparently too low on the flanks of the volcano to record significant changes. Overall, these ground deformation results reflect the low level of intermittent activity at the volcano over the last few years."
Geologic Background. The 10-km-wide island of Manam, lying 13 km off the northern coast of mainland Papua New Guinea, is one of the country's most active volcanoes. Four large radial valleys extend from the unvegetated summit of the conical basaltic-andesitic stratovolcano to its lower flanks. These valleys channel lava flows and pyroclastic avalanches that have sometimes reached the coast. Five small satellitic centers are located near the island's shoreline on the northern, southern, and western sides. Two summit craters are present; both are active, although most observed eruptions have originated from the southern crater, concentrating eruptive products during much of the past century into the SE valley. Frequent eruptions, typically of mild-to-moderate scale, have been recorded since 1616. Occasional larger eruptions have produced pyroclastic flows and lava flows that reached flat-lying coastal areas and entered the sea, sometimes impacting populated areas.
Information Contacts: B. Talai and C. McKee, RVO.
Merapi (Indonesia) — November 1991 Cite this Report
Merapi
Indonesia
7.54°S, 110.446°E; summit elev. 2910 m
All times are local (unless otherwise noted)
Degassing but no apparent lava dome growth; deformation data from 1988-90 and seismicity from 1990-91
The volume of the lava dome apparently remained stable at 6.8 x 10⁶ m3, and the temperature of the nearby solfatara was 806°C in early December, about the same as in November. Degassing continued, with the vapor column reaching 300 m height. December COSPEC measurements yielded SO2 emission rates of 73 t/d during the first week and 87 t/d the second week. Average plume velocity was 0.9-3.4 m/second. December is generally a rainy month at Merapi, and geologists were closely monitoring lahar hazards. Moderate seismicity continued to be recorded by nearby instruments (table 4).
Table 4. Local seismicity at Merapi during the first two weeks of December 1991. Courtesy of VSI.
| Dates |
Volcanic |
Multiphase volcanic |
Avalanche |
Tectonic |
| Dec 1991 - Week 1 |
3 |
5 |
10 |
13 |
| Dec 1991 - Week 2 |
13 |
4 |
6 |
4 |
[The following seismicity and deformation data were excerpted from 17:3] Comparison of distance measurements across the summit in June-July 1988 and September 1990, during to shortly after the later stages of the previous dome-building eruption, showed expansions that reached nearly 1 m (figure 1). Seismic data from 1990-91 show a strong increase in B-type events during the August 1990 crisis. B-type seismicity remained at increased levels through 1991 (figure 2).
Reference: Voight, B., 1988, A model for prediction of volcanic eruptions: Nature, v. 332, p. 125-130.
Geologic Background. Merapi, one of Indonesia's most active volcanoes, lies in one of the world's most densely populated areas and dominates the landscape immediately north of the major city of Yogyakarta. It is the youngest and southernmost of a volcanic chain extending NNW to Ungaran volcano. Growth of Old Merapi during the Pleistocene ended with major edifice collapse perhaps about 2,000 years ago, leaving a large arcuate scarp cutting the eroded older Batulawang volcano. Subsequent growth of the steep-sided Young Merapi edifice, its upper part unvegetated due to frequent activity, began SW of the earlier collapse scarp. Pyroclastic flows and lahars accompanying growth and collapse of the steep-sided active summit lava dome have devastated cultivated lands on the western-to-southern flanks and caused many fatalities.
Information Contacts: VSI; UPI; B. Voight, Pennsylvania State Univ.
Pacaya (Guatemala) — November 1991 Cite this Report
Pacaya
Guatemala
14.382°N, 90.601°W; summit elev. 2569 m
All times are local (unless otherwise noted)
Small explosions and lava flow
The following, from Michael Conway, describes 11 November fieldwork by geologists from INSIVUMEH and MTU. On 10 November, a small-volume lava flow began to erupt from the summit of MacKenney cone at about 1600. By the evening of the following day, the flow had traveled 50-100 m down the cone's S flank. This was the first time in several years that a flow was erupted onto the S flank, indicating that the powerful explosive eruptions of July and August resulted in major changes in the vent geometry of MacKenney cone.
Several small eruptions observed on the afternoon of 11 November produced black plumes that rose as much as several hundred meters above the vent, generally accompanied by a jetting sound. Widely spaced (50-125 m) en echelon fractures were identified on the W flank of MacKenney cone. The fractures began 10-30 m below the summit and continued down the flank for roughly 50-100 m. A series of point-source fumaroles marked the fractures, which may have originated as the W part of the cone sagged into an evacuated shallow magma chamber following the powerful pyroclastic eruptions of July-August.
Geologic Background. Eruptions from Pacaya are frequently visible from Guatemala City, the nation's capital. This complex basaltic volcano was constructed just outside the southern topographic rim of the 14 x 16 km Pleistocene Amatitlán caldera. A cluster of dacitic lava domes occupies the southern caldera floor. The post-caldera Pacaya massif includes the older Pacaya Viejo and Cerro Grande stratovolcanoes and the currently active Mackenney stratovolcano. Collapse of Pacaya Viejo between 600 and 1,500 years ago produced a debris-avalanche deposit that extends 25 km onto the Pacific coastal plain and left an arcuate scarp inside which the modern Pacaya volcano (Mackenney cone) grew. The NW-flank Cerro Chino crater was last active in the 19th century. During the past several decades, activity has consisted of frequent Strombolian eruptions with intermittent lava flow extrusion that has partially filled in the caldera moat and covered the flanks of Mackenney cone, punctuated by occasional larger explosive eruptions that partially destroy the summit.
Information Contacts: Rodolfo Morales and Otoniel Matías, Sección de Vulcanología, INSIVUMEH; Michael Conway, Michigan Technological Univ, USA.
Poas (Costa Rica) — November 1991 Cite this Report
Poas
Costa Rica
10.2°N, 84.233°W; summit elev. 2697 m
All times are local (unless otherwise noted)
Phreatic explosions end; sulfur emission from crater lake
The crater lake remained quiet in November. The water level rose 1.2 m relative to October, and had a temperature of 70°C. Evaporation at the lake surface remained strong and clots of sulfur dotted the turquoise-green water. Small columns of gas were carried W and SW. Fumaroles on the 1953-55 dome had temperatures of 90°C.
Geologic Background. The broad vegetated edifice of Poás, one of the most active volcanoes of Costa Rica, contains three craters along a N-S line. The frequently visited multi-hued summit crater lakes of the basaltic-to-dacitic volcano are easily accessible by vehicle from the nearby capital city of San José. A N-S-trending fissure cutting the complex stratovolcano extends to the lower N flank, where it has produced the Congo stratovolcano and several lake-filled maars. The southernmost of the two summit crater lakes, Botos, last erupted about 7,500 years ago. The more prominent geothermally heated northern lake, Laguna Caliente, is one of the world's most acidic natural lakes, with a pH of near zero. It has been the site of frequent phreatic and phreatomagmatic eruptions since an eruption was reported in 1828. Eruptions often include geyser-like ejections of crater-lake water.
Information Contacts: E. Fernández and J. Barquero, OVSICORI.
Rabaul (Papua New Guinea) — November 1991 Cite this Report
Rabaul
Papua New Guinea
4.2459°S, 152.1937°E; summit elev. 688 m
All times are local (unless otherwise noted)
Slight increase in seismicity
"There was a slight increase in seismicity in November. The total number of caldera earthquakes for the month was 347 (compared to 200 for October). The daily count fluctuated between 0 and 93. There were three earthquakes strong enough to be felt: a ML 2.0 event on 6 November in the E part of the caldera seismic zone, and events of M 1.4 and 1.9 on 21 and 22 November, respectively, in the W part of the zone. All other events had magnitudes <1.0. Of the 347 earthquakes, only 14 could be located. These clustered in the W, NW, and E parts of the caldera seismic zone."
Geologic Background. The low-lying Rabaul caldera on the tip of the Gazelle Peninsula at the NE end of New Britain forms a broad sheltered harbor utilized by what was the island's largest city prior to a major eruption in 1994. The outer flanks of the asymmetrical shield volcano are formed by thick pyroclastic-flow deposits. The 8 x 14 km caldera is widely breached on the east, where its floor is flooded by Blanche Bay and was formed about 1,400 years ago. An earlier caldera-forming eruption about 7,100 years ago is thought to have originated from Tavui caldera, offshore to the north. Three small stratovolcanoes lie outside the N and NE caldera rims. Post-caldera eruptions built basaltic-to-dacitic pyroclastic cones on the caldera floor near the NE and W caldera walls. Several of these, including Vulcan cone, which was formed during a large eruption in 1878, have produced major explosive activity during historical time. A powerful explosive eruption in 1994 occurred simultaneously from Vulcan and Tavurvur volcanoes and forced the temporary abandonment of Rabaul city.
Information Contacts: B. Talai and C. McKee, RVO.
Nevado del Ruiz (Colombia) — November 1991 Cite this Report
Nevado del Ruiz
Colombia
4.892°N, 75.324°W; summit elev. 5279 m
All times are local (unless otherwise noted)
Seismicity weak; no deformation evident
Seismic energy release and the number of earthquakes were at low levels, and only a few pulses of tremor were recorded in November. Deformation measurements showed no significant changes.
Geologic Background. Nevado del Ruiz is a broad, glacier-covered volcano in central Colombia that covers more than 200 km2. Three major edifices, composed of andesitic and dacitic lavas and andesitic pyroclastics, have been constructed since the beginning of the Pleistocene. The modern cone consists of a broad cluster of lava domes built within the caldera of an older edifice. The 1-km-wide, 240-m-deep Arenas crater occupies the summit. The prominent La Olleta pyroclastic cone located on the SW flank may also have been active in historical time. Steep headwalls of massive landslides cut the flanks. Melting of its summit icecap during historical eruptions, which date back to the 16th century, has resulted in devastating lahars, including one in 1985 that was South America's deadliest eruption.
Information Contacts: C. Carvajal, INGEOMINAS, Manizales.
Santa Maria (Guatemala) — November 1991 Cite this Report
Santa Maria
Guatemala
14.757°N, 91.552°W; summit elev. 3745 m
All times are local (unless otherwise noted)
Explosions and block lava flow; continued lahar-induced changes in S-flank drainages
"On 12-14 November geoscientists from INSIVUMEH and Michigan Technological Univ (MTU) spent 3-6 hours/day observing Santiaguito dome. Observation sites included the old Magermann 'Hotel', the Santiaguito Volcano Observatory (figure 21), and a N-S-trending ridge about 1 km E of Caliente vent.
"Activity during this period consisted of phreatic (or phreatomagmatic) and magmatic eruptions. Phreatic eruptions were semi-regular during the morning (one every 15-20 minutes from 0700 to 1100) and tapered off somewhat in the early afternoon to one every 30 or 45 minutes. After about 1400, clouds made observations impossible. Phreatic eruptions originated in the open crater of Caliente vent. They generally lasted 1-3 minutes and consisted of a vertical, white to light-gray plume comprised of gas, finely comminuted non-vesicular dacite glass, and subordinate amounts of fine-grained opaque minerals and plagioclase. Plumes typically rose 1-2 km above the vent where they were quickly beheaded and dispersed to the SW by prevailing winds.
"A block lava flow, active for about 16 months, continued to erupt from Caliente vent (figure 22). The flow had recently reached the headwaters of the Río Nimá I, where it changed direction from E to S. Because of constriction of the lava flow at this junction, its front had stagnated and fresh lava was piling up on the upper E flanks of Caliente. This oversteepened lava cap commonly produced small-volume hot rock avalanches; at night, incandescent avalanches were visible [from San Felipe, 14 km SSE]. As lava continued to pile up around the vent, the potential for a [lava flow] collapse increased. Such an event would likely produce a large block-and-ash flow and accompanying ash-cloud surge. In the past, most notably on 19 July 1989 and 19 July 1991, block-and-ash flows entered the Río Nimá drainages and traveled several kilometers downstream. Accompanying pyroclastic surges detached from the flows and traveled E, blowing down trees, scorching vegetation, and blanketing a several-km2 area E of the dome with ash and lapilli. Collapse of the lava flow cap on Caliente's E rim would probably produce similar effects.
"Lahars originating near Santiaguito continued to present a serious hazard in the Ríos Nimá I and II and the Río Samalá. The bridge over Río Nimá II at El Palmar, destroyed by a lahar in 1990, has since been replaced by a temporary structure. A lahar destroyed the foot bridge over the Río Samalá near San Felipe in July. The same month, a lahar broke through the perched levees of the Río Nimá II and spilled into the Río Nimá I near Finca Santa Marta ("new channel" on figure 23). The lahar temporarily dammed the Río Nimá I, producing a small reservoir 200 m long and nearly 2 m deep. The new channel linking the Ríos Nimá II and I was about 5 m wide and 6 m deep.
"Capture of the Río Nimá II by the Río Nimá I could seriously threaten local communities. In particular, El Palmar, on the E bank of the Río Nimá I, would be endangered by lahars and flood inundation. Furthermore, an increase in the hydraulic load of the Río Nimá I could result in its capture by the Río Samalá at the S end of El Palmar. Such an event would increase the probability of flooding or inundation by lahars downstream in the town of San Felipe. Moreover, a sudden increase in the sediment load of the Río Samalá could lead to temporary damming of the river. This in turn could cause flooding of Finca Las Marías, upstream in the Río Samalá."
Geologic Background. Symmetrical, forest-covered Santa María volcano is part of a chain of large stratovolcanoes that rise above the Pacific coastal plain of Guatemala. The sharp-topped, conical profile is cut on the SW flank by a 1.5-km-wide crater. The oval-shaped crater extends from just below the summit to the lower flank, and was formed during a catastrophic eruption in 1902. The renowned Plinian eruption of 1902 that devastated much of SW Guatemala followed a long repose period after construction of the large basaltic-andesite stratovolcano. The massive dacitic Santiaguito lava-dome complex has been growing at the base of the 1902 crater since 1922. Compound dome growth at Santiaguito has occurred episodically from four vents, with activity progressing E towards the most recent, Caliente. Dome growth has been accompanied by almost continuous minor explosions, with periodic lava extrusion, larger explosions, pyroclastic flows, and lahars.
Information Contacts: Rodolfo Morales and Otoniel Matías, INSIVUMEH; Michael Conway, Michigan Technological Univ.
Semeru (Indonesia) — November 1991 Cite this Report
Semeru
Indonesia
8.108°S, 112.922°E; summit elev. 3657 m
All times are local (unless otherwise noted)
More frequent explosions and tremor; lava avalanches
Emission of gas plumes, sometimes containing ash, to a maximum height of 600 m continued through early December. The press, citing an unnamed local volcanologist, reported that small explosions occurred as often as every 5 minutes after 4 December. Avalanches extended 500 m downslope from the growing lava dome. Explosion shocks were recorded at rates of 35-110/day, accompanied by 2-10 avalanche events daily. Volcanic tremor was more frequent in November than in October. Although activity was increasing, it remained within the normal range for the eruption . . . .
Geologic Background. Semeru, the highest volcano on Java, and one of its most active, lies at the southern end of a volcanic massif extending north to the Tengger caldera. The steep-sided volcano, also referred to as Mahameru (Great Mountain), rises above coastal plains to the south. Gunung Semeru was constructed south of the overlapping Ajek-ajek and Jambangan calderas. A line of lake-filled maars was constructed along a N-S trend cutting through the summit, and cinder cones and lava domes occupy the eastern and NE flanks. Summit topography is complicated by the shifting of craters from NW to SE. Frequent 19th and 20th century eruptions were dominated by small-to-moderate explosions from the summit crater, with occasional lava flows and larger explosive eruptions accompanied by pyroclastic flows that have reached the lower flanks of the volcano.
Information Contacts: VSI; UPI.
Soputan (Indonesia) — November 1991 Cite this Report
Soputan
Indonesia
1.112°N, 124.737°E; summit elev. 1785 m
All times are local (unless otherwise noted)
Incandescent ejecta; tremor
Nine episodes of volcanic tremor, lasting ~2 minutes each, and two A-type earthquakes were recorded 26-27 November. Night glow suggested that lava had been newly extruded into the crater. Similar activity occurred on 12 October. The press reported incandescent tephra ejection and an apparent lava flow on 9 December.
Geologic Background. The Soputan stratovolcano on the southern rim of the Quaternary Tondano caldera on the northern arm of Sulawesi Island is one of Sulawesi's most active volcanoes. The youthful, largely unvegetated volcano is the only active cone in the Sempu-Soputan volcanic complex, which includes the Soputan caldera, Rindengan, and Manimporok (3.5 km ESE). Kawah Masem maar was formed in the W part of the caldera and contains a crater lake; sulfur has been extracted from fumarolic areas in the maar since 1938. Recent eruptions have originated at both the summit crater and Aeseput, a prominent NE-flank vent that formed in 1906 and was the source of intermittent major lava flows until 1924.
Information Contacts: VSI; UPI.
Unzendake (Japan) — November 1991 Cite this Report
Unzendake
Japan
32.761°N, 130.299°E; summit elev. 1483 m
All times are local (unless otherwise noted)
Continued lava extrusion; fewer pyroclastic flows
Lava extrusion has continued . . . with rockfalls from domes frequently causing pyroclastic flows. Extrusion of the 4th in a series of lava domes began after the 15 September collapse of dome 3, which spawned a major pyroclastic flow. A seismic swarm began beneath the crater on 24 October and inflation of the upper part of dome 4 was first noted the next day. Inflation continued through November and seismicity increased gradually until 1 December, then declined. On 3 December, a new lobe emerged on the S side of dome 4, and it was continuing to grow a week later. The number of seismically counted pyroclastic flows was relatively low until late November, when frequent flows resumed. The flows, generated mainly from dome 4 and its early-December lobe, moved down the same valleys (Oshiga and Mizunashi) as in previous months. Ash clouds elutriated from the larger flows reached about 2 km height.
The following information, from Setsuya Nakada, describes November-early December surface activity.
Growth of lava dome 4 has continued in the depression left by the collapse of dome 3 on 15 September. By the end of October, dome 4 was 500 m long, with two lobes forming a crudely petal-shaped structure. Rough pressure ridges, convex downslope and of long wavelength, formed on the surface of dome 4, and thick lava layers piled atop each other were observed on its southern cliffs. New magma reached the surface along the narrow space between domes 2 and 4 and between the head of dome 4 and the remnants of dome 3, where it built new irregularly shaped lobes. Significant intrusion was indicated by swelling of the dome and uplift of the talus between domes 3 and 4. As the uplifted area expanded southward and northward, reddish blocky lava replaced the talus. Older domes were pushed S-SW, causing radial cracking in dome 3, where deformation was continuing in early December. Talus in front of the domes rested at angles as high as 33°, and parts of the dome 4 surface were even steeper.
Dome 4 has advanced little since early November, as frequent rockfalls from the dome front compensated for the additional magma supply. Rockfalls eroded and buried dome 2, but did not develop into pyroclastic flows as often in October and November as in previous months. Pyroclastic flows that traveled >2 km occurred at both the beginning and end of November. The early-November flow started from the head of dome 4, advanced across the dome, then entered the Oshiga valley. The latter flow, videotaped by Ground Self-Defense Force personnel, was generated by failure of ~ 105 m3 of dome-4 lava blocks, which broke into small pieces upon landing on dome 2, crossed a region of talus, then entered a narrow gorge that had not previously been filled by debris. Its average speed was calculated at 14.7 m/s (53 km/hour).
Geologic Background. The massive Unzendake volcanic complex comprises much of the Shimabara Peninsula east of the city of Nagasaki. An E-W graben, 30-40 km long, extends across the peninsula. Three large stratovolcanoes with complex structures, Kinugasa on the north, Fugen-dake at the east-center, and Kusenbu on the south, form topographic highs on the broad peninsula. Fugendake and Mayuyama volcanoes in the east-central portion of the andesitic-to-dacitic volcanic complex have been active during the Holocene. The Mayuyama lava dome complex, located along the eastern coast west of Shimabara City, formed about 4000 years ago and was the source of a devastating 1792 CE debris avalanche and tsunami. Historical eruptive activity has been restricted to the summit and flanks of Fugendake. The latest activity during 1990-95 formed a lava dome at the summit, accompanied by pyroclastic flows that caused fatalities and damaged populated areas near Shimabara City.
Information Contacts: S. Nakada, Kyushu Univ; JMA.
Westdahl (United States) — November 1991 Cite this Report
Westdahl
United States
54.516°N, 164.65°W; summit elev. 1563 m
All times are local (unless otherwise noted)
Lava flows and tephra from 8-km NE-flank fissure
Westdahl erupted at approximately 1700 on 29 November, sending a plume of steam and ash to more than 6 km altitude. The FAA immediately rerouted air traffic to the Pacific side of the eastern Aleutians to avoid encounters with the plume, which drifted NNE over the Bering Sea.
Video and still photographs from 30 November (courtesy of the U.S. Coast Guard, Peninsula Airways, and several civilians) show that the eruption occurred from a fissure, ~8 km long, extending down the NE flank from Westdahl Peak to an elevation of ~760 m. Several large craters and gaping sinuous cracks, parallel to the fissure, formed in snow and ice fields, probably by collapse due to melting. Ash venting occurred discontinuously along most of the fissure's length, but lava fountaining was concentrated along the lower few kilometers. Several streams of fluid lava traveled E down at least two steep-walled drainages. By the second day of the eruption, the principal lava flow had moved a distance of about 4 km. Based on observations by AVO staff from a Coast Guard C-130 aircraft on 3 December, the very active flow front was 1.5 km wide, 5-10 m high, and ~7 km from the vent [figure 5]. The lava flow consisted of blocky gray aa, and widened as it reached the broad valley draining to the Pacific Ocean. As of 3 December, the front was about 10 km from the ocean. Also observed on the overflight was a dark-colored debris-flow deposit that extended to the Pacific. Streams draining the NE flank were muddy and steaming slightly when observed on 30 November and 3 December. Lava fountaining was visible, during clear weather, through 10 December, and lava flows remained active on the NE flank.
Satellite imagery and pilot observations through mid-December indicated that the steam plume, periodically containing small quantities of ash, rose to as much as 7 km altitude and was preferentially carried NE. On 30 November, residents of False Pass, 90 km NE, reported ash-laden skies, fine ash deposition, and a strong sulfur smell that lasted into the night. Similar strong sulfur odors were reported by pilots up to several hundred kilometers inland. Light ashfall occurred again at False Pass on 9 and 12 December, and distant roaring and rumbling were occasionally heard at night through mid-December. No ash was reported in Cold Bay (145 km NE).
[No seismometers are installed on Westdahl, so information about seismicity associated with the eruption is limited. Data from the nearest seismic station, 170 km ENE of Westdahl (at Dutton), included six earthquakes of M 2.8-3.1 between 1100 and 1940 on 29 November. S-P values were consistent with epicenters in the Westdahl area, as were those recorded at Sand Point, 275 km ENE. The Dutton station also detected a tremor-like signal, different from typical noise at the site, between 1500 and 1949 on 29 November. (Originally in 17:01).]
Further Reference. Swanson, S., 1990, Westdahl, in Wood, C. and Kienle, J., Volcanoes of North America: Cambridge University Press, p. 45-46.
Geologic Background. Westdahl is a broad glacier-covered volcano occupying the SW end of Unimak Island. Two peaks protrude from the summit plateau, and a new crater formed in 1978 cuts the summit icecap. The volcano has a somewhat of a shield-like morphology and forms one of the largest volcanoes of the Aleutian Islands. The sharp-topped, conical Pogromni stratovolcano, 6 km N, rises several hundred meters higher than Westdahl, but is moderately glacially dissected and presumably older. Many satellitic cones of postglacial age are located along a NW-SE line cutting across the summit of Westdahl. Some of the historical eruptions attributed to the eroded Pogromni may have originated instead from Westdahl (Miller et al. 1998). The first historical eruption occurred in 1795. An 8-km-long fissure extending east from the summit produced explosive eruptions and lava flows in 1991.
Information Contacts: AVO; SAB; AP.
Whakaari/White Island (New Zealand) — November 1991 Cite this Report
Whakaari/White Island
New Zealand
37.52°S, 177.18°E; summit elev. 294 m
All times are local (unless otherwise noted)
Tephra emission continues from new crater
An explosive episode on 24 November at 1400 ejected a tephra column and produced an E-type seismic event detected by a nearby seismometer. The tephra column was seen from the mainland by helicopter pilot R. Fleming, who estimated that it rose to 2,000 m.
Fieldwork on 28 November revealed fresh andesitic scoria bombs scattered over a wide area from 250 m NE to 500 m ESE of its probable source, the new crater (Wade) that had formed in mid-October (BGVN 16:10). Bombs ranged to 50 cm across and most were irregularly shaped. As much as 2 cm of gray ash covered the brick-red ash erupted by the new crater in late October and early November. During the 2-hour visit, emission of gas and fine, gray-brown ash from Wade crater was essentially continuous, accompanied by constant loud rumbling and occasional clattering noises that were probably caused by rocks striking the vent walls. The new crater was much larger than when first seen on 23 October, forming an oval to sub-rectangular slot extending across the floor of the 1978/91 Crater complex. TV1 crater, roughly 100 m NE of Wade, weakly emitted vapor and fine gray ash. May 91 crater appeared quiet.
Geologic Background. The uninhabited Whakaari/White Island is the 2 x 2.4 km emergent summit of a 16 x 18 km submarine volcano in the Bay of Plenty about 50 km offshore of North Island. The island consists of two overlapping andesitic-to-dacitic stratovolcanoes. The SE side of the crater is open at sea level, with the recent activity centered about 1 km from the shore close to the rear crater wall. Volckner Rocks, sea stacks that are remnants of a lava dome, lie 5 km NW. Descriptions of volcanism since 1826 have included intermittent moderate phreatic, phreatomagmatic, and Strombolian eruptions; activity there also forms a prominent part of Maori legends. The formation of many new vents during the 19th and 20th centuries caused rapid changes in crater floor topography. Collapse of the crater wall in 1914 produced a debris avalanche that buried buildings and workers at a sulfur-mining project. Explosive activity in December 2019 took place while tourists were present, resulting in many fatalities. The official government name Whakaari/White Island is a combination of the full Maori name of Te Puia o Whakaari ("The Dramatic Volcano") and White Island (referencing the constant steam plume) given by Captain James Cook in 1769.
Information Contacts: C. Wood, DSIR Geology & Geophysics, Rotorua.
Yasur
Vanuatu
19.532°S, 169.447°E; summit elev. 361 m
All times are local (unless otherwise noted)
Strombolian activity and/or small lava lakes at four vents
The following is from a report by Gérard Granger on activity observed from the summit's main crater rim on 17 and 18 August (LAVE Bulletin, no. 34, Paris, France, p. 2-3).
Active lava lakes and/or Strombolian activity were visible at four vents (A, B, B', and B''; figure 2) within the large pit crater located at the center of the main crater. The fifth summit vent (C), NE of the central pit crater, appeared inactive.
Vent A is located within a deep cylindrical pit, with a 100-m-high nearly vertical S wall. Although the lava surface was not visible, continuous lava fountaining ejected material several meters above the rim. Rare explosions (two on 17 August during 9 hours of observations, and one during 6 hours the next day) threw lava clots 50-80 m above the rim.
Strombolian activity occurred at a small ash cone (vent B), just below the E rim of the central pit crater. Several tens of explosions occurred/hour, occasionally with 7-8 explosions in rapid succession. The narrow eruptive plume rose above the rim of the main summit crater, obscuring the view of vents B' and B'' from the SW rim (point N).
Located within a cinder cone at the NW base of the central pit-crater wall, the 10-m-wide vent B' was the site of the most intense activity. On 17 August, a small, continuously bubbling lava lake was periodically visible within the cone. By the following day, the surface level of the lake had dropped, and it was no longer visible. Approximately one explosion was heard/second, accompanied by ejections of fluid lava. Several (usually ~10) times/hour, a large explosion sent a fountain to 100 m height.
Vent B'' is located within a continuously incandescent crater, 80 m below the top of the NE wall of the central pit crater, where it joins crater C. Loud explosions occurred at a rate of 3 or 4/hour, dropping ballistics onto the pit crater rim. Large quantities of ash were emitted following the explosions.
Geologic Background. Yasur has exhibited essentially continuous Strombolian and Vulcanian activity at least since Captain Cook observed ash eruptions in 1774. This style of activity may have continued for the past 800 years. Located at the SE tip of Tanna Island in Vanuatu, this pyroclastic cone has a nearly circular, 400-m-wide summit crater. The active cone is largely contained within the small Yenkahe caldera, and is the youngest of a group of Holocene volcanic centers constructed over the down-dropped NE flank of the Pleistocene Tukosmeru volcano. The Yenkahe horst is located within the Siwi ring fracture, a 4-km-wide open feature associated with eruption of the andesitic Siwi pyroclastic sequence. Active tectonism along the Yenkahe horst accompanying eruptions has raised Port Resolution harbor more than 20 m during the past century.
Information Contacts: G. Granger, LAVE.