Recently Published Bulletin Reports
Kadovar (Papua New Guinea) An ash plume and weak thermal anomaly during May 2023
San Miguel (El Salvador) Small gas-and-ash explosions during March and May 2023
Ebeko (Russia) Continued explosions, ash plumes, and ashfall during October 2022-May 2023
Home Reef (Tonga) Discolored plumes continued during November 2022-April 2023
Semisopochnoi (United States) Occasional explosions, ash deposits, and gas-and-steam plumes during December 2022-May 2023
Ambae (Vanuatu) New lava flow, ash plumes, and sulfur dioxide plumes during February-May 2023
Ibu (Indonesia) Daily ash explosions continue, along with thermal anomalies in the crater, October 2022-May 2023
Dukono (Indonesia) Continuing ash emissions, SO2 plumes, and thermal signals during October 2022-May 2023
Sabancaya (Peru) Explosions, gas-and-ash plumes, and thermal activity persist during November 2022-April 2023
Sheveluch (Russia) Significant explosions destroyed part of the lava-dome complex during April 2023
Bezymianny (Russia) Explosions, ash plumes, lava flows, and avalanches during November 2022-April 2023
Chikurachki (Russia) New explosive eruption during late January-early February 2023
Kadovar (Papua New Guinea) — June 2023  Cite this Report
Kadovar
Papua New Guinea
3.608°S, 144.588°E; summit elev. 365 m
All times are local (unless otherwise noted)
An ash plume and weak thermal anomaly during May 2023
Kadovar is a 2-km-wide island that is the emergent summit of a Bismarck Sea stratovolcano. It lies off the coast of New Guinea, about 25 km N of the mouth of the Sepik River. Prior to an eruption that began in 2018, a lava dome formed the high point of the volcano, filling an arcuate landslide scarp open to the S. Submarine debris-avalanche deposits occur to the S of the island. The current eruption began in January 2018 and has comprised lava effusion from vents at the summit and at the E coast; more recent activity has consisted of ash plumes, weak thermal activity, and gas-and-steam plumes (BGVN 48:02). This report covers activity during February through May 2023 using information from the Darwin Volcanic Ash Advisory Center (VAAC) and satellite data.
Activity during the reporting period was relatively low and mainly consisted of white gas-and-steam plumes that were visible in natural color satellite images on clear weather days (figure 67). According to a Darwin VAAC report, at 2040 on 6 May an ash plume rose to 4.6 km altitude and drifted W; by 2300 the plume had dissipated. MODIS satellite instruments using the MODVOLC thermal algorithm detected a single thermal hotspot on the SE side of the island on 7 May. Weak thermal activity was also detected in a satellite image on the E side of the island on 14 May, accompanied by a white gas-and-steam plume that drifted SE (figure 68).
Geologic Background. The 2-km-wide island of Kadovar is the emergent summit of a Bismarck Sea stratovolcano of Holocene age. It is part of the Schouten Islands, and lies off the coast of New Guinea, about 25 km N of the mouth of the Sepik River. Prior to an eruption that began in 2018, a lava dome formed the high point of the andesitic volcano, filling an arcuate landslide scarp open to the south; submarine debris-avalanche deposits occur in that direction. Thick lava flows with columnar jointing forms low cliffs along the coast. The youthful island lacks fringing or offshore reefs. A period of heightened thermal phenomena took place in 1976. An eruption began in January 2018 that included lava effusion from vents at the summit and at the E coast.
Information Contacts: Darwin Volcanic Ash Advisory Centre (VAAC), Bureau of Meteorology, Northern Territory Regional Office, PO Box 40050, Casuarina, NT 0811, Australia (URL: http://www.bom.gov.au/info/vaac/); Hawai'i Institute of Geophysics and Planetology (HIGP) - MODVOLC Thermal Alerts System, School of Ocean and Earth Science and Technology (SOEST), Univ. of Hawai'i, 2525 Correa Road, Honolulu, HI 96822, USA (URL: http://modis.higp.hawaii.edu/); Copernicus Browser, Copernicus Data Space Ecosystem, European Space Agency (URL: https://dataspace.copernicus.eu/browser/).
San Miguel (El Salvador) — June 2023 Cite this Report
San Miguel
El Salvador
13.434°N, 88.269°W; summit elev. 2130 m
All times are local (unless otherwise noted)
Small gas-and-ash explosions during March and May 2023
San Miguel in El Salvador is a broad, deep crater complex that has been frequently modified by eruptions recorded since the early 16th century and consists of the summit known locally as Chaparrastique. Flank eruptions have produced lava flows that extended to the N, NE, and SE during the 17-19th centuries. The most recent activity has consisted of minor ash eruptions from the summit crater. The current eruption period began in November 2022 and has been characterized by frequent phreatic explosions, gas-and-ash emissions, and sulfur dioxide plumes (BGVN 47:12). This report describes small gas-and-ash explosions during December 2022 through May 2023 based on special reports from the Ministero de Medio Ambiente y Recursos Naturales (MARN).
Activity has been relatively low since the last recorded explosions on 29 November 2022. Seismicity recorded by the San Miguel Volcano Station (VSM) located on the N flank at 1.7 km elevation had decreased by 7 December. Sulfur dioxide gas measurements taken with DOAS (Differential Optical Absorption Spectroscopy) mobile equipment were below typical previously recorded values: 300 tons per day (t/d). During December, small explosions were recorded by the seismic network and manifested as gas-and-steam emissions.
Gas-and-ash explosions in the crater occurred during January 2023, which were recorded by the seismic network. Sulfur dioxide values remained low, between 300-400 t/d through 10 March. At 0817 on 14 January a gas-and-ash emission was visible in webcam images, rising just above the crater rim. Some mornings during February, small gas-and-steam plumes were visible in the crater. On 7 March at 2252 MARN noted an increase in degassing from the central crater; gas emissions were constantly observed through the early morning hours on 8 March. During the early morning of 8 March through the afternoon on 9 March, 12 emissions were registered, some accompanied by ash. The last gas-and-ash emission was recorded at 1210 on 9 March; very fine ashfall was reported in El Tránsito (10 km S), La Morita (6 km W), and La Piedrita (3 km W). The smell of sulfur was reported in Piedra Azul (5 km SW). On 16 March MARN reported that gas-and-steam emissions decreased.
Low degassing and very low seismicity were reported during April; no explosions have been detected between 9 March and 27 May. The sulfur dioxide emissions remained between 350-400 t/d; during 13-20 April sulfur dioxide values fluctuated between 30-300 t/d. Activity remained low through most of May; on 23 May seismicity increased. An explosion was detected at 1647 on 27 May generated a gas-and-ash plume that rose 700 m high (figure 32); a decrease in seismicity and gas emissions followed. The DOAS station installed on the W flank recorded sulfur dioxide values that reached 400 t/d on 27 May; subsequent measurements showed a decrease to 268 t/d on 28 May and 100 t/d on 29 May.
Geologic Background. The symmetrical cone of San Miguel, one of the most active volcanoes in El Salvador, rises from near sea level to form one of the country's most prominent landmarks. A broad, deep, crater complex that has been frequently modified by eruptions recorded since the early 16th century caps the truncated unvegetated summit, also known locally as Chaparrastique. Flanks eruptions of the basaltic-andesitic volcano have produced many lava flows, including several during the 17th-19th centuries that extended to the N, NE, and SE. The SE-flank flows are the largest and form broad, sparsely vegetated lava fields crossed by highways and a railroad skirting the base of the volcano. Flank vent locations have migrated higher on the edifice during historical time, and the most recent activity has consisted of minor ash eruptions from the summit crater.
Information Contacts: Ministero de Medio Ambiente y Recursos Naturales (MARN), Km. 5½ Carretera a Nueva San Salvador, Avenida las Mercedes, San Salvador, El Salvador (URL: http://www.snet.gob.sv/ver/vulcanologia).
Ebeko
Russia
50.686°N, 156.014°E; summit elev. 1103 m
All times are local (unless otherwise noted)
Continued explosions, ash plumes, and ashfall during October 2022-May 2023
Ebeko, located on the N end of Paramushir Island in the Kuril Islands, consists of three summit craters along a SSW-NNE line at the northern end of a complex of five volcanic cones. Eruptions date back to the late 18th century and have been characterized as small-to-moderate explosions from the summit crater, accompanied by intense fumarolic activity. The current eruption period began in June 2022 and has recently consisted of frequent explosions, ash plumes, and thermal activity (BGVN 47:10). This report covers similar activity during October 2022 through May 2023, based on information from the Kamchatka Volcanic Eruptions Response Team (KVERT) and satellite data.
Activity during October consisted of explosive activity, ash plumes, and occasional thermal anomalies. Visual data by volcanologists from Severo-Kurilsk showed explosions producing ash clouds up to 2.1-3 km altitude which drifted E, N, NE, and SE during 1-8, 10, 16, and 18 October. KVERT issued several Volcano Observatory Notices for Aviation (VONA) on 7, 13-15, and 27 October 2022, stating that explosions generated ash plumes that rose to 2.3-4 km altitude and drifted 5 km E, NE, and SE. Ashfall was reported in Severo-Kurilsk (Paramushir Island, about 7 km E) on 7 and 13 October. Satellite data showed a thermal anomaly over the volcano on 15-16 October. Visual data showed ash plumes rising to 2.5-3.6 km altitude on 22, 25-29, and 31 October and moving NE due to constant explosions.
Similar activity continued during November, with explosions, ash plumes, and ashfall occurring. KVERT issued VONAs on 1-2, 4, 6-7, 9, 13, and 16 November that reported explosions and resulting ash plumes that rose to 1.7-3.6 km altitude and drifted 3-5 km SE, ESE, E, and NE. On 1 November ash plumes extended as far as 110 km SE. On 5, 8, 12, and 24-25 November explosions and ash plumes rose to 2-3.1 km altitude and drifted N and E. Ashfall was observed in Severo-Kurilsk on 7 and 16 November. A thermal anomaly was visible during 1-4, 16, and 20 November. Explosions during 26 November rose as high as 2.7 km altitude and drifted NE (figure 45).
Explosions and ash plumes continued to occur in December. During 1-2 and 4 December volcanologists from Severo-Kurilsk observed explosions that sent ash to 1.9-2.5 km altitude and drifted NE and SE (figure 46). VONAs were issued on 5, 9, and 16 December reporting that explosions generated ash plumes rising to 1.9 km, 2.6 km, and 2.4 km altitude and drifted 5 km SE, E, and NE, respectively. A thermal anomaly was visible in satellite imagery on 16 December. On 18 and 27-28 December explosions produced ash plumes that rose to 2.5 km altitude and drifted NE and SE. On 31 December an ash plume rose to 2 km altitude and drifted NE.
Explosions continued during January 2023, based on visual observations by volcanologists from Severo-Kurilsk. During 1-7 January explosions generated ash plumes that rose to 4 km altitude and drifted NE, E, W, and SE. According to VONAs issued by KVERT on 2, 4, 10, and 23 January, explosions produced ash plumes that rose to 2-4 km altitude and drifted 5 km N, NE, E, and ENE; the ash plume that rose to 4 km altitude occurred on 10 January (figure 47). Satellite data showed a thermal anomaly during 3-4, 10, 13, 16, 21, 22, and 31 January. KVERT reported that an ash cloud on 4 January moved 12 km NE. On 6 and 9-11 January explosions sent ash plumes to 4.5 km altitude and drifted W and ESE. On 13 January an ash plume rose to 3 km altitude and drifted SE. During 20-24 January ash plumes from explosions rose to 3.7 km altitude and drifted SE, N, and NE. On 21 January the ash plume drifted as far as 40 km NE. During 28-29 and 31 January and 1 February ash plumes rose to 4 km altitude and drifted NE.
During February, explosions, ash plumes, and ashfall were reported. During 1, 4-5 and 7-8 February explosions generated ash plumes that rose to 4.5 km altitude and drifted E and NE; ashfall was observed on 5 and 8 February. On 6 February an explosion produced an ash plume that rose to 3 km altitude and drifted 7 km E, causing ashfall in Severo-Kurilsk. A thermal anomaly was visible in satellite data on 8, 9, 13, and 21 February. Explosions on 9 and 12-13 February produced ash plumes that rose to 4 km altitude and drifted E and NE; the ash cloud on 12 February extended as far as 45 km E. On 22 February explosions sent ash to 3 km altitude that drifted E. During 24 and 26-27 February ash plumes rose to 4 km altitude and drifted E. On 28 February an explosion sent ash to 2.5-3 km altitude and drifted 5 km E; ashfall was observed in Severo-Kurilsk.
Activity continued during March; visual observations showed that explosions generated ash plumes that rose to 3.6 km altitude on 3, 5-7, and 9-12 March and drifted E, NE, and NW. Thermal anomalies were visible on 10, 13, and 29-30 March in satellite imagery. On 18, 21-23, 26, and 29-30 March explosions produced ash plumes that rose to 2.8 km altitude and drifted NE and E; the ash plumes during 22-23 March extended up to 76 km E. A VONA issued on 21 March reported an explosion that produced an ash plume that rose to 2.8 km altitude and drifted 5 km E. Another VONA issued on 23 March reported that satellite data showed an ash plume rising to 3 km altitude and drifted 14 km E.
Explosions during April continued to generate ash plumes. On 1 and 4 April an ash plume rose to 2.8-3.5 km altitude and drifted SE and NE. A thermal anomaly was visible in satellite imagery during 1-6 April. Satellite data showed ash plumes and clouds rising to 2-3 km altitude and drifting up to 12 km SW and E on 3 and 6 April (figure 48). KVERT issued VONAs on 3, 5, 14, 16 April describing explosions that produced ash plumes rising to 3 km, 3.5 km, 3.5 km, and 3 km altitude and drifting 5 km S, 5 km NE and SE, 72 km NNE, and 5 km NE, respectively. According to satellite data, the resulting ash cloud from the explosion on 14 April was 25 x 7 km in size and drifted 72-104 km NNE during 14-15 April. According to visual data by volcanologists from Severo-Kurilsk explosions sent ash up to 3.5 km altitude that drifted NE and E during 15-16, 22, 25-26, and 29 April.
The explosive eruption continued during May. Explosions during 3-4, 6-7, and 9-10 May generated ash plumes that rose to 4 km altitude and drifted SW and E. Satellite data showed a thermal anomaly on 3, 9, 13-14, and 24 May. During 12-16, 23-25, and 27-28 May ash plumes rose to 3.5 km altitude and drifted in different directions due to explosions. Two VONA notices were issued on 16 and 25 May, describing explosions that generated ash plumes rising to 3 km and 3.5 km altitude, respectively and extending 5 km E. The ash cloud on 25 May drifted 75 km SE.
Thermal activity in the summit crater, occasionally accompanied by ash plumes and ash deposits on the SE and E flanks due to frequent explosions, were visible in infrared and true color satellite images (figure 49).
Geologic Background. The flat-topped summit of the central cone of Ebeko volcano, one of the most active in the Kuril Islands, occupies the northern end of Paramushir Island. Three summit craters located along a SSW-NNE line form Ebeko volcano proper, at the northern end of a complex of five volcanic cones. Blocky lava flows extend west from Ebeko and SE from the neighboring Nezametnyi cone. The eastern part of the southern crater contains strong solfataras and a large boiling spring. The central crater is filled by a lake about 20 m deep whose shores are lined with steaming solfataras; the northern crater lies across a narrow, low barrier from the central crater and contains a small, cold crescentic lake. Historical activity, recorded since the late-18th century, has been restricted to small-to-moderate explosive eruptions from the summit craters. Intense fumarolic activity occurs in the summit craters, on the outer flanks of the cone, and in lateral explosion craters.
Information Contacts: Kamchatka Volcanic Eruptions Response Team (KVERT), Far Eastern Branch, Russian Academy of Sciences, 9 Piip Blvd., Petropavlovsk-Kamchatsky, 683006, Russia (URL: http://www.kscnet.ru/ivs/kvert/); MIROVA (Middle InfraRed Observation of Volcanic Activity), a collaborative project between the Universities of Turin and Florence (Italy) supported by the Centre for Volcanic Risk of the Italian Civil Protection Department (URL: http://www.mirovaweb.it/); Copernicus Browser, Copernicus Data Space Ecosystem, European Space Agency (URL: https://dataspace.copernicus.eu/browser/).
Home Reef
Tonga
18.992°S, 174.775°W; summit elev. -10 m
All times are local (unless otherwise noted)
Discolored plumes continued during November 2022-April 2023
Home Reef is a submarine volcano located in the central Tonga islands between Lateiki (Metis Shoal) and Late Island. The first recorded eruption occurred in the mid-19th century, when an ephemeral island formed. An eruption in 1984 produced a 12-km-high eruption plume, a large volume of floating pumice, and an ephemeral island 500 x 1,500 m wide, with cliffs 30-50 m high that enclosed a water-filled crater. Another island-forming eruption in 2006 produced widespread pumice rafts that drifted as far as Australia; by 2008 the island had eroded below sea level. The previous eruption occurred during October 2022 and was characterized by a new island-forming eruption, lava effusion, ash plumes, discolored water, and gas-and-steam plumes (BGVN 47:11). This report covers discolored water plumes during November 2022 through April 2023 using satellite data.
Discolored plumes continued during the reporting period and were observed in true color satellite images on clear weather days. Satellite images show light green-yellow discolored water extending W on 8 and 28 November 2022 (figure 31), and SW on 18 November. Light green-yellow plumes extended W on 3 December, S on 13 December, SW on 18 December, and W and S on 23 December (figure 31). On 12 January 2023 discolored green-yellow plumes extended to the NE, E, SE, and N. The plume moved SE on 17 January and NW on 22 January. Faint discolored water in February was visible moving NE on 1 February. A discolored plume extended NW on 8 and 28 March and NW on 13 March (figure 31). During April, clear weather showed green-blue discolored plumes moving S on 2 April, W on 7 April, and NE and S on 12 April. A strong green-yellow discolored plume extended E and NE on 22 April for several kilometers (figure 31).
Geologic Background. Home Reef, a submarine volcano midway between Metis Shoal and Late Island in the central Tonga islands, was first reported active in the mid-19th century, when an ephemeral island formed. An eruption in 1984 produced a 12-km-high eruption plume, large amounts of floating pumice, and an ephemeral 500 x 1,500 m island, with cliffs 30-50 m high that enclosed a water-filled crater. In 2006 an island-forming eruption produced widespread dacitic pumice rafts that drifted as far as Australia. Another island was built during a September-October 2022 eruption.
Information Contacts: Copernicus Browser, Copernicus Data Space Ecosystem, European Space Agency (URL: https://dataspace.copernicus.eu/browser/).
Semisopochnoi (United States) — June 2023 Cite this Report
Semisopochnoi
United States
51.93°N, 179.58°E; summit elev. 1221 m
All times are local (unless otherwise noted)
Occasional explosions, ash deposits, and gas-and-steam plumes during December 2022-May 2023
Semisopochnoi is located in the western Aleutians, is 20-km-wide at sea level, and contains an 8-km-wide caldera. The three-peaked Mount Young (formerly Cerberus) was constructed within the caldera during the Holocene. Each of these peaks contains a summit crater; the lava flows on the N flank appear younger than those on the S side. The current eruption period began in early February 2021 and has more recently consisted of intermittent explosions and ash emissions (BGVN 47:12). This report updates activity during December 2022 through May 2023 using daily, weekly, and special reports from the Alaska Volcano Observatory (AVO). AVO monitors the volcano using local seismic and infrasound sensors, satellite data, web cameras, and remote infrasound and lightning networks.
Activity during most of December 2022 was relatively quiet; according to AVO no eruptive or explosive activity was observed since 7 November 2022. Intermittent tremor and occasional small earthquakes were observed in geophysical data. Continuous gas-and-steam emissions were observed from the N crater of Mount Young in webcam images on clear weather days (figure 25). On 24 December, there was a slight increase in earthquake activity and several small possible explosion signals were detected in infrasound data. Eruptive activity resumed on 27 December at the N crater of Mount Young; AVO issued a Volcano Activity Notice (VAN) that reported minor ash deposits on the flanks of Mount Young that extended as far as 1 km from the vent, according to webcam images taken during 27-28 December (figure 26). No ash plumes were observed in webcam or satellite imagery, but a persistent gas-and-steam plume that might have contained some ash rose to 1.5 km altitude. As a result, AVO raised the Aviation Color Code (ACC) to Orange (the second highest level on a four-color scale) and the Volcano Alert Level (VAL) to Watch (the second highest level on a four-level scale). Possible explosions were detected during 21 December 2022 through 1 January 2023 and seismic tremor was recorded during 30-31 December.
During January 2023 eruptive activity continued at the active N crater of Mount Young. Minor ash deposits were observed on the flanks, extending about 2 km SSW, based on webcam images from 1 and 3 January. A possible explosion occurred during 1-2 January based on elevated seismicity recorded on local seismometers and an infrasound signal recorded minutes later by an array at Adak. Though no ash plumes were observed in webcam or satellite imagery, a persistent gas-and-steam plume rose to 1.5 km altitude that might have carried minor traces of ash. Ash deposits were accompanied by periods of elevated seismicity and infrasound signals from the local geophysical network, which AVO reported were likely due to weak explosive activity. Low-level explosive activity was also detected during 2-3 January, with minor gas-and-steam emissions and a new ash deposit that was visible in webcam images. Low-level explosive activity was detected in geophysical data during 4-5 January, with elevated seismicity and infrasound signals observed on local stations. Volcanic tremor was detected during 7-9 January and very weak explosive activity was detected in seismic and infrasound data on 9 January. Weak seismic and infrasound signals were recorded on 17 January, which indicated minor explosive activity, but no ash emissions were observed in clear webcam images; a gas-and-steam plume continued to rise to 1.5 km altitude. During 29-30 January, ash deposits near the summit were observed on fresh snow, according to webcam images.
The active N cone at Mount Young continued to produce a gas-and-steam plume during February, but no ash emissions or explosive events were detected. Seismicity remained elevated with faint tremor during early February. Gas-and-steam emissions from the N crater were observed in clear webcam images on 11-13 and 16 February; no explosive activity was detected in seismic, infrasound, or satellite data. Seismicity has also decreased, with no significant seismic tremor observed since 25 January. Therefore, the ACC was lowered to Yellow (the second lowest level on a four-color scale) and the VAL was lowered to Advisory (the second lowest level on a four-color scale) on 22 February.
Gas-and-steam emissions persisted during March from the N cone of Mount Young, based on clear webcam images. A few brief episodes of weak tremor were detected in seismic data, although seismicity decreased over the month. A gas-and-steam plume detected in satellite data extended 150 km on 18 March. Low-level ash emissions from the N cone at Mount Young were observed in several webcam images during 18-19 March, in addition to small explosions and volcanic tremor. The ACC was raised to Orange and the VAL increased to Watch on 19 March. A small explosion was detected in seismic and infrasound data on 21 March.
Low-level unrest continued during April, although cloudy weather often obscured views of the summit; periods of seismic tremor and local earthquakes were recorded. During 3-4 April a gas-and-steam plume was visible traveling more than 200 km overnight; no ash was evident in the plume, according to AVO. A gas-and-steam plume was observed during 4-6 April that extended 400 km but did not seem to contain ash. Small explosions were detected in seismic and infrasound data on 5 April. Occasional clear webcam images showed continuing gas-and-steam emissions rose from Mount Young, but no ash deposits were observed on the snow. On 19 April small explosions and tremor were detected in seismic and infrasound data. A period of seismic tremor was detected during 22-25 April, with possible weak explosions on 25 April. Ash deposits were visible near the crater rim, but it was unclear if these deposits were recent or due to older deposits.
Occasional small earthquakes were recorded during May, but there were no signs of explosive activity seen in geophysical data. Gas-and-steam emissions continued from the N crater of Mount Young, based on webcam images, and seismicity remained slightly elevated. A new, light ash deposit was visible during the morning of 5 May on fresh snow on the NW flank of Mount Young. During 10 May periods of volcanic tremor were observed. The ACC was lowered to Yellow and the VAL to Advisory on 17 May due to no additional evidence of activity.
Geologic Background. Semisopochnoi, the largest subaerial volcano of the western Aleutians, is 20 km wide at sea level and contains an 8-km-wide caldera. It formed as a result of collapse of a low-angle, dominantly basaltic volcano following the eruption of a large volume of dacitic pumice. The high point of the island is Anvil Peak, a double-peaked late-Pleistocene cone that forms much of the island's northern part. The three-peaked Mount Cerberus (renamed Mount Young in 2023) was constructed within the caldera during the Holocene. Each of the peaks contains a summit crater; lava flows on the N flank appear younger than those on the south side. Other post-caldera volcanoes include the symmetrical Sugarloaf Peak SSE of the caldera and Lakeshore Cone, a small cinder cone at the edge of Fenner Lake in the NE part of the caldera. Most documented eruptions have originated from Young, although Coats (1950) considered that both Sugarloaf and Lakeshore Cone could have been recently active.
Information Contacts: Alaska Volcano Observatory (AVO), a cooperative program of a) U.S. Geological Survey, 4200 University Drive, Anchorage, AK 99508-4667 USA (URL: https://avo.alaska.edu/), b) Geophysical Institute, University of Alaska, PO Box 757320, Fairbanks, AK 99775-7320, USA, and c) Alaska Division of Geological & Geophysical Surveys, 794 University Ave., Suite 200, Fairbanks, AK 99709, USA (URL: http://dggs.alaska.gov/).
Ambae
Vanuatu
15.389°S, 167.835°E; summit elev. 1496 m
All times are local (unless otherwise noted)
New lava flow, ash plumes, and sulfur dioxide plumes during February-May 2023
Ambae, also known as Aoba, is a large basaltic shield volcano in Vanuatu. A broad pyroclastic cone containing three crater lakes (Manaro Ngoru, Voui, and Manaro Lakua) is located at the summit within the youngest of at least two nested calderas. Periodic phreatic and pyroclastic explosions have been reported since the 16th century. A large eruption more than 400 years ago resulted in a volcanic cone within the summit crater that is now filled by Lake Voui; the similarly sized Lake Manaro fills the western third of the caldera. The previous eruption ended in August 2022 that was characterized by gas-and-steam and ash emissions and explosions of wet tephra (BGVN 47:10). This report covers a new eruption during February through May 2023 that consisted of a new lava flow, ash plumes, and sulfur dioxide emissions, using information from the Vanuatu Meteorology and Geo-Hazards Department (VMGD) and satellite data.
During the reporting period, the Alert Level remained at a 2 (on a scale of 0-5), which has been in place since December 2021. Activity during October 2022 through March 2023 remained relatively low and mostly consisted of gas-and-steam emissions in Lake Voui. VMGD reported that at 1300 on 15 November a satellite image captured a strong amount of sulfur dioxide rising above the volcano (figure 99), and that seismicity slightly increased. The southern and northern part of the island reported a strong sulfur dioxide smell and heard explosions. On 20 February 2023 a gas-and-ash plume rose 1.3 km above the summit and drifted SSW, according to a webcam image (figure 100). Gas-and-steam and possibly ash emissions continued on 23 February and volcanic earthquakes were recorded by the seismic network.
During April, volcanic earthquakes and gas-and-steam and ash emissions were reported from the cone in Lake Voui. VMGD reported that activity increased during 5-7 April; high gas-and-steam and ash plumes were visible, accompanied by nighttime incandescence. According to a Wellington VAAC report, a low-level ash plume rose as high as 2.5 km above the summit and drifted W and SW on 5 April, based on satellite imagery. Reports in Saratamata stated that a dark ash plume drifted to the WSW, but no loud explosion was heard. Webcam images from 2100 showed incandescence above the crater and reflected in the clouds. According to an aerial survey, field observations, and satellite data, water was no longer present in the lake. A lava flow was reported effusing from the vent and traveling N into the dry Lake Voui, which lasted three days. The next morning at 0745 on 6 April a gas-and-steam and ash plume rose 5.4 km above the summit and drifted ESE, based on information from VMGD (figure 101). The Wellington VAAC also reported that light ashfall was observed on the island. Intermittent gas-and-steam and ash emissions were visible on 7 April, some of which rose to an estimated 3 km above the summit and drifted E. Webcam images during 0107-0730 on 7 April showed continuing ash emissions. A gas-and-steam and ash plume rose 695 m above the summit crater at 0730 on 19 April and drifted ESE, based on a webcam image (figure 102).
According to visual and infrared satellite data, water was visible in Lake Voui as late as 24 March 2023 (figure 103). The vent in the caldera showed a gas-and-steam plume drifted SE. On 3 April thermal activity was first detected, accompanied by a gas-and-ash plume that drifted W (figure 103). The lava flow moved N within the dry lake and was shown cooling by 8 April. By 23 April much of the water in the lake had returned. Occasional sulfur dioxide plumes were detected by the TROPOMI instrument on the Sentinel-5P satellite that exceeded 2 Dobson Units (DU) and drifted in different directions (figure 104).
Geologic Background. The island of Ambae, also known as Aoba, is a massive 2,500 km3 basaltic shield that is the most voluminous volcano of the New Hebrides archipelago. A pronounced NE-SW-trending rift zone with numerous scoria cones gives the 16 x 38 km island an elongated form. A broad pyroclastic cone containing three crater lakes (Manaro Ngoru, Voui, and Manaro Lakua) is located at the summit within the youngest of at least two nested calderas, the largest of which is 6 km in diameter. That large central edifice is also called Manaro Voui or Lombenben volcano. Post-caldera explosive eruptions formed the summit craters about 360 years ago. A tuff cone was constructed within Lake Voui (or Vui) about 60 years later. The latest known flank eruption, about 300 years ago, destroyed the population of the Nduindui area near the western coast.
Information Contacts: Geo-Hazards Division, Vanuatu Meteorology and Geo-Hazards Department (VMGD), Ministry of Climate Change Adaptation, Meteorology, Geo-Hazards, Energy, Environment and Disaster Management, Private Mail Bag 9054, Lini Highway, Port Vila, Vanuatu (URL: http://www.vmgd.gov.vu/, https://www.facebook.com/VanuatuGeohazardsObservatory/); Wellington Volcanic Ash Advisory Centre (VAAC), Meteorological Service of New Zealand Ltd (MetService), PO Box 722, Wellington, New Zealand (URL: http://www.metservice.com/vaac/, http://www.ssd.noaa.gov/VAAC/OTH/NZ/messages.html); MIROVA (Middle InfraRed Observation of Volcanic Activity), a collaborative project between the Universities of Turin and Florence (Italy) supported by the Centre for Volcanic Risk of the Italian Civil Protection Department (URL: http://www.mirovaweb.it/); Global Sulfur Dioxide Monitoring Page, Atmospheric Chemistry and Dynamics Laboratory, NASA Goddard Space Flight Center (NASA/GSFC), 8800 Greenbelt Road, Goddard, Maryland, USA (URL: https://so2.gsfc.nasa.gov/); Copernicus Browser, Copernicus Data Space Ecosystem, European Space Agency (URL: https://dataspace.copernicus.eu/browser/).
Ibu
Indonesia
1.488°N, 127.63°E; summit elev. 1325 m
All times are local (unless otherwise noted)
Daily ash explosions continue, along with thermal anomalies in the crater, October 2022-May 2023
Persistent eruptive activity since April 2008 at Ibu, a stratovolcano on Indonesian’s Halmahera Island, has consisted of daily explosive ash emissions and plumes, along with observations of thermal anomalies (BGVN 47:04). The current eruption continued during October 2022-May 2023, described below, based on advisories issued by the Pusat Vulkanologi dan Mitigasi Bencana Geologi (PVMBG, also known as Indonesian Center for Volcanology and Geological Hazard Mitigation, CVGHM), daily reports by MAGMA Indonesia (a PVMBG platform), and the Darwin Volcanic Ash Advisory Centre (VAAC), and various satellite data. The Alert Level during the reporting period remained at 2 (on a scale of 1-4), except raised briefly to 3 on 27 May, and the public was warned to stay at least 2 km away from the active crater and 3.5 km away on the N side of the volcano.
According to MAGMA Indonesia, during October 2022-May 2023, daily gray-and-white ash plumes of variable densities rose 200-1,000 m above the summit and drifted in multiple directions. On 30 October and 11 November, plumes rose a maximum of 2 km and 1.5 km above the summit, respectively (figures 42 and 43). According to the Darwin VAAC, discrete ash emissions on 13 November rose to 2.1 km altitude, or 800 m above the summit, and drifted W, and multiple ash emissions on 15 November rose 1.4 km above the summit and drifted NE. Occasional larger ash explosions through May 2023 prompted PVMBG to issue Volcano Observatory Notice for Aviation (VONA) alerts (table 6); the Aviation Color Code remained at Orange throughout this period.
Table 6. Volcano Observatory Notice for Aviation (VONA) ash plume alerts for Ibu issued by PVMBG during October 2022-May 2023. Maximum height above the summit was estimated by a ground observer. VONAs in January-May 2023 all described the ash plumes as dense.
| Date |
Time (local) |
Max height above summit |
Direction |
| 17 Oct 2022 |
0858 |
800 m |
SW |
| 18 Oct 2022 |
1425 |
800 m |
S |
| 19 Oct 2022 |
2017 |
600 m |
SW |
| 21 Oct 2022 |
0916 |
800 m |
NW |
| 16 Jan 2023 |
1959 |
600 m |
NE |
| 22 Jan 2023 |
0942 |
1,000 m |
E |
| 29 Jan 2023 |
2138 |
1,000 m |
E |
| 10 May 2023 |
0940 |
800 m |
NW |
| 10 May 2023 |
2035 |
600 m |
E |
| 21 May 2023 |
2021 |
600 m |
W |
| 21 May 2023 |
2140 |
1,000 m |
W |
| 29 May 2023 |
1342 |
800 m |
N |
| 31 May 2023 |
1011 |
1,000 m |
SW |
Sentinel-2 L1C satellite images throughout the reporting period show two, sometimes three persistent thermal anomalies in the summit crater, with the most prominent hotspot from the top of a cone within the crater. Clear views were more common during March-April 2023, when a vent and lava flows on the NE flank of the intra-crater cone could be distinguished (figure 44). White-to-grayish emissions were also observed during brief periods when weather clouds allowed clear views.
The MIROVA space-based volcano hotspot detection system recorded almost daily thermal anomalies throughout the reporting period, though cloud cover often interfered with detections. Data from imaging spectroradiometers aboard NASA’s Aqua and Terra satellites and processed using the MODVOLC algorithm (MODIS-MODVOLC) recorded hotspots on one day during October 2022 and December 2022, two days in April 2023, three days in November 2022 and May 2023, and four days in March 2023.
Geologic Background. The truncated summit of Gunung Ibu stratovolcano along the NW coast of Halmahera Island has large nested summit craters. The inner crater, 1 km wide and 400 m deep, has contained several small crater lakes. The 1.2-km-wide outer crater is breached on the N, creating a steep-walled valley. A large cone grew ENE of the summit, and a smaller one to the WSW has fed a lava flow down the W flank. A group of maars is located below the N and W flanks. The first observed and recorded eruption was a small explosion from the summit crater in 1911. Eruptive activity began again in December 1998, producing a lava dome that eventually covered much of the floor of the inner summit crater along with ongoing explosive ash emissions.
Information Contacts: Pusat Vulkanologi dan Mitigasi Bencana Geologi (PVMBG, also known as Indonesian Center for Volcanology and Geological Hazard Mitigation, CVGHM), Jalan Diponegoro 57, Bandung 40122, Indonesia (URL: http://www.vsi.esdm.go.id/); MAGMA Indonesia (Multiplatform Application for Geohazard Mitigation and Assessment in Indonesia), Kementerian Energi dan Sumber Daya Mineral (URL: https://magma.esdm.go.id/v1); Copernicus Browser, Copernicus Data Space Ecosystem, European Space Agency (URL: https://dataspace.copernicus.eu/browser/); MIROVA (Middle InfraRed Observation of Volcanic Activity), a collaborative project between the Universities of Turin and Florence (Italy) supported by the Centre for Volcanic Risk of the Italian Civil Protection Department (URL: http://www.mirovaweb.it/); Hawai'i Institute of Geophysics and Planetology (HIGP) - MODVOLC Thermal Alerts System, School of Ocean and Earth Science and Technology (SOEST), Univ. of Hawai'i, 2525 Correa Road, Honolulu, HI 96822, USA (URL: http://modis.higp.hawaii.edu/).
Dukono
Indonesia
1.6992°N, 127.8783°E; summit elev. 1273 m
All times are local (unless otherwise noted)
Continuing ash emissions, SO2 plumes, and thermal signals during October 2022-May 2023
Dukono, a remote volcano on Indonesia’s Halmahera Island, has been erupting continuously since 1933, with frequent ash explosions and sulfur dioxide plumes (BGVN 46:11, 47:10). This activity continued during October 2022 through May 2023, based on reports from the Pusat Vulkanologi dan Mitigasi Bencana Geologi (PVMBG; also known as Indonesian Center for Volcanology and Geological Hazard Mitigation, CVGHM), the Darwin Volcanic Ash Advisory Centre (VAAC), and satellite data. During this period, the Alert Level remained at 2 (on a scale of 1-4) and the public was warned to remain outside of the 2-km exclusion zone. The highest reported plume of the period reached 9.4 km above the summit on 14 November 2022.
According to MAGMA Indonesia (a platform developed by PVMBG), white, gray, or dark plumes of variable densities were observed almost every day during the reporting period, except when fog obscured the volcano (figure 33). Plumes generally rose 25-450 m above the summit, but rose as high as 700-800 m on several days, somewhat lower than the maximum heights reached earlier in 2022 when plumes reached as high as 1 km. However, the Darwin VAAC reported that on 14 November 2022, a discrete ash plume rose 9.4 km above the summit (10.7 km altitude), accompanied by a strong hotspot and a sulfur dioxide signal observed in satellite imagery; a continuous ash plume that day and through the 15th rose to 2.1-2.4 km altitude and drifted NE.
Sentinel-2 images were obscured by weather clouds almost every viewing day during the reporting period. However, the few reasonably clear images showed a hotspot and white or gray emissions and plumes. Strong SO2 plumes from Dukono were present on many days during October 2022-May 2023, as detected using the TROPOMI instrument on the Sentinel-5P satellite (figure 34).
Geologic Background. Reports from this remote volcano in northernmost Halmahera are rare, but Dukono has been one of Indonesia's most active volcanoes. More-or-less continuous explosive eruptions, sometimes accompanied by lava flows, have occurred since 1933. During a major eruption in 1550 CE, a lava flow filled in the strait between Halmahera and the N-flank Gunung Mamuya cone. This complex volcano presents a broad, low profile with multiple summit peaks and overlapping craters. Malupang Wariang, 1 km SW of the summit crater complex, contains a 700 x 570 m crater that has also been active during historical time.
Information Contacts: Pusat Vulkanologi dan Mitigasi Bencana Geologi (PVMBG, also known as Indonesian Center for Volcanology and Geological Hazard Mitigation, CVGHM), Jalan Diponegoro 57, Bandung 40122, Indonesia (URL: http://www.vsi.esdm.go.id/); MAGMA Indonesia (Multiplatform Application for Geohazard Mitigation and Assessment in Indonesia), Kementerian Energi dan Sumber Daya Mineral (URL: https://magma.esdm.go.id/v1); Darwin Volcanic Ash Advisory Centre (VAAC), Bureau of Meteorology, Northern Territory Regional Office, PO Box 40050, Casuarina, NT 0811, Australia (URL: http://www.bom.gov.au/info/vaac/); NASA Global Sulfur Dioxide Monitoring Page, Atmospheric Chemistry and Dynamics Laboratory, NASA Goddard Space Flight Center (NASA/GSFC), 8800 Greenbelt Road, Goddard, Maryland, USA (URL: https://so2.gsfc.nasa.gov/); Sentinel Hub Playground (URL: https://www.sentinel-hub.com/explore/sentinel-playground).
Sabancaya
Peru
15.787°S, 71.857°W; summit elev. 5960 m
All times are local (unless otherwise noted)
Explosions, gas-and-ash plumes, and thermal activity persist during November 2022-April 2023
Sabancaya is located in Peru, NE of Ampato and SE of Hualca Hualca. Eruptions date back to 1750 and have been characterized by explosions, phreatic activity, ash plumes, and ashfall. The current eruption period began in November 2016 and has more recently consisted of daily explosions, gas-and-ash plumes, and thermal activity (BGVN 47:11). This report updates activity during November 2022 through April 2023 using information from Instituto Geophysico del Peru (IGP) that use weekly activity reports and various satellite data.
Intermittent low-to-moderate power thermal anomalies were reported by the MIROVA project during November 2022 through April 2023 (figure 119). There were few short gaps in thermal activity during mid-December 2022, late December-to-early January 2023, late January to mid-February, and late February. According to data recorded by the MODVOLC thermal algorithm, there were a total of eight thermal hotspots: three in November 2022, three in February 2023, one in March, and one in April. On clear weather days, some of this thermal anomaly was visible in infrared satellite imagery showing the active lava dome in the summit crater (figure 120). Almost daily moderate-to-strong sulfur dioxide plumes were recorded during the reporting period by the TROPOMI instrument on the Sentinel-5P satellite (figure 121). Many of these plumes exceeded 2 Dobson Units (DU) and drifted in multiple directions.
IGP reported that moderate activity during November and December 2022 continued; during November, an average number of explosions were reported each week: 30, 33, 36, and 35, and during December, it was 32, 40, 47, 52, and 67. Gas-and-ash plumes in November rose 3-3.5 km above the summit and drifted E, NE, SE, S, N, W, and SW. During December the gas-and-ash plumes rose 2-4 km above the summit and drifted in different directions. There were 1,259 volcanic earthquakes recorded during November and 1,693 during December. Seismicity also included volcano-tectonic-type events that indicate rock fracturing events. Slight inflation was observed in the N part of the volcano near Hualca Hualca (4 km N). Thermal activity was frequently reported in the crater at the active lava dome (figure 120).
Explosive activity continued during January and February 2023. The average number of explosions were reported each week during January (51, 50, 60, and 59) and February (43, 54, 51, and 50). Gas-and-ash plumes rose 1.6-2.9 km above the summit and drifted NW, SW, and W during January and rose 1.4-2.8 above the summit and drifted W, SW, E, SE, N, S, NW, and NE during February. IGP also detected 1,881 volcanic earthquakes during January and 1,661 during February. VT-type earthquakes were also reported. Minor inflation persisted near Hualca Hualca. Satellite imagery showed continuous thermal activity in the crater at the lava dome (figure 120).
During March, the average number of explosions each week was 46, 48, 31, 35, and 22 and during April, it was 29, 41, 31, and 27. Accompanying gas-and-ash plumes rose 1.7-2.6 km above the summit crater and drifted W, SW, NW, S, and SE during March. According to a Buenos Aires Volcano Ash Advisory Center (VAAC) notice, on 22 March at 1800 through 23 March an ash plume rose to 7 km altitude and drifted NW. By 0430 an ash plume rose to 7.6 km altitude and drifted W. On 24 and 26 March continuous ash emissions rose to 7.3 km altitude and drifted SW and on 28 March ash emissions rose to 7.6 km altitude. During April, gas-and-ash plumes rose 1.6-2.5 km above the summit and drifted W, SW, S, NW, NE, and E. Frequent volcanic earthquakes were recorded, with 1,828 in March and 1,077 in April, in addition to VT-type events. Thermal activity continued to be reported in the summit crater at the lava dome (figure 120).
Geologic Background. Sabancaya, located in the saddle NE of Ampato and SE of Hualca Hualca volcanoes, is the youngest of these volcanic centers and the only one to have erupted in historical time. The oldest of the three, Nevado Hualca Hualca, is of probable late-Pliocene to early Pleistocene age. The name Sabancaya (meaning "tongue of fire" in the Quechua language) first appeared in records in 1595 CE, suggesting activity prior to that date. Holocene activity has consisted of Plinian eruptions followed by emission of voluminous andesitic and dacitic lava flows, which form an extensive apron around the volcano on all sides but the south. Records of historical eruptions date back to 1750.
Information Contacts: Instituto Geofisico del Peru (IGP), Centro Vulcanológico Nacional (CENVUL), Calle Badajoz N° 169 Urb. Mayorazgo IV Etapa, Ate, Lima 15012, Perú (URL: https://www.igp.gob.pe/servicios/centro-vulcanologico-nacional/inicio); Buenos Aires Volcanic Ash Advisory Center (VAAC), Servicio Meteorológico Nacional-Fuerza Aérea Argentina, 25 de mayo 658, Buenos Aires, Argentina (URL: http://www.smn.gov.ar/vaac/buenosaires/inicio.php); MIROVA (Middle InfraRed Observation of Volcanic Activity), a collaborative project between the Universities of Turin and Florence (Italy) supported by the Centre for Volcanic Risk of the Italian Civil Protection Department (URL: http://www.mirovaweb.it/); Hawai'i Institute of Geophysics and Planetology (HIGP) - MODVOLC Thermal Alerts System, School of Ocean and Earth Science and Technology (SOEST), Univ. of Hawai'i, 2525 Correa Road, Honolulu, HI 96822, USA (URL: http://modis.higp.hawaii.edu/); NASA Global Sulfur Dioxide Monitoring Page, Atmospheric Chemistry and Dynamics Laboratory, NASA Goddard Space Flight Center (NASA/GSFC), 8800 Greenbelt Road, Goddard MD 20771, USA (URL: https://so2.gsfc.nasa.gov/); Copernicus Browser, Copernicus Data Space Ecosystem, European Space Agency (URL: https://dataspace.copernicus.eu/browser/).
Sheveluch
Russia
56.653°N, 161.36°E; summit elev. 3283 m
All times are local (unless otherwise noted)
Significant explosions destroyed part of the lava-dome complex during April 2023
Sheveluch (also spelled Shiveluch) in Kamchatka, has had at least 60 large eruptions during the last 10,000 years. The summit is truncated by a broad 9-km-wide caldera that is breached to the S, and many lava domes occur on the outer flanks. The lava dome complex was constructed within the large open caldera. Frequent collapses of the dome complex have produced debris avalanches; the resulting deposits cover much of the caldera floor. A major south-flank collapse during a 1964 Plinian explosion produced a scarp in which a “Young Sheveluch” dome began to form in 1980. Repeated episodes of dome formation and destruction since then have produced major and minor ash plumes, pyroclastic flows, block-and-ash flows, and “whaleback domes” of spine-like extrusions in 1993 and 2020 (BGVN 45:11). The current eruption period began in August 1999 and has more recently consisted of lava dome growth, explosions, ash plumes, and avalanches (BGVN 48:01). This report covers a significant explosive eruption during early-to-mid-April 2023 that generated a 20 km altitude ash plume, produced a strong sulfur dioxide plume, and destroyed part of the lava-dome complex; activity described during January through April 2023 use information primarily from the Kamchatka Volcanic Eruptions Response Team (KVERT) and various satellite data.
Satellite data. Activity during the majority of this reporting period was characterized by continued lava dome growth, strong fumarole activity, explosions, and hot avalanches. According to the MODVOLC Thermal Alerts System, 140 hotspots were detected through the reporting period, with 33 recorded in January 2023, 29 in February, 44 in March, and 34 in April. Frequent strong thermal activity was recorded during January 2023 through April, according to the MIROVA (Middle InfraRed Observation of Volcanic Activity) graph and resulted from the continuously growing lava dome (figure 94). A slightly stronger pulse in thermal activity was detected in early-to-mid-April, which represented the significant eruption that destroyed part of the lava-dome complex. Thermal anomalies were also visible in infrared satellite imagery at the summit crater (figure 95).
During January 2023 KVERT reported continued growth of the lava dome, accompanied by strong fumarolic activity, incandescence from the lava dome, explosions, ash plumes, and avalanches. Satellite data showed a daily thermal anomaly over the volcano. Video data showed ash plumes associated with collapses at the dome that generated avalanches that in turn produced ash plumes rising to 3.5 km altitude and drifting 40 km W on 4 January and rising to 7-7.5 km altitude and drifting 15 km SW on 5 January. A gas-and-steam plume containing some ash that was associated with avalanches rose to 5-6 km altitude and extended 52-92 km W on 7 January. Explosions that same day produced ash plumes that rose to 7-7.5 km altitude and drifted 10 km W. According to a Volcano Observatory Notice for Aviation (VONA) issued at 1344 on 19 January, explosions produced an ash cloud that was 15 x 25 km in size and rose to 9.6-10 km altitude, drifting 21-25 km W; as a result, the Aviation Color Code (ACC) was raised to Red (the highest level on a four-color scale). Another VONA issued at 1635 reported that no more ash plumes were observed, and the ACC was lowered to Orange (the second highest level on a four-color scale). On 22 January an ash plume from collapses and avalanches rose to 5 km altitude and drifted 25 km NE and SW; ash plumes associated with collapses extended 70 km NE on 27 and 31 January.
Lava dome growth, fumarolic activity, dome incandescence, and occasional explosions and avalanches continued during February and March. A daily thermal anomaly was visible in satellite data. Explosions on 1 February generated ash plumes that rose to 6.3-6.5 km altitude and extended 15 km NE. Video data showed an ash cloud from avalanches rising to 5.5 km altitude and drifting 5 km SE on 2 February. Satellite data showed gas-and-steam plumes containing some ash rose to 5-5.5 km altitude and drifted 68-110 km ENE and NE on 6 February, to 4.5-5 km altitude and drifted 35 km WNW on 22 February, and to 3.7-4 km altitude and drifted 47 km NE on 28 February. Scientists from the Kamchatka Volcanological Station (KVS) went on a field excursion on 25 February to document the growing lava dome, and although it was cloudy most of the day, nighttime incandescence was visible. Satellite data showed an ash plume extending up to 118 km E during 4-5 March. Video data from 1150 showed an ash cloud from avalanches rose to 3.7-5.5 km altitude and drifted 5-10 km ENE and E on 5 March. On 11 March an ash plume drifted 62 km E. On 27 March ash plumes rose to 3.5 km altitude and drifted 100 km E. Avalanches and constant incandescence at the lava dome was focused on the E and NE slopes on 28 March. A gas-and-steam plume containing some ash rose to 3.5 km altitude and moved 40 km E on 29 March. Ash plumes on 30 March rose to 3.5-3.7 km altitude and drifted 70 km NE.
Similar activity continued during April, with lava dome growth, strong fumarolic activity, incandescence in the dome, occasional explosions, and avalanches. A thermal anomaly persisted throughout the month. During 1-4 April weak ash plumes rose to 2.5-3 km altitude and extended 13-65 km SE and E.
Activity during 11 April 2023. The Institute of Volcanology and Seismology, Far Eastern Branch, Russian Academy of Sciences (IVS FEB RAS) reported a significant increase in seismicity around 0054 on 11 April, as reported by strong explosions detected on 11 April beginning at 0110 that sent ash plumes up to 7-10 km altitude and extended 100-435 km W, WNW, NNW, WSW, and SW. According to a Tokyo VAAC report the ash plume rose to 15.8 km altitude. By 0158 the plume extended over a 75 x 100 km area. According to an IVS FEB RAS report, the eruptive column was not vertical: the initial plume at 0120 on 11 April deviated to the NNE, at 0000 on 12 April, it drifted NW, and by 1900 it drifted SW. KVS reported that significant pulses of activity occurred at around 0200, 0320, and then a stronger phase around 0600. Levin Dmitry took a video from near Békés (3 km away) at around 0600 showing a rising plume; he also reported that a pyroclastic flow traveled across the road behind him as he left the area. According to IVS FEB RAS, the pyroclastic flow traveled several kilometers SSE, stopping a few hundred meters from a bridge on the road between Klyuchi and Petropavlovsk-Kamchatsky.
Ashfall was first observed in Klyuchi (45 km SW) at 0630, and a large, black ash plume blocked light by 0700. At 0729 KVERT issued a Volcano Observatory Notice for Aviation (VONA) raising the Aviation Color Code to Red (the highest level on a four-color scale). It also stated that a large ash plume had risen to 10 km altitude and drifted 100 km W. Near-constant lightning strikes were reported in the plume and sounds like thunderclaps were heard until about 1000. According to IVS FEB RAS the cloud was 200 km long and 76 km wide by 0830, and was spreading W at altitudes of 6-12 km. In the Klyuchi Village, the layer of both ash and snow reached 8.5 cm (figure 96); ashfall was also reported in Kozyrevsk (112 km SW) at 0930, Mayskoye, Anavgay, Atlasovo, Lazo, and Esso. Residents in Klyuchi reported continued darkness and ashfall at 1100. In some areas, ashfall was 6 cm deep and some residents reported dirty water coming from their plumbing. According to IVS FEB RAS, an ash cloud at 1150 rose to 5-20 km altitude and was 400 km long and 250 km wide, extending W. A VONA issued at 1155 reported that ash had risen to 10 km and drifted 340 km NNW and 240 km WSW. According to Simon Carn (Michigan Technological University), about 0.2 Tg of sulfur dioxide in the plume was measured in a satellite image from the TROPOMI instrument on the Sentinel-5P satellite acquired at 1343 that covered an area of about 189,000 km2 (figure 97). Satellite data at 1748 showed an ash plume that rose to 8 km altitude and drifted 430 km WSW and S, according to a VONA.
Activity during 12-15 April 2023. On 12 April at 0730 satellite images showed ash plumes rose to 7-8 km altitude and extended 600 km SW, 1,050 km ESE, and 1,300-3,000 km E. By 1710 that day, the explosions weakened. According to news sources, the ash-and-gas plumes drifted E toward the Aleutian Islands and reached the Gulf of Alaska by 13 April, causing flight disruptions. More than 100 flights involving Alaska airspace were cancelled due to the plume. Satellite data showed ash plumes rising to 4-5.5 km altitude and drifted 400-415 km SE and ESE on 13 April. KVS volcanologists observed the pyroclastic flow deposits and noted that steam rose from downed, smoldering trees. They also noted that the deposits were thin with very few large fragments, which differed from previous flows. The ash clouds traveled across the Pacific Ocean. Flight cancellations were also reported in NW Canada (British Columbia) during 13-14 April. During 14-15 April ash plumes rose to 6 km altitude and drifted 700 km NW.
Alaskan flight schedules were mostly back to normal by 15 April, with only minor delays and far less cancellations; a few cancellations continued to be reported in Canada. Clear weather on 15 April showed that most of the previous lava-dome complex was gone and a new crater roughly 1 km in diameter was observed (figure 98); gas-and-steam emissions were rising from this crater. Evidence suggested that there had been a directed blast to the SE, and pyroclastic flows traveled more than 20 km. An ash plume rose to 4.5-5.2 km altitude and drifted 93-870 km NW on 15 April.
Activity during 16-30 April 2023. Resuspended ash was lifted by the wind from the slopes and rose to 4 km altitude and drifted 224 km NW on 17 April. KVERT reported a plume of resuspended ash from the activity during 10-13 April on 19 April that rose to 3.5-4 km altitude and drifted 146-204 km WNW. During 21-22 April a plume stretched over the Scandinavian Peninsula. A gas-and-steam plume containing some ash rose to 3-3.5 km altitude and drifted 60 km SE on 30 April. A possible new lava dome was visible on the W slope of the volcano on 29-30 April (figure 99); satellite data showed two thermal anomalies, a bright one over the existing lava dome and a weaker one over the possible new one.
References. Girina, O., Loupian, E., Horvath, A., Melnikov, D., Manevich, A., Nuzhdaev, A., Bril, A., Ozerov, A., Kramareva, L., Sorokin, A., 2023, Analysis of the development of the paroxysmal eruption of Sheveluch volcano on April 10–13, 2023, based on data from various satellite systems, ??????????? ???????? ??? ?? ???????, 20(2).
Geologic Background. The high, isolated massif of Sheveluch volcano (also spelled Shiveluch) rises above the lowlands NNE of the Kliuchevskaya volcano group. The 1,300 km3 andesitic volcano is one of Kamchatka's largest and most active volcanic structures, with at least 60 large eruptions during the Holocene. The summit of roughly 65,000-year-old Stary Shiveluch is truncated by a broad 9-km-wide late-Pleistocene caldera breached to the south. Many lava domes occur on its outer flanks. The Molodoy Shiveluch lava dome complex was constructed during the Holocene within the large open caldera; Holocene lava dome extrusion also took place on the flanks of Stary Shiveluch. Widespread tephra layers from these eruptions have provided valuable time markers for dating volcanic events in Kamchatka. Frequent collapses of dome complexes, most recently in 1964, have produced debris avalanches whose deposits cover much of the floor of the breached caldera.
Information Contacts: Kamchatka Volcanic Eruptions Response Team (KVERT), Far Eastern Branch, Russian Academy of Sciences, 9 Piip Blvd., Petropavlovsk-Kamchatsky, 683006, Russia (URL: http://www.kscnet.ru/ivs/kvert/); Institute of Volcanology and Seismology, Far Eastern Branch, Russian Academy of Sciences (IVS FEB RAS), 9 Piip Blvd., Petropavlovsk-Kamchatsky 683006, Russia (URL: http://www.kscnet.ru/ivs/eng/); Kamchatka Volcanological Station, Kamchatka Branch of Geophysical Survey, (KB GS RAS), Klyuchi, Kamchatka Krai, Russia (URL: http://volkstat.ru/); Hawai'i Institute of Geophysics and Planetology (HIGP) - MODVOLC Thermal Alerts System, School of Ocean and Earth Science and Technology (SOEST), Univ. of Hawai'i, 2525 Correa Road, Honolulu, HI 96822, USA (URL: http://modis.higp.hawaii.edu/); MIROVA (Middle InfraRed Observation of Volcanic Activity), a collaborative project between the Universities of Turin and Florence (Italy) supported by the Centre for Volcanic Risk of the Italian Civil Protection Department (URL: http://www.mirovaweb.it/); Copernicus Browser, Copernicus Data Space Ecosystem, European Space Agency (URL: https://dataspace.copernicus.eu/browser/); Kam 24 News Agency, 683032, Kamchatka Territory, Petropavlovsk-Kamchatsky, Vysotnaya St., 2A (URL: https://kam24.ru/news/main/20230411/96657.html#.Cj5Jrky6.dpuf); Simon Carn, Geological and Mining Engineering and Sciences, Michigan Technological University, 1400 Townsend Drive, Houghton, MI 49931, USA (URL: http://www.volcarno.com/, Twitter: @simoncarn).
Bezymianny
Russia
55.972°N, 160.595°E; summit elev. 2882 m
All times are local (unless otherwise noted)
Explosions, ash plumes, lava flows, and avalanches during November 2022-April 2023
Bezymianny is located on the Kamchatka Peninsula of Russia as part of the Klyuchevskoy volcano group. Historic eruptions began in 1955 and have been characterized by dome growth, explosions, pyroclastic flows, ash plumes, and ashfall. During the 1955-56 eruption a large open crater was formed by collapse of the summit and an associated lateral blast. Subsequent episodic but ongoing lava-dome growth, accompanied by intermittent explosive activity and pyroclastic flows, has largely filled the 1956 crater. The current eruption period began in December 2016 and more recent activity has consisted of strong explosions, ash plumes, and thermal activity (BGVN 47:11). This report covers activity during November 2022 through April 2023, based on weekly and daily reports from the Kamchatka Volcano Eruptions Response Team (KVERT) and satellite data.
Activity during November and March 2023 was relatively low and mostly consisted of gas-and-steam emissions, occasional small collapses that generated avalanches along the lava dome slopes, and a persistent thermal anomaly over the volcano that was observed in satellite data on clear weather days. According to the Tokyo VAAC and KVERT, an explosion produced an ash plume that rose to 6 km altitude and drifted 25 km NE at 1825 on 29 March.
Gas-and-steam emissions, collapses generating avalanches, and thermal activity continued during April. According to two Volcano Observatory Notice for Aviation (VONA) issued on 2 and 6 April (local time) ash plumes rose to 3 km and 3.5-3.8 km altitude and drifted 35 km E and 140 km E, respectively. Satellite data from KVERT showed weak ash plumes extending up to 550 km E on 2 and 5-6 April.
A VONA issued at 0843 on 7 April described an ash plume that rose to 4.5-5 km altitude and drifted 250 km ESE. Later that day at 1326 satellite data showed an ash plume that rose to 5.5-6 km altitude and drifted 150 km ESE. A satellite image from 1600 showed an ash plume extending as far as 230 km ESE; KVERT noted that ash emissions were intensifying, likely due to avalanches from the growing lava dome. The Aviation Color Code (ACC) was raised to Red (the highest level on a four-color scale). At 1520 satellite data showed an ash plume rising to 5-5.5 km altitude and drifting 230 km ESE. That same day, Kamchatka Volcanological Station (KVS) volcanologists traveled to Ambon to collect ash; they reported that a notable eruption began at 1730, and within 20 minutes a large ash plume rose to 10 km altitude and drifted NW. KVERT reported that the strong explosive phase began at 1738. Video and satellite data taken at 1738 showed an ash plume that rose to 10-12 km altitude and drifted up to 2,800 km SE and E. Explosions were clearly audible 20 km away for 90 minutes, according to KVS. Significant amounts of ash fell at the Apakhonchich station, which turned the snow gray; ash continued to fall until the morning of 8 April. In a VONA issued at 0906 on 8 April, KVERT stated that the explosive eruption had ended; ash plumes had drifted 2,000 km E. The ACC was lowered to Orange (the third highest level on a four-color scale). The KVS team saw a lava flow on the active dome once the conditions were clear that same day (figure 53). On 20 April lava dome extrusion was reported; lava flows were noted on the flanks of the dome, and according to KVERT satellite data, a thermal anomaly was observed in the area. The ACC was lowered to Yellow (the second lowest on a four-color scale).
Satellite data showed an increase in thermal activity beginning in early April 2023. A total of 31 thermal hotspots were detected by the MODVOLC thermal algorithm on 4, 5, 7, and 12 April 2023. The elevated thermal activity resulted from an increase in explosive activity and the start of an active lava flow. The MIROVA (Middle InfraRed Observation of Volcanic Activity) volcano hotspot detection system based on the analysis of MODIS data also showed a pulse in thermal activity during the same time (figure 54). Infrared satellite imagery captured a continuous thermal anomaly at the summit crater, often accompanied by white gas-and-steam emissions (figure 55). On 4 April 2023 an active lava flow was observed descending the SE flank.
Geologic Background. The modern Bezymianny, much smaller than its massive neighbors Kamen and Kliuchevskoi on the Kamchatka Peninsula, was formed about 4,700 years ago over a late-Pleistocene lava-dome complex and an edifice built about 11,000-7,000 years ago. Three periods of intensified activity have occurred during the past 3,000 years. The latest period, which was preceded by a 1,000-year quiescence, began with the dramatic 1955-56 eruption. This eruption, similar to that of St. Helens in 1980, produced a large open crater that was formed by collapse of the summit and an associated lateral blast. Subsequent episodic but ongoing lava-dome growth, accompanied by intermittent explosive activity and pyroclastic flows, has largely filled the 1956 crater.
Information Contacts: Kamchatka Volcanic Eruptions Response Team (KVERT), Far Eastern Branch, Russian Academy of Sciences, 9 Piip Blvd., Petropavlovsk-Kamchatsky, 683006, Russia (URL: http://www.kscnet.ru/ivs/kvert/); Kamchatka Volcanological Station, Kamchatka Branch of Geophysical Survey, (KB GS RAS), Klyuchi, Kamchatka Krai, Russia (URL: http://volkstat.ru/); Hawai'i Institute of Geophysics and Planetology (HIGP) - MODVOLC Thermal Alerts System, School of Ocean and Earth Science and Technology (SOEST), Univ. of Hawai'i, 2525 Correa Road, Honolulu, HI 96822, USA (URL: http://modis.higp.hawaii.edu/); MIROVA (Middle InfraRed Observation of Volcanic Activity), a collaborative project between the Universities of Turin and Florence (Italy) supported by the Centre for Volcanic Risk of the Italian Civil Protection Department (URL: http://www.mirovaweb.it/); Copernicus Browser, Copernicus Data Space Ecosystem, European Space Agency (URL: https://dataspace.copernicus.eu/browser/).
Chikurachki
Russia
50.324°N, 155.461°E; summit elev. 1781 m
All times are local (unless otherwise noted)
New explosive eruption during late January-early February 2023
Chikurachki, located on Paramushir Island in the northern Kuriles, has had Plinian eruptions during the Holocene. Lava flows have reached the sea and formed capes on the NW coast; several young lava flows are also present on the E flank beneath a scoria deposit. Reported eruptions date back to 1690, with the most recent eruption period occurring during January through October 2022, characterized by occasional explosions, ash plumes, and thermal activity (BGVN 47:11). This report covers a new eruptive period during January through February 2023 that consisted of ash explosions and ash plumes, based on information from the Kamchatka Volcanic Eruptions Response Team (KVERT) and satellite data.
According to reports from KVERT, an explosive eruption began around 0630 on 29 January. Explosions generated ash plumes that rose to 3-3.5 km altitude and drifted 6-75 km SE and E, based on satellite data. As a result, the Aviation Color Code (ACC) was raised to Orange (the second highest level on a four-color scale). At 1406 and 1720 ash plumes were identified in satellite images that rose to 4.3 km altitude and extended 70 km E. By 2320 the ash plume had dissipated. A thermal anomaly was visible at the volcano on 31 January, according to a satellite image, and an ash plume was observed drifting 66 km NE.
Occasional explosions and ash plumes continued during early February. At 0850 on 1 February an ash plume rose to 3.5 km altitude and drifted 35 km NE. Satellite data showed an ash plume that rose to 3.2-3.5 km altitude and drifted 50 km NE at 1222 later that day (figure 22). A thermal anomaly was detected over the volcano during 5-6 February and ash plumes drifted as far as 125 km SE, E, and NE. Explosive events were reported at 0330 on 6 February that produced ash plumes rising to 4-4.5 km altitude and drifting 72-90 km N, NE, and ENE. KVERT noted that the last gas-and steam plume that contained some ash was observed on 8 February and drifted 55 km NE before the explosive eruption ended. The ACC was lowered to Yellow and then Green (the lowest level on a four-color scale) on 18 February.
Geologic Background. Chikurachki, the highest volcano on Paramushir Island in the northern Kuriles, is a relatively small cone constructed on a high Pleistocene edifice. Oxidized basaltic-to-andesitic scoria deposits covering the upper part of the young cone give it a distinctive red color. Frequent basaltic Plinian eruptions have occurred during the Holocene. Lava flows have reached the sea and formed capes on the NW coast; several young lava flows are also present on the E flank beneath a scoria deposit. The Tatarinov group of six volcanic centers is located immediately to the south, and the Lomonosov cinder cone group, the source of an early Holocene lava flow that reached the saddle between it and Fuss Peak to the west, lies at the southern end of the N-S-trending Chikurachki-Tatarinov complex. In contrast to the frequently active Chikurachki, the Tatarinov centers are extensively modified by erosion and have a more complex structure. Tephrochronology gives evidence of an eruption around 1690 CE from Tatarinov, although its southern cone contains a sulfur-encrusted crater with fumaroles that were active along the margin of a crater lake until 1959.
Information Contacts: Kamchatka Volcanic Eruptions Response Team (KVERT), Far East Division, Russian Academy of Sciences, 9 Piip Blvd., Petropavlovsk-Kamchatsky, 683006, Russia (URL: http://www.kscnet.ru/ivs/); Copernicus Browser, Copernicus Data Space Ecosystem, European Space Agency (URL: https://dataspace.copernicus.eu/browser/).
Search Bulletin Archive by Publication Date
Select a month and year from the drop-downs and click "Show Issue" to have that issue displayed in this tab.
The default month and year is the latest issue available.
Bulletin of the Global Volcanism Network - Volume 20, Number 03 (March 1995)
Managing Editor: Richard Wunderman
Aira (Japan)
Explosive eruptions send plumes 3-4 km above the summit
Alcedo (Ecuador)
Two craters on the SW caldera wall linked to a 1993 eruption
Arenal (Costa Rica)
Eruptions and lava flows continue; ash deposition rate quantified
Asosan (Japan)
Mud ejection beyond the crater and an ash cloud to 1 km
Cameroon (Cameroon)
Seismicity in 1994 declines from 1993 levels
Fernandina (Ecuador)
Lava enters the sea at three locations; ejections from lava lake
Fogo (Cabo Verde)
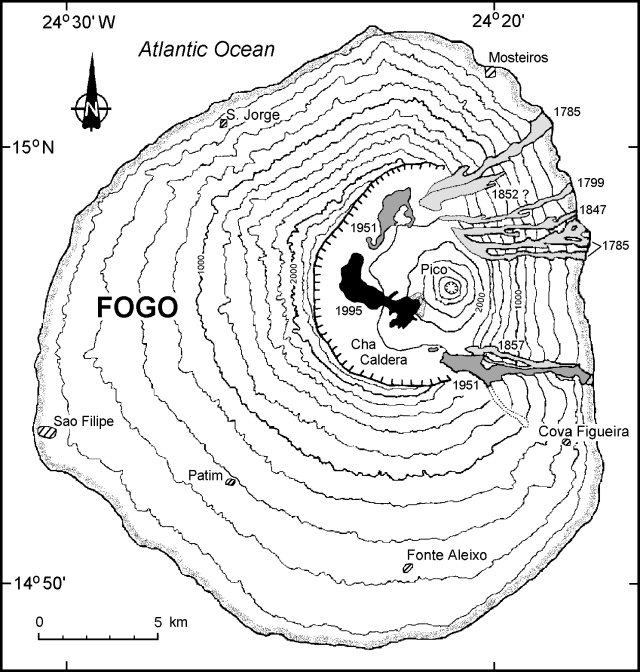
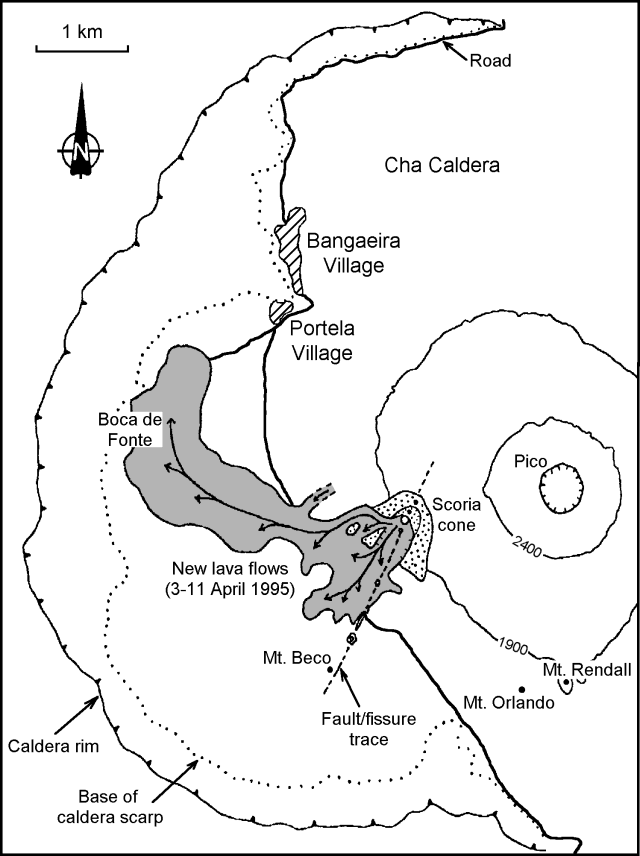
New eruption on 2 April generates lava flows within the caldera
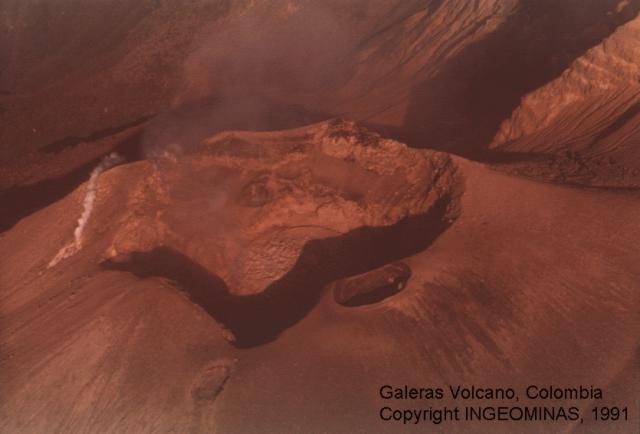
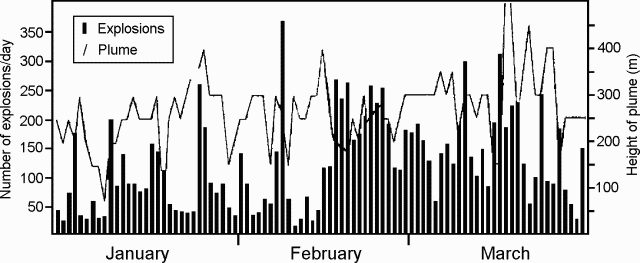
Galeras (Colombia)
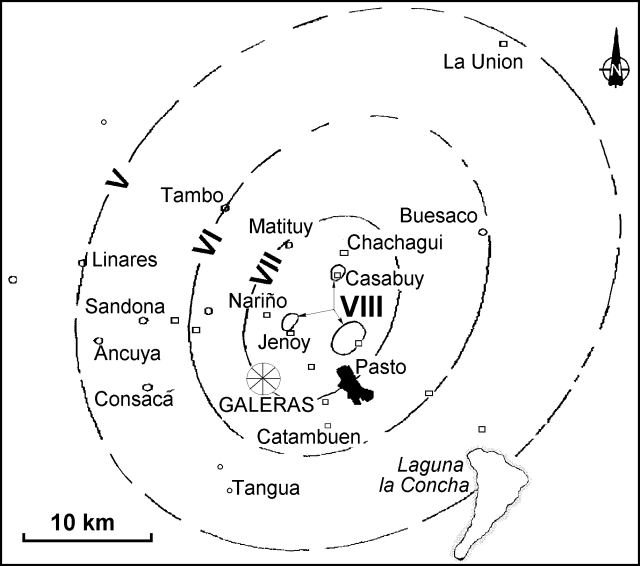
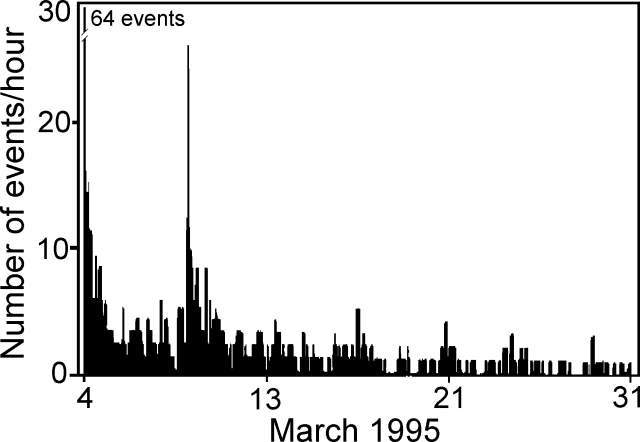
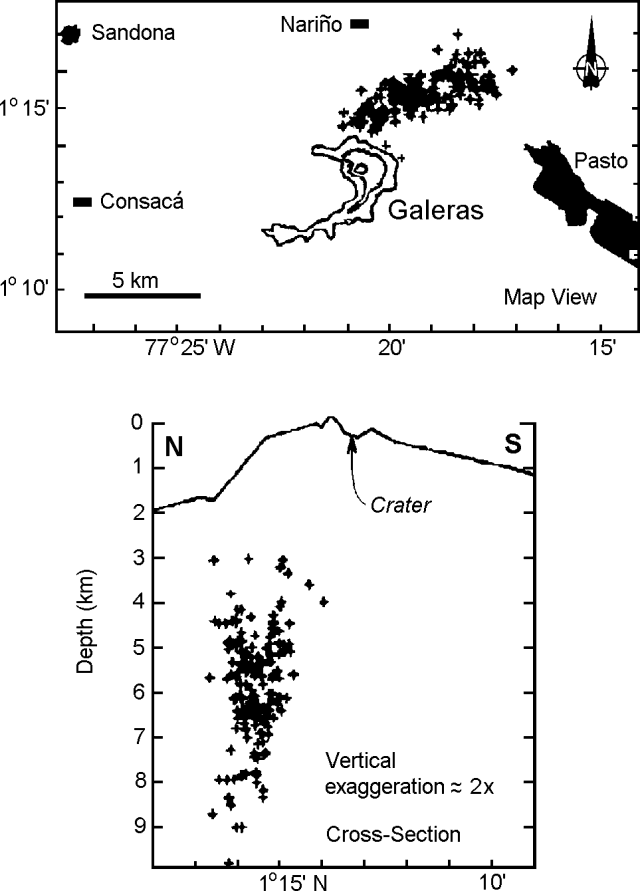
Earthquake on 4 March kills six people and precedes more felt earthquakes
Irazu (Costa Rica)
Lake rises one meter
Krakatau (Indonesia)
Explosions continue, sending ash plumes daily up to 500 m above the summit
Langila (Papua New Guinea)
Moderate emissions and explosions from Crater 2
Lascar (Chile)
Small ash eruptions and increased height of gas plume
Long Valley (United States)
Summary of 1994 seismicity, deformation, and CO2 discharge
Manam (Papua New Guinea)
Gentle vapor emissions, weak glow, and low-level seismicity
Martin (United States)
Large steam plumes, but no eruptive activity
Poas (Costa Rica)
Continued moderate seismicity, but no tremor; lake rise
Popocatepetl (Mexico)
Ash plumes; two SO2-flux measurements from January (1-4 kilotons/day)
Rabaul (Papua New Guinea)
Mild explosive activity at Tavurvur
San Miguel (El Salvador)
Increased seismicity and minor ashfall near the crater
Semeru (Indonesia)
Ash eruptions, lava avalanches, and summit glow
Slamet (Indonesia)
Increased seismicity and gas emission
Tengger Caldera (Indonesia)
Eruption at Bromo causes ashfall 20 km away; gas emissions
Turrialba (Costa Rica)
Weak fumarolic activity
Ulawun (Papua New Guinea)
Continued moderate vapor emissions; SO2 data from October 1994
Aira
Japan
31.5772°N, 130.6589°E; summit elev. 1117 m
All times are local (unless otherwise noted)
Explosive eruptions send plumes 3-4 km above the summit
Explosive volcanism continued in February and March from Minami-dake crater but caused no damage. There were a total of 22 eruptions in February, including 12 explosive ones. Activity increased somewhat in March with 36 eruptions, 24 of which were explosive. The highest monthly ash plumes occurred on 11 February (3 km) and on 8 March (4 km). Ashfall measured 10 km W at the Kagoshima Meteorological Observatory (KMO) was 30 g/m2 in February. Although there were more eruptions, only 9 g/m2 of ash fell at KMO during March.
An earthquake swarm that started at 1600 on 23 February lasted 9 hours and consisted of 99 events registered at Station B, 2.3 km NE of Minami-dake crater. This episode caused the KMO to issue a Volcanic Advisory noting the restlessness of the volcano. Station B also registered 208.8 hours of volcanic tremor and a total of 424 volcanic earthquakes during February. Another earthquake swarm between 0000 on 26 March and 0300 on 28 March produced 2,041 earthquakes and 828 tremors, causing another two Volcanic Advisories. However, total amount of tremor in March (164.3 hours) was less than in February.
Geologic Background. The Aira caldera in the northern half of Kagoshima Bay contains the post-caldera Sakurajima volcano, one of Japan's most active. Eruption of the voluminous Ito pyroclastic flow accompanied formation of the 17 x 23 km caldera about 22,000 years ago. The smaller Wakamiko caldera was formed during the early Holocene in the NE corner of the caldera, along with several post-caldera cones. The construction of Sakurajima began about 13,000 years ago on the southern rim and built an island that was joined to the Osumi Peninsula during the major explosive and effusive eruption of 1914. Activity at the Kitadake summit cone ended about 4,850 years ago, after which eruptions took place at Minamidake. Frequent eruptions since the 8th century have deposited ash on the city of Kagoshima, located across Kagoshima Bay only 8 km from the summit. The largest recorded eruption took place during 1471-76.
Information Contacts: Volcanological Division, Seismological and Volcanological Department, Japan Meteorological Agency (JMA), 1-3-4 Ote-machi, Chiyoda-ku, Tokyo 100 Japan.
Alcedo
Ecuador
0.43°S, 91.12°W; summit elev. 1130 m
All times are local (unless otherwise noted)
Two craters on the SW caldera wall linked to a 1993 eruption
Alcedo . . . had two new craters when visited by Jonathan R. Green during 16-18 February 1994. According to him and Jim Stimac, who saw the craters in February 1995, the craters were located on the S wall of the caldera. At the same two points, Geist and others (1994) had previously mapped sulfur veneer and fumaroles in 1991. The points lie ~1.4 km W of El Geyser, a fumarole that lies within a similar crater and sits farther E along a common fault. . . . Geist confirmed that there were no craters in this vicinity when he made his map, and in addition Green clearly reported that these two craters were new.
Besides the opening of these new craters, Green (1994) described Alcedo activity during November-December 1993, and January 1994. This included local tremor, explosions, noises from one or more subterranean sources, and increased fumarolic activity. The larger crater was associated with adjacent deposits of ash, debris, and mud. The craters were also observed during a July 1994 helicopter flyover. A videotape made during the flyover (archived at Galápagos National Park Headquarters) documented vigorous steam plumes coming from both craters, similar to plumes seen by Green in February 1994. Green, who showed the craters on a sketch in his report, estimated that the larger crater was 75 x 100 m.
Although groups do occasionally visit, Alcedo is uninhabited and no one witnessed the eruption. Green's report stated: "Additional information from other guides places this activity later than mid-November 1993 and prior to the end of December 1993."
Later observations were made when J. Stimac and Fraser Goff sampled fumaroles . . . from 5 to 10 February 1995. At that time the larger new crater issued a vigorous steam plume from a small vent along one side; the smaller crater issued less steam. Stimac estimated that the elliptical larger crater had a diameter of 100-150 m, and a depth of 35-40 m. The smaller crater had a diameter of 10 m and a depth of 3 m.
Layered tephra, up to perhaps 2-m thick, lies at the crater margins and extends for several hundred meters, Stimac reported. Based on the observed deposits, and on crater morphology and location, visiting volcanologists concluded the craters were formed by hydrothermal explosions.
Geist and others (1994) point out that Alcedo is distinct from other Galápagos volcanoes (and many oceanic islands) in that it has erupted rhyolite and not just basalt as seen on all the adjacent islands.
References. Geist, D., Howard, K., Jellinek, A. M., and Rayder, S., 1994, The volcanic history of Volcán Alcedo, Galápagos Archipelago: A case study of rhyolitic oceanic volcanism: Bulletin of Volcanology, v. 56, no. 4, Springer-Verlag, p. 243-260.
Green, J., 1994, Recent activity in Alcedo volcano, Isabela Island: Noticias de Galápagos, no. 54 (H. Snell, editor): The Charles Darwin Foundation for the Galápagos Islands (100 N. Washington St., Suite 311, Falls Church, VA 22046 USA), p. 11-13.
Geologic Background. Alcedo is one of the lowest and smallest of six shield volcanoes on Isabela Island. Much of the flanks and summit caldera are vegetated, but young lava flows are prominent on the N flank near the saddle with Darwin volcano. It is the only Galapagos volcano known to have erupted rhyolite as well as basalt, producing about 1 km3 of late-Pleistocene rhyolitic tephra and lava flows from several vents late in its history. Recent faulting has produced a moat around part of the 7-8 km caldera floor, which is elongated N-S and appears to be migrating to the south. Fewer circumferential fissures occur on Alcedo than on other western Galápagos volcanoes. An eruption attributed to Alcedo in 1954 (Richards, 1957) is more likely to have been from neighboring Sierra Negra (Simkin 1980, pers. comm.). Photo-geologic mapping by K.A. Howard (pers. comm.) revealed only one flow on 30 October 1960 photographs that does not appear on 30 May 1946 photos. That is near Cartago Bay, low on the SE flank, rather than the 610-m, NE-flank elevation listed for the 1954 eruption. An active hydrothermal system is located within the caldera.
Information Contacts: J. Green, Quito; D. Geist, University of Idaho; J. Stimac and F. Goff, LANL, Los Alamos.
Arenal (Costa Rica) — March 1995 Cite this Report
Arenal
Costa Rica
10.463°N, 84.703°W; summit elev. 1670 m
All times are local (unless otherwise noted)
Eruptions and lava flows continue; ash deposition rate quantified
Crater C continued its ongoing emission of gases, lava flows, and sporadic Strombolian eruptions. The Strombolian eruptions remained similar to those of January, with ash columns reaching up to 1 km above the crater. These eruptions vibrated windows in the village of La Palma 4 km from the volcano. Falling bombs and blocks reached 1,000 m elev, ~660 m below the summit. Crater D continued fumarolic activity. Moderate low-frequency (<3 Hz) seismicity continued to decrease during March, but tremor duration remained high (figure 71).
The record of ash deposition 1.8 km W of the vent (table 9) shows, in terms of total mass, that the deposition rate has increased since October 1994. Daily deposition after 3 March was 22.7 g/m2, compared to a daily average of only 7.6-8.2 g/m2 between 19 October 1994 and 3 March 1995.
Table 9. Ash collected 1.8 km W of Arenal's active vent. Courtesy of G. Soto, ICE.
| Collection Interval |
Avg daily ashfall (grams/m2) |
Ash % 300+µ |
Ash % less than 300µ |
| 19 Oct 94-23 Jan 1995 |
7.6 |
38.0 |
62.0 |
| 23 Jan 95-03 Mar 1995 |
8.2 |
54.7 |
45.3 |
| 03 Mar 95-30 Mar 1995 |
22.7 |
42.2 |
57.8 |
Geologic Background. Conical Volcán Arenal is the youngest stratovolcano in Costa Rica and one of its most active. The 1670-m-high andesitic volcano towers above the eastern shores of Lake Arenal, which has been enlarged by a hydroelectric project. Arenal lies along a volcanic chain that has migrated to the NW from the late-Pleistocene Los Perdidos lava domes through the Pleistocene-to-Holocene Chato volcano, which contains a 500-m-wide, lake-filled summit crater. The earliest known eruptions of Arenal took place about 7000 years ago, and it was active concurrently with Cerro Chato until the activity of Chato ended about 3500 years ago. Growth of Arenal has been characterized by periodic major explosive eruptions at several-hundred-year intervals and periods of lava effusion that armor the cone. An eruptive period that began with a major explosive eruption in 1968 ended in December 2010; continuous explosive activity accompanied by slow lava effusion and the occasional emission of pyroclastic flows characterized the eruption from vents at the summit and on the upper western flank.
Information Contacts: E. Fernández, V. Barboza, and J. Barquero, OVSICORI; G. Soto, ICE.
Asosan
Japan
32.8849°N, 131.085°E; summit elev. 1592 m
All times are local (unless otherwise noted)
Mud ejection beyond the crater and an ash cloud to 1 km
Mud and water ejections continued during February from the shrinking pool of hot water in Naka-dake Crater 1. Similar ejections occurred on 13 and 17 March. The eruption on 17 March ejected mud and volcaniclastic materials within a 300-m radius, including some beyond the crater rim, and sent an ash cloud as high as 1 km above the crater rim. Large-amplitude tremor associated with the mud ejections was felt at the Aso Weather Station (AWS) on 14 and 19 February, and another nine times during March. An earthquake centered beneath the crater was also felt at AWS on 16 February.
Geologic Background. The 24-km-wide Asosan caldera was formed during four major explosive eruptions from 300,000 to 90,000 years ago. These produced voluminous pyroclastic flows that covered much of Kyushu. The last of these, the Aso-4 eruption, produced more than 600 km3 of airfall tephra and pyroclastic-flow deposits. A group of 17 central cones was constructed in the middle of the caldera, one of which, Nakadake, is one of Japan's most active volcanoes. It was the location of Japan's first documented historical eruption in 553 CE. The Nakadake complex has remained active throughout the Holocene. Several other cones have been active during the Holocene, including the Kometsuka scoria cone as recently as about 210 CE. Historical eruptions have largely consisted of basaltic to basaltic-andesite ash emission with periodic strombolian and phreatomagmatic activity. The summit crater of Nakadake is accessible by toll road and cable car, and is one of Kyushu's most popular tourist destinations.
Information Contacts: JMA.
Cameroon (Cameroon) — March 1995 Cite this Report
Cameroon
Cameroon
4.203°N, 9.17°E; summit elev. 4095 m
All times are local (unless otherwise noted)
Seismicity in 1994 declines from 1993 levels
Overall seismic activity was lower in 1994 (240 total events) compared to 1993 (840 events). Most of the 1993 activity was from beneath the SE flank. The monthly number of events was consistently below 30 after October 1993, until December 1994 (figure 1). During 10-12 December a swarm of >40 microearthquakes with a maximum magnitude of 2.5 was recorded at station KBC. Because that was the only operational station, the events could not be accurately located. However, based on the waveform and S-P intervals of ~7 seconds, they were interpreted to be from Mount Cameroon. As of the end of January 1995, seismicity below the SE flank had returned to the 1992 level of 9-12 events/month.
Geologic Background. Mount Cameroon, one of Africa's largest volcanoes, rises above the coast of west Cameroon. The massive steep-sided volcano of dominantly basaltic-to-trachybasaltic composition forms a volcanic horst constructed above a basement of Precambrian metamorphic rocks covered with Cretaceous to Quaternary sediments. More than 100 small cinder cones, often fissure-controlled parallel to the long axis of the 1400 km3 edifice, occur on the flanks and surrounding lowlands. A large satellitic peak, Etinde (also known as Little Cameroon), is located on the S flank near the coast. Historical activity was first observed in the 5th century BCE by the Carthaginian navigator Hannon. During historical time, moderate explosive and effusive eruptions have occurred from both summit and flank vents. A 1922 SW-flank eruption produced a lava flow that reached the Atlantic coast, and a lava flow from a 1999 south-flank eruption stopped only 200 m from the sea. Explosive activity from two vents on the upper SE flank was reported in May 2000.
Information Contacts: A. Bekoa and N. Nfomou, ARGV, Buea; Ekodeck G.E. and N. Metuk, IRGM, Yaounde; J. Fairhead, Univ of Leeds.
Fernandina (Ecuador) — March 1995 Cite this Report
Fernandina
Ecuador
0.37°S, 91.55°W; summit elev. 1476 m
All times are local (unless otherwise noted)
Lava enters the sea at three locations; ejections from lava lake
Fernandina continued to erupt in late March. While acting as a guide for a film crew, Godfrey Merlin made his third visit . . . and reported on 26 March concerning the 30 hours the group spent at the volcano.
Lava flowing into the sea was concentrated in three areas. Two areas were the same as two months earlier, and the third was ~400 m to the N. Most of the lava descended the near-vertical shoreline, a sea-cliff that was typically ~4-m high and being progressively undercut by wave action removing sand along its base. Flowing in channels of 0.5-1.5 m width, the lava often dripped into the ocean, although Merlin noted that the lava to the N had "the appearance of water cascading to the sea." Discolored water still surrounded the lava's ocean entries. The amount of lava flowing into the sea was difficult to judge, but at least one substantial fluctuation in flow volume was seen during their 30-hour visit.
The group reached shore at the Cape Hammond landing, an area rich in wildlife that could have been threatened if lava flows had continued to progress in that direction. They found that nearby flow fronts remained immobile since the previous visit . . . . Merlin suggested that the lava issuing from main vent (now a well-formed cone), was descending in old tubes to the shore. At night, no incandescence could be seen between the main vent and the sea. During the day, in the upper third of this interval, white vapor rose from the lava flows but otherwise there was little surface evidence of their freshness.
While hiking to the main vent they heard several explosions and saw molten lava "tossed above the rim of the cone every few seconds." Nevertheless, Merlin and Mr. Iwago of the Japanese Broadcasting Corporation (NGK) ascended the cone's base, which they described as built on "huge blocks of reddish-gray rock jumbled together" with intermediate spaces "filled with glassy scoria." Next, they descended into a shallow valley of scoria with extremely hot vents, some ringed by white deposits. They climbed the upper slopes of the spatter cone from the E, upwind side, and found that the cone held a "heaving, rolling, red sea of molten lava" that was ~30-40 m in diameter and 40 m below the cone's rim. Spatter was thrown ~70 m above the lava lake's surface. On the cone's W side, lava flowed over the rim and descended into a tube within the cone.
They found eight dead marine iguanas. Although their appearance ranged from unscorched to charred, the iguanas had each been "literally cooked on the surface of the lava." The group also noted that live iguanas continued to invade the still-hot surface. In contrast to earlier in the eruption, no dead fish were seen floating along the coast and accordingly the large number of sea birds that previously had come to feed on them were absent.
Geologic Background. Fernandina, the most active of Galápagos volcanoes and the one closest to the Galápagos mantle plume, is a basaltic shield volcano with a deep 5 x 6.5 km summit caldera. The volcano displays the classic "overturned soup bowl" profile of Galápagos shield volcanoes. Its caldera is elongated in a NW-SE direction and formed during several episodes of collapse. Circumferential fissures surround the caldera and were instrumental in growth of the volcano. Reporting has been poor in this uninhabited western end of the archipelago, and even a 1981 eruption was not witnessed at the time. In 1968 the caldera floor dropped 350 m following a major explosive eruption. Subsequent eruptions, mostly from vents located on or near the caldera boundary faults, have produced lava flows inside the caldera as well as those in 1995 that reached the coast from a SW-flank vent. Collapse of a nearly 1 km3 section of the east caldera wall during an eruption in 1988 produced a debris-avalanche deposit that covered much of the caldera floor and absorbed the caldera lake.
Information Contacts: G. Merlen, Estacion Cientifica Charles Darwin.
Fogo
Cabo Verde
14.95°N, 24.35°W; summit elev. 2829 m
All times are local (unless otherwise noted)
New eruption on 2 April generates lava flows within the caldera
A fissure eruption that began the night of 2-3 April produced lava flows from the base of the Pico cone, located within the 8-km-diameter Cha Caldera (figure 1). This cone, also called Fogo Peak, has a crater ~500 m in diameter and 180 m deep. Caldera residents felt weak intermittent earthquakes as early as 25 March. After 0100 on 2 April the earthquakes increased in frequency, and felt events occurred at 0700 and 1500. At about 2015 residents felt a stronger earthquake that caused dishes to fall from cupboard shelves and may have opened a 200-m-long crack on the flanks of the cone.
Residents in Sao Filipe, ~15 km WSW of the vent, noticed a red glow around 2300 on the night of 2 April, probably the beginning of the eruption. Other residents reported that eruptive vents on the flank of Pico opened at 0006 on 3 April. Initially there was a burst or jetting of gas followed by ejection of large blocks. This Strombolian activity was followed by a "curtain of fire" that fed a lava flow, which cut off the main road to Portela village by 0200 (figure 2). By 0500 on 3 April, fine dark ash had begun to fall in areas close to the volcano. Around the same time, an eruption cloud to a height of 2,500 m was formed. Witnesses told reporters that the volcano was "spewing out smoke and flames." The head of the Cape Verde Red Cross stated that high flames could be seen and that "a pall of black smoke was hanging over the island."
During the night of 2-3 April, several residents evacuated to the N coast. Once ashfall began, more caldera residents and some people in the eastern villages of Corvo, Achada Grande, Relva, Tintiera, Cova Matinho, Cova Figueira, and Estância Roque also evacuated to the coastal towns of Mosteiros (~9 km N of the summit) or Sao Filipe. Police officials reported that all of the ~1,300 people living within the caldera had managed to get out on foot and had been accounted for by noon on 3 April.
Under the supervision of the National Defense Minister, a Crisis Cabinet was created by the Cape Verde Government. About 60 Cape Verde Army soldiers were sent to the island and an emergency communications system was installed. Food and medicine were provided, and evacuation centers (schools, private institutions, and tent camps) were established to hold up to 5,600 people. Official reports indicated that almost 1,000 persons were sheltered in the Army camps at Sao Filipe, Patim, Achada Furna, and Mosteiros. During the first days of the eruption local authorities, Cape Verde soldiers, and volunteers, helped caldera residents save their belongings. Nobody was killed, and only 20 people needed medical assistance during the evacuation, including children with respiratory problems. Although numbers are uncertain, as many as 5,000 people may have been displaced during this eruption. As of 16 April, Portela residents continued to remove belongings by foot.
Around noon on 3 April some teachers who had driven from Sao Filipe to Mosteiros told geologist Veronica Carvalho Martins (U.S. Embassy in Cape Verde) of sandy ashfall along the road on the E side of the island just below the caldera; they also reported sounds "like an old stove." During a flight W of the caldera soon afterwards, Martins observed a high mushroom-shaped ash column rising from the caldera. Martins later saw a long fissure vent with lava fountains feeding an already well-developed flow that was moving W across a road towards the caldera wall and curving N. A vent SE of the fissure exhibited continuous strong ejection of brownish pyroclastic material, while to the NW a smaller vent was intermittently ejecting similar material.
João Gaspar (Universidade dos Açores) and colleagues from Cape Verde (ISE and IICT) reported that on 3 April a thick cloud of dark ash and vapor 2,500-5,000 m high could be seen from Santiago Island, ~60 km ENE. Early that morning three small vents were observed inside the caldera along the SW part of a N30°E fissure that crossed the main road within the caldera (figure 2). Fine dark ash and small pahoehoe lavas were produced, and large plastic bombs (1-4 m in diameter) were projected distances of 500 m. That afternoon the fissure reached 2 km in length, and four new vents opened in its NE section. Activity increased during the night of 3-4 April with the emission of more lava flows, but decreased the following morning. One Cape Verde official said that the lava was moving at a speed of 60 m/hour. Gaspar reported that explosive activity was centered at the NE vents, but strong fumarolic activity continued along the main fissure. Lava fountains reached ~ 400 m high and a cloud of dark ash and gases rose 2,000 m. A scoria cone with a crater open to the SW formed and produced aa lava flows with thicknesses of 3-10 m measured at different fronts.
Effusive activity remained intense on 4 April, but ejection of pyroclastic fragments had decreased significantly. Television pictures showed a lava "stream" coming from the fissure and, in the morning, a mantle of aa lava covering the central part of the caldera. Portuguese television and other press coverage on the evening of 5 April indicated that activity had decreased.
In the following days the lava flow reached the settlement of Boca de Fonte near the caldera wall ~2 km W of the eruption center, and by 9 April it had destroyed at least 5 houses (possibly 10), the main water reservoir, and several square kilometers of fertile land used to grow coffee, wine grapes, fruits, maize, tapioca, and beans. Reluctant farmers with cattle in the caldera were ordered to leave their homes or face arrest on 8 April. A TSF Radio correspondent reported on 9 April that the lava flow moving into Boca de Fonte was advancing at a rate of 10-14 m/hour, twice as fast as the day before. However, the flow slowed to 4-5 m/hour on the 10th. Weak tremor had been felt on the caldera floor since the start of the eruption. On 10 April the seismicity increased, and earthquakes with Mercalli intensities of III-IV occurred, probably due to obstruction of the main vent, where lava fountaining stopped briefly.
Richard Moore and Frank Trusdell (U.S. Geological Survey) arrived on 10 April to assess the volcanic hazards and advise the Government of Cape Verde. With the help of Martins, they installed a seismograph ~1 km S of the erupting vent. The seismograph recorded continuous tremor, indicative of the ongoing eruption, as well as microearthquakes (M
Gaspar noted that on 11 April two main lava rivers had velocities of 5-6 m/s near the vent. One lobe moved towards the W and fed the flow-front moving towards Portela and Bangaeira villages. The other more active lobe was directed SW into the Cova Tina depression. The USGS team observed relatively low-volume eruptions of gas-rich spatter slowly building a cone, and lava cascading rapidly down the W flank of Pico being directed W and SW by high levees. The N flow-front, near Portela, stagnated during 10-11 April. At 1830 on 11 April, advancing flows were confined to the S part of the caldera, where two small lobes were moving W at a rate of ~15-20 m/hour, travelling S of the flows erupted the previous week.
During the morning of 12 April eruptive activity consisted of Strombolian gas-rich spatter ejection; volumetric output remained relatively low. At 1549 activity changed to Hawaiian-type fire fountains that typically rose 100-120 m above the vent, slowly building a scoria cone 100 m high. A new lava flow that started on 12 April overrode the first flow, which had stagnated ~1 km SW of Portela. This flow quickly traveled 3 km from the vent in the general direction of Portela, but remained entirely on top of the first flow. All other lava flows were inactive at 1900 on 12 April. Preliminary estimates of erupted volume through 12 April ranged from 50 to 75 x 106 m3 of lava.
Although volumetric output remained low, Hawaiian-type fire fountains continued on 13 April and a flow confined to a 3-m-wide channel cascaded down the W flank of the new cone. That channel continued to feed a sluggish aa flow moving W then N. The cinder and spatter cone reached a height of 120 m. The overriding lava flow only moved N another 46 m; most of the additional lava was expended covering the first flow. The added mass on top of the first flow also caused it to spread laterally.
Activity on 14 April continued unabated, increasing the height of the new cone to 130 m. The E lobe of the second flow reactivated and moved 470 m N during 13-14 April. At 1900 on 14 April the second flow was within 235 m of the distal end of the first flow, and lateral spreading was occurring at the flow margins. At this time the distal portion of the first lobe showed signs of renewed movement, induced by pressure from the overriding aa flow. The thick aa flow continued to spread slowly W the next day; maximum lateral spreading S of Boca de Fonte was ~3 m. The new E lobe of the second flow advanced an additional 6 m and stopped. At 1700 on 15 April the most active part of the overriding flow was on its NW side. Much of the lava production apparently went towards thickening the central part of the flow, estimated to be 16 m thick. At 1800 on 15 April spatter fountains were ~100 m high and cinder was falling as far as 2 km S of the vent.
Activity remained generally constant on 16 April, with fire fountains typically rising 100-120 m; the scoria cone stood 140 m tall. Estimates of lava-channel dimensions and speeds through 16 April yielded an erupted lava volume of 2.5-8 x 10⁶ m3/day. The flow-front became remobilized at 1535 on 16 April, and by 1700 had moved 38 m beyond and NE of the distal end of the first flow. At that time the lava front was ~534 m from the nearest house in Portela. A lava temperature of 1,056°C was measured with a thermocouple in a spiny aa breakout near the terminus of the flow. From a few hundred meters away, USGS geologists watched the roof of a small house burn; it was buried soon thereafter. There was also considerable lateral spreading of the flow S of Boca de Fonte on 16 April. In this area, the flow-front monitor lines showed westward movement of 19-26.5 m. At 1800 the flow was still active and 41-72 m E of the Portela access road. Thickness at the margins of the active flows ranged from 1 to 20 m. The greater thicknesses are a strong indication that a breakout of spiny pahoehoe or aa can be expected, advancing the flow.
Fogo Island (476 km2), with a population of ~33,000, consists of a single massive volcano with an 8-km-wide caldera breached to the E; the W rim rises 700 m above the caldera floor. The central cone in the caldera, the highest point in the Cape Verde Islands, was apparently almost continuously active from the time of Portuguese settlement in 1500 A.D. until around 1760. Later historical lava flows reached the E coast. The last eruption was during June-August 1951 from caldera vents S and NW of the central cone. That eruption, also preceded by earthquakes, began with ejection of pyroclastic material that formed Mt. Rendall and Mt. Orlando (figure 2).
Reference. Neumann van Padang, M., Richards, A.F., Machado, F., Bravo, T., Baker, P.E., and LeMaitre, R.W., 1967, Catalogue of active volcanoes of the world including solfatara fields, part XXI, Atlantic Ocean: Rome, IAVCEI, 128 p.
Geologic Background. The island of Fogo consists of a single massive stratovolcano that is the most prominent of the Cape Verde Islands. The roughly circular 25-km-wide island is truncated by a large 9-km-wide caldera that is breached to the east and has a headwall 1 km high. The caldera is located asymmetrically NE of the center of the island and was formed as a result of massive lateral collapse of the older Monte Armarelo edifice. A very youthful steep-sided central cone, Pico, rises more than 1 km above the caldera floor to about 100 m above the rim. Pico, which is capped by a 500-m-wide, 150-m-deep summit crater, was apparently in almost continuous activity from the time of Portuguese settlement in 1500 CE until around 1760. Later lava flows, some from vents on the caldera floor, reached the eastern coast below the breached caldera.
Information Contacts: J. Gaspar and N. Wallenstein, Universidad dos Açores; A. Mota Gomes, Instituto Superior de Educação de Cabo Verde (ISE), Cape Verde; F. Costa and E. Correia, Centro de Geografia do Instituto de Investigação Cientifica de Tropical (IICT), [Portugal]; R. Moore, USGS; F. Trusdell, USGS Hawaiian Volcano Observatory; V. Carvalho Martins, U.S. Embassy, Cape Verde; UNDHA; Reuters; UPI; LUSA News Agency, RTP Internacional Television, Channel 1 Television, and TSF Radio, Lisbon.
Galeras
Colombia
1.22°N, 77.37°W; summit elev. 4276 m
All times are local (unless otherwise noted)
Earthquake on 4 March kills six people and precedes more felt earthquakes
According to INGEOMINAS, at 1823 on 4 March a M 4.7-4.8 earthquake struck Galeras's NE flank (figure 73). The USGS National Earthquake Information Center (NEIC) reported the earthquake as M 4.5. The preliminary location for the event was provided by the Observatory's network (stations 0.9, 1.6, 2.1, 11.0, 5.0, 5.5 and 9.0 km from the active crater); the hypocenter (at 1.26°N, 77.33°W) was ~4 km NE of the active cone at 13 km depth. Signals from the earthquake saturated all of the stations in the local network; the earthquake itself was clearly felt in SW Colombia's in the E part of the Department of Nariño.
During the 3 hours following the event there were 130 aftershocks, at least 11 felt, the majority with magnitudes between 2.6 and 3.6 (figures 74 and 75). Subsequent events tended to decrease in magnitude, but some were still felt near the epicenter. Two relatively strong aftershocks took place 6 days after the initial earthquake (at 0017 and 0632 on 10 March), M 4.1 and 3.8, setting off a second swarm of declining aftershocks (figure 75). During 4-31 March approximately 1,440 aftershocks took place from the same area (figures 74, 75, and 76). At least 67 aftershocks were felt; the last, at 0804 on 29 March, was M 2.1.
Large measured tilt coincided with the main shock. The maximum tilt changes were registered by electronic tiltmeters as 3 µrad, and by short leveling line vectors as 15 µrad. The tiltmeters returned to their previous levels almost immediately; the short leveling line vectors returned in a few days.
The epicentral area basically corresponded to the rural municipalities of Pasto . . . and other adjacent towns (figures 73 and 76), settlements with houses that were for the most part single-level and of rudimentary adobe construction. The houses were seriously affected and INGEOMINAS reported that some were ". . . damaged so badly as to be ready to collapse, also with caved-in roofs and loose tiles, that made living in them impossible and insecure. In the city of Pasto the constructions most affected were the antiquated structures . . . ." INGEOMINAS also related that: "In one neighborhood to the N of the city, the principal earthquake caused the loosening of blocks on a slope that fell on a nearby house, causing its destruction and killing 6 of its inhabitants. Other effects related to the main shock and its aftershocks were loud noises and small landslides on slopes near the wagon trails close to the epicentral region." NEIC reports stated that eight people were killed and four were injured. They mentioned that there were ~250 aftershocks, and that over 50 houses were damaged or destroyed, many by seismically triggered mudslides.
INGEOMINAS noted that previous seismic swarms had similar or adjacent epicenters. In both April and November 1993 swarms of M < 4.5 were felt in the same epicentral region, although the 4 March earthquake was itself larger and associated with more energetic, more numerous, and more frequent aftershocks. Soon after the earthquake, on 6, 11, and 19 March, the local seismic system around Galeras registered unusual, high-amplitude seismic events possibly associated with an explosive eruption. During these events signal amplitude grew for a few seconds, rapidly escalated, and then quickly decayed, the entire event lasting perhaps two minutes. The high-amplitude part of the event generally caused many of the stations in the local system to saturate. Associated with these high amplitude events, people located ~6-9 km from the volcano reported loud noises suggesting that an explosive eruption may have occurred. This hypothesis was unconfirmed due to poor visibility.
Other than these large earthquakes at Galeras, low- and high-frequency events and "butterfly" events remained low. The high- and low-frequency events were chiefly located at shallow depths (<3 km) near to, or just W of, the active cone. During the last days of March there were 12 "screw-type" events (<=3 events/day). The screw-type events had durations of up to 85 seconds and multiple constituent frequencies in the 1.5-7 Hz range. Screw-type events were registered before the majority of the 1992-1993 eruptive events and before some 1994-1995 degassing episodes.
As in previous months, the concentrations of SO2 obtained by mobile, ground-based correlation spectroscopy (COSPEC) remained <100 t/d. The volcano was clearly visible on various occasions, particularly at the beginning of the month, but the gas column was only visible a few times from the city of Pasto. At these times the column had heights under 300 m, and emission were coming from the W sector of the volcano. Sometimes, when the column was blown E, sulfurous odors were reported.
M. Calvache recently sent us color photographs showing Galeras's summit morphology in December 1991, March 1993, and March 1995. The December 1991 image was most suitable for black-and-white reproduction (figure 77).
Geologic Background. Galeras, a stratovolcano with a large breached caldera located immediately west of the city of Pasto, is one of Colombia's most frequently active volcanoes. The dominantly andesitic complex has been active for more than 1 million years, and two major caldera collapse eruptions took place during the late Pleistocene. Long-term extensive hydrothermal alteration has contributed to large-scale edifice collapse on at least three occasions, producing debris avalanches that swept to the west and left a large open caldera inside which the modern cone has been constructed. Major explosive eruptions since the mid-Holocene have produced widespread tephra deposits and pyroclastic flows that swept all but the southern flanks. A central cone slightly lower than the caldera rim has been the site of numerous small-to-moderate eruptions since the time of the Spanish conquistadors.
Information Contacts: INGEOMINAS, Pasto; NEIC.
Irazu
Costa Rica
9.979°N, 83.852°W; summit elev. 3436 m
All times are local (unless otherwise noted)
Lake rises one meter
"Irazú remains calm [in February]. Fumarolic activity is still weak in the main crater and on the NW flanks. The lake in the main crater has a temperature between 18 and 23°C, and the water surface rose about 1 m with respect to the same date last year. The lake holds an estimated 430 million m3 of water. Acidity and temperature of hot springs surrounding the volcano remain unchanged."
On 17 April Soto added that "tectonic-like seismic events have been recorded in the vicinity of the volcano during 1995 (8 in January, 8 in February, 14 in March . . . )." The hypocenters were located within 20 km of the main crater. The biggest earthquake took place on 21 March, about 15 km from the main crater.
Geologic Background. The massive Irazú volcano in Costa Rica, immediately E of the capital city of San José, covers an area of 500 km2 and is vegetated to within a few hundred meters of its broad summit crater complex. At least 10 satellitic cones are located on its S flank. No lava effusion is known since the eruption of the Cervantes lava flows from S-flank vents about 14,000 years ago, and all known Holocene eruptions have been explosive. The focus of eruptions at the summit crater complex has migrated to the W towards the main crater, which contains a small lake. The first well-documented eruption occurred in 1723, and frequent explosive eruptions have occurred since. Ashfall from the last major eruption during 1963-65 caused significant disruption to San José and surrounding areas. Phreatic activity reported in 1994 may have been a landslide event from the fumarolic area on the NW summit (Fallas et al., 2018).
Information Contacts: G. Soto, ICE.
Krakatau (Indonesia) — March 1995 Cite this Report
Krakatau
Indonesia
6.1009°S, 105.4233°E; summit elev. 285 m
All times are local (unless otherwise noted)
Explosions continue, sending ash plumes daily up to 500 m above the summit
Volcanic activity continued through January-March 1995, sending grayish white plumes 150-500 m above the summit. Sounds like thunder were sometimes heard at the VSI observatory . . . and glow was visible at night as high as 50 m above the summit. The daily number of explosions in January and early February fluctuated between 50 and 150 events. From mid-February to mid-March the average number of explosions increased to 150-200 events/day (figure 10).
Geologic Background. The renowned Krakatau (frequently mis-named as Krakatoa) volcano lies in the Sunda Strait between Java and Sumatra. Collapse of an older edifice, perhaps in 416 or 535 CE, formed a 7-km-wide caldera. Remnants of that volcano are preserved in Verlaten and Lang Islands; subsequently the Rakata, Danan, and Perbuwatan cones were formed, coalescing to create the pre-1883 Krakatau Island. Caldera collapse during the catastrophic 1883 eruption destroyed Danan and Perbuwatan, and left only a remnant of Rakata. This eruption caused more than 36,000 fatalities, most as a result of tsunamis that swept the adjacent coastlines of Sumatra and Java. Pyroclastic surges traveled 40 km across the Sunda Strait and reached the Sumatra coast. After a quiescence of less than a half century, the post-collapse cone of Anak Krakatau (Child of Krakatau) was constructed within the 1883 caldera at a point between the former Danan and Perbuwatan cones. Anak Krakatau has been the site of frequent eruptions since 1927.
Information Contacts: W. Tjetjep, VSI.
Langila (Papua New Guinea) — March 1995 Cite this Report
Langila
Papua New Guinea
5.525°S, 148.42°E; summit elev. 1330 m
All times are local (unless otherwise noted)
Moderate emissions and explosions from Crater 2
"Monitoring was temporarily discontinued on 18 March. Until that time activity at Crater 2 was at a moderate level, similar to that observed in February, while Crater 3 showed a low level of activity. Emissions from Crater 2 were mostly white vapour, weak to moderate in volume. Occasionally grey ash clouds were emitted. Light ash fall took place around the crater. One loud explosion was heard on 8 March with weak explosions on the following two days and low rumbling sounds on the 16th. Steady weak night glow was observed on 16 and 17 March. Crater 3 released very thin to occasionally moderately thick white vapour. Thin blue vapour was observed on 1 and 7 March. There were no audible sounds and no night glows. Both seismographs remained inoperative throughout the month."
Geologic Background. Langila, one of the most active volcanoes of New Britain, consists of a group of four small overlapping composite basaltic-andesitic cones on the lower E flank of the extinct Talawe volcano in the Cape Gloucester area of NW New Britain. A rectangular, 2.5-km-long crater is breached widely to the SE; Langila was constructed NE of the breached crater of Talawe. An extensive lava field reaches the coast on the N and NE sides of Langila. Frequent mild-to-moderate explosive eruptions, sometimes accompanied by lava flows, have been recorded since the 19th century from three active craters at the summit. The youngest and smallest crater (no. 3 crater) was formed in 1960 and has a diameter of 150 m.
Information Contacts: B. Talai, RVO.
Lascar
Chile
23.37°S, 67.73°W; summit elev. 5592 m
All times are local (unless otherwise noted)
Small ash eruptions and increased height of gas plume
Activity in February-March 1995. For the period 18 February to 10 March 1995 Lascar remained fairly active—frequently changing the altitude of its gas plume, producing small ash eruptions, and ejecting dense columns of water vapor (figure 24). The plume, which was typically pulsing, had a yellowish or brownish color. On 23 and 25 February underground booming noises ('retumbos') were heard 4 km from the volcano on both the N and NW flanks and at the village of Soncor, 25 km SW. On 24 February the plume's height above the crater suddenly increased from 200 m to 1,000 m (figure 24). This elevated "sustained" plume height marked the beginning of a series of small eruptions whose "transient" column heights are depicted by the arrow tips on figure 24. The sustained plume height initially remained comparatively high, reaching a maximum of 2 km above the volcano on 3 March; later, sustained plume height decreased gradually to ~500 m (figure 24).
At 0800 on 26 February a small ash-bearing eruption was reported by the Carabineros from 35 km NW of the volcano in Toconao. A black column rose at least 200 m (probably higher) above the crater. Retumbos associated with this eruption were audible at the offices of MINSAL in Toconao. Three larger eruptions were observed on 7 March, between 0000 and 0100, by Elcira Araya at the MINSAL offices. In each case a dark column rose an estimated 3 km above the crater. Plumes from these columns blew NW over Toconao and many residents reported a strong sulfur smell. The type of activity described (retumbos and small ash-rich eruptions) has in the past preceded larger Vulcanian eruptions. It is thought likely that such a Vulcanian eruption will occur in the near future.
Recent crater collapse and eruptive activity. At least two eruptive events took place in late 1994, both producing columns 4-km high. In November, Luis Aracena, a tour guide from San Pedro de Atacama, climbed Lascar and noted that a portion of the S rim had collapsed into the crater. Fractures on the S side of the crater had enlarged with an increase in fumarolic activity. He also found that the central hole in the crater floor had deepened substantially. One of his photos revealed large new arcuate fractures along the base of the talus slope at the foot of the NE crater wall.
Volcanologists concluded that the crater floor had continued to subside, destabilizing the walls and inducing them to collapse. The crater is thus becoming deeper and wider. In addition, blockage of the gas jets in the base of the crater due to subsidence on ring fractures and rockfalls from the walls has led to periodic 'throat clearing' eruptions. The edifice was expected to become increasingly unstable so long as this activity continues. Thus, the Carabineros in Toconao began advising tourists not to climb the volcano due to the high risk of both small explosive eruptions and of additional collapse along the S rim (along the favored ascent route).
Geologic Background. Láscar is the most active volcano of the northern Chilean Andes. The andesitic-to-dacitic stratovolcano contains six overlapping summit craters. Prominent lava flows descend its NW flanks. An older, higher stratovolcano 5 km E, Volcán Aguas Calientes, displays a well-developed summit crater and a probable Holocene lava flow near its summit (de Silva and Francis, 1991). Láscar consists of two major edifices; activity began at the eastern volcano and then shifted to the western cone. The largest eruption took place about 26,500 years ago, and following the eruption of the Tumbres scoria flow about 9000 years ago, activity shifted back to the eastern edifice, where three overlapping craters were formed. Frequent small-to-moderate explosive eruptions have been recorded since the mid-19th century, along with periodic larger eruptions that produced ashfall hundreds of kilometers away. The largest historical eruption took place in 1993, producing pyroclastic flows to 8.5 km NW of the summit and ashfall in Buenos Aires.
Information Contacts: S. Matthews, Univ of Bristol; M. Gardeweg, SERNAGEOMIN, Santiago.
Long Valley (United States) — March 1995 Cite this Report
Long Valley
United States
37.7°N, 118.87°W; summit elev. 3390 m
All times are local (unless otherwise noted)
Summary of 1994 seismicity, deformation, and CO2 discharge
The following summarizes more detailed reports (Hill, 1995; Johnson and others, 1995; and Sorey and others, 1995) on caldera seismicity, deformation, and CO2 discharge at Mammoth Mountain during 1994.
Earthquake activity within the caldera gradually decreased through the first months of 1994, and activity thereafter remained moderate with a few exceptions. During the entire year there were only ten-twelve M ~3 earthquakes in the caldera, in comparison with 30 in 1993. The earthquakes continued to cluster in the caldera's S moat, and gradually moved northward. During 1994, earthquakes with M <2 took place beneath Mammoth Mountain at depths of 4-20 km.
Seismicity in the Sierra Nevada block, S of the caldera, persisted at a moderate level throughout the year and was concentrated in a broad band extending S from Mount Morrison to Red Slate Mountain. In the Chalfant Valley, E of the Long Valley Caldera and W of the White Mountains, over 20 M ~3 earthquakes occurred throughout 1994, with many smaller late M <2 aftershocks associated with the M 6.4 Chalfant Valley earthquake of 1986.
Swelling of Long Valley's resurgent dome continued at a steady rate of 2-3 ppm/year, resembling 1993 activity. Deformation measurements, using a two-color geodetic distance-meter (geodimeter), revealed steady extension rates to the N and E of a central survey site (CASA, figure 17) from mid-1991 through the end of 1994. To the W and SW of CASA, extension rates gradually decelerated beginning in mid-to-late 1993 and continuing through 1994.
Dead mature pine trees were found in four separate areas on the flanks of Mammoth Mountain during 1994. Reports of asphyxia among workers entering poorly ventilated parts of the tree kill areas and an area near the top of the Chair 3 ski lift were also recorded during 1994, and were correlated with high (10-90%) CO2 concentrations in the soils (Sorey and others, 1995). The area of tree mortality has expanded since 1989, when the first tree death was reported. Several explanations have been put forward, including: 1) dike intrusion during the intense earthquake swarm below Mammoth Mountain of April-December 1989; 2) ongoing shallow silicic magma intrusion; 3) ongoing input of basaltic magma from a deeper source associated with the long-period earthquakes that began in 1989; and 4) gas release from a volatile-rich vapor zone surrounding areas of previously emplaced igneous rocks.
References: Hill, David P., 1995, Long Valley Caldera Monitoring Report (Oct - Dec 1994): U.S. Geological Survey, Office of Earthquakes, Volcanoes, and Engineering, 345 Middlefield Rd. Menlo Park, CA 94025, 16 p.
Sorey, Mike, Evans, Bill, and Farrar, Chris, 1994, Gas composition and discharge rate at Mammoth Mountain, in Hill, 1995, Long Valley Caldera Monitoring Report (Oct - Dec 1994): U.S. Geological Survey, 2 p.
Geologic Background. The large 17 x 32 km Long Valley caldera east of the central Sierra Nevada Range formed as a result of the voluminous Bishop Tuff eruption about 760,000 years ago. Resurgent doming in the central part of the caldera occurred shortly afterwards, followed by rhyolitic eruptions from the caldera moat and the eruption of rhyodacite from outer ring fracture vents, ending about 50,000 years ago. During early resurgent doming the caldera was filled with a large lake that left strandlines on the caldera walls and the resurgent dome island; the lake eventually drained through the Owens River Gorge. The caldera remains thermally active, with many hot springs and fumaroles, and has had significant deformation, seismicity, and other unrest in recent years. The late-Pleistocene to Holocene Inyo Craters cut the NW topographic rim of the caldera, and along with Mammoth Mountain on the SW topographic rim, are west of the structural caldera and are chemically and tectonically distinct from the Long Valley magmatic system.
Information Contacts: D. Hill, USGS Menlo Park.
Manam (Papua New Guinea) — March 1995 Cite this Report
Manam
Papua New Guinea
4.08°S, 145.037°E; summit elev. 1807 m
All times are local (unless otherwise noted)
Gentle vapor emissions, weak glow, and low-level seismicity
"South Crater released occasional gentle emissions of thin-to-thick white vapour during most of the month, but from 28-31 March the amount of vapour emissions decreased. Thin wispy blue vapour emissions were observed on the 31st. Weak steady glow was observed occasionally (on 3, 22-24, and 26-28 March). There were no audible sounds produced. Main Crater also released occasional gentle, thin-to-thick white vapour emissions. There were no night glows and no audible sounds. Seismicity fluctuated but was at a low level during most of the month. A decline in seismic activity occurred on 26 March and persisted for the remainder of the month."
Geologic Background. The 10-km-wide island of Manam, lying 13 km off the northern coast of mainland Papua New Guinea, is one of the country's most active volcanoes. Four large radial valleys extend from the unvegetated summit of the conical basaltic-andesitic stratovolcano to its lower flanks. These valleys channel lava flows and pyroclastic avalanches that have sometimes reached the coast. Five small satellitic centers are located near the island's shoreline on the northern, southern, and western sides. Two summit craters are present; both are active, although most observed eruptions have originated from the southern crater, concentrating eruptive products during much of the past century into the SE valley. Frequent eruptions, typically of mild-to-moderate scale, have been recorded since 1616. Occasional larger eruptions have produced pyroclastic flows and lava flows that reached flat-lying coastal areas and entered the sea, sometimes impacting populated areas.
Information Contacts: B. Talai, RVO.
Martin (United States) — March 1995 Cite this Report
Martin
United States
58.172°N, 155.361°W; summit elev. 1863 m
All times are local (unless otherwise noted)
Large steam plumes, but no eruptive activity
On 15 March, the U.S. National Weather Service received a report from the town of King Salmon of steam plumes rising 600-900 m over the general vicinity of Mount Martin volcano in Katmai National Park. No eruptive activity was detected during analysis of satellite imagery. The mostly ice-covered Mount Martin stratovolcano has a poorly documented record of minor historical eruptive activity. However, vigorous steam plumes from its summit crater are common.
Geologic Background. The mostly ice-covered Mount Martin stratovolcano lies at the SW end of the Katmai volcano cluster in Katmai National Park. The volcano was named for George C. Martin, the first person to visit and describe the area after the 1912 eruption. It is capped by a 300-m-wide summit crater, which is ice-free because of an almost-constant steam plume; it also contains a shallow acidic lake. The edifice was constructed entirely during the Holocene, and overlies glaciated lava flows of the adjacent mid- to late-Pleistocene Alagoshak volcano to the WSW. Martin consists of a small fragmental cone that was the source of ten thick overlapping blocky dacitic lava flows, largely uneroded by glaciers, that descend 10 km to the NW, cover 31 km2, and form about 95% of the eruptive volume of the volcano. Two reports of historical eruptions that originated from uncertain sources were attributed by Muller et al. (1954) to Martin.
Information Contacts: Alaska Volcano Observatory.
Poas
Costa Rica
10.2°N, 84.233°W; summit elev. 2697 m
All times are local (unless otherwise noted)
Continued moderate seismicity, but no tremor; lake rise
During February the green-turquoise colored lake rose to its December 1994 level. The lake contained clouds of suspended sulfur, and had a temperature of 47°C. Lake evaporation caused minor steam clouds (columns <50 m tall); in the S part of the lake constant bubbling took place with sporadic gushing of water.
During February seismic station POA2 (located 2.7 km SW of the principal crater) registered 4,937 earthquakes (high, medium, and low-frequency events combined). This was the largest number of earthquakes since July 1994. It followed a low of 2,555 earthquakes in December 1994 and previous highs of ~7,000 earthquakes in March and April 1994. Although up to 200-300 hours of tremor took place during mid-1994, in February 1995 less than an hour of tremor was registered. Events of high frequency (above 3 Hz) took place 20 times, a comparatively high number for Poás.
Geologic Background. The broad vegetated edifice of Poás, one of the most active volcanoes of Costa Rica, contains three craters along a N-S line. The frequently visited multi-hued summit crater lakes of the basaltic-to-dacitic volcano are easily accessible by vehicle from the nearby capital city of San José. A N-S-trending fissure cutting the complex stratovolcano extends to the lower N flank, where it has produced the Congo stratovolcano and several lake-filled maars. The southernmost of the two summit crater lakes, Botos, last erupted about 7,500 years ago. The more prominent geothermally heated northern lake, Laguna Caliente, is one of the world's most acidic natural lakes, with a pH of near zero. It has been the site of frequent phreatic and phreatomagmatic eruptions since an eruption was reported in 1828. Eruptions often include geyser-like ejections of crater-lake water.
Information Contacts: E. Fernández, V. Barboza, and J. Barquero, OVSICORI; G. Soto, ICE.
Popocatepetl (Mexico) — March 1995 Cite this Report
Popocatepetl
Mexico
19.023°N, 98.622°W; summit elev. 5393 m
All times are local (unless otherwise noted)
Ash plumes; two SO2-flux measurements from January (1-4 kilotons/day)
. . . SO2 flux was estimated twice during January using COSPEC. On 15 January scientists made airborne measurements but were unable to establish a GPS navigational fix for 2-3 hours and so made wind speed estimates from map positions and estimates by their pilot, Sergio Zambrano. On 28 January the plume was traversed by a van on a route between the Puebla airport and a junction N of Atlixco; wind speed was from pilot reports to the Puebla airport. Two 15-minute eruptions of dark ash were noted (at 0922 and 1015). Results of these SO2 flux measurements were as follows: 1) 15 January, 3,680 ± 300 tons/day; 2) 28 January, 2,000 ± 1,000 tons/day.
At 1000 on 27 January a light beige plume rose no more than 100-200 m above the crater rim and was visible downwind for about 100 km. In addition, sufficient ash fell on the Puebla airport during the night of 27 January to make the tarmac (airport surface) light in color and to visibly cover freshly washed planes.
Geologic Background. Volcán Popocatépetl, whose name is the Aztec word for smoking mountain, rises 70 km SE of Mexico City to form North America's 2nd-highest volcano. The glacier-clad stratovolcano contains a steep-walled, 400 x 600 m wide crater. The generally symmetrical volcano is modified by the sharp-peaked Ventorrillo on the NW, a remnant of an earlier volcano. At least three previous major cones were destroyed by gravitational failure during the Pleistocene, producing massive debris-avalanche deposits covering broad areas to the south. The modern volcano was constructed south of the late-Pleistocene to Holocene El Fraile cone. Three major Plinian eruptions, the most recent of which took place about 800 CE, have occurred since the mid-Holocene, accompanied by pyroclastic flows and voluminous lahars that swept basins below the volcano. Frequent historical eruptions, first recorded in Aztec codices, have occurred since Pre-Columbian time.
Information Contacts: Stan Williams, Tobias Fisher, and Caitlin Gorman, Arizona State University, USA; Claus Siebe and Hugo Delgado, Instituto de Geofísica, UNAM, Coyoacan.
Rabaul (Papua New Guinea) — March 1995 Cite this Report
Rabaul
Papua New Guinea
4.2459°S, 152.1937°E; summit elev. 688 m
All times are local (unless otherwise noted)
Mild explosive activity at Tavurvur
"Explosions at Tavurvur were mostly mild with emission clouds rising slowly to ~1 km above the crater at intervals of ~5-15 minutes. Seismic activity was slightly elevated on 1-2 March, but then decreased sharply in accord with weaker visible activity. The activity remained low for 24 hours then started to increase at a steady rate until it peaked on the 6th. Activity decayed the following day, but then began a gradual recovery that continued until 14 March. The explosions continued at intervals of ~5-15 minutes with ash emissions lasting 2-5 minutes. On 15 March a slight increase in seismic activity occurred as indicated by larger and more frequent explosion earthquakes, although visible activity appeared unchanged. Seismicity peaked on the 19th and then declined slightly over a period of ~48 hours. During the next 10 days the activity showed minor fluctuations but on average there were ~6 events/hour. On 30 March at 0805 and 2034 two strong explosions occurred. Dense ash clouds rose ~3 km above the crater and the flanks of Tavurvur were showered with lava fragments. These explosions signified a dramatic change in the pattern of activity as the frequency of explosions dropped markedly. The intervals between explosions sometimes lasted several hours.
"Aerial inspections of Tavurvur and Vulcan were conducted on 6, 13, and 21 March. The active crater at Tavurvur was bowl-shaped. On two occasions (6 and 21 March) there appeared to be an ash-mantled lava mound on the floor of the crater. At the NW and SE edges of the mound were a number of small vents (~1-2 m wide). These vents were aligned roughly in two arcs, which might represent small fissures. Between eruptions some vents emitted blue vapour. When inspected on 14 March, three rubble-covered vent areas were noted on the S, E, and NE parts of the crater floor. Low ridges of ash separated these vents. Weak fumaroles were present on parts of Tavurvur's main crater, especially on the N Wall. Fumarolic activity was also noted on the 1994 lava flow.
"Apart from the seismic activity related to events at Tavurvur, which were basically low-frequency explosion earthquakes, overall seismic activity of Rabaul Caldera was very low. Only five well-located high-frequency earthquakes were recorded (compared to 4 in February and 28 in January). Three occurred outside the caldera and the other two were under Tavurvur. The electronic tiltmeter at Matupit Island continued to show a trend of slow deflation of the caldera.
"Vulcan continued to exhibit only weak fumarolic activity at the W base of the 1994 crater. Hot springs along the N shore yielded temperatures of ~100°C. Rabaul continued to be under a State of Emergency with access to severely affected areas being controlled because of the risk of mud flows and flooding. Since the eruption started in September 1994, only one death was reported related to flooding."
Geologic Background. The low-lying Rabaul caldera on the tip of the Gazelle Peninsula at the NE end of New Britain forms a broad sheltered harbor utilized by what was the island's largest city prior to a major eruption in 1994. The outer flanks of the asymmetrical shield volcano are formed by thick pyroclastic-flow deposits. The 8 x 14 km caldera is widely breached on the east, where its floor is flooded by Blanche Bay and was formed about 1,400 years ago. An earlier caldera-forming eruption about 7,100 years ago is thought to have originated from Tavui caldera, offshore to the north. Three small stratovolcanoes lie outside the N and NE caldera rims. Post-caldera eruptions built basaltic-to-dacitic pyroclastic cones on the caldera floor near the NE and W caldera walls. Several of these, including Vulcan cone, which was formed during a large eruption in 1878, have produced major explosive activity during historical time. A powerful explosive eruption in 1994 occurred simultaneously from Vulcan and Tavurvur volcanoes and forced the temporary abandonment of Rabaul city.
Information Contacts: B. Talai, RVO.
San Miguel (El Salvador) — March 1995 Cite this Report
San Miguel
El Salvador
13.434°N, 88.269°W; summit elev. 2130 m
All times are local (unless otherwise noted)
Increased seismicity and minor ashfall near the crater
New fumaroles were found near the central vent in early January, followed by an increase in seismic activity from an average of 20-30 events/day. On 8 February there were 52 recorded earthquakes. Seismicity increased to 73 events on 19 February, 100 on the 20th, and peaked at 267 on the 21st. This activity then declined on 22 February to an average of 76 events/day, a rate which continued through at least 24 March. Minor ashfall was reported on 23 March within ~100 m of the crater.
The Centro de Investigaciones Geotécnicas (CIG) concluded that this activity was no cause for alarm, but they would increase their monitoring efforts. The population at risk from an eruption with significant ashfall is a mix of urban and rural residents. The city of San Miguel (10 km NE) has a population of ~150,000, and the rural zone that would likely be affected has a population of ~100,000.
Geologic Background. The symmetrical cone of San Miguel, one of the most active volcanoes in El Salvador, rises from near sea level to form one of the country's most prominent landmarks. A broad, deep, crater complex that has been frequently modified by eruptions recorded since the early 16th century caps the truncated unvegetated summit, also known locally as Chaparrastique. Flanks eruptions of the basaltic-andesitic volcano have produced many lava flows, including several during the 17th-19th centuries that extended to the N, NE, and SE. The SE-flank flows are the largest and form broad, sparsely vegetated lava fields crossed by highways and a railroad skirting the base of the volcano. Flank vent locations have migrated higher on the edifice during historical time, and the most recent activity has consisted of minor ash eruptions from the summit crater.
Information Contacts: Jorge Alberto Rodríguez Deras, Director, Centro de Investigaciones Geotécnicas, San Salvador, El Salvador.
Semeru
Indonesia
8.108°S, 112.922°E; summit elev. 3657 m
All times are local (unless otherwise noted)
Ash eruptions, lava avalanches, and summit glow
Activity from the Jonggring Seloko summit crater continued in January and February 1995. Ash eruptions rose as high as 600 m above the summit. Lava avalanches increased in frequency during January and early February, and traveled down the Kembar River drainage to a distance of 750 m from the summit. Glow was sometimes observed 50-100 m above the summit. On the morning of 6 February three pyroclastic avalanches moved 800-1,000 m from the summit along the Kembar River before turning into the Kobokan River.
Tremor and volcanic earthquakes (both A- and B-type) were variable, with 20-110 events/day and 1-12 events/day, respectively (figure 5, top). Maximum tremor amplitude was 3-18 mm during the first week of January before increasing and peaking at 30 mm on the 8th. The daily number of explosions, recorded by a seismograph, showed an overall decline from 40-190 events/day in December to
Geologic Background. Semeru, the highest volcano on Java, and one of its most active, lies at the southern end of a volcanic massif extending north to the Tengger caldera. The steep-sided volcano, also referred to as Mahameru (Great Mountain), rises above coastal plains to the south. Gunung Semeru was constructed south of the overlapping Ajek-ajek and Jambangan calderas. A line of lake-filled maars was constructed along a N-S trend cutting through the summit, and cinder cones and lava domes occupy the eastern and NE flanks. Summit topography is complicated by the shifting of craters from NW to SE. Frequent 19th and 20th century eruptions were dominated by small-to-moderate explosions from the summit crater, with occasional lava flows and larger explosive eruptions accompanied by pyroclastic flows that have reached the lower flanks of the volcano.
Information Contacts: W. Tjetjep, VSI.
Slamet
Indonesia
7.242°S, 109.208°E; summit elev. 3428 m
All times are local (unless otherwise noted)
Increased seismicity and gas emission
Seismicity increased in January-February 1995. Continuous volcanic tremor (maximum amplitude 21 mm) was recorded during 14-19 January, followed by intermittent tremor (maximum amplitude 10 mm) until 26 January and during 6-10 February. Earthquakes associated with gas emissions were recorded at an average rate of 50 events/day in late January; by the end of February these had increased to 150 events/day (figure 06sla01f). No explosive activity was observed or detected.
Geologic Background. Slamet, Java's second highest volcano at 3428 m and one of its most active, has a cluster of about three dozen cinder cones on its lower SE-NE flanks and a single cinder cone on the western flank. It is composed of two overlapping edifices, an older basaltic-andesite to andesitic volcano on the west and a younger basaltic to basaltic-andesite one on the east. Gunung Malang II cinder cone on the upper E flank on the younger edifice fed a lava flow that extends 6 km E. Four craters occur at the summit of Gunung Slamet, with activity migrating to the SW over time. Historical eruptions, recorded since the 18th century, have originated from a 150-m-deep, 450-m-wide, steep-walled crater at the western part of the summit and have consisted of explosive eruptions generally lasting a few days to a few weeks.
Information Contacts: W. Tjetjep, VSI.
Tengger Caldera (Indonesia) — March 1995 Cite this Report
Tengger Caldera
Indonesia
7.942°S, 112.95°E; summit elev. 2329 m
All times are local (unless otherwise noted)
Eruption at Bromo causes ashfall 20 km away; gas emissions
An ash eruption from the active vent on the N side of Bromo crater at 0600 on 3 March produced a dark gray plume that rose 100-200 m above the crater rim. The plume extended >20 km S and SE, causing ashfall (0.5-2 mm thick) that covered ~10 km2 of cultivated land in and around the area of Sukapura (~20 km away). No injuries were reported as a result of this activity. Continuous weak-to-moderate gas emissions lasted through the end of March. COSPEC measurements showed that the SO2 flux was 6 t/d on 8 March. SO2 emission gradually increased to a peak of 22.8 t/d on the 18th before dropping again on 19-20 March (figure 1). Measurements during 27-31 March were again higher, 15-21 t/d.
Volcanic tremor events associated with the gas emissions (maximum amplitude 2-7 mm) were recorded continuously beginning on 9 March using PS-2 and Teledyne seismographs installed between 500 and 1,000 m from the active crater. The number of distinct earthquakes (maximum amplitude1,100 to ~400, and gradually decreased through the end of the month (figure 1). Three tectonic earthquakes were detected on 23 February, and one each on 24 and 28 February, and 28 March.
Geologic Background. The 16-km-wide Tengger caldera is located at the northern end of a volcanic massif extending from Semeru volcano. The massive volcanic complex dates back to about 820,000 years ago and consists of five overlapping stratovolcanoes, each truncated by a caldera. Lava domes, pyroclastic cones, and a maar occupy the flanks of the massif. The Ngadisari caldera at the NE end of the complex formed about 150,000 years ago and is now drained through the Sapikerep valley. The most recent of the calderas is the 9 x 10 km wide Sandsea caldera at the SW end of the complex, which formed incrementally during the late Pleistocene and early Holocene. An overlapping cluster of post-caldera cones was constructed on the floor of the Sandsea caldera within the past several thousand years. The youngest of these is Bromo, one of Java's most active and most frequently visited volcanoes.
Information Contacts: W. Tjetjep, VSI.
Turrialba (Costa Rica) — March 1995 Cite this Report
Turrialba
Costa Rica
10.025°N, 83.767°W; summit elev. 3340 m
All times are local (unless otherwise noted)
Weak fumarolic activity
"Weak fumarolic activity was witnessed in the SW and Central craters during an overflight in February." Previously described tilt measurements in 1994 (18:01) disclosed no changes above detection limits.
Geologic Background. Turrialba, the easternmost of Costa Rica's Holocene volcanoes, is a large vegetated basaltic-to-dacitic stratovolcano located across a broad saddle NE of Irazú volcano overlooking the city of Cartago. The massive edifice covers an area of 500 km2. Three well-defined craters occur at the upper SW end of a broad 800 x 2200 m summit depression that is breached to the NE. Most activity originated from the summit vent complex, but two pyroclastic cones are located on the SW flank. Five major explosive eruptions have occurred during the past 3500 years. A series of explosive eruptions during the 19th century were sometimes accompanied by pyroclastic flows. Fumarolic activity continues at the central and SW summit craters.
Information Contacts: G. Soto, ICE.
Ulawun (Papua New Guinea) — March 1995 Cite this Report
Ulawun
Papua New Guinea
5.05°S, 151.33°E; summit elev. 2334 m
All times are local (unless otherwise noted)
Continued moderate vapor emissions; SO2 data from October 1994
Activity on most days during January-March remained at a low level, with only moderate or moderate-strong thick white vapor emissions. Seismicity was low during the first week of January, the first three weeks of February, and the first three weeks of March; the seismograph was not operational at other times.
On 6 October 1994 the stratovolcano was visited by Chris McKee and Rod Stewart (RVO), and Stan Williams and Steve Schaefer (ASU), because of reports that the gas plume was abnormally large. Williams suggested that the plume appeared larger in volume and visible extent than during his two other visits in 1983 and 1989. Airborne COSPEC measurements made in clear atmospheric conditions showed the SO2 flux to be 1,260 ± 100 t/d. Prior measurements in 1983 and 1989 were 71 and 120 t/d, respectively.
Geologic Background. The symmetrical basaltic-to-andesitic Ulawun stratovolcano is the highest volcano of the Bismarck arc, and one of Papua New Guinea's most frequently active. The volcano, also known as the Father, rises above the N coast of the island of New Britain across a low saddle NE of Bamus volcano, the South Son. The upper 1,000 m is unvegetated. A prominent E-W escarpment on the south may be the result of large-scale slumping. Satellitic cones occupy the NW and E flanks. A steep-walled valley cuts the NW side, and a flank lava-flow complex lies to the south of this valley. Historical eruptions date back to the beginning of the 18th century. Twentieth-century eruptions were mildly explosive until 1967, but after 1970 several larger eruptions produced lava flows and basaltic pyroclastic flows, greatly modifying the summit crater.
Information Contacts: B. Talai, C. McKee, and R. Stewart, RVO; S. Williams and S. Schaefer, Arizona State University.