Recently Published Bulletin Reports
Kadovar (Papua New Guinea) An ash plume and weak thermal anomaly during May 2023
San Miguel (El Salvador) Small gas-and-ash explosions during March and May 2023
Ebeko (Russia) Continued explosions, ash plumes, and ashfall during October 2022-May 2023
Home Reef (Tonga) Discolored plumes continued during November 2022-April 2023
Semisopochnoi (United States) Occasional explosions, ash deposits, and gas-and-steam plumes during December 2022-May 2023
Ambae (Vanuatu) New lava flow, ash plumes, and sulfur dioxide plumes during February-May 2023
Ibu (Indonesia) Daily ash explosions continue, along with thermal anomalies in the crater, October 2022-May 2023
Dukono (Indonesia) Continuing ash emissions, SO2 plumes, and thermal signals during October 2022-May 2023
Sabancaya (Peru) Explosions, gas-and-ash plumes, and thermal activity persist during November 2022-April 2023
Sheveluch (Russia) Significant explosions destroyed part of the lava-dome complex during April 2023
Bezymianny (Russia) Explosions, ash plumes, lava flows, and avalanches during November 2022-April 2023
Chikurachki (Russia) New explosive eruption during late January-early February 2023
Kadovar (Papua New Guinea) — June 2023  Cite this Report
Kadovar
Papua New Guinea
3.608°S, 144.588°E; summit elev. 365 m
All times are local (unless otherwise noted)
An ash plume and weak thermal anomaly during May 2023
Kadovar is a 2-km-wide island that is the emergent summit of a Bismarck Sea stratovolcano. It lies off the coast of New Guinea, about 25 km N of the mouth of the Sepik River. Prior to an eruption that began in 2018, a lava dome formed the high point of the volcano, filling an arcuate landslide scarp open to the S. Submarine debris-avalanche deposits occur to the S of the island. The current eruption began in January 2018 and has comprised lava effusion from vents at the summit and at the E coast; more recent activity has consisted of ash plumes, weak thermal activity, and gas-and-steam plumes (BGVN 48:02). This report covers activity during February through May 2023 using information from the Darwin Volcanic Ash Advisory Center (VAAC) and satellite data.
Activity during the reporting period was relatively low and mainly consisted of white gas-and-steam plumes that were visible in natural color satellite images on clear weather days (figure 67). According to a Darwin VAAC report, at 2040 on 6 May an ash plume rose to 4.6 km altitude and drifted W; by 2300 the plume had dissipated. MODIS satellite instruments using the MODVOLC thermal algorithm detected a single thermal hotspot on the SE side of the island on 7 May. Weak thermal activity was also detected in a satellite image on the E side of the island on 14 May, accompanied by a white gas-and-steam plume that drifted SE (figure 68).
Geologic Background. The 2-km-wide island of Kadovar is the emergent summit of a Bismarck Sea stratovolcano of Holocene age. It is part of the Schouten Islands, and lies off the coast of New Guinea, about 25 km N of the mouth of the Sepik River. Prior to an eruption that began in 2018, a lava dome formed the high point of the andesitic volcano, filling an arcuate landslide scarp open to the south; submarine debris-avalanche deposits occur in that direction. Thick lava flows with columnar jointing forms low cliffs along the coast. The youthful island lacks fringing or offshore reefs. A period of heightened thermal phenomena took place in 1976. An eruption began in January 2018 that included lava effusion from vents at the summit and at the E coast.
Information Contacts: Darwin Volcanic Ash Advisory Centre (VAAC), Bureau of Meteorology, Northern Territory Regional Office, PO Box 40050, Casuarina, NT 0811, Australia (URL: http://www.bom.gov.au/info/vaac/); Hawai'i Institute of Geophysics and Planetology (HIGP) - MODVOLC Thermal Alerts System, School of Ocean and Earth Science and Technology (SOEST), Univ. of Hawai'i, 2525 Correa Road, Honolulu, HI 96822, USA (URL: http://modis.higp.hawaii.edu/); Copernicus Browser, Copernicus Data Space Ecosystem, European Space Agency (URL: https://dataspace.copernicus.eu/browser/).
San Miguel (El Salvador) — June 2023 Cite this Report
San Miguel
El Salvador
13.434°N, 88.269°W; summit elev. 2130 m
All times are local (unless otherwise noted)
Small gas-and-ash explosions during March and May 2023
San Miguel in El Salvador is a broad, deep crater complex that has been frequently modified by eruptions recorded since the early 16th century and consists of the summit known locally as Chaparrastique. Flank eruptions have produced lava flows that extended to the N, NE, and SE during the 17-19th centuries. The most recent activity has consisted of minor ash eruptions from the summit crater. The current eruption period began in November 2022 and has been characterized by frequent phreatic explosions, gas-and-ash emissions, and sulfur dioxide plumes (BGVN 47:12). This report describes small gas-and-ash explosions during December 2022 through May 2023 based on special reports from the Ministero de Medio Ambiente y Recursos Naturales (MARN).
Activity has been relatively low since the last recorded explosions on 29 November 2022. Seismicity recorded by the San Miguel Volcano Station (VSM) located on the N flank at 1.7 km elevation had decreased by 7 December. Sulfur dioxide gas measurements taken with DOAS (Differential Optical Absorption Spectroscopy) mobile equipment were below typical previously recorded values: 300 tons per day (t/d). During December, small explosions were recorded by the seismic network and manifested as gas-and-steam emissions.
Gas-and-ash explosions in the crater occurred during January 2023, which were recorded by the seismic network. Sulfur dioxide values remained low, between 300-400 t/d through 10 March. At 0817 on 14 January a gas-and-ash emission was visible in webcam images, rising just above the crater rim. Some mornings during February, small gas-and-steam plumes were visible in the crater. On 7 March at 2252 MARN noted an increase in degassing from the central crater; gas emissions were constantly observed through the early morning hours on 8 March. During the early morning of 8 March through the afternoon on 9 March, 12 emissions were registered, some accompanied by ash. The last gas-and-ash emission was recorded at 1210 on 9 March; very fine ashfall was reported in El Tránsito (10 km S), La Morita (6 km W), and La Piedrita (3 km W). The smell of sulfur was reported in Piedra Azul (5 km SW). On 16 March MARN reported that gas-and-steam emissions decreased.
Low degassing and very low seismicity were reported during April; no explosions have been detected between 9 March and 27 May. The sulfur dioxide emissions remained between 350-400 t/d; during 13-20 April sulfur dioxide values fluctuated between 30-300 t/d. Activity remained low through most of May; on 23 May seismicity increased. An explosion was detected at 1647 on 27 May generated a gas-and-ash plume that rose 700 m high (figure 32); a decrease in seismicity and gas emissions followed. The DOAS station installed on the W flank recorded sulfur dioxide values that reached 400 t/d on 27 May; subsequent measurements showed a decrease to 268 t/d on 28 May and 100 t/d on 29 May.
Geologic Background. The symmetrical cone of San Miguel, one of the most active volcanoes in El Salvador, rises from near sea level to form one of the country's most prominent landmarks. A broad, deep, crater complex that has been frequently modified by eruptions recorded since the early 16th century caps the truncated unvegetated summit, also known locally as Chaparrastique. Flanks eruptions of the basaltic-andesitic volcano have produced many lava flows, including several during the 17th-19th centuries that extended to the N, NE, and SE. The SE-flank flows are the largest and form broad, sparsely vegetated lava fields crossed by highways and a railroad skirting the base of the volcano. Flank vent locations have migrated higher on the edifice during historical time, and the most recent activity has consisted of minor ash eruptions from the summit crater.
Information Contacts: Ministero de Medio Ambiente y Recursos Naturales (MARN), Km. 5½ Carretera a Nueva San Salvador, Avenida las Mercedes, San Salvador, El Salvador (URL: http://www.snet.gob.sv/ver/vulcanologia).
Ebeko
Russia
50.686°N, 156.014°E; summit elev. 1103 m
All times are local (unless otherwise noted)
Continued explosions, ash plumes, and ashfall during October 2022-May 2023
Ebeko, located on the N end of Paramushir Island in the Kuril Islands, consists of three summit craters along a SSW-NNE line at the northern end of a complex of five volcanic cones. Eruptions date back to the late 18th century and have been characterized as small-to-moderate explosions from the summit crater, accompanied by intense fumarolic activity. The current eruption period began in June 2022 and has recently consisted of frequent explosions, ash plumes, and thermal activity (BGVN 47:10). This report covers similar activity during October 2022 through May 2023, based on information from the Kamchatka Volcanic Eruptions Response Team (KVERT) and satellite data.
Activity during October consisted of explosive activity, ash plumes, and occasional thermal anomalies. Visual data by volcanologists from Severo-Kurilsk showed explosions producing ash clouds up to 2.1-3 km altitude which drifted E, N, NE, and SE during 1-8, 10, 16, and 18 October. KVERT issued several Volcano Observatory Notices for Aviation (VONA) on 7, 13-15, and 27 October 2022, stating that explosions generated ash plumes that rose to 2.3-4 km altitude and drifted 5 km E, NE, and SE. Ashfall was reported in Severo-Kurilsk (Paramushir Island, about 7 km E) on 7 and 13 October. Satellite data showed a thermal anomaly over the volcano on 15-16 October. Visual data showed ash plumes rising to 2.5-3.6 km altitude on 22, 25-29, and 31 October and moving NE due to constant explosions.
Similar activity continued during November, with explosions, ash plumes, and ashfall occurring. KVERT issued VONAs on 1-2, 4, 6-7, 9, 13, and 16 November that reported explosions and resulting ash plumes that rose to 1.7-3.6 km altitude and drifted 3-5 km SE, ESE, E, and NE. On 1 November ash plumes extended as far as 110 km SE. On 5, 8, 12, and 24-25 November explosions and ash plumes rose to 2-3.1 km altitude and drifted N and E. Ashfall was observed in Severo-Kurilsk on 7 and 16 November. A thermal anomaly was visible during 1-4, 16, and 20 November. Explosions during 26 November rose as high as 2.7 km altitude and drifted NE (figure 45).
Explosions and ash plumes continued to occur in December. During 1-2 and 4 December volcanologists from Severo-Kurilsk observed explosions that sent ash to 1.9-2.5 km altitude and drifted NE and SE (figure 46). VONAs were issued on 5, 9, and 16 December reporting that explosions generated ash plumes rising to 1.9 km, 2.6 km, and 2.4 km altitude and drifted 5 km SE, E, and NE, respectively. A thermal anomaly was visible in satellite imagery on 16 December. On 18 and 27-28 December explosions produced ash plumes that rose to 2.5 km altitude and drifted NE and SE. On 31 December an ash plume rose to 2 km altitude and drifted NE.
Explosions continued during January 2023, based on visual observations by volcanologists from Severo-Kurilsk. During 1-7 January explosions generated ash plumes that rose to 4 km altitude and drifted NE, E, W, and SE. According to VONAs issued by KVERT on 2, 4, 10, and 23 January, explosions produced ash plumes that rose to 2-4 km altitude and drifted 5 km N, NE, E, and ENE; the ash plume that rose to 4 km altitude occurred on 10 January (figure 47). Satellite data showed a thermal anomaly during 3-4, 10, 13, 16, 21, 22, and 31 January. KVERT reported that an ash cloud on 4 January moved 12 km NE. On 6 and 9-11 January explosions sent ash plumes to 4.5 km altitude and drifted W and ESE. On 13 January an ash plume rose to 3 km altitude and drifted SE. During 20-24 January ash plumes from explosions rose to 3.7 km altitude and drifted SE, N, and NE. On 21 January the ash plume drifted as far as 40 km NE. During 28-29 and 31 January and 1 February ash plumes rose to 4 km altitude and drifted NE.
During February, explosions, ash plumes, and ashfall were reported. During 1, 4-5 and 7-8 February explosions generated ash plumes that rose to 4.5 km altitude and drifted E and NE; ashfall was observed on 5 and 8 February. On 6 February an explosion produced an ash plume that rose to 3 km altitude and drifted 7 km E, causing ashfall in Severo-Kurilsk. A thermal anomaly was visible in satellite data on 8, 9, 13, and 21 February. Explosions on 9 and 12-13 February produced ash plumes that rose to 4 km altitude and drifted E and NE; the ash cloud on 12 February extended as far as 45 km E. On 22 February explosions sent ash to 3 km altitude that drifted E. During 24 and 26-27 February ash plumes rose to 4 km altitude and drifted E. On 28 February an explosion sent ash to 2.5-3 km altitude and drifted 5 km E; ashfall was observed in Severo-Kurilsk.
Activity continued during March; visual observations showed that explosions generated ash plumes that rose to 3.6 km altitude on 3, 5-7, and 9-12 March and drifted E, NE, and NW. Thermal anomalies were visible on 10, 13, and 29-30 March in satellite imagery. On 18, 21-23, 26, and 29-30 March explosions produced ash plumes that rose to 2.8 km altitude and drifted NE and E; the ash plumes during 22-23 March extended up to 76 km E. A VONA issued on 21 March reported an explosion that produced an ash plume that rose to 2.8 km altitude and drifted 5 km E. Another VONA issued on 23 March reported that satellite data showed an ash plume rising to 3 km altitude and drifted 14 km E.
Explosions during April continued to generate ash plumes. On 1 and 4 April an ash plume rose to 2.8-3.5 km altitude and drifted SE and NE. A thermal anomaly was visible in satellite imagery during 1-6 April. Satellite data showed ash plumes and clouds rising to 2-3 km altitude and drifting up to 12 km SW and E on 3 and 6 April (figure 48). KVERT issued VONAs on 3, 5, 14, 16 April describing explosions that produced ash plumes rising to 3 km, 3.5 km, 3.5 km, and 3 km altitude and drifting 5 km S, 5 km NE and SE, 72 km NNE, and 5 km NE, respectively. According to satellite data, the resulting ash cloud from the explosion on 14 April was 25 x 7 km in size and drifted 72-104 km NNE during 14-15 April. According to visual data by volcanologists from Severo-Kurilsk explosions sent ash up to 3.5 km altitude that drifted NE and E during 15-16, 22, 25-26, and 29 April.
The explosive eruption continued during May. Explosions during 3-4, 6-7, and 9-10 May generated ash plumes that rose to 4 km altitude and drifted SW and E. Satellite data showed a thermal anomaly on 3, 9, 13-14, and 24 May. During 12-16, 23-25, and 27-28 May ash plumes rose to 3.5 km altitude and drifted in different directions due to explosions. Two VONA notices were issued on 16 and 25 May, describing explosions that generated ash plumes rising to 3 km and 3.5 km altitude, respectively and extending 5 km E. The ash cloud on 25 May drifted 75 km SE.
Thermal activity in the summit crater, occasionally accompanied by ash plumes and ash deposits on the SE and E flanks due to frequent explosions, were visible in infrared and true color satellite images (figure 49).
Geologic Background. The flat-topped summit of the central cone of Ebeko volcano, one of the most active in the Kuril Islands, occupies the northern end of Paramushir Island. Three summit craters located along a SSW-NNE line form Ebeko volcano proper, at the northern end of a complex of five volcanic cones. Blocky lava flows extend west from Ebeko and SE from the neighboring Nezametnyi cone. The eastern part of the southern crater contains strong solfataras and a large boiling spring. The central crater is filled by a lake about 20 m deep whose shores are lined with steaming solfataras; the northern crater lies across a narrow, low barrier from the central crater and contains a small, cold crescentic lake. Historical activity, recorded since the late-18th century, has been restricted to small-to-moderate explosive eruptions from the summit craters. Intense fumarolic activity occurs in the summit craters, on the outer flanks of the cone, and in lateral explosion craters.
Information Contacts: Kamchatka Volcanic Eruptions Response Team (KVERT), Far Eastern Branch, Russian Academy of Sciences, 9 Piip Blvd., Petropavlovsk-Kamchatsky, 683006, Russia (URL: http://www.kscnet.ru/ivs/kvert/); MIROVA (Middle InfraRed Observation of Volcanic Activity), a collaborative project between the Universities of Turin and Florence (Italy) supported by the Centre for Volcanic Risk of the Italian Civil Protection Department (URL: http://www.mirovaweb.it/); Copernicus Browser, Copernicus Data Space Ecosystem, European Space Agency (URL: https://dataspace.copernicus.eu/browser/).
Home Reef
Tonga
18.992°S, 174.775°W; summit elev. -10 m
All times are local (unless otherwise noted)
Discolored plumes continued during November 2022-April 2023
Home Reef is a submarine volcano located in the central Tonga islands between Lateiki (Metis Shoal) and Late Island. The first recorded eruption occurred in the mid-19th century, when an ephemeral island formed. An eruption in 1984 produced a 12-km-high eruption plume, a large volume of floating pumice, and an ephemeral island 500 x 1,500 m wide, with cliffs 30-50 m high that enclosed a water-filled crater. Another island-forming eruption in 2006 produced widespread pumice rafts that drifted as far as Australia; by 2008 the island had eroded below sea level. The previous eruption occurred during October 2022 and was characterized by a new island-forming eruption, lava effusion, ash plumes, discolored water, and gas-and-steam plumes (BGVN 47:11). This report covers discolored water plumes during November 2022 through April 2023 using satellite data.
Discolored plumes continued during the reporting period and were observed in true color satellite images on clear weather days. Satellite images show light green-yellow discolored water extending W on 8 and 28 November 2022 (figure 31), and SW on 18 November. Light green-yellow plumes extended W on 3 December, S on 13 December, SW on 18 December, and W and S on 23 December (figure 31). On 12 January 2023 discolored green-yellow plumes extended to the NE, E, SE, and N. The plume moved SE on 17 January and NW on 22 January. Faint discolored water in February was visible moving NE on 1 February. A discolored plume extended NW on 8 and 28 March and NW on 13 March (figure 31). During April, clear weather showed green-blue discolored plumes moving S on 2 April, W on 7 April, and NE and S on 12 April. A strong green-yellow discolored plume extended E and NE on 22 April for several kilometers (figure 31).
Geologic Background. Home Reef, a submarine volcano midway between Metis Shoal and Late Island in the central Tonga islands, was first reported active in the mid-19th century, when an ephemeral island formed. An eruption in 1984 produced a 12-km-high eruption plume, large amounts of floating pumice, and an ephemeral 500 x 1,500 m island, with cliffs 30-50 m high that enclosed a water-filled crater. In 2006 an island-forming eruption produced widespread dacitic pumice rafts that drifted as far as Australia. Another island was built during a September-October 2022 eruption.
Information Contacts: Copernicus Browser, Copernicus Data Space Ecosystem, European Space Agency (URL: https://dataspace.copernicus.eu/browser/).
Semisopochnoi (United States) — June 2023 Cite this Report
Semisopochnoi
United States
51.93°N, 179.58°E; summit elev. 1221 m
All times are local (unless otherwise noted)
Occasional explosions, ash deposits, and gas-and-steam plumes during December 2022-May 2023
Semisopochnoi is located in the western Aleutians, is 20-km-wide at sea level, and contains an 8-km-wide caldera. The three-peaked Mount Young (formerly Cerberus) was constructed within the caldera during the Holocene. Each of these peaks contains a summit crater; the lava flows on the N flank appear younger than those on the S side. The current eruption period began in early February 2021 and has more recently consisted of intermittent explosions and ash emissions (BGVN 47:12). This report updates activity during December 2022 through May 2023 using daily, weekly, and special reports from the Alaska Volcano Observatory (AVO). AVO monitors the volcano using local seismic and infrasound sensors, satellite data, web cameras, and remote infrasound and lightning networks.
Activity during most of December 2022 was relatively quiet; according to AVO no eruptive or explosive activity was observed since 7 November 2022. Intermittent tremor and occasional small earthquakes were observed in geophysical data. Continuous gas-and-steam emissions were observed from the N crater of Mount Young in webcam images on clear weather days (figure 25). On 24 December, there was a slight increase in earthquake activity and several small possible explosion signals were detected in infrasound data. Eruptive activity resumed on 27 December at the N crater of Mount Young; AVO issued a Volcano Activity Notice (VAN) that reported minor ash deposits on the flanks of Mount Young that extended as far as 1 km from the vent, according to webcam images taken during 27-28 December (figure 26). No ash plumes were observed in webcam or satellite imagery, but a persistent gas-and-steam plume that might have contained some ash rose to 1.5 km altitude. As a result, AVO raised the Aviation Color Code (ACC) to Orange (the second highest level on a four-color scale) and the Volcano Alert Level (VAL) to Watch (the second highest level on a four-level scale). Possible explosions were detected during 21 December 2022 through 1 January 2023 and seismic tremor was recorded during 30-31 December.
During January 2023 eruptive activity continued at the active N crater of Mount Young. Minor ash deposits were observed on the flanks, extending about 2 km SSW, based on webcam images from 1 and 3 January. A possible explosion occurred during 1-2 January based on elevated seismicity recorded on local seismometers and an infrasound signal recorded minutes later by an array at Adak. Though no ash plumes were observed in webcam or satellite imagery, a persistent gas-and-steam plume rose to 1.5 km altitude that might have carried minor traces of ash. Ash deposits were accompanied by periods of elevated seismicity and infrasound signals from the local geophysical network, which AVO reported were likely due to weak explosive activity. Low-level explosive activity was also detected during 2-3 January, with minor gas-and-steam emissions and a new ash deposit that was visible in webcam images. Low-level explosive activity was detected in geophysical data during 4-5 January, with elevated seismicity and infrasound signals observed on local stations. Volcanic tremor was detected during 7-9 January and very weak explosive activity was detected in seismic and infrasound data on 9 January. Weak seismic and infrasound signals were recorded on 17 January, which indicated minor explosive activity, but no ash emissions were observed in clear webcam images; a gas-and-steam plume continued to rise to 1.5 km altitude. During 29-30 January, ash deposits near the summit were observed on fresh snow, according to webcam images.
The active N cone at Mount Young continued to produce a gas-and-steam plume during February, but no ash emissions or explosive events were detected. Seismicity remained elevated with faint tremor during early February. Gas-and-steam emissions from the N crater were observed in clear webcam images on 11-13 and 16 February; no explosive activity was detected in seismic, infrasound, or satellite data. Seismicity has also decreased, with no significant seismic tremor observed since 25 January. Therefore, the ACC was lowered to Yellow (the second lowest level on a four-color scale) and the VAL was lowered to Advisory (the second lowest level on a four-color scale) on 22 February.
Gas-and-steam emissions persisted during March from the N cone of Mount Young, based on clear webcam images. A few brief episodes of weak tremor were detected in seismic data, although seismicity decreased over the month. A gas-and-steam plume detected in satellite data extended 150 km on 18 March. Low-level ash emissions from the N cone at Mount Young were observed in several webcam images during 18-19 March, in addition to small explosions and volcanic tremor. The ACC was raised to Orange and the VAL increased to Watch on 19 March. A small explosion was detected in seismic and infrasound data on 21 March.
Low-level unrest continued during April, although cloudy weather often obscured views of the summit; periods of seismic tremor and local earthquakes were recorded. During 3-4 April a gas-and-steam plume was visible traveling more than 200 km overnight; no ash was evident in the plume, according to AVO. A gas-and-steam plume was observed during 4-6 April that extended 400 km but did not seem to contain ash. Small explosions were detected in seismic and infrasound data on 5 April. Occasional clear webcam images showed continuing gas-and-steam emissions rose from Mount Young, but no ash deposits were observed on the snow. On 19 April small explosions and tremor were detected in seismic and infrasound data. A period of seismic tremor was detected during 22-25 April, with possible weak explosions on 25 April. Ash deposits were visible near the crater rim, but it was unclear if these deposits were recent or due to older deposits.
Occasional small earthquakes were recorded during May, but there were no signs of explosive activity seen in geophysical data. Gas-and-steam emissions continued from the N crater of Mount Young, based on webcam images, and seismicity remained slightly elevated. A new, light ash deposit was visible during the morning of 5 May on fresh snow on the NW flank of Mount Young. During 10 May periods of volcanic tremor were observed. The ACC was lowered to Yellow and the VAL to Advisory on 17 May due to no additional evidence of activity.
Geologic Background. Semisopochnoi, the largest subaerial volcano of the western Aleutians, is 20 km wide at sea level and contains an 8-km-wide caldera. It formed as a result of collapse of a low-angle, dominantly basaltic volcano following the eruption of a large volume of dacitic pumice. The high point of the island is Anvil Peak, a double-peaked late-Pleistocene cone that forms much of the island's northern part. The three-peaked Mount Cerberus (renamed Mount Young in 2023) was constructed within the caldera during the Holocene. Each of the peaks contains a summit crater; lava flows on the N flank appear younger than those on the south side. Other post-caldera volcanoes include the symmetrical Sugarloaf Peak SSE of the caldera and Lakeshore Cone, a small cinder cone at the edge of Fenner Lake in the NE part of the caldera. Most documented eruptions have originated from Young, although Coats (1950) considered that both Sugarloaf and Lakeshore Cone could have been recently active.
Information Contacts: Alaska Volcano Observatory (AVO), a cooperative program of a) U.S. Geological Survey, 4200 University Drive, Anchorage, AK 99508-4667 USA (URL: https://avo.alaska.edu/), b) Geophysical Institute, University of Alaska, PO Box 757320, Fairbanks, AK 99775-7320, USA, and c) Alaska Division of Geological & Geophysical Surveys, 794 University Ave., Suite 200, Fairbanks, AK 99709, USA (URL: http://dggs.alaska.gov/).
Ambae
Vanuatu
15.389°S, 167.835°E; summit elev. 1496 m
All times are local (unless otherwise noted)
New lava flow, ash plumes, and sulfur dioxide plumes during February-May 2023
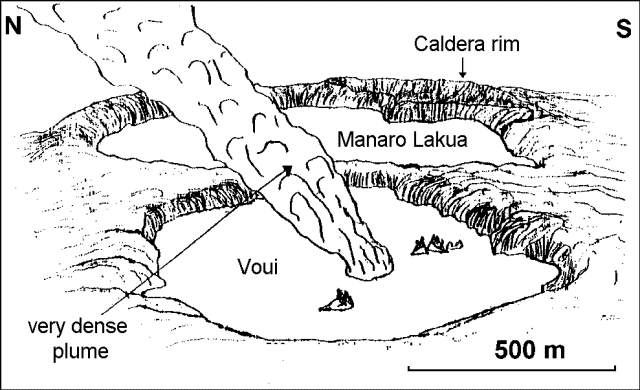
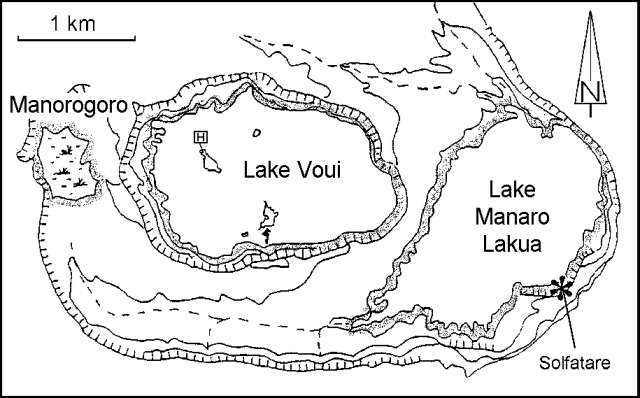
Ambae, also known as Aoba, is a large basaltic shield volcano in Vanuatu. A broad pyroclastic cone containing three crater lakes (Manaro Ngoru, Voui, and Manaro Lakua) is located at the summit within the youngest of at least two nested calderas. Periodic phreatic and pyroclastic explosions have been reported since the 16th century. A large eruption more than 400 years ago resulted in a volcanic cone within the summit crater that is now filled by Lake Voui; the similarly sized Lake Manaro fills the western third of the caldera. The previous eruption ended in August 2022 that was characterized by gas-and-steam and ash emissions and explosions of wet tephra (BGVN 47:10). This report covers a new eruption during February through May 2023 that consisted of a new lava flow, ash plumes, and sulfur dioxide emissions, using information from the Vanuatu Meteorology and Geo-Hazards Department (VMGD) and satellite data.
During the reporting period, the Alert Level remained at a 2 (on a scale of 0-5), which has been in place since December 2021. Activity during October 2022 through March 2023 remained relatively low and mostly consisted of gas-and-steam emissions in Lake Voui. VMGD reported that at 1300 on 15 November a satellite image captured a strong amount of sulfur dioxide rising above the volcano (figure 99), and that seismicity slightly increased. The southern and northern part of the island reported a strong sulfur dioxide smell and heard explosions. On 20 February 2023 a gas-and-ash plume rose 1.3 km above the summit and drifted SSW, according to a webcam image (figure 100). Gas-and-steam and possibly ash emissions continued on 23 February and volcanic earthquakes were recorded by the seismic network.
During April, volcanic earthquakes and gas-and-steam and ash emissions were reported from the cone in Lake Voui. VMGD reported that activity increased during 5-7 April; high gas-and-steam and ash plumes were visible, accompanied by nighttime incandescence. According to a Wellington VAAC report, a low-level ash plume rose as high as 2.5 km above the summit and drifted W and SW on 5 April, based on satellite imagery. Reports in Saratamata stated that a dark ash plume drifted to the WSW, but no loud explosion was heard. Webcam images from 2100 showed incandescence above the crater and reflected in the clouds. According to an aerial survey, field observations, and satellite data, water was no longer present in the lake. A lava flow was reported effusing from the vent and traveling N into the dry Lake Voui, which lasted three days. The next morning at 0745 on 6 April a gas-and-steam and ash plume rose 5.4 km above the summit and drifted ESE, based on information from VMGD (figure 101). The Wellington VAAC also reported that light ashfall was observed on the island. Intermittent gas-and-steam and ash emissions were visible on 7 April, some of which rose to an estimated 3 km above the summit and drifted E. Webcam images during 0107-0730 on 7 April showed continuing ash emissions. A gas-and-steam and ash plume rose 695 m above the summit crater at 0730 on 19 April and drifted ESE, based on a webcam image (figure 102).
According to visual and infrared satellite data, water was visible in Lake Voui as late as 24 March 2023 (figure 103). The vent in the caldera showed a gas-and-steam plume drifted SE. On 3 April thermal activity was first detected, accompanied by a gas-and-ash plume that drifted W (figure 103). The lava flow moved N within the dry lake and was shown cooling by 8 April. By 23 April much of the water in the lake had returned. Occasional sulfur dioxide plumes were detected by the TROPOMI instrument on the Sentinel-5P satellite that exceeded 2 Dobson Units (DU) and drifted in different directions (figure 104).
Geologic Background. The island of Ambae, also known as Aoba, is a massive 2,500 km3 basaltic shield that is the most voluminous volcano of the New Hebrides archipelago. A pronounced NE-SW-trending rift zone with numerous scoria cones gives the 16 x 38 km island an elongated form. A broad pyroclastic cone containing three crater lakes (Manaro Ngoru, Voui, and Manaro Lakua) is located at the summit within the youngest of at least two nested calderas, the largest of which is 6 km in diameter. That large central edifice is also called Manaro Voui or Lombenben volcano. Post-caldera explosive eruptions formed the summit craters about 360 years ago. A tuff cone was constructed within Lake Voui (or Vui) about 60 years later. The latest known flank eruption, about 300 years ago, destroyed the population of the Nduindui area near the western coast.
Information Contacts: Geo-Hazards Division, Vanuatu Meteorology and Geo-Hazards Department (VMGD), Ministry of Climate Change Adaptation, Meteorology, Geo-Hazards, Energy, Environment and Disaster Management, Private Mail Bag 9054, Lini Highway, Port Vila, Vanuatu (URL: http://www.vmgd.gov.vu/, https://www.facebook.com/VanuatuGeohazardsObservatory/); Wellington Volcanic Ash Advisory Centre (VAAC), Meteorological Service of New Zealand Ltd (MetService), PO Box 722, Wellington, New Zealand (URL: http://www.metservice.com/vaac/, http://www.ssd.noaa.gov/VAAC/OTH/NZ/messages.html); MIROVA (Middle InfraRed Observation of Volcanic Activity), a collaborative project between the Universities of Turin and Florence (Italy) supported by the Centre for Volcanic Risk of the Italian Civil Protection Department (URL: http://www.mirovaweb.it/); Global Sulfur Dioxide Monitoring Page, Atmospheric Chemistry and Dynamics Laboratory, NASA Goddard Space Flight Center (NASA/GSFC), 8800 Greenbelt Road, Goddard, Maryland, USA (URL: https://so2.gsfc.nasa.gov/); Copernicus Browser, Copernicus Data Space Ecosystem, European Space Agency (URL: https://dataspace.copernicus.eu/browser/).
Ibu
Indonesia
1.488°N, 127.63°E; summit elev. 1325 m
All times are local (unless otherwise noted)
Daily ash explosions continue, along with thermal anomalies in the crater, October 2022-May 2023
Persistent eruptive activity since April 2008 at Ibu, a stratovolcano on Indonesian’s Halmahera Island, has consisted of daily explosive ash emissions and plumes, along with observations of thermal anomalies (BGVN 47:04). The current eruption continued during October 2022-May 2023, described below, based on advisories issued by the Pusat Vulkanologi dan Mitigasi Bencana Geologi (PVMBG, also known as Indonesian Center for Volcanology and Geological Hazard Mitigation, CVGHM), daily reports by MAGMA Indonesia (a PVMBG platform), and the Darwin Volcanic Ash Advisory Centre (VAAC), and various satellite data. The Alert Level during the reporting period remained at 2 (on a scale of 1-4), except raised briefly to 3 on 27 May, and the public was warned to stay at least 2 km away from the active crater and 3.5 km away on the N side of the volcano.
According to MAGMA Indonesia, during October 2022-May 2023, daily gray-and-white ash plumes of variable densities rose 200-1,000 m above the summit and drifted in multiple directions. On 30 October and 11 November, plumes rose a maximum of 2 km and 1.5 km above the summit, respectively (figures 42 and 43). According to the Darwin VAAC, discrete ash emissions on 13 November rose to 2.1 km altitude, or 800 m above the summit, and drifted W, and multiple ash emissions on 15 November rose 1.4 km above the summit and drifted NE. Occasional larger ash explosions through May 2023 prompted PVMBG to issue Volcano Observatory Notice for Aviation (VONA) alerts (table 6); the Aviation Color Code remained at Orange throughout this period.
Table 6. Volcano Observatory Notice for Aviation (VONA) ash plume alerts for Ibu issued by PVMBG during October 2022-May 2023. Maximum height above the summit was estimated by a ground observer. VONAs in January-May 2023 all described the ash plumes as dense.
| Date |
Time (local) |
Max height above summit |
Direction |
| 17 Oct 2022 |
0858 |
800 m |
SW |
| 18 Oct 2022 |
1425 |
800 m |
S |
| 19 Oct 2022 |
2017 |
600 m |
SW |
| 21 Oct 2022 |
0916 |
800 m |
NW |
| 16 Jan 2023 |
1959 |
600 m |
NE |
| 22 Jan 2023 |
0942 |
1,000 m |
E |
| 29 Jan 2023 |
2138 |
1,000 m |
E |
| 10 May 2023 |
0940 |
800 m |
NW |
| 10 May 2023 |
2035 |
600 m |
E |
| 21 May 2023 |
2021 |
600 m |
W |
| 21 May 2023 |
2140 |
1,000 m |
W |
| 29 May 2023 |
1342 |
800 m |
N |
| 31 May 2023 |
1011 |
1,000 m |
SW |
Sentinel-2 L1C satellite images throughout the reporting period show two, sometimes three persistent thermal anomalies in the summit crater, with the most prominent hotspot from the top of a cone within the crater. Clear views were more common during March-April 2023, when a vent and lava flows on the NE flank of the intra-crater cone could be distinguished (figure 44). White-to-grayish emissions were also observed during brief periods when weather clouds allowed clear views.
The MIROVA space-based volcano hotspot detection system recorded almost daily thermal anomalies throughout the reporting period, though cloud cover often interfered with detections. Data from imaging spectroradiometers aboard NASA’s Aqua and Terra satellites and processed using the MODVOLC algorithm (MODIS-MODVOLC) recorded hotspots on one day during October 2022 and December 2022, two days in April 2023, three days in November 2022 and May 2023, and four days in March 2023.
Geologic Background. The truncated summit of Gunung Ibu stratovolcano along the NW coast of Halmahera Island has large nested summit craters. The inner crater, 1 km wide and 400 m deep, has contained several small crater lakes. The 1.2-km-wide outer crater is breached on the N, creating a steep-walled valley. A large cone grew ENE of the summit, and a smaller one to the WSW has fed a lava flow down the W flank. A group of maars is located below the N and W flanks. The first observed and recorded eruption was a small explosion from the summit crater in 1911. Eruptive activity began again in December 1998, producing a lava dome that eventually covered much of the floor of the inner summit crater along with ongoing explosive ash emissions.
Information Contacts: Pusat Vulkanologi dan Mitigasi Bencana Geologi (PVMBG, also known as Indonesian Center for Volcanology and Geological Hazard Mitigation, CVGHM), Jalan Diponegoro 57, Bandung 40122, Indonesia (URL: http://www.vsi.esdm.go.id/); MAGMA Indonesia (Multiplatform Application for Geohazard Mitigation and Assessment in Indonesia), Kementerian Energi dan Sumber Daya Mineral (URL: https://magma.esdm.go.id/v1); Copernicus Browser, Copernicus Data Space Ecosystem, European Space Agency (URL: https://dataspace.copernicus.eu/browser/); MIROVA (Middle InfraRed Observation of Volcanic Activity), a collaborative project between the Universities of Turin and Florence (Italy) supported by the Centre for Volcanic Risk of the Italian Civil Protection Department (URL: http://www.mirovaweb.it/); Hawai'i Institute of Geophysics and Planetology (HIGP) - MODVOLC Thermal Alerts System, School of Ocean and Earth Science and Technology (SOEST), Univ. of Hawai'i, 2525 Correa Road, Honolulu, HI 96822, USA (URL: http://modis.higp.hawaii.edu/).
Dukono
Indonesia
1.6992°N, 127.8783°E; summit elev. 1273 m
All times are local (unless otherwise noted)
Continuing ash emissions, SO2 plumes, and thermal signals during October 2022-May 2023
Dukono, a remote volcano on Indonesia’s Halmahera Island, has been erupting continuously since 1933, with frequent ash explosions and sulfur dioxide plumes (BGVN 46:11, 47:10). This activity continued during October 2022 through May 2023, based on reports from the Pusat Vulkanologi dan Mitigasi Bencana Geologi (PVMBG; also known as Indonesian Center for Volcanology and Geological Hazard Mitigation, CVGHM), the Darwin Volcanic Ash Advisory Centre (VAAC), and satellite data. During this period, the Alert Level remained at 2 (on a scale of 1-4) and the public was warned to remain outside of the 2-km exclusion zone. The highest reported plume of the period reached 9.4 km above the summit on 14 November 2022.
According to MAGMA Indonesia (a platform developed by PVMBG), white, gray, or dark plumes of variable densities were observed almost every day during the reporting period, except when fog obscured the volcano (figure 33). Plumes generally rose 25-450 m above the summit, but rose as high as 700-800 m on several days, somewhat lower than the maximum heights reached earlier in 2022 when plumes reached as high as 1 km. However, the Darwin VAAC reported that on 14 November 2022, a discrete ash plume rose 9.4 km above the summit (10.7 km altitude), accompanied by a strong hotspot and a sulfur dioxide signal observed in satellite imagery; a continuous ash plume that day and through the 15th rose to 2.1-2.4 km altitude and drifted NE.
Sentinel-2 images were obscured by weather clouds almost every viewing day during the reporting period. However, the few reasonably clear images showed a hotspot and white or gray emissions and plumes. Strong SO2 plumes from Dukono were present on many days during October 2022-May 2023, as detected using the TROPOMI instrument on the Sentinel-5P satellite (figure 34).
Geologic Background. Reports from this remote volcano in northernmost Halmahera are rare, but Dukono has been one of Indonesia's most active volcanoes. More-or-less continuous explosive eruptions, sometimes accompanied by lava flows, have occurred since 1933. During a major eruption in 1550 CE, a lava flow filled in the strait between Halmahera and the N-flank Gunung Mamuya cone. This complex volcano presents a broad, low profile with multiple summit peaks and overlapping craters. Malupang Wariang, 1 km SW of the summit crater complex, contains a 700 x 570 m crater that has also been active during historical time.
Information Contacts: Pusat Vulkanologi dan Mitigasi Bencana Geologi (PVMBG, also known as Indonesian Center for Volcanology and Geological Hazard Mitigation, CVGHM), Jalan Diponegoro 57, Bandung 40122, Indonesia (URL: http://www.vsi.esdm.go.id/); MAGMA Indonesia (Multiplatform Application for Geohazard Mitigation and Assessment in Indonesia), Kementerian Energi dan Sumber Daya Mineral (URL: https://magma.esdm.go.id/v1); Darwin Volcanic Ash Advisory Centre (VAAC), Bureau of Meteorology, Northern Territory Regional Office, PO Box 40050, Casuarina, NT 0811, Australia (URL: http://www.bom.gov.au/info/vaac/); NASA Global Sulfur Dioxide Monitoring Page, Atmospheric Chemistry and Dynamics Laboratory, NASA Goddard Space Flight Center (NASA/GSFC), 8800 Greenbelt Road, Goddard, Maryland, USA (URL: https://so2.gsfc.nasa.gov/); Sentinel Hub Playground (URL: https://www.sentinel-hub.com/explore/sentinel-playground).
Sabancaya
Peru
15.787°S, 71.857°W; summit elev. 5960 m
All times are local (unless otherwise noted)
Explosions, gas-and-ash plumes, and thermal activity persist during November 2022-April 2023
Sabancaya is located in Peru, NE of Ampato and SE of Hualca Hualca. Eruptions date back to 1750 and have been characterized by explosions, phreatic activity, ash plumes, and ashfall. The current eruption period began in November 2016 and has more recently consisted of daily explosions, gas-and-ash plumes, and thermal activity (BGVN 47:11). This report updates activity during November 2022 through April 2023 using information from Instituto Geophysico del Peru (IGP) that use weekly activity reports and various satellite data.
Intermittent low-to-moderate power thermal anomalies were reported by the MIROVA project during November 2022 through April 2023 (figure 119). There were few short gaps in thermal activity during mid-December 2022, late December-to-early January 2023, late January to mid-February, and late February. According to data recorded by the MODVOLC thermal algorithm, there were a total of eight thermal hotspots: three in November 2022, three in February 2023, one in March, and one in April. On clear weather days, some of this thermal anomaly was visible in infrared satellite imagery showing the active lava dome in the summit crater (figure 120). Almost daily moderate-to-strong sulfur dioxide plumes were recorded during the reporting period by the TROPOMI instrument on the Sentinel-5P satellite (figure 121). Many of these plumes exceeded 2 Dobson Units (DU) and drifted in multiple directions.
IGP reported that moderate activity during November and December 2022 continued; during November, an average number of explosions were reported each week: 30, 33, 36, and 35, and during December, it was 32, 40, 47, 52, and 67. Gas-and-ash plumes in November rose 3-3.5 km above the summit and drifted E, NE, SE, S, N, W, and SW. During December the gas-and-ash plumes rose 2-4 km above the summit and drifted in different directions. There were 1,259 volcanic earthquakes recorded during November and 1,693 during December. Seismicity also included volcano-tectonic-type events that indicate rock fracturing events. Slight inflation was observed in the N part of the volcano near Hualca Hualca (4 km N). Thermal activity was frequently reported in the crater at the active lava dome (figure 120).
Explosive activity continued during January and February 2023. The average number of explosions were reported each week during January (51, 50, 60, and 59) and February (43, 54, 51, and 50). Gas-and-ash plumes rose 1.6-2.9 km above the summit and drifted NW, SW, and W during January and rose 1.4-2.8 above the summit and drifted W, SW, E, SE, N, S, NW, and NE during February. IGP also detected 1,881 volcanic earthquakes during January and 1,661 during February. VT-type earthquakes were also reported. Minor inflation persisted near Hualca Hualca. Satellite imagery showed continuous thermal activity in the crater at the lava dome (figure 120).
During March, the average number of explosions each week was 46, 48, 31, 35, and 22 and during April, it was 29, 41, 31, and 27. Accompanying gas-and-ash plumes rose 1.7-2.6 km above the summit crater and drifted W, SW, NW, S, and SE during March. According to a Buenos Aires Volcano Ash Advisory Center (VAAC) notice, on 22 March at 1800 through 23 March an ash plume rose to 7 km altitude and drifted NW. By 0430 an ash plume rose to 7.6 km altitude and drifted W. On 24 and 26 March continuous ash emissions rose to 7.3 km altitude and drifted SW and on 28 March ash emissions rose to 7.6 km altitude. During April, gas-and-ash plumes rose 1.6-2.5 km above the summit and drifted W, SW, S, NW, NE, and E. Frequent volcanic earthquakes were recorded, with 1,828 in March and 1,077 in April, in addition to VT-type events. Thermal activity continued to be reported in the summit crater at the lava dome (figure 120).
Geologic Background. Sabancaya, located in the saddle NE of Ampato and SE of Hualca Hualca volcanoes, is the youngest of these volcanic centers and the only one to have erupted in historical time. The oldest of the three, Nevado Hualca Hualca, is of probable late-Pliocene to early Pleistocene age. The name Sabancaya (meaning "tongue of fire" in the Quechua language) first appeared in records in 1595 CE, suggesting activity prior to that date. Holocene activity has consisted of Plinian eruptions followed by emission of voluminous andesitic and dacitic lava flows, which form an extensive apron around the volcano on all sides but the south. Records of historical eruptions date back to 1750.
Information Contacts: Instituto Geofisico del Peru (IGP), Centro Vulcanológico Nacional (CENVUL), Calle Badajoz N° 169 Urb. Mayorazgo IV Etapa, Ate, Lima 15012, Perú (URL: https://www.igp.gob.pe/servicios/centro-vulcanologico-nacional/inicio); Buenos Aires Volcanic Ash Advisory Center (VAAC), Servicio Meteorológico Nacional-Fuerza Aérea Argentina, 25 de mayo 658, Buenos Aires, Argentina (URL: http://www.smn.gov.ar/vaac/buenosaires/inicio.php); MIROVA (Middle InfraRed Observation of Volcanic Activity), a collaborative project between the Universities of Turin and Florence (Italy) supported by the Centre for Volcanic Risk of the Italian Civil Protection Department (URL: http://www.mirovaweb.it/); Hawai'i Institute of Geophysics and Planetology (HIGP) - MODVOLC Thermal Alerts System, School of Ocean and Earth Science and Technology (SOEST), Univ. of Hawai'i, 2525 Correa Road, Honolulu, HI 96822, USA (URL: http://modis.higp.hawaii.edu/); NASA Global Sulfur Dioxide Monitoring Page, Atmospheric Chemistry and Dynamics Laboratory, NASA Goddard Space Flight Center (NASA/GSFC), 8800 Greenbelt Road, Goddard MD 20771, USA (URL: https://so2.gsfc.nasa.gov/); Copernicus Browser, Copernicus Data Space Ecosystem, European Space Agency (URL: https://dataspace.copernicus.eu/browser/).
Sheveluch
Russia
56.653°N, 161.36°E; summit elev. 3283 m
All times are local (unless otherwise noted)
Significant explosions destroyed part of the lava-dome complex during April 2023
Sheveluch (also spelled Shiveluch) in Kamchatka, has had at least 60 large eruptions during the last 10,000 years. The summit is truncated by a broad 9-km-wide caldera that is breached to the S, and many lava domes occur on the outer flanks. The lava dome complex was constructed within the large open caldera. Frequent collapses of the dome complex have produced debris avalanches; the resulting deposits cover much of the caldera floor. A major south-flank collapse during a 1964 Plinian explosion produced a scarp in which a “Young Sheveluch” dome began to form in 1980. Repeated episodes of dome formation and destruction since then have produced major and minor ash plumes, pyroclastic flows, block-and-ash flows, and “whaleback domes” of spine-like extrusions in 1993 and 2020 (BGVN 45:11). The current eruption period began in August 1999 and has more recently consisted of lava dome growth, explosions, ash plumes, and avalanches (BGVN 48:01). This report covers a significant explosive eruption during early-to-mid-April 2023 that generated a 20 km altitude ash plume, produced a strong sulfur dioxide plume, and destroyed part of the lava-dome complex; activity described during January through April 2023 use information primarily from the Kamchatka Volcanic Eruptions Response Team (KVERT) and various satellite data.
Satellite data. Activity during the majority of this reporting period was characterized by continued lava dome growth, strong fumarole activity, explosions, and hot avalanches. According to the MODVOLC Thermal Alerts System, 140 hotspots were detected through the reporting period, with 33 recorded in January 2023, 29 in February, 44 in March, and 34 in April. Frequent strong thermal activity was recorded during January 2023 through April, according to the MIROVA (Middle InfraRed Observation of Volcanic Activity) graph and resulted from the continuously growing lava dome (figure 94). A slightly stronger pulse in thermal activity was detected in early-to-mid-April, which represented the significant eruption that destroyed part of the lava-dome complex. Thermal anomalies were also visible in infrared satellite imagery at the summit crater (figure 95).
During January 2023 KVERT reported continued growth of the lava dome, accompanied by strong fumarolic activity, incandescence from the lava dome, explosions, ash plumes, and avalanches. Satellite data showed a daily thermal anomaly over the volcano. Video data showed ash plumes associated with collapses at the dome that generated avalanches that in turn produced ash plumes rising to 3.5 km altitude and drifting 40 km W on 4 January and rising to 7-7.5 km altitude and drifting 15 km SW on 5 January. A gas-and-steam plume containing some ash that was associated with avalanches rose to 5-6 km altitude and extended 52-92 km W on 7 January. Explosions that same day produced ash plumes that rose to 7-7.5 km altitude and drifted 10 km W. According to a Volcano Observatory Notice for Aviation (VONA) issued at 1344 on 19 January, explosions produced an ash cloud that was 15 x 25 km in size and rose to 9.6-10 km altitude, drifting 21-25 km W; as a result, the Aviation Color Code (ACC) was raised to Red (the highest level on a four-color scale). Another VONA issued at 1635 reported that no more ash plumes were observed, and the ACC was lowered to Orange (the second highest level on a four-color scale). On 22 January an ash plume from collapses and avalanches rose to 5 km altitude and drifted 25 km NE and SW; ash plumes associated with collapses extended 70 km NE on 27 and 31 January.
Lava dome growth, fumarolic activity, dome incandescence, and occasional explosions and avalanches continued during February and March. A daily thermal anomaly was visible in satellite data. Explosions on 1 February generated ash plumes that rose to 6.3-6.5 km altitude and extended 15 km NE. Video data showed an ash cloud from avalanches rising to 5.5 km altitude and drifting 5 km SE on 2 February. Satellite data showed gas-and-steam plumes containing some ash rose to 5-5.5 km altitude and drifted 68-110 km ENE and NE on 6 February, to 4.5-5 km altitude and drifted 35 km WNW on 22 February, and to 3.7-4 km altitude and drifted 47 km NE on 28 February. Scientists from the Kamchatka Volcanological Station (KVS) went on a field excursion on 25 February to document the growing lava dome, and although it was cloudy most of the day, nighttime incandescence was visible. Satellite data showed an ash plume extending up to 118 km E during 4-5 March. Video data from 1150 showed an ash cloud from avalanches rose to 3.7-5.5 km altitude and drifted 5-10 km ENE and E on 5 March. On 11 March an ash plume drifted 62 km E. On 27 March ash plumes rose to 3.5 km altitude and drifted 100 km E. Avalanches and constant incandescence at the lava dome was focused on the E and NE slopes on 28 March. A gas-and-steam plume containing some ash rose to 3.5 km altitude and moved 40 km E on 29 March. Ash plumes on 30 March rose to 3.5-3.7 km altitude and drifted 70 km NE.
Similar activity continued during April, with lava dome growth, strong fumarolic activity, incandescence in the dome, occasional explosions, and avalanches. A thermal anomaly persisted throughout the month. During 1-4 April weak ash plumes rose to 2.5-3 km altitude and extended 13-65 km SE and E.
Activity during 11 April 2023. The Institute of Volcanology and Seismology, Far Eastern Branch, Russian Academy of Sciences (IVS FEB RAS) reported a significant increase in seismicity around 0054 on 11 April, as reported by strong explosions detected on 11 April beginning at 0110 that sent ash plumes up to 7-10 km altitude and extended 100-435 km W, WNW, NNW, WSW, and SW. According to a Tokyo VAAC report the ash plume rose to 15.8 km altitude. By 0158 the plume extended over a 75 x 100 km area. According to an IVS FEB RAS report, the eruptive column was not vertical: the initial plume at 0120 on 11 April deviated to the NNE, at 0000 on 12 April, it drifted NW, and by 1900 it drifted SW. KVS reported that significant pulses of activity occurred at around 0200, 0320, and then a stronger phase around 0600. Levin Dmitry took a video from near Békés (3 km away) at around 0600 showing a rising plume; he also reported that a pyroclastic flow traveled across the road behind him as he left the area. According to IVS FEB RAS, the pyroclastic flow traveled several kilometers SSE, stopping a few hundred meters from a bridge on the road between Klyuchi and Petropavlovsk-Kamchatsky.
Ashfall was first observed in Klyuchi (45 km SW) at 0630, and a large, black ash plume blocked light by 0700. At 0729 KVERT issued a Volcano Observatory Notice for Aviation (VONA) raising the Aviation Color Code to Red (the highest level on a four-color scale). It also stated that a large ash plume had risen to 10 km altitude and drifted 100 km W. Near-constant lightning strikes were reported in the plume and sounds like thunderclaps were heard until about 1000. According to IVS FEB RAS the cloud was 200 km long and 76 km wide by 0830, and was spreading W at altitudes of 6-12 km. In the Klyuchi Village, the layer of both ash and snow reached 8.5 cm (figure 96); ashfall was also reported in Kozyrevsk (112 km SW) at 0930, Mayskoye, Anavgay, Atlasovo, Lazo, and Esso. Residents in Klyuchi reported continued darkness and ashfall at 1100. In some areas, ashfall was 6 cm deep and some residents reported dirty water coming from their plumbing. According to IVS FEB RAS, an ash cloud at 1150 rose to 5-20 km altitude and was 400 km long and 250 km wide, extending W. A VONA issued at 1155 reported that ash had risen to 10 km and drifted 340 km NNW and 240 km WSW. According to Simon Carn (Michigan Technological University), about 0.2 Tg of sulfur dioxide in the plume was measured in a satellite image from the TROPOMI instrument on the Sentinel-5P satellite acquired at 1343 that covered an area of about 189,000 km2 (figure 97). Satellite data at 1748 showed an ash plume that rose to 8 km altitude and drifted 430 km WSW and S, according to a VONA.
Activity during 12-15 April 2023. On 12 April at 0730 satellite images showed ash plumes rose to 7-8 km altitude and extended 600 km SW, 1,050 km ESE, and 1,300-3,000 km E. By 1710 that day, the explosions weakened. According to news sources, the ash-and-gas plumes drifted E toward the Aleutian Islands and reached the Gulf of Alaska by 13 April, causing flight disruptions. More than 100 flights involving Alaska airspace were cancelled due to the plume. Satellite data showed ash plumes rising to 4-5.5 km altitude and drifted 400-415 km SE and ESE on 13 April. KVS volcanologists observed the pyroclastic flow deposits and noted that steam rose from downed, smoldering trees. They also noted that the deposits were thin with very few large fragments, which differed from previous flows. The ash clouds traveled across the Pacific Ocean. Flight cancellations were also reported in NW Canada (British Columbia) during 13-14 April. During 14-15 April ash plumes rose to 6 km altitude and drifted 700 km NW.
Alaskan flight schedules were mostly back to normal by 15 April, with only minor delays and far less cancellations; a few cancellations continued to be reported in Canada. Clear weather on 15 April showed that most of the previous lava-dome complex was gone and a new crater roughly 1 km in diameter was observed (figure 98); gas-and-steam emissions were rising from this crater. Evidence suggested that there had been a directed blast to the SE, and pyroclastic flows traveled more than 20 km. An ash plume rose to 4.5-5.2 km altitude and drifted 93-870 km NW on 15 April.
Activity during 16-30 April 2023. Resuspended ash was lifted by the wind from the slopes and rose to 4 km altitude and drifted 224 km NW on 17 April. KVERT reported a plume of resuspended ash from the activity during 10-13 April on 19 April that rose to 3.5-4 km altitude and drifted 146-204 km WNW. During 21-22 April a plume stretched over the Scandinavian Peninsula. A gas-and-steam plume containing some ash rose to 3-3.5 km altitude and drifted 60 km SE on 30 April. A possible new lava dome was visible on the W slope of the volcano on 29-30 April (figure 99); satellite data showed two thermal anomalies, a bright one over the existing lava dome and a weaker one over the possible new one.
References. Girina, O., Loupian, E., Horvath, A., Melnikov, D., Manevich, A., Nuzhdaev, A., Bril, A., Ozerov, A., Kramareva, L., Sorokin, A., 2023, Analysis of the development of the paroxysmal eruption of Sheveluch volcano on April 10–13, 2023, based on data from various satellite systems, ??????????? ???????? ??? ?? ???????, 20(2).
Geologic Background. The high, isolated massif of Sheveluch volcano (also spelled Shiveluch) rises above the lowlands NNE of the Kliuchevskaya volcano group. The 1,300 km3 andesitic volcano is one of Kamchatka's largest and most active volcanic structures, with at least 60 large eruptions during the Holocene. The summit of roughly 65,000-year-old Stary Shiveluch is truncated by a broad 9-km-wide late-Pleistocene caldera breached to the south. Many lava domes occur on its outer flanks. The Molodoy Shiveluch lava dome complex was constructed during the Holocene within the large open caldera; Holocene lava dome extrusion also took place on the flanks of Stary Shiveluch. Widespread tephra layers from these eruptions have provided valuable time markers for dating volcanic events in Kamchatka. Frequent collapses of dome complexes, most recently in 1964, have produced debris avalanches whose deposits cover much of the floor of the breached caldera.
Information Contacts: Kamchatka Volcanic Eruptions Response Team (KVERT), Far Eastern Branch, Russian Academy of Sciences, 9 Piip Blvd., Petropavlovsk-Kamchatsky, 683006, Russia (URL: http://www.kscnet.ru/ivs/kvert/); Institute of Volcanology and Seismology, Far Eastern Branch, Russian Academy of Sciences (IVS FEB RAS), 9 Piip Blvd., Petropavlovsk-Kamchatsky 683006, Russia (URL: http://www.kscnet.ru/ivs/eng/); Kamchatka Volcanological Station, Kamchatka Branch of Geophysical Survey, (KB GS RAS), Klyuchi, Kamchatka Krai, Russia (URL: http://volkstat.ru/); Hawai'i Institute of Geophysics and Planetology (HIGP) - MODVOLC Thermal Alerts System, School of Ocean and Earth Science and Technology (SOEST), Univ. of Hawai'i, 2525 Correa Road, Honolulu, HI 96822, USA (URL: http://modis.higp.hawaii.edu/); MIROVA (Middle InfraRed Observation of Volcanic Activity), a collaborative project between the Universities of Turin and Florence (Italy) supported by the Centre for Volcanic Risk of the Italian Civil Protection Department (URL: http://www.mirovaweb.it/); Copernicus Browser, Copernicus Data Space Ecosystem, European Space Agency (URL: https://dataspace.copernicus.eu/browser/); Kam 24 News Agency, 683032, Kamchatka Territory, Petropavlovsk-Kamchatsky, Vysotnaya St., 2A (URL: https://kam24.ru/news/main/20230411/96657.html#.Cj5Jrky6.dpuf); Simon Carn, Geological and Mining Engineering and Sciences, Michigan Technological University, 1400 Townsend Drive, Houghton, MI 49931, USA (URL: http://www.volcarno.com/, Twitter: @simoncarn).
Bezymianny
Russia
55.972°N, 160.595°E; summit elev. 2882 m
All times are local (unless otherwise noted)
Explosions, ash plumes, lava flows, and avalanches during November 2022-April 2023
Bezymianny is located on the Kamchatka Peninsula of Russia as part of the Klyuchevskoy volcano group. Historic eruptions began in 1955 and have been characterized by dome growth, explosions, pyroclastic flows, ash plumes, and ashfall. During the 1955-56 eruption a large open crater was formed by collapse of the summit and an associated lateral blast. Subsequent episodic but ongoing lava-dome growth, accompanied by intermittent explosive activity and pyroclastic flows, has largely filled the 1956 crater. The current eruption period began in December 2016 and more recent activity has consisted of strong explosions, ash plumes, and thermal activity (BGVN 47:11). This report covers activity during November 2022 through April 2023, based on weekly and daily reports from the Kamchatka Volcano Eruptions Response Team (KVERT) and satellite data.
Activity during November and March 2023 was relatively low and mostly consisted of gas-and-steam emissions, occasional small collapses that generated avalanches along the lava dome slopes, and a persistent thermal anomaly over the volcano that was observed in satellite data on clear weather days. According to the Tokyo VAAC and KVERT, an explosion produced an ash plume that rose to 6 km altitude and drifted 25 km NE at 1825 on 29 March.
Gas-and-steam emissions, collapses generating avalanches, and thermal activity continued during April. According to two Volcano Observatory Notice for Aviation (VONA) issued on 2 and 6 April (local time) ash plumes rose to 3 km and 3.5-3.8 km altitude and drifted 35 km E and 140 km E, respectively. Satellite data from KVERT showed weak ash plumes extending up to 550 km E on 2 and 5-6 April.
A VONA issued at 0843 on 7 April described an ash plume that rose to 4.5-5 km altitude and drifted 250 km ESE. Later that day at 1326 satellite data showed an ash plume that rose to 5.5-6 km altitude and drifted 150 km ESE. A satellite image from 1600 showed an ash plume extending as far as 230 km ESE; KVERT noted that ash emissions were intensifying, likely due to avalanches from the growing lava dome. The Aviation Color Code (ACC) was raised to Red (the highest level on a four-color scale). At 1520 satellite data showed an ash plume rising to 5-5.5 km altitude and drifting 230 km ESE. That same day, Kamchatka Volcanological Station (KVS) volcanologists traveled to Ambon to collect ash; they reported that a notable eruption began at 1730, and within 20 minutes a large ash plume rose to 10 km altitude and drifted NW. KVERT reported that the strong explosive phase began at 1738. Video and satellite data taken at 1738 showed an ash plume that rose to 10-12 km altitude and drifted up to 2,800 km SE and E. Explosions were clearly audible 20 km away for 90 minutes, according to KVS. Significant amounts of ash fell at the Apakhonchich station, which turned the snow gray; ash continued to fall until the morning of 8 April. In a VONA issued at 0906 on 8 April, KVERT stated that the explosive eruption had ended; ash plumes had drifted 2,000 km E. The ACC was lowered to Orange (the third highest level on a four-color scale). The KVS team saw a lava flow on the active dome once the conditions were clear that same day (figure 53). On 20 April lava dome extrusion was reported; lava flows were noted on the flanks of the dome, and according to KVERT satellite data, a thermal anomaly was observed in the area. The ACC was lowered to Yellow (the second lowest on a four-color scale).
Satellite data showed an increase in thermal activity beginning in early April 2023. A total of 31 thermal hotspots were detected by the MODVOLC thermal algorithm on 4, 5, 7, and 12 April 2023. The elevated thermal activity resulted from an increase in explosive activity and the start of an active lava flow. The MIROVA (Middle InfraRed Observation of Volcanic Activity) volcano hotspot detection system based on the analysis of MODIS data also showed a pulse in thermal activity during the same time (figure 54). Infrared satellite imagery captured a continuous thermal anomaly at the summit crater, often accompanied by white gas-and-steam emissions (figure 55). On 4 April 2023 an active lava flow was observed descending the SE flank.
Geologic Background. The modern Bezymianny, much smaller than its massive neighbors Kamen and Kliuchevskoi on the Kamchatka Peninsula, was formed about 4,700 years ago over a late-Pleistocene lava-dome complex and an edifice built about 11,000-7,000 years ago. Three periods of intensified activity have occurred during the past 3,000 years. The latest period, which was preceded by a 1,000-year quiescence, began with the dramatic 1955-56 eruption. This eruption, similar to that of St. Helens in 1980, produced a large open crater that was formed by collapse of the summit and an associated lateral blast. Subsequent episodic but ongoing lava-dome growth, accompanied by intermittent explosive activity and pyroclastic flows, has largely filled the 1956 crater.
Information Contacts: Kamchatka Volcanic Eruptions Response Team (KVERT), Far Eastern Branch, Russian Academy of Sciences, 9 Piip Blvd., Petropavlovsk-Kamchatsky, 683006, Russia (URL: http://www.kscnet.ru/ivs/kvert/); Kamchatka Volcanological Station, Kamchatka Branch of Geophysical Survey, (KB GS RAS), Klyuchi, Kamchatka Krai, Russia (URL: http://volkstat.ru/); Hawai'i Institute of Geophysics and Planetology (HIGP) - MODVOLC Thermal Alerts System, School of Ocean and Earth Science and Technology (SOEST), Univ. of Hawai'i, 2525 Correa Road, Honolulu, HI 96822, USA (URL: http://modis.higp.hawaii.edu/); MIROVA (Middle InfraRed Observation of Volcanic Activity), a collaborative project between the Universities of Turin and Florence (Italy) supported by the Centre for Volcanic Risk of the Italian Civil Protection Department (URL: http://www.mirovaweb.it/); Copernicus Browser, Copernicus Data Space Ecosystem, European Space Agency (URL: https://dataspace.copernicus.eu/browser/).
Chikurachki
Russia
50.324°N, 155.461°E; summit elev. 1781 m
All times are local (unless otherwise noted)
New explosive eruption during late January-early February 2023
Chikurachki, located on Paramushir Island in the northern Kuriles, has had Plinian eruptions during the Holocene. Lava flows have reached the sea and formed capes on the NW coast; several young lava flows are also present on the E flank beneath a scoria deposit. Reported eruptions date back to 1690, with the most recent eruption period occurring during January through October 2022, characterized by occasional explosions, ash plumes, and thermal activity (BGVN 47:11). This report covers a new eruptive period during January through February 2023 that consisted of ash explosions and ash plumes, based on information from the Kamchatka Volcanic Eruptions Response Team (KVERT) and satellite data.
According to reports from KVERT, an explosive eruption began around 0630 on 29 January. Explosions generated ash plumes that rose to 3-3.5 km altitude and drifted 6-75 km SE and E, based on satellite data. As a result, the Aviation Color Code (ACC) was raised to Orange (the second highest level on a four-color scale). At 1406 and 1720 ash plumes were identified in satellite images that rose to 4.3 km altitude and extended 70 km E. By 2320 the ash plume had dissipated. A thermal anomaly was visible at the volcano on 31 January, according to a satellite image, and an ash plume was observed drifting 66 km NE.
Occasional explosions and ash plumes continued during early February. At 0850 on 1 February an ash plume rose to 3.5 km altitude and drifted 35 km NE. Satellite data showed an ash plume that rose to 3.2-3.5 km altitude and drifted 50 km NE at 1222 later that day (figure 22). A thermal anomaly was detected over the volcano during 5-6 February and ash plumes drifted as far as 125 km SE, E, and NE. Explosive events were reported at 0330 on 6 February that produced ash plumes rising to 4-4.5 km altitude and drifting 72-90 km N, NE, and ENE. KVERT noted that the last gas-and steam plume that contained some ash was observed on 8 February and drifted 55 km NE before the explosive eruption ended. The ACC was lowered to Yellow and then Green (the lowest level on a four-color scale) on 18 February.
Geologic Background. Chikurachki, the highest volcano on Paramushir Island in the northern Kuriles, is a relatively small cone constructed on a high Pleistocene edifice. Oxidized basaltic-to-andesitic scoria deposits covering the upper part of the young cone give it a distinctive red color. Frequent basaltic Plinian eruptions have occurred during the Holocene. Lava flows have reached the sea and formed capes on the NW coast; several young lava flows are also present on the E flank beneath a scoria deposit. The Tatarinov group of six volcanic centers is located immediately to the south, and the Lomonosov cinder cone group, the source of an early Holocene lava flow that reached the saddle between it and Fuss Peak to the west, lies at the southern end of the N-S-trending Chikurachki-Tatarinov complex. In contrast to the frequently active Chikurachki, the Tatarinov centers are extensively modified by erosion and have a more complex structure. Tephrochronology gives evidence of an eruption around 1690 CE from Tatarinov, although its southern cone contains a sulfur-encrusted crater with fumaroles that were active along the margin of a crater lake until 1959.
Information Contacts: Kamchatka Volcanic Eruptions Response Team (KVERT), Far East Division, Russian Academy of Sciences, 9 Piip Blvd., Petropavlovsk-Kamchatsky, 683006, Russia (URL: http://www.kscnet.ru/ivs/); Copernicus Browser, Copernicus Data Space Ecosystem, European Space Agency (URL: https://dataspace.copernicus.eu/browser/).
Search Bulletin Archive by Publication Date
Select a month and year from the drop-downs and click "Show Issue" to have that issue displayed in this tab.
The default month and year is the latest issue available.
Bulletin of the Global Volcanism Network - Volume 20, Number 08 (August 1995)
Managing Editor: Richard Wunderman
Aira (Japan)
Explosive activity 23-25 August, dense ash cloud closes a highway
Akan (Japan)
Increased seismicity
Ambae (Vanuatu)
Crater lake exhibits convection cells and steaming as level drops
Arenal (Costa Rica)
Ongoing eruptions; high earthquake and tremor counts
Asosan (Japan)
Continued mud and water ejections; increasing tremor episodes
Bagana (Papua New Guinea)
Vapor emissions produce SO2-rich plume 15-20 km long
Balbi (Papua New Guinea)
Profuse steaming from the summit amphitheater
Etna (Italy)
Magmatic activity resumes in Bocca Nuova and Northeast craters
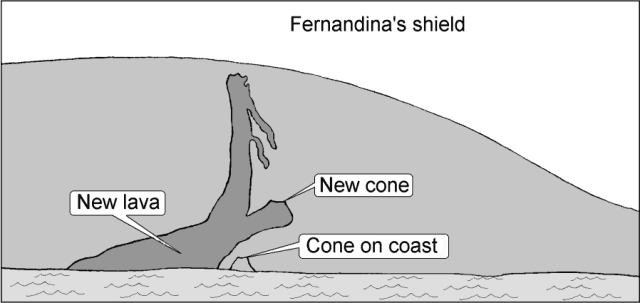
Fernandina (Ecuador)
Now-cooling lava and the eruption's impact on plants and animals
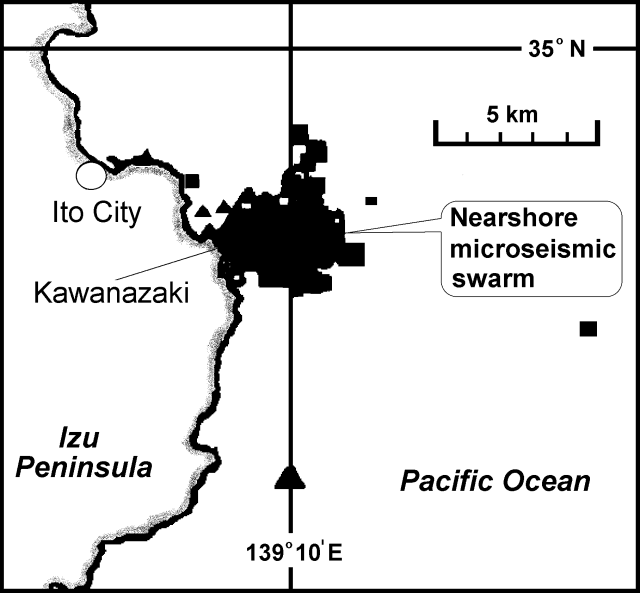
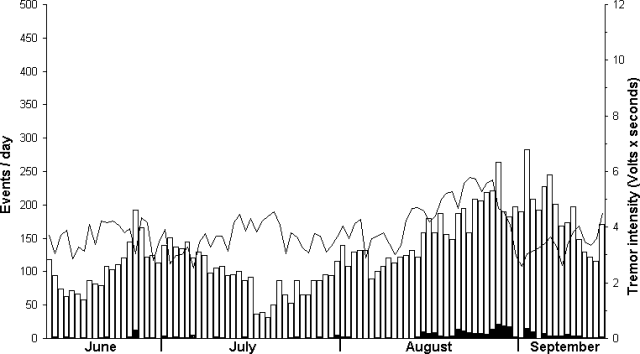
Izu-Tobu (Japan)
Earthquake swarm offshore SE of Ito City
Kanaga (United States)
Minor steaming from the summit area
Kirishimayama (Japan)
Seismicity increased in late August
Langila (Papua New Guinea)
Intermittent Vulcanian explosions and weaker ash-and-vapor emissions
Loloru (Papua New Guinea)
Weak to moderate steaming, but sublimate deposits in possible decline
Manam (Papua New Guinea)
Low to moderate degassing; no deformation
Mayon (Philippines)
Crater glow and steam emissions
Moyorodake [Medvezhia] (Japan - administered by Russia)
Measurements of SO2 in Kudriavy plume
Ontakesan (Japan)
Small tremors in late August
Poas (Costa Rica)
Elevated seismicity and continued fumarolic activity within the N crater
Rabaul (Papua New Guinea)
Intracaldera cones quiet, but nearby earthquake triggers local seismicity
Soufriere Hills (United Kingdom)
Two additional vents open in late August; steam-and-ash emissions
Stromboli (Italy)
Seismicity generally low from mid-June to mid-September
Tokachidake (Japan)
Tremor event and increased seismicity
Veniaminof (United States)
Small steam plumes and hot spots on satellite images
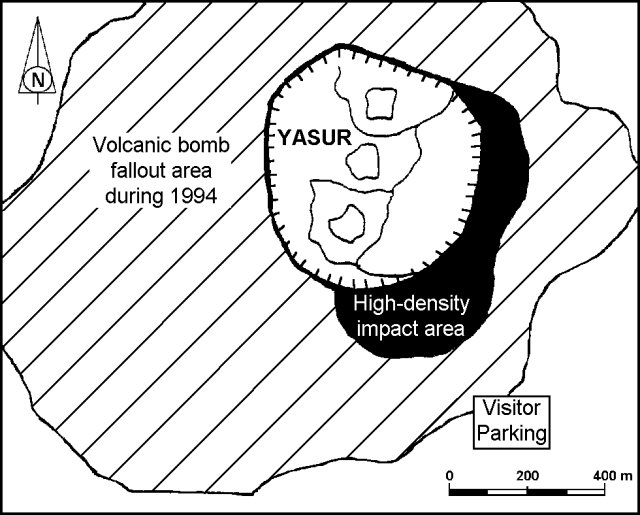
Yasur (Vanuatu)
Frequent bomb ejections continue; increased activity during 1994
Aira
Japan
31.5772°N, 130.6589°E; summit elev. 1117 m
All times are local (unless otherwise noted)
Explosive activity 23-25 August, dense ash cloud closes a highway
During 1995, the geophysical system described below registered Sakura-jima's 126th explosion on 23 August. During 23-25 August, 28 explosions were recorded. The total through August of 153 explosions is relatively small compared to 1960, 1974, 1983, and 1985, years when over 400 explosions took place. During August no measurable ash fell at Kagoshima Local Meteorological Observatory, 10 km W of the crater. On the other hand, ash-bearing explosions were of sufficient size to send a dense ash cloud NW of the volcano that dropped ash in N Kyushu and closed a highway for an unspecified duration. The highest plume of the month vented on 30 August and rose to 3 km above the crater rim. Station B (2.3 km NE of Minami-dake crater) registered 671 earthquakes and 378 tremor events.
Geophysical determination of explosions. The monthly tally of "explosions" (sometimes also called "explosive eruptions") at Sakura-jima has a geophysical definition, with its origins closely linked to aircraft safety. The volcano sits ~25 km from the busy Kagoshima International Airport and generates frequent Vulcanian explosive eruptions (BGVN 19:11). A video camera monitors the volcano and a real-time image is transmitted to air traffic control. In order to alert aviation dispatchers and pilots of potential hazards regardless of the time of day or the weather, scientists devised a system to rapidly classify the volcano's seismic and acoustic signals (Onodera and Kamo, 1994). This geophysical system has been linked to the Japan Airlines office at Kagoshima Airport since March 1991.
When the amplitudes of incoming seismic signals rise above an established threshold (table 12) their dominant frequency is computed. The above-threshold signals also have an associated air-shock wave that is received at an "infrasonic" microphone with a 0.02-100 Hz detection range. For reference, the low-frequency range of the human ear stops at around 16 Hz. Once the infrasonic air-shock wave is received, the system measures its amplitude and computes its spectrum. The combination of seismic and air-shock amplitudes and spectra allow the events to be classified into "non-eruption," "eruption," or "explosion." categories (table 2).
Table 12. (above) Definition of "explosion" at Sakura-jima, a geophysical characterization of explosive, bomb- and ash-bearing eruptions. (below) Recognized volcanic earthquakes at Sakura-jima, showing the maximum values registered for explosion earthquakes and corresponding air-shock waves (after Onodera and Kamo, 1994).
| Criteria for Definition of Explosion at Sakura-jima (~90% accurate when compared to visual observations) |
| 1. Maximum amplitude of explosion earthquake >= 10 microns (0.1 x 10⁻³ cm/sec). |
| 2. Amplitude of infrasonic air shock >= 0.1 mbars at a site 2.7 km NW of summit crater. |
| 3. Spectral analysis of received infrasonic air-shock discriminates between the categories "non-eruption" (> 5 Hz), "eruption" (2- 5 Hz), and "explosion" (<2 Hz). |
| Volcanic earthquake type |
Dominant frequency range |
Comment |
| A-type |
>8 Hz |
Similar to tectonic earthquakes; devoid of infrasonic air-shocks and not accompanied by eruptive activity. |
| B-type |
<5 Hz |
Includes both BL (1-3 Hz, max. amplitudes <7 x 10⁻³ cm/sec, reduced displacement <60 cm2 and <1 mb) and BH (5-8 Hz); the former often affiliated with bomb- and ash-bearing eruptions; the latter not affiliated with eruptive activity. |
| C-type |
-- |
Harmonic wave trains, "volcanic tremor" |
| D'-type |
-- |
Non-harmonic tremor; max. amplitudes <7 x 10⁻³ cm/sec, reduced displacement <60 cm2 and <1 mb; often affiliated with bomb- and ash-bearing eruptions. |
| Explosion |
-- |
Accompanied by strong air-shock waves, and bomb- and ash-bearing. Maximum amplitudes range from 3 x 10⁻³ to 3 x 10⁻² cm/s for the earthquakes (reduced displacements of 50-500 cm2) and 0.1 to 5 mb for the infrasonic air-shock waves. |
Although passing typhoons can trigger inappropriate warnings or false alarms, and small-magnitude eruptions may be missed, the number of explosions correlates well with the measured deposition of fresh volcanic ash. The system has been effective at reducing aviation risks. A future goal is to use "explosion" category to automatically trigger the calculation of volcanic ash diffusion based on meteorological data. This program would thus automatically estimate the likely trajectory of ash discharged from the volcano.
References. Onodera, S., Iguchi, M., and Ishihara, K., 1994, Recent advances in Japan, volcano monitoring system of Japan Airlines at Kagoshima Airport: 9th Annual International Oceanic Airspace Conference, 9 November 1994.
Geologic Background. The Aira caldera in the northern half of Kagoshima Bay contains the post-caldera Sakurajima volcano, one of Japan's most active. Eruption of the voluminous Ito pyroclastic flow accompanied formation of the 17 x 23 km caldera about 22,000 years ago. The smaller Wakamiko caldera was formed during the early Holocene in the NE corner of the caldera, along with several post-caldera cones. The construction of Sakurajima began about 13,000 years ago on the southern rim and built an island that was joined to the Osumi Peninsula during the major explosive and effusive eruption of 1914. Activity at the Kitadake summit cone ended about 4,850 years ago, after which eruptions took place at Minamidake. Frequent eruptions since the 8th century have deposited ash on the city of Kagoshima, located across Kagoshima Bay only 8 km from the summit. The largest recorded eruption took place during 1471-76.
Information Contacts: Volcanological Division, Seismological and Volcanological Department, Japan Meteorological Agency (JMA), 1-3-4 Ote-machi, Chiyoda-ku, Tokyo 100 Japan; Saburo Onodera, Director of Meteorology, Flight Operations, Japan Airlines, 3-3-2 Haneda Airport, Tokyo 144, Japan; Kosuke Kamo, Masato Iguchi, and Kazuhiro Ishihara, Sakurajima Volcano Observatory (SVO), Disaster Prevention Research Institute, Kyoto University, Sakurajima-cho, Kagoshima 89114, Japan.
Akan
Japan
43.384°N, 144.013°E; summit elev. 1499 m
All times are local (unless otherwise noted)
Increased seismicity
Seismicity increased after 15 August. On 18 August, 127 events were recorded 2.3 km from Ponmachineshiri Crater on Me-Akan volcano. The total number of earthquakes in August was 363. High seismicity was previously reported in March-April 1993.
Geologic Background. Akan is a 13 x 24 km caldera located immediately SW of Kussharo caldera. The elongated, irregular outline of the caldera rim reflects its incremental formation during major explosive eruptions from the early to mid-Pleistocene. Growth of four post-caldera stratovolcanoes, three at the SW end of the caldera and the other at the NE side, has restricted the size of the caldera lake. Conical Oakandake was frequently active during the Holocene. The 1-km-wide Nakamachineshiri crater of Meakandake was formed during a major pumice-and-scoria eruption about 13,500 years ago. Within the Akan volcanic complex, only the Meakandake group, east of Lake Akan, has been historically active, producing mild phreatic eruptions since the beginning of the 19th century. Meakandake is composed of nine overlapping cones. The main cone of Meakandake proper has a triple crater at its summit. Historical eruptions at Meakandake have consisted of minor phreatic explosions, but four major magmatic eruptions including pyroclastic flows have occurred during the Holocene.
Information Contacts: Volcanological Division, Seismological and Volcanological Department, Japan Meteorological Agency (JMA), 1-3-4 Ote-machi, Chiyoda-ku, Tokyo 100 Japan.
Ambae
Vanuatu
15.389°S, 167.835°E; summit elev. 1496 m
All times are local (unless otherwise noted)
Crater lake exhibits convection cells and steaming as level drops
A pyroclastic explosion on the morning of 3 March 1995 generated a vapor-and-ash column ~3 km high (BGVN 20:02). Preliminary analysis of the resulting deposit did not reveal any juvenile material. On the morning of 5 March, a vapor plume rose ~500 m. It is possible that vapor plumes were emitted over several days, but were not observed at other times because of the thick clouds that usually hide the summit area. The center of activity on 3 March was between two small islands in Lake Voui (figures 4 and 5). Because of poor weather conditions, ORSTOM scientists were unable to observe the lake at close range until 13 March. Aerial photos taken on 20 March (figure 6) show the thermal contrast between Lake Manaro Lakua, formed by the accumulation of water in a low-lying area of the caldera, and Lake Voui, which fills the active crater. Convection cells, ~300-400 m in diameter, could be discerned within Lake Voui.
A drop in the level of Lake Voui that began on 6 March (BGVN 20:02) was visible in photographs taken on 20 March. During another overflight on 6 April, the level of the crater lake had dropped by ~2 m. By the time of a 27 June landing on the NW island in Lake Voui (figure 5), the lake level had dropped ~5 m below the maximum, as determined by recent vegetation. Water temperatures measured around the most accessible parts of the island averaged 38-40°C, with highs of 63-67°C. The strongly acidic (pH 2.3) emerald-green lake was mostly obscured by clouds, but vapor emissions were visible between the island and the NW edge of the crater. A small island seen on 6 April in the N part of the lake had enlarged noticeably because of the drop in water level. The topography of the islands is steep towards the center of the lake and gentle towards crater edge. All of the trees on the island were dead, but other vegetation was beginning to reappear. Some blocks of dried mud (40-50 cm in diameter) ejected during the phreatic explosion at the beginning of March were still visible. Sulfur deposits were noted, and gas bubbles were coming from numerous fissures at the edge of the island.
A bathymetric survey of Lake Voui has never been done, but ORSTOM estimates that it has a volume of 50 million cubic meters. Although activity has declined in recent months, ORSTOM will maintain the current low-level alert status until approximately the end of November.
Geologic Background. The island of Ambae, also known as Aoba, is a massive 2,500 km3 basaltic shield that is the most voluminous volcano of the New Hebrides archipelago. A pronounced NE-SW-trending rift zone with numerous scoria cones gives the 16 x 38 km island an elongated form. A broad pyroclastic cone containing three crater lakes (Manaro Ngoru, Voui, and Manaro Lakua) is located at the summit within the youngest of at least two nested calderas, the largest of which is 6 km in diameter. That large central edifice is also called Manaro Voui or Lombenben volcano. Post-caldera explosive eruptions formed the summit craters about 360 years ago. A tuff cone was constructed within Lake Voui (or Vui) about 60 years later. The latest known flank eruption, about 300 years ago, destroyed the population of the Nduindui area near the western coast.
Information Contacts: M. Lardy, D. Douglas, P. Wiart, and K. Kalkaua, Centre ORSTOM, Port Vila, Vanuatu, and Bureau des Desastres Nationaux, P.M.B. 014, Port Vila, Vanuatu; M. Regnier and S. Temakon, ORSTOM et Departement des Mines et de la Geologie et des Ressources en Eaux, Port Vila, Vanuatu; Chief N. Tahi, Village de Nambangahake (Ndui-Ndui) Aoba, Vanuatu; C. Robin and M. Monzier, Centre ORSTOM, Quito, EcuadorJ-P.Eissen, Centre ORSTOM de Brest, France; J-P. Metaxian, Universite de Savoie.
Arenal (Costa Rica) — August 1995 Cite this Report
Arenal
Costa Rica
10.463°N, 84.703°W; summit elev. 1670 m
All times are local (unless otherwise noted)
Ongoing eruptions; high earthquake and tremor counts
In August, Crater C continued its regular emission of gases, lava, and sporadic Strombolian eruptions; in addition, there were occasional lava avalanches. Lava that began to be emitted in May 1995 followed a course toward the SW and flowed down as far as 720 m elevation. Lava emitted a month earlier branched into two arms at ~1,300 m elevation. Explosions sent columns to 1 km above the active vent. These columns were typically blown to the NW, W, and SW; however, some minor local ashfalls also took place on the N and NE as well.
During August, OVSICORI-UNA reported comparative highs in both the number of seismic events (925) and the duration of tremor (348 hours). No seismic data are currently available for July 1995. Comparing the available record starting in January 1994, greater numbers of seismic events took place only in February and March 1994 (956 and 1,011 events) and in June 1995 (1,027 events). For the same interval, tremor prevailed longer only in May and June 1995 (419 and 402 hours, respectively).
A May explosion of >1.2 minutes duration and a plot of the available 1994-95 seismic record were both discussed in BGVN 20:04. The volcano's first chronicled eruption occurred in 1968 and many basaltic andesite discharges have followed since then.
Geologic Background. Conical Volcán Arenal is the youngest stratovolcano in Costa Rica and one of its most active. The 1670-m-high andesitic volcano towers above the eastern shores of Lake Arenal, which has been enlarged by a hydroelectric project. Arenal lies along a volcanic chain that has migrated to the NW from the late-Pleistocene Los Perdidos lava domes through the Pleistocene-to-Holocene Chato volcano, which contains a 500-m-wide, lake-filled summit crater. The earliest known eruptions of Arenal took place about 7000 years ago, and it was active concurrently with Cerro Chato until the activity of Chato ended about 3500 years ago. Growth of Arenal has been characterized by periodic major explosive eruptions at several-hundred-year intervals and periods of lava effusion that armor the cone. An eruptive period that began with a major explosive eruption in 1968 ended in December 2010; continuous explosive activity accompanied by slow lava effusion and the occasional emission of pyroclastic flows characterized the eruption from vents at the summit and on the upper western flank.
Information Contacts: E. Fernandez, E. Duarte, R. Saenz, W. Jimenez, and V. Barboza, Observatorio Vulcanologico y Sismologico de Costa Rica, Universidad Nacional (OVSICORI-UNA), Apartado 86-3000, Heredia, Costa Rica.
Asosan
Japan
32.8849°N, 131.085°E; summit elev. 1592 m
All times are local (unless otherwise noted)
Continued mud and water ejections; increasing tremor episodes
The bottom of Naka-dake Crater 1 remained covered with a pool of hot water throughout August. The central part of the lake was gray, changing to grayish white or green near the margins. Mud and water ejections were frequently observed; the highest rose 10 m. Isolated tremors increased late in the month (recorded 800 m W of the crater). Isolated tremor events totalled 2,613 during August, and five earthquakes were detected. Tremor events continued increasing in early September; by the 10th there had been >2,000 counted.
Geologic Background. The 24-km-wide Asosan caldera was formed during four major explosive eruptions from 300,000 to 90,000 years ago. These produced voluminous pyroclastic flows that covered much of Kyushu. The last of these, the Aso-4 eruption, produced more than 600 km3 of airfall tephra and pyroclastic-flow deposits. A group of 17 central cones was constructed in the middle of the caldera, one of which, Nakadake, is one of Japan's most active volcanoes. It was the location of Japan's first documented historical eruption in 553 CE. The Nakadake complex has remained active throughout the Holocene. Several other cones have been active during the Holocene, including the Kometsuka scoria cone as recently as about 210 CE. Historical eruptions have largely consisted of basaltic to basaltic-andesite ash emission with periodic strombolian and phreatomagmatic activity. The summit crater of Nakadake is accessible by toll road and cable car, and is one of Kyushu's most popular tourist destinations.
Information Contacts: Volcanological Division, Seismological and Volcanological Department, Japan Meteorological Agency (JMA), 1-3-4 Ote-machi, Chiyoda-ku, Tokyo 100 Japan.
Bagana (Papua New Guinea) — August 1995 Cite this Report
Bagana
Papua New Guinea
6.137°S, 155.196°E; summit elev. 1855 m
All times are local (unless otherwise noted)
Vapor emissions produce SO2-rich plume 15-20 km long
Although one of Melanesia's youngest and most active volcanoes, reports on Bagana are infrequent. Bagana sits along Bougainville's axial highlands ~140 km NW of the 16 August, M 7.8 earthquake's epicenter. Following the earthquake, a report from the Buka Passage Administration Office described a change in activity. Specifically, the report mentioned "black thick clouds coming out of the volcano" and stated that "lava had fallen along the SW coastline." The report included a request for RVO to carry out an inspection. As a result, Chris McKee (RVO) flew around the volcano on 22 August.
McKee noted moderate-to-strong vapor emissions forming a 15-20 km long plume. While the plume looked white near Bagana's summit, downwind a prevailing brown color suggested high SO2 concentrations in the emissions. No ash was noted in the plume. The summit, a region occupied by a blocky lava dome, fed the plume from numerous sources. There was no appreciable force in the emissions and the plume rose only slightly above the summit.
A lava flow that has been active for several years was observed on the volcano's SW flank. In late August the flow's front was estimated to have reached 580 m elevation. In overview, conditions at the volcano appeared stable. There was no indication of recent explosive activity.
Although reports documenting activity have been absent since early 1991, reported Bagana eruptions in the interval 1972-87 described activity that included long-term lava effusion and slow dome growth, coupled with moderate explosive activity ending with dome destruction. After destruction there was a return to dome growth and lava flows.
Geologic Background. Bagana volcano, in a remote portion of central Bougainville Island, is frequently active. This massive symmetrical cone was largely constructed by an accumulation of viscous andesitic lava flows. The entire edifice could have been constructed in about 300 years at its present rate of lava production. Eruptive activity is characterized by non-explosive effusion of viscous lava that maintains a small lava dome in the summit crater, although occasional explosive activity produces pyroclastic flows. Lava flows with tongue-shaped lobes up to 50 m thick and prominent levees descend the flanks on all sides.
Information Contacts: Patrice de Saint-Ours and Ben Talai, RVO.
Balbi (Papua New Guinea) — August 1995 Cite this Report
Balbi
Papua New Guinea
5.9156°S, 155.0008°E; summit elev. 2715 m
All times are local (unless otherwise noted)
Profuse steaming from the summit amphitheater
Aerial inspection was carried out on 22 August, after the 16 August, M 7.8 earthquake that struck 100 km to the W. The inspection revealed profuse white vapor coming from large-output fumaroles in the main fumarole field of the stratovolcano's summit amphitheater. In contrast, emissions at Crater B were moderate and from diffused sources.
Recent landslides were noted in two of the summit craters. The more extensive slides were on the W wall of Crater B. These landslides were thought to have been caused by shaking during the 16 August earthquake.
In general, the visible activity at Balbi appeared to be similar to that observed during previous inspections in the late 1980's. However, emissions may have been more voluminous in 1995.
Balbi marks the highest point on Bougainville Island, forming a summit composed of coalesced cones and lava domes and hosting a large solfatera field. Interviews with local inhabitants suggested that Balbi's last eruption took the lives of a number of people in about 1800-1850.
Geologic Background. The complex andesitic Balbi stratovolcano on Bougainville Island includes a large number of coalesced cones and lava domes. Five well-preserved craters occupy a NW-SE-trending ridge north of the summit cone, which also contains a crater. Three large valleys with steep headwalls dissect the flanks. The age of the most recent eruption is not known precisely. An oral tradition of a major eruption during the 19th century is thought to be in error, but could refer to minor eruptive activity. Fumaroles are located within 600-m-wide Crater B and on its W flank.
Information Contacts: Patrice de Saint-Ours and Ben Talai, RVO.
Etna
Italy
37.748°N, 14.999°E; summit elev. 3357 m
All times are local (unless otherwise noted)
Magmatic activity resumes in Bocca Nuova and Northeast craters
Strombolian activity resumed at Bocca Nuova vent on 30 July and in Northeast Crater on 2 August. Etna's last magmatic activity within its summit craters stopped 3 years and 7 months earlier, two days after the beginning of the 1991-93 flank lava flow eruption (BGVN 16:12). During that 15-month-long eruption and the following 28 months, the four summit craters exhibited continuous steam emission with frequent non-juvenile ash puffs, several collapses, and some strong phreatic explosions from Northeast Crater and Bocca Nuova. No morphological changes were observed in August at either Voragine or Southeast craters, where gas and steam emissions continued as in previous months.
On 30 July the first red spatters were observed inside Bocca Nuova, but bad weather prevented an evaluation of the intensity of this new magmatic activity. Observations the next day revealed that the vent was located in a new pit crater (20-30 m wide and ~50 m deep) on the N part of the crater floor. That part of the crater floor collapsed in June 1994, and probably dropped again in June 1995 when some phreatic explosions occurred (BGVN 20:06). The vent was a few meters across, and magma was sometimes visible during pulsed degassing episodes frequently interrupted by mild Strombolian explosions. The most energetic events were lava jets lasting 15-20 seconds that threw large spatters 120-130 m above the vent to the crater rim. The activity climaxed on 2 and 3 August when lava jets frequently rose up to a few tens of meters above the crater rim. Strombolian activity stopped abruptly on the night of 4 August, leaving a thick tongue of lava on the pit floor. During the Strombolian phase no spatter fell beyond the crater rim; most fell close to the vent inside the inner pit. In the days following 4 August, several ash emissions were observed at Bocca Nuova, which gradually resumed its quiet degassing. No further activity at Bocca Nuova was observed through the end of August.
Until 2 August, no lava emissions had been observed from Northeast Crater since September 1986 (SEAN 11:09); only scoria was ejected on 13 May 1991 (BGVN 16:07). Strombolian explosions during 2-3 August issued from a small vent in the lowest part of the crater, ~150 m below the crater rim. Almost continuous spatter ejections never reached the crater rim. During 3 August the activity gradually changed to puffs of black ash that continued in the following days. After ash emissions decreased, three incandescent degassing points on the crater floor were seen for several days. On 18 August, Strombolian activity resumed and during the night some incandescent bombs rose above the crater rim. Ash emission the following days prevented observations inside the crater, but no blasts were heard. On 29 August, another 1-day phase of Strombolian activity was followed the next day by ash emissions that marked the end of this eruptive episode.
Geologic Background. Mount Etna, towering above Catania on the island of Sicily, has one of the world's longest documented records of volcanism, dating back to 1500 BCE. Historical lava flows of basaltic composition cover much of the surface of this massive volcano, whose edifice is the highest and most voluminous in Italy. The Mongibello stratovolcano, truncated by several small calderas, was constructed during the late Pleistocene and Holocene over an older shield volcano. The most prominent morphological feature of Etna is the Valle del Bove, a 5 x 10 km caldera open to the east. Two styles of eruptive activity typically occur, sometimes simultaneously. Persistent explosive eruptions, sometimes with minor lava emissions, take place from one or more summit craters. Flank vents, typically with higher effusion rates, are less frequently active and originate from fissures that open progressively downward from near the summit (usually accompanied by Strombolian eruptions at the upper end). Cinder cones are commonly constructed over the vents of lower-flank lava flows. Lava flows extend to the foot of the volcano on all sides and have reached the sea over a broad area on the SE flank.
Information Contacts: Mauro Coltelli, CNR Istituto Internazionale di Vulcanologia, Piazza Roma 2, 95123 Catania, Italy.
Fernandina (Ecuador) — August 1995 Cite this Report
Fernandina
Ecuador
0.37°S, 91.55°W; summit elev. 1476 m
All times are local (unless otherwise noted)
Now-cooling lava and the eruption's impact on plants and animals
Godfrey Merlen was granted permission by the Galapagos National Park Service to make a post-eruption visit to Fernandina. The recent eruption ceased on about 8 April 1995 (BGVN 20:05). Merlen looked at the eruptions impact on plants and animals, and viewed the newly formed lava fields and cone in the absence of the acrid gases and heat present during the eruption.
Merlin arrived at Cape Hammond on 26 July (figure 3) and climbed for 2 hours along a well-known route to the kipuka adjacent the cone. From this point, he approached the cone itself. He noted Jasminocereus cactus, which form a distinctive part of the flora in the area, and, which were partially scalded within several hundred meters of the lava. Surprisingly, they were heavy with fruit.
The cone was approached from the SW. Large blocks of new lava formed the base of the cone, and below them the old lavas were totally covered with a scoria layer. Poking through this layer were a number of Opuntia cactus. Many had been badly burnt by the heat, but they had undergone strong regrowth, and some had up to 9 or 10 new pads. A few flowers were also present.
He ascended the cone (figure 3) easily, due to its firm surface composed of congealed spatter. From the rim he observed that the lava lake had drained, leaving a reddish rubble in the bottom of the crater. A visible entrance to a lava tunnel on the crater's W side probably served as a lava exit route. Circumferential fissures had developed in many areas around the rim, leading to inward collapses. On the N side of the cone's rim, hot spots disclosed by shimmering, heated air indicated that they were still too hot to approach closely.
From the rim one could look upslope and see the earliest flows from the eruption (figure 3). Though previously obscured by gases, it now seems clear that the flow farthest to the N was of significant extent, even though previously unseen. It had traveled a considerable distance past the cone and then turned N, filling in a low area well down toward the coast. Later, lava from the cone butted up against this flow, making a continuous field of new lava.
In descending from the cone's N side towards the "Iguana Hill" kipuka (figure 3), he crossed over the fresh new aa lava, but there were also some smooth patches and many small lava tubes on the surface. The track of the main lava tube could be followed by noting the white encrustations on the rocks. On approach to these encrustations extreme heat was felt. He assumed that a short distance below the surface there were partially liquid lavas that were still degassing. Away from these encrustations the surface of the lava was quite cool.
Although Iguana Hill was wreathed in acidic volcanic gases for many weeks during the eruption, Land Iguanas trapped there survived and four adults were seen. This hardly represents all the iguanas, as the dense scrub vegetation impeded investigation. Many of the plants on the Iguana Hill kipuka were putting out leaves. Zanthoxylum, Croton, and Cordia were all in full leaf, the former were a particularly noticeable bright green.
Blue "smoke" was still visible a little to the NE of Iguana Hill. There was also a little smoke in the low area behind the shoreline. The coast itself was volcanically quiet. Heavy southerly swells broke along a long, black beach that stood in front of the near-vertical sea cliff. This eruption changed conditions at the Cape Hammond landing little, if at all. Flightless cormorants were building nests and some had eggs. The pupping season for the fur seals and sea lion had begun.
A perspective sketch (figure 4) from a point several kilometers offshore shows that the lava flow that started high on the shoulder of the volcano lined up with the westernmost string of cones, including one cone on the coast. However, the new cone, the vent for much of this recently erupted lava, lies off this line to the S.
Geologic Background. Fernandina, the most active of Galápagos volcanoes and the one closest to the Galápagos mantle plume, is a basaltic shield volcano with a deep 5 x 6.5 km summit caldera. The volcano displays the classic "overturned soup bowl" profile of Galápagos shield volcanoes. Its caldera is elongated in a NW-SE direction and formed during several episodes of collapse. Circumferential fissures surround the caldera and were instrumental in growth of the volcano. Reporting has been poor in this uninhabited western end of the archipelago, and even a 1981 eruption was not witnessed at the time. In 1968 the caldera floor dropped 350 m following a major explosive eruption. Subsequent eruptions, mostly from vents located on or near the caldera boundary faults, have produced lava flows inside the caldera as well as those in 1995 that reached the coast from a SW-flank vent. Collapse of a nearly 1 km3 section of the east caldera wall during an eruption in 1988 produced a debris-avalanche deposit that covered much of the caldera floor and absorbed the caldera lake.
Information Contacts: Godfrey Merlen, skipper of motor vessel "Ratty," Fundacion Charles Darwin Para Las Islas Galapagos, Estacion Cientifica Charles Darwin, Ecuador.
Izu-Tobu
Japan
34.9°N, 139.098°E; summit elev. 1406 m
All times are local (unless otherwise noted)
Earthquake swarm offshore SE of Ito City
An offshore micro-earthquake swarm began around 0700 on 11 September near Kawanazaki (figure 14). The number of events increased from 61 on 11 September to 125 the next day before decreasing to only 12 on 13 September. The largest event was M 2.6 at 1059 on the 12th. Volume strain meters detected contraction of 10-7. The last earthquake swarm was detected between 27 February and 9 March 1994; it consisted of 287 events, including a M 3.8 earthquake.
Geologic Background. The Izu-Tobu volcano group (Higashi-Izu volcano group) is scattered over a broad, plateau-like area of more than 400 km2 on the E side of the Izu Peninsula. Construction of several stratovolcanoes continued throughout much of the Pleistocene and overlapped with growth of smaller monogenetic volcanoes beginning about 300,000 years ago. About 70 subaerial monogenetic volcanoes formed during the last 140,000 years, and chemically similar submarine cones are located offshore. These volcanoes are located on a basement of late-Tertiary volcanic rocks and related sediments and on the flanks of three Quaternary stratovolcanoes: Amagi, Tenshi, and Usami. Some eruptive vents are controlled by fissure systems trending NW-SE or NE-SW. Thirteen eruptive episodes have been documented during the past 32,000 years. Kawagodaira maar produced pyroclastic flows during the largest Holocene eruption about 3,000 years ago. The latest eruption occurred in 1989, when a small submarine crater was formed NE of Ito City.
Information Contacts: Volcanological Division, Seismological and Volcanological Department, Japan Meteorological Agency (JMA), 1-3-4 Ote-machi, Chiyoda-ku, Tokyo 100 Japan.
Kanaga (United States) — August 1995 Cite this Report
Kanaga
United States
51.923°N, 177.168°W; summit elev. 1307 m
All times are local (unless otherwise noted)
Minor steaming from the summit area
Clouds obscured the volcano during much of the second half of July, preventing ground and satellite observations. Observers on Adak got a brief view on 14 July and reported light steaming from the summit. On 20 July an AVO geologist on Adak viewed Kanaga for several hours. As has been reported intermittently by U.S. Fish and Wildlife Service (FWS) observers since last fall, fumaroles high on the E and SE flank steamed vigorously and a hazy plume of steam and possibly volcanic gas emanated from the summit crater and drifted a few kilometers downwind. In contrast to other mountain peaks of similar elevation, most of Kanaga was dark and snow-free. One snow patch just below the summit was mantled by debris. It is not known if material mantling the cone is the result of possible activity in late June or merely wind-reworking of material deposited during the extended 1994 eruption. Clouds again obscured Kanaga through the first half of August, but FWS personnel on Adak observed minor steaming from the summit crater during 12-25 August.
Geologic Background. Symmetrical Kanaga stratovolcano is situated within the Kanaton caldera at the northern tip of Kanaga Island. The caldera rim forms a 760-m-high arcuate ridge south and east of Kanaga; a lake occupies part of the SE caldera floor. The volume of subaerial dacitic tuff is smaller than would typically be associated with caldera collapse, and deposits of a massive submarine debris avalanche associated with edifice collapse extend nearly 30 km to the NNW. Several fresh lava flows from historical or late prehistorical time descend the flanks of Kanaga, in some cases to the sea. Historical eruptions, most of which are poorly documented, have been recorded since 1763. Kanaga is also noted petrologically for ultramafic inclusions within an outcrop of alkaline basalt SW of the volcano. Fumarolic activity occurs in a circular, 200-m-wide, 60-m-deep summit crater and produces vapor plumes sometimes seen on clear days from Adak, 50 km to the east.
Information Contacts: Alaska Volcano Observatory (AVO), a cooperative program of a) U.S. Geological Survey, 4200 University Drive, Anchorage, AK 99508-4667 USA, b) Geophysical Institute, University of Alaska, PO Box 757320, Fairbanks, AK 99775-7320, USA, and c) Alaska Division of Geological & Geophysical Surveys, 794 University Ave., Suite 200, Fairbanks, AK 99709, USA.
Kirishimayama (Japan) — August 1995 Cite this Report
Kirishimayama
Japan
31.934°N, 130.862°E; summit elev. 1700 m
All times are local (unless otherwise noted)
Seismicity increased in late August
During 25-30 August there was an increase in seismicity near Shinmoe-dake; 126 earthquakes on the 26th were recorded 1.7 km SW. The maximum seismic amplitude of 3.2 µm occurred on the 30th. In total, 463 events were recorded in August.
Geologic Background. Kirishimayama is a large group of more than 20 Quaternary volcanoes located north of Kagoshima Bay. The late-Pleistocene to Holocene dominantly andesitic group consists of stratovolcanoes, pyroclastic cones, maars, and underlying shield volcanoes located over an area of 20 x 30 km. The larger stratovolcanoes are scattered throughout the field, with the centrally located Karakunidake being the highest. Onamiike and Miike, the two largest maars, are located SW of Karakunidake and at its far eastern end, respectively. Holocene eruptions have been concentrated along an E-W line of vents from Miike to Ohachi, and at Shinmoedake to the NE. Frequent small-to-moderate explosive eruptions have been recorded since the 8th century.
Information Contacts: JMA.
Langila (Papua New Guinea) — August 1995 Cite this Report
Langila
Papua New Guinea
5.525°S, 148.42°E; summit elev. 1330 m
All times are local (unless otherwise noted)
Intermittent Vulcanian explosions and weaker ash-and-vapor emissions
During August, intermittent Vulcanian explosions interspersed with weaker ash-and-vapor emissions continued at Crater 2. Larger explosions rose several hundred meters above the crater rim and resulted in ashfalls on the downwind (N-NW) side of the volcano. Observers heard low detonations to deep rumblings; on 4, 5, and 17 August they saw weak, steady crater glow. No activity was seen from Crater 3. The seismographs remained inoperative in August.
Geologic Background. Langila, one of the most active volcanoes of New Britain, consists of a group of four small overlapping composite basaltic-andesitic cones on the lower E flank of the extinct Talawe volcano in the Cape Gloucester area of NW New Britain. A rectangular, 2.5-km-long crater is breached widely to the SE; Langila was constructed NE of the breached crater of Talawe. An extensive lava field reaches the coast on the N and NE sides of Langila. Frequent mild-to-moderate explosive eruptions, sometimes accompanied by lava flows, have been recorded since the 19th century from three active craters at the summit. The youngest and smallest crater (no. 3 crater) was formed in 1960 and has a diameter of 150 m.
Information Contacts: Patrice de Saint-Ours and Ben Talai, Rabaul Volcano Observatory (RVO), P.O. Box 386, Rabaul, Papua New Guinea.
Loloru (Papua New Guinea) — August 1995 Cite this Report
Loloru
Papua New Guinea
6.52°S, 155.62°E; summit elev. 1887 m
All times are local (unless otherwise noted)
Weak to moderate steaming, but sublimate deposits in possible decline
An aerial inspection took place after the 16 August, M 7.8 earthquake 200 km to the NW. Weak-to-moderate, white vapor emissions were observed from the main fumarole field in a valley on the N flank of the summit lava dome. Sublimate deposits in the valley appeared to be less extensive than when last inspected in 1989. The lake at Loloru's summit appeared normal. There was no discoloration of lake water and the level of water appeared to be unchanged.
Geologic Background. Loloru, the SE-most volcano on Bougainville Island, is the source of a broad ignimbrite apron that covers much of the southern part of the island. The summit consists of two nested calderas, and a forested andesitic lava dome that restricts a crescent-shaped lake to the eastern side of the younger caldera. The smooth flanks of the pyroclastic shield are dissected by radiating deep valleys. A pristine lava flow occurs on the SE flank. Loloru is constructed within the 10 x 15 km Pleistocene Laluai caldera. The topographically higher Taroka group of volcanoes to the NW and the Takuan group to the north also were constructed within the caldera and deflected the bulk of Loloru ignimbrites to the south. The most recent of several major Holocene explosive eruptions took place about 3,000 years ago.
Information Contacts: Patrice de Saint-Ours and Ben Talai, RVO.
Manam (Papua New Guinea) — August 1995 Cite this Report
Manam
Papua New Guinea
4.08°S, 145.037°E; summit elev. 1807 m
All times are local (unless otherwise noted)
Low to moderate degassing; no deformation
During August, Manam's summit craters were covered with atmospheric clouds, but when visible, they were simply emitting white vapor at low-to-moderate rates. There were no audible sounds from either crater and no sightings of crater glow. Tiltmeters (installed 4 km SW of the summit) registered little or no ground deformation.
Geologic Background. The 10-km-wide island of Manam, lying 13 km off the northern coast of mainland Papua New Guinea, is one of the country's most active volcanoes. Four large radial valleys extend from the unvegetated summit of the conical basaltic-andesitic stratovolcano to its lower flanks. These valleys channel lava flows and pyroclastic avalanches that have sometimes reached the coast. Five small satellitic centers are located near the island's shoreline on the northern, southern, and western sides. Two summit craters are present; both are active, although most observed eruptions have originated from the southern crater, concentrating eruptive products during much of the past century into the SE valley. Frequent eruptions, typically of mild-to-moderate scale, have been recorded since 1616. Occasional larger eruptions have produced pyroclastic flows and lava flows that reached flat-lying coastal areas and entered the sea, sometimes impacting populated areas.
Information Contacts: Patrice de Saint-Ours and Ben Talai, RVO.
Mayon (Philippines) — August 1995 Cite this Report
Mayon
Philippines
13.257°N, 123.685°E; summit elev. 2462 m
All times are local (unless otherwise noted)
Crater glow and steam emissions
On the evening of 23 August, staff at the Lignon Hill Observatory in Legazpi observed moderate to intense glow from the crater of Mayon. Moderate steam emissions rising ~300 m above the summit preceded the observation of glow. The Philippine Institute of Volcanology and Seismology (PHIVOLCS) increased the Alert Level to 2, indicating that volcanic activity had increased slightly. PHIVOLCS also recommended strict compliance with the 6-km-radius permanent danger zone, an area restricted to regular human activity, especially below the Bonga channel on the SE flank. The PHIVOLCS Quick Response Team was dispatched to augment monitoring staff at the Lignon Hill and Mayon Resthouse observatories.
The summit crater continued to exhibit glow on 25 August, with varying intensity, and there was moderate steam emission. COSPEC measurements of SO2 levels in the steam plume were ~630 metric tons/day (t/d), well above the 100-200 t/d measured during quiet periods. No unusual seismicity was detected. The last sighting of crater glow was on 2 September, although it was not until 12 September that SO2 measurements by COSPEC decreased to near background.
As of mid-September, the dominant seismicity consisted of occasional high-frequency volcanic earthquakes (<5 events/day); they were large enough to be located, and occurred within the E and N parts of the edifice. Observations of the crater area disclosed that some multi-phase events were due to large lava blocks detaching from the vent. The vent is open to the SE as a result of the 1993 explosions. A preliminary investigation of a water well in Malilipot (ENE of the summit) on 25 August revealed a slight decrease in water level, also an indicator of volcanic unrest. However, further measurements of water wells on the SE and S margins of lahar fans around Mayon, where most wells are located, did not show measurable or significant changes. PHIVOLCS therefore concluded that little ground deformation was taking place.
Geologic Background. Symmetrical Mayon, which rises above the Albay Gulf NW of Legazpi City, is the most active volcano of the Philippines. The steep upper slopes are capped by a small summit crater. Recorded eruptions since 1616 CE range from Strombolian to basaltic Plinian, with cyclical activity beginning with basaltic eruptions, followed by longer term andesitic lava flows. Eruptions occur predominately from the central conduit and have also produced lava flows that travel far down the flanks. Pyroclastic flows and mudflows have commonly swept down many of the approximately 40 ravines that radiate from the summit and have often damaged populated lowland areas. A violent eruption in 1814 killed more than 1,200 people and devastated several towns.
Information Contacts: Ernesto G. Corpuz, Chief of Volcano Monitoring Division, Philippine Institute of Volcanology and Seismology (PHIVOLCS), 5th & 6th Floors Hizon Building, 29 Quezon Avenue, Quezon City, Philippines.
Moyorodake [Medvezhia] (Japan - administered by Russia) — August 1995 Cite this Report
Moyorodake [Medvezhia]
Japan - administered by Russia
45.389°N, 148.838°E; summit elev. 1124 m
All times are local (unless otherwise noted)
Measurements of SO2 in Kudriavy plume
The Kudriavy cone at Medvezhia has been the subject of great interest since Korzhinsky and others (1994) discovered a pure rhenium sulfide mineral in its high-temperature (535°C) fumaroles. Given the concentration of Re found in gas samples (2-10 ppb), the occurrence of ReS2 or Re2S3 (exact form still uncertain) requires enrichment of Re by eight orders of magnitude. During a 21 August-5 September visit, Stan Williams, Tobias Fisher, and Russian colleagues made COSPEC measurements of SO2 flux. Gas samples were also collected from crater fumaroles.
The COSPEC was operated from the base camp (150 m elevation) 2.7 km SE of the elongate ENE-WSW summit (990 m elevation), while the wind velocity was measured at the summit using a hand-held anemometer. The first measurements were made on 28 August in vertically oriented stationary mode with the wind blowing the wide gas plume directly over the camp. Wind velocity was measured at 3 m/s and the plume was estimated to be rising only 50 m above the summit before being blown downwind. The flux was found to be 100 +- 20 metric tons/day (t/d) for the three measurements possible before the wind shifted to the SW, making any measurements essentially oblique to the plume axis, and therefore of great uncertainty. An occasional strong odor of H2S was detected at the camp during measurements.
During a crater visits on 29 and 31 August, and during a helicopter flight downwind in the plume, there was always a strong odor of H2S. Under clear skies on 31 August the wind carried the plume SW, allowing stationary mode vertical and horizontal measurements. One specific goal of the research was to quantify the output of the isolated fumarole fields with different temperatures, which was possible for part of the day. Wind velocity was measured at 3 m/s and the SO2 flux was calculated to be only 30 +- 10 t/d.
Kudriavy has been consistently degassing passively at high temperatures since at least 1961, when it was first visited by Russian scientists; annual fieldwork began in 1989. No change in activity was noted during this visit. At the low levels at which Kudriavy was found to be degassing, a realistic SO2 norm may be 75 +- 50 t/d, with the oscillations potentially reflecting meteoric conditions. These low-pressure fumaroles, some with temperatures up to 950°C, produced hissing to roaring to deafening levels of noise. There was more noise and higher flux than at Momotombo (Nicaragua), where 950°C fumaroles were studied through the early to mid-1980s by U.S. and Russian collaboration.
Reference. Korzhinsky, M.A., Tkachenko, S.I., Shmulovich, K.I., Taran, Y.A., and Steinberg, G.S., 1994, Discovery of a pure rhenium mineral at Kudriavy volcano: Nature, v. 369, p. 51-52.
Geologic Background. The Moyorodake volcanic complex (also known as Medvezhia) occupies the NE end of Iturup (Etorofu) Island. Two overlapping calderas, 14 x 18 and 10 x 12 km in diameter, were formed during the Pleistocene. The caldera floor contains several lava domes, cinder cones and associated lava fields, and a small lake. Four small closely spaced stratovolcanoes were constructed along an E-W line on the eastern side of the complex. The easternmost and highest, Medvezhii, lies outside the western caldera, along the Pacific coast. Srednii, Tukap, and Kudriavy (Moyorodake) volcanoes lie immediately to the west. Historically active Moyorodake is younger than 2000 years; it and Tukap remain fumarolically active. The westernmost of the post-caldera cones, Menshoi Brat, is a large lava dome with flank scoria cones, one of which has produced a series of young lava flows up to 4.5 km long that reached Slavnoe Lake. Eruptions have been documented since the 18th century, although lava flows from cinder cones on the flanks of Menshoi Brat were also probably erupted within the past few centuries.
Information Contacts: Stanley N. Williams and Tobias P. Fischer, Geology Dept., Arizona State University, Tempe AZ 85287, USA; Kirill I. Shmulovich and Mikhail A. Korzhinsky, Inst. of Experimental Mineralogy, Russian Academy of Sciences, 142432 Chernogolovka, Moscow District, Russia; Genrikh S. Steinberg, Inst. of Volcanology & Geodynamic ANSRF, 693008 Yuzhno-Sakhalinsk, Box 18, Russia.
Ontakesan
Japan
35.893°N, 137.48°E; summit elev. 3067 m
All times are local (unless otherwise noted)
Small tremors in late August
Small volcanic tremors were recorded in late August from a station 1.5 km SE of the summit.
Geologic Background. The massive Ontakesan stratovolcano, the second highest volcano in Japan, lies at the southern end of the Northern Japan Alps. Ascending this volcano is one of the major objects of religious pilgrimage in central Japan. It is constructed within a largely buried 4 x 5 km caldera and occupies the southern end of the Norikura volcanic zone, which extends northward to Yakedake volcano. The older volcanic complex consisted of at least four major stratovolcanoes constructed from about 680,000 to about 420,000 years ago, after which Ontakesan was inactive for more than 300,000 years. The broad, elongated summit of the younger edifice is cut by a series of small explosion craters along a NNE-trending line. Several phreatic eruptions post-date the roughly 7300-year-old Akahoya tephra from Kikai caldera. The first historical eruption took place in 1979 from fissures near the summit. A non-eruptive landslide in 1984 produced a debris avalanche and lahar that swept down valleys south and east of the volcano. Very minor phreatic activity caused a dusting of ash near the summit in 1991 and 2007. A significant phreatic explosion in September 2014, when a large number of hikers were at or near the summit, resulted in many fatalities.
Information Contacts: Volcanological Division, Seismological and Volcanological Department, Japan Meteorological Agency (JMA), 1-3-4 Ote-machi, Chiyoda-ku, Tokyo 100 Japan.
Poas
Costa Rica
10.2°N, 84.233°W; summit elev. 2697 m
All times are local (unless otherwise noted)
Elevated seismicity and continued fumarolic activity within the N crater
During August, the level of the sky blue lake within the N crater climbed 1.5 m with respect to its position in June. The lake's temperature was 37.5°C. Fumaroles on the W lake terrace generated gas columns <50 m high; those on the NW lakeshore continued their constant bubbling. The gases escaping from the pyroclastic cone had an 89°C temperature. Fumaroles on the S and SW crater walls had 94°C and 96°C temperatures and produced columns reaching over 50 m high. When the wind blew towards the S, Rangers at the park entry station smelled sulfur.
Poás was very active in terms of both moderate- to low-frequency earthquakes and tremor. There were 5,651 seismic events in August, predominantly low-frequency (table 6). Both medium- and high-frequency events prevailed when seismicity peaked on 25 August with 312 events.
August can be compared to the 17 other months where data were available during 1994-95 (table 6). The number of low-frequency events was fourth largest in August 1995. The largest value for the 1994-1995 interval was 7,119 events (March 1994). Tremor in August 1995 took place for 9 hours; this compares with high values seen in April 1995 (11 hours) and June 1994 (307 hours).
Geologic Background. The broad vegetated edifice of Poás, one of the most active volcanoes of Costa Rica, contains three craters along a N-S line. The frequently visited multi-hued summit crater lakes of the basaltic-to-dacitic volcano are easily accessible by vehicle from the nearby capital city of San José. A N-S-trending fissure cutting the complex stratovolcano extends to the lower N flank, where it has produced the Congo stratovolcano and several lake-filled maars. The southernmost of the two summit crater lakes, Botos, last erupted about 7,500 years ago. The more prominent geothermally heated northern lake, Laguna Caliente, is one of the world's most acidic natural lakes, with a pH of near zero. It has been the site of frequent phreatic and phreatomagmatic eruptions since an eruption was reported in 1828. Eruptions often include geyser-like ejections of crater-lake water.
Information Contacts: E. Fernandez, E. Duarte, R. Saenz, W. Jimenez, and V. Barboza, Observatorio Vulcanologico y Sismologico de Costa Rica, Universidad Nacional (OVSICORI-UNA).
Rabaul (Papua New Guinea) — August 1995 Cite this Report
Rabaul
Papua New Guinea
4.2459°S, 152.1937°E; summit elev. 688 m
All times are local (unless otherwise noted)
Intracaldera cones quiet, but nearby earthquake triggers local seismicity
Although Rabaul remained quiet in August, the region was subjected to a strong tectonic earthquake (Ms 7.8) followed by associated aftershocks. The earthquake struck on 16 August centered ~260 km SE of Rabaul. In Rabaul the earthquake struck at 2027 with a modified Mercalli (MM) intensity of V, causing some minor landslides and the collapse of a few buildings.
The earthquake triggered noteworthy responses at the caldera. On 16 August there were 24 high-frequency events, and, as late as 23 August, 3-9 additional events/day; in July there were 7 high-frequency earthquakes (M <1). On 22 August, one event was felt by residents. With an approximate magnitude of ML 2.8, this was the first felt caldera earthquake since the early phase of Rabaul's September 1994 eruption.
These high-frequency earthquakes occurred mostly in the NE part of the caldera (Namanula Hill area). In contrast, throughout the period of heightened seismicity the number of low-frequency earthquakes remained low, peaking on 30-31 August at 10 and 26 events, respectively. For comparison, during July low-frequency events occurred 11 times. The August low-frequency earthquakes appeared to originate from within or just outside the N caldera area.
During the first half of the month ground deformation remained below the measurable level. Following the Ms 7.8 earthquake, electronic and water-tube tiltmeters recorded offsets as large as 90 µrad. The offsets suggested subsidence in the central part of the caldera with the outer rim remaining stationary. As of 15 September, adequate elevation data were unavailable to confirm the pattern of offset seen in the deformation data.
Geologic Background. The low-lying Rabaul caldera on the tip of the Gazelle Peninsula at the NE end of New Britain forms a broad sheltered harbor utilized by what was the island's largest city prior to a major eruption in 1994. The outer flanks of the asymmetrical shield volcano are formed by thick pyroclastic-flow deposits. The 8 x 14 km caldera is widely breached on the east, where its floor is flooded by Blanche Bay and was formed about 1,400 years ago. An earlier caldera-forming eruption about 7,100 years ago is thought to have originated from Tavui caldera, offshore to the north. Three small stratovolcanoes lie outside the N and NE caldera rims. Post-caldera eruptions built basaltic-to-dacitic pyroclastic cones on the caldera floor near the NE and W caldera walls. Several of these, including Vulcan cone, which was formed during a large eruption in 1878, have produced major explosive activity during historical time. A powerful explosive eruption in 1994 occurred simultaneously from Vulcan and Tavurvur volcanoes and forced the temporary abandonment of Rabaul city.
Information Contacts: Patrice de Saint-Ours and Ben Talai, RVO.
Soufriere Hills (United Kingdom) — August 1995 Cite this Report
Soufriere Hills
United Kingdom
16.72°N, 62.18°W; summit elev. 915 m
All times are local (unless otherwise noted)
Two additional vents open in late August; steam-and-ash emissions
Eruptive activity . . . began with a phreatic explosion on 18 July that caused ashfall around the island (20:6). Formation of a second vent in the summit crater on 28 July and increased steam-and-ash emissions prompted evacuations from communities near the summit (20:7). Activity was variable but generally low in early August, with small mudflows and continued steaming. Vent 1 reactivated on 11 August, and some earthquakes were centered beneath St. George's Hill, 3 km WNW of the summit. Relatively heavy cloud cover and bad weather prevented observations on many days in late August.
Moderate emissions continued from both vents through 19 August (20:7). An ash-and-steam eruption from Vent 1 at 1220 on 19 August was similar in size to the two previous events that caused ashfall in Plymouth. The eruption lasted for ~35 minutes, during which a 10-minute-long phase of more vigorous activity deposited ~1 mm of ash in areas NW of the vent. Ashfall along the road between Lees and Gages has caused reduced traction; police were advising motorists to drive slower on the slippery surface.
Another small phreatic episode at 1657 on 20 August produced minor ashfall. Since the disappearance of continuous tremor on 19 August, seismicity consisted of low-intensity spasmodic tremor and occasional small volcano-tectonic (VT) earthquakes attributed to very shallow activities under the summit area.
Formation of Vent 3 on 22 August. Seismicity generally increased in frequency and amplitude until the largest single phreatic eruption episode to date at 0803 on 21 August produced a column to a height of ~2 km. Ash blown down the W flank engulfed Plymouth within eight minutes, caused darkness for ~25 minutes, and deposited an estimated 2 mm of ash. An analysis of the new ash showed that it consisted only of old altered material. Other reported phenomenon were projectiles in the Long Ground area and a density current in Gages. Over 70 locatable VT earthquakes were recorded between noon on 20 August through noon the next day; most of these events occurred before the 21 August eruption and were very shallow.
Following a contingency plan, the volcano observatory was relocated to the Vue Pointe Hotel in Old Towne (~ 4.5 km N of Plymouth) at approximately 1600 on the 21st; by 1730 all of the seismic instruments were back on-line. Seismicity was less frequent and vigorous through noon on 22 August, with only four eruption signals of smaller intensity and duration than the previous episodes. Over 5,000 residents were evacuated from the capital city of Plymouth to camps on the N part of the island. Day use was permitted, but restricted. Government offices were also relocated.
Six phreatic eruptions occurred between noon on 22 August and noon the next day. The largest, at 1551 on 22 August, produced ashfall ~3-3.5 km to the SW. This event was followed by three long-period (LP) earthquakes (events associated with the movement of pressurized fluids). When the crater area was visited on the afternoon of 22 August it was discovered that a new vent (Vent 3) had opened along the inside of English's Crater rim. Only 24 earthquakes were located during 21-23 August, all very shallow. Seismicity was comparable or slightly lower during the next twenty-four hours. There were six episodes of increased gas venting, some of which were followed by small VT events. Fifteen earthquakes, including two LP events, were located beneath Soufriere Hills at depths ranging from near-surface to ~5 km.
Aerial reconnaissance on the afternoon of 24 August showed a NNW-SSE trending line of several small explosion craters in the summit crater, with Vent 1 at the N end and Vent 3 at the S; Vent 2 was offset to the SE. The rate of steam emission from Vent 2 was very low, while slightly more steam was being emitted from Vent 3. No gas emission was observed from Vent 1. Seismicity continued to be relatively low, with seven earthquakes distributed beneath St. George's Hill and Soufriere Hills at depths of 0-4 km. Three episodes of increased gas venting and 30 minutes of broadband tremor also occurred. A small mudflow originating from Gages Upper Soufriere during heavy rains on the afternoon of 24 August flowed through Fort Ghaut. Seismicity remained low until a swarm of VT earthquakes that lasted from 2157 on 25 August until 0230 the next day. Located earthquakes consisted of 22 VT events at depths of 0-5 km beneath the N flank. Five episodes of gas venting during 25-26 August had repose intervals of ~4 hours.
Formation of Vent 4 on 27 August. On 27 August there was one episode of broadband tremor that lasted ~20 minutes and a small mudflow in Fort Ghaut that began around 0820. From 26 to 28 August, fourteen small VT earthquakes were located beneath Soufriere Hills and St. Georges Hill at depths of <5 km. During this same period there were twelve episodes of increased gas venting. One episode at 1443 on 26 August ejected ash that could be seen from the Vue Pointe Hotel; other emissions caused light ashfall in the Tar River area. Observations on the morning of 28 August confirmed the presence of a fourth vent that had probably opened the day before. Located on the NNE flank of Castle Peak dome, it was vigorously emitting steam and ash through mid-day on 28 August; emissions from the other vents were low. Eight VT earthquakes were located beneath Soufriere Hills at depths of 0-4 km. Five episodes of increased gas venting occurred.
Vent 4 was still emitting mainly steam at a reduced rate on 29-30 August. Another nine episodes of increased gas venting were detected, and five small shallow earthquakes were located beneath and to the N of the Soufriere Hills during 29-30 August. Unusually good visibility allowed Castle Peak dome to be inspected at around 0900 on 30 August. Steam emissions from all vents were low and there was no ash. The main vent system (a linear chain of vents extending from Vent 1 on the NW margin of the dome SE to the S margin of the dome) had enlarged since 24 August. Mud or muddy water was locally present in the bottom of the main vent system. Several pools of standing water were located atop Castle Peak, and the moat pond on the NW side of the dome still existed. A recent mudflow from the W side of the dome southward down the Tar River had buried Vent 2, on the S side of the dome.
In terms of earthquake activity, the 24-hour period beginning at 1400 on 30 August was probably the most active since the 21 August phreatic eruption. Thirty-four shallow earthquakes were located WNW of Soufriere Hills. A few earthquakes were also located beneath Windy Hill (3.5 km NNW) and in the area between Windy Hill and Soufriere Hills. Seismicity decreased the next day, when only ten shallow earthquakes were located WNW of Soufriere Hills; two were also located beneath Windy Hill. In addition, four LP earthquakes occurred at shallow depths beneath the NW edge of Soufriere Hills. During these two days, thirteen episodes of increased gas venting were detected, but steam and ash emissions from all vents remained low.
Deformation and SO2 measurements. A review of the Brodrick's dry-tilt data completed on 23 August indicated that some deformation of the volcano may have occurred between January and 9 August, confirming that magma may be at a shallow depth (as suggested by the earthquake data). Tiltmeter readings in late August were generally within background noise levels; no tilt related to volcanism was observed. EDM reflectors were deployed on 30 August in Gages Upper Soufriere and on Castle Peak dome.
COSPEC gas measurements taken on the afternoon of 20 August indicated that the rate of SO2 emission was just above the detection level, ~50 metric tons/day (t/d). Additional measurements taken during favorable conditions on the next afternoon and morning of 22 August did not detect any SO2. This lack of SO2 was thought to be a result either of the system running out of gases or a sealing off of the fluid access path to the surface. A COSPEC flight on the afternoon of 23 August detected a slight trace of SO2 (~ 40 t/d) while a flight the next morning showed none. The flux rate on the morning of 26 August was ~50 t/d, and on 28 August was ~85 t/d. Further COSPEC measurements on 29, 30, and 31 August showed no detectable SO2.
Geologic Background. The complex, dominantly andesitic Soufrière Hills volcano occupies the southern half of the island of Montserrat. The summit area consists primarily of a series of lava domes emplaced along an ESE-trending zone. The volcano is flanked by Pleistocene complexes to the north and south. English's Crater, a 1-km-wide crater breached widely to the east by edifice collapse, was formed about 2000 years ago as a result of the youngest of several collapse events producing submarine debris-avalanche deposits. Block-and-ash flow and surge deposits associated with dome growth predominate in flank deposits, including those from an eruption that likely preceded the 1632 CE settlement of the island, allowing cultivation on recently devegetated land to near the summit. Non-eruptive seismic swarms occurred at 30-year intervals in the 20th century, but no historical eruptions were recorded until 1995. Long-term small-to-moderate ash eruptions beginning in that year were later accompanied by lava-dome growth and pyroclastic flows that forced evacuation of the southern half of the island and ultimately destroyed the capital city of Plymouth, causing major social and economic disruption.
Information Contacts: VDAP, USGS; Seismic Research Unit, UWI; Montserrat EOC.
Stromboli
Italy
38.789°N, 15.213°E; summit elev. 924 m
All times are local (unless otherwise noted)
Seismicity generally low from mid-June to mid-September
The only significant tremor variations for the period 11 June-15 September 1995 were between 12 and 27 August, when intensity slowly increased (figure 45). The following four days were characterized by a rapid return of the intensity to the range observed throughout the first half of September. Noteworthy is the lack of a great number of saturating events compared to March-May 1995, including the 5 March explosion (BGVN 20:04 and 20:05). This means that explosive activity was either less energetic or shallower, with more energy released towards the air than into seismic waves. The total number of recorded events showed a rise and subsequent decrease from mid-June to mid-July, with two minima of 50-60 events/day and a maximum of almost 200 events/day recorded on 26 June. Another rise starting in mid-July reached values of 260-280 events on 28 August and 3 September, corresponding to the period of decreased tremor.
Geologic Background. Spectacular incandescent nighttime explosions at Stromboli have long attracted visitors to the "Lighthouse of the Mediterranean" in the NE Aeolian Islands. This volcano has lent its name to the frequent mild explosive activity that has characterized its eruptions throughout much of historical time. The small island is the emergent summit of a volcano that grew in two main eruptive cycles, the last of which formed the western portion of the island. The Neostromboli eruptive period took place between about 13,000 and 5,000 years ago. The active summit vents are located at the head of the Sciara del Fuoco, a prominent scarp that formed about 5,000 years ago due to a series of slope failures which extends to below sea level. The modern volcano has been constructed within this scarp, which funnels pyroclastic ejecta and lava flows to the NW. Essentially continuous mild Strombolian explosions, sometimes accompanied by lava flows, have been recorded for more than a millennium.
Information Contacts: Roberto Carniel, Dipartimento di Georisorse e Territorio, via Cotonificio 114, I-33100 Udine, Italy.
Tokachidake (Japan) — August 1995 Cite this Report
Tokachidake
Japan
43.418°N, 142.686°E; summit elev. 2077 m
All times are local (unless otherwise noted)
Tremor event and increased seismicity
A volcanic tremor event and 20 seismic events were observed on 18 August at Station A, 4.5 km NNW of Crater 62-2. On 23 August another 19 events were recorded. In total, 77 earthquakes were detected in August. This period of increased seismicity began on 9 July.
Geologic Background. Tokachidake volcano consists of a group of dominantly andesitic stratovolcanoes and lava domes arranged on a NE-SW line above a plateau of welded Pleistocene tuffs in central Hokkaido. Numerous explosion craters and cinder cones are located on the upper flanks of the small stratovolcanoes, with the youngest Holocene centers located at the NW end of the chain. Frequent historical eruptions, consisting mostly of mild-to-moderate phreatic explosions, have been recorded since the mid-19th century. Two larger eruptions occurred in 1926 and 1962. Partial cone collapse of the western flank during the 1926 eruption produced a disastrous debris avalanche and mudflow.
Information Contacts: Volcanological Division, Seismological and Volcanological Department, Japan Meteorological Agency (JMA), 1-3-4 Ote-machi, Chiyoda-ku, Tokyo 100 Japan.
Veniaminof (United States) — August 1995 Cite this Report
Veniaminof
United States
56.17°N, 159.38°W; summit elev. 2507 m
All times are local (unless otherwise noted)
Small steam plumes and hot spots on satellite images
Clouds frequently obscured the volcano in July and August, preventing ground and satellite observations. Observers in Perryville (~30 km S of Veniaminof) got good views on 13 and 27 July, and reported light steaming on both days. On 28 July a weak hot spot centered on Veniaminof was noted on an AVHRR image. Perryville residents reported clear skies but no evidence of activity on the morning of 4 August, and AVHRR satellite images on 4 and 5 August showed no hot spot. Perryville residents saw a small steam plume on 9 August, a small steam plume and "smoke" during the week of 12-18 August, and a small steam plume again during 19-25 August. AVHRR satellite images on 14 and 21 August showed no hot spots. Another AVHRR image from late on 31 August showed a possible steam plume ~50 km long blowing NW of Veniaminof. The hot spot was ~15°C warmer than the surrounding features (probably ice and snow near the summit).
Geologic Background. Veniaminof, on the Alaska Peninsula, is truncated by a steep-walled, 8 x 11 km, glacier-filled caldera that formed around 3,700 years ago. The caldera rim is up to 520 m high on the north, is deeply notched on the west by Cone Glacier, and is covered by an ice sheet on the south. Post-caldera vents are located along a NW-SE zone bisecting the caldera that extends 55 km from near the Bering Sea coast, across the caldera, and down the Pacific flank. Historical eruptions probably all originated from the westernmost and most prominent of two intra-caldera cones, which rises about 300 m above the surrounding icefield. The other cone is larger, and has a summit crater or caldera that may reach 2.5 km in diameter, but is more subdued and barely rises above the glacier surface.
Information Contacts: Alaska Volcano Observatory (AVO), a cooperative program of a) U.S. Geological Survey, 4200 University Drive, Anchorage, AK 99508-4667 USA, b) Geophysical Institute, University of Alaska, PO Box 757320, Fairbanks, AK 99775-7320, USA, and c) Alaska Division of Geological & Geophysical Surveys, 794 University Ave., Suite 200, Fairbanks, AK 99709, USA.
Yasur
Vanuatu
19.532°S, 169.447°E; summit elev. 361 m
All times are local (unless otherwise noted)
Frequent bomb ejections continue; increased activity during 1994
During October 1993, a telemetered surveillance station registered variations in the seismicity at Yasur. The station is located 2 km from the crater on the ashflow plain (figure 3). Seismicity (detected at five stations) generally increased from October 1993 to January 1994, corresponding to renewed eruptive activity. Very strong activity from January 1994 to January 1995 (comparable to 1976-77) ejected bombs in a radius of ~400 m from the crater rim (figure 4). Ashfall measured at the surveillance station totaled ~12 cm during January-October 1994. Seismicity remained high throughout 1994, then declined after January 1995.
Because Yasur is very accessible, it has been promoted as a tourist destination, resulting in a greater number of visitors and greater risk of accidents. In mid-January 1994 and early February 1995, when activity began to decline, there were two accidents with three victims. In one incident, two visitors on the crater rim died when they were struck by a 15 kg bomb ejected from the vent. Although there is little danger when the volcano is having regular explosions at intervals of a few minutes to tens of minutes, the local authorities want to better inform visitors of the constant danger. In January 1994, ORSTOM began publishing a series of booklets to inform the general public of the volcanic risks. Risks discussed include bombs falling near the crater, modifications of the crater topography (raising of the floor, migration of the vent, etc.). In addition, the 200-m distance between the observation site and the active vents, and the very frequent bomb ejections at speeds of 100-300 m/second that have rendered approaching the crater rim dangerous.
Geologic Background. Yasur has exhibited essentially continuous Strombolian and Vulcanian activity at least since Captain Cook observed ash eruptions in 1774. This style of activity may have continued for the past 800 years. Located at the SE tip of Tanna Island in Vanuatu, this pyroclastic cone has a nearly circular, 400-m-wide summit crater. The active cone is largely contained within the small Yenkahe caldera, and is the youngest of a group of Holocene volcanic centers constructed over the down-dropped NE flank of the Pleistocene Tukosmeru volcano. The Yenkahe horst is located within the Siwi ring fracture, a 4-km-wide open feature associated with eruption of the andesitic Siwi pyroclastic sequence. Active tectonism along the Yenkahe horst accompanying eruptions has raised Port Resolution harbor more than 20 m during the past century.
Information Contacts: M. Lardy and D. Charley, Centre ORSTOM, Port Vila, Vanuatu, and Department des Mines et de la Geologie et des Ressources en Eaux; J. Tabbagh, Centre de Teleobservation Informatise des Volcans, Garchy, France; J-P. Eissen, Centre ORSTOM de Brest, France; C. Robin and M. Monzier, Centre ORSTOM, Quito, Ecuador.