Recently Published Bulletin Reports
Manam (Papua New Guinea) Few ash plumes during November-December 2022
Krakatau (Indonesia) Strombolian activity and ash plumes during November 2022-April 2023
Stromboli (Italy) Strombolian explosions and lava flows continue during January-April 2023
Nishinoshima (Japan) Small ash plumes and fumarolic activity during November 2022 through April 2023
Karangetang (Indonesia) Lava flows, incandescent avalanches, and ash plumes during January-June 2023
Ahyi (United States) Intermittent hydroacoustic signals and discolored plumes during November 2022-June 2023
Kadovar (Papua New Guinea) An ash plume and weak thermal anomaly during May 2023
San Miguel (El Salvador) Small gas-and-ash explosions during March and May 2023
Semisopochnoi (United States) Occasional explosions, ash deposits, and gas-and-steam plumes during December 2022-May 2023
Ebeko (Russia) Continued explosions, ash plumes, and ashfall during October 2022-May 2023
Home Reef (Tonga) Discolored plumes continued during November 2022-April 2023
Ambae (Vanuatu) New lava flow, ash plumes, and sulfur dioxide plumes during February-May 2023
Manam (Papua New Guinea) — July 2023  Cite this Report
Manam
Papua New Guinea
4.08°S, 145.037°E; summit elev. 1807 m
All times are local (unless otherwise noted)
Few ash plumes during November-December 2022
Manam is a 10-km-wide island that consists of two active summit craters: the Main summit crater and the South summit crater and is located 13 km off the northern coast of mainland Papua New Guinea. Frequent mild-to-moderate eruptions have been recorded since 1616. The current eruption period began during June 2014 and has more recently been characterized by intermittent ash plumes and thermal activity (BGVN 47:11). This report updates activity that occurred from November 2022 through May 2023 based on information from the Darwin Volcanic Ash Advisory Center (VAAC) and various satellite data.
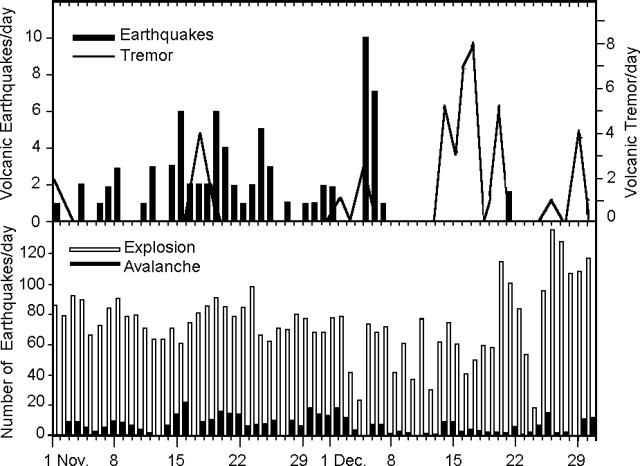
Ash plumes were reported during November and December 2022 by the Darwin VAAC. On 7 November an ash plume rose to 2.1 km altitude and drifted NE based on satellite images and weather models. On 14 November an ash plume rose to 2.1 km altitude and drifted W based on RVO webcam images. On 20 November ash plumes rose to 1.8 km altitude and drifted NW. On 26 December an ash plume rose to 3 km altitude and drifted S and SSE.
Intermittent sulfur dioxide plumes were detected using the TROPOMI instrument on the Sentinel-5P satellite, some of which exceeded at least two Dobson Units (DU) and drifted in different directions (figure 93). Occasional low-to-moderate power thermal anomalies were recorded by the MIROVA (Middle InfraRed Observation of Volcanic Activity) system; less than five anomalies were recorded each month during November 2022 through May 2023 (figure 94). Two thermal hotspots were detected by the MODVOLC thermal alerts system on 10 December 2022. On clear weather days, thermal activity was also captured in infrared satellite imagery in both the Main and South summit craters, accompanied by gas-and-steam emissions (figure 95).
Geologic Background. The 10-km-wide island of Manam, lying 13 km off the northern coast of mainland Papua New Guinea, is one of the country's most active volcanoes. Four large radial valleys extend from the unvegetated summit of the conical basaltic-andesitic stratovolcano to its lower flanks. These valleys channel lava flows and pyroclastic avalanches that have sometimes reached the coast. Five small satellitic centers are located near the island's shoreline on the northern, southern, and western sides. Two summit craters are present; both are active, although most observed eruptions have originated from the southern crater, concentrating eruptive products during much of the past century into the SE valley. Frequent eruptions, typically of mild-to-moderate scale, have been recorded since 1616. Occasional larger eruptions have produced pyroclastic flows and lava flows that reached flat-lying coastal areas and entered the sea, sometimes impacting populated areas.
Information Contacts: Rabaul Volcano Observatory (RVO), Geohazards Management Division, Department of Mineral Policy and Geohazards Management (DMPGM), PO Box 3386, Kokopo, East New Britain Province, Papua New Guinea; Darwin Volcanic Ash Advisory Centre (VAAC), Bureau of Meteorology, Northern Territory Regional Office, PO Box 40050, Casuarina, NT 0811, Australia (URL: http://www.bom.gov.au/info/vaac/); MIROVA (Middle InfraRed Observation of Volcanic Activity), a collaborative project between the Universities of Turin and Florence (Italy) supported by the Centre for Volcanic Risk of the Italian Civil Protection Department (URL: http://www.mirovaweb.it/); Hawai'i Institute of Geophysics and Planetology (HIGP) - MODVOLC Thermal Alerts System, School of Ocean and Earth Science and Technology (SOEST), Univ. of Hawai'i, 2525 Correa Road, Honolulu, HI 96822, USA (URL: http://modis.higp.hawaii.edu/); NASA Global Sulfur Dioxide Monitoring Page, Atmospheric Chemistry and Dynamics Laboratory, NASA Goddard Space Flight Center (NASA/GSFC), 8800 Greenbelt Road, Goddard, Maryland, USA (URL: https://so2.gsfc.nasa.gov/); Copernicus Browser, Copernicus Data Space Ecosystem, European Space Agency (URL: https://dataspace.copernicus.eu/browser/).
Krakatau (Indonesia) — July 2023 Cite this Report
Krakatau
Indonesia
6.1009°S, 105.4233°E; summit elev. 285 m
All times are local (unless otherwise noted)
Strombolian activity and ash plumes during November 2022-April 2023
Krakatau is located in the Sunda Strait between Java and Sumatra, Indonesia. Caldera collapse during the catastrophic 1883 eruption destroyed Danan and Perbuwatan cones and left only a remnant of Rakata. The post-collapse cone of Anak Krakatau (Child of Krakatau) was constructed within the 1883 caldera at a point between the former Danan and Perbuwatan cones; it has been the site of frequent eruptions since 1927. The current eruption period began in May 2021 and has recently consisted of explosions, ash plumes, and thermal activity (BGVN 47:11). This report covers activity during November 2022 through April 2023 based on information provided by the Indonesian Center for Volcanology and Geological Hazard Mitigation, referred to as Pusat Vulkanologi dan Mitigasi Bencana Geologi (PVMBG), MAGMA Indonesia, the Darwin Volcanic Ash Advisory Center (VAAC), and several sources of satellite data.
Activity was relatively low during November and December 2022. Daily white gas-and-steam plumes rose 25-100 m above the summit and drifted in different directions. Gray ash plumes rose 200 m above the summit and drifted NE at 1047 and at 2343 on 11 November. On 14 November at 0933 ash plumes rose 300 m above the summit and drifted E. An ash plume was reported at 0935 on 15 December that rose 100 m above the summit and drifted NE. An eruptive event at 1031 later that day generated an ash plume that rose 700 m above the summit and drifted NE. A gray ash plume at 1910 rose 100 m above the summit and drifted E. Incandescent material was ejected above the vent based on an image taken at 1936.
During January 2023 daily white gas-and-steam plumes rose 25-300 m above the summit and drifted in multiple directions. Gray-to-brown ash plumes were reported at 1638 on 3 January, at 1410 and 1509 on 4 January, and at 0013 on 5 January that rose 100-750 m above the summit and drifted NE and E; the gray-to-black ash plume at 1509 on 4 January rose as high as 3 km above the summit and drifted E. Gray ash plumes were recorded at 1754, 2241, and 2325 on 11 January and at 0046 on 12 January and rose 200-300 m above the summit and drifted NE. Toward the end of January, PVMBG reported that activity had intensified; Strombolian activity was visible in webcam images taken at 0041, 0043, and 0450 on 23 January. Multiple gray ash plumes throughout the day rose 200-500 m above the summit and drifted E and SE (figure 135). Webcam images showed progressively intensifying Strombolian activity at 1919, 1958, and 2113 on 24 January; a gray ash plume at 1957 rose 300 m above the summit and drifted E (figure 135). Eruptive events at 0231 and 2256 on 25 January and at 0003 on 26 January ejected incandescent material from the vent, based on webcam images. Gray ash plumes observed during 26-27 January rose 300-500 m above the summit and drifted NE, E, and SE.
Low levels of activity were reported during February and March. Daily white gas-and-steam plumes rose 25-300 m above the summit and drifted in different directions. The Darwin VAAC reported that continuous ash emissions rose to 1.5-1.8 km altitude and drifted W and NW during 1240-1300 on 10 March, based on satellite images, weather models, and PVMBG webcams. White-and-gray ash plumes rose 500 m and 300 m above the summit and drifted SW at 1446 and 1846 on 18 March, respectively. An eruptive event was recorded at 2143, though it was not visible due to darkness. Multiple ash plumes were reported during 27-29 March that rose as high as 2.5 km above the summit and drifted NE, W, and SW (figure 136). Webcam images captured incandescent ejecta above the vent at 0415 and around the summit area at 2003 on 28 March and at 0047 above the vent on 29 March.
Daily white gas-and-steam plumes rose 25-300 m above the summit and drifted in multiple directions during April and May. White-and-gray and black plumes rose 50-300 m above the summit on 2 and 9 April. On 11 May at 1241 a gray ash plume rose 1-3 km above the summit and drifted SW. On 12 May at 0920 a gray ash plume rose 2.5 km above the summit and drifted SW and at 2320 an ash plume rose 1.5 km above the summit and drifted SW. An accompanying webcam image showed incandescent ejecta. On 13 May at 0710 a gray ash plume rose 2 km above the summit and drifted SW (figure 137).
The MIROVA (Middle InfraRed Observation of Volcanic Activity) graph of MODIS thermal anomaly data showed intermittent low-to-moderate power thermal anomalies during November 2022 through April 2023 (figure 138). Some of this thermal activity was also visible in infrared satellite imagery at the crater, accompanied by gas-and-steam and ash plumes that drifted in different directions (figure 139).
Geologic Background. The renowned Krakatau (frequently mis-named as Krakatoa) volcano lies in the Sunda Strait between Java and Sumatra. Collapse of an older edifice, perhaps in 416 or 535 CE, formed a 7-km-wide caldera. Remnants of that volcano are preserved in Verlaten and Lang Islands; subsequently the Rakata, Danan, and Perbuwatan cones were formed, coalescing to create the pre-1883 Krakatau Island. Caldera collapse during the catastrophic 1883 eruption destroyed Danan and Perbuwatan, and left only a remnant of Rakata. This eruption caused more than 36,000 fatalities, most as a result of tsunamis that swept the adjacent coastlines of Sumatra and Java. Pyroclastic surges traveled 40 km across the Sunda Strait and reached the Sumatra coast. After a quiescence of less than a half century, the post-collapse cone of Anak Krakatau (Child of Krakatau) was constructed within the 1883 caldera at a point between the former Danan and Perbuwatan cones. Anak Krakatau has been the site of frequent eruptions since 1927.
Information Contacts: Pusat Vulkanologi dan Mitigasi Bencana Geologi (PVMBG, also known as Indonesian Center for Volcanology and Geological Hazard Mitigation, CVGHM), Jalan Diponegoro 57, Bandung 40122, Indonesia (URL: http://www.vsi.esdm.go.id/); MAGMA Indonesia, Kementerian Energi dan Sumber Daya Mineral (URL: https://magma.esdm.go.id/v1); Darwin Volcanic Ash Advisory Centre (VAAC), Bureau of Meteorology, Northern Territory Regional Office, PO Box 40050, Casuarina, NT 0811, Australia (URL: http://www.bom.gov.au/info/vaac/); MIROVA (Middle InfraRed Observation of Volcanic Activity), a collaborative project between the Universities of Turin and Florence (Italy) supported by the Centre for Volcanic Risk of the Italian Civil Protection Department (URL: http://www.mirovaweb.it/); Copernicus Browser, Copernicus Data Space Ecosystem, European Space Agency (URL: https://dataspace.copernicus.eu/browser/).
Stromboli
Italy
38.789°N, 15.213°E; summit elev. 924 m
All times are local (unless otherwise noted)
Strombolian explosions and lava flows continue during January-April 2023
Stromboli, located in Italy, has exhibited nearly constant lava fountains for the past 2,000 years; recorded eruptions date back to 350 BCE. Eruptive activity occurs at the summit from multiple vents, which include a north crater area (N area) and a central-southern crater (CS area) on a terrace known as the ‘terrazza craterica’ at the head of the Sciara del Fuoco, a large scarp that runs from the summit down the NW side of the volcano-island. Activity typically consists of Strombolian explosions, incandescent ejecta, lava flows, and pyroclastic flows. Thermal and visual monitoring cameras are located on the nearby Pizzo Sopra La Fossa, above the terrazza craterica, and at multiple flank locations. The current eruption period has been ongoing since 1934 and recent activity has consisted of frequent Strombolian explosions and lava flows (BGVN 48:02). This report updates activity during January through April 2023 primarily characterized by Strombolian explosions and lava flows based on reports from Italy's Istituto Nazionale di Geofisica e Vulcanologia (INGV) and various satellite data.
Frequent explosive activity continued throughout the reporting period, generally in the low-to-medium range, based on the number of hourly explosions in the summit crater (figure 253, table 16). Intermittent thermal activity was recorded by the MIROVA (Middle InfraRed Observation of Volcanic Activity) analysis of MODIS satellite data (figure 254). According to data collected by the MODVOLC thermal algorithm, a total of 9 thermal alerts were detected: one on 2 January 2023, one on 1 February, five on 24 March, and two on 26 March. The stronger pulses of thermal activity likely reflected lava flow events. Infrared satellite imagery captured relatively strong thermal hotspots at the two active summit craters on clear weather days, showing an especially strong event on 8 March (figure 255).
Table 16. Summary of type, frequency, and intensity of explosive activity at Stromboli by month during January-April 2023; information from webcam observations. Courtesy of INGV weekly reports.
| Month |
Explosive Activity |
| Jan 2023 |
Typical Strombolian activity with spattering and lava overflows in the N crater area. Explosions were reported from 4 vents in the N area and 1-2 vents in the CS area. The average hourly frequency of explosions was low-to-medium (1-12 events/hour). The intensity of the explosions varied from low (less than 80 m high) to medium (less than 150 m high) in the N crater area and up to high (greater than 150 m high) in the CS crater area. |
| Feb 2023 |
Typical Strombolian activity with spattering in the N crater area. Explosions were reported from 2-3 vents in the N area and 1-4 vents in the CS area. The average hourly frequency of explosions was low-to-medium (1-14 events/hour). The intensity of the explosions varied from low (less than 80 m high) to medium (less than 150 m high) in the N crater area and up to high (greater than 150 m high) in the CS crater area. |
| Mar 2023 |
Typical Strombolian activity with spattering and lava overflows in the N crater area. Explosions were reported from 2-3 vents in the N area and 2-4 vents in the CS area. The average hourly frequency of explosions was low-to-medium (1-18 events/hour). The intensity of the explosions varied from low (less than 80 m high) to medium (less than 150 m high) in the N crater area and up to high (greater than 150 m high) in the CS crater area. |
| Apr 2023 |
Typical Strombolian activity. Explosions were reported from 2 vents in the N area and 2-3 vents in the CS area. The average hourly frequency of explosions was low-to-high (1-16 events/hour). The intensity of the explosions varied from low (less than 80 m high) to medium (less than 150 m high) in both the N and CS crater areas. |
Activity during January-February 2023. Strombolian explosions were reported in the N crater area, as well as lava effusion. Explosive activity in the N crater area ejected coarse material (bombs and lapilli). Intense spattering was observed in both the N1 and N2 craters. In the CS crater area, explosions generally ejected fine material (ash), sometimes to heights greater than 250 m. The intensity of the explosions was characterized as low-to-medium in the N crater and medium-to-high in the CS crater. After intense spattering activity from the N crater area, a lava overflow began at 2136 on 2 January that flowed part way down the Sciara del Fuoco, possibly moving down the drainage that formed in October, out of view from webcams. The flow remained active for a couple of hours before stopping and beginning to cool. A second lava flow was reported at 0224 on 4 January that similarly remained active for a few hours before stopping and cooling. Intense spattering was observed on 11 and 13 January from the N1 crater. After intense spattering activity at the N2 crater at 1052 on 17 January another lava flow started to flow into the upper part of the Sciara del Fuoco (figure 256), dividing into two: one that traveled in the direction of the drainage formed in October, and the other one moving parallel to the point of emission. By the afternoon, the rate of the flow began to decrease, and at 1900 it started to cool. A lava flow was reported at 1519 on 24 January following intense spattering in the N2 area, which began to flow into the upper part of the Sciara del Fuoco. By the morning of 25 January, the lava flow had begun to cool. During 27 January the frequency of eruption in the CS crater area increased to 6-7 events/hour compared to the typical 1-7 events/hour; the following two days showed a decrease in frequency to less than 1 event/hour. Starting at 1007 on 30 January a high-energy explosive sequence was produced by vents in the CS crater area. The sequence began with an initial energetic pulse that lasted 45 seconds, ejecting predominantly coarse products 300 m above the crater that fell in an ESE direction. Subsequent and less intense explosions ejected material 100 m above the crater. The total duration of this event lasted approximately two minutes. During 31 January through 6, 13, and 24 February spattering activity was particularly intense for short periods in the N2 crater.
An explosive sequence was reported on 16 February that was characterized by a major explosion in the CS crater area (figure 257). The sequence began at 1817 near the S2 crater that ejected material radially. A few seconds later, lava fountains were observed in the central part of the crater. Three explosions of medium intensity (material was ejected less than 150 m high) were recorded at the S2 crater. The first part of this sequence lasted approximately one minute, according to INGV, and material rose 300 m above the crater and then was deposited along the Sciara del Fuoco. The second phase began at 1818 at the S1 crater; it lasted seven seconds and material was ejected 150 m above the crater. Another event 20 seconds later lasted 12 seconds, also ejecting material 150 m above the crater. The sequence ended with at least three explosions of mostly fine material from the S1 crater. The total duration of this sequence was about two minutes.
Short, intense spattering activity was noted above the N1 crater on 27 and 28 February. A lava overflow was first reported at 0657 from the N2 crater on 27 February that flowed into the October 2022 drainage. By 1900 the flow had stopped. A second lava overflow also in the N crater area occurred at 2149, which overlapped the first flow and then stopped by 0150 on 28 February. Material detached from both the lava overflows rolled down the Sciara del Fuoco, some of which was visible in webcam images.
Activity during March-April 2023. Strombolian activity continued with spattering activity and lava overflows in the N crater area during March. Explosive activity at the N crater area varied from low (less than 80 m high) to medium (less than 150 m high) and ejected coarse material, such as bombs and lapilli. Spattering was observed above the N1 crater, while explosive activity at the CS crater area varied from medium to high (greater than 150 m high) and ejected coarse material. Intense spattering activity was observed for short periods on 6 March above the N1 crater. At approximately 0610 a lava overflow was reported around the N2 crater on 8 March, which then flowed into the October 2022 drainage. By 1700 the flow started to cool. A second overflow began at 1712 on 9 March and overlapped the previous flow. It had stopped by 2100. Material from both flows was deposited along the Sciara del Fuoco, though much of the activity was not visible in webcam images. On 11 March a lava overflow was observed at 0215 that overlapped the two previous flows in the October 2022 drainage. By late afternoon on 12 March, it had stopped.
During a field excursion on 16 March, scientists noted that a vent in the central crater area was degassing. Another vent showed occasional Strombolian activity that emitted ash and lapilli. During 1200-1430 low-to-medium intense activity was reported; the N1 crater emitted ash emissions and the N2 crater emitted both ash and coarse material. Some explosions also occurred in the CS crater area that ejected coarse material. The C crater in the CS crater area occasionally showed gas jetting and low intensity explosions on 17 and 22 March; no activity was observed at the S1 crater. Intense, longer periods of spattering were reported in the N1 crater on 19, 24, and 25 March. Around 2242 on 23 March a lava overflow began from the N1 crater that, after about an hour, began moving down the October 2022 drainage and flow along the Sciara del Fuoco (figure 258). Between 0200 and 0400 on 26 March the flow rate increased, which generated avalanches of material from collapses at the advancing flow front. By early afternoon, the flow began to cool. On 25 March at 1548 an explosive sequence began from one of the vents at S2 in the CS crater area (figure 258). Fine ash mixed with coarse material was ejected 300 m above the crater rim and drifted SSE. Some modest explosions around Vent C were detected at 1549 on 25 March, which included an explosion at 1551 that ejected coarse material. The entire explosive sequence lasted approximately three minutes.
During April explosions persisted in both the N and CS crater areas. Fine material was ejected less than 80 m above the N crater rim until 6 April, followed by ejection of coarser material. Fine material was also ejected less than 80 m above the CS crater rim. The C and S2 crater did not show significant eruptive activity. On 7 April an explosive sequence was detected in the CS crater area at 1203 (figure 259). The first explosion lasted approximately 18 seconds and ejected material 400 m above the crater rim, depositing pyroclastic material in the upper part of the Sciara del Fuoco. At 1204 a second, less intense explosion lasted approximately four seconds and deposited pyroclastic products outside the crater area and near Pizzo Sopra La Fossa. A third explosion at 1205 was mainly composed of ash that rose about 150 m above the crater and lasted roughly 20 seconds. A fourth explosion occurred at 1205 about 28 seconds after the third explosion and ejected a mixture of coarse and fine material about 200 m above the crater; the explosion lasted roughly seven seconds. Overall, the entire explosive sequence lasted about two minutes and 20 seconds. After the explosive sequence on 7 April, explosions in both the N and CS crater areas ejected material as high as 150 m above the crater.
On 21 April research scientists from INGV made field observations in the summit area of Stromboli, and some lapilli samples were collected. In the N crater area near the N1 crater, a small cone was observed with at least two active vents, one of which was characterized by Strombolian explosions. The other vent produced explosions that ejected ash and chunks of cooled lava. At the N2 crater at least one vent was active and frequently emitted ash. In the CS crater area, a small cone contained 2-3 degassing vents and a smaller, possible fissure area also showed signs of degassing close to the Pizzo Sopra La Fossa. In the S part of the crater, three vents were active: a small hornito was characterized by modest and rare explosions, a vent that intermittently produced weak Strombolian explosions, and a vent at the end of the terrace that produced frequent ash emissions. Near the S1 crater there was a hornito that generally emitted weak gas-and-steam emissions, sometimes associated with “gas rings”. On 22 April another field inspection was carried out that reported two large sliding surfaces on the Sciara del Fuoco that showed where blocks frequently descended toward the sea. A thermal anomaly was detected at 0150 on 29 April.
Geologic Background. Spectacular incandescent nighttime explosions at Stromboli have long attracted visitors to the "Lighthouse of the Mediterranean" in the NE Aeolian Islands. This volcano has lent its name to the frequent mild explosive activity that has characterized its eruptions throughout much of historical time. The small island is the emergent summit of a volcano that grew in two main eruptive cycles, the last of which formed the western portion of the island. The Neostromboli eruptive period took place between about 13,000 and 5,000 years ago. The active summit vents are located at the head of the Sciara del Fuoco, a prominent scarp that formed about 5,000 years ago due to a series of slope failures which extends to below sea level. The modern volcano has been constructed within this scarp, which funnels pyroclastic ejecta and lava flows to the NW. Essentially continuous mild Strombolian explosions, sometimes accompanied by lava flows, have been recorded for more than a millennium.
Information Contacts: Istituto Nazionale di Geofisica e Vulcanologia (INGV), Sezione di Catania, Piazza Roma 2, 95123 Catania, Italy, (URL: http://www.ct.ingv.it/en/); MIROVA (Middle InfraRed Observation of Volcanic Activity), a collaborative project between the Universities of Turin and Florence (Italy) supported by the Centre for Volcanic Risk of the Italian Civil Protection Department (URL: http://www.mirovaweb.it/); Hawai'i Institute of Geophysics and Planetology (HIGP) - MODVOLC Thermal Alerts System, School of Ocean and Earth Science and Technology (SOEST), Univ. of Hawai'i, 2525 Correa Road, Honolulu, HI 96822, USA (URL: http://modis.higp.hawaii.edu/); Copernicus Browser, Copernicus Data Space Ecosystem, European Space Agency (URL: https://dataspace.copernicus.eu/browser/).
Nishinoshima (Japan) — July 2023 Cite this Report
Nishinoshima
Japan
27.247°N, 140.874°E; summit elev. 100 m
All times are local (unless otherwise noted)
Small ash plumes and fumarolic activity during November 2022 through April 2023
Nishinoshima is a small island located about 1,000 km S of Tokyo in the Ogasawara Arc in Japan. The island is the summit of a massive submarine volcano that has prominent peaks to the S, W, and NE. Eruptions date back to 1973; the most recent eruption period began in October 2022 and was characterized by ash plumes and fumarolic activity (BGVN 47:12). This report describes ash plumes and fumarolic activity during November 2022 through April 2023 based on monthly reports from the Japan Meteorological Agency (JMA) monthly reports and satellite data.
The most recent eruptive activity prior to the reporting internal occurred on 12 October 2022, when an ash plume rose 3.5 km above the crater rim. An aerial observation conducted by the Japan Coast Guard (JCG) on 25 November reported that white fumaroles rose approximately 200 m above the central crater of a pyroclastic cone (figure 119), and multiple plumes were observed on the ESE flank of the cone. Discolored water ranging from reddish-brown to brown and yellowish-green were visible around the perimeter of the island (figure 119). No significant activity was reported in December.
During an overflight conducted by JCG on 25 January 2023 intermittent activity and small, blackish-gray plumes rose 900 m above the central part of the crater were observed (figure 120). The fumarolic zone of the E flank and base of the cone had expanded and emissions had intensified. Dark brown discolored water was visible around the perimeter of the island.
No significant activity was reported during February through March. Ash plumes at 1050 and 1420 on 11 April rose 1.9 km above the crater rim and drifted NW and N. These were the first ash plumes observed since 12 October 2022. On 14 April JCG carried out an overflight and reported that no further eruptive activity was visible, although white gas-and-steam plumes were visible from the central crater and rose 900 m high (figure 121). Brownish and yellow-green discolored water surrounded the island.
Intermittent low-to-moderate power thermal anomalies were recorded in the MIROVA graph (Middle InfraRed Observation of Volcanic Activity) during November 2022 through April 2023 (figure 123). A cluster of six to eight anomalies were detected during November while a smaller number were detected during the following months: two to three during December, one during mid-January 2023, one during February, five during March, and two during April. Thermal activity was also reflected in infrared satellite data at the summit crater, accompanied by occasional gas-and-steam plumes (figure 124).
Geologic Background. The small island of Nishinoshima was enlarged when several new islands coalesced during an eruption in 1973-74. Multiple eruptions that began in 2013 completely covered the previous exposed surface and continued to enlarge the island. The island is the summit of a massive submarine volcano that has prominent peaks to the S, W, and NE. The summit of the southern cone rises to within 214 m of the ocean surface 9 km SSE.
Information Contacts: Japan Meteorological Agency (JMA), 1-3-4 Otemachi, Chiyoda-ku, Tokyo 100-8122, Japan (URL: http://www.jma.go.jp/jma/indexe.html); MIROVA (Middle InfraRed Observation of Volcanic Activity), a collaborative project between the Universities of Turin and Florence (Italy) supported by the Centre for Volcanic Risk of the Italian Civil Protection Department (URL: http://www.mirovaweb.it/); Copernicus Browser, Copernicus Data Space Ecosystem, European Space Agency (URL: https://dataspace.copernicus.eu/browser/).
Karangetang (Indonesia) — July 2023 Cite this Report
Karangetang
Indonesia
2.781°N, 125.407°E; summit elev. 1797 m
All times are local (unless otherwise noted)
Lava flows, incandescent avalanches, and ash plumes during January-June 2023
Karangetang (also known as Api Siau), at the northern end of the island of Siau, Indonesia, contains five summit craters along a N-S line. More than 40 eruptions have been recorded since 1675; recent eruptions have included frequent explosive activity, sometimes accompanied by pyroclastic flows and lahars. Lava dome growth has occurred in the summit craters and collapses of lava flow fronts have produced pyroclastic flows. The two active summit craters are Kawah Dua (the N crater) and Kawah Utama (the S crater, also referred to as the “Main Crater”). The most recent eruption began in late November 2018 and has more recently consisted of weak thermal activity and gas-and-steam emissions (BGVN 48:01). This report updates activity characterized by lava flows, incandescent avalanches, and ash plumes during January through June 2023 using reports from Pusat Vulkanologi dan Mitigasi Bencana Geologi (PVMBG, also known as CVGHM, or the Center of Volcanology and Geological Hazard Mitigation), MAGMA Indonesia, the Darwin VAAC (Volcano Ash Advisory Center), and satellite data.
Activity during January was relatively low and mainly consisted of white gas-and-steam emissions that rose 25-150 m above Main Crater (S crater) and drifted in different directions. Incandescence was visible from the lava dome in Kawah Dua (the N crater). Weather conditions often prevented clear views of the summit. On 18 January the number of seismic signals that indicated avalanches of material began to increase. In addition, there were a total of 71 earthquakes detected during the month.
Activity continued to increase during the first week of February. Material from Main Crater traveled as far as 800 m down the Batuawang (S) and Batang (W) drainages and as far as 1 km W down the Beha (W) drainage on 4 February. On 6 February 43 earthquake events were recorded, and on 7 February, 62 events were recorded. White gas-and-steam emissions rose 25-250 m above both summit craters throughout the month. PVMBG reported an eruption began during the evening of 8 February around 1700. Photos showed incandescent material at Main Crater. Incandescent material had also descended the flank in at least two unconfirmed directions as far as 2 km from Main Crater, accompanied by ash plumes (figure 60). As a result, PVMBG increased the Volcano Alert Level (VAL) to 3 (the second highest level on a 1-4 scale).
Occasional nighttime webcam images showed three main incandescent lava flows of differing lengths traveling down the S, SW, and W flanks (figure 61). Incandescent rocks were visible on the upper flanks, possibly from ejected or collapsed material from the crater, and incandescence was the most intense at the summit. Based on analyses of satellite imagery and weather models, the Darwin VAAC reported that daily ash plumes during 16-20 February rose to 2.1-3 km altitude and drifted NNE, E, and SE. BNPB reported on 16 February that as many as 77 people were evacuated and relocated to the East Siau Museum. A webcam image taken at 2156 on 17 February possibly showed incandescent material descending the SE flank. Ash plumes rose to 2.1 km altitude and drifted SE during 22-23 February, according to the Darwin VAAC.
Incandescent avalanches of material and summit incandescence at Main Crater continued during March. White gas-and-steam emissions during March generally rose 25-150 m above the summit crater; on 31 March gas-and-steam emissions rose 200-400 m high. An ash plume rose to 2.4 km altitude and drifted S at 1710 on 9 March and a large thermal anomaly was visible in images taken at 0550 and 0930 on 10 March. Incandescent material was visible at the summit and on the flanks based on webcam images taken at 0007 and 2345 on 16 March, at 1828 on 17 March, at 1940 on 18 March, at 2311 on 19 March, and at 2351 on 20 March. Incandescence was most intense on 18 and 20 March and webcam images showed possible Strombolian explosions (figure 62). An ash plume rose to 2.4 km altitude and drifted SW on 18 March, accompanied by a thermal anomaly.
Summit crater incandescence at Main Crater and on the flanks persisted during April. Incandescent material at the S crater and on the flanks was reported at 0016 on 1 April. The lava flows had stopped by 1 April according to PVMBG, although incandescence was still visible up to 10 m high. Seismic signals indicating effusion decreased and by 6 April they were no longer detected. Incandescence was visible from both summit craters. On 26 April the VAL was lowered to 2 (the second lowest level on a 1-4 scale). White gas-and-steam emissions rose 25-200 m above the summit crater.
During May white gas-and-steam emissions generally rose 50-250 m above the summit, though it was often cloudy, which prevented clear views; on 21 May gas-and-steam emissions rose 50-400 m high. Nighttime N summit crater incandescence rose 10-25 m above the lava dome, and less intense incandescence was noted above Main Crater, which reached about 10 m above the dome. Sounds of falling rocks at Main Crater were heard on 15 May and the seismic network recorded 32 rockfall events in the crater on 17 May. Avalanches traveled as far as 1.5 km down the SW and S flanks, accompanied by rumbling sounds on 18 May. Incandescent material descending the flanks was captured in a webcam image at 2025 on 19 May (figure 63) and on 29 May; summit crater incandescence was observed in webcam images at 2332 on 26 May and at 2304 on 29 May. On 19 May the VAL was again raised to 3.
Occasional Main Crater incandescence was reported during June, as well as incandescent material on the flanks. White gas-and-steam emissions rose 10-200 m above the summit crater. Ash plumes rose to 2.1 km altitude and drifted SE and E during 2-4 June, according to the Darwin VAAC. Material on the flanks of Main Crater were observed at 2225 on 7 June, at 2051 on 9 June, at 0007 on 17 June, and at 0440 on 18 June. Webcam images taken on 21, 25, and 27 June showed incandescence at Main Crater and from material on the flanks.
MIROVA (Middle InfraRed Observation of Volcanic Activity) analysis of MODIS satellite data showed strong thermal activity during mid-February through March and mid-May through June, which represented incandescent avalanches and lava flows (figure 64). During April through mid-May the power of the anomalies decreased but frequent anomalies were still detected. Brief gaps in activity occurred during late March through early April and during mid-June. Infrared satellite images showed strong lava flows mainly affecting the SW and S flanks, accompanied by gas-and-steam emissions (figure 65). According to data recorded by the MODVOLC thermal algorithm, there were a total of 79 thermal hotspots detected: 28 during February, 24 during March, one during April, five during May, and 21 during June.
Geologic Background. Karangetang (Api Siau) volcano lies at the northern end of the island of Siau, about 125 km NNE of the NE-most point of Sulawesi. The stratovolcano contains five summit craters along a N-S line. It is one of Indonesia's most active volcanoes, with more than 40 eruptions recorded since 1675 and many additional small eruptions that were not documented (Neumann van Padang, 1951). Twentieth-century eruptions have included frequent explosive activity sometimes accompanied by pyroclastic flows and lahars. Lava dome growth has occurred in the summit craters; collapse of lava flow fronts have produced pyroclastic flows.
Information Contacts: Pusat Vulkanologi dan Mitigasi Bencana Geologi (PVMBG, also known as Indonesian Center for Volcanology and Geological Hazard Mitigation, CVGHM), Jalan Diponegoro 57, Bandung 40122, Indonesia (URL: http://www.vsi.esdm.go.id/); MAGMA Indonesia, Kementerian Energi dan Sumber Daya Mineral (URL: https://magma.esdm.go.id/v1); Badan Nasional Penanggulangan Bencana (BNPB), National Disaster Management Agency, Graha BNPB - Jl. Scout Kav.38, East Jakarta 13120, Indonesia (URL: http://www.bnpb.go.id/); Darwin Volcanic Ash Advisory Centre (VAAC), Bureau of Meteorology, Northern Territory Regional Office, PO Box 40050, Casuarina, NT 0811, Australia (URL: http://www.bom.gov.au/info/vaac/); MIROVA (Middle InfraRed Observation of Volcanic Activity), a collaborative project between the Universities of Turin and Florence (Italy) supported by the Centre for Volcanic Risk of the Italian Civil Protection Department (URL: http://www.mirovaweb.it/); Hawai'i Institute of Geophysics and Planetology (HIGP) - MODVOLC Thermal Alerts System, School of Ocean and Earth Science and Technology (SOEST), Univ. of Hawai'i, 2525 Correa Road, Honolulu, HI 96822, USA (URL: http://modis.higp.hawaii.edu/); Copernicus Browser, Copernicus Data Space Ecosystem, European Space Agency (URL: https://dataspace.copernicus.eu/browser/); IDN Times, Jl. Jend. Gatot Subroto Kav. 27 3rd Floor Kuningan, Jakarta, Indonesia 12950, Status of Karangetang Volcano in Sitaro Islands Increases (URL: https://sulsel.idntimes.com/news/indonesia/savi/status-gunung-api-karangetang-di-kepulauan-sitaro-meningkat?page=all).
Ahyi (United States) — July 2023 Cite this Report
Ahyi
United States
20.42°N, 145.03°E; summit elev. -75 m
All times are local (unless otherwise noted)
Intermittent hydroacoustic signals and discolored plumes during November 2022-June 2023
Ahyi seamount is a large, conical submarine volcano that rises to within 75 m of the ocean surface about 18 km SE of the island of Farallon de Pajaros in the Northern Marianas. The remote location of the seamount has made eruptions difficult to document, but seismic stations installed in the region confirmed an eruption in the vicinity in 2001. No new activity was detected until April-May 2014 when an eruption was detected by NOAA (National Oceanic and Atmospheric Administration) divers, hydroacoustic sensors, and seismic stations (BGVN 42:04). New activity was first detected on 15 November by hydroacoustic sensors that were consistent with submarine volcanic activity. This report covers activity during November 2022 through June 2023 based on daily and weekly reports from the US Geological Survey.
Starting in mid-October, hydroacoustic sensors at Wake Island (2.2 km E) recorded signals consistent with submarine volcanic activity, according to a report from the USGS issued on 15 November 2022. A combined analysis of the hydroacoustic signals and seismic stations located at Guam and Chichijima Island, Japan, suggested that the source of this activity was at or near the Ahyi seamount. After a re-analysis of a satellite image of the area that was captured on 6 November, USGS confirmed that there was no evidence of discoloration at the ocean surface. Few hydroacoustic and seismic signals continued through November, including on 18 November, which USGS suggested signified a decline or pause in unrest. A VONA (Volcano Observatory Notice for Aviation) reported that a discolored water plume was persistently visible in satellite data starting on 18 November (figure 6). Though clouds often obscured clear views of the volcano, another discolored water plume was captured in a satellite image on 26 November. The Aviation Color Code (ACC) was raised to Yellow (the second lowest level on a four-color scale) and the Volcano Alert Level (VAL) was raised to Advisory (the second lowest level on a four-level scale) on 29 November.
During December, occasional detections were recorded on the Wake Island hydrophone sensors and discolored water over the seamount remained visible. During 2-7, 10-12, and 16-31 December possible explosion signals were detected. A small area of discolored water was observed in high-resolution Sentinel-2 satellite images during 1-6 December (figure 7). High-resolution satellite images recorded discolored water plumes on 13 December that originated from the summit region; no observations indicated that activity breached the ocean surface. A possible underwater plume was visible in satellite images on 18 December, and during 19-20 December a definite but diffuse underwater plume located SSE from the main vent was reported. An underwater plume was visible in a satellite image taken on 26 December (figure 7).
Hydrophone sensors continued to detect signals consistent with possible explosions during 1-8 January 2023. USGS reported that the number of detections decreased during 4-5 January. The hydrophone sensors experienced a data outage that started at 0118 on 8 January and continued through 10 January, though according to USGS, possible explosions were recorded prior to the data outage and likely continued during the outage. A discolored water plume originating from the summit region was detected in a partly cloudy satellite image on 8 January. On 11-12 and 15-17 January possible explosion signals were recorded again. One small signal was detected during 22-23 January and several signals were recorded on 25 and 31 January. During 27-31 January a plume of discolored water was observed above the seamount in satellite imagery (figure 8).
Low levels of activity continued during February and March, based on data from pressure sensors on Wake Island. During 1 and 4-6 February activity was reported, and a submarine plume was observed on 4 February (figure 8). Possible explosion signals were detected during 7-8, 10, 13-14, and 24 February. During 1-2 and 3-5 March a plume of discolored water was observed in satellite imagery (figure 8). Almost continuous hydroacoustic signals were detected in remote pressure sensor data on Wake Island 2,270 km E from the volcano during 7-13 March. During 12-13 March water discoloration around the seamount was observed in satellite imagery, despite cloudy weather. By 14 March discolored water extended about 35 km, but no direction was noted. USGS reported that the continuous hydroacoustic signals detected during 13-14 March stopped abruptly on 14 March and no new detections were observed. Three 30 second hydroacoustic detections were reported during 17-19 March, but no activity was visible due to cloudy weather. A data outage was reported during 21-22 March, making pressure sensor data unavailable; a discolored water plume was, however, visible in satellite data. A possible underwater explosion signal was detected by pressure sensors at Wake Island on 26, 29, and 31 March, though the cause and origin of these events were unclear.
Similar low activity continued during April, May, and June. Several signals were detected during 1-3 April in pressure sensors at Wake Island. USGS suggested that these may be related to underwater explosions or earthquakes at the volcano, but no underwater plumes were visible in clear satellite images. The pressure sensors had data outages during 12-13 April and no data were recorded; no underwater plumes were visible in satellite images, although cloudy weather obscured most clear views. Eruptive activity was reported starting at 2210 on 21 May. On 22 May a discolored water plume that extended 4 km was visible in satellite images, though no direction was recorded. During 23-24 May some signals were detected by the underwater pressure sensors. Possible hydroacoustic signals were detected during 2-3 and 6-8 June. Multiple hydroacoustic signals were detected during 9-11 and 16-17 June, although no activity was visible in satellite images. One hydroacoustic signal was detected during 23-24 June, but there was some uncertainty about its association with volcanic activity. A single possible hydroacoustic signal was detected during 30 June to 1 July.
Geologic Background. Ahyi seamount is a large conical submarine volcano that rises to within 75 m of the ocean surface ~18 km SE of the island of Farallon de Pajaros in the northern Marianas. Water discoloration has been observed there, and in 1979 the crew of a fishing boat felt shocks over the summit area, followed by upwelling of sulfur-bearing water. On 24-25 April 2001 an explosive eruption was detected seismically by a station on Rangiroa Atoll, Tuamotu Archipelago. The event was well constrained (+/- 15 km) at a location near the southern base of Ahyi. An eruption in April-May 2014 was detected by NOAA divers, hydroacoustic sensors, and seismic stations.
Information Contacts: US Geological Survey, Volcano Hazards Program (USGS-VHP), 12201 Sunrise Valley Drive, Reston, VA, USA, https://volcanoes.usgs.gov/index.html; Copernicus Browser, Copernicus Data Space Ecosystem, European Space Agency (URL: https://dataspace.copernicus.eu/browser/).
Kadovar (Papua New Guinea) — June 2023 Cite this Report
Kadovar
Papua New Guinea
3.608°S, 144.588°E; summit elev. 365 m
All times are local (unless otherwise noted)
An ash plume and weak thermal anomaly during May 2023
Kadovar is a 2-km-wide island that is the emergent summit of a Bismarck Sea stratovolcano. It lies off the coast of New Guinea, about 25 km N of the mouth of the Sepik River. Prior to an eruption that began in 2018, a lava dome formed the high point of the volcano, filling an arcuate landslide scarp open to the S. Submarine debris-avalanche deposits occur to the S of the island. The current eruption began in January 2018 and has comprised lava effusion from vents at the summit and at the E coast; more recent activity has consisted of ash plumes, weak thermal activity, and gas-and-steam plumes (BGVN 48:02). This report covers activity during February through May 2023 using information from the Darwin Volcanic Ash Advisory Center (VAAC) and satellite data.
Activity during the reporting period was relatively low and mainly consisted of white gas-and-steam plumes that were visible in natural color satellite images on clear weather days (figure 67). According to a Darwin VAAC report, at 2040 on 6 May an ash plume rose to 4.6 km altitude and drifted W; by 2300 the plume had dissipated. MODIS satellite instruments using the MODVOLC thermal algorithm detected a single thermal hotspot on the SE side of the island on 7 May. Weak thermal activity was also detected in a satellite image on the E side of the island on 14 May, accompanied by a white gas-and-steam plume that drifted SE (figure 68).
Geologic Background. The 2-km-wide island of Kadovar is the emergent summit of a Bismarck Sea stratovolcano of Holocene age. It is part of the Schouten Islands, and lies off the coast of New Guinea, about 25 km N of the mouth of the Sepik River. Prior to an eruption that began in 2018, a lava dome formed the high point of the andesitic volcano, filling an arcuate landslide scarp open to the south; submarine debris-avalanche deposits occur in that direction. Thick lava flows with columnar jointing forms low cliffs along the coast. The youthful island lacks fringing or offshore reefs. A period of heightened thermal phenomena took place in 1976. An eruption began in January 2018 that included lava effusion from vents at the summit and at the E coast.
Information Contacts: Darwin Volcanic Ash Advisory Centre (VAAC), Bureau of Meteorology, Northern Territory Regional Office, PO Box 40050, Casuarina, NT 0811, Australia (URL: http://www.bom.gov.au/info/vaac/); Hawai'i Institute of Geophysics and Planetology (HIGP) - MODVOLC Thermal Alerts System, School of Ocean and Earth Science and Technology (SOEST), Univ. of Hawai'i, 2525 Correa Road, Honolulu, HI 96822, USA (URL: http://modis.higp.hawaii.edu/); Copernicus Browser, Copernicus Data Space Ecosystem, European Space Agency (URL: https://dataspace.copernicus.eu/browser/).
San Miguel (El Salvador) — June 2023 Cite this Report
San Miguel
El Salvador
13.434°N, 88.269°W; summit elev. 2130 m
All times are local (unless otherwise noted)
Small gas-and-ash explosions during March and May 2023
San Miguel in El Salvador is a broad, deep crater complex that has been frequently modified by eruptions recorded since the early 16th century and consists of the summit known locally as Chaparrastique. Flank eruptions have produced lava flows that extended to the N, NE, and SE during the 17-19th centuries. The most recent activity has consisted of minor ash eruptions from the summit crater. The current eruption period began in November 2022 and has been characterized by frequent phreatic explosions, gas-and-ash emissions, and sulfur dioxide plumes (BGVN 47:12). This report describes small gas-and-ash explosions during December 2022 through May 2023 based on special reports from the Ministero de Medio Ambiente y Recursos Naturales (MARN).
Activity has been relatively low since the last recorded explosions on 29 November 2022. Seismicity recorded by the San Miguel Volcano Station (VSM) located on the N flank at 1.7 km elevation had decreased by 7 December. Sulfur dioxide gas measurements taken with DOAS (Differential Optical Absorption Spectroscopy) mobile equipment were below typical previously recorded values: 300 tons per day (t/d). During December, small explosions were recorded by the seismic network and manifested as gas-and-steam emissions.
Gas-and-ash explosions in the crater occurred during January 2023, which were recorded by the seismic network. Sulfur dioxide values remained low, between 300-400 t/d through 10 March. At 0817 on 14 January a gas-and-ash emission was visible in webcam images, rising just above the crater rim. Some mornings during February, small gas-and-steam plumes were visible in the crater. On 7 March at 2252 MARN noted an increase in degassing from the central crater; gas emissions were constantly observed through the early morning hours on 8 March. During the early morning of 8 March through the afternoon on 9 March, 12 emissions were registered, some accompanied by ash. The last gas-and-ash emission was recorded at 1210 on 9 March; very fine ashfall was reported in El Tránsito (10 km S), La Morita (6 km W), and La Piedrita (3 km W). The smell of sulfur was reported in Piedra Azul (5 km SW). On 16 March MARN reported that gas-and-steam emissions decreased.
Low degassing and very low seismicity were reported during April; no explosions have been detected between 9 March and 27 May. The sulfur dioxide emissions remained between 350-400 t/d; during 13-20 April sulfur dioxide values fluctuated between 30-300 t/d. Activity remained low through most of May; on 23 May seismicity increased. An explosion was detected at 1647 on 27 May generated a gas-and-ash plume that rose 700 m high (figure 32); a decrease in seismicity and gas emissions followed. The DOAS station installed on the W flank recorded sulfur dioxide values that reached 400 t/d on 27 May; subsequent measurements showed a decrease to 268 t/d on 28 May and 100 t/d on 29 May.
Geologic Background. The symmetrical cone of San Miguel, one of the most active volcanoes in El Salvador, rises from near sea level to form one of the country's most prominent landmarks. A broad, deep, crater complex that has been frequently modified by eruptions recorded since the early 16th century caps the truncated unvegetated summit, also known locally as Chaparrastique. Flanks eruptions of the basaltic-andesitic volcano have produced many lava flows, including several during the 17th-19th centuries that extended to the N, NE, and SE. The SE-flank flows are the largest and form broad, sparsely vegetated lava fields crossed by highways and a railroad skirting the base of the volcano. Flank vent locations have migrated higher on the edifice during historical time, and the most recent activity has consisted of minor ash eruptions from the summit crater.
Information Contacts: Ministero de Medio Ambiente y Recursos Naturales (MARN), Km. 5½ Carretera a Nueva San Salvador, Avenida las Mercedes, San Salvador, El Salvador (URL: http://www.snet.gob.sv/ver/vulcanologia).
Semisopochnoi (United States) — June 2023 Cite this Report
Semisopochnoi
United States
51.93°N, 179.58°E; summit elev. 1221 m
All times are local (unless otherwise noted)
Occasional explosions, ash deposits, and gas-and-steam plumes during December 2022-May 2023
Semisopochnoi is located in the western Aleutians, is 20-km-wide at sea level, and contains an 8-km-wide caldera. The three-peaked Mount Young (formerly Cerberus) was constructed within the caldera during the Holocene. Each of these peaks contains a summit crater; the lava flows on the N flank appear younger than those on the S side. The current eruption period began in early February 2021 and has more recently consisted of intermittent explosions and ash emissions (BGVN 47:12). This report updates activity during December 2022 through May 2023 using daily, weekly, and special reports from the Alaska Volcano Observatory (AVO). AVO monitors the volcano using local seismic and infrasound sensors, satellite data, web cameras, and remote infrasound and lightning networks.
Activity during most of December 2022 was relatively quiet; according to AVO no eruptive or explosive activity was observed since 7 November 2022. Intermittent tremor and occasional small earthquakes were observed in geophysical data. Continuous gas-and-steam emissions were observed from the N crater of Mount Young in webcam images on clear weather days (figure 25). On 24 December, there was a slight increase in earthquake activity and several small possible explosion signals were detected in infrasound data. Eruptive activity resumed on 27 December at the N crater of Mount Young; AVO issued a Volcano Activity Notice (VAN) that reported minor ash deposits on the flanks of Mount Young that extended as far as 1 km from the vent, according to webcam images taken during 27-28 December (figure 26). No ash plumes were observed in webcam or satellite imagery, but a persistent gas-and-steam plume that might have contained some ash rose to 1.5 km altitude. As a result, AVO raised the Aviation Color Code (ACC) to Orange (the second highest level on a four-color scale) and the Volcano Alert Level (VAL) to Watch (the second highest level on a four-level scale). Possible explosions were detected during 21 December 2022 through 1 January 2023 and seismic tremor was recorded during 30-31 December.
During January 2023 eruptive activity continued at the active N crater of Mount Young. Minor ash deposits were observed on the flanks, extending about 2 km SSW, based on webcam images from 1 and 3 January. A possible explosion occurred during 1-2 January based on elevated seismicity recorded on local seismometers and an infrasound signal recorded minutes later by an array at Adak. Though no ash plumes were observed in webcam or satellite imagery, a persistent gas-and-steam plume rose to 1.5 km altitude that might have carried minor traces of ash. Ash deposits were accompanied by periods of elevated seismicity and infrasound signals from the local geophysical network, which AVO reported were likely due to weak explosive activity. Low-level explosive activity was also detected during 2-3 January, with minor gas-and-steam emissions and a new ash deposit that was visible in webcam images. Low-level explosive activity was detected in geophysical data during 4-5 January, with elevated seismicity and infrasound signals observed on local stations. Volcanic tremor was detected during 7-9 January and very weak explosive activity was detected in seismic and infrasound data on 9 January. Weak seismic and infrasound signals were recorded on 17 January, which indicated minor explosive activity, but no ash emissions were observed in clear webcam images; a gas-and-steam plume continued to rise to 1.5 km altitude. During 29-30 January, ash deposits near the summit were observed on fresh snow, according to webcam images.
The active N cone at Mount Young continued to produce a gas-and-steam plume during February, but no ash emissions or explosive events were detected. Seismicity remained elevated with faint tremor during early February. Gas-and-steam emissions from the N crater were observed in clear webcam images on 11-13 and 16 February; no explosive activity was detected in seismic, infrasound, or satellite data. Seismicity has also decreased, with no significant seismic tremor observed since 25 January. Therefore, the ACC was lowered to Yellow (the second lowest level on a four-color scale) and the VAL was lowered to Advisory (the second lowest level on a four-color scale) on 22 February.
Gas-and-steam emissions persisted during March from the N cone of Mount Young, based on clear webcam images. A few brief episodes of weak tremor were detected in seismic data, although seismicity decreased over the month. A gas-and-steam plume detected in satellite data extended 150 km on 18 March. Low-level ash emissions from the N cone at Mount Young were observed in several webcam images during 18-19 March, in addition to small explosions and volcanic tremor. The ACC was raised to Orange and the VAL increased to Watch on 19 March. A small explosion was detected in seismic and infrasound data on 21 March.
Low-level unrest continued during April, although cloudy weather often obscured views of the summit; periods of seismic tremor and local earthquakes were recorded. During 3-4 April a gas-and-steam plume was visible traveling more than 200 km overnight; no ash was evident in the plume, according to AVO. A gas-and-steam plume was observed during 4-6 April that extended 400 km but did not seem to contain ash. Small explosions were detected in seismic and infrasound data on 5 April. Occasional clear webcam images showed continuing gas-and-steam emissions rose from Mount Young, but no ash deposits were observed on the snow. On 19 April small explosions and tremor were detected in seismic and infrasound data. A period of seismic tremor was detected during 22-25 April, with possible weak explosions on 25 April. Ash deposits were visible near the crater rim, but it was unclear if these deposits were recent or due to older deposits.
Occasional small earthquakes were recorded during May, but there were no signs of explosive activity seen in geophysical data. Gas-and-steam emissions continued from the N crater of Mount Young, based on webcam images, and seismicity remained slightly elevated. A new, light ash deposit was visible during the morning of 5 May on fresh snow on the NW flank of Mount Young. During 10 May periods of volcanic tremor were observed. The ACC was lowered to Yellow and the VAL to Advisory on 17 May due to no additional evidence of activity.
Geologic Background. Semisopochnoi, the largest subaerial volcano of the western Aleutians, is 20 km wide at sea level and contains an 8-km-wide caldera. It formed as a result of collapse of a low-angle, dominantly basaltic volcano following the eruption of a large volume of dacitic pumice. The high point of the island is Anvil Peak, a double-peaked late-Pleistocene cone that forms much of the island's northern part. The three-peaked Mount Cerberus (renamed Mount Young in 2023) was constructed within the caldera during the Holocene. Each of the peaks contains a summit crater; lava flows on the N flank appear younger than those on the south side. Other post-caldera volcanoes include the symmetrical Sugarloaf Peak SSE of the caldera and Lakeshore Cone, a small cinder cone at the edge of Fenner Lake in the NE part of the caldera. Most documented eruptions have originated from Young, although Coats (1950) considered that both Sugarloaf and Lakeshore Cone could have been recently active.
Information Contacts: Alaska Volcano Observatory (AVO), a cooperative program of a) U.S. Geological Survey, 4200 University Drive, Anchorage, AK 99508-4667 USA (URL: https://avo.alaska.edu/), b) Geophysical Institute, University of Alaska, PO Box 757320, Fairbanks, AK 99775-7320, USA, and c) Alaska Division of Geological & Geophysical Surveys, 794 University Ave., Suite 200, Fairbanks, AK 99709, USA (URL: http://dggs.alaska.gov/).
Ebeko
Russia
50.686°N, 156.014°E; summit elev. 1103 m
All times are local (unless otherwise noted)
Continued explosions, ash plumes, and ashfall during October 2022-May 2023
Ebeko, located on the N end of Paramushir Island in the Kuril Islands, consists of three summit craters along a SSW-NNE line at the northern end of a complex of five volcanic cones. Eruptions date back to the late 18th century and have been characterized as small-to-moderate explosions from the summit crater, accompanied by intense fumarolic activity. The current eruption period began in June 2022 and has recently consisted of frequent explosions, ash plumes, and thermal activity (BGVN 47:10). This report covers similar activity during October 2022 through May 2023, based on information from the Kamchatka Volcanic Eruptions Response Team (KVERT) and satellite data.
Activity during October consisted of explosive activity, ash plumes, and occasional thermal anomalies. Visual data by volcanologists from Severo-Kurilsk showed explosions producing ash clouds up to 2.1-3 km altitude which drifted E, N, NE, and SE during 1-8, 10, 16, and 18 October. KVERT issued several Volcano Observatory Notices for Aviation (VONA) on 7, 13-15, and 27 October 2022, stating that explosions generated ash plumes that rose to 2.3-4 km altitude and drifted 5 km E, NE, and SE. Ashfall was reported in Severo-Kurilsk (Paramushir Island, about 7 km E) on 7 and 13 October. Satellite data showed a thermal anomaly over the volcano on 15-16 October. Visual data showed ash plumes rising to 2.5-3.6 km altitude on 22, 25-29, and 31 October and moving NE due to constant explosions.
Similar activity continued during November, with explosions, ash plumes, and ashfall occurring. KVERT issued VONAs on 1-2, 4, 6-7, 9, 13, and 16 November that reported explosions and resulting ash plumes that rose to 1.7-3.6 km altitude and drifted 3-5 km SE, ESE, E, and NE. On 1 November ash plumes extended as far as 110 km SE. On 5, 8, 12, and 24-25 November explosions and ash plumes rose to 2-3.1 km altitude and drifted N and E. Ashfall was observed in Severo-Kurilsk on 7 and 16 November. A thermal anomaly was visible during 1-4, 16, and 20 November. Explosions during 26 November rose as high as 2.7 km altitude and drifted NE (figure 45).
Explosions and ash plumes continued to occur in December. During 1-2 and 4 December volcanologists from Severo-Kurilsk observed explosions that sent ash to 1.9-2.5 km altitude and drifted NE and SE (figure 46). VONAs were issued on 5, 9, and 16 December reporting that explosions generated ash plumes rising to 1.9 km, 2.6 km, and 2.4 km altitude and drifted 5 km SE, E, and NE, respectively. A thermal anomaly was visible in satellite imagery on 16 December. On 18 and 27-28 December explosions produced ash plumes that rose to 2.5 km altitude and drifted NE and SE. On 31 December an ash plume rose to 2 km altitude and drifted NE.
Explosions continued during January 2023, based on visual observations by volcanologists from Severo-Kurilsk. During 1-7 January explosions generated ash plumes that rose to 4 km altitude and drifted NE, E, W, and SE. According to VONAs issued by KVERT on 2, 4, 10, and 23 January, explosions produced ash plumes that rose to 2-4 km altitude and drifted 5 km N, NE, E, and ENE; the ash plume that rose to 4 km altitude occurred on 10 January (figure 47). Satellite data showed a thermal anomaly during 3-4, 10, 13, 16, 21, 22, and 31 January. KVERT reported that an ash cloud on 4 January moved 12 km NE. On 6 and 9-11 January explosions sent ash plumes to 4.5 km altitude and drifted W and ESE. On 13 January an ash plume rose to 3 km altitude and drifted SE. During 20-24 January ash plumes from explosions rose to 3.7 km altitude and drifted SE, N, and NE. On 21 January the ash plume drifted as far as 40 km NE. During 28-29 and 31 January and 1 February ash plumes rose to 4 km altitude and drifted NE.
During February, explosions, ash plumes, and ashfall were reported. During 1, 4-5 and 7-8 February explosions generated ash plumes that rose to 4.5 km altitude and drifted E and NE; ashfall was observed on 5 and 8 February. On 6 February an explosion produced an ash plume that rose to 3 km altitude and drifted 7 km E, causing ashfall in Severo-Kurilsk. A thermal anomaly was visible in satellite data on 8, 9, 13, and 21 February. Explosions on 9 and 12-13 February produced ash plumes that rose to 4 km altitude and drifted E and NE; the ash cloud on 12 February extended as far as 45 km E. On 22 February explosions sent ash to 3 km altitude that drifted E. During 24 and 26-27 February ash plumes rose to 4 km altitude and drifted E. On 28 February an explosion sent ash to 2.5-3 km altitude and drifted 5 km E; ashfall was observed in Severo-Kurilsk.
Activity continued during March; visual observations showed that explosions generated ash plumes that rose to 3.6 km altitude on 3, 5-7, and 9-12 March and drifted E, NE, and NW. Thermal anomalies were visible on 10, 13, and 29-30 March in satellite imagery. On 18, 21-23, 26, and 29-30 March explosions produced ash plumes that rose to 2.8 km altitude and drifted NE and E; the ash plumes during 22-23 March extended up to 76 km E. A VONA issued on 21 March reported an explosion that produced an ash plume that rose to 2.8 km altitude and drifted 5 km E. Another VONA issued on 23 March reported that satellite data showed an ash plume rising to 3 km altitude and drifted 14 km E.
Explosions during April continued to generate ash plumes. On 1 and 4 April an ash plume rose to 2.8-3.5 km altitude and drifted SE and NE. A thermal anomaly was visible in satellite imagery during 1-6 April. Satellite data showed ash plumes and clouds rising to 2-3 km altitude and drifting up to 12 km SW and E on 3 and 6 April (figure 48). KVERT issued VONAs on 3, 5, 14, 16 April describing explosions that produced ash plumes rising to 3 km, 3.5 km, 3.5 km, and 3 km altitude and drifting 5 km S, 5 km NE and SE, 72 km NNE, and 5 km NE, respectively. According to satellite data, the resulting ash cloud from the explosion on 14 April was 25 x 7 km in size and drifted 72-104 km NNE during 14-15 April. According to visual data by volcanologists from Severo-Kurilsk explosions sent ash up to 3.5 km altitude that drifted NE and E during 15-16, 22, 25-26, and 29 April.
The explosive eruption continued during May. Explosions during 3-4, 6-7, and 9-10 May generated ash plumes that rose to 4 km altitude and drifted SW and E. Satellite data showed a thermal anomaly on 3, 9, 13-14, and 24 May. During 12-16, 23-25, and 27-28 May ash plumes rose to 3.5 km altitude and drifted in different directions due to explosions. Two VONA notices were issued on 16 and 25 May, describing explosions that generated ash plumes rising to 3 km and 3.5 km altitude, respectively and extending 5 km E. The ash cloud on 25 May drifted 75 km SE.
Thermal activity in the summit crater, occasionally accompanied by ash plumes and ash deposits on the SE and E flanks due to frequent explosions, were visible in infrared and true color satellite images (figure 49).
Geologic Background. The flat-topped summit of the central cone of Ebeko volcano, one of the most active in the Kuril Islands, occupies the northern end of Paramushir Island. Three summit craters located along a SSW-NNE line form Ebeko volcano proper, at the northern end of a complex of five volcanic cones. Blocky lava flows extend west from Ebeko and SE from the neighboring Nezametnyi cone. The eastern part of the southern crater contains strong solfataras and a large boiling spring. The central crater is filled by a lake about 20 m deep whose shores are lined with steaming solfataras; the northern crater lies across a narrow, low barrier from the central crater and contains a small, cold crescentic lake. Historical activity, recorded since the late-18th century, has been restricted to small-to-moderate explosive eruptions from the summit craters. Intense fumarolic activity occurs in the summit craters, on the outer flanks of the cone, and in lateral explosion craters.
Information Contacts: Kamchatka Volcanic Eruptions Response Team (KVERT), Far Eastern Branch, Russian Academy of Sciences, 9 Piip Blvd., Petropavlovsk-Kamchatsky, 683006, Russia (URL: http://www.kscnet.ru/ivs/kvert/); MIROVA (Middle InfraRed Observation of Volcanic Activity), a collaborative project between the Universities of Turin and Florence (Italy) supported by the Centre for Volcanic Risk of the Italian Civil Protection Department (URL: http://www.mirovaweb.it/); Copernicus Browser, Copernicus Data Space Ecosystem, European Space Agency (URL: https://dataspace.copernicus.eu/browser/).
Home Reef
Tonga
18.992°S, 174.775°W; summit elev. -10 m
All times are local (unless otherwise noted)
Discolored plumes continued during November 2022-April 2023
Home Reef is a submarine volcano located in the central Tonga islands between Lateiki (Metis Shoal) and Late Island. The first recorded eruption occurred in the mid-19th century, when an ephemeral island formed. An eruption in 1984 produced a 12-km-high eruption plume, a large volume of floating pumice, and an ephemeral island 500 x 1,500 m wide, with cliffs 30-50 m high that enclosed a water-filled crater. Another island-forming eruption in 2006 produced widespread pumice rafts that drifted as far as Australia; by 2008 the island had eroded below sea level. The previous eruption occurred during October 2022 and was characterized by a new island-forming eruption, lava effusion, ash plumes, discolored water, and gas-and-steam plumes (BGVN 47:11). This report covers discolored water plumes during November 2022 through April 2023 using satellite data.
Discolored plumes continued during the reporting period and were observed in true color satellite images on clear weather days. Satellite images show light green-yellow discolored water extending W on 8 and 28 November 2022 (figure 31), and SW on 18 November. Light green-yellow plumes extended W on 3 December, S on 13 December, SW on 18 December, and W and S on 23 December (figure 31). On 12 January 2023 discolored green-yellow plumes extended to the NE, E, SE, and N. The plume moved SE on 17 January and NW on 22 January. Faint discolored water in February was visible moving NE on 1 February. A discolored plume extended NW on 8 and 28 March and NW on 13 March (figure 31). During April, clear weather showed green-blue discolored plumes moving S on 2 April, W on 7 April, and NE and S on 12 April. A strong green-yellow discolored plume extended E and NE on 22 April for several kilometers (figure 31).
Geologic Background. Home Reef, a submarine volcano midway between Metis Shoal and Late Island in the central Tonga islands, was first reported active in the mid-19th century, when an ephemeral island formed. An eruption in 1984 produced a 12-km-high eruption plume, large amounts of floating pumice, and an ephemeral 500 x 1,500 m island, with cliffs 30-50 m high that enclosed a water-filled crater. In 2006 an island-forming eruption produced widespread dacitic pumice rafts that drifted as far as Australia. Another island was built during a September-October 2022 eruption.
Information Contacts: Copernicus Browser, Copernicus Data Space Ecosystem, European Space Agency (URL: https://dataspace.copernicus.eu/browser/).
Ambae
Vanuatu
15.389°S, 167.835°E; summit elev. 1496 m
All times are local (unless otherwise noted)
New lava flow, ash plumes, and sulfur dioxide plumes during February-May 2023
Ambae, also known as Aoba, is a large basaltic shield volcano in Vanuatu. A broad pyroclastic cone containing three crater lakes (Manaro Ngoru, Voui, and Manaro Lakua) is located at the summit within the youngest of at least two nested calderas. Periodic phreatic and pyroclastic explosions have been reported since the 16th century. A large eruption more than 400 years ago resulted in a volcanic cone within the summit crater that is now filled by Lake Voui; the similarly sized Lake Manaro fills the western third of the caldera. The previous eruption ended in August 2022 that was characterized by gas-and-steam and ash emissions and explosions of wet tephra (BGVN 47:10). This report covers a new eruption during February through May 2023 that consisted of a new lava flow, ash plumes, and sulfur dioxide emissions, using information from the Vanuatu Meteorology and Geo-Hazards Department (VMGD) and satellite data.
During the reporting period, the Alert Level remained at a 2 (on a scale of 0-5), which has been in place since December 2021. Activity during October 2022 through March 2023 remained relatively low and mostly consisted of gas-and-steam emissions in Lake Voui. VMGD reported that at 1300 on 15 November a satellite image captured a strong amount of sulfur dioxide rising above the volcano (figure 99), and that seismicity slightly increased. The southern and northern part of the island reported a strong sulfur dioxide smell and heard explosions. On 20 February 2023 a gas-and-ash plume rose 1.3 km above the summit and drifted SSW, according to a webcam image (figure 100). Gas-and-steam and possibly ash emissions continued on 23 February and volcanic earthquakes were recorded by the seismic network.
During April, volcanic earthquakes and gas-and-steam and ash emissions were reported from the cone in Lake Voui. VMGD reported that activity increased during 5-7 April; high gas-and-steam and ash plumes were visible, accompanied by nighttime incandescence. According to a Wellington VAAC report, a low-level ash plume rose as high as 2.5 km above the summit and drifted W and SW on 5 April, based on satellite imagery. Reports in Saratamata stated that a dark ash plume drifted to the WSW, but no loud explosion was heard. Webcam images from 2100 showed incandescence above the crater and reflected in the clouds. According to an aerial survey, field observations, and satellite data, water was no longer present in the lake. A lava flow was reported effusing from the vent and traveling N into the dry Lake Voui, which lasted three days. The next morning at 0745 on 6 April a gas-and-steam and ash plume rose 5.4 km above the summit and drifted ESE, based on information from VMGD (figure 101). The Wellington VAAC also reported that light ashfall was observed on the island. Intermittent gas-and-steam and ash emissions were visible on 7 April, some of which rose to an estimated 3 km above the summit and drifted E. Webcam images during 0107-0730 on 7 April showed continuing ash emissions. A gas-and-steam and ash plume rose 695 m above the summit crater at 0730 on 19 April and drifted ESE, based on a webcam image (figure 102).
According to visual and infrared satellite data, water was visible in Lake Voui as late as 24 March 2023 (figure 103). The vent in the caldera showed a gas-and-steam plume drifted SE. On 3 April thermal activity was first detected, accompanied by a gas-and-ash plume that drifted W (figure 103). The lava flow moved N within the dry lake and was shown cooling by 8 April. By 23 April much of the water in the lake had returned. Occasional sulfur dioxide plumes were detected by the TROPOMI instrument on the Sentinel-5P satellite that exceeded 2 Dobson Units (DU) and drifted in different directions (figure 104).
Geologic Background. The island of Ambae, also known as Aoba, is a massive 2,500 km3 basaltic shield that is the most voluminous volcano of the New Hebrides archipelago. A pronounced NE-SW-trending rift zone with numerous scoria cones gives the 16 x 38 km island an elongated form. A broad pyroclastic cone containing three crater lakes (Manaro Ngoru, Voui, and Manaro Lakua) is located at the summit within the youngest of at least two nested calderas, the largest of which is 6 km in diameter. That large central edifice is also called Manaro Voui or Lombenben volcano. Post-caldera explosive eruptions formed the summit craters about 360 years ago. A tuff cone was constructed within Lake Voui (or Vui) about 60 years later. The latest known flank eruption, about 300 years ago, destroyed the population of the Nduindui area near the western coast.
Information Contacts: Geo-Hazards Division, Vanuatu Meteorology and Geo-Hazards Department (VMGD), Ministry of Climate Change Adaptation, Meteorology, Geo-Hazards, Energy, Environment and Disaster Management, Private Mail Bag 9054, Lini Highway, Port Vila, Vanuatu (URL: http://www.vmgd.gov.vu/, https://www.facebook.com/VanuatuGeohazardsObservatory/); Wellington Volcanic Ash Advisory Centre (VAAC), Meteorological Service of New Zealand Ltd (MetService), PO Box 722, Wellington, New Zealand (URL: http://www.metservice.com/vaac/, http://www.ssd.noaa.gov/VAAC/OTH/NZ/messages.html); MIROVA (Middle InfraRed Observation of Volcanic Activity), a collaborative project between the Universities of Turin and Florence (Italy) supported by the Centre for Volcanic Risk of the Italian Civil Protection Department (URL: http://www.mirovaweb.it/); Global Sulfur Dioxide Monitoring Page, Atmospheric Chemistry and Dynamics Laboratory, NASA Goddard Space Flight Center (NASA/GSFC), 8800 Greenbelt Road, Goddard, Maryland, USA (URL: https://so2.gsfc.nasa.gov/); Copernicus Browser, Copernicus Data Space Ecosystem, European Space Agency (URL: https://dataspace.copernicus.eu/browser/).
Search Bulletin Archive by Publication Date
Select a month and year from the drop-downs and click "Show Issue" to have that issue displayed in this tab.
The default month and year is the latest issue available.
Bulletin of the Global Volcanism Network - Volume 21, Number 01 (January 1996)
Managing Editor: Richard Wunderman
Additional Reports (Unknown)
Japan: Acoustic signals in late January; source not locatable
Aira (Japan)
Explosive eruptions and ashfalls continue
Akademia Nauk (Russia)
Explosive eruption from Karymsky Lake and new crater at summit
Arenal (Costa Rica)
Small Strombolian eruptions continue
Fukutoku-Oka-no-Ba (Japan)
Discolored seawater observed for the second time in three months
Irazu (Costa Rica)
Dark yellow crater-lake water; discrete 7-hour seismic swarm
Karangetang (Indonesia)
Small ash plumes, incandescent ejecta, and increased seismicity
Karymsky (Russia)
Explosive eruption from Karymsky Lake and new crater at summit
Kilauea (United States)
Eruptive pulse on 1 February almost results in a summit eruption
Krakatau (Indonesia)
Steaming and fumarolic activity; cone description
Kujusan (Japan)
Earthquake swarm and eruptions on 13-14 January; continuous plume
Lokon-Empung (Indonesia)
Variable seismicity and minor vapor emissions
Merapi (Indonesia)
Increased seismicity related to lava avalanches and rockfalls
Minami-Hiyoshi (Japan)
Discolored seawater plume 6 km long
Nyamulagira (DR Congo)
High levels of seismicity during September 1995
Nyiragongo (DR Congo)
High levels of seismicity during September 1995
Poas (Costa Rica)
Seismically active with new fumaroles and some cross-crater deformation
Popocatepetl (Mexico)
High steam column and variable fumarolic activity
Rabaul (Papua New Guinea)
Explosive eruptions from Tavurvur
Rincon de la Vieja (Costa Rica)
Eruption on 11-13 November followed by decreasing seismicity
Ruapehu (New Zealand)
Geochemical analyses of lake water; record glacial retreat continues
Semeru (Indonesia)
Explosions, pyroclastic flows, and lava avalanches continue
Shishaldin (United States)
Steam plumes; thermal anomaly on satellite images
Soputan (Indonesia)
Vapor emission and intense tremor; possible high ash
Soufriere Hills (United Kingdom)
Dome growth continues
Suwanosejima (Japan)
Small eruptions in January; nine explosions throughout 1995
Turrialba (Costa Rica)
Weak fumarolic activity
Additional Reports (Unknown) — January 1996 Cite this Report
Additional Reports
Unknown
Unknown, Unknown; summit elev. m
All times are local (unless otherwise noted)
Japan: Acoustic signals in late January; source not locatable
The JMA Ocean Bottom Seismograph off the Boso Peninsula (E of Tokyo) detected T-phase-like signals after 22 January, and clear T-phase signals on 27 January (figure 1). According to tentative analyses of arrival times at the detectors, the signals were interpreted to have propagated from the S. As of mid-February, JMA had not determined a specific source for these signals. However, discolored seawater was observed above two submarine volcanoes in the Volcano Islands during January: Minami-Hiyoshi on 12 January, and Fukutoku-okanoba on 12, 22, and 23 January.
Geologic Background. Reports of floating pumice from an unknown source, hydroacoustic signals, or possible eruption plumes seen in satellite imagery.
Information Contacts: Volcanological Division, Seismological and Volcanological Department, Japan Meteorological Agency (JMA), 1-3-4 Ote-machi, Chiyoda-ku, Tokyo 100 Japan.
Aira
Japan
31.5772°N, 130.6589°E; summit elev. 1117 m
All times are local (unless otherwise noted)
Explosive eruptions and ashfalls continue
Minami-dake crater was slightly active throughout January. The monthly total number of eruptions was 60, including 42 explosive ones. At the seismic station 2.3 km NW of Minami-dake crater (Station B), 601 earthquakes and 684 tremors were recorded. The highest ash plume of the month rose 2,300 m above the summit crater on the 21st. Ashfall measured at the Kagoshima Local Meteorological Observatory, 10 km W form the crater, was 41 g/m2.
The VRC noted that there were more than 200 eruptions in 1995; total amount of erupted material was estimated at 3-4 million tons by the Sakurajima Volcanological Observatory, Kyoto University. The latter has been observing continuous uplift on the N side of the volcano, implying accumulation of magma beneath the volcano.
Geologic Background. The Aira caldera in the northern half of Kagoshima Bay contains the post-caldera Sakurajima volcano, one of Japan's most active. Eruption of the voluminous Ito pyroclastic flow accompanied formation of the 17 x 23 km caldera about 22,000 years ago. The smaller Wakamiko caldera was formed during the early Holocene in the NE corner of the caldera, along with several post-caldera cones. The construction of Sakurajima began about 13,000 years ago on the southern rim and built an island that was joined to the Osumi Peninsula during the major explosive and effusive eruption of 1914. Activity at the Kitadake summit cone ended about 4,850 years ago, after which eruptions took place at Minamidake. Frequent eruptions since the 8th century have deposited ash on the city of Kagoshima, located across Kagoshima Bay only 8 km from the summit. The largest recorded eruption took place during 1471-76.
Information Contacts: Volcanological Division, Seismological and Volcanological Department, Japan Meteorological Agency (JMA), 1-3-4 Ote-machi, Chiyoda-ku, Tokyo 100 Japan; Volcano Research Center, Earthquake Research Institute, University of Tokyo, Yayoi 1-1-1, Bunkyo-ku, Tokyo 113, Japan (URL: http://www.eri.u-tokyo.ac.jp/VRC/index_E.html).
Akademia Nauk (Russia) — January 1996 Cite this Report
Akademia Nauk
Russia
53.98°N, 159.45°E; summit elev. 1180 m
All times are local (unless otherwise noted)
Explosive eruption from Karymsky Lake and new crater at summit
Periods of seismic unrest have occurred several times in the past 12 months, including one episode in April 1995 (BGVN 19:05), and the volcano usually emits a continuous steam plume. Based on recorded seismic activity, an eruption apparently began during 1700-1900 on 1 January. Russian aviation sources reported an ash plume to 7 km altitude at approximately 1130 the next day. A satellite image at 1400 on 2 January showed that the plume had extended at least 200 km SE and S of the volcano. Several aviation notices (SIGMETs) were issued concerning the ash plume. GMS satellite imagery revealed multiple ash emissions on 2 January, with the cloud height estimated at ~7 km. Satellite data on 3 January continued to show multiple low-level (below 5,400 m) ash bursts of short duration that drifted S and dissipated within an hour.
When the volcano was visited by Vladimir Kirianov and Yuri Doubik of the Institute of Volcanic Geology and Geochemistry between 1330 and 1630 on 3 January, they discovered that the initial eruption had vented from the N end of Karymsky Lake. The lake occupies the 5-km-diameter late-Pleistocene Akademia Nauk caldera, ~5 km S of Karymsky volcano proper. However, by the time of their visit activity had shifted to Karymsky volcano where a new crater had formed on the SSW side of the summit, adjacent to the old crater. The new crater, approximately the same size as the old crater, produced explosions every 1-5 minutes that fed a thick black ash plume to an altitude of ~2.5 km moving E. Fresh ashfall was widespread throughout the 5-km-wide Karymsky caldera and for a considerable area to the E and N. Karymsky Lake was yellow-gray in color and mostly covered by steam and vapor. The Karymsky River, which drains the lake to the N, was completely buried in ash and no longer visible; a new beach with numerous fumaroles marked the former source of the river. Very strong seismic activity associated with the eruption included one M 6.5 earthquake on the first day of the eruption. Seismic stations as far as 110 km from the volcano recorded the activity.
By 5 January the new summit crater was over twice the size of the old crater. A thick black ash plume had been observed the previous two days erupting explosively from the new crater to altitudes ranging of 2,400-5,500 m. Seismicity on 6 January indicated continued explosions every 1-3 minutes. Karymsky Lake remained yellow-gray and covered by steam and vapor. Seismicity through 12 January was interpreted to reflect continued, but less explosive, eruptive activity.
Karymsky, ~110 km NW of Petropavlovsk-Kamchatsky, is the most active volcano of eastern Kamchatka. The latest eruptive period began ~500 years ago; much of the cone is mantled by lava flows less than 200 years old. It has been quiescent since frequent eruptive activity during 1970-82. The volcano is capable of explosive eruptions which can send ash to over 10 km and continue sporadically for days or weeks; short lava flows are also common.
Geologic Background. The lake-filled Akademia Nauk caldera is one of three volcanoes constructed within the mid-Pleistocene, 15-km-wide Polovinka caldera. The eroded Beliankin stratovolcano, in the SW part of Polovinka caldera, has been active in postglacial time (Sviatlovsky, 1959). Two nested calderas, 5 x 4 km Odnoboky and 3 x 5 km Akademia Nauk (also known as Karymsky Lake or Academii Nauk), were formed during the late Pleistocene, the latter about 30,000 years ago. Eruptive products varied from initial basaltic-andesite lava flows to late-stage rhyodacitic lava domes. Two maars, Akademia Nauk and Karymsky, subsequently formed at the southern and northern margins of the caldera lake, respectively. The northern maar, Karymsky, erupted about 6,500 radiocarbon years ago and formed a small bay. The first recorded eruption from Akademia Nauk took place on 2 January 1996, when a day-long explosive eruption of unusual basaltic and rhyolitic composition occurred from vents beneath the NNW part of the caldera lake near Karymsky maar.
Information Contacts: Tom Miller, Alaska Volcano Observatory (AVO), a cooperative program of a) U.S. Geological Survey, 4200 University Drive, Anchorage, AK 99508-4667, USA, b) Geophysical Institute, University of Alaska, PO Box 757320, Fairbanks, AK 99775-7320, USA, and c) Alaska Division of Geological & Geophysical Surveys, 794 University Ave., Suite 200, Fairbanks, AK 99709, USA; Vladimir Kirianov and Yuri Doubik, Institute of Volcanic Geology and Geochemistry, Piip Ave. 9, Petropavlovsk-Kamchatsky, 683006, Russia; NOAA/NESDIS Synoptic Analysis Branch (SAB) , Room 401, 5200 Auth Road, Camp Springs, MD 20746, USA.
Arenal (Costa Rica) — January 1996 Cite this Report
Arenal
Costa Rica
10.463°N, 84.703°W; summit elev. 1670 m
All times are local (unless otherwise noted)
Small Strombolian eruptions continue
During December 1995 and January 1996, Crater C continued its ongoing emission of gases, lava flows, and sporadic Strombolian eruptions. The intensity of Strombolian activity remained high, but showed some decline during this interval. Ash columns reached up to 1 km above the crater.
Lava that began extruding in July 1995 ceased advancing during much of January 1996. In contrast, new lava began extruding during January; it followed previously established channels and reached the 1,100-m contour.
During some past years, a general tendency toward deflation of the edifice had been noted. For the W and N sectors, inclinometers detected a 1995 deflation averaging 15.4 µrad/year. In harmony with this observed deflation, 1995 distance surveys over the local net registered an overall contraction of 21.2 ppm/year.
During December and January, seismic station VACR (2.7 km NE of the main crater) registered a moderate number of local events (figure 75). The majority of these events were thought to be associated with Strombolian eruptions; some were sufficiently strong to be recognized at station JTS (30 km SW of the crater). Tremor during these same two months registered for 306 and 420 hours, respectively (figure 75).
Geologic Background. Conical Volcán Arenal is the youngest stratovolcano in Costa Rica and one of its most active. The 1670-m-high andesitic volcano towers above the eastern shores of Lake Arenal, which has been enlarged by a hydroelectric project. Arenal lies along a volcanic chain that has migrated to the NW from the late-Pleistocene Los Perdidos lava domes through the Pleistocene-to-Holocene Chato volcano, which contains a 500-m-wide, lake-filled summit crater. The earliest known eruptions of Arenal took place about 7000 years ago, and it was active concurrently with Cerro Chato until the activity of Chato ended about 3500 years ago. Growth of Arenal has been characterized by periodic major explosive eruptions at several-hundred-year intervals and periods of lava effusion that armor the cone. An eruptive period that began with a major explosive eruption in 1968 ended in December 2010; continuous explosive activity accompanied by slow lava effusion and the occasional emission of pyroclastic flows characterized the eruption from vents at the summit and on the upper western flank.
Information Contacts: Rodolfo Van der Laat, Vilma Barboza, Erick Fernández, Jorge Barquero, Franklin de Obaldia, Tomás Marino, and Rodrigo Sáenz, Observatorio Vulcanológico y Sismológico de Costa Rica, Universidad Nacional (OVSICORI-UNA), Apartado 86-3000, Heredia, Costa Rica.
Fukutoku-Oka-no-Ba (Japan) — January 1996 Cite this Report
Fukutoku-Oka-no-Ba
Japan
24.285°N, 141.481°E; summit elev. -29 m
All times are local (unless otherwise noted)
Discolored seawater observed for the second time in three months
On 12, 22, and 23 January, an aviator from the Japan Marine Safety Agency (JMSA) reported distinct discoloration of seawater to yellowish green. Similar discoloration was seen during 25-28 November 1995 (BGVN 20:11/12). Prior to that, discolored seawater was last seen at this location in September 1993.
Geologic Background. Fukutoku-Oka-no-ba is a submarine volcano located 5 km NE of the island of Minami-Ioto. Water discoloration is frequently observed, and several ephemeral islands have formed in the 20th century. The first of these formed Shin-Ioto ("New Sulfur Island") in 1904, and the most recent island was formed in 1986. The volcano is part of an elongated edifice with two major topographic highs trending NNW-SSE, and is a trachyandesitic volcano geochemically similar to Ioto.
Information Contacts: Volcanological Division, Seismological and Volcanological Department, Japan Meteorological Agency (JMA), 1-3-4 Ote-machi, Chiyoda-ku, Tokyo 100 Japan.
Irazu (Costa Rica) — January 1996 Cite this Report
Irazu
Costa Rica
9.979°N, 83.852°W; summit elev. 3436 m
All times are local (unless otherwise noted)
Dark yellow crater-lake water; discrete 7-hour seismic swarm
When visited in January, the crater lake's dark-yellow water remained high, covering the entire crater floor. Prominent fumaroles continued to bubble along the lake's N, NW, and SE shores. Slides continued to take place along the N, SW, and W walls. Seismic station IRZ2 (5 km SW) registered a swarm of 29 local earthquakes between 1512 and 2111 on 30 January; one was detected at a more distant station.
Geologic Background. The massive Irazú volcano in Costa Rica, immediately E of the capital city of San José, covers an area of 500 km2 and is vegetated to within a few hundred meters of its broad summit crater complex. At least 10 satellitic cones are located on its S flank. No lava effusion is known since the eruption of the Cervantes lava flows from S-flank vents about 14,000 years ago, and all known Holocene eruptions have been explosive. The focus of eruptions at the summit crater complex has migrated to the W towards the main crater, which contains a small lake. The first well-documented eruption occurred in 1723, and frequent explosive eruptions have occurred since. Ashfall from the last major eruption during 1963-65 caused significant disruption to San José and surrounding areas. Phreatic activity reported in 1994 may have been a landslide event from the fumarolic area on the NW summit (Fallas et al., 2018).
Information Contacts: Rodolfo Van der Laat, Vilma Barboza, Erick Fernández, Jorge Barquero, Franklin de Obaldia, Tomás Marino, and Rodrigo Sáenz, Observatorio Vulcanológico y Sismológico de Costa Rica, Universidad Nacional (OVSICORI-UNA), Apartado 86-3000, Heredia, Costa Rica.
Karangetang (Indonesia) — January 1996 Cite this Report
Karangetang
Indonesia
2.781°N, 125.407°E; summit elev. 1797 m
All times are local (unless otherwise noted)
Small ash plumes, incandescent ejecta, and increased seismicity
On 9 and 16 November "thunderclaps" were heard from the summit. A gray plume 500 m high was observed, and incandescent ejecta rose 10-50 m above the summit at night. On 17 December thunderclaps were heard again and ejecta rose 100 m above the summit. Seismicity increased from 26 October until the end of 1995. Daily counts of deep volcanic (A-type) earthquakes fluctuated up to 116 (figure 3).
Geologic Background. Karangetang (Api Siau) volcano lies at the northern end of the island of Siau, about 125 km NNE of the NE-most point of Sulawesi. The stratovolcano contains five summit craters along a N-S line. It is one of Indonesia's most active volcanoes, with more than 40 eruptions recorded since 1675 and many additional small eruptions that were not documented (Neumann van Padang, 1951). Twentieth-century eruptions have included frequent explosive activity sometimes accompanied by pyroclastic flows and lahars. Lava dome growth has occurred in the summit craters; collapse of lava flow fronts have produced pyroclastic flows.
Information Contacts: Wimpy S. Tjetjep (Director), Volcanological Survey of Indonesia (VSI), Jalan Diponegoro 57, Bandung, Indonesia.
Karymsky (Russia) — January 1996 Cite this Report
Karymsky
Russia
54.049°N, 159.443°E; summit elev. 1513 m
All times are local (unless otherwise noted)
Explosive eruption from Karymsky Lake and new crater at summit
Periods of seismic unrest have occurred several times in the past 12 months, including one episode in April 1995, and the volcano usually emits a continuous steam plume. Based on recorded seismic activity, an eruption apparently began during 1700-1900 on 1 January. Russian aviation sources reported an ash plume to 7 km altitude at approximately 1130 the next day. A satellite image at 1400 on 2 January showed that the plume had extended at least 200 km SE and S of the volcano. Several aviation notices (SIGMETs) were issued concerning the ash plume. GMS satellite imagery revealed multiple ash emissions on 2 January, with the cloud height estimated at ~7 km. Satellite data on 3 January continued to show multiple low-level (below 5,400 m) ash bursts of short duration that drifted S and dissipated within an hour.
When the volcano was visited by Vladimir Kirianov and Yuri Doubik of the Institute of Volcanic Geology and Geochemistry between 1330 and 1630 on 3 January, they discovered that the initial eruption had vented from the N end of Karymsky Lake. The lake occupies the 5-km-diameter late-Pleistocene Akademia Nauk caldera, ~5 km S of Karymsky volcano proper. However, by the time of their visit activity had shifted to Karymsky volcano where a new crater had formed on the SSW side of the summit, adjacent to the old crater. The new crater, approximately the same size as the old crater, produced explosions every 1-5 minutes that fed a thick black ash plume to an altitude of ~2.5 km moving E. Fresh ashfall was widespread throughout the 5-km-wide Karymsky caldera and for a considerable area to the E and N. Karymsky Lake was yellow-gray in color and mostly covered by steam and vapor. The Karymsky River, which drains the lake to the N, was completely buried in ash and no longer visible; a new beach with numerous fumaroles marked the former source of the river. Very strong seismic activity associated with the eruption included one M 6.5 earthquake on the first day of the eruption. Seismic stations as far as 110 km from the volcano recorded the activity.
By 5 January the new summit crater was over twice the size of the old crater. A thick black ash plume had been observed the previous two days erupting explosively from the new crater to altitudes ranging of 2,400-5,500 m. Seismicity on 6 January indicated continued explosions every 1-3 minutes. Karymsky Lake remained yellow-gray and covered by steam and vapor. Seismicity through 12 January was interpreted to reflect continued, but less explosive, eruptive activity.
Geologic Background. Karymsky, the most active volcano of Kamchatka's eastern volcanic zone, is a symmetrical stratovolcano constructed within a 5-km-wide caldera that formed during the early Holocene. The caldera cuts the south side of the Pleistocene Dvor volcano and is located outside the north margin of the large mid-Pleistocene Polovinka caldera, which contains the smaller Akademia Nauk and Odnoboky calderas. Most seismicity preceding Karymsky eruptions originated beneath Akademia Nauk caldera, located immediately south. The caldera enclosing Karymsky formed about 7600-7700 radiocarbon years ago; construction of the stratovolcano began about 2000 years later. The latest eruptive period began about 500 years ago, following a 2300-year quiescence. Much of the cone is mantled by lava flows less than 200 years old. Historical eruptions have been vulcanian or vulcanian-strombolian with moderate explosive activity and occasional lava flows from the summit crater.
Information Contacts: Tom Miller, Alaska Volcano Observatory; Vladimir Kirianov and Yuri Doubik, Institute of Volcanic Geology and Geochemistry; Synoptic Analysis Branch, NOAA/NESDIS, USA.
Kilauea (United States) — January 1996 Cite this Report
Kilauea
United States
19.421°N, 155.287°W; summit elev. 1222 m
All times are local (unless otherwise noted)
Eruptive pulse on 1 February almost results in a summit eruption
The eruption on the East Rift Zone continued in January with the usual activity consisting of surface lava flows and lava traveling through tubes to enter the ocean. However, an unusual event on 1 February almost resulted in a summit eruption. Following this event an eruptive pause began that continued through mid-February.
Normal activity in January. Surface flows during the first two weeks of January covered ~4 km2 on the E side of the Kamoamoa flow field. On the slopes of Pulama pali, lava breakouts followed the E margin of older flows as far as 1 km, sometimes burning adjacent forest and grassland. On the coastal plain, inflating sheet flows were widespread. At the West Kamokuna entry the bench was rebuilt following the collapse of 1 January (BGVN 20:11/12), and two littoral cones were created.
The Great Pit, a collapse pit on the SW slope of Pu`u `O`o cinder cone, was enlarged by several collapses since late December, expanding toward a second collapse pit over an Episode-51 vent. This vent, which has continued to issue lava during the current Episode 53, is connected to the Pu`u `O`o lava pond; a series of collapses in recent months defined a line from this pit across the rim of the cone to the lava pond inside and probably resulted from breakdown of the roof in the underlying plumbing system.
Almost daily explosive activity at the Kamokuna bench in the second half of January included bubble bursts and spattering to 50 m height, as well as steam and ash jetting to 150 m. On 25 January a small collapse removed a 40 × 100 m area of the lower bench, along with part of a littoral cone. The collapsed area was rebuilt within three days, and explosive activity constructed a new littoral cone. On the night of 30 January a large bench collapse at Kamokuna occurred over a period of six hours, during which time approximately 800 × 200 m of the bench slid into the ocean accompanied by frequent explosions that threw blocks as far as 300 m inland. Lava flows were continually active on the slope of Pulama pali, particularly around the base and on the coastal plain within 1.5 km of the ocean entry. Pahoehoe flows burning into forest and brush caused loud and abundant methane explosions. Lava flows on the coastal plain advanced E to within 500 m of the Royal Gardens access road.
Eruption tremor remained low with minor, irregular variations. Tremor amplitudes in the second half of January measured ~2x the background level on the STC seismic station near Pu`u `O`o. Shallow, long-period activity at the summit was about average. Short-period microearthquake counts were low beneath the summit and rift zones.
Eruptive pulse of 1 February. Unusual and dramatic activity started on the morning of 1 February with a large increase in shallow tremor at the summit caldera and rapid inflation of the summit, suggesting that an eruption from the summit or upper East Rift Zone might be imminent. As a result, most of Hawaii Volcanoes National Park, including the local airspace, was closed for several hours. However, no new ground cracks or eruptive fissures formed. Instead, the increase in tremor was followed three hours later by an order-of-magnitude increase in the volume of lava flowing into tubes from the vent on the flank of Pu`u `O`o cone.
Excess pressure in the tube system caused the lava to gush out of four skylights, forming dome fountains at 735, 720, 695, and 675 m elevations. Prior to this event, no surface flows had occurred above 675 m since early 1993. Heights of the fountains in mid-afternoon were 1.8-7.6 m. Lava from the largest fountain formed a channelized flow that ran E into the forest, and then descended Pulama pali as a fast-moving aa flow. Inside Pu`u `O`o, the actively circulating lava pond rose to at least 60 m below the rim, and sloshed another 15-20 m higher. Spatter from the pond was thrown 50 m beyond the S crater rim.
Over the next three days, the level of activity gradually decreased. The Pu`u `O`o lava pond exhibited cycles of influx and drainback, but remained relatively deep (65-80 m below the rim). Lava flows from the skylights started and stopped, as did surface flows on the coastal plain. The Kamokuna ocean entry paused for 11 hours on 2 February, probably because of blockage in the tube system, and then flowed at diminished volume on 3-4 February. Late on 4 February the eruption stopped. Sometime during the next night, an explosion in the Great Pit blasted out fragments (up to fist-size) of mostly reddish oxidized rock. The smaller fragments were carried ~9.5 km NE by Kona winds. The pause continued through 12 February.
The change in lava effusion rate was attended by an episodic increase in gas release. Fumaroles at the summit and East Rift Zone showed abnormally high CO2 levels starting on 1 February, possibly reflecting a pulse of gas-rich magma. Ambient SO2 in the HVO parking lot topped 4 ppm on 2 February and was greater than 1 ppm near the NPS Visitors Center. SO2 emission rates measured near the eruption site were as high as 2,000 metric tons/day on 2 February. SO2 emission rates and fumarole chemistry from the summit and east rift were approaching near-normal for an eruptive pause by 12 February.
Seismicity and deformation. Tremor amplitudes remained at 2-3x background level until the morning of 1 February. Shortly after 0800, tremor on the STC station gradually increased; summit seismicity increased at the same time. Tremor, as well as a swarm of shallow, short-period earthquakes, registered on the summit seismic stations as a result of the intrusive episode. Several hundred microearthquakes were counted. Seismicity at the summit began to subside shortly after noon with a notable decrease in summit tremor and short-period earthquakes. An increase of shallow and intermediate long-period earthquakes followed. By 1600, tremor amplitudes on the STC station were high and remained relatively steady until about 1200 on 2 February. Tremor amplitudes again increased on 3 February at 0700 and remained at elevated levels until 0200 on the 4th. From then through 12 February amplitudes fluctuated in banded patterns of a few minutes to a few hours of increased tremor, alternating with low- level tremor.
The Uwekahuna short-base water-tube tiltmeter recorded summit inflation, with ~11 µrads of N-S tilt and ~15 µrads of E-W tilt during the seismic swarm of 1 February; the maximum tilt was read at 1246. Summit deflation followed at a rate of ~1.5 µrads/hour, coincident with the increase in activity at Pu`u `O`o. By 0830 on 2 February, the E-W component had recovered to the pre-swarm level of deflation and the N-S component to ~2/3 of the pre-swarm level. A permanent-glass EDM monitor spanning the summit caldera of Kīlauea from the flank of Mauna Loa to the Kalanaokuaiki fault recorded the maximum extension between the N caldera rim and a site 1 km S of Halemaumau. This was also the area in which the earthquake swarm was localized. Measurements on 6 February showed contraction to pre-swarm values in conjunction with the summit deflation.
Geologic Background. Kilauea overlaps the E flank of the massive Mauna Loa shield volcano in the island of Hawaii. Eruptions are prominent in Polynesian legends; written documentation since 1820 records frequent summit and flank lava flow eruptions interspersed with periods of long-term lava lake activity at Halemaumau crater in the summit caldera until 1924. The 3 x 5 km caldera was formed in several stages about 1,500 years ago and during the 18th century; eruptions have also originated from the lengthy East and Southwest rift zones, which extend to the ocean in both directions. About 90% of the surface of the basaltic shield volcano is formed of lava flows less than about 1,100 years old; 70% of the surface is younger than 600 years. The long-term eruption from the East rift zone between 1983 and 2018 produced lava flows covering more than 100 km2, destroyed hundreds of houses, and added new coastline.
Information Contacts: Hawaiian Volcano Observatory (HVO), U.S. Geological Survey, Hawaii Volcanoes National Park, HI 96718, USA.
Krakatau (Indonesia) — January 1996 Cite this Report
Krakatau
Indonesia
6.1009°S, 105.4233°E; summit elev. 285 m
All times are local (unless otherwise noted)
Steaming and fumarolic activity; cone description
During an approved visit on 6 November, the volcano was steaming but not erupting. A large sulfur-stained plug of lava, ~20% the diameter of the summit cone, was bulging out of a black cinder cone just below and W of the summit; it appeared to be inside the SW margin of a broad depression. A smaller sulfur-stained plug was farther S in another depression. The landing site on the SE shore was a black-sand beach with tiny dunes of white pumice. While climbing the SE slope of the older cone, the party crossed water-eroded fields of pyroclastic material dotted with volcanic bombs. The ascent to the summit went through deep cinder deposits covered with a blanket of loose breadloaf-sized stones. From the summit complicated internal crater structures could be seen. One symmetrical cone (~100 m across) had a sulfur-lined inner rim that was fuming. The largest and most active fumaroles were inside this cone's S rim. A smaller cone within the larger one was almost horseshoe-shaped and steeper to the S. Bombs on the summit cone were as large as 1-2 m in diameter.
Geologic Background. The renowned Krakatau (frequently mis-named as Krakatoa) volcano lies in the Sunda Strait between Java and Sumatra. Collapse of an older edifice, perhaps in 416 or 535 CE, formed a 7-km-wide caldera. Remnants of that volcano are preserved in Verlaten and Lang Islands; subsequently the Rakata, Danan, and Perbuwatan cones were formed, coalescing to create the pre-1883 Krakatau Island. Caldera collapse during the catastrophic 1883 eruption destroyed Danan and Perbuwatan, and left only a remnant of Rakata. This eruption caused more than 36,000 fatalities, most as a result of tsunamis that swept the adjacent coastlines of Sumatra and Java. Pyroclastic surges traveled 40 km across the Sunda Strait and reached the Sumatra coast. After a quiescence of less than a half century, the post-collapse cone of Anak Krakatau (Child of Krakatau) was constructed within the 1883 caldera at a point between the former Danan and Perbuwatan cones. Anak Krakatau has been the site of frequent eruptions since 1927.
Information Contacts: Steve O'Meara, PO Box 218, Volcano, HI 96785, USA.
Kujusan
Japan
33.086°N, 131.249°E; summit elev. 1791 m
All times are local (unless otherwise noted)
Earthquake swarm and eruptions on 13-14 January; continuous plume
Frequent earthquakes during the night of 13 January and through the next morning were centered 3-4 km NW of the Hosho dome near Sujiyu spa; eruptions caused minor ashfall around the volcano. Instruments recorded 526 earthquakes during the 13-14 January episode, some of which were felt by local residents. Some earthquakes on 27 January were centered SW of the active dome. Overall, there were 861 earthquakes detected in January, but no tremor. The plume height remained at 100-300 m throughout most of the month. Scientists at the University of Tokyo noted that vesiculated glass was again observed in the 13 January material, and deflation near the crater area was continuing.
Geologic Background. Kujusan is a complex of stratovolcanoes and lava domes lying NE of Aso caldera in north-central Kyushu. The group consists of 16 andesitic lava domes, five andesitic stratovolcanoes, and one basaltic cone. Activity dates back about 150,000 years. Six major andesitic-to-dacitic tephra deposits, many associated with the growth of lava domes, have been recorded during the Holocene. Eruptive activity has migrated systematically eastward during the past 5000 years. The latest magmatic activity occurred about 1600 years ago, when Kurodake lava dome at the E end of the complex was formed. The first reports of historical eruptions were in the 17th and 18th centuries, when phreatic or hydrothermal activity occurred. There are also many hot springs and hydrothermal fields. A fumarole on Hosho lava dome was the site of a sulfur mine for at least 500 years. Two geothermal power plants are in operation at Kuju.
Information Contacts: Volcanological Division, Seismological and Volcanological Department, Japan Meteorological Agency (JMA), 1-3-4 Ote-machi, Chiyoda-ku, Tokyo 100 Japan; Volcano Research Center, Earthquake Research Institute, University of Tokyo, Yayoi 1-1-1, Bunkyo-ku, Tokyo 113, Japan (URL: http://www.eri.u-tokyo.ac.jp/VRC/index_E.html).
Lokon-Empung (Indonesia) — January 1996 Cite this Report
Lokon-Empung
Indonesia
1.358°N, 124.792°E; summit elev. 1580 m
All times are local (unless otherwise noted)
Variable seismicity and minor vapor emissions
Vapor emission was observed during November-December 1995 and whitish-gray plumes rose to 100 m above the active crater. Seismicity during September-October 1995 consisted of 1- 8 A-type events/day. On 1 November there were 46 A-type events recorded, followed by very low seismicity over the next ten days. Activity then increased from 12 November through 31 December, but was highly variable with 4-21 events/day. B-type events remained at 0-8 events/day.
The present activity is located at Tompaluan crater, in the saddle between the peaks of Lokon (1,579 m) and Empung (1,340 m). About 10,000 people evacuated following an explosion in October 1991 accompanied by a pyroclastic flow; the eruption ended in January 1992.
Geologic Background. The Lokong-Empung volcanic complex, rising above the plain of Tondano in North Sulawesi, includes four peaks and an active crater. Lokon, the highest peak, has a flat craterless top. The morphologically younger Empung cone 2 km NE has a 400-m-wide, 150-m-deep crater that erupted last in the 18th century. A ridge extending 3 km WNW from Lokon includes the Tatawiran and Tetempangan peaks. All eruptions since 1829 have originated from Tompaluan, a 150 x 250 m crater in the saddle between Lokon and Empung. These eruptions have primarily produced small-to-moderate ash plumes that sometimes damaged croplands and houses, but lava-dome growth and pyroclastic flows have also occurred.
Information Contacts: Wimpy S. Tjetjep (Director), Volcanological Survey of Indonesia (VSI), Jalan Diponegoro 57, Bandung, Indonesia.
Merapi (Indonesia) — January 1996 Cite this Report
Merapi
Indonesia
7.54°S, 110.446°E; summit elev. 2910 m
All times are local (unless otherwise noted)
Increased seismicity related to lava avalanches and rockfalls
During November-December 1995 glowing avalanches down the Boyong, Krasak, and Bebeng rivers reached up to 2.5 km from the source. Seismic activity was dominated by multiphase earthquakes, low-frequency earthquakes, and lava avalanches (rockfalls). The number of multiphase earthquakes decreased from 924 in November to 152 in December; low-frequency earthquakes also decreased from 74 in November to 42 in December. Seismicity associated with lava avalanches and rock falls increased from 816 events in November to 1,078 in December (figure 17). A deep volcanic earthquake (A- type) and two tremor events were recorded in November, three shallow volcanic earthquakes (B-type) occurred in December.
Inflation increased since 17 November from 2.5 to 10.8 µrad/day. Tilt data collected at two stations in the summit area during November and December indicated inflation of 60 and 320 µrad, respectively. The geomagnetic intensity in early December was -14.5 nTs; it then decreased to -1.5 nTs by the end of the month. The emission rate of SO2 during November fluctuated between 27 and 275 t/d, averaging 95 t/d, and the plume velocity was ~3.2-3.5 m/s. In December the emission rate decreased to 70 t/d, fluctuating between 18 and 156 t/d; plume speed was slightly higher at 3.3-3.6 m/s.
Geologic Background. Merapi, one of Indonesia's most active volcanoes, lies in one of the world's most densely populated areas and dominates the landscape immediately north of the major city of Yogyakarta. It is the youngest and southernmost of a volcanic chain extending NNW to Ungaran volcano. Growth of Old Merapi during the Pleistocene ended with major edifice collapse perhaps about 2,000 years ago, leaving a large arcuate scarp cutting the eroded older Batulawang volcano. Subsequent growth of the steep-sided Young Merapi edifice, its upper part unvegetated due to frequent activity, began SW of the earlier collapse scarp. Pyroclastic flows and lahars accompanying growth and collapse of the steep-sided active summit lava dome have devastated cultivated lands on the western-to-southern flanks and caused many fatalities.
Information Contacts: Wimpy S. Tjetjep (Director), Volcanological Survey of Indonesia (VSI), Jalan Diponegoro 57, Bandung, Indonesia; Steve O'Meara, PO Box 218, Volcano, HI 96785, USA .
Minami-Hiyoshi (Japan) — January 1996 Cite this Report
Minami-Hiyoshi
Japan
23.5°N, 141.935°E; summit elev. -107 m
All times are local (unless otherwise noted)
Discolored seawater plume 6 km long
On 12 January, an aviator from the JMSA observed seawater discolored to yellowish green in an area 500 m wide and 6 km long, flowing from Minami-Hiyoshi seamount to the S. Discolored water was last observed in February 1992 (BGVN 17:02).
Periodic water discoloration and water-spouting has been reported over this submarine volcano since 1975, when detonations and an explosion were also reported. Located 90 km SE of Minami-Iwo-Jima, Minami-Hiyoshi lies near the SE end of a coalescing chain of youthful seamounts, and is the only historically active vent. The morphologically youthful seamounts Kita-Hiyoshi and Naka-Hiyoshi lie to the NW, and Ko-Hiyoshi to the SE.
Geologic Background. Periodic water discoloration and water-spouting have been reported over the Minami-Hiyoshi submarine volcano since 1975, when detonation sounds and an explosion were also reported. It lies near the SE end of a coalescing chain of youthful seamounts, and is the only vent with recorded activity. The reported depth of the summit of the trachyandesitic volcano has varied between 274 and 30 m. The morphologically youthful seamounts Kita-Hiyoshi and Naka-Hiyoshi lie to the NW, and Ko-Hiyoshi to the SE.
Information Contacts: Volcanological Division, Seismological and Volcanological Department, Japan Meteorological Agency (JMA), 1-3-4 Ote-machi, Chiyoda-ku, Tokyo 100 Japan.
Nyamulagira (DR Congo) — January 1996 Cite this Report
Nyamulagira
DR Congo
1.408°S, 29.2°E; summit elev. 3058 m
All times are local (unless otherwise noted)
High levels of seismicity during September 1995
Volcanic seismicity in the Nyamuragira/Nyiragongo area during 15-30 September was very high (figure 15). This activity was characterized by A-type (high-frequency) and C-type (low-frequency) events. Hypocenters were principally concentrated ESE of the summit of Nyamuragira, NE of Nyiragongo, at depths of 0-20 km. Depths for all of the earthquakes decreased from W to E and from S to N, suggesting a volcanic conduit rising in a generally NE direction towards the surface on the ESE flank of Nyamuragira. The level of volcanic tremor was very low. The low tremor level does not signify an overall reduction in the Nyiragongo lava lake activity, but no fresh lava was apparent in the crater.
Seismic recordings in the first half of October were severely impaired by frequent power disruptions to the observatory and the regular discharge of the batteries. The number of earthquakes decreased significantly compared to September; events were mainly centered at greater depths (5-30 km) SE of Nyiragongo. Problems with the transmitter at the Kunene seismic station prevented acquisition of better data; scientists were unable to visit the station regularly due to a lack of tires for their vehicle.
Seismicity during 15 November-2 December remained high, mainly consisting of A- and C-type earthquakes, and volcanic tremor. The distribution of hypocenters was similar to that observed during September. Each series of earthquakes was followed by up to several hours of tremor. Five seismic stations were operating during this period, four of them (Kibati, Rusayo, Buhimba, and Kunene) telemetered to the Goma observatory, and the fifth (Mt. Goma) connected by cable. However, the transmitter from Kunene was intermittent. Tremor amplitude remained low.
Monitoring of both active Virunga volcanoes is done from a small observatory building located in Goma, ~18 km S of the Nyiragongo crater. Goma is the city where the major encampment of Rwandan civil-war refugees is located. A previous lava lake in the deep summit crater of Nyiragongo, active since 1894, drained suddenly on 10 January 1977, killing about 70 people. Lava lake activity resumed in June 1982, but had ceased by early 1983. The lava lake was again activated after an eruption that began in June 1994 (BGVN 19:06-19:08). Historical eruptions from Nyamuragira (14 km NW of Nyiragongo) have occurred within the summit caldera and from numerous flank fissures and cinder cones. Twentieth century flank lava flows extend >30 km from the summit. Nyamuragira also began erupting in July 1994, producing lava fountaining, lava flows, and ash emission.
Geologic Background. Africa's most active volcano, Nyamulagira (also known as Nyamuragira), is a massive high-potassium basaltic shield about 25 km N of Lake Kivu and 13 km NNW of the steep-sided Nyiragongo volcano. The summit is truncated by a small 2 x 2.3 km caldera that has walls up to about 100 m high. Documented eruptions have occurred within the summit caldera, as well as from the numerous flank fissures and cinder cones. A lava lake in the summit crater, active since at least 1921, drained in 1938, at the time of a major flank eruption. Recent lava flows extend down the flanks more than 30 km from the summit as far as Lake Kivu; extensive lava flows from this volcano have covered 1,500 km2 of the western branch of the East African Rift.
Information Contacts: Wafula Mifundi and Mahinda Kasereka, Goma Volcano Observatory, Departement de Geophysique, Centre de Recherche en Sciences Naturelles, Lwiro, D.S. Bukavu, Zaire.
Nyiragongo (DR Congo) — January 1996 Cite this Report
Nyiragongo
DR Congo
1.52°S, 29.25°E; summit elev. 3470 m
All times are local (unless otherwise noted)
High levels of seismicity during September 1995
Volcanic seismicity in the Nyamuragira/Nyiragongo area during 15-30 September was very high (figure 8). This activity was characterized by A-type (high-frequency) and C-type (low-frequency) events. Hypocenters were principally concentrated ESE of the summit of Nyamuragira, NE of Nyiragongo, at depths of 0-20 km. Depths for all of the earthquakes decreased from W to E and from S to N, suggesting a volcanic conduit rising in a generally NE direction towards the surface on the ESE flank of Nyamuragira. The level of volcanic tremor was very low. The low tremor level does not signify an overall reduction in the Nyiragongo lava lake activity, but no fresh lava was apparent in the crater.
Seismic recordings in the first half of October were severely impaired by frequent power disruptions to the observatory and the regular discharge of the batteries. The number of earthquakes decreased significantly compared to September; events were mainly centered at greater depths (5-30 km) SE of Nyiragongo. Problems with the transmitter at the Kunene seismic station prevented acquisition of better data; scientists were unable to visit the station regularly due to a lack of tires for their vehicle.
Seismicity during 15 November-2 December remained high, mainly consisting of A- and C-type earthquakes, and volcanic tremor. The distribution of hypocenters was similar to that observed during September. Each series of earthquakes was followed by up to several hours of tremor. Five seismic stations were operating during this period, four of them (Kibati, Rusayo, Buhimba, and Kunene) telemetered to the Goma observatory, and the fifth (Mt. Goma) connected by cable. However, the transmitter from Kunene was intermittent. Tremor amplitude remained low.
Monitoring of both active Virunga volcanoes is done from a small observatory building located in Goma, ~18 km S of the Nyiragongo crater. Goma is the city where the major encampment of Rwandan civil-war refugees is located. A previous lava lake in the deep summit crater of Nyiragongo, active since 1894, drained suddenly on 10 January 1977, killing about 70 people. Lava lake activity resumed in June 1982, but had ceased by early 1983. The lava lake was again activated after an eruption that began in June 1994 (BGVN 19:06-19:08). Historical eruptions from Nyamuragira (14 km NW of Nyiragongo) have occurred within the summit caldera and from numerous flank fissures and cinder cones. Twentieth century flank lava flows extend >30 km from the summit. Nyamuragira also began erupting in July 1994, producing lava fountaining, lava flows, and ash emission.
Geologic Background. The Nyiragongo stratovolcano contained a lava lake in its deep summit crater that was active for half a century before draining catastrophically through its outer flanks in 1977. The steep slopes contrast to the low profile of its neighboring shield volcano, Nyamuragira. Benches in the steep-walled, 1.2-km-wide summit crater mark levels of former lava lakes, which have been observed since the late-19th century. Two older stratovolcanoes, Baruta and Shaheru, are partially overlapped by Nyiragongo on the north and south. About 100 cones are located primarily along radial fissures south of Shaheru, east of the summit, and along a NE-SW zone extending as far as Lake Kivu. Many cones are buried by voluminous lava flows that extend long distances down the flanks, which is characterized by the eruption of foiditic rocks. The extremely fluid 1977 lava flows caused many fatalities, as did lava flows that inundated portions of the major city of Goma in January 2002.
Information Contacts: Wafula Mifundi and Mahinda Kasereka, Goma Volcano Observatory, Departement de Geophysique, Centre de Recherche en Sciences Naturelles, Lwiro, D.S. Bukavu, Zaire.
Poas (Costa Rica) — January 1996 Cite this Report
Poas
Costa Rica
10.2°N, 84.233°W; summit elev. 2697 m
All times are local (unless otherwise noted)
Seismically active with new fumaroles and some cross-crater deformation
When visited during January, the surface of the turquoise-green crater lake had risen 45 cm with respect to its December level. At the dome's N margin a small bubbling spring discharged relatively clear water. Lake water measured at the shoreline near the spring had a temperature of 29°C and on the N shore, a temperature of 27°C. The ongoing collapse of the N wall continued, as did reports of sulfur odors at the park entrance station, ~1 km away. Within the crater a small landslide had partially covered the W terrace and local fumaroles there, but fumaroles had migrated to the NW terrace where escaping gases made loud noises. SW-terrace fumaroles also remained active.
The SE-SW portion of the crater wall contained new fumaroles. These chiefly had temperatures of 73-91°C, with the maximum fumarole temperature, 94°C, found along the S wall. During the January visit, the intracrater cone displayed an increased number of gas emission points. Although the majority were inaccessible, gas columns emanating from the crater margins gave temperatures of 94°C.
During 1995, two distance-survey lines across the active crater underwent an expansion of 19.5 ppm. During the same interval, the distance-survey network outside the crater and the tilt network both lacked significant changes.
During December 1995 and January 1996, the total number of seismic events was relatively high, 5,960 and 4,187, respectively (figure 60). These events were predominantly of low frequency. During December and January, tremor registered for a total of 259 and 6 hours, respectively.
Geologic Background. The broad vegetated edifice of Poás, one of the most active volcanoes of Costa Rica, contains three craters along a N-S line. The frequently visited multi-hued summit crater lakes of the basaltic-to-dacitic volcano are easily accessible by vehicle from the nearby capital city of San José. A N-S-trending fissure cutting the complex stratovolcano extends to the lower N flank, where it has produced the Congo stratovolcano and several lake-filled maars. The southernmost of the two summit crater lakes, Botos, last erupted about 7,500 years ago. The more prominent geothermally heated northern lake, Laguna Caliente, is one of the world's most acidic natural lakes, with a pH of near zero. It has been the site of frequent phreatic and phreatomagmatic eruptions since an eruption was reported in 1828. Eruptions often include geyser-like ejections of crater-lake water.
Information Contacts: Rodolfo Van der Laat, Vilma Barboza, Erick Fernández, Jorge Barquero, Franklin de Obaldia, Tomás Marino, and Rodrigo Sáenz, Observatorio Vulcanológico y Sismológico de Costa Rica, Universidad Nacional (OVSICORI-UNA).
Popocatepetl (Mexico) — January 1996 Cite this Report
Popocatepetl
Mexico
19.023°N, 98.622°W; summit elev. 5393 m
All times are local (unless otherwise noted)
High steam column and variable fumarolic activity
Several months of explosive activity began at Popocatépetl on 21 December 1994. The eruption followed over a year of increased seismicity, SO2 flux, and fumarolic activity.
Beginning at 1140 on 6 January 1996, observers in Puebla saw a steam column reaching ~6.1 km (20,000 ft). Meteorologists at the Synoptic Analysis Branch of NOAA were unable to see this steam column in either the GOES visible or infrared satellite imagery. On 7 January, as viewed from towns at the volcano s base (such as Amecameca and Atlautla), strong fumarolic activity continued from the crater.
Three days later, on 10 January, a helicopter from the Procuraduria General de la Republica flew L. Cardenas, H. Delgado, C. Siebe, and others over the volcano. They noted that fumaroles in the crater appeared rather weak, including those in the field on the volcano s NW side first noticed in April 1995. New fumaroles had sprung up on the N crater rim. No emanations were seen coming from the E-flank fumarolic field.
Later, when observed in conditions of good visibility from surrounding towns on 13-14 and 17-18 January, fumarolic activity was absent. Around this time a climb to the crater rim by Cardenas and Delgado enabled them to look inside; they again saw fumarolic activity that was weaker compared to that seen during most of 1994 and 1995. Despite this weak activity, two boccas on the rim of the old inner lava dome each contained an intensely hissing fumarole. The rocks cradling the fumarole glowed a reddish color visible in daylight, attesting to very high temperatures. In addition, fresh rockslide rubble that had probably sloughed off the crater s N walls lay on the crater floor. The crater s inner E wall looked extremely altered, suggesting that it may be susceptible to additional mass wasting in the near future.
They saw more intense fumarolic activity from the crater rim than they had ever seen before, possibly indicating that the main conduit below the crater floor was in the process of sealing. In this context they advised against mountaineers climbing to the summit area, because small Vulcanian explosions could occur at any time without warning.
C. Valdés-González, G. González-Pomposo, and A. Arciniega-Ceballos (UNAM) reported on seismic activity from November 1995 through early January 1996. Activity was monitored using seismic station PPM, a part of the Mexican National Seismic Network, located on the north flank at 3,900 m elevation. Seismic events were classified as type-A, -B, and -AB (BGVN 19:01).
Type-B events dominated during 1 November-8 January, an interval when 617 were recorded. Where data are available in the interval 1 November-8 January (figure 11), the number of type-B events ranged between 3 and 18 events/day. During this same interval, type-A and -AB events registered only 7 and 6 times, respectively. Fewer than 13 type-B events/day registered during late November through early January, ending on 5 and 6 January 17 and 18 events/day were recorded, respectively.
Galindo and others (1995) summarized the available SO2 flux estimates for 2 January 1994-28 January 1995. Other reports in the same volume described different facets of the volcano s behavior, including those relevant to public health (e.g. ash- aerosol dispersion).
Reference. Galindo, I., González, and Ayala, R., 1995, Emisiones de Bioxido de Azurfre del Volcan Popocatépetl, Mexico durante la erupcion de Diciembre 1994-Enero 1995; Comite Cientifico Asesor CENAPRED-UNAM, 1995, Volcan Popocatépetl Estudios Realizados Durante la crisis de 1994-1995; Capitulo VI, Aspectos GeoQuimicos y de Impacto Atmosferico, p. 245-256.
Geologic Background. Volcán Popocatépetl, whose name is the Aztec word for smoking mountain, rises 70 km SE of Mexico City to form North America's 2nd-highest volcano. The glacier-clad stratovolcano contains a steep-walled, 400 x 600 m wide crater. The generally symmetrical volcano is modified by the sharp-peaked Ventorrillo on the NW, a remnant of an earlier volcano. At least three previous major cones were destroyed by gravitational failure during the Pleistocene, producing massive debris-avalanche deposits covering broad areas to the south. The modern volcano was constructed south of the late-Pleistocene to Holocene El Fraile cone. Three major Plinian eruptions, the most recent of which took place about 800 CE, have occurred since the mid-Holocene, accompanied by pyroclastic flows and voluminous lahars that swept basins below the volcano. Frequent historical eruptions, first recorded in Aztec codices, have occurred since Pre-Columbian time.
Information Contacts: Claus Siebe and Hugo Delgado, Instituto de Geofisíca, UNAM, Cuidad Univ., 04510 D.F., México; Guillermo González- Pomposo, Carlos Valdés González, and Ana Lillian Martin del Pozzo, Departamento de Sismología y Volcanología, Instituto de Geofísica, UNAM, Cd. Universitaría, 04510, D.F., México; NOAA/NESDIS Synoptic Analysis Branch, Room 401, 5200 Auth Road, Camp Springs, MD 20746, USA.
Rabaul (Papua New Guinea) — January 1996 Cite this Report
Rabaul
Papua New Guinea
4.2459°S, 152.1937°E; summit elev. 688 m
All times are local (unless otherwise noted)
Explosive eruptions from Tavurvur
Low-level activity from Tavurvur throughout January continued with plumes containing low to moderate ash contents. The plumes were released at intervals of 3-10 minutes, sometimes accompanied by weak roaring or explosion sounds. Incandescent lava fragments were ejected during some ash emissions. Large explosions occurred on 3 (2), 17 (2), 19 (1), and 24 (1) January. These explosions deposited lava blocks, as large as 60-80 cm in diameter, 1-1.5 km from the vent. The plumes rose 400-1,000 m above Tavurvur and were generally blown SE, but sometimes in a broad arc extending from the SW to the N. Ashfalls were recorded at Talwat village, in the Kokopo area, and in Rabaul Town. No vapor emissions were observed from Vulcan.
Seismicity was higher in January compared to December, with three high-frequency earthquakes, 2,401 low-frequency earthquakes, and 1,404 explosion events. Discontinuous non-harmonic tremor also occurred during the month. High-frequency earthquakes that could be located occurred NE of the caldera. Except for three low-frequency earthquakes, which originated NW of the caldera, all the other seismicity was associated with eruptive activity at Tavurvur. The increase in the number of both types of events was also accompanied by an increase in their amplitudes.
Geologic Background. The low-lying Rabaul caldera on the tip of the Gazelle Peninsula at the NE end of New Britain forms a broad sheltered harbor utilized by what was the island's largest city prior to a major eruption in 1994. The outer flanks of the asymmetrical shield volcano are formed by thick pyroclastic-flow deposits. The 8 x 14 km caldera is widely breached on the east, where its floor is flooded by Blanche Bay and was formed about 1,400 years ago. An earlier caldera-forming eruption about 7,100 years ago is thought to have originated from Tavui caldera, offshore to the north. Three small stratovolcanoes lie outside the N and NE caldera rims. Post-caldera eruptions built basaltic-to-dacitic pyroclastic cones on the caldera floor near the NE and W caldera walls. Several of these, including Vulcan cone, which was formed during a large eruption in 1878, have produced major explosive activity during historical time. A powerful explosive eruption in 1994 occurred simultaneously from Vulcan and Tavurvur volcanoes and forced the temporary abandonment of Rabaul city.
Information Contacts: Ben Talai, Rabaul Volcano Observatory, P.O. Box 386, Rabaul, Papua New Guinea.
Rincon de la Vieja (Costa Rica) — January 1996 Cite this Report
Rincon de la Vieja
Costa Rica
10.83°N, 85.324°W; summit elev. 1916 m
All times are local (unless otherwise noted)
Eruption on 11-13 November followed by decreasing seismicity
The eruption that began on [6] November had ended by 13 November (BGVN 20:11/12), yet somewhat elevated seismicity (4 events/day) prevailed through late November. Although the seismic system (RIN3, 5 km SW of the active crater) later failed (all or partly inoperative, 3 December-3 January), it received low-frequency events during most of 1-10 December at the rate of 1-3 events/day, and on 6 December it recorded eight events. During January, RIN3 registered near background levels of seismicity: 8 events/month, consisting of two at low frequencies and six at high frequencies.
Geologic Background. Rincón de la Vieja, the largest volcano in NW Costa Rica, is a remote volcanic complex in the Guanacaste Range. The volcano consists of an elongated, arcuate NW-SE-trending ridge constructed within the 15-km-wide early Pleistocene Guachipelín caldera, whose rim is exposed on the south side. Sometimes known as the "Colossus of Guanacaste," it has an estimated volume of 130 km3 and contains at least nine major eruptive centers. Activity has migrated to the SE, where the youngest-looking craters are located. The twin cone of Santa María volcano, the highest peak of the complex, is located at the eastern end of a smaller, 5-km-wide caldera and has a 500-m-wide crater. A Plinian eruption producing the 0.25 km3 Río Blanca tephra about 3,500 years ago was the last major magmatic eruption. All subsequent eruptions, including numerous historical eruptions possibly dating back to the 16th century, have been from the prominent active crater containing a 500-m-wide acid lake located ENE of Von Seebach crater.
Information Contacts: Rodolfo Van der Laat, Vilma Barboza, Erick Fernández, Jorge Barquero, Franklin de Obaldia, Tomás Marino, and Rodrigo Sáenz, Observatorio Vulcanológico y Sismológico de Costa Rica, Universidad Nacional (OVSICORI-UNA), Apartado 86-3000, Heredia, Costa Rica.
Ruapehu (New Zealand) — January 1996 Cite this Report
Ruapehu
New Zealand
39.28°S, 175.57°E; summit elev. 2797 m
All times are local (unless otherwise noted)
Geochemical analyses of lake water; record glacial retreat continues
No significant eruptions are known to have occurred at Ruapehu since November 1995. During a crater lake inspection on 18 January 1996, in conditions of limited visibility, the crater floor was occupied by a 70-m diameter lake whose surface lay around 80 m below the overflow level. The lake was chiefly green-gray in color; the E part of the lake, beneath Pyramid Peak, was mostly clear. Vigorous fumaroles were present above the lake s W and N shores, and beneath Pyramid Peak. At the Peak s foot, new crater wall exposures revealed 20 m of steep fans composed of ash and deposits tentatively identified as lake sediments. Both of these deposits were being dissected and eroded into mudflows. A zone of 1995 ejecta, 5 m thick, included a scoria-and-block unit (probably erupted on 11 October) and fine-medium ash layers. Glaciers in the crater basin and Whangaehu continued their rapid, and in the experience of the IGNS observers, unprecedented, retreat.
A tilt-leveling survey was conducted using four Dome benchmarks falling along a 45-m-long line radial to the crater. The benchmarks had moved since last measured. Assuming site instability at these benchmarks had developed since the latest pre-eruption survey (April 1994), the Dome s deformation averaged 30 ± 10 µrad deflation.
Both earthquakes and tremor started to decline in mid- October. From 31 October-8 November, long-duration events almost completely ceased, while short-duration events continued unchanged. During the month of November through 18 January, the previously seen 2-Hz tremor ceased, replaced mainly by higher-frequency tremor. This 7-Hz tremor had amplitudes 3-4x higher than seen prior to the commencement of activity in September 1995. Numerous, short-duration high-frequency earthquakes continued to be recorded at the Dome station through December, January, and into February 1996, defining Ruapehu s most recent background seismicity.
Maximum fumarole temperatures in one area (station A, beneath peg I) had fallen from 281°C (December 6, 1995) to 92 °C (18 January). Despite the lower temperatures, the discharges were still vigorous but notably water-rich. H2/Ar temperatures fell only slightly over this period (from 397 to 392°C), suggesting that the cooling reflects near-surface quenching by shallow groundwater.
Analytical results for lake water samples are given in Table 10. These include samples taken on 6 December (by sampler suspended from a helicopter), and on 20 December 1995, and 18 January 1996 (from the lakeshore). A dilution trend with time is evident in the data, but it is not clear whether this represents an artifact of sampling or decreased magmatic input into the lake. So far, ratios of SO4/Cl and Mg/Cl show inconsistent trends. Much of the volcano s discharged heat and gases evaded the lake, to be released instead beyond the lake s NE and SW margins. A COSPEC flight on 31 December measured an SO2 flux of 1,295 ± 160 tons/day; this value was presumed to indicate continuing, steady state, open vent degassing.
Table 10. Lake water temperature and chemical analyses from Ruapehu, 6 and 20 December 1995, and 18 January 1996. Courtesy of IGNS.
| Date |
Lake Temp (°C) |
Mg |
SO4 |
Cl |
SO4/Cl |
Mg/Cl |
| 06 Dec 1995 |
57.7 |
903 |
11400 |
12536 |
0.909 |
0.072 |
| 20 Dec 1995 |
60.0 |
615 |
7070 |
8127 |
0.870 |
0.076 |
| 18 Jan 1996 |
49.6 |
367 |
5780 |
5664 |
1.021 |
0.065 |
Geologic Background. Ruapehu, one of New Zealand's most active volcanoes, is a complex stratovolcano constructed during at least four cone-building episodes dating back to about 200,000 years ago. The dominantly andesitic 110 km3 volcanic massif is elongated in a NNE-SSW direction and surrounded by another 100 km3 ring plain of volcaniclastic debris, including the NW-flank Murimoto debris-avalanche deposit. A series of subplinian eruptions took place between about 22,600 and 10,000 years ago, but pyroclastic flows have been infrequent. The broad summait area and flank contain at least six vents active during the Holocene. Frequent mild-to-moderate explosive eruptions have been recorded from the Te Wai a-Moe (Crater Lake) vent, and tephra characteristics suggest that the crater lake may have formed as recently as 3,000 years ago. Lahars resulting from phreatic eruptions at the summit crater lake are a hazard to a ski area on the upper flanks and lower river valleys.
Information Contacts: P.M. Otway, S. Sherburn, and I.A. Nairn, Institute of Geological & Nuclear Sciences (IGNS), Private Bag 2000, Wairakei, New Zealand.
Semeru (Indonesia) — January 1996 Cite this Report
Semeru
Indonesia
8.108°S, 112.922°E; summit elev. 3657 m
All times are local (unless otherwise noted)
Explosions, pyroclastic flows, and lava avalanches continue
Volcanic activity continued until the end of 1995 at a level of intensity comparable to August-October (BGVN 20:09). During November and December, small to moderate explosions and avalanches occurred from the Jonggring Seloko summit crater. The average plume height was 300-500 m. Pyroclastic avalanches descended along the Kembar river to a distance of 500-1,000 m from the summit. The number of lava avalanches increased during November, traveling down the Kembar river up to 300 m from the summit. On 27 December an incandescent lava flow traveled 500 m; during this event volcanic tremor was recorded with a maximum amplitude of 3 mm.
The frequency of volcanic earthquakes (both A- and B- types) during the November- December period ranged from 1 to 10 events/day. Volcanic tremor was recorded on 1, 2, 17, and 18 November; tremor from 15 to 18 December increased to 3-8 events/day (figure 9). Explosion earthquakes were variable (31-136 events/day), with two minima on 5 and 25 December (24 and 19 events/day, respectively) (figure 9).
Typical activity for this volcano was observed by Steve O'Meara on 13 November from the rim of Tengger Caldera. Thick cauliflower-shaped columns of gray ash rose up to 200 m high every 15-20 minutes, and the sky to the SW was spotted with ash clouds from previous eruptions. One event lasted ~5 minutes, generating a dark gray ash cloud that caused ashfall on the S slopes before detaching from the summit. Another eruption cloud spilled over the SW rim and flowed downslope.
Geologic Background. Semeru, the highest volcano on Java, and one of its most active, lies at the southern end of a volcanic massif extending north to the Tengger caldera. The steep-sided volcano, also referred to as Mahameru (Great Mountain), rises above coastal plains to the south. Gunung Semeru was constructed south of the overlapping Ajek-ajek and Jambangan calderas. A line of lake-filled maars was constructed along a N-S trend cutting through the summit, and cinder cones and lava domes occupy the eastern and NE flanks. Summit topography is complicated by the shifting of craters from NW to SE. Frequent 19th and 20th century eruptions were dominated by small-to-moderate explosions from the summit crater, with occasional lava flows and larger explosive eruptions accompanied by pyroclastic flows that have reached the lower flanks of the volcano.
Information Contacts: Wimpy S. Tjetjep (Director), Volcanological Survey of Indonesia (VSI), Jalan Diponegoro 57, Bandung, Indonesia; Steve O'Meara, PO Box 218, Volcano, HI 96785, USA.
Shishaldin (United States) — January 1996 Cite this Report
Shishaldin
United States
54.756°N, 163.97°W; summit elev. 2857 m
All times are local (unless otherwise noted)
Steam plumes; thermal anomaly on satellite images
An eruption on 23 December was first reported by pilots who observed an ash plume as high as 10.5 km altitude (BGVN 20:11/12). Possible very light ashfall was reported a few hours later 90 km away. Large steam plumes were reported in early January, and an intermittent "hot spot" was detected on AVHRR satellite imagery during 5-26 January, in the vicinity of the summit crater. This thermal anomaly may reflect unusually high temperatures in the vicinity of the continuously active fumaroles in the summit crater. AVO received no additional pilot reports or other observations of eruptive activity after 26 January.
Geologic Background. The symmetrical glacier-covered Shishaldin in the Aleutian Islands is the westernmost of three large stratovolcanoes in the eastern half of Unimak Island. The Aleuts named the volcano Sisquk, meaning "mountain which points the way when I am lost." Constructed atop an older glacially dissected edifice, it is largely basaltic in composition. Remnants of an older edifice are exposed on the W and NE sides at 1,500-1,800 m elevation. There are over two dozen pyroclastic cones on its NW flank, which is covered by massive aa lava flows. Frequent explosive activity, primarily consisting of Strombolian ash eruptions from the small summit crater, but sometimes producing lava flows, has been recorded since the 18th century. A steam plume often rises from the summit crater.
Information Contacts: Alaska Volcano Observatory.
Soputan (Indonesia) — January 1996 Cite this Report
Soputan
Indonesia
1.112°N, 124.737°E; summit elev. 1785 m
All times are local (unless otherwise noted)
Vapor emission and intense tremor; possible high ash
Activity in late 1995 consisted of whitish vapor emission to 25-100 m above the summit. During November occasional volcanic tremors were recorded with a maximum amplitude of 1.5 mm. Aviation reports on 7 November indicated increased eruptive activity with an ash cloud rising as high as 4.5 km altitude. Satellite imagery showed a possible ash cloud extending 90 km to the SW.
On 5 December, an increase in tremor amplitude up to 5 mm followed a tectonic earthquake felt throughout the Mimahassa Peninsula on Sulawesi. The same day maximum tremor amplitude reached 200 mm and glow was observed from three points on the lava dome. About an hour later tremor reached a maximum amplitude of 40 mm. On 6 December, tremor was still being recorded, but maximum amplitude had decreased to 2 mm.
Geologic Background. The Soputan stratovolcano on the southern rim of the Quaternary Tondano caldera on the northern arm of Sulawesi Island is one of Sulawesi's most active volcanoes. The youthful, largely unvegetated volcano is the only active cone in the Sempu-Soputan volcanic complex, which includes the Soputan caldera, Rindengan, and Manimporok (3.5 km ESE). Kawah Masem maar was formed in the W part of the caldera and contains a crater lake; sulfur has been extracted from fumarolic areas in the maar since 1938. Recent eruptions have originated at both the summit crater and Aeseput, a prominent NE-flank vent that formed in 1906 and was the source of intermittent major lava flows until 1924.
Information Contacts: Wimpy S. Tjetjep (Director), Volcanological Survey of Indonesia (VSI), Jalan Diponegoro 57, Bandung, Indonesia; Bureau of Meteorology, Northern Territory Regional Office, P.O. Box 735, Darwin, NT 0801 Australia.
Soufriere Hills (United Kingdom) — January 1996 Cite this Report
Soufriere Hills
United Kingdom
16.72°N, 62.18°W; summit elev. 915 m
All times are local (unless otherwise noted)
Dome growth continues
The dome continued to extrude in the breached summit crater. During January, subtle to dramatic variations occurred in the location, style, and rate of growth (with some areas undergoing up to 1-m vertical rise per day). Numerous spines grew, fell, and shattered. Besides obtaining the first samples of the new dome, fieldworkers established that the emplacement of the old dome (Castle Peak) was accompanied by one or more pyroclastic flows and lahars. The total seismic energy release for the last week of January was the highest since early December. Cumulative deformation measurements suggested inflation of the edifice.
Dome growth and visible observations. On 28-30 December 1995, the dome's E side grew 3 m upwards. Local avalanches accompanied this growth, but by 1 January both the growth and avalanches in this area temporarily slowed to a stop. Adjacent Castle Peak, on the new dome's S side where a small spine had formed on 26 December, volume increased without vertical growth in the week ending on 3 January. During that same week, significant steam escaped near the N part of the dome; the nearly continuous steam plume was sometimes charged with small amounts of ash.
Although dome growth appeared slow during part of the week ending on 10 January, it did not cease. Observers noted local avalanches (off both the dome's N and E sides) coupled with suggested swelling and new lava extrusions in the dome's central region. During this same week, the September spine appeared to move and tilt, and in the subsequent week the spine was pushed S by new dome growth. A new spine was identified on 10 January in the dome's center; this spine grew relatively rapidly until it fell down on 13 or 14 January. Other spines on the new dome also appeared to undergo a growth spurt.
Another spine appeared just after 14 January in the N dome area. Large parts of this spine had fallen by 18 January, possibly contributing to airborne ash seen on two occasions that day; the next day large blocks of the broken spine lay on the talus slope. Yet another spine appeared around 18 January along the S edge of the dome; it grew for two days prior to fall and breakup. Spalling material created a substantial talus pile in the S moat. On 20-21 January another spine grew in roughly the same spot. During the next two days this spine reached 25 m in height and 15 m in basal diameter prior to its partial collapse (an event correlated with significant ash emission on 23 January). Late in the week ending on 24 January, growth of the dome's S edge included growth of spines, spalling debris, slow swelling, and vertical growth.
Steam emissions were generally high during mid-January, and observers first saw new dome material piling up against the crater's W wall at the base of Chances Peak. The other side of the new dome extended a formidable distance up Castle Peak.
The most pronounced dome growth in the final week of January took the form of swelling on the dome's steeply sloping N margin. Although early in the week mass wasting repeatedly sent debris into the adjacent moat, later in the week this took place less frequently. On 26 January a spine was again noted in the dome's S area, but growth there on 28 January was manifested as swelling. Beginning on about 29 January on the N and S ends of the new dome observers saw two elongate ridges trending NE-SW. These appeared as rough mirror images of each other, their forms resembling whale backs.
Lofted ash and mass wasting. Airborne ash seen during January was mainly attributed to mass wasting. For example, a small amount of ash fell in Plymouth early on 4 January; the source was thought to have been a crater-confined rock avalanche off the dome. Minor ash fell in Plymouth four times on 12 January, and one time on both 15 and 16 January. Four ash emission events on 24 January were all associated with major rock-fall events on the lava dome. In some cases very minor ash emissions also issued directly from the dome and some of the material involved in mass wasting may have been dislodged by small explosions.
Visual observations into the crater have enabled good correlation between seismic signals and rock-fall events. During the week ending on 24 January, heat production from the dome appeared somewhat higher than in the past. During January dome incandescence was reported and some material within the rock falls was hot. Rockfalls and avalanches remained confined within the crater area, although the moat continued to gradually fill with debris.
Field studies. Good conditions on 8 January enabled the collection of a sample from the part of the new dome located within the 18 July vent, an area thought to have been extruded in late November. The crystal-rich sample contained dominant plagioclase, subordinate pyroxene and hornblende; parts of the sample were sent to four labs for further analysis.
Around the same time, other fieldwork in flanking drainages (Hot River and Fort Ghaut) found new exposures and established that several charcoal-bearing pyroclastic units (including at least one pyroclastic flow unit) were erupted during the growth of Castle Peak dome. These were also found adjacent to deposits having the character of lahars.
Deformation. EDM lines composed a network consisting of four surveyed triangles around the volcano. The lines continued to be measured routinely. Dry-tilt sites at Amersham and Brodericks on the volcano's W side were re-occupied during the early part of the week ending 10 January; neither showed any change since their last occupation in October. During January, the Spring Hill tiltmeter failed and was moved to a new site, but the Long Ground tiltmeter continued to indicate angular stability.
Looked at in the short term, EDM measurements taken during the first half of January did not show any changes in slant distance (above the error of the method); however, during the week ending 17 January it was reported that a slow shortening had occurred on many of the lines towards the volcano. The shortening indicated swelling of the edifice.
In the week ending on 24 January, it was reported that slant line distance in the NE sector (Tar River to Castle Peak area) underwent a 2.5-cm shortening over the period of a month. During the shorter interval of the final week of January, no changes above the error of the method were detected in slant distance measurements on two deformation triangles in the volcano's S to SW and NE sectors (the Galways-Chance's Peak-O Garra's and Long Ground-White's Yard-Castle Peak triangles).
Seismicity. During January, broadband tremor commonly registered on the Gages station. Tremor was generally absent at the other stations, although the Long Ground station also registered some tremor in mid-January. The number of daily earthquakes typically measured in the thousands (eg. 5,000 to 6,000 events at the closest station on 27 January), too numerous to count on a real-time basis. Instead, MVO often quantified seismicity for rapid dissemination by using located events. These are events for which a hypocenter (the earthquake focus, the point at which the first motion originates) was calculated based on one S-wave and the records from four stations.
An MVO report on 3 January stated that long-period events recorded at most seismic stations had been occurring at a rate of 10-15/day. The hypocenters for these events could not be found but they were thought to be at very shallow depths in the crater area. Later reports in January did not quantify the rate of occurrence for long-period events.
Late on 5 January, broadband tremor picked up slightly in amplitude at Gages station. Then, small long-period events occurred for about the next 12 hours. This was followed by an 8-hour swarm of >300 hybrid events with virtually identical waveforms <3 km beneath the volcano. Lower amplitude, regular hybrid events occurred every 1-2 minutes until 8 January. A smaller series of similar hybrid events took place on 12-15 January. Some initially small hybrid events that first appeared on 23 January grew in amplitude and rate of occurrence (to 6-7/minute) and continued until at least 31 January. During the last week of January these hybrid events formed the dominant seismic activity. repeated shallow hybrid events in early January within the crater preceded new dome growth by a few days. This had happened on at least two previous occassions.
During the first week of January, shallow (0-7 km depth) volcano-tectonic earthquakes with epicenters scattered around the volcano continued at a rate of 2-3/day. An exception was 1 January, when a cluster of 17 volcano-tectonic earthquakes took place just N of the active crater at 1-3 km depths. They occurred in an eight-hour period following an M 5.0 earthquake that struck at a depth of 25 km, centered ~55 km N of Port of Spain, Trinidad. This larger earthquake may have been the trigger for the 1 January seismicity.
Three small, 1-3 km deep, volcano-tectonic earthquakes struck SW of the island during mid-January. Very occasional, small, long-period earthquakes started to appear on the evening of 28 January and a solitary volcano-tectonic earthquake took place early on the 29th. This M 2-2.5 earthquake was located beneath the crater area at a depth of 2.8 km; it was felt by Long Ground area residents.
Crisis management. The eruption driving the current crisis began on 18 July 1995 (BGVN 20:06). According to the Montserrat Government Information Unit (on 13 February 1996), during the crisis there has been no official off-island evacuation. However, a phased relocation of 6,000 residents from the southern half of the island to the northern half immediately followed a large phreatic eruption on the morning of 21 August 1995. Ash from that eruption's cloud, and from a density current that flowed down the flanks of the volcano, caused darkness in the capital (Plymouth) and surrounding areas, and ultimately deposited several millimeters of ash there. The relocation order was partially lifted on 3 September, a day before the passage of Hurricane Luis.
A change in eruptive style in mid-November ultimately lead to the extrusion of lava at the surface. On 1 December 1995 a second relocation of 4,000 residents took place. The relocation lasted a month for residents on the island's SW side and about a month-and-a-half for those on the island's SE side. Some preparatory steps for future emergencies included the continued relocation of Glendon Hospital and newly acquired school buses to move residents.
Geologic Background. The complex, dominantly andesitic Soufrière Hills volcano occupies the southern half of the island of Montserrat. The summit area consists primarily of a series of lava domes emplaced along an ESE-trending zone. The volcano is flanked by Pleistocene complexes to the north and south. English's Crater, a 1-km-wide crater breached widely to the east by edifice collapse, was formed about 2000 years ago as a result of the youngest of several collapse events producing submarine debris-avalanche deposits. Block-and-ash flow and surge deposits associated with dome growth predominate in flank deposits, including those from an eruption that likely preceded the 1632 CE settlement of the island, allowing cultivation on recently devegetated land to near the summit. Non-eruptive seismic swarms occurred at 30-year intervals in the 20th century, but no historical eruptions were recorded until 1995. Long-term small-to-moderate ash eruptions beginning in that year were later accompanied by lava-dome growth and pyroclastic flows that forced evacuation of the southern half of the island and ultimately destroyed the capital city of Plymouth, causing major social and economic disruption.
Information Contacts: Montserrat Volcano Observatory (MVO), c/o Chief Minister's Office, PO Box 292, Plymouth, Montserrat.
Suwanosejima (Japan) — January 1996 Cite this Report
Suwanosejima
Japan
29.638°N, 129.714°E; summit elev. 796 m
All times are local (unless otherwise noted)
Small eruptions in January; nine explosions throughout 1995
Monitoring from the Sakurajima Volcanological Observatory revealed nine explosions from Suwanose-jima in 1995. According to the Japan Meteorological Agency and the Kagoshima Prefectural Government, small eruptions during 10-13 January 1996 sent plumes 300-600 m above the volcano and caused ashfall to the S. Activity has been high since 1950, with 1-2 ash emissions every month, and some Strombolian explosions.
Geologic Background. The 8-km-long island of Suwanosejima in the northern Ryukyu Islands consists of an andesitic stratovolcano with two active summit craters. The summit is truncated by a large breached crater extending to the sea on the E flank that was formed by edifice collapse. One of Japan's most frequently active volcanoes, it was in a state of intermittent Strombolian activity from Otake, the NE summit crater, between 1949 and 1996, after which periods of inactivity lengthened. The largest recorded eruption took place in 1813-14, when thick scoria deposits covered residential areas, and the SW crater produced two lava flows that reached the western coast. At the end of the eruption the summit of Otake collapsed, forming a large debris avalanche and creating an open collapse scarp extending to the eastern coast. The island remained uninhabited for about 70 years after the 1813-1814 eruption. Lava flows reached the eastern coast of the island in 1884. Only about 50 people live on the island.
Information Contacts: Volcano Research Center, Earthquake Research Institute, University of Tokyo, Yayoi 1-1-1, Bunkyo-ku, Tokyo 113, Japan (URL: http://www.eri.u-tokyo.ac.jp/VRC/index_E.html).
Turrialba (Costa Rica) — January 1996 Cite this Report
Turrialba
Costa Rica
10.025°N, 83.767°W; summit elev. 3340 m
All times are local (unless otherwise noted)
Weak fumarolic activity
During January, observers witnessed weak fumarolic activity continuing along the NE, N, NW, and W walls. Fumarole temperatures measured 83-89 °C. Mass wasting had taken place mainly on the S and W walls.
Geologic Background. Turrialba, the easternmost of Costa Rica's Holocene volcanoes, is a large vegetated basaltic-to-dacitic stratovolcano located across a broad saddle NE of Irazú volcano overlooking the city of Cartago. The massive edifice covers an area of 500 km2. Three well-defined craters occur at the upper SW end of a broad 800 x 2200 m summit depression that is breached to the NE. Most activity originated from the summit vent complex, but two pyroclastic cones are located on the SW flank. Five major explosive eruptions have occurred during the past 3500 years. A series of explosive eruptions during the 19th century were sometimes accompanied by pyroclastic flows. Fumarolic activity continues at the central and SW summit craters.
Information Contacts: Rodolfo Van der Laat, Vilma Barboza, Erick Fernández, Jorge Barquero, Franklin de Obaldia, Tomás Marino, and Rodrigo Sáenz, Observatorio Vulcanológico y Sismológico de Costa Rica, Universidad Nacional (OVSICORI-UNA), Apartado 86-3000, Heredia, Costa Rica.