Recently Published Bulletin Reports
Manam (Papua New Guinea) Few ash plumes during November-December 2022
Krakatau (Indonesia) Strombolian activity and ash plumes during November 2022-April 2023
Stromboli (Italy) Strombolian explosions and lava flows continue during January-April 2023
Nishinoshima (Japan) Small ash plumes and fumarolic activity during November 2022 through April 2023
Karangetang (Indonesia) Lava flows, incandescent avalanches, and ash plumes during January-June 2023
Ahyi (United States) Intermittent hydroacoustic signals and discolored plumes during November 2022-June 2023
Kadovar (Papua New Guinea) An ash plume and weak thermal anomaly during May 2023
San Miguel (El Salvador) Small gas-and-ash explosions during March and May 2023
Semisopochnoi (United States) Occasional explosions, ash deposits, and gas-and-steam plumes during December 2022-May 2023
Ebeko (Russia) Continued explosions, ash plumes, and ashfall during October 2022-May 2023
Home Reef (Tonga) Discolored plumes continued during November 2022-April 2023
Ambae (Vanuatu) New lava flow, ash plumes, and sulfur dioxide plumes during February-May 2023
Manam (Papua New Guinea) — July 2023  Cite this Report
Manam
Papua New Guinea
4.08°S, 145.037°E; summit elev. 1807 m
All times are local (unless otherwise noted)
Few ash plumes during November-December 2022
Manam is a 10-km-wide island that consists of two active summit craters: the Main summit crater and the South summit crater and is located 13 km off the northern coast of mainland Papua New Guinea. Frequent mild-to-moderate eruptions have been recorded since 1616. The current eruption period began during June 2014 and has more recently been characterized by intermittent ash plumes and thermal activity (BGVN 47:11). This report updates activity that occurred from November 2022 through May 2023 based on information from the Darwin Volcanic Ash Advisory Center (VAAC) and various satellite data.
Ash plumes were reported during November and December 2022 by the Darwin VAAC. On 7 November an ash plume rose to 2.1 km altitude and drifted NE based on satellite images and weather models. On 14 November an ash plume rose to 2.1 km altitude and drifted W based on RVO webcam images. On 20 November ash plumes rose to 1.8 km altitude and drifted NW. On 26 December an ash plume rose to 3 km altitude and drifted S and SSE.
Intermittent sulfur dioxide plumes were detected using the TROPOMI instrument on the Sentinel-5P satellite, some of which exceeded at least two Dobson Units (DU) and drifted in different directions (figure 93). Occasional low-to-moderate power thermal anomalies were recorded by the MIROVA (Middle InfraRed Observation of Volcanic Activity) system; less than five anomalies were recorded each month during November 2022 through May 2023 (figure 94). Two thermal hotspots were detected by the MODVOLC thermal alerts system on 10 December 2022. On clear weather days, thermal activity was also captured in infrared satellite imagery in both the Main and South summit craters, accompanied by gas-and-steam emissions (figure 95).
Geologic Background. The 10-km-wide island of Manam, lying 13 km off the northern coast of mainland Papua New Guinea, is one of the country's most active volcanoes. Four large radial valleys extend from the unvegetated summit of the conical basaltic-andesitic stratovolcano to its lower flanks. These valleys channel lava flows and pyroclastic avalanches that have sometimes reached the coast. Five small satellitic centers are located near the island's shoreline on the northern, southern, and western sides. Two summit craters are present; both are active, although most observed eruptions have originated from the southern crater, concentrating eruptive products during much of the past century into the SE valley. Frequent eruptions, typically of mild-to-moderate scale, have been recorded since 1616. Occasional larger eruptions have produced pyroclastic flows and lava flows that reached flat-lying coastal areas and entered the sea, sometimes impacting populated areas.
Information Contacts: Rabaul Volcano Observatory (RVO), Geohazards Management Division, Department of Mineral Policy and Geohazards Management (DMPGM), PO Box 3386, Kokopo, East New Britain Province, Papua New Guinea; Darwin Volcanic Ash Advisory Centre (VAAC), Bureau of Meteorology, Northern Territory Regional Office, PO Box 40050, Casuarina, NT 0811, Australia (URL: http://www.bom.gov.au/info/vaac/); MIROVA (Middle InfraRed Observation of Volcanic Activity), a collaborative project between the Universities of Turin and Florence (Italy) supported by the Centre for Volcanic Risk of the Italian Civil Protection Department (URL: http://www.mirovaweb.it/); Hawai'i Institute of Geophysics and Planetology (HIGP) - MODVOLC Thermal Alerts System, School of Ocean and Earth Science and Technology (SOEST), Univ. of Hawai'i, 2525 Correa Road, Honolulu, HI 96822, USA (URL: http://modis.higp.hawaii.edu/); NASA Global Sulfur Dioxide Monitoring Page, Atmospheric Chemistry and Dynamics Laboratory, NASA Goddard Space Flight Center (NASA/GSFC), 8800 Greenbelt Road, Goddard, Maryland, USA (URL: https://so2.gsfc.nasa.gov/); Copernicus Browser, Copernicus Data Space Ecosystem, European Space Agency (URL: https://dataspace.copernicus.eu/browser/).
Krakatau (Indonesia) — July 2023 Cite this Report
Krakatau
Indonesia
6.1009°S, 105.4233°E; summit elev. 285 m
All times are local (unless otherwise noted)
Strombolian activity and ash plumes during November 2022-April 2023
Krakatau is located in the Sunda Strait between Java and Sumatra, Indonesia. Caldera collapse during the catastrophic 1883 eruption destroyed Danan and Perbuwatan cones and left only a remnant of Rakata. The post-collapse cone of Anak Krakatau (Child of Krakatau) was constructed within the 1883 caldera at a point between the former Danan and Perbuwatan cones; it has been the site of frequent eruptions since 1927. The current eruption period began in May 2021 and has recently consisted of explosions, ash plumes, and thermal activity (BGVN 47:11). This report covers activity during November 2022 through April 2023 based on information provided by the Indonesian Center for Volcanology and Geological Hazard Mitigation, referred to as Pusat Vulkanologi dan Mitigasi Bencana Geologi (PVMBG), MAGMA Indonesia, the Darwin Volcanic Ash Advisory Center (VAAC), and several sources of satellite data.
Activity was relatively low during November and December 2022. Daily white gas-and-steam plumes rose 25-100 m above the summit and drifted in different directions. Gray ash plumes rose 200 m above the summit and drifted NE at 1047 and at 2343 on 11 November. On 14 November at 0933 ash plumes rose 300 m above the summit and drifted E. An ash plume was reported at 0935 on 15 December that rose 100 m above the summit and drifted NE. An eruptive event at 1031 later that day generated an ash plume that rose 700 m above the summit and drifted NE. A gray ash plume at 1910 rose 100 m above the summit and drifted E. Incandescent material was ejected above the vent based on an image taken at 1936.
During January 2023 daily white gas-and-steam plumes rose 25-300 m above the summit and drifted in multiple directions. Gray-to-brown ash plumes were reported at 1638 on 3 January, at 1410 and 1509 on 4 January, and at 0013 on 5 January that rose 100-750 m above the summit and drifted NE and E; the gray-to-black ash plume at 1509 on 4 January rose as high as 3 km above the summit and drifted E. Gray ash plumes were recorded at 1754, 2241, and 2325 on 11 January and at 0046 on 12 January and rose 200-300 m above the summit and drifted NE. Toward the end of January, PVMBG reported that activity had intensified; Strombolian activity was visible in webcam images taken at 0041, 0043, and 0450 on 23 January. Multiple gray ash plumes throughout the day rose 200-500 m above the summit and drifted E and SE (figure 135). Webcam images showed progressively intensifying Strombolian activity at 1919, 1958, and 2113 on 24 January; a gray ash plume at 1957 rose 300 m above the summit and drifted E (figure 135). Eruptive events at 0231 and 2256 on 25 January and at 0003 on 26 January ejected incandescent material from the vent, based on webcam images. Gray ash plumes observed during 26-27 January rose 300-500 m above the summit and drifted NE, E, and SE.
Low levels of activity were reported during February and March. Daily white gas-and-steam plumes rose 25-300 m above the summit and drifted in different directions. The Darwin VAAC reported that continuous ash emissions rose to 1.5-1.8 km altitude and drifted W and NW during 1240-1300 on 10 March, based on satellite images, weather models, and PVMBG webcams. White-and-gray ash plumes rose 500 m and 300 m above the summit and drifted SW at 1446 and 1846 on 18 March, respectively. An eruptive event was recorded at 2143, though it was not visible due to darkness. Multiple ash plumes were reported during 27-29 March that rose as high as 2.5 km above the summit and drifted NE, W, and SW (figure 136). Webcam images captured incandescent ejecta above the vent at 0415 and around the summit area at 2003 on 28 March and at 0047 above the vent on 29 March.
Daily white gas-and-steam plumes rose 25-300 m above the summit and drifted in multiple directions during April and May. White-and-gray and black plumes rose 50-300 m above the summit on 2 and 9 April. On 11 May at 1241 a gray ash plume rose 1-3 km above the summit and drifted SW. On 12 May at 0920 a gray ash plume rose 2.5 km above the summit and drifted SW and at 2320 an ash plume rose 1.5 km above the summit and drifted SW. An accompanying webcam image showed incandescent ejecta. On 13 May at 0710 a gray ash plume rose 2 km above the summit and drifted SW (figure 137).
The MIROVA (Middle InfraRed Observation of Volcanic Activity) graph of MODIS thermal anomaly data showed intermittent low-to-moderate power thermal anomalies during November 2022 through April 2023 (figure 138). Some of this thermal activity was also visible in infrared satellite imagery at the crater, accompanied by gas-and-steam and ash plumes that drifted in different directions (figure 139).
Geologic Background. The renowned Krakatau (frequently mis-named as Krakatoa) volcano lies in the Sunda Strait between Java and Sumatra. Collapse of an older edifice, perhaps in 416 or 535 CE, formed a 7-km-wide caldera. Remnants of that volcano are preserved in Verlaten and Lang Islands; subsequently the Rakata, Danan, and Perbuwatan cones were formed, coalescing to create the pre-1883 Krakatau Island. Caldera collapse during the catastrophic 1883 eruption destroyed Danan and Perbuwatan, and left only a remnant of Rakata. This eruption caused more than 36,000 fatalities, most as a result of tsunamis that swept the adjacent coastlines of Sumatra and Java. Pyroclastic surges traveled 40 km across the Sunda Strait and reached the Sumatra coast. After a quiescence of less than a half century, the post-collapse cone of Anak Krakatau (Child of Krakatau) was constructed within the 1883 caldera at a point between the former Danan and Perbuwatan cones. Anak Krakatau has been the site of frequent eruptions since 1927.
Information Contacts: Pusat Vulkanologi dan Mitigasi Bencana Geologi (PVMBG, also known as Indonesian Center for Volcanology and Geological Hazard Mitigation, CVGHM), Jalan Diponegoro 57, Bandung 40122, Indonesia (URL: http://www.vsi.esdm.go.id/); MAGMA Indonesia, Kementerian Energi dan Sumber Daya Mineral (URL: https://magma.esdm.go.id/v1); Darwin Volcanic Ash Advisory Centre (VAAC), Bureau of Meteorology, Northern Territory Regional Office, PO Box 40050, Casuarina, NT 0811, Australia (URL: http://www.bom.gov.au/info/vaac/); MIROVA (Middle InfraRed Observation of Volcanic Activity), a collaborative project between the Universities of Turin and Florence (Italy) supported by the Centre for Volcanic Risk of the Italian Civil Protection Department (URL: http://www.mirovaweb.it/); Copernicus Browser, Copernicus Data Space Ecosystem, European Space Agency (URL: https://dataspace.copernicus.eu/browser/).
Stromboli
Italy
38.789°N, 15.213°E; summit elev. 924 m
All times are local (unless otherwise noted)
Strombolian explosions and lava flows continue during January-April 2023
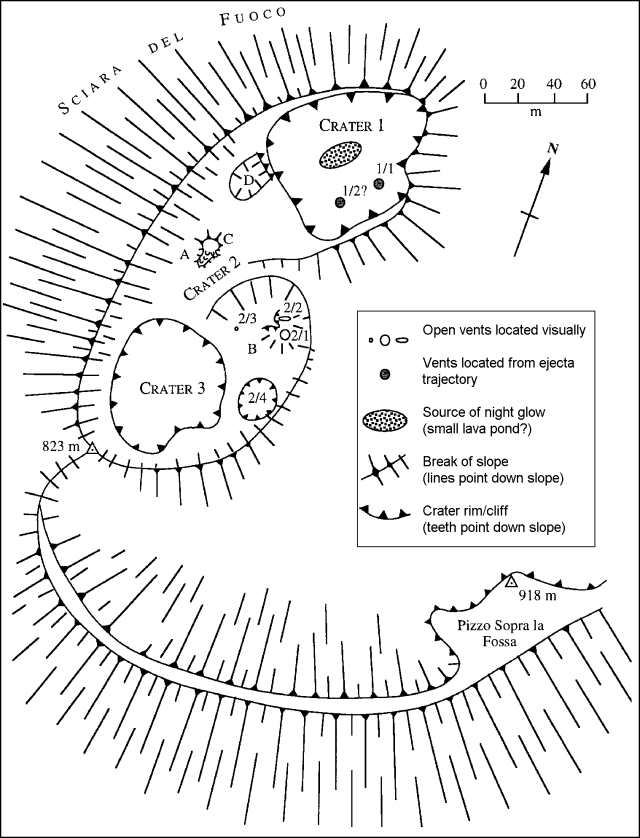
Stromboli, located in Italy, has exhibited nearly constant lava fountains for the past 2,000 years; recorded eruptions date back to 350 BCE. Eruptive activity occurs at the summit from multiple vents, which include a north crater area (N area) and a central-southern crater (CS area) on a terrace known as the ‘terrazza craterica’ at the head of the Sciara del Fuoco, a large scarp that runs from the summit down the NW side of the volcano-island. Activity typically consists of Strombolian explosions, incandescent ejecta, lava flows, and pyroclastic flows. Thermal and visual monitoring cameras are located on the nearby Pizzo Sopra La Fossa, above the terrazza craterica, and at multiple flank locations. The current eruption period has been ongoing since 1934 and recent activity has consisted of frequent Strombolian explosions and lava flows (BGVN 48:02). This report updates activity during January through April 2023 primarily characterized by Strombolian explosions and lava flows based on reports from Italy's Istituto Nazionale di Geofisica e Vulcanologia (INGV) and various satellite data.
Frequent explosive activity continued throughout the reporting period, generally in the low-to-medium range, based on the number of hourly explosions in the summit crater (figure 253, table 16). Intermittent thermal activity was recorded by the MIROVA (Middle InfraRed Observation of Volcanic Activity) analysis of MODIS satellite data (figure 254). According to data collected by the MODVOLC thermal algorithm, a total of 9 thermal alerts were detected: one on 2 January 2023, one on 1 February, five on 24 March, and two on 26 March. The stronger pulses of thermal activity likely reflected lava flow events. Infrared satellite imagery captured relatively strong thermal hotspots at the two active summit craters on clear weather days, showing an especially strong event on 8 March (figure 255).
Table 16. Summary of type, frequency, and intensity of explosive activity at Stromboli by month during January-April 2023; information from webcam observations. Courtesy of INGV weekly reports.
| Month |
Explosive Activity |
| Jan 2023 |
Typical Strombolian activity with spattering and lava overflows in the N crater area. Explosions were reported from 4 vents in the N area and 1-2 vents in the CS area. The average hourly frequency of explosions was low-to-medium (1-12 events/hour). The intensity of the explosions varied from low (less than 80 m high) to medium (less than 150 m high) in the N crater area and up to high (greater than 150 m high) in the CS crater area. |
| Feb 2023 |
Typical Strombolian activity with spattering in the N crater area. Explosions were reported from 2-3 vents in the N area and 1-4 vents in the CS area. The average hourly frequency of explosions was low-to-medium (1-14 events/hour). The intensity of the explosions varied from low (less than 80 m high) to medium (less than 150 m high) in the N crater area and up to high (greater than 150 m high) in the CS crater area. |
| Mar 2023 |
Typical Strombolian activity with spattering and lava overflows in the N crater area. Explosions were reported from 2-3 vents in the N area and 2-4 vents in the CS area. The average hourly frequency of explosions was low-to-medium (1-18 events/hour). The intensity of the explosions varied from low (less than 80 m high) to medium (less than 150 m high) in the N crater area and up to high (greater than 150 m high) in the CS crater area. |
| Apr 2023 |
Typical Strombolian activity. Explosions were reported from 2 vents in the N area and 2-3 vents in the CS area. The average hourly frequency of explosions was low-to-high (1-16 events/hour). The intensity of the explosions varied from low (less than 80 m high) to medium (less than 150 m high) in both the N and CS crater areas. |
Activity during January-February 2023. Strombolian explosions were reported in the N crater area, as well as lava effusion. Explosive activity in the N crater area ejected coarse material (bombs and lapilli). Intense spattering was observed in both the N1 and N2 craters. In the CS crater area, explosions generally ejected fine material (ash), sometimes to heights greater than 250 m. The intensity of the explosions was characterized as low-to-medium in the N crater and medium-to-high in the CS crater. After intense spattering activity from the N crater area, a lava overflow began at 2136 on 2 January that flowed part way down the Sciara del Fuoco, possibly moving down the drainage that formed in October, out of view from webcams. The flow remained active for a couple of hours before stopping and beginning to cool. A second lava flow was reported at 0224 on 4 January that similarly remained active for a few hours before stopping and cooling. Intense spattering was observed on 11 and 13 January from the N1 crater. After intense spattering activity at the N2 crater at 1052 on 17 January another lava flow started to flow into the upper part of the Sciara del Fuoco (figure 256), dividing into two: one that traveled in the direction of the drainage formed in October, and the other one moving parallel to the point of emission. By the afternoon, the rate of the flow began to decrease, and at 1900 it started to cool. A lava flow was reported at 1519 on 24 January following intense spattering in the N2 area, which began to flow into the upper part of the Sciara del Fuoco. By the morning of 25 January, the lava flow had begun to cool. During 27 January the frequency of eruption in the CS crater area increased to 6-7 events/hour compared to the typical 1-7 events/hour; the following two days showed a decrease in frequency to less than 1 event/hour. Starting at 1007 on 30 January a high-energy explosive sequence was produced by vents in the CS crater area. The sequence began with an initial energetic pulse that lasted 45 seconds, ejecting predominantly coarse products 300 m above the crater that fell in an ESE direction. Subsequent and less intense explosions ejected material 100 m above the crater. The total duration of this event lasted approximately two minutes. During 31 January through 6, 13, and 24 February spattering activity was particularly intense for short periods in the N2 crater.
An explosive sequence was reported on 16 February that was characterized by a major explosion in the CS crater area (figure 257). The sequence began at 1817 near the S2 crater that ejected material radially. A few seconds later, lava fountains were observed in the central part of the crater. Three explosions of medium intensity (material was ejected less than 150 m high) were recorded at the S2 crater. The first part of this sequence lasted approximately one minute, according to INGV, and material rose 300 m above the crater and then was deposited along the Sciara del Fuoco. The second phase began at 1818 at the S1 crater; it lasted seven seconds and material was ejected 150 m above the crater. Another event 20 seconds later lasted 12 seconds, also ejecting material 150 m above the crater. The sequence ended with at least three explosions of mostly fine material from the S1 crater. The total duration of this sequence was about two minutes.
Short, intense spattering activity was noted above the N1 crater on 27 and 28 February. A lava overflow was first reported at 0657 from the N2 crater on 27 February that flowed into the October 2022 drainage. By 1900 the flow had stopped. A second lava overflow also in the N crater area occurred at 2149, which overlapped the first flow and then stopped by 0150 on 28 February. Material detached from both the lava overflows rolled down the Sciara del Fuoco, some of which was visible in webcam images.
Activity during March-April 2023. Strombolian activity continued with spattering activity and lava overflows in the N crater area during March. Explosive activity at the N crater area varied from low (less than 80 m high) to medium (less than 150 m high) and ejected coarse material, such as bombs and lapilli. Spattering was observed above the N1 crater, while explosive activity at the CS crater area varied from medium to high (greater than 150 m high) and ejected coarse material. Intense spattering activity was observed for short periods on 6 March above the N1 crater. At approximately 0610 a lava overflow was reported around the N2 crater on 8 March, which then flowed into the October 2022 drainage. By 1700 the flow started to cool. A second overflow began at 1712 on 9 March and overlapped the previous flow. It had stopped by 2100. Material from both flows was deposited along the Sciara del Fuoco, though much of the activity was not visible in webcam images. On 11 March a lava overflow was observed at 0215 that overlapped the two previous flows in the October 2022 drainage. By late afternoon on 12 March, it had stopped.
During a field excursion on 16 March, scientists noted that a vent in the central crater area was degassing. Another vent showed occasional Strombolian activity that emitted ash and lapilli. During 1200-1430 low-to-medium intense activity was reported; the N1 crater emitted ash emissions and the N2 crater emitted both ash and coarse material. Some explosions also occurred in the CS crater area that ejected coarse material. The C crater in the CS crater area occasionally showed gas jetting and low intensity explosions on 17 and 22 March; no activity was observed at the S1 crater. Intense, longer periods of spattering were reported in the N1 crater on 19, 24, and 25 March. Around 2242 on 23 March a lava overflow began from the N1 crater that, after about an hour, began moving down the October 2022 drainage and flow along the Sciara del Fuoco (figure 258). Between 0200 and 0400 on 26 March the flow rate increased, which generated avalanches of material from collapses at the advancing flow front. By early afternoon, the flow began to cool. On 25 March at 1548 an explosive sequence began from one of the vents at S2 in the CS crater area (figure 258). Fine ash mixed with coarse material was ejected 300 m above the crater rim and drifted SSE. Some modest explosions around Vent C were detected at 1549 on 25 March, which included an explosion at 1551 that ejected coarse material. The entire explosive sequence lasted approximately three minutes.
During April explosions persisted in both the N and CS crater areas. Fine material was ejected less than 80 m above the N crater rim until 6 April, followed by ejection of coarser material. Fine material was also ejected less than 80 m above the CS crater rim. The C and S2 crater did not show significant eruptive activity. On 7 April an explosive sequence was detected in the CS crater area at 1203 (figure 259). The first explosion lasted approximately 18 seconds and ejected material 400 m above the crater rim, depositing pyroclastic material in the upper part of the Sciara del Fuoco. At 1204 a second, less intense explosion lasted approximately four seconds and deposited pyroclastic products outside the crater area and near Pizzo Sopra La Fossa. A third explosion at 1205 was mainly composed of ash that rose about 150 m above the crater and lasted roughly 20 seconds. A fourth explosion occurred at 1205 about 28 seconds after the third explosion and ejected a mixture of coarse and fine material about 200 m above the crater; the explosion lasted roughly seven seconds. Overall, the entire explosive sequence lasted about two minutes and 20 seconds. After the explosive sequence on 7 April, explosions in both the N and CS crater areas ejected material as high as 150 m above the crater.
On 21 April research scientists from INGV made field observations in the summit area of Stromboli, and some lapilli samples were collected. In the N crater area near the N1 crater, a small cone was observed with at least two active vents, one of which was characterized by Strombolian explosions. The other vent produced explosions that ejected ash and chunks of cooled lava. At the N2 crater at least one vent was active and frequently emitted ash. In the CS crater area, a small cone contained 2-3 degassing vents and a smaller, possible fissure area also showed signs of degassing close to the Pizzo Sopra La Fossa. In the S part of the crater, three vents were active: a small hornito was characterized by modest and rare explosions, a vent that intermittently produced weak Strombolian explosions, and a vent at the end of the terrace that produced frequent ash emissions. Near the S1 crater there was a hornito that generally emitted weak gas-and-steam emissions, sometimes associated with “gas rings”. On 22 April another field inspection was carried out that reported two large sliding surfaces on the Sciara del Fuoco that showed where blocks frequently descended toward the sea. A thermal anomaly was detected at 0150 on 29 April.
Geologic Background. Spectacular incandescent nighttime explosions at Stromboli have long attracted visitors to the "Lighthouse of the Mediterranean" in the NE Aeolian Islands. This volcano has lent its name to the frequent mild explosive activity that has characterized its eruptions throughout much of historical time. The small island is the emergent summit of a volcano that grew in two main eruptive cycles, the last of which formed the western portion of the island. The Neostromboli eruptive period took place between about 13,000 and 5,000 years ago. The active summit vents are located at the head of the Sciara del Fuoco, a prominent scarp that formed about 5,000 years ago due to a series of slope failures which extends to below sea level. The modern volcano has been constructed within this scarp, which funnels pyroclastic ejecta and lava flows to the NW. Essentially continuous mild Strombolian explosions, sometimes accompanied by lava flows, have been recorded for more than a millennium.
Information Contacts: Istituto Nazionale di Geofisica e Vulcanologia (INGV), Sezione di Catania, Piazza Roma 2, 95123 Catania, Italy, (URL: http://www.ct.ingv.it/en/); MIROVA (Middle InfraRed Observation of Volcanic Activity), a collaborative project between the Universities of Turin and Florence (Italy) supported by the Centre for Volcanic Risk of the Italian Civil Protection Department (URL: http://www.mirovaweb.it/); Hawai'i Institute of Geophysics and Planetology (HIGP) - MODVOLC Thermal Alerts System, School of Ocean and Earth Science and Technology (SOEST), Univ. of Hawai'i, 2525 Correa Road, Honolulu, HI 96822, USA (URL: http://modis.higp.hawaii.edu/); Copernicus Browser, Copernicus Data Space Ecosystem, European Space Agency (URL: https://dataspace.copernicus.eu/browser/).
Nishinoshima (Japan) — July 2023 Cite this Report
Nishinoshima
Japan
27.247°N, 140.874°E; summit elev. 100 m
All times are local (unless otherwise noted)
Small ash plumes and fumarolic activity during November 2022 through April 2023
Nishinoshima is a small island located about 1,000 km S of Tokyo in the Ogasawara Arc in Japan. The island is the summit of a massive submarine volcano that has prominent peaks to the S, W, and NE. Eruptions date back to 1973; the most recent eruption period began in October 2022 and was characterized by ash plumes and fumarolic activity (BGVN 47:12). This report describes ash plumes and fumarolic activity during November 2022 through April 2023 based on monthly reports from the Japan Meteorological Agency (JMA) monthly reports and satellite data.
The most recent eruptive activity prior to the reporting internal occurred on 12 October 2022, when an ash plume rose 3.5 km above the crater rim. An aerial observation conducted by the Japan Coast Guard (JCG) on 25 November reported that white fumaroles rose approximately 200 m above the central crater of a pyroclastic cone (figure 119), and multiple plumes were observed on the ESE flank of the cone. Discolored water ranging from reddish-brown to brown and yellowish-green were visible around the perimeter of the island (figure 119). No significant activity was reported in December.
During an overflight conducted by JCG on 25 January 2023 intermittent activity and small, blackish-gray plumes rose 900 m above the central part of the crater were observed (figure 120). The fumarolic zone of the E flank and base of the cone had expanded and emissions had intensified. Dark brown discolored water was visible around the perimeter of the island.
No significant activity was reported during February through March. Ash plumes at 1050 and 1420 on 11 April rose 1.9 km above the crater rim and drifted NW and N. These were the first ash plumes observed since 12 October 2022. On 14 April JCG carried out an overflight and reported that no further eruptive activity was visible, although white gas-and-steam plumes were visible from the central crater and rose 900 m high (figure 121). Brownish and yellow-green discolored water surrounded the island.
Intermittent low-to-moderate power thermal anomalies were recorded in the MIROVA graph (Middle InfraRed Observation of Volcanic Activity) during November 2022 through April 2023 (figure 123). A cluster of six to eight anomalies were detected during November while a smaller number were detected during the following months: two to three during December, one during mid-January 2023, one during February, five during March, and two during April. Thermal activity was also reflected in infrared satellite data at the summit crater, accompanied by occasional gas-and-steam plumes (figure 124).
Geologic Background. The small island of Nishinoshima was enlarged when several new islands coalesced during an eruption in 1973-74. Multiple eruptions that began in 2013 completely covered the previous exposed surface and continued to enlarge the island. The island is the summit of a massive submarine volcano that has prominent peaks to the S, W, and NE. The summit of the southern cone rises to within 214 m of the ocean surface 9 km SSE.
Information Contacts: Japan Meteorological Agency (JMA), 1-3-4 Otemachi, Chiyoda-ku, Tokyo 100-8122, Japan (URL: http://www.jma.go.jp/jma/indexe.html); MIROVA (Middle InfraRed Observation of Volcanic Activity), a collaborative project between the Universities of Turin and Florence (Italy) supported by the Centre for Volcanic Risk of the Italian Civil Protection Department (URL: http://www.mirovaweb.it/); Copernicus Browser, Copernicus Data Space Ecosystem, European Space Agency (URL: https://dataspace.copernicus.eu/browser/).
Karangetang (Indonesia) — July 2023 Cite this Report
Karangetang
Indonesia
2.781°N, 125.407°E; summit elev. 1797 m
All times are local (unless otherwise noted)
Lava flows, incandescent avalanches, and ash plumes during January-June 2023
Karangetang (also known as Api Siau), at the northern end of the island of Siau, Indonesia, contains five summit craters along a N-S line. More than 40 eruptions have been recorded since 1675; recent eruptions have included frequent explosive activity, sometimes accompanied by pyroclastic flows and lahars. Lava dome growth has occurred in the summit craters and collapses of lava flow fronts have produced pyroclastic flows. The two active summit craters are Kawah Dua (the N crater) and Kawah Utama (the S crater, also referred to as the “Main Crater”). The most recent eruption began in late November 2018 and has more recently consisted of weak thermal activity and gas-and-steam emissions (BGVN 48:01). This report updates activity characterized by lava flows, incandescent avalanches, and ash plumes during January through June 2023 using reports from Pusat Vulkanologi dan Mitigasi Bencana Geologi (PVMBG, also known as CVGHM, or the Center of Volcanology and Geological Hazard Mitigation), MAGMA Indonesia, the Darwin VAAC (Volcano Ash Advisory Center), and satellite data.
Activity during January was relatively low and mainly consisted of white gas-and-steam emissions that rose 25-150 m above Main Crater (S crater) and drifted in different directions. Incandescence was visible from the lava dome in Kawah Dua (the N crater). Weather conditions often prevented clear views of the summit. On 18 January the number of seismic signals that indicated avalanches of material began to increase. In addition, there were a total of 71 earthquakes detected during the month.
Activity continued to increase during the first week of February. Material from Main Crater traveled as far as 800 m down the Batuawang (S) and Batang (W) drainages and as far as 1 km W down the Beha (W) drainage on 4 February. On 6 February 43 earthquake events were recorded, and on 7 February, 62 events were recorded. White gas-and-steam emissions rose 25-250 m above both summit craters throughout the month. PVMBG reported an eruption began during the evening of 8 February around 1700. Photos showed incandescent material at Main Crater. Incandescent material had also descended the flank in at least two unconfirmed directions as far as 2 km from Main Crater, accompanied by ash plumes (figure 60). As a result, PVMBG increased the Volcano Alert Level (VAL) to 3 (the second highest level on a 1-4 scale).
Occasional nighttime webcam images showed three main incandescent lava flows of differing lengths traveling down the S, SW, and W flanks (figure 61). Incandescent rocks were visible on the upper flanks, possibly from ejected or collapsed material from the crater, and incandescence was the most intense at the summit. Based on analyses of satellite imagery and weather models, the Darwin VAAC reported that daily ash plumes during 16-20 February rose to 2.1-3 km altitude and drifted NNE, E, and SE. BNPB reported on 16 February that as many as 77 people were evacuated and relocated to the East Siau Museum. A webcam image taken at 2156 on 17 February possibly showed incandescent material descending the SE flank. Ash plumes rose to 2.1 km altitude and drifted SE during 22-23 February, according to the Darwin VAAC.
Incandescent avalanches of material and summit incandescence at Main Crater continued during March. White gas-and-steam emissions during March generally rose 25-150 m above the summit crater; on 31 March gas-and-steam emissions rose 200-400 m high. An ash plume rose to 2.4 km altitude and drifted S at 1710 on 9 March and a large thermal anomaly was visible in images taken at 0550 and 0930 on 10 March. Incandescent material was visible at the summit and on the flanks based on webcam images taken at 0007 and 2345 on 16 March, at 1828 on 17 March, at 1940 on 18 March, at 2311 on 19 March, and at 2351 on 20 March. Incandescence was most intense on 18 and 20 March and webcam images showed possible Strombolian explosions (figure 62). An ash plume rose to 2.4 km altitude and drifted SW on 18 March, accompanied by a thermal anomaly.
Summit crater incandescence at Main Crater and on the flanks persisted during April. Incandescent material at the S crater and on the flanks was reported at 0016 on 1 April. The lava flows had stopped by 1 April according to PVMBG, although incandescence was still visible up to 10 m high. Seismic signals indicating effusion decreased and by 6 April they were no longer detected. Incandescence was visible from both summit craters. On 26 April the VAL was lowered to 2 (the second lowest level on a 1-4 scale). White gas-and-steam emissions rose 25-200 m above the summit crater.
During May white gas-and-steam emissions generally rose 50-250 m above the summit, though it was often cloudy, which prevented clear views; on 21 May gas-and-steam emissions rose 50-400 m high. Nighttime N summit crater incandescence rose 10-25 m above the lava dome, and less intense incandescence was noted above Main Crater, which reached about 10 m above the dome. Sounds of falling rocks at Main Crater were heard on 15 May and the seismic network recorded 32 rockfall events in the crater on 17 May. Avalanches traveled as far as 1.5 km down the SW and S flanks, accompanied by rumbling sounds on 18 May. Incandescent material descending the flanks was captured in a webcam image at 2025 on 19 May (figure 63) and on 29 May; summit crater incandescence was observed in webcam images at 2332 on 26 May and at 2304 on 29 May. On 19 May the VAL was again raised to 3.
Occasional Main Crater incandescence was reported during June, as well as incandescent material on the flanks. White gas-and-steam emissions rose 10-200 m above the summit crater. Ash plumes rose to 2.1 km altitude and drifted SE and E during 2-4 June, according to the Darwin VAAC. Material on the flanks of Main Crater were observed at 2225 on 7 June, at 2051 on 9 June, at 0007 on 17 June, and at 0440 on 18 June. Webcam images taken on 21, 25, and 27 June showed incandescence at Main Crater and from material on the flanks.
MIROVA (Middle InfraRed Observation of Volcanic Activity) analysis of MODIS satellite data showed strong thermal activity during mid-February through March and mid-May through June, which represented incandescent avalanches and lava flows (figure 64). During April through mid-May the power of the anomalies decreased but frequent anomalies were still detected. Brief gaps in activity occurred during late March through early April and during mid-June. Infrared satellite images showed strong lava flows mainly affecting the SW and S flanks, accompanied by gas-and-steam emissions (figure 65). According to data recorded by the MODVOLC thermal algorithm, there were a total of 79 thermal hotspots detected: 28 during February, 24 during March, one during April, five during May, and 21 during June.
Geologic Background. Karangetang (Api Siau) volcano lies at the northern end of the island of Siau, about 125 km NNE of the NE-most point of Sulawesi. The stratovolcano contains five summit craters along a N-S line. It is one of Indonesia's most active volcanoes, with more than 40 eruptions recorded since 1675 and many additional small eruptions that were not documented (Neumann van Padang, 1951). Twentieth-century eruptions have included frequent explosive activity sometimes accompanied by pyroclastic flows and lahars. Lava dome growth has occurred in the summit craters; collapse of lava flow fronts have produced pyroclastic flows.
Information Contacts: Pusat Vulkanologi dan Mitigasi Bencana Geologi (PVMBG, also known as Indonesian Center for Volcanology and Geological Hazard Mitigation, CVGHM), Jalan Diponegoro 57, Bandung 40122, Indonesia (URL: http://www.vsi.esdm.go.id/); MAGMA Indonesia, Kementerian Energi dan Sumber Daya Mineral (URL: https://magma.esdm.go.id/v1); Badan Nasional Penanggulangan Bencana (BNPB), National Disaster Management Agency, Graha BNPB - Jl. Scout Kav.38, East Jakarta 13120, Indonesia (URL: http://www.bnpb.go.id/); Darwin Volcanic Ash Advisory Centre (VAAC), Bureau of Meteorology, Northern Territory Regional Office, PO Box 40050, Casuarina, NT 0811, Australia (URL: http://www.bom.gov.au/info/vaac/); MIROVA (Middle InfraRed Observation of Volcanic Activity), a collaborative project between the Universities of Turin and Florence (Italy) supported by the Centre for Volcanic Risk of the Italian Civil Protection Department (URL: http://www.mirovaweb.it/); Hawai'i Institute of Geophysics and Planetology (HIGP) - MODVOLC Thermal Alerts System, School of Ocean and Earth Science and Technology (SOEST), Univ. of Hawai'i, 2525 Correa Road, Honolulu, HI 96822, USA (URL: http://modis.higp.hawaii.edu/); Copernicus Browser, Copernicus Data Space Ecosystem, European Space Agency (URL: https://dataspace.copernicus.eu/browser/); IDN Times, Jl. Jend. Gatot Subroto Kav. 27 3rd Floor Kuningan, Jakarta, Indonesia 12950, Status of Karangetang Volcano in Sitaro Islands Increases (URL: https://sulsel.idntimes.com/news/indonesia/savi/status-gunung-api-karangetang-di-kepulauan-sitaro-meningkat?page=all).
Ahyi (United States) — July 2023 Cite this Report
Ahyi
United States
20.42°N, 145.03°E; summit elev. -75 m
All times are local (unless otherwise noted)
Intermittent hydroacoustic signals and discolored plumes during November 2022-June 2023
Ahyi seamount is a large, conical submarine volcano that rises to within 75 m of the ocean surface about 18 km SE of the island of Farallon de Pajaros in the Northern Marianas. The remote location of the seamount has made eruptions difficult to document, but seismic stations installed in the region confirmed an eruption in the vicinity in 2001. No new activity was detected until April-May 2014 when an eruption was detected by NOAA (National Oceanic and Atmospheric Administration) divers, hydroacoustic sensors, and seismic stations (BGVN 42:04). New activity was first detected on 15 November by hydroacoustic sensors that were consistent with submarine volcanic activity. This report covers activity during November 2022 through June 2023 based on daily and weekly reports from the US Geological Survey.
Starting in mid-October, hydroacoustic sensors at Wake Island (2.2 km E) recorded signals consistent with submarine volcanic activity, according to a report from the USGS issued on 15 November 2022. A combined analysis of the hydroacoustic signals and seismic stations located at Guam and Chichijima Island, Japan, suggested that the source of this activity was at or near the Ahyi seamount. After a re-analysis of a satellite image of the area that was captured on 6 November, USGS confirmed that there was no evidence of discoloration at the ocean surface. Few hydroacoustic and seismic signals continued through November, including on 18 November, which USGS suggested signified a decline or pause in unrest. A VONA (Volcano Observatory Notice for Aviation) reported that a discolored water plume was persistently visible in satellite data starting on 18 November (figure 6). Though clouds often obscured clear views of the volcano, another discolored water plume was captured in a satellite image on 26 November. The Aviation Color Code (ACC) was raised to Yellow (the second lowest level on a four-color scale) and the Volcano Alert Level (VAL) was raised to Advisory (the second lowest level on a four-level scale) on 29 November.
During December, occasional detections were recorded on the Wake Island hydrophone sensors and discolored water over the seamount remained visible. During 2-7, 10-12, and 16-31 December possible explosion signals were detected. A small area of discolored water was observed in high-resolution Sentinel-2 satellite images during 1-6 December (figure 7). High-resolution satellite images recorded discolored water plumes on 13 December that originated from the summit region; no observations indicated that activity breached the ocean surface. A possible underwater plume was visible in satellite images on 18 December, and during 19-20 December a definite but diffuse underwater plume located SSE from the main vent was reported. An underwater plume was visible in a satellite image taken on 26 December (figure 7).
Hydrophone sensors continued to detect signals consistent with possible explosions during 1-8 January 2023. USGS reported that the number of detections decreased during 4-5 January. The hydrophone sensors experienced a data outage that started at 0118 on 8 January and continued through 10 January, though according to USGS, possible explosions were recorded prior to the data outage and likely continued during the outage. A discolored water plume originating from the summit region was detected in a partly cloudy satellite image on 8 January. On 11-12 and 15-17 January possible explosion signals were recorded again. One small signal was detected during 22-23 January and several signals were recorded on 25 and 31 January. During 27-31 January a plume of discolored water was observed above the seamount in satellite imagery (figure 8).
Low levels of activity continued during February and March, based on data from pressure sensors on Wake Island. During 1 and 4-6 February activity was reported, and a submarine plume was observed on 4 February (figure 8). Possible explosion signals were detected during 7-8, 10, 13-14, and 24 February. During 1-2 and 3-5 March a plume of discolored water was observed in satellite imagery (figure 8). Almost continuous hydroacoustic signals were detected in remote pressure sensor data on Wake Island 2,270 km E from the volcano during 7-13 March. During 12-13 March water discoloration around the seamount was observed in satellite imagery, despite cloudy weather. By 14 March discolored water extended about 35 km, but no direction was noted. USGS reported that the continuous hydroacoustic signals detected during 13-14 March stopped abruptly on 14 March and no new detections were observed. Three 30 second hydroacoustic detections were reported during 17-19 March, but no activity was visible due to cloudy weather. A data outage was reported during 21-22 March, making pressure sensor data unavailable; a discolored water plume was, however, visible in satellite data. A possible underwater explosion signal was detected by pressure sensors at Wake Island on 26, 29, and 31 March, though the cause and origin of these events were unclear.
Similar low activity continued during April, May, and June. Several signals were detected during 1-3 April in pressure sensors at Wake Island. USGS suggested that these may be related to underwater explosions or earthquakes at the volcano, but no underwater plumes were visible in clear satellite images. The pressure sensors had data outages during 12-13 April and no data were recorded; no underwater plumes were visible in satellite images, although cloudy weather obscured most clear views. Eruptive activity was reported starting at 2210 on 21 May. On 22 May a discolored water plume that extended 4 km was visible in satellite images, though no direction was recorded. During 23-24 May some signals were detected by the underwater pressure sensors. Possible hydroacoustic signals were detected during 2-3 and 6-8 June. Multiple hydroacoustic signals were detected during 9-11 and 16-17 June, although no activity was visible in satellite images. One hydroacoustic signal was detected during 23-24 June, but there was some uncertainty about its association with volcanic activity. A single possible hydroacoustic signal was detected during 30 June to 1 July.
Geologic Background. Ahyi seamount is a large conical submarine volcano that rises to within 75 m of the ocean surface ~18 km SE of the island of Farallon de Pajaros in the northern Marianas. Water discoloration has been observed there, and in 1979 the crew of a fishing boat felt shocks over the summit area, followed by upwelling of sulfur-bearing water. On 24-25 April 2001 an explosive eruption was detected seismically by a station on Rangiroa Atoll, Tuamotu Archipelago. The event was well constrained (+/- 15 km) at a location near the southern base of Ahyi. An eruption in April-May 2014 was detected by NOAA divers, hydroacoustic sensors, and seismic stations.
Information Contacts: US Geological Survey, Volcano Hazards Program (USGS-VHP), 12201 Sunrise Valley Drive, Reston, VA, USA, https://volcanoes.usgs.gov/index.html; Copernicus Browser, Copernicus Data Space Ecosystem, European Space Agency (URL: https://dataspace.copernicus.eu/browser/).
Kadovar (Papua New Guinea) — June 2023 Cite this Report
Kadovar
Papua New Guinea
3.608°S, 144.588°E; summit elev. 365 m
All times are local (unless otherwise noted)
An ash plume and weak thermal anomaly during May 2023
Kadovar is a 2-km-wide island that is the emergent summit of a Bismarck Sea stratovolcano. It lies off the coast of New Guinea, about 25 km N of the mouth of the Sepik River. Prior to an eruption that began in 2018, a lava dome formed the high point of the volcano, filling an arcuate landslide scarp open to the S. Submarine debris-avalanche deposits occur to the S of the island. The current eruption began in January 2018 and has comprised lava effusion from vents at the summit and at the E coast; more recent activity has consisted of ash plumes, weak thermal activity, and gas-and-steam plumes (BGVN 48:02). This report covers activity during February through May 2023 using information from the Darwin Volcanic Ash Advisory Center (VAAC) and satellite data.
Activity during the reporting period was relatively low and mainly consisted of white gas-and-steam plumes that were visible in natural color satellite images on clear weather days (figure 67). According to a Darwin VAAC report, at 2040 on 6 May an ash plume rose to 4.6 km altitude and drifted W; by 2300 the plume had dissipated. MODIS satellite instruments using the MODVOLC thermal algorithm detected a single thermal hotspot on the SE side of the island on 7 May. Weak thermal activity was also detected in a satellite image on the E side of the island on 14 May, accompanied by a white gas-and-steam plume that drifted SE (figure 68).
Geologic Background. The 2-km-wide island of Kadovar is the emergent summit of a Bismarck Sea stratovolcano of Holocene age. It is part of the Schouten Islands, and lies off the coast of New Guinea, about 25 km N of the mouth of the Sepik River. Prior to an eruption that began in 2018, a lava dome formed the high point of the andesitic volcano, filling an arcuate landslide scarp open to the south; submarine debris-avalanche deposits occur in that direction. Thick lava flows with columnar jointing forms low cliffs along the coast. The youthful island lacks fringing or offshore reefs. A period of heightened thermal phenomena took place in 1976. An eruption began in January 2018 that included lava effusion from vents at the summit and at the E coast.
Information Contacts: Darwin Volcanic Ash Advisory Centre (VAAC), Bureau of Meteorology, Northern Territory Regional Office, PO Box 40050, Casuarina, NT 0811, Australia (URL: http://www.bom.gov.au/info/vaac/); Hawai'i Institute of Geophysics and Planetology (HIGP) - MODVOLC Thermal Alerts System, School of Ocean and Earth Science and Technology (SOEST), Univ. of Hawai'i, 2525 Correa Road, Honolulu, HI 96822, USA (URL: http://modis.higp.hawaii.edu/); Copernicus Browser, Copernicus Data Space Ecosystem, European Space Agency (URL: https://dataspace.copernicus.eu/browser/).
San Miguel (El Salvador) — June 2023 Cite this Report
San Miguel
El Salvador
13.434°N, 88.269°W; summit elev. 2130 m
All times are local (unless otherwise noted)
Small gas-and-ash explosions during March and May 2023
San Miguel in El Salvador is a broad, deep crater complex that has been frequently modified by eruptions recorded since the early 16th century and consists of the summit known locally as Chaparrastique. Flank eruptions have produced lava flows that extended to the N, NE, and SE during the 17-19th centuries. The most recent activity has consisted of minor ash eruptions from the summit crater. The current eruption period began in November 2022 and has been characterized by frequent phreatic explosions, gas-and-ash emissions, and sulfur dioxide plumes (BGVN 47:12). This report describes small gas-and-ash explosions during December 2022 through May 2023 based on special reports from the Ministero de Medio Ambiente y Recursos Naturales (MARN).
Activity has been relatively low since the last recorded explosions on 29 November 2022. Seismicity recorded by the San Miguel Volcano Station (VSM) located on the N flank at 1.7 km elevation had decreased by 7 December. Sulfur dioxide gas measurements taken with DOAS (Differential Optical Absorption Spectroscopy) mobile equipment were below typical previously recorded values: 300 tons per day (t/d). During December, small explosions were recorded by the seismic network and manifested as gas-and-steam emissions.
Gas-and-ash explosions in the crater occurred during January 2023, which were recorded by the seismic network. Sulfur dioxide values remained low, between 300-400 t/d through 10 March. At 0817 on 14 January a gas-and-ash emission was visible in webcam images, rising just above the crater rim. Some mornings during February, small gas-and-steam plumes were visible in the crater. On 7 March at 2252 MARN noted an increase in degassing from the central crater; gas emissions were constantly observed through the early morning hours on 8 March. During the early morning of 8 March through the afternoon on 9 March, 12 emissions were registered, some accompanied by ash. The last gas-and-ash emission was recorded at 1210 on 9 March; very fine ashfall was reported in El Tránsito (10 km S), La Morita (6 km W), and La Piedrita (3 km W). The smell of sulfur was reported in Piedra Azul (5 km SW). On 16 March MARN reported that gas-and-steam emissions decreased.
Low degassing and very low seismicity were reported during April; no explosions have been detected between 9 March and 27 May. The sulfur dioxide emissions remained between 350-400 t/d; during 13-20 April sulfur dioxide values fluctuated between 30-300 t/d. Activity remained low through most of May; on 23 May seismicity increased. An explosion was detected at 1647 on 27 May generated a gas-and-ash plume that rose 700 m high (figure 32); a decrease in seismicity and gas emissions followed. The DOAS station installed on the W flank recorded sulfur dioxide values that reached 400 t/d on 27 May; subsequent measurements showed a decrease to 268 t/d on 28 May and 100 t/d on 29 May.
Geologic Background. The symmetrical cone of San Miguel, one of the most active volcanoes in El Salvador, rises from near sea level to form one of the country's most prominent landmarks. A broad, deep, crater complex that has been frequently modified by eruptions recorded since the early 16th century caps the truncated unvegetated summit, also known locally as Chaparrastique. Flanks eruptions of the basaltic-andesitic volcano have produced many lava flows, including several during the 17th-19th centuries that extended to the N, NE, and SE. The SE-flank flows are the largest and form broad, sparsely vegetated lava fields crossed by highways and a railroad skirting the base of the volcano. Flank vent locations have migrated higher on the edifice during historical time, and the most recent activity has consisted of minor ash eruptions from the summit crater.
Information Contacts: Ministero de Medio Ambiente y Recursos Naturales (MARN), Km. 5½ Carretera a Nueva San Salvador, Avenida las Mercedes, San Salvador, El Salvador (URL: http://www.snet.gob.sv/ver/vulcanologia).
Semisopochnoi (United States) — June 2023 Cite this Report
Semisopochnoi
United States
51.93°N, 179.58°E; summit elev. 1221 m
All times are local (unless otherwise noted)
Occasional explosions, ash deposits, and gas-and-steam plumes during December 2022-May 2023
Semisopochnoi is located in the western Aleutians, is 20-km-wide at sea level, and contains an 8-km-wide caldera. The three-peaked Mount Young (formerly Cerberus) was constructed within the caldera during the Holocene. Each of these peaks contains a summit crater; the lava flows on the N flank appear younger than those on the S side. The current eruption period began in early February 2021 and has more recently consisted of intermittent explosions and ash emissions (BGVN 47:12). This report updates activity during December 2022 through May 2023 using daily, weekly, and special reports from the Alaska Volcano Observatory (AVO). AVO monitors the volcano using local seismic and infrasound sensors, satellite data, web cameras, and remote infrasound and lightning networks.
Activity during most of December 2022 was relatively quiet; according to AVO no eruptive or explosive activity was observed since 7 November 2022. Intermittent tremor and occasional small earthquakes were observed in geophysical data. Continuous gas-and-steam emissions were observed from the N crater of Mount Young in webcam images on clear weather days (figure 25). On 24 December, there was a slight increase in earthquake activity and several small possible explosion signals were detected in infrasound data. Eruptive activity resumed on 27 December at the N crater of Mount Young; AVO issued a Volcano Activity Notice (VAN) that reported minor ash deposits on the flanks of Mount Young that extended as far as 1 km from the vent, according to webcam images taken during 27-28 December (figure 26). No ash plumes were observed in webcam or satellite imagery, but a persistent gas-and-steam plume that might have contained some ash rose to 1.5 km altitude. As a result, AVO raised the Aviation Color Code (ACC) to Orange (the second highest level on a four-color scale) and the Volcano Alert Level (VAL) to Watch (the second highest level on a four-level scale). Possible explosions were detected during 21 December 2022 through 1 January 2023 and seismic tremor was recorded during 30-31 December.
During January 2023 eruptive activity continued at the active N crater of Mount Young. Minor ash deposits were observed on the flanks, extending about 2 km SSW, based on webcam images from 1 and 3 January. A possible explosion occurred during 1-2 January based on elevated seismicity recorded on local seismometers and an infrasound signal recorded minutes later by an array at Adak. Though no ash plumes were observed in webcam or satellite imagery, a persistent gas-and-steam plume rose to 1.5 km altitude that might have carried minor traces of ash. Ash deposits were accompanied by periods of elevated seismicity and infrasound signals from the local geophysical network, which AVO reported were likely due to weak explosive activity. Low-level explosive activity was also detected during 2-3 January, with minor gas-and-steam emissions and a new ash deposit that was visible in webcam images. Low-level explosive activity was detected in geophysical data during 4-5 January, with elevated seismicity and infrasound signals observed on local stations. Volcanic tremor was detected during 7-9 January and very weak explosive activity was detected in seismic and infrasound data on 9 January. Weak seismic and infrasound signals were recorded on 17 January, which indicated minor explosive activity, but no ash emissions were observed in clear webcam images; a gas-and-steam plume continued to rise to 1.5 km altitude. During 29-30 January, ash deposits near the summit were observed on fresh snow, according to webcam images.
The active N cone at Mount Young continued to produce a gas-and-steam plume during February, but no ash emissions or explosive events were detected. Seismicity remained elevated with faint tremor during early February. Gas-and-steam emissions from the N crater were observed in clear webcam images on 11-13 and 16 February; no explosive activity was detected in seismic, infrasound, or satellite data. Seismicity has also decreased, with no significant seismic tremor observed since 25 January. Therefore, the ACC was lowered to Yellow (the second lowest level on a four-color scale) and the VAL was lowered to Advisory (the second lowest level on a four-color scale) on 22 February.
Gas-and-steam emissions persisted during March from the N cone of Mount Young, based on clear webcam images. A few brief episodes of weak tremor were detected in seismic data, although seismicity decreased over the month. A gas-and-steam plume detected in satellite data extended 150 km on 18 March. Low-level ash emissions from the N cone at Mount Young were observed in several webcam images during 18-19 March, in addition to small explosions and volcanic tremor. The ACC was raised to Orange and the VAL increased to Watch on 19 March. A small explosion was detected in seismic and infrasound data on 21 March.
Low-level unrest continued during April, although cloudy weather often obscured views of the summit; periods of seismic tremor and local earthquakes were recorded. During 3-4 April a gas-and-steam plume was visible traveling more than 200 km overnight; no ash was evident in the plume, according to AVO. A gas-and-steam plume was observed during 4-6 April that extended 400 km but did not seem to contain ash. Small explosions were detected in seismic and infrasound data on 5 April. Occasional clear webcam images showed continuing gas-and-steam emissions rose from Mount Young, but no ash deposits were observed on the snow. On 19 April small explosions and tremor were detected in seismic and infrasound data. A period of seismic tremor was detected during 22-25 April, with possible weak explosions on 25 April. Ash deposits were visible near the crater rim, but it was unclear if these deposits were recent or due to older deposits.
Occasional small earthquakes were recorded during May, but there were no signs of explosive activity seen in geophysical data. Gas-and-steam emissions continued from the N crater of Mount Young, based on webcam images, and seismicity remained slightly elevated. A new, light ash deposit was visible during the morning of 5 May on fresh snow on the NW flank of Mount Young. During 10 May periods of volcanic tremor were observed. The ACC was lowered to Yellow and the VAL to Advisory on 17 May due to no additional evidence of activity.
Geologic Background. Semisopochnoi, the largest subaerial volcano of the western Aleutians, is 20 km wide at sea level and contains an 8-km-wide caldera. It formed as a result of collapse of a low-angle, dominantly basaltic volcano following the eruption of a large volume of dacitic pumice. The high point of the island is Anvil Peak, a double-peaked late-Pleistocene cone that forms much of the island's northern part. The three-peaked Mount Cerberus (renamed Mount Young in 2023) was constructed within the caldera during the Holocene. Each of the peaks contains a summit crater; lava flows on the N flank appear younger than those on the south side. Other post-caldera volcanoes include the symmetrical Sugarloaf Peak SSE of the caldera and Lakeshore Cone, a small cinder cone at the edge of Fenner Lake in the NE part of the caldera. Most documented eruptions have originated from Young, although Coats (1950) considered that both Sugarloaf and Lakeshore Cone could have been recently active.
Information Contacts: Alaska Volcano Observatory (AVO), a cooperative program of a) U.S. Geological Survey, 4200 University Drive, Anchorage, AK 99508-4667 USA (URL: https://avo.alaska.edu/), b) Geophysical Institute, University of Alaska, PO Box 757320, Fairbanks, AK 99775-7320, USA, and c) Alaska Division of Geological & Geophysical Surveys, 794 University Ave., Suite 200, Fairbanks, AK 99709, USA (URL: http://dggs.alaska.gov/).
Ebeko
Russia
50.686°N, 156.014°E; summit elev. 1103 m
All times are local (unless otherwise noted)
Continued explosions, ash plumes, and ashfall during October 2022-May 2023
Ebeko, located on the N end of Paramushir Island in the Kuril Islands, consists of three summit craters along a SSW-NNE line at the northern end of a complex of five volcanic cones. Eruptions date back to the late 18th century and have been characterized as small-to-moderate explosions from the summit crater, accompanied by intense fumarolic activity. The current eruption period began in June 2022 and has recently consisted of frequent explosions, ash plumes, and thermal activity (BGVN 47:10). This report covers similar activity during October 2022 through May 2023, based on information from the Kamchatka Volcanic Eruptions Response Team (KVERT) and satellite data.
Activity during October consisted of explosive activity, ash plumes, and occasional thermal anomalies. Visual data by volcanologists from Severo-Kurilsk showed explosions producing ash clouds up to 2.1-3 km altitude which drifted E, N, NE, and SE during 1-8, 10, 16, and 18 October. KVERT issued several Volcano Observatory Notices for Aviation (VONA) on 7, 13-15, and 27 October 2022, stating that explosions generated ash plumes that rose to 2.3-4 km altitude and drifted 5 km E, NE, and SE. Ashfall was reported in Severo-Kurilsk (Paramushir Island, about 7 km E) on 7 and 13 October. Satellite data showed a thermal anomaly over the volcano on 15-16 October. Visual data showed ash plumes rising to 2.5-3.6 km altitude on 22, 25-29, and 31 October and moving NE due to constant explosions.
Similar activity continued during November, with explosions, ash plumes, and ashfall occurring. KVERT issued VONAs on 1-2, 4, 6-7, 9, 13, and 16 November that reported explosions and resulting ash plumes that rose to 1.7-3.6 km altitude and drifted 3-5 km SE, ESE, E, and NE. On 1 November ash plumes extended as far as 110 km SE. On 5, 8, 12, and 24-25 November explosions and ash plumes rose to 2-3.1 km altitude and drifted N and E. Ashfall was observed in Severo-Kurilsk on 7 and 16 November. A thermal anomaly was visible during 1-4, 16, and 20 November. Explosions during 26 November rose as high as 2.7 km altitude and drifted NE (figure 45).
Explosions and ash plumes continued to occur in December. During 1-2 and 4 December volcanologists from Severo-Kurilsk observed explosions that sent ash to 1.9-2.5 km altitude and drifted NE and SE (figure 46). VONAs were issued on 5, 9, and 16 December reporting that explosions generated ash plumes rising to 1.9 km, 2.6 km, and 2.4 km altitude and drifted 5 km SE, E, and NE, respectively. A thermal anomaly was visible in satellite imagery on 16 December. On 18 and 27-28 December explosions produced ash plumes that rose to 2.5 km altitude and drifted NE and SE. On 31 December an ash plume rose to 2 km altitude and drifted NE.
Explosions continued during January 2023, based on visual observations by volcanologists from Severo-Kurilsk. During 1-7 January explosions generated ash plumes that rose to 4 km altitude and drifted NE, E, W, and SE. According to VONAs issued by KVERT on 2, 4, 10, and 23 January, explosions produced ash plumes that rose to 2-4 km altitude and drifted 5 km N, NE, E, and ENE; the ash plume that rose to 4 km altitude occurred on 10 January (figure 47). Satellite data showed a thermal anomaly during 3-4, 10, 13, 16, 21, 22, and 31 January. KVERT reported that an ash cloud on 4 January moved 12 km NE. On 6 and 9-11 January explosions sent ash plumes to 4.5 km altitude and drifted W and ESE. On 13 January an ash plume rose to 3 km altitude and drifted SE. During 20-24 January ash plumes from explosions rose to 3.7 km altitude and drifted SE, N, and NE. On 21 January the ash plume drifted as far as 40 km NE. During 28-29 and 31 January and 1 February ash plumes rose to 4 km altitude and drifted NE.
During February, explosions, ash plumes, and ashfall were reported. During 1, 4-5 and 7-8 February explosions generated ash plumes that rose to 4.5 km altitude and drifted E and NE; ashfall was observed on 5 and 8 February. On 6 February an explosion produced an ash plume that rose to 3 km altitude and drifted 7 km E, causing ashfall in Severo-Kurilsk. A thermal anomaly was visible in satellite data on 8, 9, 13, and 21 February. Explosions on 9 and 12-13 February produced ash plumes that rose to 4 km altitude and drifted E and NE; the ash cloud on 12 February extended as far as 45 km E. On 22 February explosions sent ash to 3 km altitude that drifted E. During 24 and 26-27 February ash plumes rose to 4 km altitude and drifted E. On 28 February an explosion sent ash to 2.5-3 km altitude and drifted 5 km E; ashfall was observed in Severo-Kurilsk.
Activity continued during March; visual observations showed that explosions generated ash plumes that rose to 3.6 km altitude on 3, 5-7, and 9-12 March and drifted E, NE, and NW. Thermal anomalies were visible on 10, 13, and 29-30 March in satellite imagery. On 18, 21-23, 26, and 29-30 March explosions produced ash plumes that rose to 2.8 km altitude and drifted NE and E; the ash plumes during 22-23 March extended up to 76 km E. A VONA issued on 21 March reported an explosion that produced an ash plume that rose to 2.8 km altitude and drifted 5 km E. Another VONA issued on 23 March reported that satellite data showed an ash plume rising to 3 km altitude and drifted 14 km E.
Explosions during April continued to generate ash plumes. On 1 and 4 April an ash plume rose to 2.8-3.5 km altitude and drifted SE and NE. A thermal anomaly was visible in satellite imagery during 1-6 April. Satellite data showed ash plumes and clouds rising to 2-3 km altitude and drifting up to 12 km SW and E on 3 and 6 April (figure 48). KVERT issued VONAs on 3, 5, 14, 16 April describing explosions that produced ash plumes rising to 3 km, 3.5 km, 3.5 km, and 3 km altitude and drifting 5 km S, 5 km NE and SE, 72 km NNE, and 5 km NE, respectively. According to satellite data, the resulting ash cloud from the explosion on 14 April was 25 x 7 km in size and drifted 72-104 km NNE during 14-15 April. According to visual data by volcanologists from Severo-Kurilsk explosions sent ash up to 3.5 km altitude that drifted NE and E during 15-16, 22, 25-26, and 29 April.
The explosive eruption continued during May. Explosions during 3-4, 6-7, and 9-10 May generated ash plumes that rose to 4 km altitude and drifted SW and E. Satellite data showed a thermal anomaly on 3, 9, 13-14, and 24 May. During 12-16, 23-25, and 27-28 May ash plumes rose to 3.5 km altitude and drifted in different directions due to explosions. Two VONA notices were issued on 16 and 25 May, describing explosions that generated ash plumes rising to 3 km and 3.5 km altitude, respectively and extending 5 km E. The ash cloud on 25 May drifted 75 km SE.
Thermal activity in the summit crater, occasionally accompanied by ash plumes and ash deposits on the SE and E flanks due to frequent explosions, were visible in infrared and true color satellite images (figure 49).
Geologic Background. The flat-topped summit of the central cone of Ebeko volcano, one of the most active in the Kuril Islands, occupies the northern end of Paramushir Island. Three summit craters located along a SSW-NNE line form Ebeko volcano proper, at the northern end of a complex of five volcanic cones. Blocky lava flows extend west from Ebeko and SE from the neighboring Nezametnyi cone. The eastern part of the southern crater contains strong solfataras and a large boiling spring. The central crater is filled by a lake about 20 m deep whose shores are lined with steaming solfataras; the northern crater lies across a narrow, low barrier from the central crater and contains a small, cold crescentic lake. Historical activity, recorded since the late-18th century, has been restricted to small-to-moderate explosive eruptions from the summit craters. Intense fumarolic activity occurs in the summit craters, on the outer flanks of the cone, and in lateral explosion craters.
Information Contacts: Kamchatka Volcanic Eruptions Response Team (KVERT), Far Eastern Branch, Russian Academy of Sciences, 9 Piip Blvd., Petropavlovsk-Kamchatsky, 683006, Russia (URL: http://www.kscnet.ru/ivs/kvert/); MIROVA (Middle InfraRed Observation of Volcanic Activity), a collaborative project between the Universities of Turin and Florence (Italy) supported by the Centre for Volcanic Risk of the Italian Civil Protection Department (URL: http://www.mirovaweb.it/); Copernicus Browser, Copernicus Data Space Ecosystem, European Space Agency (URL: https://dataspace.copernicus.eu/browser/).
Home Reef
Tonga
18.992°S, 174.775°W; summit elev. -10 m
All times are local (unless otherwise noted)
Discolored plumes continued during November 2022-April 2023
Home Reef is a submarine volcano located in the central Tonga islands between Lateiki (Metis Shoal) and Late Island. The first recorded eruption occurred in the mid-19th century, when an ephemeral island formed. An eruption in 1984 produced a 12-km-high eruption plume, a large volume of floating pumice, and an ephemeral island 500 x 1,500 m wide, with cliffs 30-50 m high that enclosed a water-filled crater. Another island-forming eruption in 2006 produced widespread pumice rafts that drifted as far as Australia; by 2008 the island had eroded below sea level. The previous eruption occurred during October 2022 and was characterized by a new island-forming eruption, lava effusion, ash plumes, discolored water, and gas-and-steam plumes (BGVN 47:11). This report covers discolored water plumes during November 2022 through April 2023 using satellite data.
Discolored plumes continued during the reporting period and were observed in true color satellite images on clear weather days. Satellite images show light green-yellow discolored water extending W on 8 and 28 November 2022 (figure 31), and SW on 18 November. Light green-yellow plumes extended W on 3 December, S on 13 December, SW on 18 December, and W and S on 23 December (figure 31). On 12 January 2023 discolored green-yellow plumes extended to the NE, E, SE, and N. The plume moved SE on 17 January and NW on 22 January. Faint discolored water in February was visible moving NE on 1 February. A discolored plume extended NW on 8 and 28 March and NW on 13 March (figure 31). During April, clear weather showed green-blue discolored plumes moving S on 2 April, W on 7 April, and NE and S on 12 April. A strong green-yellow discolored plume extended E and NE on 22 April for several kilometers (figure 31).
Geologic Background. Home Reef, a submarine volcano midway between Metis Shoal and Late Island in the central Tonga islands, was first reported active in the mid-19th century, when an ephemeral island formed. An eruption in 1984 produced a 12-km-high eruption plume, large amounts of floating pumice, and an ephemeral 500 x 1,500 m island, with cliffs 30-50 m high that enclosed a water-filled crater. In 2006 an island-forming eruption produced widespread dacitic pumice rafts that drifted as far as Australia. Another island was built during a September-October 2022 eruption.
Information Contacts: Copernicus Browser, Copernicus Data Space Ecosystem, European Space Agency (URL: https://dataspace.copernicus.eu/browser/).
Ambae
Vanuatu
15.389°S, 167.835°E; summit elev. 1496 m
All times are local (unless otherwise noted)
New lava flow, ash plumes, and sulfur dioxide plumes during February-May 2023
Ambae, also known as Aoba, is a large basaltic shield volcano in Vanuatu. A broad pyroclastic cone containing three crater lakes (Manaro Ngoru, Voui, and Manaro Lakua) is located at the summit within the youngest of at least two nested calderas. Periodic phreatic and pyroclastic explosions have been reported since the 16th century. A large eruption more than 400 years ago resulted in a volcanic cone within the summit crater that is now filled by Lake Voui; the similarly sized Lake Manaro fills the western third of the caldera. The previous eruption ended in August 2022 that was characterized by gas-and-steam and ash emissions and explosions of wet tephra (BGVN 47:10). This report covers a new eruption during February through May 2023 that consisted of a new lava flow, ash plumes, and sulfur dioxide emissions, using information from the Vanuatu Meteorology and Geo-Hazards Department (VMGD) and satellite data.
During the reporting period, the Alert Level remained at a 2 (on a scale of 0-5), which has been in place since December 2021. Activity during October 2022 through March 2023 remained relatively low and mostly consisted of gas-and-steam emissions in Lake Voui. VMGD reported that at 1300 on 15 November a satellite image captured a strong amount of sulfur dioxide rising above the volcano (figure 99), and that seismicity slightly increased. The southern and northern part of the island reported a strong sulfur dioxide smell and heard explosions. On 20 February 2023 a gas-and-ash plume rose 1.3 km above the summit and drifted SSW, according to a webcam image (figure 100). Gas-and-steam and possibly ash emissions continued on 23 February and volcanic earthquakes were recorded by the seismic network.
During April, volcanic earthquakes and gas-and-steam and ash emissions were reported from the cone in Lake Voui. VMGD reported that activity increased during 5-7 April; high gas-and-steam and ash plumes were visible, accompanied by nighttime incandescence. According to a Wellington VAAC report, a low-level ash plume rose as high as 2.5 km above the summit and drifted W and SW on 5 April, based on satellite imagery. Reports in Saratamata stated that a dark ash plume drifted to the WSW, but no loud explosion was heard. Webcam images from 2100 showed incandescence above the crater and reflected in the clouds. According to an aerial survey, field observations, and satellite data, water was no longer present in the lake. A lava flow was reported effusing from the vent and traveling N into the dry Lake Voui, which lasted three days. The next morning at 0745 on 6 April a gas-and-steam and ash plume rose 5.4 km above the summit and drifted ESE, based on information from VMGD (figure 101). The Wellington VAAC also reported that light ashfall was observed on the island. Intermittent gas-and-steam and ash emissions were visible on 7 April, some of which rose to an estimated 3 km above the summit and drifted E. Webcam images during 0107-0730 on 7 April showed continuing ash emissions. A gas-and-steam and ash plume rose 695 m above the summit crater at 0730 on 19 April and drifted ESE, based on a webcam image (figure 102).
According to visual and infrared satellite data, water was visible in Lake Voui as late as 24 March 2023 (figure 103). The vent in the caldera showed a gas-and-steam plume drifted SE. On 3 April thermal activity was first detected, accompanied by a gas-and-ash plume that drifted W (figure 103). The lava flow moved N within the dry lake and was shown cooling by 8 April. By 23 April much of the water in the lake had returned. Occasional sulfur dioxide plumes were detected by the TROPOMI instrument on the Sentinel-5P satellite that exceeded 2 Dobson Units (DU) and drifted in different directions (figure 104).
Geologic Background. The island of Ambae, also known as Aoba, is a massive 2,500 km3 basaltic shield that is the most voluminous volcano of the New Hebrides archipelago. A pronounced NE-SW-trending rift zone with numerous scoria cones gives the 16 x 38 km island an elongated form. A broad pyroclastic cone containing three crater lakes (Manaro Ngoru, Voui, and Manaro Lakua) is located at the summit within the youngest of at least two nested calderas, the largest of which is 6 km in diameter. That large central edifice is also called Manaro Voui or Lombenben volcano. Post-caldera explosive eruptions formed the summit craters about 360 years ago. A tuff cone was constructed within Lake Voui (or Vui) about 60 years later. The latest known flank eruption, about 300 years ago, destroyed the population of the Nduindui area near the western coast.
Information Contacts: Geo-Hazards Division, Vanuatu Meteorology and Geo-Hazards Department (VMGD), Ministry of Climate Change Adaptation, Meteorology, Geo-Hazards, Energy, Environment and Disaster Management, Private Mail Bag 9054, Lini Highway, Port Vila, Vanuatu (URL: http://www.vmgd.gov.vu/, https://www.facebook.com/VanuatuGeohazardsObservatory/); Wellington Volcanic Ash Advisory Centre (VAAC), Meteorological Service of New Zealand Ltd (MetService), PO Box 722, Wellington, New Zealand (URL: http://www.metservice.com/vaac/, http://www.ssd.noaa.gov/VAAC/OTH/NZ/messages.html); MIROVA (Middle InfraRed Observation of Volcanic Activity), a collaborative project between the Universities of Turin and Florence (Italy) supported by the Centre for Volcanic Risk of the Italian Civil Protection Department (URL: http://www.mirovaweb.it/); Global Sulfur Dioxide Monitoring Page, Atmospheric Chemistry and Dynamics Laboratory, NASA Goddard Space Flight Center (NASA/GSFC), 8800 Greenbelt Road, Goddard, Maryland, USA (URL: https://so2.gsfc.nasa.gov/); Copernicus Browser, Copernicus Data Space Ecosystem, European Space Agency (URL: https://dataspace.copernicus.eu/browser/).
Search Bulletin Archive by Publication Date
Select a month and year from the drop-downs and click "Show Issue" to have that issue displayed in this tab.
The default month and year is the latest issue available.
Bulletin of the Global Volcanism Network - Volume 22, Number 05 (May 1997)
Managing Editor: Richard Wunderman
Akita-Yakeyama (Japan)
Landslide, explosion, mud- and debris-flows, and tephra
Arenal (Costa Rica)
New pyroclastic cone noted in May
Atmospheric Effects (1995-2001) (Unknown)
German lidar data from early 1991 through mid-1997
Etna (Italy)
New map of the craters Voragine and Bocca Nuova
False Reports (Unknown)
Mexico: Rumors of new volcano prove false; methane combustion implicated
Irazu (Costa Rica)
Comparatively high numbers of earthquakes in April and May
Langila (Papua New Guinea)
Late-May eruptions send plumes up to 4.5 km elevation
Manam (Papua New Guinea)
Continued outbursts and light ashfalls
Monowai (New Zealand)
Seismically inferred eruption during 17-20 April
Poas (Costa Rica)
Number of monthly earthquakes high in April, lower in May
Rabaul (Papua New Guinea)
Inflation precedes 1 June eruption at Tavurvur
Rincon de la Vieja (Costa Rica)
Conspicuous fumaroles and plumes persist
San Cristobal (Nicaragua)
Eruptions cause ashfall on the slopes; plumes to 2,500 m
Soufriere Hills (United Kingdom)
Pyroclastic flows no longer confined by the crater's N wall
Special Announcements (Unknown)
Aviator's observation form
Stromboli (Italy)
New map of the crater terrace
Telica (Nicaragua)
Continued high levels of seismicity
Turrialba (Costa Rica)
Fumarolic temperatures near 90°C; two M 2 earthquakes in May
Akita-Yakeyama (Japan) — May 1997 Cite this Report
Akita-Yakeyama
Japan
39.964°N, 140.757°E; summit elev. 1366 m
All times are local (unless otherwise noted)
Landslide, explosion, mud- and debris-flows, and tephra
On 11 May, rapid movement of an older landslide was followed by a steam explosion that triggered mud flows and a small tephra emission. The event occurred at Sumikawa-Onsen (a hot spring resort) at the foot of Akita-Yakeyama, ~4 km NE of the summit. The following is based on a report by Shintaro Hayashi.
Although the landslide began moving a few days before 11 May, the sliding accelerated 20 minutes before the explosion. A field party saw the fast-moving landslide and took refuge prior to 0800 on 11 May. The explosion was witnessed at 0800 by a pilot flying over the area; he saw a water-and-steam column rising like a geyser, followed within seconds by black smoke emissions.
The explosion, heard as far as 1.4 km away, triggered a mudflow along the Akagawa River and eventually developed into a debris flow downstream. The field party noticed a thin coat of ash covering the mudflow deposits; they concluded that the tephra had issued from the explosion site.
Hayashi suggested that the explosion was triggered by sudden depressurization of a hot water reservoir under the hot spring due to removal of the overlying debris. The depressurization led to sudden boiling, generating sufficient steam pressure to explode. The volume of erupted material was estimated to be between 1,000 and 10,000 m3.
According to Hiroyuri Hamaguchi the precursory vibration and tremor were recorded by a short-period seismometer 1 km NNE of the hot spring. The landslide was as large as 500 m wide, 150 m long, and 500 m deep. After 2000 on 10 May, tremors of increasing amplitude built up. They declined by midnight and then returned at 0400 on 11 May. A maximum amplitude was reached at 0732, followed by a hiatus during 0753-0757. Short- and long-period events took place at 0757 and 0758, respectively.
Hayakawa reported that two hotels at the foot of Akita Yakeyama were completely destroyed by the landslide and lahar; however, there were no casualties because the staff and guests had evacuated. Air photos taken on 12 May by Asia Air Survey Co. can be seen on the internet.
Geologic Background. One of several Japanese volcanoes named Yakeyama ("Burning Mountain"), Akita-Yakeyama is the most recently active of a group of coalescing edifices in NW Honshu immediately west of Hachimantai volcano. The main volcano, Yakeyama, contains a small lava dome in its 600-m-wide summit crater. Tsugamori to the east is a stratovolcano of roughly the same height and has a 2-km-wide crater breached to the NE. The flat-topped lava dome of Kuroshimori lies 4 km S of Yakedake. One of several thermal areas, the Tamagawa Spa at the western foot has strongly acidic and slightly radioactive water. The last magmatic eruption formed the Onigajo lava dome in the summit crater about 5000 years ago. There have been somewhat uncertain reported 19th-century eruptions and mild phreatic eruptions in the 20th century.
Information Contacts: Shintaro Hayashi, Faculty of Education, Akita University, 1-1 Tegata-Gakuen-Cho, Akita 010, Japan; Hiroyuki Hamaguchi, Faculty of Science, Tohoku University, Sendai 980-77, Japan; Yukio Hayakawa, Faculty of Education, Gunma University, 4-2 Aramaki-machi, Mae-bashi-chi, Gunma 371, Japan (URL: http://www.hayakawayukio.jp/); Tatsuro Chiba, Dept of Disaster Prevention, Asia Air Survey Co., 4-2-18 Shinjuku, Shinjuku-ku, Tokyo 160, Japan (URL: http://www.ajiko.co.jp/en/).
Arenal
Costa Rica
10.463°N, 84.703°W; summit elev. 1670 m
All times are local (unless otherwise noted)
New pyroclastic cone noted in May
During April OVSICORI-UNA scientists noted a decrease in eruptive vigor and seismicity at Arenal compared to the previous month. Lavas erupted beginning in January 1997 advanced during April to reach an elevation of ~800 m on the N flank; lavas erupted in March advanced during April to reach an elevation of 1,150 m. During mid-May some advancing lava fronts had reached an elevation of about 1000 m. As has been typical during recent years, Crater D showed only fumarolic activity. Crater C erupted about 288 times during May.
Tremor occurred for as much as 15 hours/day during April, but both tremor and earthquake counts dropped by about a third compared to March, and further still during May. Nonetheless, on 16 May there were 8 hours of continuous tremor (amplitude, 18 mm; dominant frequency, 2.0-3.9 Hz). This tremor accompanied venting of new lava that traveled down the NNW flank. At least through April, the OVSICORI-UNA distance network continued to undergo radial contraction of ~22 ppm/year.
During 10-14 May, Gerardo Soto saw mild Strombolian eruptions tens of minutes apart, with ash columns up to 500 m above the crater. Although this seemed comparatively quiet, the usual vigorous summit fumarolic outgassing prevailed. A new pyroclastic cone was noted in Crater C (figure 82); it stood tens of meters high. Although the volcano lacked pyroclastic flows while he was watching, well developed pyroclastic-flow fans existed on the N and W flanks and summit.
Arenal's first chronicled eruption, in 1968, began an unbroken sequence of Strombolian explosions and basaltic andesite discharges from multiple vents. The volcano can be seen from a lodge 2.8 km S of the vent that enables visitors to hear, to see, and occasionally to smell its dynamism.
Geologic Background. Conical Volcán Arenal is the youngest stratovolcano in Costa Rica and one of its most active. The 1670-m-high andesitic volcano towers above the eastern shores of Lake Arenal, which has been enlarged by a hydroelectric project. Arenal lies along a volcanic chain that has migrated to the NW from the late-Pleistocene Los Perdidos lava domes through the Pleistocene-to-Holocene Chato volcano, which contains a 500-m-wide, lake-filled summit crater. The earliest known eruptions of Arenal took place about 7000 years ago, and it was active concurrently with Cerro Chato until the activity of Chato ended about 3500 years ago. Growth of Arenal has been characterized by periodic major explosive eruptions at several-hundred-year intervals and periods of lava effusion that armor the cone. An eruptive period that began with a major explosive eruption in 1968 ended in December 2010; continuous explosive activity accompanied by slow lava effusion and the occasional emission of pyroclastic flows characterized the eruption from vents at the summit and on the upper western flank.
Information Contacts: E. Fernandez, R. Van der Laat, F. de Obaldia, T. Marino, V. Barboza, W. Jimenez, R. Saenz, E. Duarte, M. Martinez, E. Hernandez, and F. Vega, Observatorio Vulcanologico y Sismologico de Costa Rica, Universidad Nacional (OVSICORI-UNA), Apartado 86-3000, Heredia, Costa Rica; G.J. Soto, Oficina de Sismologia y Vulcanologia del Arenal y Miravalles (OSIVAM), Instituto Costarricense de Electricidad (ICE), Apartado 10032-1000, San José, Costa Rica.
Atmospheric Effects (1995-2001) (Unknown) — May 1997 Cite this Report
Atmospheric Effects (1995-2001)
Unknown
Unknown, Unknown; summit elev. m
All times are local (unless otherwise noted)
German lidar data from early 1991 through mid-1997
The Pinatubo aerosol layer at Garmisch-Partenkirchen declined to a minimum in the summer of 1996 (figure 3 and table 11). Since then no further decay was observed. The January-June 1997 average value of the integrated backscatter represents ~70% of 1991 pre-Pinatubo value. It is too early, however, to establish the aerosol load observed since mid-1996 as a new stratospheric background.
Table 11. Lidar data from Germany (October 1996-June 1997) and Hawaii (July-December 1996) showing altitudes of aerosol layers. Backscattering rations are for the Nd-YAG wavelength of 0.53 um, with equivalent ruby values in parentheses for data from Germany; those from Mauna Loa are for the ruby wavelength of 0.69 um. The integrated value shows total backscatter, expressed in steradians-1, integrated over 300-m intervals from the tropopause to 30 km at Garmisch-Partenkirchen and 15.8-33 km at Hawaii. The "ci" stands for cirrus clouds; their presence in the tropopause region usually obscures the lower boundary of the aerosol layer. Courtesy of Horst Jager and John Barnes.
| DATE |
LAYER ALTITUDE (km) (peak) |
BACKSCATTERING RATIO |
BACKSCATTERING INTEGRATED |
| Garmisch-Partenkirchen, Germany (47.5°N, 11.0°E) |
| 03 Oct 1996 |
13-28 (16.3) |
1.08 (1.15) |
-- |
| 24 Oct 1996 |
9-27 (19.8) |
1.08 (1.16) |
-- |
| 31 Oct 1996 |
Ci-26 (15.2) |
1.06 (1.12) |
-- |
| 03 Nov 1996 |
Ci-30 (14.4) |
1.06 (1.12) |
-- |
| 09 Nov 1996 |
12-27 (15.1) |
1.08 (1.15) |
-- |
| 22 Nov 1996 |
9-32 (15.2) |
1.08 (1.15) |
-- |
| 04 Dec 1996 |
Ci-30 (16.7) |
1.08 (1.16) |
-- |
| 26 Dec 1996 |
10-30 (23.3) |
1.07 (1.14) |
-- |
| 29 Dec 1996 |
9-26 (22.5) |
1.07 (1.13) |
-- |
| 12 Jan 1997 |
12-29 (17.5) |
1.09 (1.17) |
-- |
| 15 Jan 1997 |
12-29 (22.1) |
1.09 (1.17) |
-- |
| 17 Jan 1997 |
10-28 (19.8) |
1.08 (1.15) |
-- |
| 30 Jan 1997 |
10-27 (18.7) |
1.09 (1.17) |
-- |
| 06 Feb 1997 |
14-28 (22.5) |
1.09 (1.17) |
-- |
| 10 Feb 1997 |
11-29 (20.3) |
1.07 (1.13) |
-- |
| 22 Feb 1997 |
13-27 (19.8) |
1.08 (1.15) |
-- |
| 01 Mar 1997 |
12-26 (20.9) |
1.08 (1.16) |
-- |
| 09 Mar 1997 |
11-28 (20.1) |
1.10 (1.20) |
-- |
| 12 Mar 1997 |
16-26 (20.6) |
1.07 (1.15) |
-- |
| 02 Apr 1997 |
13-26 (22.7) |
1.07 (1.14) |
-- |
| 07 Apr 1997 |
12-27 (18.7) |
1.10 (1.20) |
-- |
| 17 Apr 1997 |
12-26 (15.9) |
1.06 (1.13) |
-- |
| 24 Apr 1997 |
13-30 (18.5) |
1.10 (1.20) |
-- |
| 14 May 1997 |
Ci-28 (19.7) |
1.08 (1.16) |
-- |
| 06 Jun 1997 |
Ci-25 (19.9) |
1.08 (1.16) |
-- |
| Mauna Loa, Hawaii (19.5°N, 155.6°W) (corrected data) |
| 03 Jul 1996 |
16-28 (24.7) |
1.22 |
0.48 x 10⁻⁴ |
| 10 Jul 1996 |
16-33 (24.1) |
1.34 |
0.99 x 10⁻⁴ |
| 17 Jul 1996 |
16-34 (22.0) |
1.29 |
0.83 x 10⁻⁴ |
| 01 Aug 1996 |
16-27 (25.3) |
1.18 |
0.51 x 10⁻⁴ |
| 07 Aug 1996 |
16-32 (24.7) |
1.36 |
0.88 x 10⁻⁴ |
| 20 Aug 1996 |
17-31 (24.4) |
1.34 |
0.91 x 10⁻⁴ |
| 28 Aug 1996 |
16-31 (25.9) |
1.28 |
0.67 x 10⁻⁴ |
| 04 Sep 1996 |
17-29 (23.5) |
1.24 |
0.76 x 10⁻⁴ |
| 11 Sep 1996 |
17-30 (28.0) |
1.40 |
0.88 x 10⁻⁴ |
| 18 Sep 1996 |
17-32 (24.1) |
1.29 |
0.78 x 10⁻⁴ |
| 27 Sep 1996 |
17-32 (24.4) |
1.28 |
0.73 x 10⁻⁴ |
| 02 Oct 1996 |
17-34 (25.3) |
1.36 |
0.84 x 10⁻⁴ |
| 10 Oct 1996 |
16-34 (28.0) |
1.38 |
0.97 x 10⁻⁴ |
| 17 Oct 1996 |
16-33 (25.0) |
1.38 |
0.93 x 10⁻⁴ |
| 31 Oct 1996 |
16-32 (22.1) |
1.30 |
0.95 x 10⁻⁴ |
| 27 Nov 1996 |
15-30 (24.4) |
1.40 |
1.19 x 10⁻⁴ |
| 04 Dec 1996 |
17-34 (23.8) |
1.28 |
0.63 x 10⁻⁴ |
| 10 Dec 1996 |
16-34 (25.0) |
1.37 |
1.00 x 110-4 |
| 18 Dec 1996 |
16-34 (21.7) |
1.45 |
1.20 x 10⁻⁴ |
Correction: Lidar data from Mauna Loa, Hawaii, for July-December 1996 (Bulletin v. 22, no. 3) was incorrect by a factor of 1,000. Corrected data is presented in this issue (table 11).
Geologic Background. The enormous aerosol cloud from the March-April 1982 eruption of Mexico''s El Chichón persisted for years in the stratosphere, and led to the Atmospheric Effects section becoming a regular feature of the Bulletin thorugh 1989. Lidar data and other atmospheric observations were again published intermittently between 1995 and 2001; those reports are included here.
Information Contacts: Horst Jager, Fraunhofer-Institut fur Atmospharische Umweltforschung, Kreuzeckbahnstrasse 19, D-8100 Garmisch-Partenkirchen, Germany.
Etna
Italy
37.748°N, 14.999°E; summit elev. 3357 m
All times are local (unless otherwise noted)
New map of the craters Voragine and Bocca Nuova
A map prepared from observations carried out on 11 April of Voragine and Bocca Nuova craters is presented in figure 66. The position and altitude of the points shown by stars were measured with ranging binoculars (model 1500 DAES; on loan courtesy Leica-France) from two observation points (circles) on the rim of the craters. Photos of the crater interior were also used to draw the map.
Bocca Nuova crater measured ~170 m deep and had two active cones on the crater floor. The N cone, 25 m above the crater floor, was the most active. Its Strombolian activity threw ejecta close to Monumento, a spot on the crater's N rim. The S cone, 35-40 m above the crater floor, appeared composed of two coalescent cones, and was less active then the N one.
The depth of the Voragine crater measured ~150 m. Quiet steam emission was observed escaping from the large hole on the lower part of the crater floor.
Geologic Background. Mount Etna, towering above Catania on the island of Sicily, has one of the world's longest documented records of volcanism, dating back to 1500 BCE. Historical lava flows of basaltic composition cover much of the surface of this massive volcano, whose edifice is the highest and most voluminous in Italy. The Mongibello stratovolcano, truncated by several small calderas, was constructed during the late Pleistocene and Holocene over an older shield volcano. The most prominent morphological feature of Etna is the Valle del Bove, a 5 x 10 km caldera open to the east. Two styles of eruptive activity typically occur, sometimes simultaneously. Persistent explosive eruptions, sometimes with minor lava emissions, take place from one or more summit craters. Flank vents, typically with higher effusion rates, are less frequently active and originate from fissures that open progressively downward from near the summit (usually accompanied by Strombolian eruptions at the upper end). Cinder cones are commonly constructed over the vents of lower-flank lava flows. Lava flows extend to the foot of the volcano on all sides and have reached the sea over a broad area on the SE flank.
Information Contacts: Pierre Briole, Orazio Consoli, Christine Deplus, and Jean-Luc Froger, Institut de Physique du Globe de Paris, Case 89, 4 place Jussieu, 75252 Paris Cedex 05, France.
False Reports (Unknown) — May 1997 Cite this Report
False Reports
Unknown
Unknown, Unknown; summit elev. m
All times are local (unless otherwise noted)
Mexico: Rumors of new volcano prove false; methane combustion implicated
Although mid-May speculations suggested that a new volcano might be developing in the SE part of the State of Zacatecas, the incident has been attributed to methane combustion unrelated to volcanism. The event took place near the town of Jerez, ~50 km SW of Zacatecas city. Hugo Delgado received a video made by local residents, asked officials about the event, and provided the following report.
"The place where this phenomena is happening is a flat area (a square area [~20 m on each side]) where the ground is smoking (combustion-like blue smoke). There are several cracks on the ground and inside the cracks the earth looks reddish and hot. The people who sent me the video show how a piece of wood burns [when] they put it inside the crack. The area was isolated from the curious people (crowds of families who want to see what is happening visit the place) [by] digging a furrow around the hot site and posting policemen in order to [prevent] children [from falling] into the hot cracks.
"People from the University of Zacatecas and from the SEMARNAP (Ministry of the Environment, Natural Resources, and Fisheries) have visited the area and concluded that microbial activity on concentrated organic material in the area has produced methane and this started to burn since the beginning of May. Burning of methane has [caused] the ground to glow. According to their report, no deformation of the ground has been detected, nor [were] ashes or sulfuric odors detected during their visit. Samples taken from the ground were chemically analyzed [revealing] mainly organic material in them. This kind of [incident] has occurred before in other [parts] of Zacatecas, according to SEMARNAP.
"[It] seems that somebody (unidentified, but according to the local people, it was a retired scientist [transporting] equipment) came to the region to see the phenomena, and commented that it was the birth of a volcano. Thus, the inhabitants became alarmed. Local newspapers have also published that methane is burning there according to the researchers of the University of Zacatecas.
"Officials from the National Center for Disaster Prevention (CENAPRED) knew about this event, and have received the reports from SEMARNAP and the University of Zacatecas. This has been treated not as a volcanic problem but [an] environmental [one].
"A year ago, there was a similar event in the region. Carlos Gutierrez from CENAPRED visited the zone in order to deploy seismic equipment to observe this event. It was determined that organic material (sedimentary carbon[aceous] deposit[s] in a lacustrine environment during the Pleistocene) was burning underground after the local people incinerated dry grass (a common practice in Mexico to fertilize the land before the rainy season)."
Luca Ferrari provided geological insight into the area. It is on the E flank of the Sierra Madre Occidental, a huge mid-Tertiary volcanic pile related to subduction of the Farallon Plate. Volcanic rocks in the area include extensive silicic ashflow tuffs of late Oligocene to early Miocene age; these are sometimes capped by small volumes of andesitic and basaltic lavas ~20 Ma old. The incident took place more than 200 km N of the active volcanic arc (the Mexican Volcanic Belt, related to the ongoing subduction of the Rivera and Cocos plates). Quaternary intra-plate basalts are absent within a 200 km radius of the site of the incident. From a tectonic point of view, the village of Jerez lies at the N end of the Tlaltenango graben, which formed during Basin and Range extension in the early Miocene. Tectonic activity appears to have slowed since then and no Quaternary faulting is reported in the region.
Geologic Background. False or otherwise incorrect reports of volcanic activity.
Information Contacts: Hugo Delgado, Instituto de Geofisica, U.N.A.M.Circuito Cientifico, C.U. 04510, Mexico D.F., Mexico; Luca Ferrari, Instituto de Geologia, UNAM, Apdo. Postal 376, 36000 Guanajuato, Gto., Mexico.
Irazu
Costa Rica
9.979°N, 83.852°W; summit elev. 3436 m
All times are local (unless otherwise noted)
Comparatively high numbers of earthquakes in April and May
In April and May there were 107 and 136 earthquakes, respectively, a higher number than is typical. These were mainly detected locally. One M 1.9 earthquake centered 4 km SW of the active crater at a depth of 3.8 km took place at 0054 on 6 April. A M 2.2 earthquake struck at 0437 the same day at 5.2 km depth centered 11 km NW of the crater. On 19 May the station 5 km SW (IRZ2) registed a swarm consisting of 23 high-frequency earthquakes.
Irazú lies along a fault zone shaken by repeated earthquakes in the past 6 years. It was estimated that ~40 of May's 136 earthquakes were associated with faulting. Earlier summaries of monthly earthquakes for December 1996, and January and March 1997 reported 51, 82, and 92 events, respectively.
Irazú's ashfalls frequently reached San Jose, 25 km to the E, during its historically most active period in 1963- 65. That period of intermittent, weak-to-moderate explosive activity severely affected agricultural areas over much of central Costa Rica, causing major economic problems. During the same interval, 46 secondary mudflows swept down the Rio Reventado valley.
Geologic Background. The massive Irazú volcano in Costa Rica, immediately E of the capital city of San José, covers an area of 500 km2 and is vegetated to within a few hundred meters of its broad summit crater complex. At least 10 satellitic cones are located on its S flank. No lava effusion is known since the eruption of the Cervantes lava flows from S-flank vents about 14,000 years ago, and all known Holocene eruptions have been explosive. The focus of eruptions at the summit crater complex has migrated to the W towards the main crater, which contains a small lake. The first well-documented eruption occurred in 1723, and frequent explosive eruptions have occurred since. Ashfall from the last major eruption during 1963-65 caused significant disruption to San José and surrounding areas. Phreatic activity reported in 1994 may have been a landslide event from the fumarolic area on the NW summit (Fallas et al., 2018).
Information Contacts: E. Fernandez, R. Van der Laat, F. de Obaldia, T. Marino, V. Barboza, W. Jimenez, R. Saenz, E. Duarte, M. Martinez, E. Hernandez, and F. Vega, Observatorio Vulcanologico y Sismologico de Costa Rica, Universidad Nacional (OVSICORI-UNA), Apartado 86-3000, Heredia, Costa Rica.
Langila (Papua New Guinea) — May 1997 Cite this Report
Langila
Papua New Guinea
5.525°S, 148.42°E; summit elev. 1330 m
All times are local (unless otherwise noted)
Late-May eruptions send plumes up to 4.5 km elevation
Vulcanian explosions resumed in late May. During the first 3 weeks of the month Crater 2 released moderate volumes of steam. Then, an explosion on the 22nd at 1510 produced dark gray ash clouds that rose to about 4.5 km above the crater rim. Explosions on the following days of May generated ash clouds to heights of between 2 and 3.5 km. Low rumbling sounds on the 27th presumably accompanied other explosions. Only weak vapor vented at Crater 3 during May. Seismographs remained inoperative.
Geologic Background. Langila, one of the most active volcanoes of New Britain, consists of a group of four small overlapping composite basaltic-andesitic cones on the lower E flank of the extinct Talawe volcano in the Cape Gloucester area of NW New Britain. A rectangular, 2.5-km-long crater is breached widely to the SE; Langila was constructed NE of the breached crater of Talawe. An extensive lava field reaches the coast on the N and NE sides of Langila. Frequent mild-to-moderate explosive eruptions, sometimes accompanied by lava flows, have been recorded since the 19th century from three active craters at the summit. The youngest and smallest crater (no. 3 crater) was formed in 1960 and has a diameter of 150 m.
Information Contacts: B. Talai, D. Lolok, P. de Saint-Ours, and C. McKee, RVO.
Manam (Papua New Guinea) — May 1997 Cite this Report
Manam
Papua New Guinea
4.08°S, 145.037°E; summit elev. 1807 m
All times are local (unless otherwise noted)
Continued outbursts and light ashfalls
During the first week of May, Main Crater gently emitted small to moderate ash clouds, similar to those in late April. On 9 May, activity increased slightly and ash clouds were ejected to 500-1,000 m above the summit resulting in light ashfall downwind. Forceful emissions and light ashfalls at Main Crater occurred on the 13th; there were also two loud explosions during 1500-1600. After that, there were weak-moderate ash emissions accompanied by roaring noises and infrequent rumblings. Rumblings on the 6th and 28th were attributed to rocks cascading into Southwest Valley. Activity increased again on the 29th. South Crater weakly emitted steam during May.
Seismicity showed an irregular rise during May (growing from 800 to 1,700 low-frequency events/day). Wave amplitudes, although low, doubled. Water-tube tiltmeters at Manam Volcano Observatory (4 km SW of the summit) showed a very small inflationary change (0.5 µrad), which may be significant because it continues the inflationary pattern evident since early March.
Geologic Background. The 10-km-wide island of Manam, lying 13 km off the northern coast of mainland Papua New Guinea, is one of the country's most active volcanoes. Four large radial valleys extend from the unvegetated summit of the conical basaltic-andesitic stratovolcano to its lower flanks. These valleys channel lava flows and pyroclastic avalanches that have sometimes reached the coast. Five small satellitic centers are located near the island's shoreline on the northern, southern, and western sides. Two summit craters are present; both are active, although most observed eruptions have originated from the southern crater, concentrating eruptive products during much of the past century into the SE valley. Frequent eruptions, typically of mild-to-moderate scale, have been recorded since 1616. Occasional larger eruptions have produced pyroclastic flows and lava flows that reached flat-lying coastal areas and entered the sea, sometimes impacting populated areas.
Information Contacts: B. Talai, D. Lolok, P. de Saint-Ours, and C. McKee, RVO.
Monowai (New Zealand) — May 1997 Cite this Report
Monowai
New Zealand
25.887°S, 177.188°W; summit elev. -132 m
All times are local (unless otherwise noted)
Seismically inferred eruption during 17-20 April
Between 17 and 20 April the seismic network of the French Laboratoire de Geophysique in Tahiti recorded an acoustic swarm from Monowai seamount (figure 3). The swarm ended on 20 April at 2058 GMT. It was very similar to the swarm of September 1996, with similar amplitudes and overall duration.
The signals for the 17 April acoustic swarm that started at 2007 GMT consisted of strong acoustic waves with a maximum peak-to-peak amplitude of 1.01 m/s. These and later signals were interpreted as an indication of explosive phenomena. The subsequent acoustic waves were weaker, with amplitudes between 50 and 450 millimicrons/second. Overall, the laboratory recorded 136 acoustic waves. Most of the signals clustered into two episodes. The first took place on 18 April during 0013-1911 GMT and included 46 acoustic waves. The second occurred on 19 April during 0308-0810 GMT and included 81 acoustic waves. In addition to including more waves in a shorter time interval, the second episode was stronger.
The above-cited coordinates (25.89°S, 177.19°W) are for the summit of the volcano. A bubbling area was discovered on 17 October 1977 at 25.917°S, 177.233°W. The exact coordinates of the acoustic source discussed here are not well known, and can not be located precisely using currently available T-wave selections.
Proceeding NNE from the Rumble (I, II, III, and IV) seamounts (New Zealand), the next known active volcanoes lie in the Southern Kermadec Islands. From S to N, these consist of Curtis (submarine), Brimstone Island (submarine), Macauley Island (a sub-aerial caldera), Raoul Island (a vigorously active stratovolcano), an unnamed center (submarine), and then Monowai (submarine). Monowai was the source of over six inferred eruptions; in some cases these eruption reports were also based on collateral visual observations such as discolored water and bubbles.
Geologic Background. Monowai, also known as Orion seamount, is a basaltic stratovolcano that rises from a depth of about 1,500 to within 100 m of the ocean surface about halfway between the Kermadec and Tonga island groups, at the southern end of the Tonga Ridge. Small cones occur on the N and W flanks, and an 8.5 x 11 km submarine caldera with a depth of more than 1,500 m lies to the NNE. Numerous eruptions have been identified using submarine acoustic signals since it was first recognized as a volcano in 1977. A shoal that had been reported in 1944 may have been a pumice raft or water disturbance due to degassing. Surface observations have included water discoloration, vigorous gas bubbling, and areas of upwelling water, sometimes accompanied by rumbling noises. It was named for one of the New Zealand Navy bathymetric survey ships that documented its morphology.
Information Contacts: Olivier Hyvernaud, BP 640, Laboratoire de Geophysique, Tahiti, French Polynesia.
Poas
Costa Rica
10.2°N, 84.233°W; summit elev. 2697 m
All times are local (unless otherwise noted)
Number of monthly earthquakes high in April, lower in May
During April, fumarolic degassing and weak bubbling continued in the 29°C, green-turquoise-colored crater lake. On the N crater floor there appeared a new 80-m-long fracture with fumaroles depositing sulfur; weakly escaping gases there had temperatures of 94°C. The same temperature was measured at the accessible part of the pyroclastic cone, and other fumaroles reached temperatures of 92-93°C. A steam plume rose 300 m above the crater floor.
April seismicity increased to 2,532 events (2,192 low-frequency and 339 medium-frequency). Only one month in the previous year had more events: during January 1996 there were 4,045 events. The high seismicity was not sustained, May 1997 earthquakes only numbered 1,020. In conjunction with medium-frequency earthquakes, people watching the volcano noticed new fumaroles. The distance net showed no significant changes during 1997.
Geologic Background. The broad vegetated edifice of Poás, one of the most active volcanoes of Costa Rica, contains three craters along a N-S line. The frequently visited multi-hued summit crater lakes of the basaltic-to-dacitic volcano are easily accessible by vehicle from the nearby capital city of San José. A N-S-trending fissure cutting the complex stratovolcano extends to the lower N flank, where it has produced the Congo stratovolcano and several lake-filled maars. The southernmost of the two summit crater lakes, Botos, last erupted about 7,500 years ago. The more prominent geothermally heated northern lake, Laguna Caliente, is one of the world's most acidic natural lakes, with a pH of near zero. It has been the site of frequent phreatic and phreatomagmatic eruptions since an eruption was reported in 1828. Eruptions often include geyser-like ejections of crater-lake water.
Information Contacts: E. Fernandez, R. Van der Laat, F. de Obaldia, T. Marino, V. Barboza, W. Jimenez, R. Saenz, E. Duarte, M. Martinez, E. Hernandez, and F. Vega, Observatorio Vulcanologico y Sismologico de Costa Rica, Universidad Nacional (OVSICORI-UNA).
Rabaul (Papua New Guinea) — May 1997 Cite this Report
Rabaul
Papua New Guinea
4.2459°S, 152.1937°E; summit elev. 688 m
All times are local (unless otherwise noted)
Inflation precedes 1 June eruption at Tavurvur
Inflation recorded since late April culminated in a Strombolian eruption on 1 June. Unlike most of the earlier Strombolian eruptions, this one escalated slowly and sustained moderate-to-high intensities briefly before declining.
Activity during May. The lead-up to June's Strombolian eruption, like that of the April eruption, was characterized by relatively low-pressure, but voluminous gas-rich emissions. Occasionally, these very pale gray emissions produced light ashfalls from columns with heights of 0.6-1 km altitude. Roaring sounds were heard throughout May; loud explosions occurred on the 2nd (at 0105), 12th (1526), 14th (0759), 15th (0052), and 31st (2201). Weak night glows were seen above the crater on the 1, 2, 16, and 25 May.
Twenty-one low-frequency earthquakes (mostly associated with explosions) were recorded during May; most in the first two weeks. The highest numbers of daily earthquakes reached four on the 7th and three on the 8th. There were six high-frequency earthquakes on the 18th. Two of these were located immediately NE of the caldera and one was just outside the SE part of the caldera. Background seismicity remained low at ~20 RSAM units.
The Sulphur Creek water-tube tiltmeters registered N-down tilt in early May, continuing the inflationary pattern seen since late April. About 5 µrad of inflationary tilt had accumulated by mid-May, a time when the tilting seemed to cease or perhaps reverse slightly. At Sulphur Creek, the total inflation since the March eruption was ~10 µrad.
A new electronic tiltmeter was installed at Matupit Island on 8 May and soon indicated WNW-down tilt, suggesting inflation of the magma reservoir. About 18 µrad of this tilting had accumulated by 15 May when tilt changed to WSW-down, a direction radial to Tavurvur. This change was consistent with the behavior of the tiltmeters at Sulphur Creek in mid May. The WSW-down tilt continued through the remainder of the month, amounting to ~20 µrad. The pattern of tilting registered by the electronic tiltmeter on the S part of the Vulcan headland (Vulcan Island) was complicated during the first half of May, but during the second half of the month ~10 µrad of SW-down tilt took place, consistent with the inflation in the central or eastern part of the caldera.
During May the water-tube tiltmeters at Tavuiliu (on Rabaul caldera's SW rim) continued to shift in a SW- down direction. Since the April eruption this tilting had amounted to about 6 µrad. The only late-stage precursor to the 1 June eruption was an unusual E-down tilt of a few microradians recorded at the Matupit Island electronic tiltmeter beginning about midday on 31 May.
Activity during June. Apart from the tilt, through the early morning of 1 June there was little indication of the impending Strombolian eruption. The eruption's early phase began when low-pressure, hazy, white-and-blue emissions rose a few hundred meters above Tavurvur.
Starting about 0700 at Matupit Island, a N-down shift in tilt began at ~1 µrad/hour accompanied by discontinuous tremor (recorded at the nearest seismic station, KPTH, ~1 km away on Matupit Island). By about 0830 on 1 June, the seismicity had climbed to ~50 RSAM units from a normal background of about 20. At 0837, a moderate explosion sent a low-density ash cloud ~1.3 km above the vent. Seismicity briefly reached 200 RSAM units and then declined to ~90 RSAM units by 0900. The column remained at ~1.3 km and seismicity fluctuated between about 60 and 150 RSAM units until 1030 when activity intensified.
Later, at about 1030, the column rose to ~2.5 km and seismicity increased to 250 RSAM units. The column was a pale gray-brown color, with moderate ash content. A strong S wind blew the plume over the E side of Rabaul Town. Then, between 1100 and 1145, eruptive vigor declined and seismicity fell (to 120 RSAM units).
From 1130 until 1930, the eruption was observed at comparatively close range, at 0.5-1.5 km distances. Although the explosions were initially, around 1130, almost continuous, the column only rose to ~0.5 km above the vent. There were multiple active vents within Tavurvur's summit crater, but the principal one was near the crater's S rim. The explosions produced broad, dense, and moderately dark gray emission clouds that assumed the shape of cock's tails. The activity began increasing again at 1145 and lightning was seen in the column at 1200. The N-down tilt that had been in progress since 0700 reversed at 1200 after accumulating ~5 µrad.
A change in the column was noticed at about 1240 as the emissions became distinctly depleted in ash and the sounds grew louder and sharper. By this time seismicity had increased to about 250 RSAM units, where it stayed until 1400. Tavurur's principal vent (on the S side of the crater) started ejecting incandescent lava fragments, including some very large ones. For brief intervals, other vents in the crater issued dark, dense clouds.
The noisy explosions from the principal vent carried brightly incandescent lava fragments with little ash. In contrast, the dense ash-rich explosions from other vents escaped were accompanied by little or no sound.
During a brief lull between about 1400 and 1425 seismicity fell to ~200 RSAM units. Then, at about 1425, distinctly louder explosions began. It appeared that fluid lava had almost reached the crater rim and the explosions were akin to bubbles bursting. The explosions usually involved sustained jetting for periods of over 10 seconds. Intervals between events were typically only a few seconds.
Beginning about 1440, visible shock waves were observed. At about 1451 the explosions were very loud and the eruption column was about 0.5 km high. At 1450, seismicity peaked at 645 RSAM units.
A prolonged period of dense, dark ash emission commenced at about 1500 and seismicity fell sharply. While dark ash clouds billowed upwards from vents in the W part of the crater, the principal vent continued producing nearly ash-free explosions bearing larger incandescent fragments. The dense, dark ash emission had ceased by 1519, and by then seismicity had dropped to 300 RSAM units. Seismicity during 1520-1600 increased to ~500 RSAM units; after that it declined slowly so that by 1800 it reached 300 RSAM units. After 1830 seismicity declined more quickly, so that by 2030 it reached only 90 RSAM units.
For most of the remainder of the eruption the only vent to emit much solid material was the principal vent, which continued to eject nearly ash-free, incandescent lava fragments. Although the bulk of the column remained only ~0.5 km above the vent, beginning in the mid-afternoon some fragments rose ~100 m higher. Explosions throughout the afternoon tended to sustain stronger jets of gas and lava fragments. By about 1800 some of the explosions were more than 1-minute long. In one 5-minute period at about 1800 there were eight explosions.
Witnesses on a boat sailing past Tavurvur's S and W flanks at about 1910-1930 noticed considerably more ejecta landing N of the vent. Some ejecta blew in the strong prevailing S wind as far as Tavurvur's N flank. Between 1200 and 2000 the tiltmeter at Matupit Island had accumulated ~5 µrad of predominantly S-down tilt. Then, at 2000, the tilt shifted to SW down, changing by 0.3 µrad/hour.
During the night of 1 June there were episodes of rhythmic degassing; in addition some very loud detonations shook buildings. Background seismicity fell slowly after 2030 on June 1, descending by midnight to 30 RSAM units. Sustained increases in seismicity returned on 2 June during two intervals: the first, 0100-0145, and the second, 0300-0500. During these intervals, seismicity reached 300 and 250 RSAM units, respectively. In addition, a brief (10 minute) peak in seismicity occurred around 0330 on 2 June; it reached 750 RSAM units.
Overview. Unlike some previous eruptions, no lava flows were generated by the 1-2 June event. Ejected lava fragments showed textural evidence of moderate expansion but lacked evidence of post-emplacement flow. Additionally, the bombs were considerably smaller.
The volume of material erupted on 1 June was very small, possibly only 1 x 10⁵ m3. There was no off- set in tilt as had been seen with the earlier, larger eruptions. Thus, after the 1 June eruption, Tavurvur remained inflated 10 µrad over the tilt encountered after the March eruption (BGVN 22:03). Accordingly, scientists believe that Tavurvur could erupt with similar intensity again in coming weeks.
Geologic Background. The low-lying Rabaul caldera on the tip of the Gazelle Peninsula at the NE end of New Britain forms a broad sheltered harbor utilized by what was the island's largest city prior to a major eruption in 1994. The outer flanks of the asymmetrical shield volcano are formed by thick pyroclastic-flow deposits. The 8 x 14 km caldera is widely breached on the east, where its floor is flooded by Blanche Bay and was formed about 1,400 years ago. An earlier caldera-forming eruption about 7,100 years ago is thought to have originated from Tavui caldera, offshore to the north. Three small stratovolcanoes lie outside the N and NE caldera rims. Post-caldera eruptions built basaltic-to-dacitic pyroclastic cones on the caldera floor near the NE and W caldera walls. Several of these, including Vulcan cone, which was formed during a large eruption in 1878, have produced major explosive activity during historical time. A powerful explosive eruption in 1994 occurred simultaneously from Vulcan and Tavurvur volcanoes and forced the temporary abandonment of Rabaul city.
Information Contacts: B. Talai, D. Lolok, P. de Saint-Ours, and C. McKee, Rabaul Volcano Observatory (RVO), P.O. Box 386, Rabaul, Papua New Guinea.
Rincon de la Vieja (Costa Rica) — May 1997 Cite this Report
Rincon de la Vieja
Costa Rica
10.83°N, 85.324°W; summit elev. 1916 m
All times are local (unless otherwise noted)
Conspicuous fumaroles and plumes persist
During April, fumarolic activity remained in the E and S parts of the main crater. In the latter location, escaping gases hissed like a pressure cooker and were audible from the crater rim. Gas columns rose up to 200 m high. Adjacent to the crater, visitors smelled sulfur gases and their throats, eyes, and skin became irritated. Some of the plants damaged during November 1995 showed new signs of recovery. Although the seismic station (RIN3, located 5 km SW of the active crater) remained out of service during May, earthquake counts numbered five events in December 1996 and 24 in January 1997.
Geologic Background. Rincón de la Vieja, the largest volcano in NW Costa Rica, is a remote volcanic complex in the Guanacaste Range. The volcano consists of an elongated, arcuate NW-SE-trending ridge constructed within the 15-km-wide early Pleistocene Guachipelín caldera, whose rim is exposed on the south side. Sometimes known as the "Colossus of Guanacaste," it has an estimated volume of 130 km3 and contains at least nine major eruptive centers. Activity has migrated to the SE, where the youngest-looking craters are located. The twin cone of Santa María volcano, the highest peak of the complex, is located at the eastern end of a smaller, 5-km-wide caldera and has a 500-m-wide crater. A Plinian eruption producing the 0.25 km3 Río Blanca tephra about 3,500 years ago was the last major magmatic eruption. All subsequent eruptions, including numerous historical eruptions possibly dating back to the 16th century, have been from the prominent active crater containing a 500-m-wide acid lake located ENE of Von Seebach crater.
Information Contacts: E. Fernandez, R. Van der Laat, F. de Obaldia, T. Marino, V. Barboza, W. Jimenez, R. Sáenz, E. Duarte, M. Martinez, E. Hernandez, and F. Vega, Observatorio Vulcanológico y Sismológico de Costa Rica, Universidad Nacional (OVSICORI-UNA), Apartado 86-3000, Heredia, Costa Rica.
San Cristobal (Nicaragua) — May 1997 Cite this Report
San Cristobal
Nicaragua
12.702°N, 87.004°W; summit elev. 1745 m
All times are local (unless otherwise noted)
Eruptions cause ashfall on the slopes; plumes to 2,500 m
According to press reports quoting an official from the Instituto Nicaraguense de Estudios Territoriales (INETER), an eruptive phase began at San Cristóbal during the night of 19-20 May. Because of the possibility of ashfall, authorities declared a state of alert in the city of Chinandega, one of the largest cities in Nicaragua, situated 20 km WSW, the main downwind direction. A report about precursory seismicity was provided by INETER on 18 May. Observations after the start of eruptive activity were sent by Benjamin van Wyk de Vries (Open University), and include information from INETER scientists.
Precursory activity as of 18 May. Strong seismic activity was detected starting in May, by far the strongest seismicity observed since the new seismic station (CRIN, ~3 km NW of the crater at the base of the volcano), was installed at the end of 1992. As of 18 May CRIN was recording 500 volcano-seismic events/day, with frequencies of 1-6 Hz and durations of ~1 minute or more. Sometimes roughly mono-frequency wavetrains of ~3 Hz were observed. RSAM values climbed from2 odor. INETER volcanologists visited the volcano on 17 May, but could not climb to the crater because of high gas concentrations.
On 18 May INETER was preparing an observation point at Casita volcano, ~4 km SE of San Cristóbal. At the seismic station, CRIN, additional channels with low amplification were switched to be transmitted to the Managua data center. The installation of additional seismic stations is planned. INETER volcanologists took gas and water samples for analysis, and local residents were being interviewed to obtain information about recent changes at the volcano. INETER informed the Nicaraguan Government and the Civil Defense Organization about the situation.
Activity during 21-26 May. B. van Wyk de Vries visited the volcano during 21-23 May, setting up the base for a deformation network, and checking the general state of the cone and crater. RSAM levels stayed fairly constant during this period, but began a slow decline at the end of May. Eruptions through 26 May produced light gray clouds of ash that normally rose 50-200 m above the crater. There were a few notable large eruptions, including one at about 0245 on 22 May that reached 800 m. The height differences were partly due to how quickly the plume was pulled over by the wind. One pulse made a noise that was heard 3 km away at the Casita observation post. Pedro Perez (contracted to The Open University), who was at the crater edge on the morning of the 22nd, noted dull noises before each ejection of ash. Sounds were not heard the next day, when the ejections were less powerful. There were periods of up to a few hours with very weak gas release, then equally long periods of eruptions every 5-10 minutes, or a constant plume. If the wind was strong the plume was dragged down the cone to ~900 m, after which it rose to 1,000-1,200 m; during calmer periods the plume rose to 2,500 m.
Summit visit on 23 May. There was no activity when the crater was reached at 1200 on 23 May. Volcanologists stayed for an hour installing a GPS station on the edge of the outer crater. They made a very quick descent into the crater and saw a new vent. Before the start of activity in early May, San Cristóbal was generally the same as when van Wyk de Vries first saw it in 1986. The main change has been the slow progressive growth of the inner pit crater (figure 2). There is an old outer crater ledge on the S side, then the main crater (10-50 m deep); a small inner cone has been gradually hollowed out by a pit crater. The cone has now mostly fallen in, and only a small part to the S and W still exists. The pit is ~80 m deep and Pedro Perez reported that in early May it had a flat bottom. At that time there was little degassing: a few fumaroles on the SW side and a few fumarole mounds on the SE part of the main crater floor. There had been a vigorous fumarole on the edge of the pit crater, with a temperature of ~600°C, but this part had fallen in. On 23 May there was a 4-m-wide vent in the SW part of the pit crater floor; looking in at 45° no bottom could be seen, and in shadow it was not glowing. On the walls of the pit were dark patches of wet rock, where water seepage or fumarolic emanations had discolored the new ash. The whole of the crater was covered by ash. On the crater floor it was 10 cm deep and around the edges 1-2 cm. The upwind crater rim (SE-N) had a slight dusting. On the downwind rim ash had been stripped off the top of rocks but was accumulating in fine layers on the vertical upwind surfaces. The ash was being continually blown around and formed some beautiful ripples.
Ash covered the W side of the mountain, giving it a light-gray appearance down to ~800 m. Although vegetation hid the ash layer from distant viewers, it continued down to ~600 m where a 1-3 mm thick layer coated the ground and dusted the leaves. Gas masks were worn during the descent from the summit because the ash billowed up. Down at the farm of Las Rojas (500 m elevation) there was a slight dusting of ash; other farms reported heavier falls. Vegetation damage was not observed, possibly because everything is so dry in the area. Very light ashfall was occurring 10-15 km downwind.
No tremor was felt at the crater, though there were ~600 events/day being recorded. Campesinos living on the pass between San Cristóbal and Casita felt shocks on the night of 21-22 May. The only significant deformation features noted on 23 May were several fissures around the edge of the inner pit crater, which indicate that it is still enlarging. The fractures on the main crater floor were covered in ash, which was not fractured, indicating that there was no movement over the previous few days. Pedro Perez noted some rockfalls during explosive activity on the morning of the 22nd, from the N side of the pit crater.
Deformation network.The new GPS network consists of two triangles. The outer triangle is centered on a point on the pass between Casita and San Cristóbal, with one position on Casita, one 2 km SE of Chinandega, and one 10 km NE of Chinandega. The lines are ~10 km long. The center point should form one corner of an inner triangle, the other points being at Las Rojas farm to the W and one as yet undecided on the N flank. These lines are <5 km long. Within the inner triangle, points were placed at ~1,500 m elevation on the SE flank and on the W side of the crater edge at ~1,700 m; both are 1-2 km from the center point. Simultaneous measurements at all four of the outer triangle points were taken with the Open University GPS and the INETER GPS. Two points on the volcano were fixed, and will be re-occupied by INETER personnel. Although the whole of the network is not in place, at least three points on the volcano have been fixed and will indicate any major movement.
Volcanic history. San Cristóbal is a stratovolcano 100 km NW of Managua that has erupted about nine times since the Spanish conquest. Its previous most recent confirmed eruption was a 45-minute ash emission in October 1977 (SEAN 02:10), but a small ash emission may have occurred in November 1987 (SEAN 13:01). The San Cristóbal complex comprises San Cristóbal cone, El Chonco cone, Cerro Montoso, Casita volcano, and La Pelona Caldera (Hazlet, 1987; Van Wyk de Vries and Borgia, 1996). San Cristóbal proper is the youngest feature of the complex. Casita was probably active in the 16th century, and has several active fumarole fields. La Pelona looks as though it was once a large stratocone that underwent a caldera-forming eruption in the Quaternary. El Chonco is an 800-m-high andesite-dacite cone. Cerro Montoso is a 600-m-high andesitic scoria cone cut by large faults.
The complex as a whole has a tendency to produce significant amounts of dacitic magma. Examples include the Chonco cone and Loma La Teta (a dacite dome associated with El Chonco), recent pyroclastic-flow and tephra deposits on San Cristóbal and Casita, and the La Pelona Caldera ignimbrite. This type of magma contrasts with the predominant basalt-basaltic andesite of the other nearby volcanoes, such as Telica, Rota, and El Hoyo/Cerro Negro. Martha Navarro (INETER), who has done geological and hazard mapping at San Cristóbal, noted that the dacitic pyroclastic-flow deposits of San Cristóbal are similar in composition to a thick tephra-fall deposit that the forms subsoil over much of the west side of the cone. On the cone itself, these deposits are covered by more recent andesitic scoriae and bombs, some or all of which come from the historical eruptions in the 17th century and the 1970's. There have not been any historical lava flows, but several lava flows are still only partially vegetated.
References. Hazlett, R.W., 1987, Geology of the San Cristóbal volcanic complex, Nicaragua, in Williams, S.N. and Carr, M.J. (eds.), Richard E. Stoiber 75th Birthday Volume: J. Volcanol. Geotherm. Res., v. 33, p. 223-230.
Van Wyk de Vries, B., and Borgia, A., 1996, The role of basement in volcano deformation, in McGuire, W.J., Jones, A.P., and Neuberg, J. (eds.), Volcano Instability on the Earth and Other Planets: Geological Society Special Publication 110, London, p. 95-110.
Geologic Background. The San Cristóbal volcanic complex, consisting of five principal volcanic edifices, forms the NW end of the Marrabios Range. The symmetrical 1745-m-high youngest cone, named San Cristóbal (also known as El Viejo), is Nicaragua's highest volcano and is capped by a 500 x 600 m wide crater. El Chonco, with several flank lava domes, is located 4 km W of San Cristóbal; it and the eroded Moyotepe volcano, 4 km NE of San Cristóbal, are of Pleistocene age. Volcán Casita, containing an elongated summit crater, lies immediately east of San Cristóbal and was the site of a catastrophic landslide and lahar in 1998. The Plio-Pleistocene La Pelona caldera is located at the eastern end of the complex. Historical eruptions from San Cristóbal, consisting of small-to-moderate explosive activity, have been reported since the 16th century. Some other 16th-century eruptions attributed to Casita volcano are uncertain and may pertain to other Marrabios Range volcanoes.
Information Contacts: Wilfried Strauch and Pedro Perez, Department of Geophysics, Instituto Nicaraguense de Estudios Territoriales (INETER), P.O. Box 1761, Managua, Nicaragua; Benjamin van Wyk de Vries, Department of Earth Sciences, The Open University, Milton Keynes MK7 6AA, United Kingdom; Reuters.
Soufriere Hills (United Kingdom) — May 1997 Cite this Report
Soufriere Hills
United Kingdom
16.72°N, 62.18°W; summit elev. 915 m
All times are local (unless otherwise noted)
Pyroclastic flows no longer confined by the crater's N wall
On 25 June, unusually large pyroclastic flows swept down drainages on the volcano's NNE side reaching almost as far as the airport. Settlements along their path sustained serious damage. Amid rescue efforts on 27 June, MVO reported at least nine people dead, six injured, and 14 missing. Additional information will be provided in next month's Bulletin.
The following summarizes weekly Scientific Reports of the Montserrat Volcano Observatory for the period 11 May-7 June 1997 and NOAA/NESDIS satellite observations during 12 May-6 June. Many of the places mentioned in this report appear on available maps (e.g. BGVN 22:02; Williams, 1997).
A new risk map was released on 6 June (figure 22). Zone A was expanded from the crater to the N as far as Harris, Bramble, and Bethel villages. Areas designated as Zone B included Tuitt's and Spanish Point on the E and Streatham and Farrell's on the W. Bramble Airport, ~5 km NE of the volcano, was moved into zone C.
At the beginning of this reporting period, dome growth (estimated at 2 m3/s) was concentrated on the crater's S side, above the Galway's area. Rockfalls and a few small pyroclastic flows were shed into both the White River and down the S side of the Tar River valley. After 12 May loud roaring sounds caused by vigorous venting of ash and gas from the dome were heard at Whites, Harris, and Farrell's. These were taken to indicate increased gas pressures within the dome. Furthermore, on 12 May an airplane pilot reported ash between 1,830 and 2,440 m altitude.
On 13 May at 0755 a moderate-size pyroclastic flow from the summit region eroded a narrow channel on the E flank of the dome, a spot underlain by the ancestral Castle Peak. The flow went down the Tar River valley, splitting into two branches that traveled down either side of the upper break in slope, and eventually reached the delta at the coast. The ash cloud from this flow reached 3.3 km altitude and later formed a plume conspicuous in visible satellite imagery for 220 km WNW of the summit.
On 14 and 15 May, small, nearly continuous rockfalls and some small pyroclastic flows occurred on the NE and SE flanks of the dome; these traveled either towards the E (Tar River valley) or S (down Galway's side). Beginning at about 2040 on 15 May a 70-minute-long outburst generated moderate-size pyroclastic flows down the E side, creating a small scar ~40 m N of the one formed on 13 May.
Events on 16 May included small-to-moderate pyroclastic flows from the dome's summit. These traveled down the dome's N and NW sides, towards Farrell's wall, which deflected them E toward the Tar River valley. In addition erosion occurred on the dome's N face: talus continued piling up against the N and NNE crater rim.
During the following days activity was concentrated on the N and E flanks of the dome, with three major rockfall chutes developed on the dome's E, NE, and N sides. At the base of one of these chutes rockfall material piled up against the crater's N wall (Farrell's). Several small rockfalls were also heard on the crater's S side (Galway's wall), where new, relatively fine-grained rockfall deposits had blanketed the entire talus slopes.
On 18 May at 0820 the largest pyroclastic flow of this reporting period occurred. First, a large long-period earthquake took place; observers at Whites reported that the entire dome was being shaken just before the flow started. This pyroclastic flow traveled from the summit down both the 15 May chute and the NE chute. Then it passed down the N side of the Tar River valley to stop a few hundred meters from the delta. During that night intense glows were observed over the dome's entire NW face. There were also some incandescent rockfalls and small pyroclastic flows.
Clear visibility on 19 May revealed a new dark extrusion at the top of the NW dome. This area discharged ash and steam and ejected 5- to 20-cm diameter fragments up to ~60 m above the dome. The source of continuous rockfalls with small pyroclastic flows extended from the 15 May chute on the E to the margin of the September 1996 scar on the NW. The remnant wall of the scar prevented material from reaching the rim of Gages wall. The N side of the crater had filled up, with small amounts of dome material falling into the top of Tuitt's Ghaut, the N- flank drainage.
On 21 and 22 May a few small spines toppled, sending rockfalls down the E, NE, and NW flanks. On 22 May at 1300, after a rockfall on the N flank, some blocks reached ~100 m down the N flank (Tuitt's Ghaut). At 1430 a pyroclastic flow on the same flank produced an almost continuous ash plume; lapilli up to 4 mm in diameter were collected at Dyers and ash fragments ~1 mm in size were reported at Farrell's and from Salem up to St. John's.
Observations on 23 May from Chances Peak revealed several small spines and large blocks in the summit area with vigorous venting and gas emissions in the growth area; there was also a cleft in the middle separating the S lobe from the new extrusion in the N.
On 27 May, a large pyroclastic flow generated high on the E side of the dome traveled down the Tar River valley at a speed of 230 km/h , the fastest flow yet documented during the eruption. In the lower part of the valley the flow slowed considerably, and it stopped ~150 m from the sea. That same day, for the first time, moderate-size pyroclastic flows reached Tuitt's Ghaut; later on 29 May discernible material was deposited 400 m down this drainage.
By 31 May, talus slopes over the dome's E and NE flanks had covered the chutes formed by mid-May pyroclastic flows. The upper part of the dome's E face looked more blocky and relatively inactive. When visibility was good, the presence of ash below ~1,600 m was reported almost daily in satellite imagery.
Small pyroclastic flows down Tuitt's Ghaut on 2 June left fresh deposits ~1 km from the crater rim. By 3 June they reached 1.4 km, and by 4 June, 1.8 km. At 1207 on 5 June a pyroclastic flow extended ~2.9 km from the crater rim; a shorter flow followed to ~2 km. All of these pyroclastic flows were confined to the narrow valley and comparatively slow moving, taking about three minutes to descend it. In the first 500 m of the upland portion of the valley all vegetation was stripped from the valley walls. Farther down, some trees were left standing within the deposits. In the upper 1 km of the deposits there was evidence of several small, lobate flows. In general the thermal effects remained confined to 10 m from the deposit's edge, but on bends it rode up the banks of the ghaut (the so- called "bobsled" effect). The front of the flow was marked by a pile of burned logs and coarse debris, and a finer-grained surge had traveled ~100-200 m farther down the ghaut. A pyroclastic flow at 1845 on 6 June traveled ~2 km down from the crater rim; its front carried particularly large boulders. The flow significantly widened the notch in the crater wall through which it traveled; by this time the domes talus created a smooth slope down the ghaut.
NOAA reported ash clouds on 3, 4, and 5 June in visible satellite imagery up to 2,150 m altitude and crossing over the Virgin Islands, 400 km NW.
Seismicity. The shifting focus of dome growth and rising vigor of emission were reflected in a general decline in the number of long-period earthquakes and an increase in the number of hybrid earthquake swarms. Each swarm lasted for a few hours; some intense swarms during 19-21 May reached up to 35 events/hour. Rockfalls remained common and were concentrated during periods of minor dome collapse. The ratio of maximum rockfall amplitudes measured at Galway's Estate Station and Long Ground station served to differentiate between Tar River and White River pyroclastic flows.
Toward the end of May there was a significant reduction in the number of hybrid and long-period earthquakes, and rockfalls. The hybrid earthquake swarms continued until 27 May; although less frequent, they lasted longer.
The number of long-period earthquakes dropped to the normal background (0-4 events/day), the lowest levels since mid-March. The number of rockfalls increased from 1 June, and for the rest of the period were concentrated on the N and E sides of the dome. Periods of enhanced rockfall and pyroclastic-flow activity occurred every 16-20 hours and lasted ~4 hours. In the lulls, rockfalls continued at greatly reduced levels.
After 4 June the number of both long-period and hybrid earthquakes increased again. Over 50% of these shocks triggered rockfalls.
Ground deformation. GPS measurements at station FT3 (Farrell's wall) on 12 May showed continued movement to the NW, consistent with the total 20 cm of displacement noted since January 1997. Data were somewhat equivocal on 17 and 21 May. A GPS occupation at Chances Peak on 23 May suggested that it had moved 3.5 cm WNW since 28 April. Prior to that date, the movement was toward the NW. The change in direction was thought to reflect the dome's northward shift in activity.
Telemetered electronic tiltmeters installed at Chances Peak on 18 and 21 May (stations CP2 and CP3, W and E of the summit, respectively) registered cycles of inflation and deflation, each lasting ~12-18 hours. Progressive intervals and magnitudes of inflation were greater than those of deflation. Inflation occurred with hybrid earthquake swarms, and deflation correlated with peak rockfall/pyroclastic-flow events. RSAM patterns showed a strong correlation with tilt, with the higher spikes reflecting rockfalls, and the lower intensity patterns reflecting the sum of hybrid events and lesser rockfall activity. Thus tilt and RSAM combined provided a predictive capability. Accordingly, when it was possible, missions to close-in areas were scheduled during early inflation, when the likelihood of pyroclastic flows was considered minimal.
Crack 2, which developed into a zone of broad fracture on Chances Peak, was measured on 23 May, and on 4 and 8 June. The shear along the crack was dextral (E block moving S relative to W block) and reached 6 cm. The shear during 23 May-4 June was 2.5 cm. On 23 May a telemetered extensometer installed across part of Crack 2 that day showed almost 5 mm of diurnal change.
Dome volume, COSPEC, and other measurements. Using a combination of theodolite, GPS, and ranging binoculars, scientists on 19 May estimated the summit at 991 m elevation. One major change since the previous survey (15 April) was the inflation of the highest part of the dome above Galway's wall. Another change was the growth of the new extrusion in the N summit area and the talus accumulation in a 300-m-wide zone against the back of Farrell's wall, due to the activity on the N and NE faces. The volume of the dome from this survey was estimated at 60.1 x 10⁶ m3; this established an average extrusion rate during 15 April-19 May of 2.7 x 10⁵ m3/day (3.1 m3/s).
Later dome-volume surveys were severely hampered by poor visibility; however, brief clear windows allowed photos to be taken for both 31 May and 1 June, documenting continued growth of the dome's N side and summit. On the basis of these photos, the dome's volume was 64.6 x 10⁶ m3, a mean growth rate of 3.5 m3/s during 19 May-1 June. As with the last survey this represented a rate considerably above the mean extrusion rate of 2.1 m3/s.
Mini-COSPEC runs that were completed daily, often both in the morning and afternoon, gave results substantially higher than the usual background flux of 200-300 t/d. May and June SO2 fluxes were as follows: 24 May, 950 metric tons per day (t/d); 26 May, 940 t/d; 27 May, 971 t/d; 28 May, 616 t/d; 29 May, 770 t/d; 30 May, 510 t/d; 2 and 3 June, 475 t/d; 4 June, 2,129 t/d; 5 June, 2,242 t/d; 6 June, 642 t/d; and 7 June, 505 t/d. The high values on 4-5 June correlated with increased pyroclastic flow activity during 4-6 June. Sulfur diffusion tubes collected on 20 April and 4 May mainly showed values similar to those of previous weeks (table 19). The results from Upper Amersham on 17 May presumably increased because of the increase in the level of eruptive activity.
Table 19. SO2 concentrations in part per billion (ppb) from diffusion tubes at sites around the volcano. Recommended action level is 100 ppb. Courtesy of MVO.
| Location |
20 Apr 1997 |
04 May 1997 |
17 May 1997 |
| Plymouth Police HQ |
7.3 |
7.8 |
17.1 |
| Upper Amersham |
45.0 |
53.2 |
81.1 |
| Lower Amersham |
12.1 |
16.9 |
32.0 |
| Weekes |
0.0 |
0.0 |
4.3 |
| Whites landfill |
0.8 |
1.2 |
1.2 |
Rainwater collected W and NW of the volcano on 17 May was more acidic than samples from the previous week and chlorides and sulfates were present at substantially higher levels (table 20). After heavy rainfall and continued winds from the S and SE, a rainwater sample collected on 28 May from Lawyers, 2 km north of Salem, had a pH of 3.3. On those same days, new sites to the N of the volcano were also monitored and showed very low pH values. During this period the fluoride content of the rainwater was also elevated. The pH and fluoride returned to normal values when the wind direction changed to WNW at the end of May. Piped ground water had remained unaffected by the low pH of the rainwater.
Table 20. Rainwater geochemistry from 17 May to 1 June. For comparison, WHO guideline values are as follows: pH, 6.5- 8.5; TDS, 1.0 g/l; fluorides, 1.5 mg/l; chlorides, 250 mg/l; sulfates, 250 mg/l. Courtesy of MVO.
| Date |
Location |
pH |
Conductivity (mS/cm) |
Total Dissolved Solids (g/l) |
Sulfates (mg/l) |
Chlorides (mg/l) |
Fluorides (mg/l) |
| 17 May 1997 |
Weekes |
3.8 |
0.272 |
0.136 |
37 |
50 |
0.65 |
| 17 May 1997 |
Plymouth Police HQ |
2.7 |
3.51 |
1.75 |
560 |
710 |
-- |
| 17 May 1997 |
Upper Amersham |
2.4 |
2.45 |
1.22 |
107 |
315 |
-- |
| 17 May 1997 |
Lower Amersham |
2.8 |
4.26 |
2.13 |
97 |
760 |
-- |
| 25 May 1997 |
Weekes |
2.6 |
1.286 |
0.644 |
5 |
133 |
1.50 |
| 25 May 1997 |
Upper Amersham |
2.0 |
7.24 |
3.62 |
93 |
1000 |
0.20 |
| 25 May 1997 |
Am. cattle trough |
7.72 |
0.335 |
0.168 |
-- |
56 |
0.55 |
| 25 May 1997 |
Trial's reservoir |
7.9 |
0.827 |
0.414 |
42 |
112 |
0.35 |
| 27 May 1997 |
Hope |
2.8 |
0.789 |
0.37 |
-- |
70 |
1.50 |
| 28 May 1997 |
Weekes |
2.5 |
1.557 |
0.778 |
-- |
126 |
1.50 |
| 28 May 1997 |
Molyneux |
2.6 |
1.312 |
0.657 |
7 |
94 |
1.50 |
| 28 May 1997 |
Dyer's |
2.8 |
0.702 |
0.351 |
3 |
80 |
1.40 |
| 28 May 1997 |
Lawyer's |
3.0 |
0.46 |
0.23 |
-- |
52 |
1.25 |
| 28 May 1997 |
M.V.O. |
2.8 |
0.863 |
0.432 |
-- |
80 |
1.50 |
| 31 Jun 1997 |
Weekes |
3.4 |
0.257 |
0.128 |
3 |
-- |
1.20 |
| 31 Jun 1997 |
M.V.O. |
5.3 |
0.066 |
0.033 |
-- |
-- |
0.35 |
| 31 Jun 1997 |
Dyer's |
6.7 |
0.092 |
0.046 |
3 |
-- |
0.20 |
| 31 Jun 1997 |
Upper Amersham |
2.8 |
0.914 |
0.458 |
12 |
-- |
1.50 |
| 31 Jun 1997 |
Lower Amersham |
3.1 |
0.533 |
0.267 |
18 |
-- |
1.15 |
| 31 Jun 1997 |
Am. cattle trough |
8.89 |
0.32 |
0.16 |
-- |
-- |
0.35 |
| 31 Jun 1997 |
Trial's res. Overflow(from the tap) |
7.8 |
0.845 |
0.423 |
38 |
-- |
0.30 |
Ash was collected on 17 May following several days of increased volcanic activity. The ash was at least 6 mm thick at Upper Amersham, and 4 mm at Lower Amersham, the Plymouth Police Headquarters, and Dagenham. Ash collected on 1 June was noticeably fine and widely distributed from Brodericks to Dyers with the thickest ash fall (2 mm) at Upper Amersham, Dagenham, and Plymouth Police HQ.
Reference. Williams, A.R., 1997, Montserrat, under the Volcano: National Geographic, v. 192, no. 1 (July 1997), p. 58-77.
Geologic Background. The complex, dominantly andesitic Soufrière Hills volcano occupies the southern half of the island of Montserrat. The summit area consists primarily of a series of lava domes emplaced along an ESE-trending zone. The volcano is flanked by Pleistocene complexes to the north and south. English's Crater, a 1-km-wide crater breached widely to the east by edifice collapse, was formed about 2000 years ago as a result of the youngest of several collapse events producing submarine debris-avalanche deposits. Block-and-ash flow and surge deposits associated with dome growth predominate in flank deposits, including those from an eruption that likely preceded the 1632 CE settlement of the island, allowing cultivation on recently devegetated land to near the summit. Non-eruptive seismic swarms occurred at 30-year intervals in the 20th century, but no historical eruptions were recorded until 1995. Long-term small-to-moderate ash eruptions beginning in that year were later accompanied by lava-dome growth and pyroclastic flows that forced evacuation of the southern half of the island and ultimately destroyed the capital city of Plymouth, causing major social and economic disruption.
Information Contacts: Montserrat Volcano Observatory (MVO), c/o Chief Minister's Office, PO Box 292, Plymouth, Montserrat (URL: http://www.mvo.ms/); NOAA/NESDIS Satellite Analysis Branch (SAB), Room 401, 5200 Auth Road, Camp Spring, MD 20746, USA.
Special Announcements (Unknown) — May 1997 Cite this Report
Special Announcements
Unknown
Unknown, Unknown; summit elev. m
All times are local (unless otherwise noted)
Aviator's observation form
Tens of commercial jet aircraft, which are not designed to fly through particulate and corrosive gases, have suffered damage from inadvertently encountering ash clouds that had drifted tens to hundreds of kilometers from erupting volcanoes; in one case, a plane descended more than 6 km before the engines could be restarted (Casadevall, 1994). As a result of this vulnerability, there have been new and evolving strategies for alerting aviators as to the presence, location, and movement of eruption plumes. Conversely, pilots often see aspects of volcanism that merit preservation in the Bulletin. In order to solicit and register these observations, a form for pilots relates a series of key questions (plate 1, back page).
The form, called the "Volcanic Activity Reporting Form," is now included in the US Aeronautical Information Manual (FAA, 1995), a reference used by all large US carriers. A similar form is in use by members of the International Civil Aviation Organization (ICAO).
The form is divided into two parts. The critical upper part (numbers 1-8) gets radioed to air traffic control immediately. Most of the form's lower part provides stated choices on topics such as ash density and color, continuousness of the eruption, as well as the effects on the aircraft and atmosphere (numbers 9-15). The last block (number 16) allows pilots to provide further written information.
The forms are ultimately to be sent (via mail or fax) to GVN for archiving. Expenses for postage or connections by fax can be reimbursed by the GVN.
In addition to the form itself, we wish to receive other aviation observations. These may include eyewitness accounts or photos made by passengers or crew, descriptions of damage, or ash collected by mechanics, as well as relevant weather details from meteorologists. These can (and already do) complement volcanological and atmospheric studies of eruptive activity. Ideally, such multiple perspectives can build a much more comprehensive picture of volcanic processes than can result from any one vantage point.
Every day thousands of people fly across potentially ash-contaminated airspace--to some degree, the people in these planes are just as vulnerable as villages perched on a volcano's flanks. Conventional planes still lack on- board instruments to warn pilots if hazardous atmospheric ash lies ahead. Such plumes are relatively rare, but to consistently avoid them requires interdisciplinary communication and cooperation between both aviators and scientists.
References. Casadevall, T.J. (ed.), 1994, Volcanic ash and aviation safety, Proceeding of the First International Symposium on Volcanic Ash and Aviation Safety (Seattle, Washington, July 1991): U.S. Geological Survey Bulletin 2047, 450 p.
Federal Aviation Administration, 1995, Volcanic Activity Reporting Form: US Aeronautical Information Manual (AIM), 1995 (June), Appendix 2 (1 May 1997), p. A2-1, Superintendent of Documents, US Government Printing Office, Washington, D.C.
Further Reference. Casadevall, T.J., and Thompson, T.B., 1995, Volcanoes and principal aeronautical features, Geophysical Investigation Map GP-1011: U.S. Geological Survey, prepared in cooperation with Jeppesen Sanderson, Inc.
Geologic Background. Special announcements or information of general interest not linked to any specific volcano.
Information Contacts: Captain Ed Miller (Retired), Air Line Pilots Association, 535 Herndon Parkway, P.O. Box 1169, Herndon, VA 20172-1169 USA; Tom Fox, Air Navigation Bureau, International Civil Aviation Organization (ICAO), 999 University St., Montreal H3C 5H7, Canada.
Stromboli
Italy
38.789°N, 15.213°E; summit elev. 924 m
All times are local (unless otherwise noted)
New map of the crater terrace
A 7-hour visit on 23 May led to the construction of a crater terrace map (figure 55). The Crater 2 pit mapped in 1994 and 1995 had filled in and was occupied by an inactive lava flow fed from a small truncated cone. From information by Jürg Alean (BGVN 22:03) it was inferred that this flow was emplaced between 25 April and 19 September 1996. A new subsidence bowl was forming to the SE of the former Crater 2 pit. This was occupied by a pit crater and three vents (2/1, 2/2, and 2/3), none of which exhibited explosive activity. Vent 2/1, ~4 m in diameter, was the source of regular (~1/s) gas puffs and occasional gas release, and also showed night incandescence.
Activity during the 23 May visit was at lower levels than seen in either October 1994 (BGVN 19:10) or September 1995 (BGVN 20:11/12). However, excellent viewing conditions revealed that major changes had occurred since the 1994 and 1995 surveys (BGVN 22:03).
During the intervals 1100-1400 and 1900-2200, no eruptions were observed from Crater 3. However, at about1400 on 24 May, an explosion from Crater 3 fed a brown ash cloud that rose ~200 m above the crater rim. This was observed from the sea.
Night-time temperature measurements obtained from Pizzo Sopra la Fossa using a Minolta/Land 152 infrared thermometer (corrected for an emissivity of 0.956) gave 2/1 vent temperatures of 670-699°C. Vents 2/2 and 2/3 (~3 x 1 m and <1 m wide, respectively) were actively degassing without incandescence. The site of hornitos in 1994 and 1995 was occupied by a pit, with a wall on the NE side.
Crater 1 was occupied by two active vents (1/1 and 1/2). Between 1055 and 1155 on 23 May eight explosions occurred from these two vents. The first two explosions sent bombs 100-200 m above the crater rim with ~20% of the ejecta landing on the upper Sciara. The following six explosions sent ejecta up to 50 m above the vent.
For the next two hours, Crater 1 exploded ~1-2 times/hour, but additional sloshing and gas release sounds were occasionally audible from Pizzo Sopra la Fossa. By the evening of 23 May, Crater 1 activity had escalated to levels similar to the 1055-1155 period. As darkness fell, an intense pulsating glow visible over Crater 1 could have been due to a small, active lava pond on the crater floor. This may have accounted for the sloshing sounds heard earlier in the day.
Stromboli, a small island N of Sicily, has been in almost continuous eruption for over 2,000 years. Its small Strombolian explosions, which hurl incandescent scoriae above the crater rim, occur several times a day, but larger eruptions are less frequent.
Geologic Background. Spectacular incandescent nighttime explosions at Stromboli have long attracted visitors to the "Lighthouse of the Mediterranean" in the NE Aeolian Islands. This volcano has lent its name to the frequent mild explosive activity that has characterized its eruptions throughout much of historical time. The small island is the emergent summit of a volcano that grew in two main eruptive cycles, the last of which formed the western portion of the island. The Neostromboli eruptive period took place between about 13,000 and 5,000 years ago. The active summit vents are located at the head of the Sciara del Fuoco, a prominent scarp that formed about 5,000 years ago due to a series of slope failures which extends to below sea level. The modern volcano has been constructed within this scarp, which funnels pyroclastic ejecta and lava flows to the NW. Essentially continuous mild Strombolian explosions, sometimes accompanied by lava flows, have been recorded for more than a millennium.
Information Contacts: Andy Harris, HIGP/SOEST, University of Hawaii, 2525 Correa Road, Honolulu, HI 96822 USA.
Telica
Nicaragua
12.606°N, 86.84°W; summit elev. 1036 m
All times are local (unless otherwise noted)
Continued high levels of seismicity
Seismicity as of mid-May remained at a high level, similar to recent months. There have been ~160 daily volcano-seismic events detected, with little variation. During March there were ~150 seismic signals/day recorded; in December 1996 there were <100 signals/day (BGVN 22:03).
An eruption on 31 July 1994 produced a gas-and-ash column and detectable ash fell as far as 17 km from the summit (BGVN 19:07). Phreatic explosions continued until 12 August 1994 when seismicity began decreasing (BGVN 19:09).
Geologic Background. Telica, one of Nicaragua's most active volcanoes, has erupted frequently since the beginning of the Spanish era. This volcano group consists of several interlocking cones and vents with a general NW alignment. Sixteenth-century eruptions were reported at symmetrical Santa Clara volcano at the SW end of the group. However, its eroded and breached crater has been covered by forests throughout historical time, and these eruptions may have originated from Telica, whose upper slopes in contrast are unvegetated. The steep-sided cone of Telica is truncated by a 700-m-wide double crater; the southern crater, the source of recent eruptions, is 120 m deep. El Liston, immediately E, has several nested craters. The fumaroles and boiling mudpots of Hervideros de San Jacinto, SE of Telica, form a prominent geothermal area frequented by tourists, and geothermal exploration has occurred nearby.
Information Contacts: Wilfried Strauch, Department of Geophysics, Instituto Nicaraguense de Estudios Territoriales (INETER), P.O. Box 1761, Managua, Nicaragua.
Turrialba (Costa Rica) — May 1997 Cite this Report
Turrialba
Costa Rica
10.025°N, 83.767°W; summit elev. 3340 m
All times are local (unless otherwise noted)
Fumarolic temperatures near 90°C; two M 2 earthquakes in May
Fumaroles emitted comparatively little gas but remained active in the main crater's NE, N, NW, and W parts, with temperatures in the range 89-90°C. In the N and S parts of the crater, small areas of mass-wasting covered some fumaroles. Seismicity at a station 500 m E of the active crater (station VTU) has been measured consistently since May 1996; reported local earthquake counts included 72 in December 1996, 146 in January 1997, 194 in February, 182 in March, and 137 in April. During May, seismic station VTU registered a total of 72 earthquakes. On 10-11 May, four of these were located at 5-6 km depths at 8-9 km distances NE of the crater, with magnitudes of 2.1-2.6. Their origin was possibly related to a local fault.
Geologic Background. Turrialba, the easternmost of Costa Rica's Holocene volcanoes, is a large vegetated basaltic-to-dacitic stratovolcano located across a broad saddle NE of Irazú volcano overlooking the city of Cartago. The massive edifice covers an area of 500 km2. Three well-defined craters occur at the upper SW end of a broad 800 x 2200 m summit depression that is breached to the NE. Most activity originated from the summit vent complex, but two pyroclastic cones are located on the SW flank. Five major explosive eruptions have occurred during the past 3500 years. A series of explosive eruptions during the 19th century were sometimes accompanied by pyroclastic flows. Fumarolic activity continues at the central and SW summit craters.
Information Contacts: E. Fernandez, R. Van der Laat, F. de Obaldia, T. Marino, V. Barboza, W. Jimenez, R. Saenz, E. Duarte, M. Martinez, E. Hernandez, and F. Vega, Observatorio Vulcanologico y Sismologico de Costa Rica, Universidad Nacional (OVSICORI-UNA), Apartado 86-3000, Heredia, Costa Rica.