Recently Published Bulletin Reports
Kadovar (Papua New Guinea) An ash plume and weak thermal anomaly during May 2023
San Miguel (El Salvador) Small gas-and-ash explosions during March and May 2023
Ebeko (Russia) Continued explosions, ash plumes, and ashfall during October 2022-May 2023
Home Reef (Tonga) Discolored plumes continued during November 2022-April 2023
Semisopochnoi (United States) Occasional explosions, ash deposits, and gas-and-steam plumes during December 2022-May 2023
Ambae (Vanuatu) New lava flow, ash plumes, and sulfur dioxide plumes during February-May 2023
Ibu (Indonesia) Daily ash explosions continue, along with thermal anomalies in the crater, October 2022-May 2023
Dukono (Indonesia) Continuing ash emissions, SO2 plumes, and thermal signals during October 2022-May 2023
Sabancaya (Peru) Explosions, gas-and-ash plumes, and thermal activity persist during November 2022-April 2023
Sheveluch (Russia) Significant explosions destroyed part of the lava-dome complex during April 2023
Bezymianny (Russia) Explosions, ash plumes, lava flows, and avalanches during November 2022-April 2023
Chikurachki (Russia) New explosive eruption during late January-early February 2023
Kadovar (Papua New Guinea) — June 2023  Cite this Report
Kadovar
Papua New Guinea
3.608°S, 144.588°E; summit elev. 365 m
All times are local (unless otherwise noted)
An ash plume and weak thermal anomaly during May 2023
Kadovar is a 2-km-wide island that is the emergent summit of a Bismarck Sea stratovolcano. It lies off the coast of New Guinea, about 25 km N of the mouth of the Sepik River. Prior to an eruption that began in 2018, a lava dome formed the high point of the volcano, filling an arcuate landslide scarp open to the S. Submarine debris-avalanche deposits occur to the S of the island. The current eruption began in January 2018 and has comprised lava effusion from vents at the summit and at the E coast; more recent activity has consisted of ash plumes, weak thermal activity, and gas-and-steam plumes (BGVN 48:02). This report covers activity during February through May 2023 using information from the Darwin Volcanic Ash Advisory Center (VAAC) and satellite data.
Activity during the reporting period was relatively low and mainly consisted of white gas-and-steam plumes that were visible in natural color satellite images on clear weather days (figure 67). According to a Darwin VAAC report, at 2040 on 6 May an ash plume rose to 4.6 km altitude and drifted W; by 2300 the plume had dissipated. MODIS satellite instruments using the MODVOLC thermal algorithm detected a single thermal hotspot on the SE side of the island on 7 May. Weak thermal activity was also detected in a satellite image on the E side of the island on 14 May, accompanied by a white gas-and-steam plume that drifted SE (figure 68).
Geologic Background. The 2-km-wide island of Kadovar is the emergent summit of a Bismarck Sea stratovolcano of Holocene age. It is part of the Schouten Islands, and lies off the coast of New Guinea, about 25 km N of the mouth of the Sepik River. Prior to an eruption that began in 2018, a lava dome formed the high point of the andesitic volcano, filling an arcuate landslide scarp open to the south; submarine debris-avalanche deposits occur in that direction. Thick lava flows with columnar jointing forms low cliffs along the coast. The youthful island lacks fringing or offshore reefs. A period of heightened thermal phenomena took place in 1976. An eruption began in January 2018 that included lava effusion from vents at the summit and at the E coast.
Information Contacts: Darwin Volcanic Ash Advisory Centre (VAAC), Bureau of Meteorology, Northern Territory Regional Office, PO Box 40050, Casuarina, NT 0811, Australia (URL: http://www.bom.gov.au/info/vaac/); Hawai'i Institute of Geophysics and Planetology (HIGP) - MODVOLC Thermal Alerts System, School of Ocean and Earth Science and Technology (SOEST), Univ. of Hawai'i, 2525 Correa Road, Honolulu, HI 96822, USA (URL: http://modis.higp.hawaii.edu/); Copernicus Browser, Copernicus Data Space Ecosystem, European Space Agency (URL: https://dataspace.copernicus.eu/browser/).
San Miguel (El Salvador) — June 2023 Cite this Report
San Miguel
El Salvador
13.434°N, 88.269°W; summit elev. 2130 m
All times are local (unless otherwise noted)
Small gas-and-ash explosions during March and May 2023
San Miguel in El Salvador is a broad, deep crater complex that has been frequently modified by eruptions recorded since the early 16th century and consists of the summit known locally as Chaparrastique. Flank eruptions have produced lava flows that extended to the N, NE, and SE during the 17-19th centuries. The most recent activity has consisted of minor ash eruptions from the summit crater. The current eruption period began in November 2022 and has been characterized by frequent phreatic explosions, gas-and-ash emissions, and sulfur dioxide plumes (BGVN 47:12). This report describes small gas-and-ash explosions during December 2022 through May 2023 based on special reports from the Ministero de Medio Ambiente y Recursos Naturales (MARN).
Activity has been relatively low since the last recorded explosions on 29 November 2022. Seismicity recorded by the San Miguel Volcano Station (VSM) located on the N flank at 1.7 km elevation had decreased by 7 December. Sulfur dioxide gas measurements taken with DOAS (Differential Optical Absorption Spectroscopy) mobile equipment were below typical previously recorded values: 300 tons per day (t/d). During December, small explosions were recorded by the seismic network and manifested as gas-and-steam emissions.
Gas-and-ash explosions in the crater occurred during January 2023, which were recorded by the seismic network. Sulfur dioxide values remained low, between 300-400 t/d through 10 March. At 0817 on 14 January a gas-and-ash emission was visible in webcam images, rising just above the crater rim. Some mornings during February, small gas-and-steam plumes were visible in the crater. On 7 March at 2252 MARN noted an increase in degassing from the central crater; gas emissions were constantly observed through the early morning hours on 8 March. During the early morning of 8 March through the afternoon on 9 March, 12 emissions were registered, some accompanied by ash. The last gas-and-ash emission was recorded at 1210 on 9 March; very fine ashfall was reported in El Tránsito (10 km S), La Morita (6 km W), and La Piedrita (3 km W). The smell of sulfur was reported in Piedra Azul (5 km SW). On 16 March MARN reported that gas-and-steam emissions decreased.
Low degassing and very low seismicity were reported during April; no explosions have been detected between 9 March and 27 May. The sulfur dioxide emissions remained between 350-400 t/d; during 13-20 April sulfur dioxide values fluctuated between 30-300 t/d. Activity remained low through most of May; on 23 May seismicity increased. An explosion was detected at 1647 on 27 May generated a gas-and-ash plume that rose 700 m high (figure 32); a decrease in seismicity and gas emissions followed. The DOAS station installed on the W flank recorded sulfur dioxide values that reached 400 t/d on 27 May; subsequent measurements showed a decrease to 268 t/d on 28 May and 100 t/d on 29 May.
Geologic Background. The symmetrical cone of San Miguel, one of the most active volcanoes in El Salvador, rises from near sea level to form one of the country's most prominent landmarks. A broad, deep, crater complex that has been frequently modified by eruptions recorded since the early 16th century caps the truncated unvegetated summit, also known locally as Chaparrastique. Flanks eruptions of the basaltic-andesitic volcano have produced many lava flows, including several during the 17th-19th centuries that extended to the N, NE, and SE. The SE-flank flows are the largest and form broad, sparsely vegetated lava fields crossed by highways and a railroad skirting the base of the volcano. Flank vent locations have migrated higher on the edifice during historical time, and the most recent activity has consisted of minor ash eruptions from the summit crater.
Information Contacts: Ministero de Medio Ambiente y Recursos Naturales (MARN), Km. 5½ Carretera a Nueva San Salvador, Avenida las Mercedes, San Salvador, El Salvador (URL: http://www.snet.gob.sv/ver/vulcanologia).
Ebeko
Russia
50.686°N, 156.014°E; summit elev. 1103 m
All times are local (unless otherwise noted)
Continued explosions, ash plumes, and ashfall during October 2022-May 2023
Ebeko, located on the N end of Paramushir Island in the Kuril Islands, consists of three summit craters along a SSW-NNE line at the northern end of a complex of five volcanic cones. Eruptions date back to the late 18th century and have been characterized as small-to-moderate explosions from the summit crater, accompanied by intense fumarolic activity. The current eruption period began in June 2022 and has recently consisted of frequent explosions, ash plumes, and thermal activity (BGVN 47:10). This report covers similar activity during October 2022 through May 2023, based on information from the Kamchatka Volcanic Eruptions Response Team (KVERT) and satellite data.
Activity during October consisted of explosive activity, ash plumes, and occasional thermal anomalies. Visual data by volcanologists from Severo-Kurilsk showed explosions producing ash clouds up to 2.1-3 km altitude which drifted E, N, NE, and SE during 1-8, 10, 16, and 18 October. KVERT issued several Volcano Observatory Notices for Aviation (VONA) on 7, 13-15, and 27 October 2022, stating that explosions generated ash plumes that rose to 2.3-4 km altitude and drifted 5 km E, NE, and SE. Ashfall was reported in Severo-Kurilsk (Paramushir Island, about 7 km E) on 7 and 13 October. Satellite data showed a thermal anomaly over the volcano on 15-16 October. Visual data showed ash plumes rising to 2.5-3.6 km altitude on 22, 25-29, and 31 October and moving NE due to constant explosions.
Similar activity continued during November, with explosions, ash plumes, and ashfall occurring. KVERT issued VONAs on 1-2, 4, 6-7, 9, 13, and 16 November that reported explosions and resulting ash plumes that rose to 1.7-3.6 km altitude and drifted 3-5 km SE, ESE, E, and NE. On 1 November ash plumes extended as far as 110 km SE. On 5, 8, 12, and 24-25 November explosions and ash plumes rose to 2-3.1 km altitude and drifted N and E. Ashfall was observed in Severo-Kurilsk on 7 and 16 November. A thermal anomaly was visible during 1-4, 16, and 20 November. Explosions during 26 November rose as high as 2.7 km altitude and drifted NE (figure 45).
Explosions and ash plumes continued to occur in December. During 1-2 and 4 December volcanologists from Severo-Kurilsk observed explosions that sent ash to 1.9-2.5 km altitude and drifted NE and SE (figure 46). VONAs were issued on 5, 9, and 16 December reporting that explosions generated ash plumes rising to 1.9 km, 2.6 km, and 2.4 km altitude and drifted 5 km SE, E, and NE, respectively. A thermal anomaly was visible in satellite imagery on 16 December. On 18 and 27-28 December explosions produced ash plumes that rose to 2.5 km altitude and drifted NE and SE. On 31 December an ash plume rose to 2 km altitude and drifted NE.
Explosions continued during January 2023, based on visual observations by volcanologists from Severo-Kurilsk. During 1-7 January explosions generated ash plumes that rose to 4 km altitude and drifted NE, E, W, and SE. According to VONAs issued by KVERT on 2, 4, 10, and 23 January, explosions produced ash plumes that rose to 2-4 km altitude and drifted 5 km N, NE, E, and ENE; the ash plume that rose to 4 km altitude occurred on 10 January (figure 47). Satellite data showed a thermal anomaly during 3-4, 10, 13, 16, 21, 22, and 31 January. KVERT reported that an ash cloud on 4 January moved 12 km NE. On 6 and 9-11 January explosions sent ash plumes to 4.5 km altitude and drifted W and ESE. On 13 January an ash plume rose to 3 km altitude and drifted SE. During 20-24 January ash plumes from explosions rose to 3.7 km altitude and drifted SE, N, and NE. On 21 January the ash plume drifted as far as 40 km NE. During 28-29 and 31 January and 1 February ash plumes rose to 4 km altitude and drifted NE.
During February, explosions, ash plumes, and ashfall were reported. During 1, 4-5 and 7-8 February explosions generated ash plumes that rose to 4.5 km altitude and drifted E and NE; ashfall was observed on 5 and 8 February. On 6 February an explosion produced an ash plume that rose to 3 km altitude and drifted 7 km E, causing ashfall in Severo-Kurilsk. A thermal anomaly was visible in satellite data on 8, 9, 13, and 21 February. Explosions on 9 and 12-13 February produced ash plumes that rose to 4 km altitude and drifted E and NE; the ash cloud on 12 February extended as far as 45 km E. On 22 February explosions sent ash to 3 km altitude that drifted E. During 24 and 26-27 February ash plumes rose to 4 km altitude and drifted E. On 28 February an explosion sent ash to 2.5-3 km altitude and drifted 5 km E; ashfall was observed in Severo-Kurilsk.
Activity continued during March; visual observations showed that explosions generated ash plumes that rose to 3.6 km altitude on 3, 5-7, and 9-12 March and drifted E, NE, and NW. Thermal anomalies were visible on 10, 13, and 29-30 March in satellite imagery. On 18, 21-23, 26, and 29-30 March explosions produced ash plumes that rose to 2.8 km altitude and drifted NE and E; the ash plumes during 22-23 March extended up to 76 km E. A VONA issued on 21 March reported an explosion that produced an ash plume that rose to 2.8 km altitude and drifted 5 km E. Another VONA issued on 23 March reported that satellite data showed an ash plume rising to 3 km altitude and drifted 14 km E.
Explosions during April continued to generate ash plumes. On 1 and 4 April an ash plume rose to 2.8-3.5 km altitude and drifted SE and NE. A thermal anomaly was visible in satellite imagery during 1-6 April. Satellite data showed ash plumes and clouds rising to 2-3 km altitude and drifting up to 12 km SW and E on 3 and 6 April (figure 48). KVERT issued VONAs on 3, 5, 14, 16 April describing explosions that produced ash plumes rising to 3 km, 3.5 km, 3.5 km, and 3 km altitude and drifting 5 km S, 5 km NE and SE, 72 km NNE, and 5 km NE, respectively. According to satellite data, the resulting ash cloud from the explosion on 14 April was 25 x 7 km in size and drifted 72-104 km NNE during 14-15 April. According to visual data by volcanologists from Severo-Kurilsk explosions sent ash up to 3.5 km altitude that drifted NE and E during 15-16, 22, 25-26, and 29 April.
The explosive eruption continued during May. Explosions during 3-4, 6-7, and 9-10 May generated ash plumes that rose to 4 km altitude and drifted SW and E. Satellite data showed a thermal anomaly on 3, 9, 13-14, and 24 May. During 12-16, 23-25, and 27-28 May ash plumes rose to 3.5 km altitude and drifted in different directions due to explosions. Two VONA notices were issued on 16 and 25 May, describing explosions that generated ash plumes rising to 3 km and 3.5 km altitude, respectively and extending 5 km E. The ash cloud on 25 May drifted 75 km SE.
Thermal activity in the summit crater, occasionally accompanied by ash plumes and ash deposits on the SE and E flanks due to frequent explosions, were visible in infrared and true color satellite images (figure 49).
Geologic Background. The flat-topped summit of the central cone of Ebeko volcano, one of the most active in the Kuril Islands, occupies the northern end of Paramushir Island. Three summit craters located along a SSW-NNE line form Ebeko volcano proper, at the northern end of a complex of five volcanic cones. Blocky lava flows extend west from Ebeko and SE from the neighboring Nezametnyi cone. The eastern part of the southern crater contains strong solfataras and a large boiling spring. The central crater is filled by a lake about 20 m deep whose shores are lined with steaming solfataras; the northern crater lies across a narrow, low barrier from the central crater and contains a small, cold crescentic lake. Historical activity, recorded since the late-18th century, has been restricted to small-to-moderate explosive eruptions from the summit craters. Intense fumarolic activity occurs in the summit craters, on the outer flanks of the cone, and in lateral explosion craters.
Information Contacts: Kamchatka Volcanic Eruptions Response Team (KVERT), Far Eastern Branch, Russian Academy of Sciences, 9 Piip Blvd., Petropavlovsk-Kamchatsky, 683006, Russia (URL: http://www.kscnet.ru/ivs/kvert/); MIROVA (Middle InfraRed Observation of Volcanic Activity), a collaborative project between the Universities of Turin and Florence (Italy) supported by the Centre for Volcanic Risk of the Italian Civil Protection Department (URL: http://www.mirovaweb.it/); Copernicus Browser, Copernicus Data Space Ecosystem, European Space Agency (URL: https://dataspace.copernicus.eu/browser/).
Home Reef
Tonga
18.992°S, 174.775°W; summit elev. -10 m
All times are local (unless otherwise noted)
Discolored plumes continued during November 2022-April 2023
Home Reef is a submarine volcano located in the central Tonga islands between Lateiki (Metis Shoal) and Late Island. The first recorded eruption occurred in the mid-19th century, when an ephemeral island formed. An eruption in 1984 produced a 12-km-high eruption plume, a large volume of floating pumice, and an ephemeral island 500 x 1,500 m wide, with cliffs 30-50 m high that enclosed a water-filled crater. Another island-forming eruption in 2006 produced widespread pumice rafts that drifted as far as Australia; by 2008 the island had eroded below sea level. The previous eruption occurred during October 2022 and was characterized by a new island-forming eruption, lava effusion, ash plumes, discolored water, and gas-and-steam plumes (BGVN 47:11). This report covers discolored water plumes during November 2022 through April 2023 using satellite data.
Discolored plumes continued during the reporting period and were observed in true color satellite images on clear weather days. Satellite images show light green-yellow discolored water extending W on 8 and 28 November 2022 (figure 31), and SW on 18 November. Light green-yellow plumes extended W on 3 December, S on 13 December, SW on 18 December, and W and S on 23 December (figure 31). On 12 January 2023 discolored green-yellow plumes extended to the NE, E, SE, and N. The plume moved SE on 17 January and NW on 22 January. Faint discolored water in February was visible moving NE on 1 February. A discolored plume extended NW on 8 and 28 March and NW on 13 March (figure 31). During April, clear weather showed green-blue discolored plumes moving S on 2 April, W on 7 April, and NE and S on 12 April. A strong green-yellow discolored plume extended E and NE on 22 April for several kilometers (figure 31).
Geologic Background. Home Reef, a submarine volcano midway between Metis Shoal and Late Island in the central Tonga islands, was first reported active in the mid-19th century, when an ephemeral island formed. An eruption in 1984 produced a 12-km-high eruption plume, large amounts of floating pumice, and an ephemeral 500 x 1,500 m island, with cliffs 30-50 m high that enclosed a water-filled crater. In 2006 an island-forming eruption produced widespread dacitic pumice rafts that drifted as far as Australia. Another island was built during a September-October 2022 eruption.
Information Contacts: Copernicus Browser, Copernicus Data Space Ecosystem, European Space Agency (URL: https://dataspace.copernicus.eu/browser/).
Semisopochnoi (United States) — June 2023 Cite this Report
Semisopochnoi
United States
51.93°N, 179.58°E; summit elev. 1221 m
All times are local (unless otherwise noted)
Occasional explosions, ash deposits, and gas-and-steam plumes during December 2022-May 2023
Semisopochnoi is located in the western Aleutians, is 20-km-wide at sea level, and contains an 8-km-wide caldera. The three-peaked Mount Young (formerly Cerberus) was constructed within the caldera during the Holocene. Each of these peaks contains a summit crater; the lava flows on the N flank appear younger than those on the S side. The current eruption period began in early February 2021 and has more recently consisted of intermittent explosions and ash emissions (BGVN 47:12). This report updates activity during December 2022 through May 2023 using daily, weekly, and special reports from the Alaska Volcano Observatory (AVO). AVO monitors the volcano using local seismic and infrasound sensors, satellite data, web cameras, and remote infrasound and lightning networks.
Activity during most of December 2022 was relatively quiet; according to AVO no eruptive or explosive activity was observed since 7 November 2022. Intermittent tremor and occasional small earthquakes were observed in geophysical data. Continuous gas-and-steam emissions were observed from the N crater of Mount Young in webcam images on clear weather days (figure 25). On 24 December, there was a slight increase in earthquake activity and several small possible explosion signals were detected in infrasound data. Eruptive activity resumed on 27 December at the N crater of Mount Young; AVO issued a Volcano Activity Notice (VAN) that reported minor ash deposits on the flanks of Mount Young that extended as far as 1 km from the vent, according to webcam images taken during 27-28 December (figure 26). No ash plumes were observed in webcam or satellite imagery, but a persistent gas-and-steam plume that might have contained some ash rose to 1.5 km altitude. As a result, AVO raised the Aviation Color Code (ACC) to Orange (the second highest level on a four-color scale) and the Volcano Alert Level (VAL) to Watch (the second highest level on a four-level scale). Possible explosions were detected during 21 December 2022 through 1 January 2023 and seismic tremor was recorded during 30-31 December.
During January 2023 eruptive activity continued at the active N crater of Mount Young. Minor ash deposits were observed on the flanks, extending about 2 km SSW, based on webcam images from 1 and 3 January. A possible explosion occurred during 1-2 January based on elevated seismicity recorded on local seismometers and an infrasound signal recorded minutes later by an array at Adak. Though no ash plumes were observed in webcam or satellite imagery, a persistent gas-and-steam plume rose to 1.5 km altitude that might have carried minor traces of ash. Ash deposits were accompanied by periods of elevated seismicity and infrasound signals from the local geophysical network, which AVO reported were likely due to weak explosive activity. Low-level explosive activity was also detected during 2-3 January, with minor gas-and-steam emissions and a new ash deposit that was visible in webcam images. Low-level explosive activity was detected in geophysical data during 4-5 January, with elevated seismicity and infrasound signals observed on local stations. Volcanic tremor was detected during 7-9 January and very weak explosive activity was detected in seismic and infrasound data on 9 January. Weak seismic and infrasound signals were recorded on 17 January, which indicated minor explosive activity, but no ash emissions were observed in clear webcam images; a gas-and-steam plume continued to rise to 1.5 km altitude. During 29-30 January, ash deposits near the summit were observed on fresh snow, according to webcam images.
The active N cone at Mount Young continued to produce a gas-and-steam plume during February, but no ash emissions or explosive events were detected. Seismicity remained elevated with faint tremor during early February. Gas-and-steam emissions from the N crater were observed in clear webcam images on 11-13 and 16 February; no explosive activity was detected in seismic, infrasound, or satellite data. Seismicity has also decreased, with no significant seismic tremor observed since 25 January. Therefore, the ACC was lowered to Yellow (the second lowest level on a four-color scale) and the VAL was lowered to Advisory (the second lowest level on a four-color scale) on 22 February.
Gas-and-steam emissions persisted during March from the N cone of Mount Young, based on clear webcam images. A few brief episodes of weak tremor were detected in seismic data, although seismicity decreased over the month. A gas-and-steam plume detected in satellite data extended 150 km on 18 March. Low-level ash emissions from the N cone at Mount Young were observed in several webcam images during 18-19 March, in addition to small explosions and volcanic tremor. The ACC was raised to Orange and the VAL increased to Watch on 19 March. A small explosion was detected in seismic and infrasound data on 21 March.
Low-level unrest continued during April, although cloudy weather often obscured views of the summit; periods of seismic tremor and local earthquakes were recorded. During 3-4 April a gas-and-steam plume was visible traveling more than 200 km overnight; no ash was evident in the plume, according to AVO. A gas-and-steam plume was observed during 4-6 April that extended 400 km but did not seem to contain ash. Small explosions were detected in seismic and infrasound data on 5 April. Occasional clear webcam images showed continuing gas-and-steam emissions rose from Mount Young, but no ash deposits were observed on the snow. On 19 April small explosions and tremor were detected in seismic and infrasound data. A period of seismic tremor was detected during 22-25 April, with possible weak explosions on 25 April. Ash deposits were visible near the crater rim, but it was unclear if these deposits were recent or due to older deposits.
Occasional small earthquakes were recorded during May, but there were no signs of explosive activity seen in geophysical data. Gas-and-steam emissions continued from the N crater of Mount Young, based on webcam images, and seismicity remained slightly elevated. A new, light ash deposit was visible during the morning of 5 May on fresh snow on the NW flank of Mount Young. During 10 May periods of volcanic tremor were observed. The ACC was lowered to Yellow and the VAL to Advisory on 17 May due to no additional evidence of activity.
Geologic Background. Semisopochnoi, the largest subaerial volcano of the western Aleutians, is 20 km wide at sea level and contains an 8-km-wide caldera. It formed as a result of collapse of a low-angle, dominantly basaltic volcano following the eruption of a large volume of dacitic pumice. The high point of the island is Anvil Peak, a double-peaked late-Pleistocene cone that forms much of the island's northern part. The three-peaked Mount Cerberus (renamed Mount Young in 2023) was constructed within the caldera during the Holocene. Each of the peaks contains a summit crater; lava flows on the N flank appear younger than those on the south side. Other post-caldera volcanoes include the symmetrical Sugarloaf Peak SSE of the caldera and Lakeshore Cone, a small cinder cone at the edge of Fenner Lake in the NE part of the caldera. Most documented eruptions have originated from Young, although Coats (1950) considered that both Sugarloaf and Lakeshore Cone could have been recently active.
Information Contacts: Alaska Volcano Observatory (AVO), a cooperative program of a) U.S. Geological Survey, 4200 University Drive, Anchorage, AK 99508-4667 USA (URL: https://avo.alaska.edu/), b) Geophysical Institute, University of Alaska, PO Box 757320, Fairbanks, AK 99775-7320, USA, and c) Alaska Division of Geological & Geophysical Surveys, 794 University Ave., Suite 200, Fairbanks, AK 99709, USA (URL: http://dggs.alaska.gov/).
Ambae
Vanuatu
15.389°S, 167.835°E; summit elev. 1496 m
All times are local (unless otherwise noted)
New lava flow, ash plumes, and sulfur dioxide plumes during February-May 2023
Ambae, also known as Aoba, is a large basaltic shield volcano in Vanuatu. A broad pyroclastic cone containing three crater lakes (Manaro Ngoru, Voui, and Manaro Lakua) is located at the summit within the youngest of at least two nested calderas. Periodic phreatic and pyroclastic explosions have been reported since the 16th century. A large eruption more than 400 years ago resulted in a volcanic cone within the summit crater that is now filled by Lake Voui; the similarly sized Lake Manaro fills the western third of the caldera. The previous eruption ended in August 2022 that was characterized by gas-and-steam and ash emissions and explosions of wet tephra (BGVN 47:10). This report covers a new eruption during February through May 2023 that consisted of a new lava flow, ash plumes, and sulfur dioxide emissions, using information from the Vanuatu Meteorology and Geo-Hazards Department (VMGD) and satellite data.
During the reporting period, the Alert Level remained at a 2 (on a scale of 0-5), which has been in place since December 2021. Activity during October 2022 through March 2023 remained relatively low and mostly consisted of gas-and-steam emissions in Lake Voui. VMGD reported that at 1300 on 15 November a satellite image captured a strong amount of sulfur dioxide rising above the volcano (figure 99), and that seismicity slightly increased. The southern and northern part of the island reported a strong sulfur dioxide smell and heard explosions. On 20 February 2023 a gas-and-ash plume rose 1.3 km above the summit and drifted SSW, according to a webcam image (figure 100). Gas-and-steam and possibly ash emissions continued on 23 February and volcanic earthquakes were recorded by the seismic network.
During April, volcanic earthquakes and gas-and-steam and ash emissions were reported from the cone in Lake Voui. VMGD reported that activity increased during 5-7 April; high gas-and-steam and ash plumes were visible, accompanied by nighttime incandescence. According to a Wellington VAAC report, a low-level ash plume rose as high as 2.5 km above the summit and drifted W and SW on 5 April, based on satellite imagery. Reports in Saratamata stated that a dark ash plume drifted to the WSW, but no loud explosion was heard. Webcam images from 2100 showed incandescence above the crater and reflected in the clouds. According to an aerial survey, field observations, and satellite data, water was no longer present in the lake. A lava flow was reported effusing from the vent and traveling N into the dry Lake Voui, which lasted three days. The next morning at 0745 on 6 April a gas-and-steam and ash plume rose 5.4 km above the summit and drifted ESE, based on information from VMGD (figure 101). The Wellington VAAC also reported that light ashfall was observed on the island. Intermittent gas-and-steam and ash emissions were visible on 7 April, some of which rose to an estimated 3 km above the summit and drifted E. Webcam images during 0107-0730 on 7 April showed continuing ash emissions. A gas-and-steam and ash plume rose 695 m above the summit crater at 0730 on 19 April and drifted ESE, based on a webcam image (figure 102).
According to visual and infrared satellite data, water was visible in Lake Voui as late as 24 March 2023 (figure 103). The vent in the caldera showed a gas-and-steam plume drifted SE. On 3 April thermal activity was first detected, accompanied by a gas-and-ash plume that drifted W (figure 103). The lava flow moved N within the dry lake and was shown cooling by 8 April. By 23 April much of the water in the lake had returned. Occasional sulfur dioxide plumes were detected by the TROPOMI instrument on the Sentinel-5P satellite that exceeded 2 Dobson Units (DU) and drifted in different directions (figure 104).
Geologic Background. The island of Ambae, also known as Aoba, is a massive 2,500 km3 basaltic shield that is the most voluminous volcano of the New Hebrides archipelago. A pronounced NE-SW-trending rift zone with numerous scoria cones gives the 16 x 38 km island an elongated form. A broad pyroclastic cone containing three crater lakes (Manaro Ngoru, Voui, and Manaro Lakua) is located at the summit within the youngest of at least two nested calderas, the largest of which is 6 km in diameter. That large central edifice is also called Manaro Voui or Lombenben volcano. Post-caldera explosive eruptions formed the summit craters about 360 years ago. A tuff cone was constructed within Lake Voui (or Vui) about 60 years later. The latest known flank eruption, about 300 years ago, destroyed the population of the Nduindui area near the western coast.
Information Contacts: Geo-Hazards Division, Vanuatu Meteorology and Geo-Hazards Department (VMGD), Ministry of Climate Change Adaptation, Meteorology, Geo-Hazards, Energy, Environment and Disaster Management, Private Mail Bag 9054, Lini Highway, Port Vila, Vanuatu (URL: http://www.vmgd.gov.vu/, https://www.facebook.com/VanuatuGeohazardsObservatory/); Wellington Volcanic Ash Advisory Centre (VAAC), Meteorological Service of New Zealand Ltd (MetService), PO Box 722, Wellington, New Zealand (URL: http://www.metservice.com/vaac/, http://www.ssd.noaa.gov/VAAC/OTH/NZ/messages.html); MIROVA (Middle InfraRed Observation of Volcanic Activity), a collaborative project between the Universities of Turin and Florence (Italy) supported by the Centre for Volcanic Risk of the Italian Civil Protection Department (URL: http://www.mirovaweb.it/); Global Sulfur Dioxide Monitoring Page, Atmospheric Chemistry and Dynamics Laboratory, NASA Goddard Space Flight Center (NASA/GSFC), 8800 Greenbelt Road, Goddard, Maryland, USA (URL: https://so2.gsfc.nasa.gov/); Copernicus Browser, Copernicus Data Space Ecosystem, European Space Agency (URL: https://dataspace.copernicus.eu/browser/).
Ibu
Indonesia
1.488°N, 127.63°E; summit elev. 1325 m
All times are local (unless otherwise noted)
Daily ash explosions continue, along with thermal anomalies in the crater, October 2022-May 2023
Persistent eruptive activity since April 2008 at Ibu, a stratovolcano on Indonesian’s Halmahera Island, has consisted of daily explosive ash emissions and plumes, along with observations of thermal anomalies (BGVN 47:04). The current eruption continued during October 2022-May 2023, described below, based on advisories issued by the Pusat Vulkanologi dan Mitigasi Bencana Geologi (PVMBG, also known as Indonesian Center for Volcanology and Geological Hazard Mitigation, CVGHM), daily reports by MAGMA Indonesia (a PVMBG platform), and the Darwin Volcanic Ash Advisory Centre (VAAC), and various satellite data. The Alert Level during the reporting period remained at 2 (on a scale of 1-4), except raised briefly to 3 on 27 May, and the public was warned to stay at least 2 km away from the active crater and 3.5 km away on the N side of the volcano.
According to MAGMA Indonesia, during October 2022-May 2023, daily gray-and-white ash plumes of variable densities rose 200-1,000 m above the summit and drifted in multiple directions. On 30 October and 11 November, plumes rose a maximum of 2 km and 1.5 km above the summit, respectively (figures 42 and 43). According to the Darwin VAAC, discrete ash emissions on 13 November rose to 2.1 km altitude, or 800 m above the summit, and drifted W, and multiple ash emissions on 15 November rose 1.4 km above the summit and drifted NE. Occasional larger ash explosions through May 2023 prompted PVMBG to issue Volcano Observatory Notice for Aviation (VONA) alerts (table 6); the Aviation Color Code remained at Orange throughout this period.
Table 6. Volcano Observatory Notice for Aviation (VONA) ash plume alerts for Ibu issued by PVMBG during October 2022-May 2023. Maximum height above the summit was estimated by a ground observer. VONAs in January-May 2023 all described the ash plumes as dense.
| Date |
Time (local) |
Max height above summit |
Direction |
| 17 Oct 2022 |
0858 |
800 m |
SW |
| 18 Oct 2022 |
1425 |
800 m |
S |
| 19 Oct 2022 |
2017 |
600 m |
SW |
| 21 Oct 2022 |
0916 |
800 m |
NW |
| 16 Jan 2023 |
1959 |
600 m |
NE |
| 22 Jan 2023 |
0942 |
1,000 m |
E |
| 29 Jan 2023 |
2138 |
1,000 m |
E |
| 10 May 2023 |
0940 |
800 m |
NW |
| 10 May 2023 |
2035 |
600 m |
E |
| 21 May 2023 |
2021 |
600 m |
W |
| 21 May 2023 |
2140 |
1,000 m |
W |
| 29 May 2023 |
1342 |
800 m |
N |
| 31 May 2023 |
1011 |
1,000 m |
SW |
Sentinel-2 L1C satellite images throughout the reporting period show two, sometimes three persistent thermal anomalies in the summit crater, with the most prominent hotspot from the top of a cone within the crater. Clear views were more common during March-April 2023, when a vent and lava flows on the NE flank of the intra-crater cone could be distinguished (figure 44). White-to-grayish emissions were also observed during brief periods when weather clouds allowed clear views.
The MIROVA space-based volcano hotspot detection system recorded almost daily thermal anomalies throughout the reporting period, though cloud cover often interfered with detections. Data from imaging spectroradiometers aboard NASA’s Aqua and Terra satellites and processed using the MODVOLC algorithm (MODIS-MODVOLC) recorded hotspots on one day during October 2022 and December 2022, two days in April 2023, three days in November 2022 and May 2023, and four days in March 2023.
Geologic Background. The truncated summit of Gunung Ibu stratovolcano along the NW coast of Halmahera Island has large nested summit craters. The inner crater, 1 km wide and 400 m deep, has contained several small crater lakes. The 1.2-km-wide outer crater is breached on the N, creating a steep-walled valley. A large cone grew ENE of the summit, and a smaller one to the WSW has fed a lava flow down the W flank. A group of maars is located below the N and W flanks. The first observed and recorded eruption was a small explosion from the summit crater in 1911. Eruptive activity began again in December 1998, producing a lava dome that eventually covered much of the floor of the inner summit crater along with ongoing explosive ash emissions.
Information Contacts: Pusat Vulkanologi dan Mitigasi Bencana Geologi (PVMBG, also known as Indonesian Center for Volcanology and Geological Hazard Mitigation, CVGHM), Jalan Diponegoro 57, Bandung 40122, Indonesia (URL: http://www.vsi.esdm.go.id/); MAGMA Indonesia (Multiplatform Application for Geohazard Mitigation and Assessment in Indonesia), Kementerian Energi dan Sumber Daya Mineral (URL: https://magma.esdm.go.id/v1); Copernicus Browser, Copernicus Data Space Ecosystem, European Space Agency (URL: https://dataspace.copernicus.eu/browser/); MIROVA (Middle InfraRed Observation of Volcanic Activity), a collaborative project between the Universities of Turin and Florence (Italy) supported by the Centre for Volcanic Risk of the Italian Civil Protection Department (URL: http://www.mirovaweb.it/); Hawai'i Institute of Geophysics and Planetology (HIGP) - MODVOLC Thermal Alerts System, School of Ocean and Earth Science and Technology (SOEST), Univ. of Hawai'i, 2525 Correa Road, Honolulu, HI 96822, USA (URL: http://modis.higp.hawaii.edu/).
Dukono
Indonesia
1.6992°N, 127.8783°E; summit elev. 1273 m
All times are local (unless otherwise noted)
Continuing ash emissions, SO2 plumes, and thermal signals during October 2022-May 2023
Dukono, a remote volcano on Indonesia’s Halmahera Island, has been erupting continuously since 1933, with frequent ash explosions and sulfur dioxide plumes (BGVN 46:11, 47:10). This activity continued during October 2022 through May 2023, based on reports from the Pusat Vulkanologi dan Mitigasi Bencana Geologi (PVMBG; also known as Indonesian Center for Volcanology and Geological Hazard Mitigation, CVGHM), the Darwin Volcanic Ash Advisory Centre (VAAC), and satellite data. During this period, the Alert Level remained at 2 (on a scale of 1-4) and the public was warned to remain outside of the 2-km exclusion zone. The highest reported plume of the period reached 9.4 km above the summit on 14 November 2022.
According to MAGMA Indonesia (a platform developed by PVMBG), white, gray, or dark plumes of variable densities were observed almost every day during the reporting period, except when fog obscured the volcano (figure 33). Plumes generally rose 25-450 m above the summit, but rose as high as 700-800 m on several days, somewhat lower than the maximum heights reached earlier in 2022 when plumes reached as high as 1 km. However, the Darwin VAAC reported that on 14 November 2022, a discrete ash plume rose 9.4 km above the summit (10.7 km altitude), accompanied by a strong hotspot and a sulfur dioxide signal observed in satellite imagery; a continuous ash plume that day and through the 15th rose to 2.1-2.4 km altitude and drifted NE.
Sentinel-2 images were obscured by weather clouds almost every viewing day during the reporting period. However, the few reasonably clear images showed a hotspot and white or gray emissions and plumes. Strong SO2 plumes from Dukono were present on many days during October 2022-May 2023, as detected using the TROPOMI instrument on the Sentinel-5P satellite (figure 34).
Geologic Background. Reports from this remote volcano in northernmost Halmahera are rare, but Dukono has been one of Indonesia's most active volcanoes. More-or-less continuous explosive eruptions, sometimes accompanied by lava flows, have occurred since 1933. During a major eruption in 1550 CE, a lava flow filled in the strait between Halmahera and the N-flank Gunung Mamuya cone. This complex volcano presents a broad, low profile with multiple summit peaks and overlapping craters. Malupang Wariang, 1 km SW of the summit crater complex, contains a 700 x 570 m crater that has also been active during historical time.
Information Contacts: Pusat Vulkanologi dan Mitigasi Bencana Geologi (PVMBG, also known as Indonesian Center for Volcanology and Geological Hazard Mitigation, CVGHM), Jalan Diponegoro 57, Bandung 40122, Indonesia (URL: http://www.vsi.esdm.go.id/); MAGMA Indonesia (Multiplatform Application for Geohazard Mitigation and Assessment in Indonesia), Kementerian Energi dan Sumber Daya Mineral (URL: https://magma.esdm.go.id/v1); Darwin Volcanic Ash Advisory Centre (VAAC), Bureau of Meteorology, Northern Territory Regional Office, PO Box 40050, Casuarina, NT 0811, Australia (URL: http://www.bom.gov.au/info/vaac/); NASA Global Sulfur Dioxide Monitoring Page, Atmospheric Chemistry and Dynamics Laboratory, NASA Goddard Space Flight Center (NASA/GSFC), 8800 Greenbelt Road, Goddard, Maryland, USA (URL: https://so2.gsfc.nasa.gov/); Sentinel Hub Playground (URL: https://www.sentinel-hub.com/explore/sentinel-playground).
Sabancaya
Peru
15.787°S, 71.857°W; summit elev. 5960 m
All times are local (unless otherwise noted)
Explosions, gas-and-ash plumes, and thermal activity persist during November 2022-April 2023
Sabancaya is located in Peru, NE of Ampato and SE of Hualca Hualca. Eruptions date back to 1750 and have been characterized by explosions, phreatic activity, ash plumes, and ashfall. The current eruption period began in November 2016 and has more recently consisted of daily explosions, gas-and-ash plumes, and thermal activity (BGVN 47:11). This report updates activity during November 2022 through April 2023 using information from Instituto Geophysico del Peru (IGP) that use weekly activity reports and various satellite data.
Intermittent low-to-moderate power thermal anomalies were reported by the MIROVA project during November 2022 through April 2023 (figure 119). There were few short gaps in thermal activity during mid-December 2022, late December-to-early January 2023, late January to mid-February, and late February. According to data recorded by the MODVOLC thermal algorithm, there were a total of eight thermal hotspots: three in November 2022, three in February 2023, one in March, and one in April. On clear weather days, some of this thermal anomaly was visible in infrared satellite imagery showing the active lava dome in the summit crater (figure 120). Almost daily moderate-to-strong sulfur dioxide plumes were recorded during the reporting period by the TROPOMI instrument on the Sentinel-5P satellite (figure 121). Many of these plumes exceeded 2 Dobson Units (DU) and drifted in multiple directions.
IGP reported that moderate activity during November and December 2022 continued; during November, an average number of explosions were reported each week: 30, 33, 36, and 35, and during December, it was 32, 40, 47, 52, and 67. Gas-and-ash plumes in November rose 3-3.5 km above the summit and drifted E, NE, SE, S, N, W, and SW. During December the gas-and-ash plumes rose 2-4 km above the summit and drifted in different directions. There were 1,259 volcanic earthquakes recorded during November and 1,693 during December. Seismicity also included volcano-tectonic-type events that indicate rock fracturing events. Slight inflation was observed in the N part of the volcano near Hualca Hualca (4 km N). Thermal activity was frequently reported in the crater at the active lava dome (figure 120).
Explosive activity continued during January and February 2023. The average number of explosions were reported each week during January (51, 50, 60, and 59) and February (43, 54, 51, and 50). Gas-and-ash plumes rose 1.6-2.9 km above the summit and drifted NW, SW, and W during January and rose 1.4-2.8 above the summit and drifted W, SW, E, SE, N, S, NW, and NE during February. IGP also detected 1,881 volcanic earthquakes during January and 1,661 during February. VT-type earthquakes were also reported. Minor inflation persisted near Hualca Hualca. Satellite imagery showed continuous thermal activity in the crater at the lava dome (figure 120).
During March, the average number of explosions each week was 46, 48, 31, 35, and 22 and during April, it was 29, 41, 31, and 27. Accompanying gas-and-ash plumes rose 1.7-2.6 km above the summit crater and drifted W, SW, NW, S, and SE during March. According to a Buenos Aires Volcano Ash Advisory Center (VAAC) notice, on 22 March at 1800 through 23 March an ash plume rose to 7 km altitude and drifted NW. By 0430 an ash plume rose to 7.6 km altitude and drifted W. On 24 and 26 March continuous ash emissions rose to 7.3 km altitude and drifted SW and on 28 March ash emissions rose to 7.6 km altitude. During April, gas-and-ash plumes rose 1.6-2.5 km above the summit and drifted W, SW, S, NW, NE, and E. Frequent volcanic earthquakes were recorded, with 1,828 in March and 1,077 in April, in addition to VT-type events. Thermal activity continued to be reported in the summit crater at the lava dome (figure 120).
Geologic Background. Sabancaya, located in the saddle NE of Ampato and SE of Hualca Hualca volcanoes, is the youngest of these volcanic centers and the only one to have erupted in historical time. The oldest of the three, Nevado Hualca Hualca, is of probable late-Pliocene to early Pleistocene age. The name Sabancaya (meaning "tongue of fire" in the Quechua language) first appeared in records in 1595 CE, suggesting activity prior to that date. Holocene activity has consisted of Plinian eruptions followed by emission of voluminous andesitic and dacitic lava flows, which form an extensive apron around the volcano on all sides but the south. Records of historical eruptions date back to 1750.
Information Contacts: Instituto Geofisico del Peru (IGP), Centro Vulcanológico Nacional (CENVUL), Calle Badajoz N° 169 Urb. Mayorazgo IV Etapa, Ate, Lima 15012, Perú (URL: https://www.igp.gob.pe/servicios/centro-vulcanologico-nacional/inicio); Buenos Aires Volcanic Ash Advisory Center (VAAC), Servicio Meteorológico Nacional-Fuerza Aérea Argentina, 25 de mayo 658, Buenos Aires, Argentina (URL: http://www.smn.gov.ar/vaac/buenosaires/inicio.php); MIROVA (Middle InfraRed Observation of Volcanic Activity), a collaborative project between the Universities of Turin and Florence (Italy) supported by the Centre for Volcanic Risk of the Italian Civil Protection Department (URL: http://www.mirovaweb.it/); Hawai'i Institute of Geophysics and Planetology (HIGP) - MODVOLC Thermal Alerts System, School of Ocean and Earth Science and Technology (SOEST), Univ. of Hawai'i, 2525 Correa Road, Honolulu, HI 96822, USA (URL: http://modis.higp.hawaii.edu/); NASA Global Sulfur Dioxide Monitoring Page, Atmospheric Chemistry and Dynamics Laboratory, NASA Goddard Space Flight Center (NASA/GSFC), 8800 Greenbelt Road, Goddard MD 20771, USA (URL: https://so2.gsfc.nasa.gov/); Copernicus Browser, Copernicus Data Space Ecosystem, European Space Agency (URL: https://dataspace.copernicus.eu/browser/).
Sheveluch
Russia
56.653°N, 161.36°E; summit elev. 3283 m
All times are local (unless otherwise noted)
Significant explosions destroyed part of the lava-dome complex during April 2023
Sheveluch (also spelled Shiveluch) in Kamchatka, has had at least 60 large eruptions during the last 10,000 years. The summit is truncated by a broad 9-km-wide caldera that is breached to the S, and many lava domes occur on the outer flanks. The lava dome complex was constructed within the large open caldera. Frequent collapses of the dome complex have produced debris avalanches; the resulting deposits cover much of the caldera floor. A major south-flank collapse during a 1964 Plinian explosion produced a scarp in which a “Young Sheveluch” dome began to form in 1980. Repeated episodes of dome formation and destruction since then have produced major and minor ash plumes, pyroclastic flows, block-and-ash flows, and “whaleback domes” of spine-like extrusions in 1993 and 2020 (BGVN 45:11). The current eruption period began in August 1999 and has more recently consisted of lava dome growth, explosions, ash plumes, and avalanches (BGVN 48:01). This report covers a significant explosive eruption during early-to-mid-April 2023 that generated a 20 km altitude ash plume, produced a strong sulfur dioxide plume, and destroyed part of the lava-dome complex; activity described during January through April 2023 use information primarily from the Kamchatka Volcanic Eruptions Response Team (KVERT) and various satellite data.
Satellite data. Activity during the majority of this reporting period was characterized by continued lava dome growth, strong fumarole activity, explosions, and hot avalanches. According to the MODVOLC Thermal Alerts System, 140 hotspots were detected through the reporting period, with 33 recorded in January 2023, 29 in February, 44 in March, and 34 in April. Frequent strong thermal activity was recorded during January 2023 through April, according to the MIROVA (Middle InfraRed Observation of Volcanic Activity) graph and resulted from the continuously growing lava dome (figure 94). A slightly stronger pulse in thermal activity was detected in early-to-mid-April, which represented the significant eruption that destroyed part of the lava-dome complex. Thermal anomalies were also visible in infrared satellite imagery at the summit crater (figure 95).
During January 2023 KVERT reported continued growth of the lava dome, accompanied by strong fumarolic activity, incandescence from the lava dome, explosions, ash plumes, and avalanches. Satellite data showed a daily thermal anomaly over the volcano. Video data showed ash plumes associated with collapses at the dome that generated avalanches that in turn produced ash plumes rising to 3.5 km altitude and drifting 40 km W on 4 January and rising to 7-7.5 km altitude and drifting 15 km SW on 5 January. A gas-and-steam plume containing some ash that was associated with avalanches rose to 5-6 km altitude and extended 52-92 km W on 7 January. Explosions that same day produced ash plumes that rose to 7-7.5 km altitude and drifted 10 km W. According to a Volcano Observatory Notice for Aviation (VONA) issued at 1344 on 19 January, explosions produced an ash cloud that was 15 x 25 km in size and rose to 9.6-10 km altitude, drifting 21-25 km W; as a result, the Aviation Color Code (ACC) was raised to Red (the highest level on a four-color scale). Another VONA issued at 1635 reported that no more ash plumes were observed, and the ACC was lowered to Orange (the second highest level on a four-color scale). On 22 January an ash plume from collapses and avalanches rose to 5 km altitude and drifted 25 km NE and SW; ash plumes associated with collapses extended 70 km NE on 27 and 31 January.
Lava dome growth, fumarolic activity, dome incandescence, and occasional explosions and avalanches continued during February and March. A daily thermal anomaly was visible in satellite data. Explosions on 1 February generated ash plumes that rose to 6.3-6.5 km altitude and extended 15 km NE. Video data showed an ash cloud from avalanches rising to 5.5 km altitude and drifting 5 km SE on 2 February. Satellite data showed gas-and-steam plumes containing some ash rose to 5-5.5 km altitude and drifted 68-110 km ENE and NE on 6 February, to 4.5-5 km altitude and drifted 35 km WNW on 22 February, and to 3.7-4 km altitude and drifted 47 km NE on 28 February. Scientists from the Kamchatka Volcanological Station (KVS) went on a field excursion on 25 February to document the growing lava dome, and although it was cloudy most of the day, nighttime incandescence was visible. Satellite data showed an ash plume extending up to 118 km E during 4-5 March. Video data from 1150 showed an ash cloud from avalanches rose to 3.7-5.5 km altitude and drifted 5-10 km ENE and E on 5 March. On 11 March an ash plume drifted 62 km E. On 27 March ash plumes rose to 3.5 km altitude and drifted 100 km E. Avalanches and constant incandescence at the lava dome was focused on the E and NE slopes on 28 March. A gas-and-steam plume containing some ash rose to 3.5 km altitude and moved 40 km E on 29 March. Ash plumes on 30 March rose to 3.5-3.7 km altitude and drifted 70 km NE.
Similar activity continued during April, with lava dome growth, strong fumarolic activity, incandescence in the dome, occasional explosions, and avalanches. A thermal anomaly persisted throughout the month. During 1-4 April weak ash plumes rose to 2.5-3 km altitude and extended 13-65 km SE and E.
Activity during 11 April 2023. The Institute of Volcanology and Seismology, Far Eastern Branch, Russian Academy of Sciences (IVS FEB RAS) reported a significant increase in seismicity around 0054 on 11 April, as reported by strong explosions detected on 11 April beginning at 0110 that sent ash plumes up to 7-10 km altitude and extended 100-435 km W, WNW, NNW, WSW, and SW. According to a Tokyo VAAC report the ash plume rose to 15.8 km altitude. By 0158 the plume extended over a 75 x 100 km area. According to an IVS FEB RAS report, the eruptive column was not vertical: the initial plume at 0120 on 11 April deviated to the NNE, at 0000 on 12 April, it drifted NW, and by 1900 it drifted SW. KVS reported that significant pulses of activity occurred at around 0200, 0320, and then a stronger phase around 0600. Levin Dmitry took a video from near Békés (3 km away) at around 0600 showing a rising plume; he also reported that a pyroclastic flow traveled across the road behind him as he left the area. According to IVS FEB RAS, the pyroclastic flow traveled several kilometers SSE, stopping a few hundred meters from a bridge on the road between Klyuchi and Petropavlovsk-Kamchatsky.
Ashfall was first observed in Klyuchi (45 km SW) at 0630, and a large, black ash plume blocked light by 0700. At 0729 KVERT issued a Volcano Observatory Notice for Aviation (VONA) raising the Aviation Color Code to Red (the highest level on a four-color scale). It also stated that a large ash plume had risen to 10 km altitude and drifted 100 km W. Near-constant lightning strikes were reported in the plume and sounds like thunderclaps were heard until about 1000. According to IVS FEB RAS the cloud was 200 km long and 76 km wide by 0830, and was spreading W at altitudes of 6-12 km. In the Klyuchi Village, the layer of both ash and snow reached 8.5 cm (figure 96); ashfall was also reported in Kozyrevsk (112 km SW) at 0930, Mayskoye, Anavgay, Atlasovo, Lazo, and Esso. Residents in Klyuchi reported continued darkness and ashfall at 1100. In some areas, ashfall was 6 cm deep and some residents reported dirty water coming from their plumbing. According to IVS FEB RAS, an ash cloud at 1150 rose to 5-20 km altitude and was 400 km long and 250 km wide, extending W. A VONA issued at 1155 reported that ash had risen to 10 km and drifted 340 km NNW and 240 km WSW. According to Simon Carn (Michigan Technological University), about 0.2 Tg of sulfur dioxide in the plume was measured in a satellite image from the TROPOMI instrument on the Sentinel-5P satellite acquired at 1343 that covered an area of about 189,000 km2 (figure 97). Satellite data at 1748 showed an ash plume that rose to 8 km altitude and drifted 430 km WSW and S, according to a VONA.
Activity during 12-15 April 2023. On 12 April at 0730 satellite images showed ash plumes rose to 7-8 km altitude and extended 600 km SW, 1,050 km ESE, and 1,300-3,000 km E. By 1710 that day, the explosions weakened. According to news sources, the ash-and-gas plumes drifted E toward the Aleutian Islands and reached the Gulf of Alaska by 13 April, causing flight disruptions. More than 100 flights involving Alaska airspace were cancelled due to the plume. Satellite data showed ash plumes rising to 4-5.5 km altitude and drifted 400-415 km SE and ESE on 13 April. KVS volcanologists observed the pyroclastic flow deposits and noted that steam rose from downed, smoldering trees. They also noted that the deposits were thin with very few large fragments, which differed from previous flows. The ash clouds traveled across the Pacific Ocean. Flight cancellations were also reported in NW Canada (British Columbia) during 13-14 April. During 14-15 April ash plumes rose to 6 km altitude and drifted 700 km NW.
Alaskan flight schedules were mostly back to normal by 15 April, with only minor delays and far less cancellations; a few cancellations continued to be reported in Canada. Clear weather on 15 April showed that most of the previous lava-dome complex was gone and a new crater roughly 1 km in diameter was observed (figure 98); gas-and-steam emissions were rising from this crater. Evidence suggested that there had been a directed blast to the SE, and pyroclastic flows traveled more than 20 km. An ash plume rose to 4.5-5.2 km altitude and drifted 93-870 km NW on 15 April.
Activity during 16-30 April 2023. Resuspended ash was lifted by the wind from the slopes and rose to 4 km altitude and drifted 224 km NW on 17 April. KVERT reported a plume of resuspended ash from the activity during 10-13 April on 19 April that rose to 3.5-4 km altitude and drifted 146-204 km WNW. During 21-22 April a plume stretched over the Scandinavian Peninsula. A gas-and-steam plume containing some ash rose to 3-3.5 km altitude and drifted 60 km SE on 30 April. A possible new lava dome was visible on the W slope of the volcano on 29-30 April (figure 99); satellite data showed two thermal anomalies, a bright one over the existing lava dome and a weaker one over the possible new one.
References. Girina, O., Loupian, E., Horvath, A., Melnikov, D., Manevich, A., Nuzhdaev, A., Bril, A., Ozerov, A., Kramareva, L., Sorokin, A., 2023, Analysis of the development of the paroxysmal eruption of Sheveluch volcano on April 10–13, 2023, based on data from various satellite systems, ??????????? ???????? ??? ?? ???????, 20(2).
Geologic Background. The high, isolated massif of Sheveluch volcano (also spelled Shiveluch) rises above the lowlands NNE of the Kliuchevskaya volcano group. The 1,300 km3 andesitic volcano is one of Kamchatka's largest and most active volcanic structures, with at least 60 large eruptions during the Holocene. The summit of roughly 65,000-year-old Stary Shiveluch is truncated by a broad 9-km-wide late-Pleistocene caldera breached to the south. Many lava domes occur on its outer flanks. The Molodoy Shiveluch lava dome complex was constructed during the Holocene within the large open caldera; Holocene lava dome extrusion also took place on the flanks of Stary Shiveluch. Widespread tephra layers from these eruptions have provided valuable time markers for dating volcanic events in Kamchatka. Frequent collapses of dome complexes, most recently in 1964, have produced debris avalanches whose deposits cover much of the floor of the breached caldera.
Information Contacts: Kamchatka Volcanic Eruptions Response Team (KVERT), Far Eastern Branch, Russian Academy of Sciences, 9 Piip Blvd., Petropavlovsk-Kamchatsky, 683006, Russia (URL: http://www.kscnet.ru/ivs/kvert/); Institute of Volcanology and Seismology, Far Eastern Branch, Russian Academy of Sciences (IVS FEB RAS), 9 Piip Blvd., Petropavlovsk-Kamchatsky 683006, Russia (URL: http://www.kscnet.ru/ivs/eng/); Kamchatka Volcanological Station, Kamchatka Branch of Geophysical Survey, (KB GS RAS), Klyuchi, Kamchatka Krai, Russia (URL: http://volkstat.ru/); Hawai'i Institute of Geophysics and Planetology (HIGP) - MODVOLC Thermal Alerts System, School of Ocean and Earth Science and Technology (SOEST), Univ. of Hawai'i, 2525 Correa Road, Honolulu, HI 96822, USA (URL: http://modis.higp.hawaii.edu/); MIROVA (Middle InfraRed Observation of Volcanic Activity), a collaborative project between the Universities of Turin and Florence (Italy) supported by the Centre for Volcanic Risk of the Italian Civil Protection Department (URL: http://www.mirovaweb.it/); Copernicus Browser, Copernicus Data Space Ecosystem, European Space Agency (URL: https://dataspace.copernicus.eu/browser/); Kam 24 News Agency, 683032, Kamchatka Territory, Petropavlovsk-Kamchatsky, Vysotnaya St., 2A (URL: https://kam24.ru/news/main/20230411/96657.html#.Cj5Jrky6.dpuf); Simon Carn, Geological and Mining Engineering and Sciences, Michigan Technological University, 1400 Townsend Drive, Houghton, MI 49931, USA (URL: http://www.volcarno.com/, Twitter: @simoncarn).
Bezymianny
Russia
55.972°N, 160.595°E; summit elev. 2882 m
All times are local (unless otherwise noted)
Explosions, ash plumes, lava flows, and avalanches during November 2022-April 2023
Bezymianny is located on the Kamchatka Peninsula of Russia as part of the Klyuchevskoy volcano group. Historic eruptions began in 1955 and have been characterized by dome growth, explosions, pyroclastic flows, ash plumes, and ashfall. During the 1955-56 eruption a large open crater was formed by collapse of the summit and an associated lateral blast. Subsequent episodic but ongoing lava-dome growth, accompanied by intermittent explosive activity and pyroclastic flows, has largely filled the 1956 crater. The current eruption period began in December 2016 and more recent activity has consisted of strong explosions, ash plumes, and thermal activity (BGVN 47:11). This report covers activity during November 2022 through April 2023, based on weekly and daily reports from the Kamchatka Volcano Eruptions Response Team (KVERT) and satellite data.
Activity during November and March 2023 was relatively low and mostly consisted of gas-and-steam emissions, occasional small collapses that generated avalanches along the lava dome slopes, and a persistent thermal anomaly over the volcano that was observed in satellite data on clear weather days. According to the Tokyo VAAC and KVERT, an explosion produced an ash plume that rose to 6 km altitude and drifted 25 km NE at 1825 on 29 March.
Gas-and-steam emissions, collapses generating avalanches, and thermal activity continued during April. According to two Volcano Observatory Notice for Aviation (VONA) issued on 2 and 6 April (local time) ash plumes rose to 3 km and 3.5-3.8 km altitude and drifted 35 km E and 140 km E, respectively. Satellite data from KVERT showed weak ash plumes extending up to 550 km E on 2 and 5-6 April.
A VONA issued at 0843 on 7 April described an ash plume that rose to 4.5-5 km altitude and drifted 250 km ESE. Later that day at 1326 satellite data showed an ash plume that rose to 5.5-6 km altitude and drifted 150 km ESE. A satellite image from 1600 showed an ash plume extending as far as 230 km ESE; KVERT noted that ash emissions were intensifying, likely due to avalanches from the growing lava dome. The Aviation Color Code (ACC) was raised to Red (the highest level on a four-color scale). At 1520 satellite data showed an ash plume rising to 5-5.5 km altitude and drifting 230 km ESE. That same day, Kamchatka Volcanological Station (KVS) volcanologists traveled to Ambon to collect ash; they reported that a notable eruption began at 1730, and within 20 minutes a large ash plume rose to 10 km altitude and drifted NW. KVERT reported that the strong explosive phase began at 1738. Video and satellite data taken at 1738 showed an ash plume that rose to 10-12 km altitude and drifted up to 2,800 km SE and E. Explosions were clearly audible 20 km away for 90 minutes, according to KVS. Significant amounts of ash fell at the Apakhonchich station, which turned the snow gray; ash continued to fall until the morning of 8 April. In a VONA issued at 0906 on 8 April, KVERT stated that the explosive eruption had ended; ash plumes had drifted 2,000 km E. The ACC was lowered to Orange (the third highest level on a four-color scale). The KVS team saw a lava flow on the active dome once the conditions were clear that same day (figure 53). On 20 April lava dome extrusion was reported; lava flows were noted on the flanks of the dome, and according to KVERT satellite data, a thermal anomaly was observed in the area. The ACC was lowered to Yellow (the second lowest on a four-color scale).
Satellite data showed an increase in thermal activity beginning in early April 2023. A total of 31 thermal hotspots were detected by the MODVOLC thermal algorithm on 4, 5, 7, and 12 April 2023. The elevated thermal activity resulted from an increase in explosive activity and the start of an active lava flow. The MIROVA (Middle InfraRed Observation of Volcanic Activity) volcano hotspot detection system based on the analysis of MODIS data also showed a pulse in thermal activity during the same time (figure 54). Infrared satellite imagery captured a continuous thermal anomaly at the summit crater, often accompanied by white gas-and-steam emissions (figure 55). On 4 April 2023 an active lava flow was observed descending the SE flank.
Geologic Background. The modern Bezymianny, much smaller than its massive neighbors Kamen and Kliuchevskoi on the Kamchatka Peninsula, was formed about 4,700 years ago over a late-Pleistocene lava-dome complex and an edifice built about 11,000-7,000 years ago. Three periods of intensified activity have occurred during the past 3,000 years. The latest period, which was preceded by a 1,000-year quiescence, began with the dramatic 1955-56 eruption. This eruption, similar to that of St. Helens in 1980, produced a large open crater that was formed by collapse of the summit and an associated lateral blast. Subsequent episodic but ongoing lava-dome growth, accompanied by intermittent explosive activity and pyroclastic flows, has largely filled the 1956 crater.
Information Contacts: Kamchatka Volcanic Eruptions Response Team (KVERT), Far Eastern Branch, Russian Academy of Sciences, 9 Piip Blvd., Petropavlovsk-Kamchatsky, 683006, Russia (URL: http://www.kscnet.ru/ivs/kvert/); Kamchatka Volcanological Station, Kamchatka Branch of Geophysical Survey, (KB GS RAS), Klyuchi, Kamchatka Krai, Russia (URL: http://volkstat.ru/); Hawai'i Institute of Geophysics and Planetology (HIGP) - MODVOLC Thermal Alerts System, School of Ocean and Earth Science and Technology (SOEST), Univ. of Hawai'i, 2525 Correa Road, Honolulu, HI 96822, USA (URL: http://modis.higp.hawaii.edu/); MIROVA (Middle InfraRed Observation of Volcanic Activity), a collaborative project between the Universities of Turin and Florence (Italy) supported by the Centre for Volcanic Risk of the Italian Civil Protection Department (URL: http://www.mirovaweb.it/); Copernicus Browser, Copernicus Data Space Ecosystem, European Space Agency (URL: https://dataspace.copernicus.eu/browser/).
Chikurachki
Russia
50.324°N, 155.461°E; summit elev. 1781 m
All times are local (unless otherwise noted)
New explosive eruption during late January-early February 2023
Chikurachki, located on Paramushir Island in the northern Kuriles, has had Plinian eruptions during the Holocene. Lava flows have reached the sea and formed capes on the NW coast; several young lava flows are also present on the E flank beneath a scoria deposit. Reported eruptions date back to 1690, with the most recent eruption period occurring during January through October 2022, characterized by occasional explosions, ash plumes, and thermal activity (BGVN 47:11). This report covers a new eruptive period during January through February 2023 that consisted of ash explosions and ash plumes, based on information from the Kamchatka Volcanic Eruptions Response Team (KVERT) and satellite data.
According to reports from KVERT, an explosive eruption began around 0630 on 29 January. Explosions generated ash plumes that rose to 3-3.5 km altitude and drifted 6-75 km SE and E, based on satellite data. As a result, the Aviation Color Code (ACC) was raised to Orange (the second highest level on a four-color scale). At 1406 and 1720 ash plumes were identified in satellite images that rose to 4.3 km altitude and extended 70 km E. By 2320 the ash plume had dissipated. A thermal anomaly was visible at the volcano on 31 January, according to a satellite image, and an ash plume was observed drifting 66 km NE.
Occasional explosions and ash plumes continued during early February. At 0850 on 1 February an ash plume rose to 3.5 km altitude and drifted 35 km NE. Satellite data showed an ash plume that rose to 3.2-3.5 km altitude and drifted 50 km NE at 1222 later that day (figure 22). A thermal anomaly was detected over the volcano during 5-6 February and ash plumes drifted as far as 125 km SE, E, and NE. Explosive events were reported at 0330 on 6 February that produced ash plumes rising to 4-4.5 km altitude and drifting 72-90 km N, NE, and ENE. KVERT noted that the last gas-and steam plume that contained some ash was observed on 8 February and drifted 55 km NE before the explosive eruption ended. The ACC was lowered to Yellow and then Green (the lowest level on a four-color scale) on 18 February.
Geologic Background. Chikurachki, the highest volcano on Paramushir Island in the northern Kuriles, is a relatively small cone constructed on a high Pleistocene edifice. Oxidized basaltic-to-andesitic scoria deposits covering the upper part of the young cone give it a distinctive red color. Frequent basaltic Plinian eruptions have occurred during the Holocene. Lava flows have reached the sea and formed capes on the NW coast; several young lava flows are also present on the E flank beneath a scoria deposit. The Tatarinov group of six volcanic centers is located immediately to the south, and the Lomonosov cinder cone group, the source of an early Holocene lava flow that reached the saddle between it and Fuss Peak to the west, lies at the southern end of the N-S-trending Chikurachki-Tatarinov complex. In contrast to the frequently active Chikurachki, the Tatarinov centers are extensively modified by erosion and have a more complex structure. Tephrochronology gives evidence of an eruption around 1690 CE from Tatarinov, although its southern cone contains a sulfur-encrusted crater with fumaroles that were active along the margin of a crater lake until 1959.
Information Contacts: Kamchatka Volcanic Eruptions Response Team (KVERT), Far East Division, Russian Academy of Sciences, 9 Piip Blvd., Petropavlovsk-Kamchatsky, 683006, Russia (URL: http://www.kscnet.ru/ivs/); Copernicus Browser, Copernicus Data Space Ecosystem, European Space Agency (URL: https://dataspace.copernicus.eu/browser/).
Search Bulletin Archive by Publication Date
Select a month and year from the drop-downs and click "Show Issue" to have that issue displayed in this tab.
The default month and year is the latest issue available.
Bulletin of the Global Volcanism Network - Volume 23, Number 07 (July 1998)
Managing Editor: Richard Wunderman
Arenal (Costa Rica)
Less vigorous eruptions but lava still escaping during July
Batur (Indonesia)
Continuous mild eruptive activity during first week of July
Fournaise, Piton de la (France)
New lava flow traverses 12 km across the E flank
Iwatesan (Japan)
Monthly seismicity increases; volcanic history
Karangetang (Indonesia)
Incandescent material ejected in early July
Langila (Papua New Guinea)
Gas and ash emissions relatively quiet during May and June
Manam (Papua New Guinea)
Mild activity; a few weak ash emissions in June
Merapi (Indonesia)
Increasing activity culminates in mid-July pyroclastic flows
Papandayan (Indonesia)
Minor phreatic explosions eject mud and gas on 23 June
Poas (Costa Rica)
Noisy degassing continues
Popocatepetl (Mexico)
Ongoing exhalations; mid-August earthquake and 4-5 km ash plume
Rabaul (Papua New Guinea)
Increase in Vulcanian activity during last week of June
Soufriere Hills (United Kingdom)
Relatively large pyroclastic flows on 3 July; ash venting
St. Helens (United States)
Earthquakes, but CO2 flux returns to normal
Turrialba (Costa Rica)
Not erupting; seismicity and fumarolic condensate chemistry
Arenal
Costa Rica
10.463°N, 84.703°W; summit elev. 1670 m
All times are local (unless otherwise noted)
Less vigorous eruptions but lava still escaping during July
Compared to recent months, during July both the number of eruptions and the quantity of material emitted decreased. The lava flow extruded in mid-June descended the NE flank and its front reached 800 m elevation. The lava flow branched at about 1,100 m elevation, forming a NW-trending arm who's front reached 850 m elevation.
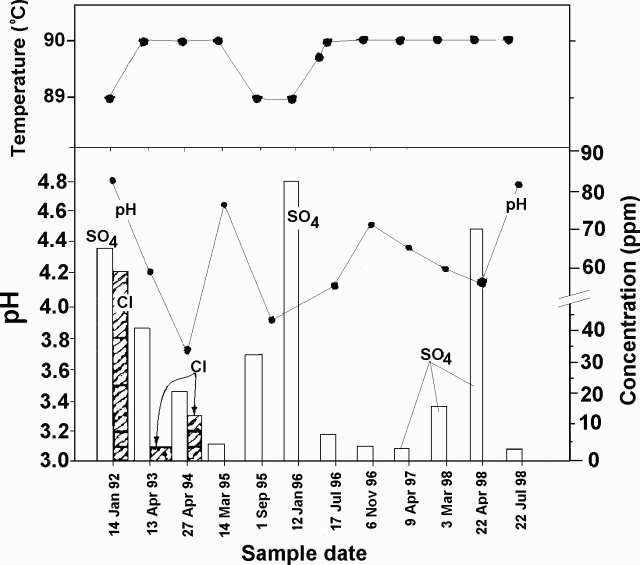
Downwind rain samples collected during the dry season (January-April) often were both more acidic and higher in measured anions than those collected in the wetter intervals (figure 86). Although the seismic station was plagued by 10 days with transmission problems, during July the station registered 229 eruptions and 120 hours of tremor.
Geologic Background. Conical Volcán Arenal is the youngest stratovolcano in Costa Rica and one of its most active. The 1670-m-high andesitic volcano towers above the eastern shores of Lake Arenal, which has been enlarged by a hydroelectric project. Arenal lies along a volcanic chain that has migrated to the NW from the late-Pleistocene Los Perdidos lava domes through the Pleistocene-to-Holocene Chato volcano, which contains a 500-m-wide, lake-filled summit crater. The earliest known eruptions of Arenal took place about 7000 years ago, and it was active concurrently with Cerro Chato until the activity of Chato ended about 3500 years ago. Growth of Arenal has been characterized by periodic major explosive eruptions at several-hundred-year intervals and periods of lava effusion that armor the cone. An eruptive period that began with a major explosive eruption in 1968 ended in December 2010; continuous explosive activity accompanied by slow lava effusion and the occasional emission of pyroclastic flows characterized the eruption from vents at the summit and on the upper western flank.
Information Contacts: E. Fernández, V. Barboza, M. Martinez, E. Duarte, R. Van der Laat, E. Hernández, and T. Marino, Observatorio Vulcanologico y Sismologico de Costa Rica, Universidad Nacional (OVSICORI-UNA), Apartado 86-3000, Heredia, Costa Rica.
Batur
Indonesia
8.2403°S, 115.3775°E; summit elev. 1711 m
All times are local (unless otherwise noted)
Continuous mild eruptive activity during first week of July
During the first week of July, Batur continuously emitted a gray plume 25-300 m above the crater. Observers saw incandescent material frequently ejected. Two episodes of tremor with amplitudes of 0.3-24 mm were recorded.
Geologic Background. The historically active Batur is located at the center of two concentric calderas NW of Agung volcano. The outer 10 x 13.5 km caldera was formed during eruption of the Bali (or Ubud) Ignimbrite about 29,300 years ago and now contains a caldera lake on its SE side, opposite the Gunung Abang cone, the topographic high of the complex. The inner 6.4 x 9.4 km caldera was formed about 20,150 years ago during eruption of the Gunungkawi Ignimbrite. The SE wall of the inner caldera lies beneath Lake Batur; Batur cone has been constructed within the inner caldera to a height above the outer caldera rim. The Batur stratovolcano has produced vents over much of the inner caldera, but a NE-SW fissure system has localized the Batur I, II, and III craters along the summit ridge. Recorded eruptions have been characterized by mild-to-moderate explosive activity sometimes accompanied by lava emission. Basaltic lava flows from both summit and flank vents have reached the caldera floor and the shores of Lake Batur in historical time.
Information Contacts: Volcanological Survey of Indonesia, Jalan Diponegoro No.57, Bandung 40122, Indonesia (URL: http://www.vsi.esdm.go.id/).
Piton de la Fournaise (France) — July 1998 Cite this Report
Piton de la Fournaise
France
21.244°S, 55.708°E; summit elev. 2632 m
All times are local (unless otherwise noted)
New lava flow traverses 12 km across the E flank
The eruption that began in March (BGVN 23:03) continued in August. A new lava flow crossed the Plaine des Osmondes and went down the E flank towards the sea. As of 31 July its front had reached 250 m from the new national road. By 3 August it had slowly progressed to within 100 m of the road. On 4 August the front moved forward suddenly; within a few hours it had crossed the old national road and stopped ~3 m in front of the new national road. No new movement of the lava flow was observed during the next week. The flow had reached a total length of 12 km. Some small but new lava flows were visible in the upper part of the Grand Brûlé. Tremor episodes had diminished in the past few months, but beginning on 6 August there was a sudden tenfold increase over levels of the preceding weeks. The increased activity persisted the following week.
Geologic Background. Piton de la Fournaise is a massive basaltic shield volcano on the French island of Réunion in the western Indian Ocean. Much of its more than 530,000-year history overlapped with eruptions of the deeply dissected Piton des Neiges shield volcano to the NW. Three scarps formed at about 250,000, 65,000, and less than 5,000 years ago by progressive eastward slumping, leaving caldera-sized embayments open to the E and SE. Numerous pyroclastic cones are present on the floor of the scarps and their outer flanks. Most recorded eruptions have originated from the summit and flanks of Dolomieu, a 400-m-high lava shield that has grown within the youngest scarp, which is about 9 km wide and about 13 km from the western wall to the ocean on the E side. More than 150 eruptions, most of which have produced fluid basaltic lava flows, have occurred since the 17th century. Only six eruptions, in 1708, 1774, 1776, 1800, 1977, and 1986, have originated from fissures outside the scarps.
Information Contacts: Thomas Staudacher, Observatoire Volcanologique du Piton de la Fournaise (OVPF), 14 RN3, le 27Km, 97418 La Plaine des Cafres, La Réunion, France.
Iwatesan
Japan
39.853°N, 141.001°E; summit elev. 2038 m
All times are local (unless otherwise noted)
Monthly seismicity increases; volcanic history
A pattern of high seismicity but low deformation that began at Iwate in March (BGVN 23:04) continued through June and July. The following also discusses Iwate's history (as reported to JMA and Tohoku University), and details of recent hazards.
Seismicity. According to reports issued by the Japan Meteorological Agency (JMA), monthly totals of volcanic earthquake events recorded at the Matsukawa observation site of Tohoku University increased progressively: 424 in March, 764 in April, 1,283 in May, and 1,806 in June. Seismicity during 1-17 July totalled 1,116 events (figure 2).
Low-frequency earthquakes occurred at 2124 on 23 June, and 0915 and 1037 on 24 June. A few minutes of volcanic tremor was observed at 0519 and 0701 on 24 June, and at 0754 on 25 June. Earthquake swarms below Nishi-Iwate continued to increase. (The place names Nishi- and Higashi-Iwate refer to West- and East-Iwate, respectively.) Further tremor took place at 1005 and 1642 on 27 June, and 1741 and 1759 on 28 June. Sixteen low-frequency earthquakes took place between the latter two events. Researchers at Tohoku University located these earthquakes at ~2 km SE of the summit of Higashi-Iwate at a depth of 8 km below sea level. This was close to where GPS surveys found a pressure source for crustal deformation. A swarm of low-frequency earthquake and tremor events occurred here in 1995, and it is just S of the craters of the 1732 (Yakebashiri) lava flow. Epicenters of high-frequency earthquakes were also located beneath Nishi-Iwate.
On the morning of 10 July, felt earthquakes occurred W of Iwate Volcano. Four minutes of large-amplitude tremor began at 0829 followed by a volcanic earthquake of M 2.5 at 0831. No surface phenomena were reported. Epicenters for seven earthquakes that morning were located at 3-5 km depth about 5 km west of Nishi-Iwate.
Epicenters of volcanic earthquake swarms under Nishi-Iwate migrated gradually to the W during May-June. New events occurred to the W of the swarms in July. Recent GPS measurements indicated that the source of deformation was located W of Iwate, in an area where no activity had occurred during the past 30,000 years. Although the degree of movement at stations remote from the volcano had become smaller since May, movement at stations closer to the volcano continued. Researchers believe that the source of deformation approached the surface, but they did not determine its depth.
Deformation surveys. Strain and tiltmeters at observation sites recorded little change since March. According to a field survey during 16-18 June, a fumarolic area in Nishi-Iwate seems to have been more active recently, since the fumarole temperature had increased. GPS surveys showed a steady and continuous lengthening between S and N sites of the volcano: a baseline of 9 km underwent a 5-cm extension in the last 5 months. Based on these results, volcanologists suspected a W-E dike intrusion at around 10 km below the summit of Higashi-Iwate, as opposed to just below Nishi-Iwate as indicated by earthquake swarms.
A geodetic measurement team from five Japanese national universities started a leveling survey at the E and S bases of Iwate Volcano on 17 July. The survey lines cover 19 km N-S and 15 km E-W.
History. Based on his recent field survey, Nobuo Doi, a geologist with Geothermal Engineering Co. Ltd., summarized Iwate's eruptive history. He concluded that Iwate began ~700,000 years ago. After the formation of a large cone (Nishi-Iwate), the eruption center migrated eastwards to Higashi-Iwate. Iwate collapsed to form debris avalanches seven times in the past 230,000 years; the most recent collapse took place sometime during the interval 915-1686 CE.
During a large collapse ~6,000 years ago, a mass of debris rushed NE but subsequent topographic constraints redirected debris SSE. The debris followed the Kitakami River reaching the present site of Morioka City (population 235,000). The episode left a large scar open to the NE on Higashi-Iwate's summit.
The present peak of Higashi-Iwate grew within this scar but it left part of the scar visible on its W side. During the last 6,000 years, magmatic eruptions occurred frequently; scoria eruptions have occurred more than 11 times. Lavas and pyroclastics younger than 6,000 years occur in the NE sector of Higashi-Iwate.
The 1686-87 CE eruption started with a pyroclastic surge; this was followed by scoria emission, a mudflow, a second pyroclastic surge, and it ended with a phreatic phase. In 1732, basaltic andesite lava flowed 2.5 km. Small explosions took place during 1934-35.
At Nishi-Iwate more than four phreatic eruptions have occurred in the past 7,500 years. The latest eruption here was phreatic and took place at O-Jigokudani ("large valley of hell") in 1919; an associated mudflow descended NNW.
Hazards. Authorities in two towns and villages near Iwate closed the mountain to climbers on 26 June because of the likelihood of phreatic explosions at Nishi-Iwate.
According to a local newspaper (Iwate Nippo), a new hazard map was expected to be ready for distribution on 22 July, incorporating aspects of volcanology, disaster-protection, and Sabo engineering. The scenario assumes a phreatic eruption on the W side, perhaps as large as one at Nishi-Iwate that occurred 3,200 years ago. The presumed disaster areas would be subjected to both ashfalls and lahars. A theoretical 10-cm-thick ash deposit would occur in resort areas N and S of the volcano extending to 5 km from the possible eruption site, but the researchers postulated a lack of serious damage to buildings.
Geologic Background. Viewed from the east, Iwatesan volcano has a symmetrical profile that invites comparison with Fuji, but on the west an older cone is visible containing an oval-shaped, 1.8 x 3 km caldera. After the growth of Nishi-Iwate volcano beginning about 700,000 years ago, activity migrated eastward to form Higashi-Iwate volcano. Iwate has collapsed seven times during the past 230,000 years, most recently between 739 and 1615 CE. The dominantly basaltic summit cone of Higashi-Iwate volcano, Yakushidake, is truncated by a 500-m-wide crater. It rises well above and buries the eastern rim of the caldera, which is breached by a narrow gorge on the NW. A central cone containing a 500-m-wide crater partially filled by a lake is located in the center of the oval-shaped caldera. A young lava flow from Yakushidake descended into the caldera, and a fresh-looking lava flow from the 1732 eruption traveled down the NE flank.
Information Contacts: Nishide Noritake, Volcanological Division, Japan Meteorological Agency (JMA), 1-3-4 Ote-machi, Chiyoda-ku, Tokyo 100, Japan (URL: http://www.jma.go.jp/); Volcano Research Center, Earthquake Research Institute (ERI), University of Tokyo, Yayoi 1-1-1, Bunkyo-ku, Tokyo 113, Japan; Nobuo Doi, Geothermal Engineering Co. Ltd., Japan.
Karangetang (Indonesia) — July 1998 Cite this Report
Karangetang
Indonesia
2.781°N, 125.407°E; summit elev. 1797 m
All times are local (unless otherwise noted)
Incandescent material ejected in early July
During early July observers noted incandescent materials at night. They also saw a plume emitted from the main crater rising to 25-50 m in height. Around this time, seismic events occurred less often compared to previous weeks.
Geologic Background. Karangetang (Api Siau) volcano lies at the northern end of the island of Siau, about 125 km NNE of the NE-most point of Sulawesi. The stratovolcano contains five summit craters along a N-S line. It is one of Indonesia's most active volcanoes, with more than 40 eruptions recorded since 1675 and many additional small eruptions that were not documented (Neumann van Padang, 1951). Twentieth-century eruptions have included frequent explosive activity sometimes accompanied by pyroclastic flows and lahars. Lava dome growth has occurred in the summit craters; collapse of lava flow fronts have produced pyroclastic flows.
Information Contacts: Volcanological Survey of Indonesia, Jalan Diponegoro No.57, Bandung 40122, Indonesia (URL: http://www.vsi.esdm.go.id/).
Langila (Papua New Guinea) — July 1998 Cite this Report
Langila
Papua New Guinea
5.525°S, 148.42°E; summit elev. 1330 m
All times are local (unless otherwise noted)
Gas and ash emissions relatively quiet during May and June
Langila remained comparatively quiet during May and June. Direct radio communication to RVO had been a persistent problem, but reports were relayed by ships operating in the area.
Crater 2 continued weak-to-moderate emissions of white vapor during both months. During 9, 13, 17, and 19-21 May a blue vapor accompanied the usual white vapor. Occasional gray ash emissions were observed on 10 May, and 16, 22-24, 27, 29-30 June. Weak glow from the crater was seen on the nights of 2 and 3 May, and 16 and 29 June.
Crater 3 only released weak white fumarolic vapors. The seismograph remained non-operational during May and June.
Geologic Background. Langila, one of the most active volcanoes of New Britain, consists of a group of four small overlapping composite basaltic-andesitic cones on the lower E flank of the extinct Talawe volcano in the Cape Gloucester area of NW New Britain. A rectangular, 2.5-km-long crater is breached widely to the SE; Langila was constructed NE of the breached crater of Talawe. An extensive lava field reaches the coast on the N and NE sides of Langila. Frequent mild-to-moderate explosive eruptions, sometimes accompanied by lava flows, have been recorded since the 19th century from three active craters at the summit. The youngest and smallest crater (no. 3 crater) was formed in 1960 and has a diameter of 150 m.
Information Contacts: Ben Talai, RVO.
Manam (Papua New Guinea) — July 1998 Cite this Report
Manam
Papua New Guinea
4.08°S, 145.037°E; summit elev. 1807 m
All times are local (unless otherwise noted)
Mild activity; a few weak ash emissions in June
Mild activity prevailed at Manam in June. Both Main and South craters continued to emit weak-to-moderately thick white vapor throughout the month. However, Southern Crater's emission was briefly punctuated by a weak projection of ash at 1900 on 26 June that rose 600 m above the summit. Main Crater also showed glimpses of increased activity with weak emissions of ash on 29 and 30 June. No glow was visible at night from either crater.
Seismicity remained low: 820-1,400 daily low-frequency events of very low amplitudes. The water-tube tiltmeters at Tabele Observatory (4 km SW of the summit) showed an inflation of 1 µrad during the month.
Geologic Background. The 10-km-wide island of Manam, lying 13 km off the northern coast of mainland Papua New Guinea, is one of the country's most active volcanoes. Four large radial valleys extend from the unvegetated summit of the conical basaltic-andesitic stratovolcano to its lower flanks. These valleys channel lava flows and pyroclastic avalanches that have sometimes reached the coast. Five small satellitic centers are located near the island's shoreline on the northern, southern, and western sides. Two summit craters are present; both are active, although most observed eruptions have originated from the southern crater, concentrating eruptive products during much of the past century into the SE valley. Frequent eruptions, typically of mild-to-moderate scale, have been recorded since 1616. Occasional larger eruptions have produced pyroclastic flows and lava flows that reached flat-lying coastal areas and entered the sea, sometimes impacting populated areas.
Information Contacts: Ben Talai, RVO.
Merapi
Indonesia
7.54°S, 110.446°E; summit elev. 2910 m
All times are local (unless otherwise noted)
Increasing activity culminates in mid-July pyroclastic flows
Seismic activity and avalanches increased significantly at Merapi beginning in June, and reached a climax in mid-July. According to Xinhua News Agency reports, pyroclastic flows and ashfall near populated areas caused concern among Volcanological Survey of Indonesia (VSI) scientists and civil authorities; evacuations were considered. VSI ranks alert status as follows, in increasing level of concern: Normal, Waspada, Siap, and Awas.
Increasing eruptive activity during the last week of June prompted officials to increase the alert level to Waspada on 2 July. As activity progressed to more dangerous levels, the alert status increased to Siaga at 0500 on 8 July, eventually reaching Awas at 0438 on 11 July, before returning to Siaga at 1200 on 12 July. A solfatara plume was observed during late June and early July; gases escaped with varying pressure to form a thin (or sometimes thick) white cloud attaining maximum heights of 1,400 m above the summit in the first week of July, and 2,000 m by 11 July. Avalanches extending as long as 1.5 km coursed through the upper portions of the Senowo river, and others were seen in the Lamat, Krasak/Bebeng and Boyong rivers (figure 18). Glowing at the summit resumed in late June. During the reporting interval seismic activity showed a significant increase; specifically, the number of shallow volcanic (B-type), multi-phase (MP), low-frequency (LF), and rockfall events increased sharply (table 9).
Table 9. The number of daily seismic events of various types at Merapi as recorded from mid-June to mid-July 1998. Data courtesy of VSI's Merapi Volcano Observatory.
| Dates |
B-type |
Low-frequency |
Multiphase |
Rockfalls |
Tremor |
Tectonic |
| 15 Jun-21 Jun 1998 |
4 |
-- |
33 |
5 |
-- |
4 |
| 22 Jun-28 Jun 1998 |
3 |
-- |
45 |
15 |
-- |
3 |
| 29 Jun-06 Jul 1998 |
47 |
3 |
925 |
142 |
-- |
5 |
| 07 Jul-12 Jul 1998 |
21 |
1 |
2029 |
613 |
-- |
2 |
| 17 Jul-21 Jul 1998 |
19 |
2 |
605 |
860 |
2 |
1 |
The amount of measured deformation also increased (although the summit tiltmeter station was rendered inoperative after 8 July). Explosions on 11 July could be heard as far away as 20 km S in the city of Yogyakarta. VSI noted, "lava was seen ejecting from the crater." In addition, and presumably with undue exaggeration, Xinhua news reporters claimed that some areas near the volcano were under 1.5 m of ash that blanketed crops and plantations.
On 19 July, Babadan Observatory located 4 km W of the summit reported three 'guguran' (pyroclastic flows resulting from dome collapse in the crater). These occurred between midnight and 0600, some reaching as far as 2,500 m down the Lamat River. VSI also noted a "thick white solfataric ash plume"; it stood 50 m in height and was observed from Kaliurang beginning at 0545. Pyroclastic flows during the remaining morning ran 5,000 m down the Lamat River valley, and an eruptive column rose up to 4,500 m above the summit. Between 0600 and 1313, seismic stations recorded 347 multiphase (MP) events. Tremor occurred between 1325 and 1503 and was accompanied by five pyroclastic flows that reached 2,000-5,000 m from the summit. At 1330 VSI ordered workers on the W sector of the volcano to leave the area. At 1501 Merapi erupted violently; several pyroclastic flows traveled 5,500 m down Lamat River and an eruptive column rose up to 6,000 m above the summit by 1507. At about 1615 ash showered the W side of the volcano, accumulating up to 2 mm in Muntilan. Ash also fell in Purworejo (42 km W of Yogyakarta) and Temanggung (35 km NW of the crater). Shallow volcanic earthquakes at 1625 were followed by small tremor. As many as 25 pyroclastic flows continued until 1800, some causing ash showers in nearby villages. There were B-type events (16), MP events ( 399 ), pyroclastic flows (119), and some glowing rockfalls throughout the afternoon.
Activity had subsided by 21 June, although fog obscured the summit area. Thick white ash rose to 460 m. Glowing rockfalls sometimes ran 1,250 m down the Lamat River valley.
This hazardous stratovolcano is located 70 km SE of Dieng and immediately N of Yogyakarta, a city of half a million people. In 32 of its 67 historical eruptions, nuées ardentes took place-more than known at any other volcano in the world-and 11 of them have caused fatalities. The volcano is carefully watched by several VSI observatories and heavily monitored instrumentally.
Geologic Background. Merapi, one of Indonesia's most active volcanoes, lies in one of the world's most densely populated areas and dominates the landscape immediately north of the major city of Yogyakarta. It is the youngest and southernmost of a volcanic chain extending NNW to Ungaran volcano. Growth of Old Merapi during the Pleistocene ended with major edifice collapse perhaps about 2,000 years ago, leaving a large arcuate scarp cutting the eroded older Batulawang volcano. Subsequent growth of the steep-sided Young Merapi edifice, its upper part unvegetated due to frequent activity, began SW of the earlier collapse scarp. Pyroclastic flows and lahars accompanying growth and collapse of the steep-sided active summit lava dome have devastated cultivated lands on the western-to-southern flanks and caused many fatalities.
Information Contacts: Mas Atje Purbawinata, Director, Merapi Volcano Observatory, Volcanological Survey of Indonesia, Jalan Cendana 15 Yogyakarta 55166 (URL: http://www.vsi.esdm.go.id/); Xinhua News Agency, 5 Sharp Street West, Wanchai, Hong Kong.
Papandayan (Indonesia) — July 1998 Cite this Report
Papandayan
Indonesia
7.32°S, 107.73°E; summit elev. 2665 m
All times are local (unless otherwise noted)
Minor phreatic explosions eject mud and gas on 23 June
The normal seismic activity of about ten events per day increased significantly after 20 June. Deep and shallow seismic events with large amplitudes were recorded during the last week of June and first few days of July. The increase also included events with low amplitude and long duration corresponding to gas emission from Emas Crater. Small phreatic explosions ejected gas and mud from fumarolic vents on 23 June, lofting material up to 5 m above the crater. A white plume under moderate pressure reached heights of 10-100 m in the first week of July. After 20 June there was an increased amount of A-type seismicity, but B-type, tectonic, and emission earthquakes changed little or decreased (table 1). Tremors and felt shocks began to be recorded at this time.
Table 1. Daily seismic events at Papandayan in late June and early July 1998. Data courtesy of VSI.
| Date |
Volcanic A |
Volcanic B |
Tectonic |
Emission |
Tremor |
Felt Shock |
| 22 Jun-29 Jun 1998 |
26 |
80 |
36 |
162 |
-- |
-- |
| 30 Jun-05 Jul 1998 |
83 |
39 |
39 |
15 |
11 |
1 |
The Volcanological Survey of Indonesia (VSI) installed four telemetric seismographs and eight temporary data-loggers around Papandayan. On 3 July they installed an infrasonic microphone on the crater to monitor the eruption.
Geologic Background. Papandayan is a complex stratovolcano with four large summit craters, the youngest of which was breached to the NE by collapse during a brief eruption in 1772 and contains active fumarole fields. The broad 1.1-km-wide, flat-floored Alun-Alun crater truncates the summit of Papandayan, and Gunung Puntang to the north gives a twin-peaked appearance. Several episodes of collapse have created an irregular profile and produced debris avalanches that have impacted lowland areas. A sulfur-encrusted fumarole field occupies historically active Kawah Mas ("Golden Crater"). After its first historical eruption in 1772, in which collapse of the NE flank produced a catastrophic debris avalanche that destroyed 40 villages and killed nearly 3000 people, only small phreatic eruptions had occurred prior to an explosive eruption that began in November 2002.
Information Contacts: Volcanological Survey of Indonesia, Jalan Diponegoro No.57, Bandung 40122, Indonesia (URL: http://www.vsi.esdm.go.id/).
Poas
Costa Rica
10.2°N, 84.233°W; summit elev. 2697 m
All times are local (unless otherwise noted)
Noisy degassing continues
During July, the turquoise-green crater lake at Poás had a temperature of 34°C. This temperature is close to those of the recent past, although during 1993-98 the lake's temperature varied significantly, from 25°C to 70°C. Between February and July 1998 the crater lake's surface dropped 1.6 m. As late as 30 July the lake's volume was 1.3 x 10⁶ m3. Gases noisily escaping from the pyroclastic cone (the dominant fumarolic area), formed columns reaching 500 and 600 m in height. Fumaroles on the S flank had measured temperatures of 92°C; those on the N terrace, 93°C; and those on the lake's S and SW shores, up to 94°C.
Changes in pH, Cl, and SO4 have been measured during the past 5 years. During 1993-94 the active crater lake's pH values were near 0; during 1996 they shifted upwards, and since then pH values have remained between 1 and 2. As recently as July 1998, the trends in pH, Cl, and SO4 have remained relatively consistent and followed the moderately constrained paths established during the past several years.
Since last reported on (BGVN 23:03), seismicity decreased several-fold. February established the monthly high for 1998 for both low- and medium-frequency earthquakes (2,718 and 75 events, respectively) and tremor duration (55 hours). During June and July, respectively, low-frequency earthquakes occurred 704 and 861 times; medium-frequency earthquakes took place seven times and one time; and tremor lasted for 2 and 3.5 hours.
Geologic Background. The broad vegetated edifice of Poás, one of the most active volcanoes of Costa Rica, contains three craters along a N-S line. The frequently visited multi-hued summit crater lakes of the basaltic-to-dacitic volcano are easily accessible by vehicle from the nearby capital city of San José. A N-S-trending fissure cutting the complex stratovolcano extends to the lower N flank, where it has produced the Congo stratovolcano and several lake-filled maars. The southernmost of the two summit crater lakes, Botos, last erupted about 7,500 years ago. The more prominent geothermally heated northern lake, Laguna Caliente, is one of the world's most acidic natural lakes, with a pH of near zero. It has been the site of frequent phreatic and phreatomagmatic eruptions since an eruption was reported in 1828. Eruptions often include geyser-like ejections of crater-lake water.
Information Contacts: E. Fernández, V. Barboza, M. Martinez, E. Duarte, R. Van der Laat, E. Hernández, and T. Marino, Observatorio Vulcanologico y Sismologico de Costa Rica, Universidad Nacional (OVSICORI-UNA).
Popocatepetl (Mexico) — July 1998 Cite this Report
Popocatepetl
Mexico
19.023°N, 98.622°W; summit elev. 5393 m
All times are local (unless otherwise noted)
Ongoing exhalations; mid-August earthquake and 4-5 km ash plume
During July 1998 Popocatépetl issued sporadic minor-to-moderate exhalations, steam plumes, and occasional minor ash. The daily log for July posted on the Internet by CENAPRED (see below) shows that activity was very similar to that reported for June (BGVN 23:06). That report also discussed the discovery of a defective calibration cell in a spectrometer used to measure SO2 at the volcano. Fortunately, the required corrections needed only to be made for low SO2 flux conditions. Although some of these uncorrected low fluxes may have been cited in previous Bulletin reports, the volcano has typically produced high SO2 fluxes.
Summary of daily activity during July. These observations and hazards were posted on the CENAPRED web site. Some of the original text has been edited.
1 July: Activity remained stable with a tendency to decrease. The number of exhalations decreased slightly; they were of low-to-moderate intensity and sometimes accompanied by steam and gases. In the morning a small plume blew SW. The recommended minimum approach distance was 4 km from the crater and the hazard status remained yellow.
2 July: Activity remained stable. The number of exhalations decreased; all of low to moderate intensity, some were accompanied by steam and gases.
3 July: Bad weather and clouds limited visibility.
4-5 July: Short exhalations of low-to-moderate intensity; some accompanied by steam and gases.
6 July: Except some isolated low intensity exhalations, the activity remained stable and at low levels. In the morning a small steam-and-gas plume blew SW.
7 July: Seismicity remained low and only small isolated exhalations were recorded. Small steam-and-gas plume.
8 July: Generally low activity. Seismic signals indicated that only a few, moderate exhalations took place. In the morning a gas and steam plume rose ~700 m above the crater and then dispersed .
9-11 July: Intense cloudiness and bad weather.
12 July: Low activity. Small and isolated exhalations, some accompanied by light steam-and-gas puffs. A small steam-and-gas plume was observed all day, blown W.
13 July: Activity increased slightly in the morning at 0931. A moderate exhalation produced a small but persistent ash emission directed to the W. Emissions and tremor continued until 0950.
14 July: Stable, low activity. Small gas plume blew W.
15 July: A few moderate exhalations were recorded seismically and were accompanied by gas-and-steam emissions. Some signals indicated rockfalls. In the morning only a small gas plume blew W .
16 July: Low seismicity and some fumarolic activity prevailed. Bad weather obstructed visibility.
17 July: Although cloudiness obscured the volcano most of the day, in the morning a steam-and-gas plume blew W.
18-21 July: In the morning on each day a dense steam-and-gas plume blew W.
22 July: Seismic signals revealed isolated, short exhalations; some contained ash. The latter was seen in the morning at 0743. The ash produced was light; it rose up to ~1 km above the summit and rapidly dispersed SW.
23-28 July: Seismic signals indicated isolated, short exhalations; some were accompanied by gas and steam. In the morning a dense steam plume blew W.
29-31 July: Activity remained stable and, in general, at low levels. Bad weather obstructed visibility.
Activity during 13-14 August. Servando De la Cruz-Reyna provided this description of a mid-August earthquake followed the next day by an eruptive outburst. At 1447 on 13 August a M 3.9 volcano-tectonic earthquake took place at a depth of ~12 km beneath the central part of the volcano (~6.5 km below sea level). During the earthquake, several tiltmeter stations recorded a step-like down-going displacement. Two smaller earthquakes occurred at various depths beneath the edifice that day. That night some low-amplitude, harmonic tremor signals were detected between 2200 and 2400; afterwards seismicity declined.
At 1850 on 14 August a moderate ash emission lasting about 15 minutes produced a column that rose to about 4-5 km over the summit. A low velocity wind (10 km/hour) distributed very light ash falls on some towns in the NW sector of the volcano about two hours later. On August 16, at 2149, a similar event produced a 2-3 km high column over the summit. The pattern of light ashfall repeated. Afterwards, Popocatepetl volcano returned to the previous low-level of activity prevailing since May 1998.
Technology versus rumors. Besides a rapidly growing web site and a broad network of seismic and tilt stations, CENAPRED has also adopted other innovative approaches. For example, a near real-time image of the N summit area is transmitted via microwave linkage and can be viewed on the CENAPRED web site at two resolutions. An infrared camera discloses thermal signatures of erupting plumes.
Still, despite these advances in monitoring technology and communication, during mid-1998 members of the lay public became increasingly concerned about rumors of doomsday scenarios involving Popocatépetl, some of which were broadcast via the media. In response, in June 1998 Roberto Meli, the Director General of CENAPRED, posted an informative note on their web site. He addressed the rumors and explained that there was an absence of scientific evidence for substantive changes in the volcano's behavior in the near future.
Geologic Background. Volcán Popocatépetl, whose name is the Aztec word for smoking mountain, rises 70 km SE of Mexico City to form North America's 2nd-highest volcano. The glacier-clad stratovolcano contains a steep-walled, 400 x 600 m wide crater. The generally symmetrical volcano is modified by the sharp-peaked Ventorrillo on the NW, a remnant of an earlier volcano. At least three previous major cones were destroyed by gravitational failure during the Pleistocene, producing massive debris-avalanche deposits covering broad areas to the south. The modern volcano was constructed south of the late-Pleistocene to Holocene El Fraile cone. Three major Plinian eruptions, the most recent of which took place about 800 CE, have occurred since the mid-Holocene, accompanied by pyroclastic flows and voluminous lahars that swept basins below the volcano. Frequent historical eruptions, first recorded in Aztec codices, have occurred since Pre-Columbian time.
Information Contacts: Servando De la Cruz-Reyna1,2, Roberto Quaas1,2 Carlos Valdés G.2, and Alicia Martinez Bringas1; 1Centro Nacional de Prevencion de Desastres (CENAPRED) Delfin Madrigal 665, Col. Pedregal de Santo Domingo,Coyoacan, 04360, México D.F. (URL: https://www.gob.mx/cenapred/); 2Instituto de Geofisica, UNAM, Coyoacán 04510, México D.F., México.
Rabaul (Papua New Guinea) — July 1998 Cite this Report
Rabaul
Papua New Guinea
4.2459°S, 152.1937°E; summit elev. 688 m
All times are local (unless otherwise noted)
Increase in Vulcanian activity during last week of June
Low-level Vulcanian eruptive activity continued at Tavurvur in June but increased somewhat during the last week of the month. During the first three weeks of June the volcano emitted small pale-gray clouds with a low ash content that rose 600-1,000 m above sea level. These emissions were usually accompanied by weak (or sometimes loud) roaring and rumbling sounds and caused light ashfalls in all but the E areas of Rabaul Town. The activity was consistent during these weeks but was interrupted by two moderately loud explosions heard at 1943 on 5 June and at 0306 on 9 June. Both explosions produced thick dark-gray ash columns rising to 3,000 m above sea level accompanied by glowing lava fragments.
The style of eruption changed in the last week of June. Beginning on 24 June, ash emissions became very small in volume but were extended over longer intervals. This period of relative quiet was followed by four weak explosions on 25-26 June that produced ash columns rising to 1,500 m. This activity persisted: dense ash-producing explosions occurred at 0408 on 27 June, 0403 on 28 June, and at 0355 and 1825 on 30 June. Ash clouds resulting from the explosions rose to 3,000 m and glowing lava fragments showered the flanks and base of Tavurvur cone.
Seismic activity was low in June according to data recorded about 2 km from Tavurvur's summit (at station KPTH). During the month a total of 1,029 low-frequency events were recorded, a significant decrease compared to 3,265 in May. Most of these events were recorded during the first three weeks of the month with an average of ~46 per day. At the end of the month daily totals decreased to only two per day. On some days throughout June, periods of short-duration tremor were recorded. Only three high-frequency earthquakes were recorded, but they were too small to be located. The sequence of arrivals at the recording stations suggested the events occurred outside the caldera.
Ground deformation data showed that the recovery (inflationary) trend observed in late May continued through June. For June, an accumulation of ~6 µrads inflation was recorded by the Sulphur Creek water tube tiltmeter, located 3.5 km NW of Tavurvur.
Geologic Background. The low-lying Rabaul caldera on the tip of the Gazelle Peninsula at the NE end of New Britain forms a broad sheltered harbor utilized by what was the island's largest city prior to a major eruption in 1994. The outer flanks of the asymmetrical shield volcano are formed by thick pyroclastic-flow deposits. The 8 x 14 km caldera is widely breached on the east, where its floor is flooded by Blanche Bay and was formed about 1,400 years ago. An earlier caldera-forming eruption about 7,100 years ago is thought to have originated from Tavui caldera, offshore to the north. Three small stratovolcanoes lie outside the N and NE caldera rims. Post-caldera eruptions built basaltic-to-dacitic pyroclastic cones on the caldera floor near the NE and W caldera walls. Several of these, including Vulcan cone, which was formed during a large eruption in 1878, have produced major explosive activity during historical time. A powerful explosive eruption in 1994 occurred simultaneously from Vulcan and Tavurvur volcanoes and forced the temporary abandonment of Rabaul city.
Information Contacts: Ben Talai, Rabaul Volcano Observatory (RVO), P.O. Box 386, Rabaul, Papua New Guinea.
Soufriere Hills (United Kingdom) — July 1998 Cite this Report
Soufriere Hills
United Kingdom
16.72°N, 62.18°W; summit elev. 915 m
All times are local (unless otherwise noted)
Relatively large pyroclastic flows on 3 July; ash venting
On 3 July, after several months of reduced activity, a 2.5-hour sequence of large pyroclastic flows took place at Soufriere Hills. Ash clouds reached heights of 9-12 km before drifting N and depositing fine ash over the inhabited part of the island. New deposits extended the Tar River delta significantly, adding ~0.25 km2 to its area, but not extending it seaward. Winds carried the cloud N, disturbing previously unaffected houses in the Long Ground area. The new materials were typical block-and-ash deposits, associated with fine surge deposits and ash-cloud deposits.
The 3 July pyroclastic flows marked the first major event at Soufriere Hills since dome growth ended in mid-March (BGVN 23:04). The dome had reached a volume of 120 x 106 m3 (the maximum observed throughout the eruption) and a summit height of 1,031 m. The minor pyroclastic flows of previous months (BGVN 23:04 and 23:05) were consistent with mechanical collapse of the very large and unstable dome and were therefore of no great significance. Given the duration of low levels of activity, it was conjectured that the current volcanic crisis might be waning, with important implications for the residents of the island and its administration. Because the 3 July pyroclastic flows apparently represented a re-escalation of activity, the Montserrat Volcano Observatory (MVO) has examined the events and deposits to investigate their significance.
Precursor events. There were no obvious precursors to the eruption. However, possibly related factors included a felt earthquake at 1704 on 25 June centered under Barbuda, and a series of small-to-moderate pyroclastic flows commencing at 1229 on 30 June and lasting 30-40 minutes. It may be significant that the events of 3 July coincided with the passage of a tropical wave, a period of bad weather and heavy rain.
Observations. Abrupt onset of activity was detected by the MVO seismic network at 0302 on 3 July, so opportunities for visual observations were limited. During the first half hour, there were reports from several localities in the W and N of the island of 'stones' and ash falling. At 0400 NOAA satellites detected a large ash column reaching altitudes of 9-12 km moving ENE. As a result of wind shear, the lower part of the plume was blown NW, which resulted in significant ashfall over the N of the island. Light ashfall was also recorded on Nevis and St. Kitts.
At 0422 an observer at Jack Boy Hill reported pyroclastic flows descending the Tar River valley, with abundant lightning and with an ash cloud drifting and rising over the center of the island. Reporters on the W of the island recorded heavy ashfall in the Belham Valley (figure 41), at Salem, and at Woodlands. Thunder and lightning were observed at the front of the ash plume as it headed W over the sea. At 0450 pyroclastic flows were observed at the Tar River delta; the deposits were steaming strongly at 0518. Winds from the S deposited 0.5-1 mm of ash over the entire N end of the island.
Although residents reported falling 'stones,' examination of the deposits revealed no pumice clasts. A maximum 2-mm-thick layer of fine ash was recorded in Salem with lithics and crystals up to 3 mm in size from MVO to the S. Most of the ash fell as accretionary lapilli all over the island, reaching diameters of up to 4 mm. These large lapilli may account for the reports of 'stones'. Heavy rain following the event precluded detailed studies of the deposits.
A helicopter flight at 0700 confirmed that pyroclastic flows had reached the Tar River delta and entered the sea. In the upper Tar River valley, flows were channeled down its S side; lower down they spread out over both sides of the valley. The N slopes of Roche's Mountain and Perche's Estate were eroded and there were indications that small amounts of material, including some ballistics, had overtopped the ridge causing impact scars on steep slopes and starting small fires. Surges associated with the passage of the pyroclastic flow left significant deposits of fine ash in the area of the Tar River estate house, and for the first time since the onset of the crisis the southern parts of Long Ground village were affected. Trees and shrubs were scorched, but no houses caught fire, nor was there any evidence of high velocities associated with the surges. Surge deposits extended to about 400 m N of the Tar River delta.
Small rockfall deposits were observed on the White River flanks of the dome, but there was no activity in Tuitt's, Mosquito, or Tyer's ghauts. Ash continued to drift W during the morning. A smaller event at about 1407 produced a dark cloud about 3 km high, depositing further ash on the Woodlands, Salem, Old Towne, and Olveston areas, but not farther N. This may have been a weak explosion or a small pyroclastic flow. A further 1 mm of fine ash accumulated in the Woodlands and Salem areas.
An observation flight at 1500 on 3 July revealed a large scar on the SE flanks of the dome, with chutes leading down against the N scarp of Perche's mountain and the S edge of the Tar River valley. A large volume had been lost from the dome (later estimated visually to be 15% of total dome volume). The prominent 50-m-high spine at Galway's dome was not visible due to steam and ash in the summit region, but craggy peaks were observed on the S and NE rims of the scar left by the collapse event. There was no evidence of changes on the other flanks of the dome. Strong fumarolic activity was observed along a clearly defined NE-trending, linear fracture 50-100 m in length within the new scar. Several distinct vents along this fracture gave off white steam; one appeared to be tinged with yellow elemental sulfur. To the W of this a dark mass was intermittently visible through the steam: its dark color may have resulted from steam condensation.
An observation flight on 10 July in clear conditions showed that the collapse scar had the shape of an extremely steep sided, long canyon extending deep back into the dome: it was not possible to determine its westernmost limit, but it must have cut through most of the dome. There was no evidence of renewed dome growth.
Associated seismicity. Beginning at 1229 on 30 June signals indicating a moderate-sized pyroclastic flow lasted ~40 minutes. After this event daily rockfall signals increased from an average of 2/day for June (including 11 on 30 June) continuing with 13 and 8 signal on 1 and 2 July.
On 3 July another, much larger pyroclastic-flow signal started at 0302 and lasted ~2.5 hours. The maximum amplitude of this signal was attained immediately after the onset and lasted for 30 seconds. It was greater than that for the flow on 30 June and several times greater than the last big flows down the Tar River valley in May 1997 (BGVN 22:05).
Spectral analysis of the high amplitude signal at the onset suggests that it was not generated by an explosive event similar to those seen during August and September 1997 (BGVN 22:08). It has been suggested, however, that a phreatic explosion may have been involved.
Deposits. New block-and-ash deposits from the 3 July event covered the entire Tar River delta, and new surge deposits extended over the N of the valley into Long Ground (figure 42). Comparisons between aerial photos of the deposit taken on 24 June, 3, 4, and 6 July show a significant increase in area on the N and S of the delta, but no significant increase in the E. The N side of the delta may have extended by up to 250 m; the S side, by only 30-50 m. The maximum width of the delta (along its base) is now ~1.9 km, tapering to 1 km seaward, extending 700 m off shore. This indicates a total area for the delta of 1 km2, an increase of about 0.25 km2.
An observation flight on 3 July showed intense white and brownish steaming on the N delta and much weaker white steaming on the S. A number of different lobes of various tones and textures were interpreted as successive pulses from different parts of the dome. Overall, the S area appeared light gray and the N appeared brownish.
Deposits along the beach lines of the delta were later visited. Dry material was extremely hot, steaming from small vents locally. The upper layers consisted of very fine grained, dusty surge deposits reaching up to ~0.5 m in thickness, lacking large clasts. This material was very mobile and small jets fountained when disturbed for sampling. Bubbling mud/ash vents up to 0.4 m in diameter were also distributed irregularly over the front of the delta. Underlying the fine surge deposits was a typical block-and-ash deposit of indeterminate thickness, with clasts typically of a few centimeters diameter, though some meter-sized boulders were visible on the surface of the deposit nearby.
Sampling carried out on the delta showed a prevalence of blocks from the dome, associated with a small proportion of pumices of varying density and vessiculation. A few blocks exhibiting bread-crust structure were found in the S delta. The differences in color seen from the air were conspicuous on the ground. The N part appears much finer than the S.
Hydrothermal alteration was observed in both areas. The top of the surge deposit showed some evidence of alteration, forming a slightly more resistant crust, perhaps as a result of steam from below. In the S this alteration crust is much harder. Part of this alteration is the result of a post-depositional process (as evidenced by yellow, white, and red staining on the surface); part may be due to pre-depositional processes, evidenced by individual discolored blocks of different size located on non-altered areas.
Exploratory sections made on 9 July through the delta deposit showed that the S area consists of a new block-and-ash flow deposit ~10 cm thick on top of deposits from an older block-and-ash flow. Close to the sea a significant layer of alteration (about 6 of 13 cm) is also evident in the deposit. The N of the delta shows a surge layer ~10 cm thick on top of the new block-and-ash flow deposit of up to 50 cm. Sections 1 and 2 (close to the original coast line) also hosted a layer of accretionary ash, probably due to secondary explosions when the flow reached the sea. This is consistent with the brownish steam seen to the N of the delta a few hours after the collapse. Section 2, the most complete section observed, shows the presence of a 15 cm thick layer of very fine ash at the base. The new deposits are probably thickest in the central part of the delta, but it was not possible to obtain thickness data there. Temperatures of the deposits were taken at several places (table 30).
Table 30. Temperature measurements in 3 July 1998 deposits at Soufriere Hills. Courtesy of MVO.
| Measurement Date |
Time |
Delta Area |
Location |
Depth (cm) |
Temperature (°C) |
| 06 Jul 1998 |
1445 |
Northern |
5 m from deposit edge |
4 |
100 |
| 06 Jul 1998 |
1445 |
Northern |
5 m from deposit edge |
50 |
300 |
| 06 Jul 1998 |
1445 |
Northern |
6 m from edge, inside fluidized area |
80 |
298 |
| 06 Jul 1998 |
1445 |
Northern |
8 m from deposit edge |
4 |
100 |
| 06 Jul 1998 |
1445 |
Northern |
8 m from deposit edge |
50 |
255 |
| |
| 07 Jul 1998 |
1400 |
Northern |
5 m from deposit edge |
4 |
65 |
| 07 Jul 1998 |
1400 |
Northern |
5 m from deposit edge |
50 |
195 |
| 07 Jul 1998 |
1400 |
Northern |
5 m from deposit edge |
100 |
319 |
| 07 Jul 1998 |
1400 |
Northern |
20 m from deposit edge |
4 |
76 |
| 07 Jul 1998 |
1400 |
Northern |
20 m from deposit edge |
50 |
193 |
| 07 Jul 1998 |
1400 |
Northern |
20 m from deposit edge |
70 |
238 |
| |
| 06 Jul 1998 |
1445 |
Southern |
5 m from deposit edge |
4 |
132 |
| 06 Jul 1998 |
1445 |
Southern |
5 m from deposit edge |
50 |
360 |
| 06 Jul 1998 |
1445 |
Southern |
10 m from edge |
4 |
120 |
| 06 Jul 1998 |
1445 |
Southern |
10 m from edge |
50 |
375 |
| |
| 07 Jul 1998 |
1400 |
Southern |
5 m from deposit edge |
4 |
117 |
| 07 Jul 1998 |
1400 |
Southern |
5 m from deposit edge |
50 |
337 |
| 07 Jul 1998 |
1400 |
Southern |
5 m from deposit edge |
70 |
391 |
| 07 Jul 1998 |
1400 |
Southern |
10 m from deposit edge |
4 |
115 |
| 07 Jul 1998 |
1400 |
Southern |
10 m from deposit edge |
50 |
360 |
| 07 Jul 1998 |
1400 |
Southern |
10 m from deposit edge |
70 |
238 |
Subsequent events. The pyroclastic flows of 3 July were followed by heightened rock-fall and volcano-tectonic earthquakes until 1407, when there was further high-amplitude seismic signal. This time the signal lasted only 10 minutes and the maximum amplitude was similar to that of the flow on 30 June. Analysis of the most recent event shows that the first 30 seconds were dominated by a 2.4-Hz harmonic signal. This, combined with observations of the color and ascent rate of the ash cloud, suggested an explosive component, which produced a low, dark ash cloud that drifted NW depositing ash on Salem and Woodlands.
On 5 July there were three episodes of ash venting, which produced weak ash plumes to about 3 km that drifted W over Plymouth. The first two occurred at about 0330 and 0500 lasting about 30 minutes each. The third event at 1030 was observed from Salem and lasted 1.75 hours with new, dense pulses of dark gray ash every 5 minutes.
The following week, there continued to be elevated numbers of rock-fall signals, volcano-tectonic earthquakes, and intervals of tremor associated with ash venting from the scar left by the large collapse.
COSPEC observations. COSPEC observations resumed on 5 July. Although the long interval since the last observations (BGVN 22:10) makes comparisons difficult, SO2 emission rates were clearly elevated, measuring 1,500-3,000 metric tons/day between 5 and 11 July. Although the high flux after the event may have been due to the effects of scattering by fine dust and aerosols in the plume (increasing the effective optical-path length), fluxes one week after the collapse were still significantly higher than during comparable periods earlier in the eruption. This may indicate a change in the magmatic source of the gas, or a change in the degassing regime caused by the depressurizing of a large part of the dome and associated changes in the underlying hydrothermal system. Reports of strong H2S odors from the volcano over previous months may also be related to a cooler, wetter hydrothermal system.
Interpretations and conclusions. Because the dome had stopped growing in mid-March, and in the absence of any clear seismic or other precursors, the 3 July event was initially interpreted as a large mechanical dome collapse- not triggered by fresh dome growth. Given the continued low level of activity, this may still be the correct interpretation. Seismic records suggested a sudden initial collapse followed by continued erosion of the scar. This inference is supported by the very long, deep collapse scar, which extends across much of the dome. Although there are no close parallels from Montserrat itself, it is possible that the high- amplitude seismic signal at the onset of the event was due to a phreatic explosion.
There is little evidence to indicate renewed dome growth. The high SO2 fluxes are problematical in the absence of fluxes taken immediately prior to the collapse. There may have been a change in the hydrothermal system, which brought about the conditions leading to collapse.
The difference in temperature, texture, and color between the new deposits in N and S areas of the delta suggests that they have been affected by different processes: the N area was affected by block-and-ash flows and surges; the S area, only by block-and-ash flows. It is likely that the large area affected by surges on the N flanks of the valley, including parts of Long Ground village, was the result of S winds during the emplacement of the pyroclastic flows.
Acknowledgments. The following scientists contributed to these studies: Costanza Bonadonna and Rob Watts, Department of Geology, University of Bristol; Peter Francis, Department of Earth Sciences, Open University; Richard Luckett and Colin Walker, Montserrat Volcano Observatory; Gill Norton and K. Rowley, British Geological Survey; Richard Robertson, Seismic Research Unit, University of the West Indies.
Geologic Background. The complex, dominantly andesitic Soufrière Hills volcano occupies the southern half of the island of Montserrat. The summit area consists primarily of a series of lava domes emplaced along an ESE-trending zone. The volcano is flanked by Pleistocene complexes to the north and south. English's Crater, a 1-km-wide crater breached widely to the east by edifice collapse, was formed about 2000 years ago as a result of the youngest of several collapse events producing submarine debris-avalanche deposits. Block-and-ash flow and surge deposits associated with dome growth predominate in flank deposits, including those from an eruption that likely preceded the 1632 CE settlement of the island, allowing cultivation on recently devegetated land to near the summit. Non-eruptive seismic swarms occurred at 30-year intervals in the 20th century, but no historical eruptions were recorded until 1995. Long-term small-to-moderate ash eruptions beginning in that year were later accompanied by lava-dome growth and pyroclastic flows that forced evacuation of the southern half of the island and ultimately destroyed the capital city of Plymouth, causing major social and economic disruption.
Information Contacts: Montserrat Volcano Observatory (MVO), c/o Chief Minister's Office, PO Box 292, Plymouth, Montserrat, West Indies (URL: http://www.mvo.ms/).
St. Helens (United States) — July 1998 Cite this Report
St. Helens
United States
46.2°N, 122.18°W; summit elev. 2549 m
All times are local (unless otherwise noted)
Earthquakes, but CO2 flux returns to normal
The rate of earthquake activity, which accelerated markedly from May through mid-July, (BGVN 23:05 and 23:06) returned in August to a level similar to that of last winter. The number of well-located earthquakes in July was 445, compared to 318 in June, but most of the earthquakes that took place during July occurred during the first three weeks of the month. The average rate for the first two weeks of August was only about four well-located earthquakes per day. Several temporary increases in earthquake activity have occurred since the last dome-building eruption in October 1986. This recent episode was the most intense.
Airborne gas surveys revealed that magmatic carbon dioxide (CO2) decreased since June. However escaping CO2 was still measurable. The CO2 was probably being released from magma that entered the magma reservoir during the past few months. The reservoir's top was estimated to be about 7 km below the crater. Because CO2 is heavier than air, it can concentrate in surface depressions on the dome or crater floor, especially under calm conditions, and pose an asphyxiation hazard. Poorly ventilated cavities, such as caves in the mass of snow and ice behind the dome, could be hazardous.
Geologic Background. Prior to 1980, Mount St. Helens was a conical volcano sometimes known as the Fujisan of America. During the 1980 eruption the upper 400 m of the summit was removed by slope failure, leaving a 2 x 3.5 km breached crater now partially filled by a lava dome. There have been nine major eruptive periods beginning about 40-50,000 years ago, and it has been the most active volcano in the Cascade Range during the Holocene. Prior to 2,200 years ago, tephra, lava domes, and pyroclastic flows were erupted, forming the older edifice, but few lava flows extended beyond the base of the volcano. The modern edifice consists of basaltic as well as andesitic and dacitic products from summit and flank vents. Eruptions in the 19th century originated from the Goat Rocks area on the N flank, and were witnessed by early settlers.
Information Contacts: Cascades Volcano Observatory, U.S. Geological Survey, 5400 MacArthur Blvd., Vancouver, WA 98661 USA (URL: http://volcanoes.usgs.gov/); Geophysics Program, University of Washington, Seattle, WA 98195 USA (URL: http://www.geophys.washington.edu/SEIS/PNSN/HELENS/).
Turrialba (Costa Rica) — July 1998 Cite this Report
Turrialba
Costa Rica
10.025°N, 83.767°W; summit elev. 3340 m
All times are local (unless otherwise noted)
Not erupting; seismicity and fumarolic condensate chemistry
During July, the main crater continued to weakly emit fumarolic gases with temperatures of 90°C. These escaped along the crater's NE, N, W, and S walls, and small landslides along the crater's N and S walls have partly covered the crater floor. Also, in the central crater, new points appeared on the N side where sulfur-rich gases gently escaped; gas temperatures measured 88°C.
Condensate chemistry and fumarole temperatures taken during 1992 through July 1998 appear on figure 4. Elevated SO4 was measured in condensate sampled on 22 April 1998 (figure 4). This coincided with the appearance of high-frequency earthquakes. Although the SO4 concentration declined in the next condensate sample (22 July), there were 68 high-frequency earthquakes from April through July (table 3).
Table 3. Seismicity registered at Turrialba's seismic station VTU, January-July 1998. Courtesy of OVSICORI-UNA.
| Month |
High-frequency |
Low-frequency |
Microseisms |
| Jan 1998 |
0 |
0 |
53 |
| Feb 1998 |
1 |
1 |
83 |
| Mar 1998 |
3 |
2 |
96 |
| Apr 1998 |
12 |
1 |
28 |
| May 1998 |
15 |
4 |
99 |
| Jun 1998 |
2 |
3 |
60 |
| Jul 1998 |
36 |
4 |
61 |
During 1998 the seismic system (station VTU, 0.5 km NE of the active crater) registered fewer than either 100 microseisms a month or five low-frequency earthquakes a month (table 3). The growth in the number of high-frequency earthquakes was thought to be related to the above-mentioned appearance of the new fumaroles in the central crater. Microseisms were generally weak, with amplitudes below 10 mm.
Geologic Background. Turrialba, the easternmost of Costa Rica's Holocene volcanoes, is a large vegetated basaltic-to-dacitic stratovolcano located across a broad saddle NE of Irazú volcano overlooking the city of Cartago. The massive edifice covers an area of 500 km2. Three well-defined craters occur at the upper SW end of a broad 800 x 2200 m summit depression that is breached to the NE. Most activity originated from the summit vent complex, but two pyroclastic cones are located on the SW flank. Five major explosive eruptions have occurred during the past 3500 years. A series of explosive eruptions during the 19th century were sometimes accompanied by pyroclastic flows. Fumarolic activity continues at the central and SW summit craters.
Information Contacts: E. Fernández, V. Barboza, M. Martinez, E. Duarte, R. Van der Laat, E. Hernández, and T. Marino, Observatorio Vulcanologico y Sismologico de Costa Rica, Universidad Nacional (OVSICORI-UNA), Apartado 86-3000, Heredia, Costa Rica.