Recently Published Bulletin Reports
Kadovar (Papua New Guinea) An ash plume and weak thermal anomaly during May 2023
San Miguel (El Salvador) Small gas-and-ash explosions during March and May 2023
Ebeko (Russia) Continued explosions, ash plumes, and ashfall during October 2022-May 2023
Home Reef (Tonga) Discolored plumes continued during November 2022-April 2023
Semisopochnoi (United States) Occasional explosions, ash deposits, and gas-and-steam plumes during December 2022-May 2023
Ambae (Vanuatu) New lava flow, ash plumes, and sulfur dioxide plumes during February-May 2023
Ibu (Indonesia) Daily ash explosions continue, along with thermal anomalies in the crater, October 2022-May 2023
Dukono (Indonesia) Continuing ash emissions, SO2 plumes, and thermal signals during October 2022-May 2023
Sabancaya (Peru) Explosions, gas-and-ash plumes, and thermal activity persist during November 2022-April 2023
Sheveluch (Russia) Significant explosions destroyed part of the lava-dome complex during April 2023
Bezymianny (Russia) Explosions, ash plumes, lava flows, and avalanches during November 2022-April 2023
Chikurachki (Russia) New explosive eruption during late January-early February 2023
Kadovar (Papua New Guinea) — June 2023  Cite this Report
Kadovar
Papua New Guinea
3.608°S, 144.588°E; summit elev. 365 m
All times are local (unless otherwise noted)
An ash plume and weak thermal anomaly during May 2023
Kadovar is a 2-km-wide island that is the emergent summit of a Bismarck Sea stratovolcano. It lies off the coast of New Guinea, about 25 km N of the mouth of the Sepik River. Prior to an eruption that began in 2018, a lava dome formed the high point of the volcano, filling an arcuate landslide scarp open to the S. Submarine debris-avalanche deposits occur to the S of the island. The current eruption began in January 2018 and has comprised lava effusion from vents at the summit and at the E coast; more recent activity has consisted of ash plumes, weak thermal activity, and gas-and-steam plumes (BGVN 48:02). This report covers activity during February through May 2023 using information from the Darwin Volcanic Ash Advisory Center (VAAC) and satellite data.
Activity during the reporting period was relatively low and mainly consisted of white gas-and-steam plumes that were visible in natural color satellite images on clear weather days (figure 67). According to a Darwin VAAC report, at 2040 on 6 May an ash plume rose to 4.6 km altitude and drifted W; by 2300 the plume had dissipated. MODIS satellite instruments using the MODVOLC thermal algorithm detected a single thermal hotspot on the SE side of the island on 7 May. Weak thermal activity was also detected in a satellite image on the E side of the island on 14 May, accompanied by a white gas-and-steam plume that drifted SE (figure 68).
Geologic Background. The 2-km-wide island of Kadovar is the emergent summit of a Bismarck Sea stratovolcano of Holocene age. It is part of the Schouten Islands, and lies off the coast of New Guinea, about 25 km N of the mouth of the Sepik River. Prior to an eruption that began in 2018, a lava dome formed the high point of the andesitic volcano, filling an arcuate landslide scarp open to the south; submarine debris-avalanche deposits occur in that direction. Thick lava flows with columnar jointing forms low cliffs along the coast. The youthful island lacks fringing or offshore reefs. A period of heightened thermal phenomena took place in 1976. An eruption began in January 2018 that included lava effusion from vents at the summit and at the E coast.
Information Contacts: Darwin Volcanic Ash Advisory Centre (VAAC), Bureau of Meteorology, Northern Territory Regional Office, PO Box 40050, Casuarina, NT 0811, Australia (URL: http://www.bom.gov.au/info/vaac/); Hawai'i Institute of Geophysics and Planetology (HIGP) - MODVOLC Thermal Alerts System, School of Ocean and Earth Science and Technology (SOEST), Univ. of Hawai'i, 2525 Correa Road, Honolulu, HI 96822, USA (URL: http://modis.higp.hawaii.edu/); Copernicus Browser, Copernicus Data Space Ecosystem, European Space Agency (URL: https://dataspace.copernicus.eu/browser/).
San Miguel (El Salvador) — June 2023 Cite this Report
San Miguel
El Salvador
13.434°N, 88.269°W; summit elev. 2130 m
All times are local (unless otherwise noted)
Small gas-and-ash explosions during March and May 2023
San Miguel in El Salvador is a broad, deep crater complex that has been frequently modified by eruptions recorded since the early 16th century and consists of the summit known locally as Chaparrastique. Flank eruptions have produced lava flows that extended to the N, NE, and SE during the 17-19th centuries. The most recent activity has consisted of minor ash eruptions from the summit crater. The current eruption period began in November 2022 and has been characterized by frequent phreatic explosions, gas-and-ash emissions, and sulfur dioxide plumes (BGVN 47:12). This report describes small gas-and-ash explosions during December 2022 through May 2023 based on special reports from the Ministero de Medio Ambiente y Recursos Naturales (MARN).
Activity has been relatively low since the last recorded explosions on 29 November 2022. Seismicity recorded by the San Miguel Volcano Station (VSM) located on the N flank at 1.7 km elevation had decreased by 7 December. Sulfur dioxide gas measurements taken with DOAS (Differential Optical Absorption Spectroscopy) mobile equipment were below typical previously recorded values: 300 tons per day (t/d). During December, small explosions were recorded by the seismic network and manifested as gas-and-steam emissions.
Gas-and-ash explosions in the crater occurred during January 2023, which were recorded by the seismic network. Sulfur dioxide values remained low, between 300-400 t/d through 10 March. At 0817 on 14 January a gas-and-ash emission was visible in webcam images, rising just above the crater rim. Some mornings during February, small gas-and-steam plumes were visible in the crater. On 7 March at 2252 MARN noted an increase in degassing from the central crater; gas emissions were constantly observed through the early morning hours on 8 March. During the early morning of 8 March through the afternoon on 9 March, 12 emissions were registered, some accompanied by ash. The last gas-and-ash emission was recorded at 1210 on 9 March; very fine ashfall was reported in El Tránsito (10 km S), La Morita (6 km W), and La Piedrita (3 km W). The smell of sulfur was reported in Piedra Azul (5 km SW). On 16 March MARN reported that gas-and-steam emissions decreased.
Low degassing and very low seismicity were reported during April; no explosions have been detected between 9 March and 27 May. The sulfur dioxide emissions remained between 350-400 t/d; during 13-20 April sulfur dioxide values fluctuated between 30-300 t/d. Activity remained low through most of May; on 23 May seismicity increased. An explosion was detected at 1647 on 27 May generated a gas-and-ash plume that rose 700 m high (figure 32); a decrease in seismicity and gas emissions followed. The DOAS station installed on the W flank recorded sulfur dioxide values that reached 400 t/d on 27 May; subsequent measurements showed a decrease to 268 t/d on 28 May and 100 t/d on 29 May.
Geologic Background. The symmetrical cone of San Miguel, one of the most active volcanoes in El Salvador, rises from near sea level to form one of the country's most prominent landmarks. A broad, deep, crater complex that has been frequently modified by eruptions recorded since the early 16th century caps the truncated unvegetated summit, also known locally as Chaparrastique. Flanks eruptions of the basaltic-andesitic volcano have produced many lava flows, including several during the 17th-19th centuries that extended to the N, NE, and SE. The SE-flank flows are the largest and form broad, sparsely vegetated lava fields crossed by highways and a railroad skirting the base of the volcano. Flank vent locations have migrated higher on the edifice during historical time, and the most recent activity has consisted of minor ash eruptions from the summit crater.
Information Contacts: Ministero de Medio Ambiente y Recursos Naturales (MARN), Km. 5½ Carretera a Nueva San Salvador, Avenida las Mercedes, San Salvador, El Salvador (URL: http://www.snet.gob.sv/ver/vulcanologia).
Ebeko
Russia
50.686°N, 156.014°E; summit elev. 1103 m
All times are local (unless otherwise noted)
Continued explosions, ash plumes, and ashfall during October 2022-May 2023
Ebeko, located on the N end of Paramushir Island in the Kuril Islands, consists of three summit craters along a SSW-NNE line at the northern end of a complex of five volcanic cones. Eruptions date back to the late 18th century and have been characterized as small-to-moderate explosions from the summit crater, accompanied by intense fumarolic activity. The current eruption period began in June 2022 and has recently consisted of frequent explosions, ash plumes, and thermal activity (BGVN 47:10). This report covers similar activity during October 2022 through May 2023, based on information from the Kamchatka Volcanic Eruptions Response Team (KVERT) and satellite data.
Activity during October consisted of explosive activity, ash plumes, and occasional thermal anomalies. Visual data by volcanologists from Severo-Kurilsk showed explosions producing ash clouds up to 2.1-3 km altitude which drifted E, N, NE, and SE during 1-8, 10, 16, and 18 October. KVERT issued several Volcano Observatory Notices for Aviation (VONA) on 7, 13-15, and 27 October 2022, stating that explosions generated ash plumes that rose to 2.3-4 km altitude and drifted 5 km E, NE, and SE. Ashfall was reported in Severo-Kurilsk (Paramushir Island, about 7 km E) on 7 and 13 October. Satellite data showed a thermal anomaly over the volcano on 15-16 October. Visual data showed ash plumes rising to 2.5-3.6 km altitude on 22, 25-29, and 31 October and moving NE due to constant explosions.
Similar activity continued during November, with explosions, ash plumes, and ashfall occurring. KVERT issued VONAs on 1-2, 4, 6-7, 9, 13, and 16 November that reported explosions and resulting ash plumes that rose to 1.7-3.6 km altitude and drifted 3-5 km SE, ESE, E, and NE. On 1 November ash plumes extended as far as 110 km SE. On 5, 8, 12, and 24-25 November explosions and ash plumes rose to 2-3.1 km altitude and drifted N and E. Ashfall was observed in Severo-Kurilsk on 7 and 16 November. A thermal anomaly was visible during 1-4, 16, and 20 November. Explosions during 26 November rose as high as 2.7 km altitude and drifted NE (figure 45).
Explosions and ash plumes continued to occur in December. During 1-2 and 4 December volcanologists from Severo-Kurilsk observed explosions that sent ash to 1.9-2.5 km altitude and drifted NE and SE (figure 46). VONAs were issued on 5, 9, and 16 December reporting that explosions generated ash plumes rising to 1.9 km, 2.6 km, and 2.4 km altitude and drifted 5 km SE, E, and NE, respectively. A thermal anomaly was visible in satellite imagery on 16 December. On 18 and 27-28 December explosions produced ash plumes that rose to 2.5 km altitude and drifted NE and SE. On 31 December an ash plume rose to 2 km altitude and drifted NE.
Explosions continued during January 2023, based on visual observations by volcanologists from Severo-Kurilsk. During 1-7 January explosions generated ash plumes that rose to 4 km altitude and drifted NE, E, W, and SE. According to VONAs issued by KVERT on 2, 4, 10, and 23 January, explosions produced ash plumes that rose to 2-4 km altitude and drifted 5 km N, NE, E, and ENE; the ash plume that rose to 4 km altitude occurred on 10 January (figure 47). Satellite data showed a thermal anomaly during 3-4, 10, 13, 16, 21, 22, and 31 January. KVERT reported that an ash cloud on 4 January moved 12 km NE. On 6 and 9-11 January explosions sent ash plumes to 4.5 km altitude and drifted W and ESE. On 13 January an ash plume rose to 3 km altitude and drifted SE. During 20-24 January ash plumes from explosions rose to 3.7 km altitude and drifted SE, N, and NE. On 21 January the ash plume drifted as far as 40 km NE. During 28-29 and 31 January and 1 February ash plumes rose to 4 km altitude and drifted NE.
During February, explosions, ash plumes, and ashfall were reported. During 1, 4-5 and 7-8 February explosions generated ash plumes that rose to 4.5 km altitude and drifted E and NE; ashfall was observed on 5 and 8 February. On 6 February an explosion produced an ash plume that rose to 3 km altitude and drifted 7 km E, causing ashfall in Severo-Kurilsk. A thermal anomaly was visible in satellite data on 8, 9, 13, and 21 February. Explosions on 9 and 12-13 February produced ash plumes that rose to 4 km altitude and drifted E and NE; the ash cloud on 12 February extended as far as 45 km E. On 22 February explosions sent ash to 3 km altitude that drifted E. During 24 and 26-27 February ash plumes rose to 4 km altitude and drifted E. On 28 February an explosion sent ash to 2.5-3 km altitude and drifted 5 km E; ashfall was observed in Severo-Kurilsk.
Activity continued during March; visual observations showed that explosions generated ash plumes that rose to 3.6 km altitude on 3, 5-7, and 9-12 March and drifted E, NE, and NW. Thermal anomalies were visible on 10, 13, and 29-30 March in satellite imagery. On 18, 21-23, 26, and 29-30 March explosions produced ash plumes that rose to 2.8 km altitude and drifted NE and E; the ash plumes during 22-23 March extended up to 76 km E. A VONA issued on 21 March reported an explosion that produced an ash plume that rose to 2.8 km altitude and drifted 5 km E. Another VONA issued on 23 March reported that satellite data showed an ash plume rising to 3 km altitude and drifted 14 km E.
Explosions during April continued to generate ash plumes. On 1 and 4 April an ash plume rose to 2.8-3.5 km altitude and drifted SE and NE. A thermal anomaly was visible in satellite imagery during 1-6 April. Satellite data showed ash plumes and clouds rising to 2-3 km altitude and drifting up to 12 km SW and E on 3 and 6 April (figure 48). KVERT issued VONAs on 3, 5, 14, 16 April describing explosions that produced ash plumes rising to 3 km, 3.5 km, 3.5 km, and 3 km altitude and drifting 5 km S, 5 km NE and SE, 72 km NNE, and 5 km NE, respectively. According to satellite data, the resulting ash cloud from the explosion on 14 April was 25 x 7 km in size and drifted 72-104 km NNE during 14-15 April. According to visual data by volcanologists from Severo-Kurilsk explosions sent ash up to 3.5 km altitude that drifted NE and E during 15-16, 22, 25-26, and 29 April.
The explosive eruption continued during May. Explosions during 3-4, 6-7, and 9-10 May generated ash plumes that rose to 4 km altitude and drifted SW and E. Satellite data showed a thermal anomaly on 3, 9, 13-14, and 24 May. During 12-16, 23-25, and 27-28 May ash plumes rose to 3.5 km altitude and drifted in different directions due to explosions. Two VONA notices were issued on 16 and 25 May, describing explosions that generated ash plumes rising to 3 km and 3.5 km altitude, respectively and extending 5 km E. The ash cloud on 25 May drifted 75 km SE.
Thermal activity in the summit crater, occasionally accompanied by ash plumes and ash deposits on the SE and E flanks due to frequent explosions, were visible in infrared and true color satellite images (figure 49).
Geologic Background. The flat-topped summit of the central cone of Ebeko volcano, one of the most active in the Kuril Islands, occupies the northern end of Paramushir Island. Three summit craters located along a SSW-NNE line form Ebeko volcano proper, at the northern end of a complex of five volcanic cones. Blocky lava flows extend west from Ebeko and SE from the neighboring Nezametnyi cone. The eastern part of the southern crater contains strong solfataras and a large boiling spring. The central crater is filled by a lake about 20 m deep whose shores are lined with steaming solfataras; the northern crater lies across a narrow, low barrier from the central crater and contains a small, cold crescentic lake. Historical activity, recorded since the late-18th century, has been restricted to small-to-moderate explosive eruptions from the summit craters. Intense fumarolic activity occurs in the summit craters, on the outer flanks of the cone, and in lateral explosion craters.
Information Contacts: Kamchatka Volcanic Eruptions Response Team (KVERT), Far Eastern Branch, Russian Academy of Sciences, 9 Piip Blvd., Petropavlovsk-Kamchatsky, 683006, Russia (URL: http://www.kscnet.ru/ivs/kvert/); MIROVA (Middle InfraRed Observation of Volcanic Activity), a collaborative project between the Universities of Turin and Florence (Italy) supported by the Centre for Volcanic Risk of the Italian Civil Protection Department (URL: http://www.mirovaweb.it/); Copernicus Browser, Copernicus Data Space Ecosystem, European Space Agency (URL: https://dataspace.copernicus.eu/browser/).
Home Reef
Tonga
18.992°S, 174.775°W; summit elev. -10 m
All times are local (unless otherwise noted)
Discolored plumes continued during November 2022-April 2023
Home Reef is a submarine volcano located in the central Tonga islands between Lateiki (Metis Shoal) and Late Island. The first recorded eruption occurred in the mid-19th century, when an ephemeral island formed. An eruption in 1984 produced a 12-km-high eruption plume, a large volume of floating pumice, and an ephemeral island 500 x 1,500 m wide, with cliffs 30-50 m high that enclosed a water-filled crater. Another island-forming eruption in 2006 produced widespread pumice rafts that drifted as far as Australia; by 2008 the island had eroded below sea level. The previous eruption occurred during October 2022 and was characterized by a new island-forming eruption, lava effusion, ash plumes, discolored water, and gas-and-steam plumes (BGVN 47:11). This report covers discolored water plumes during November 2022 through April 2023 using satellite data.
Discolored plumes continued during the reporting period and were observed in true color satellite images on clear weather days. Satellite images show light green-yellow discolored water extending W on 8 and 28 November 2022 (figure 31), and SW on 18 November. Light green-yellow plumes extended W on 3 December, S on 13 December, SW on 18 December, and W and S on 23 December (figure 31). On 12 January 2023 discolored green-yellow plumes extended to the NE, E, SE, and N. The plume moved SE on 17 January and NW on 22 January. Faint discolored water in February was visible moving NE on 1 February. A discolored plume extended NW on 8 and 28 March and NW on 13 March (figure 31). During April, clear weather showed green-blue discolored plumes moving S on 2 April, W on 7 April, and NE and S on 12 April. A strong green-yellow discolored plume extended E and NE on 22 April for several kilometers (figure 31).
Geologic Background. Home Reef, a submarine volcano midway between Metis Shoal and Late Island in the central Tonga islands, was first reported active in the mid-19th century, when an ephemeral island formed. An eruption in 1984 produced a 12-km-high eruption plume, large amounts of floating pumice, and an ephemeral 500 x 1,500 m island, with cliffs 30-50 m high that enclosed a water-filled crater. In 2006 an island-forming eruption produced widespread dacitic pumice rafts that drifted as far as Australia. Another island was built during a September-October 2022 eruption.
Information Contacts: Copernicus Browser, Copernicus Data Space Ecosystem, European Space Agency (URL: https://dataspace.copernicus.eu/browser/).
Semisopochnoi (United States) — June 2023 Cite this Report
Semisopochnoi
United States
51.93°N, 179.58°E; summit elev. 1221 m
All times are local (unless otherwise noted)
Occasional explosions, ash deposits, and gas-and-steam plumes during December 2022-May 2023
Semisopochnoi is located in the western Aleutians, is 20-km-wide at sea level, and contains an 8-km-wide caldera. The three-peaked Mount Young (formerly Cerberus) was constructed within the caldera during the Holocene. Each of these peaks contains a summit crater; the lava flows on the N flank appear younger than those on the S side. The current eruption period began in early February 2021 and has more recently consisted of intermittent explosions and ash emissions (BGVN 47:12). This report updates activity during December 2022 through May 2023 using daily, weekly, and special reports from the Alaska Volcano Observatory (AVO). AVO monitors the volcano using local seismic and infrasound sensors, satellite data, web cameras, and remote infrasound and lightning networks.
Activity during most of December 2022 was relatively quiet; according to AVO no eruptive or explosive activity was observed since 7 November 2022. Intermittent tremor and occasional small earthquakes were observed in geophysical data. Continuous gas-and-steam emissions were observed from the N crater of Mount Young in webcam images on clear weather days (figure 25). On 24 December, there was a slight increase in earthquake activity and several small possible explosion signals were detected in infrasound data. Eruptive activity resumed on 27 December at the N crater of Mount Young; AVO issued a Volcano Activity Notice (VAN) that reported minor ash deposits on the flanks of Mount Young that extended as far as 1 km from the vent, according to webcam images taken during 27-28 December (figure 26). No ash plumes were observed in webcam or satellite imagery, but a persistent gas-and-steam plume that might have contained some ash rose to 1.5 km altitude. As a result, AVO raised the Aviation Color Code (ACC) to Orange (the second highest level on a four-color scale) and the Volcano Alert Level (VAL) to Watch (the second highest level on a four-level scale). Possible explosions were detected during 21 December 2022 through 1 January 2023 and seismic tremor was recorded during 30-31 December.
During January 2023 eruptive activity continued at the active N crater of Mount Young. Minor ash deposits were observed on the flanks, extending about 2 km SSW, based on webcam images from 1 and 3 January. A possible explosion occurred during 1-2 January based on elevated seismicity recorded on local seismometers and an infrasound signal recorded minutes later by an array at Adak. Though no ash plumes were observed in webcam or satellite imagery, a persistent gas-and-steam plume rose to 1.5 km altitude that might have carried minor traces of ash. Ash deposits were accompanied by periods of elevated seismicity and infrasound signals from the local geophysical network, which AVO reported were likely due to weak explosive activity. Low-level explosive activity was also detected during 2-3 January, with minor gas-and-steam emissions and a new ash deposit that was visible in webcam images. Low-level explosive activity was detected in geophysical data during 4-5 January, with elevated seismicity and infrasound signals observed on local stations. Volcanic tremor was detected during 7-9 January and very weak explosive activity was detected in seismic and infrasound data on 9 January. Weak seismic and infrasound signals were recorded on 17 January, which indicated minor explosive activity, but no ash emissions were observed in clear webcam images; a gas-and-steam plume continued to rise to 1.5 km altitude. During 29-30 January, ash deposits near the summit were observed on fresh snow, according to webcam images.
The active N cone at Mount Young continued to produce a gas-and-steam plume during February, but no ash emissions or explosive events were detected. Seismicity remained elevated with faint tremor during early February. Gas-and-steam emissions from the N crater were observed in clear webcam images on 11-13 and 16 February; no explosive activity was detected in seismic, infrasound, or satellite data. Seismicity has also decreased, with no significant seismic tremor observed since 25 January. Therefore, the ACC was lowered to Yellow (the second lowest level on a four-color scale) and the VAL was lowered to Advisory (the second lowest level on a four-color scale) on 22 February.
Gas-and-steam emissions persisted during March from the N cone of Mount Young, based on clear webcam images. A few brief episodes of weak tremor were detected in seismic data, although seismicity decreased over the month. A gas-and-steam plume detected in satellite data extended 150 km on 18 March. Low-level ash emissions from the N cone at Mount Young were observed in several webcam images during 18-19 March, in addition to small explosions and volcanic tremor. The ACC was raised to Orange and the VAL increased to Watch on 19 March. A small explosion was detected in seismic and infrasound data on 21 March.
Low-level unrest continued during April, although cloudy weather often obscured views of the summit; periods of seismic tremor and local earthquakes were recorded. During 3-4 April a gas-and-steam plume was visible traveling more than 200 km overnight; no ash was evident in the plume, according to AVO. A gas-and-steam plume was observed during 4-6 April that extended 400 km but did not seem to contain ash. Small explosions were detected in seismic and infrasound data on 5 April. Occasional clear webcam images showed continuing gas-and-steam emissions rose from Mount Young, but no ash deposits were observed on the snow. On 19 April small explosions and tremor were detected in seismic and infrasound data. A period of seismic tremor was detected during 22-25 April, with possible weak explosions on 25 April. Ash deposits were visible near the crater rim, but it was unclear if these deposits were recent or due to older deposits.
Occasional small earthquakes were recorded during May, but there were no signs of explosive activity seen in geophysical data. Gas-and-steam emissions continued from the N crater of Mount Young, based on webcam images, and seismicity remained slightly elevated. A new, light ash deposit was visible during the morning of 5 May on fresh snow on the NW flank of Mount Young. During 10 May periods of volcanic tremor were observed. The ACC was lowered to Yellow and the VAL to Advisory on 17 May due to no additional evidence of activity.
Geologic Background. Semisopochnoi, the largest subaerial volcano of the western Aleutians, is 20 km wide at sea level and contains an 8-km-wide caldera. It formed as a result of collapse of a low-angle, dominantly basaltic volcano following the eruption of a large volume of dacitic pumice. The high point of the island is Anvil Peak, a double-peaked late-Pleistocene cone that forms much of the island's northern part. The three-peaked Mount Cerberus (renamed Mount Young in 2023) was constructed within the caldera during the Holocene. Each of the peaks contains a summit crater; lava flows on the N flank appear younger than those on the south side. Other post-caldera volcanoes include the symmetrical Sugarloaf Peak SSE of the caldera and Lakeshore Cone, a small cinder cone at the edge of Fenner Lake in the NE part of the caldera. Most documented eruptions have originated from Young, although Coats (1950) considered that both Sugarloaf and Lakeshore Cone could have been recently active.
Information Contacts: Alaska Volcano Observatory (AVO), a cooperative program of a) U.S. Geological Survey, 4200 University Drive, Anchorage, AK 99508-4667 USA (URL: https://avo.alaska.edu/), b) Geophysical Institute, University of Alaska, PO Box 757320, Fairbanks, AK 99775-7320, USA, and c) Alaska Division of Geological & Geophysical Surveys, 794 University Ave., Suite 200, Fairbanks, AK 99709, USA (URL: http://dggs.alaska.gov/).
Ambae
Vanuatu
15.389°S, 167.835°E; summit elev. 1496 m
All times are local (unless otherwise noted)
New lava flow, ash plumes, and sulfur dioxide plumes during February-May 2023
Ambae, also known as Aoba, is a large basaltic shield volcano in Vanuatu. A broad pyroclastic cone containing three crater lakes (Manaro Ngoru, Voui, and Manaro Lakua) is located at the summit within the youngest of at least two nested calderas. Periodic phreatic and pyroclastic explosions have been reported since the 16th century. A large eruption more than 400 years ago resulted in a volcanic cone within the summit crater that is now filled by Lake Voui; the similarly sized Lake Manaro fills the western third of the caldera. The previous eruption ended in August 2022 that was characterized by gas-and-steam and ash emissions and explosions of wet tephra (BGVN 47:10). This report covers a new eruption during February through May 2023 that consisted of a new lava flow, ash plumes, and sulfur dioxide emissions, using information from the Vanuatu Meteorology and Geo-Hazards Department (VMGD) and satellite data.
During the reporting period, the Alert Level remained at a 2 (on a scale of 0-5), which has been in place since December 2021. Activity during October 2022 through March 2023 remained relatively low and mostly consisted of gas-and-steam emissions in Lake Voui. VMGD reported that at 1300 on 15 November a satellite image captured a strong amount of sulfur dioxide rising above the volcano (figure 99), and that seismicity slightly increased. The southern and northern part of the island reported a strong sulfur dioxide smell and heard explosions. On 20 February 2023 a gas-and-ash plume rose 1.3 km above the summit and drifted SSW, according to a webcam image (figure 100). Gas-and-steam and possibly ash emissions continued on 23 February and volcanic earthquakes were recorded by the seismic network.
During April, volcanic earthquakes and gas-and-steam and ash emissions were reported from the cone in Lake Voui. VMGD reported that activity increased during 5-7 April; high gas-and-steam and ash plumes were visible, accompanied by nighttime incandescence. According to a Wellington VAAC report, a low-level ash plume rose as high as 2.5 km above the summit and drifted W and SW on 5 April, based on satellite imagery. Reports in Saratamata stated that a dark ash plume drifted to the WSW, but no loud explosion was heard. Webcam images from 2100 showed incandescence above the crater and reflected in the clouds. According to an aerial survey, field observations, and satellite data, water was no longer present in the lake. A lava flow was reported effusing from the vent and traveling N into the dry Lake Voui, which lasted three days. The next morning at 0745 on 6 April a gas-and-steam and ash plume rose 5.4 km above the summit and drifted ESE, based on information from VMGD (figure 101). The Wellington VAAC also reported that light ashfall was observed on the island. Intermittent gas-and-steam and ash emissions were visible on 7 April, some of which rose to an estimated 3 km above the summit and drifted E. Webcam images during 0107-0730 on 7 April showed continuing ash emissions. A gas-and-steam and ash plume rose 695 m above the summit crater at 0730 on 19 April and drifted ESE, based on a webcam image (figure 102).
According to visual and infrared satellite data, water was visible in Lake Voui as late as 24 March 2023 (figure 103). The vent in the caldera showed a gas-and-steam plume drifted SE. On 3 April thermal activity was first detected, accompanied by a gas-and-ash plume that drifted W (figure 103). The lava flow moved N within the dry lake and was shown cooling by 8 April. By 23 April much of the water in the lake had returned. Occasional sulfur dioxide plumes were detected by the TROPOMI instrument on the Sentinel-5P satellite that exceeded 2 Dobson Units (DU) and drifted in different directions (figure 104).
Geologic Background. The island of Ambae, also known as Aoba, is a massive 2,500 km3 basaltic shield that is the most voluminous volcano of the New Hebrides archipelago. A pronounced NE-SW-trending rift zone with numerous scoria cones gives the 16 x 38 km island an elongated form. A broad pyroclastic cone containing three crater lakes (Manaro Ngoru, Voui, and Manaro Lakua) is located at the summit within the youngest of at least two nested calderas, the largest of which is 6 km in diameter. That large central edifice is also called Manaro Voui or Lombenben volcano. Post-caldera explosive eruptions formed the summit craters about 360 years ago. A tuff cone was constructed within Lake Voui (or Vui) about 60 years later. The latest known flank eruption, about 300 years ago, destroyed the population of the Nduindui area near the western coast.
Information Contacts: Geo-Hazards Division, Vanuatu Meteorology and Geo-Hazards Department (VMGD), Ministry of Climate Change Adaptation, Meteorology, Geo-Hazards, Energy, Environment and Disaster Management, Private Mail Bag 9054, Lini Highway, Port Vila, Vanuatu (URL: http://www.vmgd.gov.vu/, https://www.facebook.com/VanuatuGeohazardsObservatory/); Wellington Volcanic Ash Advisory Centre (VAAC), Meteorological Service of New Zealand Ltd (MetService), PO Box 722, Wellington, New Zealand (URL: http://www.metservice.com/vaac/, http://www.ssd.noaa.gov/VAAC/OTH/NZ/messages.html); MIROVA (Middle InfraRed Observation of Volcanic Activity), a collaborative project between the Universities of Turin and Florence (Italy) supported by the Centre for Volcanic Risk of the Italian Civil Protection Department (URL: http://www.mirovaweb.it/); Global Sulfur Dioxide Monitoring Page, Atmospheric Chemistry and Dynamics Laboratory, NASA Goddard Space Flight Center (NASA/GSFC), 8800 Greenbelt Road, Goddard, Maryland, USA (URL: https://so2.gsfc.nasa.gov/); Copernicus Browser, Copernicus Data Space Ecosystem, European Space Agency (URL: https://dataspace.copernicus.eu/browser/).
Ibu
Indonesia
1.488°N, 127.63°E; summit elev. 1325 m
All times are local (unless otherwise noted)
Daily ash explosions continue, along with thermal anomalies in the crater, October 2022-May 2023
Persistent eruptive activity since April 2008 at Ibu, a stratovolcano on Indonesian’s Halmahera Island, has consisted of daily explosive ash emissions and plumes, along with observations of thermal anomalies (BGVN 47:04). The current eruption continued during October 2022-May 2023, described below, based on advisories issued by the Pusat Vulkanologi dan Mitigasi Bencana Geologi (PVMBG, also known as Indonesian Center for Volcanology and Geological Hazard Mitigation, CVGHM), daily reports by MAGMA Indonesia (a PVMBG platform), and the Darwin Volcanic Ash Advisory Centre (VAAC), and various satellite data. The Alert Level during the reporting period remained at 2 (on a scale of 1-4), except raised briefly to 3 on 27 May, and the public was warned to stay at least 2 km away from the active crater and 3.5 km away on the N side of the volcano.
According to MAGMA Indonesia, during October 2022-May 2023, daily gray-and-white ash plumes of variable densities rose 200-1,000 m above the summit and drifted in multiple directions. On 30 October and 11 November, plumes rose a maximum of 2 km and 1.5 km above the summit, respectively (figures 42 and 43). According to the Darwin VAAC, discrete ash emissions on 13 November rose to 2.1 km altitude, or 800 m above the summit, and drifted W, and multiple ash emissions on 15 November rose 1.4 km above the summit and drifted NE. Occasional larger ash explosions through May 2023 prompted PVMBG to issue Volcano Observatory Notice for Aviation (VONA) alerts (table 6); the Aviation Color Code remained at Orange throughout this period.
Table 6. Volcano Observatory Notice for Aviation (VONA) ash plume alerts for Ibu issued by PVMBG during October 2022-May 2023. Maximum height above the summit was estimated by a ground observer. VONAs in January-May 2023 all described the ash plumes as dense.
| Date |
Time (local) |
Max height above summit |
Direction |
| 17 Oct 2022 |
0858 |
800 m |
SW |
| 18 Oct 2022 |
1425 |
800 m |
S |
| 19 Oct 2022 |
2017 |
600 m |
SW |
| 21 Oct 2022 |
0916 |
800 m |
NW |
| 16 Jan 2023 |
1959 |
600 m |
NE |
| 22 Jan 2023 |
0942 |
1,000 m |
E |
| 29 Jan 2023 |
2138 |
1,000 m |
E |
| 10 May 2023 |
0940 |
800 m |
NW |
| 10 May 2023 |
2035 |
600 m |
E |
| 21 May 2023 |
2021 |
600 m |
W |
| 21 May 2023 |
2140 |
1,000 m |
W |
| 29 May 2023 |
1342 |
800 m |
N |
| 31 May 2023 |
1011 |
1,000 m |
SW |
Sentinel-2 L1C satellite images throughout the reporting period show two, sometimes three persistent thermal anomalies in the summit crater, with the most prominent hotspot from the top of a cone within the crater. Clear views were more common during March-April 2023, when a vent and lava flows on the NE flank of the intra-crater cone could be distinguished (figure 44). White-to-grayish emissions were also observed during brief periods when weather clouds allowed clear views.
The MIROVA space-based volcano hotspot detection system recorded almost daily thermal anomalies throughout the reporting period, though cloud cover often interfered with detections. Data from imaging spectroradiometers aboard NASA’s Aqua and Terra satellites and processed using the MODVOLC algorithm (MODIS-MODVOLC) recorded hotspots on one day during October 2022 and December 2022, two days in April 2023, three days in November 2022 and May 2023, and four days in March 2023.
Geologic Background. The truncated summit of Gunung Ibu stratovolcano along the NW coast of Halmahera Island has large nested summit craters. The inner crater, 1 km wide and 400 m deep, has contained several small crater lakes. The 1.2-km-wide outer crater is breached on the N, creating a steep-walled valley. A large cone grew ENE of the summit, and a smaller one to the WSW has fed a lava flow down the W flank. A group of maars is located below the N and W flanks. The first observed and recorded eruption was a small explosion from the summit crater in 1911. Eruptive activity began again in December 1998, producing a lava dome that eventually covered much of the floor of the inner summit crater along with ongoing explosive ash emissions.
Information Contacts: Pusat Vulkanologi dan Mitigasi Bencana Geologi (PVMBG, also known as Indonesian Center for Volcanology and Geological Hazard Mitigation, CVGHM), Jalan Diponegoro 57, Bandung 40122, Indonesia (URL: http://www.vsi.esdm.go.id/); MAGMA Indonesia (Multiplatform Application for Geohazard Mitigation and Assessment in Indonesia), Kementerian Energi dan Sumber Daya Mineral (URL: https://magma.esdm.go.id/v1); Copernicus Browser, Copernicus Data Space Ecosystem, European Space Agency (URL: https://dataspace.copernicus.eu/browser/); MIROVA (Middle InfraRed Observation of Volcanic Activity), a collaborative project between the Universities of Turin and Florence (Italy) supported by the Centre for Volcanic Risk of the Italian Civil Protection Department (URL: http://www.mirovaweb.it/); Hawai'i Institute of Geophysics and Planetology (HIGP) - MODVOLC Thermal Alerts System, School of Ocean and Earth Science and Technology (SOEST), Univ. of Hawai'i, 2525 Correa Road, Honolulu, HI 96822, USA (URL: http://modis.higp.hawaii.edu/).
Dukono
Indonesia
1.6992°N, 127.8783°E; summit elev. 1273 m
All times are local (unless otherwise noted)
Continuing ash emissions, SO2 plumes, and thermal signals during October 2022-May 2023
Dukono, a remote volcano on Indonesia’s Halmahera Island, has been erupting continuously since 1933, with frequent ash explosions and sulfur dioxide plumes (BGVN 46:11, 47:10). This activity continued during October 2022 through May 2023, based on reports from the Pusat Vulkanologi dan Mitigasi Bencana Geologi (PVMBG; also known as Indonesian Center for Volcanology and Geological Hazard Mitigation, CVGHM), the Darwin Volcanic Ash Advisory Centre (VAAC), and satellite data. During this period, the Alert Level remained at 2 (on a scale of 1-4) and the public was warned to remain outside of the 2-km exclusion zone. The highest reported plume of the period reached 9.4 km above the summit on 14 November 2022.
According to MAGMA Indonesia (a platform developed by PVMBG), white, gray, or dark plumes of variable densities were observed almost every day during the reporting period, except when fog obscured the volcano (figure 33). Plumes generally rose 25-450 m above the summit, but rose as high as 700-800 m on several days, somewhat lower than the maximum heights reached earlier in 2022 when plumes reached as high as 1 km. However, the Darwin VAAC reported that on 14 November 2022, a discrete ash plume rose 9.4 km above the summit (10.7 km altitude), accompanied by a strong hotspot and a sulfur dioxide signal observed in satellite imagery; a continuous ash plume that day and through the 15th rose to 2.1-2.4 km altitude and drifted NE.
Sentinel-2 images were obscured by weather clouds almost every viewing day during the reporting period. However, the few reasonably clear images showed a hotspot and white or gray emissions and plumes. Strong SO2 plumes from Dukono were present on many days during October 2022-May 2023, as detected using the TROPOMI instrument on the Sentinel-5P satellite (figure 34).
Geologic Background. Reports from this remote volcano in northernmost Halmahera are rare, but Dukono has been one of Indonesia's most active volcanoes. More-or-less continuous explosive eruptions, sometimes accompanied by lava flows, have occurred since 1933. During a major eruption in 1550 CE, a lava flow filled in the strait between Halmahera and the N-flank Gunung Mamuya cone. This complex volcano presents a broad, low profile with multiple summit peaks and overlapping craters. Malupang Wariang, 1 km SW of the summit crater complex, contains a 700 x 570 m crater that has also been active during historical time.
Information Contacts: Pusat Vulkanologi dan Mitigasi Bencana Geologi (PVMBG, also known as Indonesian Center for Volcanology and Geological Hazard Mitigation, CVGHM), Jalan Diponegoro 57, Bandung 40122, Indonesia (URL: http://www.vsi.esdm.go.id/); MAGMA Indonesia (Multiplatform Application for Geohazard Mitigation and Assessment in Indonesia), Kementerian Energi dan Sumber Daya Mineral (URL: https://magma.esdm.go.id/v1); Darwin Volcanic Ash Advisory Centre (VAAC), Bureau of Meteorology, Northern Territory Regional Office, PO Box 40050, Casuarina, NT 0811, Australia (URL: http://www.bom.gov.au/info/vaac/); NASA Global Sulfur Dioxide Monitoring Page, Atmospheric Chemistry and Dynamics Laboratory, NASA Goddard Space Flight Center (NASA/GSFC), 8800 Greenbelt Road, Goddard, Maryland, USA (URL: https://so2.gsfc.nasa.gov/); Sentinel Hub Playground (URL: https://www.sentinel-hub.com/explore/sentinel-playground).
Sabancaya
Peru
15.787°S, 71.857°W; summit elev. 5960 m
All times are local (unless otherwise noted)
Explosions, gas-and-ash plumes, and thermal activity persist during November 2022-April 2023
Sabancaya is located in Peru, NE of Ampato and SE of Hualca Hualca. Eruptions date back to 1750 and have been characterized by explosions, phreatic activity, ash plumes, and ashfall. The current eruption period began in November 2016 and has more recently consisted of daily explosions, gas-and-ash plumes, and thermal activity (BGVN 47:11). This report updates activity during November 2022 through April 2023 using information from Instituto Geophysico del Peru (IGP) that use weekly activity reports and various satellite data.
Intermittent low-to-moderate power thermal anomalies were reported by the MIROVA project during November 2022 through April 2023 (figure 119). There were few short gaps in thermal activity during mid-December 2022, late December-to-early January 2023, late January to mid-February, and late February. According to data recorded by the MODVOLC thermal algorithm, there were a total of eight thermal hotspots: three in November 2022, three in February 2023, one in March, and one in April. On clear weather days, some of this thermal anomaly was visible in infrared satellite imagery showing the active lava dome in the summit crater (figure 120). Almost daily moderate-to-strong sulfur dioxide plumes were recorded during the reporting period by the TROPOMI instrument on the Sentinel-5P satellite (figure 121). Many of these plumes exceeded 2 Dobson Units (DU) and drifted in multiple directions.
IGP reported that moderate activity during November and December 2022 continued; during November, an average number of explosions were reported each week: 30, 33, 36, and 35, and during December, it was 32, 40, 47, 52, and 67. Gas-and-ash plumes in November rose 3-3.5 km above the summit and drifted E, NE, SE, S, N, W, and SW. During December the gas-and-ash plumes rose 2-4 km above the summit and drifted in different directions. There were 1,259 volcanic earthquakes recorded during November and 1,693 during December. Seismicity also included volcano-tectonic-type events that indicate rock fracturing events. Slight inflation was observed in the N part of the volcano near Hualca Hualca (4 km N). Thermal activity was frequently reported in the crater at the active lava dome (figure 120).
Explosive activity continued during January and February 2023. The average number of explosions were reported each week during January (51, 50, 60, and 59) and February (43, 54, 51, and 50). Gas-and-ash plumes rose 1.6-2.9 km above the summit and drifted NW, SW, and W during January and rose 1.4-2.8 above the summit and drifted W, SW, E, SE, N, S, NW, and NE during February. IGP also detected 1,881 volcanic earthquakes during January and 1,661 during February. VT-type earthquakes were also reported. Minor inflation persisted near Hualca Hualca. Satellite imagery showed continuous thermal activity in the crater at the lava dome (figure 120).
During March, the average number of explosions each week was 46, 48, 31, 35, and 22 and during April, it was 29, 41, 31, and 27. Accompanying gas-and-ash plumes rose 1.7-2.6 km above the summit crater and drifted W, SW, NW, S, and SE during March. According to a Buenos Aires Volcano Ash Advisory Center (VAAC) notice, on 22 March at 1800 through 23 March an ash plume rose to 7 km altitude and drifted NW. By 0430 an ash plume rose to 7.6 km altitude and drifted W. On 24 and 26 March continuous ash emissions rose to 7.3 km altitude and drifted SW and on 28 March ash emissions rose to 7.6 km altitude. During April, gas-and-ash plumes rose 1.6-2.5 km above the summit and drifted W, SW, S, NW, NE, and E. Frequent volcanic earthquakes were recorded, with 1,828 in March and 1,077 in April, in addition to VT-type events. Thermal activity continued to be reported in the summit crater at the lava dome (figure 120).
Geologic Background. Sabancaya, located in the saddle NE of Ampato and SE of Hualca Hualca volcanoes, is the youngest of these volcanic centers and the only one to have erupted in historical time. The oldest of the three, Nevado Hualca Hualca, is of probable late-Pliocene to early Pleistocene age. The name Sabancaya (meaning "tongue of fire" in the Quechua language) first appeared in records in 1595 CE, suggesting activity prior to that date. Holocene activity has consisted of Plinian eruptions followed by emission of voluminous andesitic and dacitic lava flows, which form an extensive apron around the volcano on all sides but the south. Records of historical eruptions date back to 1750.
Information Contacts: Instituto Geofisico del Peru (IGP), Centro Vulcanológico Nacional (CENVUL), Calle Badajoz N° 169 Urb. Mayorazgo IV Etapa, Ate, Lima 15012, Perú (URL: https://www.igp.gob.pe/servicios/centro-vulcanologico-nacional/inicio); Buenos Aires Volcanic Ash Advisory Center (VAAC), Servicio Meteorológico Nacional-Fuerza Aérea Argentina, 25 de mayo 658, Buenos Aires, Argentina (URL: http://www.smn.gov.ar/vaac/buenosaires/inicio.php); MIROVA (Middle InfraRed Observation of Volcanic Activity), a collaborative project between the Universities of Turin and Florence (Italy) supported by the Centre for Volcanic Risk of the Italian Civil Protection Department (URL: http://www.mirovaweb.it/); Hawai'i Institute of Geophysics and Planetology (HIGP) - MODVOLC Thermal Alerts System, School of Ocean and Earth Science and Technology (SOEST), Univ. of Hawai'i, 2525 Correa Road, Honolulu, HI 96822, USA (URL: http://modis.higp.hawaii.edu/); NASA Global Sulfur Dioxide Monitoring Page, Atmospheric Chemistry and Dynamics Laboratory, NASA Goddard Space Flight Center (NASA/GSFC), 8800 Greenbelt Road, Goddard MD 20771, USA (URL: https://so2.gsfc.nasa.gov/); Copernicus Browser, Copernicus Data Space Ecosystem, European Space Agency (URL: https://dataspace.copernicus.eu/browser/).
Sheveluch
Russia
56.653°N, 161.36°E; summit elev. 3283 m
All times are local (unless otherwise noted)
Significant explosions destroyed part of the lava-dome complex during April 2023
Sheveluch (also spelled Shiveluch) in Kamchatka, has had at least 60 large eruptions during the last 10,000 years. The summit is truncated by a broad 9-km-wide caldera that is breached to the S, and many lava domes occur on the outer flanks. The lava dome complex was constructed within the large open caldera. Frequent collapses of the dome complex have produced debris avalanches; the resulting deposits cover much of the caldera floor. A major south-flank collapse during a 1964 Plinian explosion produced a scarp in which a “Young Sheveluch” dome began to form in 1980. Repeated episodes of dome formation and destruction since then have produced major and minor ash plumes, pyroclastic flows, block-and-ash flows, and “whaleback domes” of spine-like extrusions in 1993 and 2020 (BGVN 45:11). The current eruption period began in August 1999 and has more recently consisted of lava dome growth, explosions, ash plumes, and avalanches (BGVN 48:01). This report covers a significant explosive eruption during early-to-mid-April 2023 that generated a 20 km altitude ash plume, produced a strong sulfur dioxide plume, and destroyed part of the lava-dome complex; activity described during January through April 2023 use information primarily from the Kamchatka Volcanic Eruptions Response Team (KVERT) and various satellite data.
Satellite data. Activity during the majority of this reporting period was characterized by continued lava dome growth, strong fumarole activity, explosions, and hot avalanches. According to the MODVOLC Thermal Alerts System, 140 hotspots were detected through the reporting period, with 33 recorded in January 2023, 29 in February, 44 in March, and 34 in April. Frequent strong thermal activity was recorded during January 2023 through April, according to the MIROVA (Middle InfraRed Observation of Volcanic Activity) graph and resulted from the continuously growing lava dome (figure 94). A slightly stronger pulse in thermal activity was detected in early-to-mid-April, which represented the significant eruption that destroyed part of the lava-dome complex. Thermal anomalies were also visible in infrared satellite imagery at the summit crater (figure 95).
During January 2023 KVERT reported continued growth of the lava dome, accompanied by strong fumarolic activity, incandescence from the lava dome, explosions, ash plumes, and avalanches. Satellite data showed a daily thermal anomaly over the volcano. Video data showed ash plumes associated with collapses at the dome that generated avalanches that in turn produced ash plumes rising to 3.5 km altitude and drifting 40 km W on 4 January and rising to 7-7.5 km altitude and drifting 15 km SW on 5 January. A gas-and-steam plume containing some ash that was associated with avalanches rose to 5-6 km altitude and extended 52-92 km W on 7 January. Explosions that same day produced ash plumes that rose to 7-7.5 km altitude and drifted 10 km W. According to a Volcano Observatory Notice for Aviation (VONA) issued at 1344 on 19 January, explosions produced an ash cloud that was 15 x 25 km in size and rose to 9.6-10 km altitude, drifting 21-25 km W; as a result, the Aviation Color Code (ACC) was raised to Red (the highest level on a four-color scale). Another VONA issued at 1635 reported that no more ash plumes were observed, and the ACC was lowered to Orange (the second highest level on a four-color scale). On 22 January an ash plume from collapses and avalanches rose to 5 km altitude and drifted 25 km NE and SW; ash plumes associated with collapses extended 70 km NE on 27 and 31 January.
Lava dome growth, fumarolic activity, dome incandescence, and occasional explosions and avalanches continued during February and March. A daily thermal anomaly was visible in satellite data. Explosions on 1 February generated ash plumes that rose to 6.3-6.5 km altitude and extended 15 km NE. Video data showed an ash cloud from avalanches rising to 5.5 km altitude and drifting 5 km SE on 2 February. Satellite data showed gas-and-steam plumes containing some ash rose to 5-5.5 km altitude and drifted 68-110 km ENE and NE on 6 February, to 4.5-5 km altitude and drifted 35 km WNW on 22 February, and to 3.7-4 km altitude and drifted 47 km NE on 28 February. Scientists from the Kamchatka Volcanological Station (KVS) went on a field excursion on 25 February to document the growing lava dome, and although it was cloudy most of the day, nighttime incandescence was visible. Satellite data showed an ash plume extending up to 118 km E during 4-5 March. Video data from 1150 showed an ash cloud from avalanches rose to 3.7-5.5 km altitude and drifted 5-10 km ENE and E on 5 March. On 11 March an ash plume drifted 62 km E. On 27 March ash plumes rose to 3.5 km altitude and drifted 100 km E. Avalanches and constant incandescence at the lava dome was focused on the E and NE slopes on 28 March. A gas-and-steam plume containing some ash rose to 3.5 km altitude and moved 40 km E on 29 March. Ash plumes on 30 March rose to 3.5-3.7 km altitude and drifted 70 km NE.
Similar activity continued during April, with lava dome growth, strong fumarolic activity, incandescence in the dome, occasional explosions, and avalanches. A thermal anomaly persisted throughout the month. During 1-4 April weak ash plumes rose to 2.5-3 km altitude and extended 13-65 km SE and E.
Activity during 11 April 2023. The Institute of Volcanology and Seismology, Far Eastern Branch, Russian Academy of Sciences (IVS FEB RAS) reported a significant increase in seismicity around 0054 on 11 April, as reported by strong explosions detected on 11 April beginning at 0110 that sent ash plumes up to 7-10 km altitude and extended 100-435 km W, WNW, NNW, WSW, and SW. According to a Tokyo VAAC report the ash plume rose to 15.8 km altitude. By 0158 the plume extended over a 75 x 100 km area. According to an IVS FEB RAS report, the eruptive column was not vertical: the initial plume at 0120 on 11 April deviated to the NNE, at 0000 on 12 April, it drifted NW, and by 1900 it drifted SW. KVS reported that significant pulses of activity occurred at around 0200, 0320, and then a stronger phase around 0600. Levin Dmitry took a video from near Békés (3 km away) at around 0600 showing a rising plume; he also reported that a pyroclastic flow traveled across the road behind him as he left the area. According to IVS FEB RAS, the pyroclastic flow traveled several kilometers SSE, stopping a few hundred meters from a bridge on the road between Klyuchi and Petropavlovsk-Kamchatsky.
Ashfall was first observed in Klyuchi (45 km SW) at 0630, and a large, black ash plume blocked light by 0700. At 0729 KVERT issued a Volcano Observatory Notice for Aviation (VONA) raising the Aviation Color Code to Red (the highest level on a four-color scale). It also stated that a large ash plume had risen to 10 km altitude and drifted 100 km W. Near-constant lightning strikes were reported in the plume and sounds like thunderclaps were heard until about 1000. According to IVS FEB RAS the cloud was 200 km long and 76 km wide by 0830, and was spreading W at altitudes of 6-12 km. In the Klyuchi Village, the layer of both ash and snow reached 8.5 cm (figure 96); ashfall was also reported in Kozyrevsk (112 km SW) at 0930, Mayskoye, Anavgay, Atlasovo, Lazo, and Esso. Residents in Klyuchi reported continued darkness and ashfall at 1100. In some areas, ashfall was 6 cm deep and some residents reported dirty water coming from their plumbing. According to IVS FEB RAS, an ash cloud at 1150 rose to 5-20 km altitude and was 400 km long and 250 km wide, extending W. A VONA issued at 1155 reported that ash had risen to 10 km and drifted 340 km NNW and 240 km WSW. According to Simon Carn (Michigan Technological University), about 0.2 Tg of sulfur dioxide in the plume was measured in a satellite image from the TROPOMI instrument on the Sentinel-5P satellite acquired at 1343 that covered an area of about 189,000 km2 (figure 97). Satellite data at 1748 showed an ash plume that rose to 8 km altitude and drifted 430 km WSW and S, according to a VONA.
Activity during 12-15 April 2023. On 12 April at 0730 satellite images showed ash plumes rose to 7-8 km altitude and extended 600 km SW, 1,050 km ESE, and 1,300-3,000 km E. By 1710 that day, the explosions weakened. According to news sources, the ash-and-gas plumes drifted E toward the Aleutian Islands and reached the Gulf of Alaska by 13 April, causing flight disruptions. More than 100 flights involving Alaska airspace were cancelled due to the plume. Satellite data showed ash plumes rising to 4-5.5 km altitude and drifted 400-415 km SE and ESE on 13 April. KVS volcanologists observed the pyroclastic flow deposits and noted that steam rose from downed, smoldering trees. They also noted that the deposits were thin with very few large fragments, which differed from previous flows. The ash clouds traveled across the Pacific Ocean. Flight cancellations were also reported in NW Canada (British Columbia) during 13-14 April. During 14-15 April ash plumes rose to 6 km altitude and drifted 700 km NW.
Alaskan flight schedules were mostly back to normal by 15 April, with only minor delays and far less cancellations; a few cancellations continued to be reported in Canada. Clear weather on 15 April showed that most of the previous lava-dome complex was gone and a new crater roughly 1 km in diameter was observed (figure 98); gas-and-steam emissions were rising from this crater. Evidence suggested that there had been a directed blast to the SE, and pyroclastic flows traveled more than 20 km. An ash plume rose to 4.5-5.2 km altitude and drifted 93-870 km NW on 15 April.
Activity during 16-30 April 2023. Resuspended ash was lifted by the wind from the slopes and rose to 4 km altitude and drifted 224 km NW on 17 April. KVERT reported a plume of resuspended ash from the activity during 10-13 April on 19 April that rose to 3.5-4 km altitude and drifted 146-204 km WNW. During 21-22 April a plume stretched over the Scandinavian Peninsula. A gas-and-steam plume containing some ash rose to 3-3.5 km altitude and drifted 60 km SE on 30 April. A possible new lava dome was visible on the W slope of the volcano on 29-30 April (figure 99); satellite data showed two thermal anomalies, a bright one over the existing lava dome and a weaker one over the possible new one.
References. Girina, O., Loupian, E., Horvath, A., Melnikov, D., Manevich, A., Nuzhdaev, A., Bril, A., Ozerov, A., Kramareva, L., Sorokin, A., 2023, Analysis of the development of the paroxysmal eruption of Sheveluch volcano on April 10–13, 2023, based on data from various satellite systems, ??????????? ???????? ??? ?? ???????, 20(2).
Geologic Background. The high, isolated massif of Sheveluch volcano (also spelled Shiveluch) rises above the lowlands NNE of the Kliuchevskaya volcano group. The 1,300 km3 andesitic volcano is one of Kamchatka's largest and most active volcanic structures, with at least 60 large eruptions during the Holocene. The summit of roughly 65,000-year-old Stary Shiveluch is truncated by a broad 9-km-wide late-Pleistocene caldera breached to the south. Many lava domes occur on its outer flanks. The Molodoy Shiveluch lava dome complex was constructed during the Holocene within the large open caldera; Holocene lava dome extrusion also took place on the flanks of Stary Shiveluch. Widespread tephra layers from these eruptions have provided valuable time markers for dating volcanic events in Kamchatka. Frequent collapses of dome complexes, most recently in 1964, have produced debris avalanches whose deposits cover much of the floor of the breached caldera.
Information Contacts: Kamchatka Volcanic Eruptions Response Team (KVERT), Far Eastern Branch, Russian Academy of Sciences, 9 Piip Blvd., Petropavlovsk-Kamchatsky, 683006, Russia (URL: http://www.kscnet.ru/ivs/kvert/); Institute of Volcanology and Seismology, Far Eastern Branch, Russian Academy of Sciences (IVS FEB RAS), 9 Piip Blvd., Petropavlovsk-Kamchatsky 683006, Russia (URL: http://www.kscnet.ru/ivs/eng/); Kamchatka Volcanological Station, Kamchatka Branch of Geophysical Survey, (KB GS RAS), Klyuchi, Kamchatka Krai, Russia (URL: http://volkstat.ru/); Hawai'i Institute of Geophysics and Planetology (HIGP) - MODVOLC Thermal Alerts System, School of Ocean and Earth Science and Technology (SOEST), Univ. of Hawai'i, 2525 Correa Road, Honolulu, HI 96822, USA (URL: http://modis.higp.hawaii.edu/); MIROVA (Middle InfraRed Observation of Volcanic Activity), a collaborative project between the Universities of Turin and Florence (Italy) supported by the Centre for Volcanic Risk of the Italian Civil Protection Department (URL: http://www.mirovaweb.it/); Copernicus Browser, Copernicus Data Space Ecosystem, European Space Agency (URL: https://dataspace.copernicus.eu/browser/); Kam 24 News Agency, 683032, Kamchatka Territory, Petropavlovsk-Kamchatsky, Vysotnaya St., 2A (URL: https://kam24.ru/news/main/20230411/96657.html#.Cj5Jrky6.dpuf); Simon Carn, Geological and Mining Engineering and Sciences, Michigan Technological University, 1400 Townsend Drive, Houghton, MI 49931, USA (URL: http://www.volcarno.com/, Twitter: @simoncarn).
Bezymianny
Russia
55.972°N, 160.595°E; summit elev. 2882 m
All times are local (unless otherwise noted)
Explosions, ash plumes, lava flows, and avalanches during November 2022-April 2023
Bezymianny is located on the Kamchatka Peninsula of Russia as part of the Klyuchevskoy volcano group. Historic eruptions began in 1955 and have been characterized by dome growth, explosions, pyroclastic flows, ash plumes, and ashfall. During the 1955-56 eruption a large open crater was formed by collapse of the summit and an associated lateral blast. Subsequent episodic but ongoing lava-dome growth, accompanied by intermittent explosive activity and pyroclastic flows, has largely filled the 1956 crater. The current eruption period began in December 2016 and more recent activity has consisted of strong explosions, ash plumes, and thermal activity (BGVN 47:11). This report covers activity during November 2022 through April 2023, based on weekly and daily reports from the Kamchatka Volcano Eruptions Response Team (KVERT) and satellite data.
Activity during November and March 2023 was relatively low and mostly consisted of gas-and-steam emissions, occasional small collapses that generated avalanches along the lava dome slopes, and a persistent thermal anomaly over the volcano that was observed in satellite data on clear weather days. According to the Tokyo VAAC and KVERT, an explosion produced an ash plume that rose to 6 km altitude and drifted 25 km NE at 1825 on 29 March.
Gas-and-steam emissions, collapses generating avalanches, and thermal activity continued during April. According to two Volcano Observatory Notice for Aviation (VONA) issued on 2 and 6 April (local time) ash plumes rose to 3 km and 3.5-3.8 km altitude and drifted 35 km E and 140 km E, respectively. Satellite data from KVERT showed weak ash plumes extending up to 550 km E on 2 and 5-6 April.
A VONA issued at 0843 on 7 April described an ash plume that rose to 4.5-5 km altitude and drifted 250 km ESE. Later that day at 1326 satellite data showed an ash plume that rose to 5.5-6 km altitude and drifted 150 km ESE. A satellite image from 1600 showed an ash plume extending as far as 230 km ESE; KVERT noted that ash emissions were intensifying, likely due to avalanches from the growing lava dome. The Aviation Color Code (ACC) was raised to Red (the highest level on a four-color scale). At 1520 satellite data showed an ash plume rising to 5-5.5 km altitude and drifting 230 km ESE. That same day, Kamchatka Volcanological Station (KVS) volcanologists traveled to Ambon to collect ash; they reported that a notable eruption began at 1730, and within 20 minutes a large ash plume rose to 10 km altitude and drifted NW. KVERT reported that the strong explosive phase began at 1738. Video and satellite data taken at 1738 showed an ash plume that rose to 10-12 km altitude and drifted up to 2,800 km SE and E. Explosions were clearly audible 20 km away for 90 minutes, according to KVS. Significant amounts of ash fell at the Apakhonchich station, which turned the snow gray; ash continued to fall until the morning of 8 April. In a VONA issued at 0906 on 8 April, KVERT stated that the explosive eruption had ended; ash plumes had drifted 2,000 km E. The ACC was lowered to Orange (the third highest level on a four-color scale). The KVS team saw a lava flow on the active dome once the conditions were clear that same day (figure 53). On 20 April lava dome extrusion was reported; lava flows were noted on the flanks of the dome, and according to KVERT satellite data, a thermal anomaly was observed in the area. The ACC was lowered to Yellow (the second lowest on a four-color scale).
Satellite data showed an increase in thermal activity beginning in early April 2023. A total of 31 thermal hotspots were detected by the MODVOLC thermal algorithm on 4, 5, 7, and 12 April 2023. The elevated thermal activity resulted from an increase in explosive activity and the start of an active lava flow. The MIROVA (Middle InfraRed Observation of Volcanic Activity) volcano hotspot detection system based on the analysis of MODIS data also showed a pulse in thermal activity during the same time (figure 54). Infrared satellite imagery captured a continuous thermal anomaly at the summit crater, often accompanied by white gas-and-steam emissions (figure 55). On 4 April 2023 an active lava flow was observed descending the SE flank.
Geologic Background. The modern Bezymianny, much smaller than its massive neighbors Kamen and Kliuchevskoi on the Kamchatka Peninsula, was formed about 4,700 years ago over a late-Pleistocene lava-dome complex and an edifice built about 11,000-7,000 years ago. Three periods of intensified activity have occurred during the past 3,000 years. The latest period, which was preceded by a 1,000-year quiescence, began with the dramatic 1955-56 eruption. This eruption, similar to that of St. Helens in 1980, produced a large open crater that was formed by collapse of the summit and an associated lateral blast. Subsequent episodic but ongoing lava-dome growth, accompanied by intermittent explosive activity and pyroclastic flows, has largely filled the 1956 crater.
Information Contacts: Kamchatka Volcanic Eruptions Response Team (KVERT), Far Eastern Branch, Russian Academy of Sciences, 9 Piip Blvd., Petropavlovsk-Kamchatsky, 683006, Russia (URL: http://www.kscnet.ru/ivs/kvert/); Kamchatka Volcanological Station, Kamchatka Branch of Geophysical Survey, (KB GS RAS), Klyuchi, Kamchatka Krai, Russia (URL: http://volkstat.ru/); Hawai'i Institute of Geophysics and Planetology (HIGP) - MODVOLC Thermal Alerts System, School of Ocean and Earth Science and Technology (SOEST), Univ. of Hawai'i, 2525 Correa Road, Honolulu, HI 96822, USA (URL: http://modis.higp.hawaii.edu/); MIROVA (Middle InfraRed Observation of Volcanic Activity), a collaborative project between the Universities of Turin and Florence (Italy) supported by the Centre for Volcanic Risk of the Italian Civil Protection Department (URL: http://www.mirovaweb.it/); Copernicus Browser, Copernicus Data Space Ecosystem, European Space Agency (URL: https://dataspace.copernicus.eu/browser/).
Chikurachki
Russia
50.324°N, 155.461°E; summit elev. 1781 m
All times are local (unless otherwise noted)
New explosive eruption during late January-early February 2023
Chikurachki, located on Paramushir Island in the northern Kuriles, has had Plinian eruptions during the Holocene. Lava flows have reached the sea and formed capes on the NW coast; several young lava flows are also present on the E flank beneath a scoria deposit. Reported eruptions date back to 1690, with the most recent eruption period occurring during January through October 2022, characterized by occasional explosions, ash plumes, and thermal activity (BGVN 47:11). This report covers a new eruptive period during January through February 2023 that consisted of ash explosions and ash plumes, based on information from the Kamchatka Volcanic Eruptions Response Team (KVERT) and satellite data.
According to reports from KVERT, an explosive eruption began around 0630 on 29 January. Explosions generated ash plumes that rose to 3-3.5 km altitude and drifted 6-75 km SE and E, based on satellite data. As a result, the Aviation Color Code (ACC) was raised to Orange (the second highest level on a four-color scale). At 1406 and 1720 ash plumes were identified in satellite images that rose to 4.3 km altitude and extended 70 km E. By 2320 the ash plume had dissipated. A thermal anomaly was visible at the volcano on 31 January, according to a satellite image, and an ash plume was observed drifting 66 km NE.
Occasional explosions and ash plumes continued during early February. At 0850 on 1 February an ash plume rose to 3.5 km altitude and drifted 35 km NE. Satellite data showed an ash plume that rose to 3.2-3.5 km altitude and drifted 50 km NE at 1222 later that day (figure 22). A thermal anomaly was detected over the volcano during 5-6 February and ash plumes drifted as far as 125 km SE, E, and NE. Explosive events were reported at 0330 on 6 February that produced ash plumes rising to 4-4.5 km altitude and drifting 72-90 km N, NE, and ENE. KVERT noted that the last gas-and steam plume that contained some ash was observed on 8 February and drifted 55 km NE before the explosive eruption ended. The ACC was lowered to Yellow and then Green (the lowest level on a four-color scale) on 18 February.
Geologic Background. Chikurachki, the highest volcano on Paramushir Island in the northern Kuriles, is a relatively small cone constructed on a high Pleistocene edifice. Oxidized basaltic-to-andesitic scoria deposits covering the upper part of the young cone give it a distinctive red color. Frequent basaltic Plinian eruptions have occurred during the Holocene. Lava flows have reached the sea and formed capes on the NW coast; several young lava flows are also present on the E flank beneath a scoria deposit. The Tatarinov group of six volcanic centers is located immediately to the south, and the Lomonosov cinder cone group, the source of an early Holocene lava flow that reached the saddle between it and Fuss Peak to the west, lies at the southern end of the N-S-trending Chikurachki-Tatarinov complex. In contrast to the frequently active Chikurachki, the Tatarinov centers are extensively modified by erosion and have a more complex structure. Tephrochronology gives evidence of an eruption around 1690 CE from Tatarinov, although its southern cone contains a sulfur-encrusted crater with fumaroles that were active along the margin of a crater lake until 1959.
Information Contacts: Kamchatka Volcanic Eruptions Response Team (KVERT), Far East Division, Russian Academy of Sciences, 9 Piip Blvd., Petropavlovsk-Kamchatsky, 683006, Russia (URL: http://www.kscnet.ru/ivs/); Copernicus Browser, Copernicus Data Space Ecosystem, European Space Agency (URL: https://dataspace.copernicus.eu/browser/).
Search Bulletin Archive by Publication Date
Select a month and year from the drop-downs and click "Show Issue" to have that issue displayed in this tab.
The default month and year is the latest issue available.
Bulletin of the Global Volcanism Network - Volume 23, Number 08 (August 1998)
Managing Editor: Richard Wunderman
Azul, Cerro (Ecuador)
Flank and caldera fissure eruption; helicopter tortoise-rescue
Chichon, El (Mexico)
Changes in hydrothermal activity noticed in April
Chiginagak (United States)
Ash, gas-and-steam plume on 13 August
Dieng Volcanic Complex (Indonesia)
Plumes and earthquakes in early July
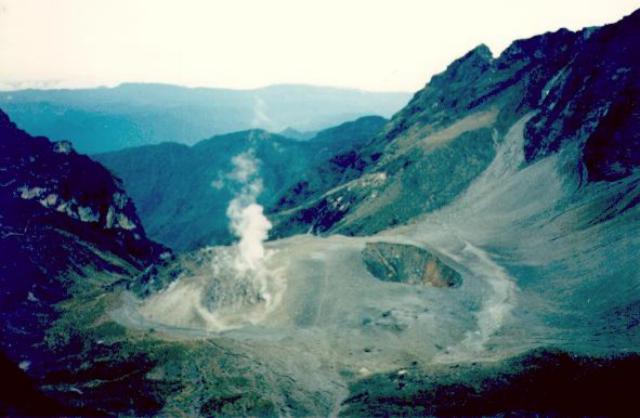
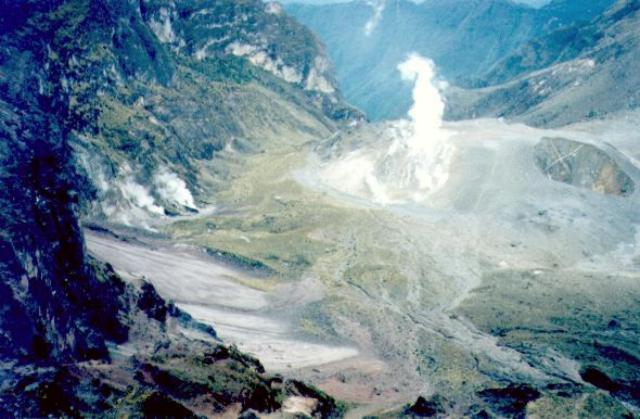
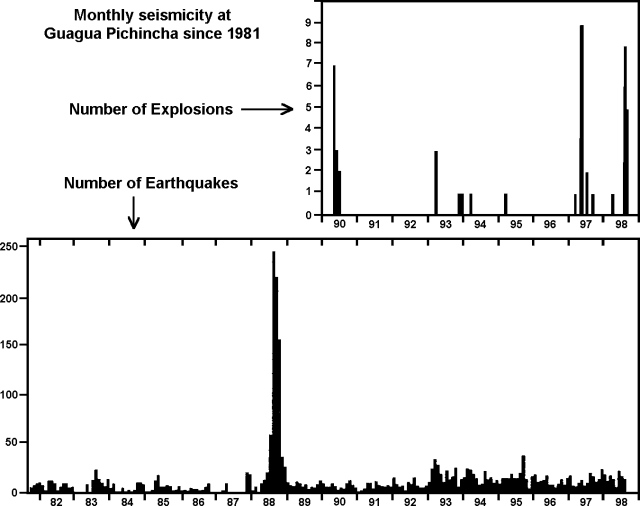
Guagua Pichincha (Ecuador)
Phreatic discharges reappear after robust off-flank seismicity
Karymsky (Russia)
Explosions and blowouts on 26 July
Kerinci (Indonesia)
Plume rises to 2 km on 4 July
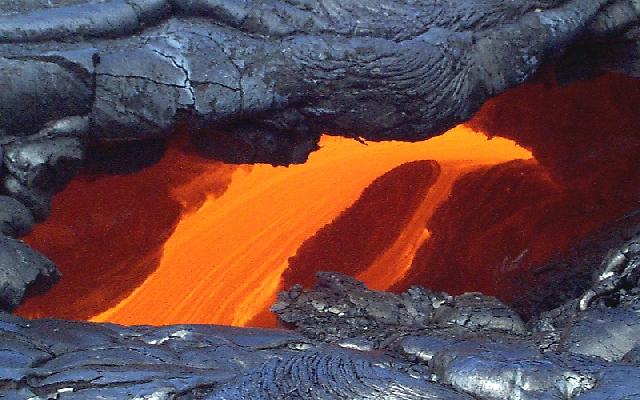
Kilauea (United States)
Eruptive pause (No. 20) followed by a new pahoehoe flow to the sea
Klyuchevskoy (Russia)
Gas-and-ash explosions during 23-25 July
Langila (Papua New Guinea)
Weak vapor and ash emissions continue
Lokon-Empung (Indonesia)
Noteworthy plume and slight increase in seismic activity
Manam (Papua New Guinea)
Weak emissions of white vapor during July and August
Merapi (Indonesia)
Details of July eruptions, new monitoring equipment
Popocatepetl (Mexico)
Moderate, intermittent ash emissions continue
Rabaul (Papua New Guinea)
Scattered ash emissions during July and August
Sabancaya (Peru)
Increases in August gas emissions
Sheveluch (Russia)
Series of shallow earthquakes in late July
Whakaari/White Island (New Zealand)
Non-seismic eruptions confirmed during 31 August visit
Cerro Azul (Ecuador) — August 1998 Cite this Report
Cerro Azul
Ecuador
0.92°S, 91.408°W; summit elev. 1640 m
All times are local (unless otherwise noted)
Flank and caldera fissure eruption; helicopter tortoise-rescue
New eruptive activity at Cerro Azul on Isabela Island was first recognized on 15 September by a satellite-based monitoring system (GOES Hotspot Monitoring System) under development by the Hawaii Space Grant Consortium. The first visual observations were from the town of Villamil, 55 km E of the volcano, and were reported to the Charles Darwin Research Station (CDRS) on Santa Cruz Island around 1800 that day. The eruption was from a radial fissure on the SE slope with at least two vents in the summit caldera. The last recorded eruption of Cerro Azul, in 1979, was from a vent very close to the current radial fissure, with lesser activity in the caldera. The region is uninhabited by humans, but is close to nesting zones of endangered Galápagos tortoises. We expect to publish a more complete report in next month's Bulletin.
Fissure eruption. The eruption began just after local noon on 15 September. A thermal anomaly appeared on a satellite image at 1246 that was not on the previous image at 1215. Eight earthquakes were recorded from 1229 to 1304 by the new multi-island Galápagos network (see BGVN 22:08); these and one epicenter the next day plotted on the volcano's E flank. The hypocenters of these earthquakes occurred at depths of less than ~7 km.
During an overflight at midday on 17 September observers estimated the fissure as ~1 km long, oriented roughly E-W, and at an elevation of 620-640 m on the volcano's SE slopes. The erupting fissure discharged three constant lava fountains, along with other intermittent fountains, to heights of 200-300 m. The principal lava flow extended ~8 km E by 1230 on 17 September.
Observers on an overflight at 1146 on 18 September noted that the flow had progressed another 2.3 km. The flow consisted of cooled levees surrounding a central, fast-flowing river of lava that was orange along most of its length. No lava tunnels were seen. The flow front moved at an average rate of 168 m/hour until 17 September, but slowed to ~100 m/hour when it reached flatter terrain. The flow averaged 500 m wide, broadening slightly at the volcano's base. Lava had covered no more than 5 km2 by 1330 on 17 September. Small fires associated with the flow did not appear to be spreading. By 18 September, new lava had reached older flows that extend N-S between Cerro Azul and Sierra Negra volcano. The flow then turned S and was 7.6 km from the sea by late on 18 September.
Activity within the caldera. Caldera eruptions likely began sometime between noon on 16 September and the morning of 17 September, but this remains to be confirmed. At 1230 on 17 September two lava flows, each <2 km long, had reached the ephemeral caldera lake. The lava flows in the caldera covered an area of ~4 km2. The steam cloud generated where the lava flows entered the lake looked like a narrow thunderhead reaching 2,600 m as measured by airplane altimeter. Lava from a fissure on a bench along the S caldera wall reached the lake where a pre-existing tuff ring was visible on satellite images. The tuff ring contains another lake, but no lava reached it. Lava from a vent on the caldera floor reached the lake from the opposite direction. No glowing lava was visible in the caldera, but observers flying directly over on 17 September (at ~2,100 m altitude) noticed a strong smell of sulfur.
Threat to tortoises. Human activities have severely reduced populations of two types of Galápagos tortoises. In the past, island residents and whaling crews hunted the tortoises to near extinction. For the last 100 years these populations have been unable to recover due to introduced species (dogs, pigs, and ants) that prey upon nests and hatchlings. One of these two tortoise species has been reduced to fewer than 100 individuals.
The Galápagos National Park Service and CDRS decided to remove tortoises from the affected region, incorporating adults from the more endangered species into their captive breeding and repatriation program. An initial helicopter operation was completed on 1 October, but seven tortoises were apparently killed by lava or associated fires. The 11 tortoises removed were only about half the number needed to establish a serious restoration program. The operation lacks funding for continued access to a helicopter. As a result, another 10 tortoises must be carried out by hand over rugged terrain consisting of aa lava covered by dense thorny vegetation. Adults can weigh up to 225 kg and can travel up to 7 km from shore.
Geologic Background. Located at the SW tip of the J-shaped Isabela Island, Cerro Azul contains a steep-walled 4 x 5 km nested summit caldera complex that is one of the smallest diameter, but at 650 m one of the deepest in the Galápagos Islands. The shield volcano is the second highest of the archipelago. A conspicuous bench occupies the SW and west sides of the caldera, which formed during several episodes of collapse. Youthful lava flows cover much of the caldera floor, which has also contained ephemeral lakes. A prominent tuff cone located at the ENE side of the caldera is evidence of episodic hydrovolcanism. Numerous spatter cones dot the western flanks. Fresh-looking lava flows, many erupted from circumferential fissures, descend the NE and NW flanks. Historical eruptions date back only to 1932, but Cerro Azul has been one of the most active Galápagos volcanoes since that time. Solfataric activity continues within the caldera.
Information Contacts: Howard L. Snell, Charles Darwin Research Station, Puerto Ayora, Galápagos, Ecuador (URL: http://www.darwinfoundation.org/); The Galápagos National Park Service, Isla Santa Cruz, Galápagos, Ecuador; Peter Mouginis-Mark and Luke Flynn, GOES Hotspot Monitoring System, Hawaii Institute of Geophysics and Planetology, University of Hawaii, 2525 Correa Road, Honolulu, Hawaii 96822 (URL: http://modis.higp.hawaii.edu/); Instituto Geofísico, Escuela Politécnica Nacional, AP 17-01-2759, Quito, Ecuador.
El Chichon (Mexico) — August 1998 Cite this Report
El Chichon
Mexico
17.3602°N, 93.2297°W; summit elev. 1150 m
All times are local (unless otherwise noted)
Changes in hydrothermal activity noticed in April
Slight variations in lake water temperature and migration of thermal fields on the crater floor were noticed during an April 1998 visit. Erosion had started to form deeply incised gullies in the crater walls, producing small rockfalls around the crater. Rockfall activity continued along the S crater wall as in 1995 (BGVN 20:05). The latest rockfall deposit contained blocks up to 3 m in diameter.
According to bathymetric data obtained during the April visit, the average depth of the lake is only 1.5 m. On the lake bottom several funnel-shaped areas about 5-6 m below the surface discharged bubbling gases. No elemental sulfur was found in samples of lake sediments. The surface temperature of the lake is very uniform, and even above the gas funnels did not exceed 35°C. Such uniformity may indicate that the lake water is not significantly influenced by underlying magma and is highly affected by seasonal variations in precipitation and ambient temperature. The lake's surface maintained the same elevation in May 1996 and January 1997, but during the April 1998 visit it was 1 m higher.
Hydrothermal activity inside the crater in April was compared to observations made in January 1997. Since then, two boiling pools on the NW side of the crater had dried out, but three new large boiling pools 5-10 m in diameter had appeared 100 m to the S. The boiling pools gave off much more vapor than earlier. The Soap Pool, a boiling spring that had an outflow rate of ~20 kg/s in 1996-97, had decreased to an outflow of only 6-7 kg/s of very saline boiling water. A large area around this pool was covered by a crust of a white salt precipitated from the pool water.
Discharge estimates for the volcano-hydrothermal system were made in April: springs on the southern slopes of the volcano and the Soap Pool inside the crater discharged at least 300 kg/s of thermal water. The steam output from the crater (from fumaroles with elevated temperatures) did not exceed 20 kg/s. Temperature and chlorine concentration of these springs are recorded in table 3.
Table 3. Temperatures and chlorine concentrations of thermal water springs at El Chichón as measured in April 1998. Data courtesy of Instituto de Geofisica, UNAM.
| Spring |
Temperature |
Chlorine (mg/kg of H2O) |
| Agua Caliente |
71°C |
2,000 |
| Agua Salada |
51°C |
1,600 |
| Agua Tibia |
55°C |
1,200 |
| Soap Pool |
98°C |
15,000 |
El Chichón is located in a heavily forested mountainous area in Chiapas, 670 km ESE of México City. No historical eruptions were known before the Plinian eruption in 1982, although solfataras and hot springs were present in the summit area and on the flanks. The 1982 explosions destroyed the summit dome creating a 1 km wide crater.
Geologic Background. El Chichón is a small trachyandesitic tuff cone and lava dome complex in an isolated part of the Chiapas region in SE México. Prior to 1982, this relatively unknown volcano was heavily forested and of no greater height than adjacent non-volcanic peaks. The largest dome, the former summit of the volcano, was constructed within a 1.6 x 2 km summit crater created about 220,000 years ago. Two other large craters are located on the SW and SE flanks; a lava dome fills the SW crater, and an older dome is located on the NW flank. More than ten large explosive eruptions have occurred since the mid-Holocene. The powerful 1982 explosive eruptions of high-sulfur, anhydrite-bearing magma destroyed the summit lava dome and were accompanied by pyroclastic flows and surges that devastated an area extending about 8 km around the volcano. The eruptions created a new 1-km-wide, 300-m-deep crater that now contains an acidic crater lake.
Information Contacts: Yuri Taran, Jose Luis Macias, Juan Manuel Espindola, and Nicholas Varley, Instituto de Geofisica, UNAM, Ciudad Universitaria, Coyoacan 04510, México D.F., México.
Chiginagak (United States) — August 1998 Cite this Report
Chiginagak
United States
57.135°N, 156.99°W; summit elev. 2221 m
All times are local (unless otherwise noted)
Ash, gas-and-steam plume on 13 August
Residents of the town of Pilot Point and personnel of the U.S. Fish and Wildlife Service reported on 13 August that the usual white steaming of Chiginagak fumaroles had changed for a time. The volcano had begun to issue puffs of black ash accompanied by a greenish-yellow gas-and-steam plume that rose 150-300 m above the summit. By the following morning a dusting of black ash was observed on fresh snow on the upper part of the volcano. The plume had reverted to white steam. The activity was not substantial enough to be detected by satellite imagery. The Alaska Volcano Observatory has no seismic instruments at the site.
Geologic Background. The symmetrical, calc-alkaline Chiginagak stratovolcano located about 15 km NW of Chiginagak Bay contains a small summit crater, which is breached to the south, and one or more summit lava domes. Satellitic lava domes occur high on the NW and SE flanks of the glacier-mantled volcano. An unglaciated lava flow and an overlying pyroclastic-flow deposit extending east from the summit are the most recent products of Chiginagak. They most likely originated from a lava dome at 1687 m on the SE flank, 1 km from the summit of the volcano, which has variably been estimated to be from 2075 to 2221 m high. Brief ash eruptions were reported in July 1971 and August 1998. Fumarolic activity occurs at 1600 m elevation on the NE flank of the volcano, and two areas of hot-spring travertine deposition are located at the NW base of the volcano near Volcano Creek.
Information Contacts: Alaska Volcano Observatory (AVO), a cooperative program of a) U.S. Geological Survey, 4200 University Drive, Anchorage, AK 99508-4667, USA (URL: http://www.avo.alaska.edu/), b) Geophysical Institute, University of Alaska, PO Box 757320, Fairbanks, AK 99775-7320, USA, and c) Alaska Division of Geological & Geophysical Surveys, 794 University Ave., Suite 200, Fairbanks, AK 99709, USA.
Dieng Volcanic Complex (Indonesia) — August 1998 Cite this Report
Dieng Volcanic Complex
Indonesia
7.2°S, 109.879°E; summit elev. 2565 m
All times are local (unless otherwise noted)
Plumes and earthquakes in early July
Seismicity increased in late June and early July. Earthquakes of M ~2 were felt locally three times on 2 July, and once on 4 July. An emission plume of white, moderately thick steam without ash issued from Sileri crater under low pressure to a height of 50 m. There was a moderate smell of sulfur. The crater lake water was clear to gray in color with temperatures varying between 54 and 94°C.
Geologic Background. The Dieng plateau in the highlands of central Java is renowned both for the variety of its volcanic scenery and as a sacred area housing Java's oldest Hindu temples, dating back to the 9th century CE. The Dieng Volcanic Complex consists of multiple stratovolcanoes and more than 20 small Pleistocene-to-Holocene craters and cones over a 6 x 14 km area. Prahu stratovolcano was truncated by a large Pleistocene caldera, which was subsequently filled by a series of cones, lava domes, and craters, many containing lakes. Lava flows cover much of the plateau, but observed activity has been restricted to minor phreatic eruptions. Gas emissions are a hazard at several craters and have caused fatalities. There are abundant thermal features and high heat flow across the area.
Information Contacts: R. Sukhyar, Director, Volcanological Survey of Indonesia (VSI), Bandung, Indonesia (URL: http://www.vsi.esdm.go.id/).
Guagua Pichincha (Ecuador) — August 1998 Cite this Report
Guagua Pichincha
Ecuador
0.171°S, 78.598°W; summit elev. 4784 m
All times are local (unless otherwise noted)
Phreatic discharges reappear after robust off-flank seismicity
A seismic swarm occurred off Guagua Pichincha's NE flank during May-September 1998. On 4 August during the course of this swarm a M 7.1 earthquake struck near the coast; days later the stratovolcano began a series of modest phreatic eruptions. The eruptions continued through at least early October when they prompted local front-page news stories. As this report went to press in early October, the hazard status was Yellow, the second stage in an alert scheme of White, Yellow, Orange, and Red.
During the seismic swarm, earthquakes were centered in a zone ~15 km NE from Pichincha's summit. The epicentral zone lies on the S fringes of Casitagua, a volcano with no known eruptions in at least the last ~100,000 years.
The May-September swarm had not ended when this report was compiled in early September, and in total produced ~2,500 earthquakes through that time. During successive months of the swarm's progression, earthquakes became more numerous. Scientists located about 10 of the swarm's events of local magnitude 4.0-4.2, and they found that the hypocenters progressed towards the surface, from ~14 km depth during June to ~8 km depth during September. When these hypocenters were plotted on a vertical section oriented SW-NE, no lateral offset was visible, implying that the foci of these larger, located earthquakes rose vertically over time.
An active compressional fault along the Quito's E margin (the Quito fault) dips W beneath the city and underlies both volcanoes at depth. As noted above, the located earthquakes did not appear to follow the W-dipping fault, and epicenters trended oblique to the fault's N-S surface trace as they defined a zone aligned NW-SE. Still, the swarm was interpreted as tectonic, associated with the Quito fault.
The M 7.1 earthquake on 4 August struck ~175 km to Pichincha's SW on Ecuador's coast, a few tens of kilometers NE and inland from the port of Bahìa de Caràquez (0.59°S, 80.39°W). The U.S. Geological Survey made a preliminary assessment of the 4 August earthquake as Ms 7.1. The earthquake occurred at 1359 (1859 GMT); the preliminary depth was given as 33 km.
Phreatic eruptions began at 0156 on 7 August; 10-15 others followed into early September. Seismic signals indicated that in some cases eruptive degassing persisted up to 25 hours, type-A earthquakes occurred, but tremor was rare. The eruptions discharged gas, mud, and lithics, but no juvenile tephra. A veneer of these deposits appeared over the N crater floor when photographed on 15 September (figures 7 and 8). At that time, the crater's post-1660 dome gently steamed. The dome's N surface lay beneath a veneer of material deposited during and after phreatic eruptions on 7 August. The veneer contained mud and lithics but no juvenile tephra; some of this material formed small lahars that traversed around the dome and spilled out of the crater (figures 7 and 8). A visit to a crater overlook on 15 September disclosed that just beyond the rim of the explosion crater's N side, some new fractures arc around its circumference (arrow, figure 8).
This phreatic episode lacked non-seismic precursors. EDM on the crater walls, on the SE flank, and on the dome showed relatively little change. SO2 flux, measured with COSPEC, lacked a spike. The crater, however, was judged too dangerous to enter for the purpose of obtaining in-situ gas samples. In 1997, the maximum temperature of gases escaping the dome was ~120°C.
During the first week of September seismicity consisted largely of A-type events, although some long-period events registered and meager tremor was seen. Degassing was too small to produce a conspicuous plume. On 6 September Quito residents felt two earthquakes; they were M 3.5 and 3.8 at ~12 km depth.
Long-term trends in Pichincha's overall seismicity and explosion-type earthquakes were plotted through August 1998 (figure 9); however, the earthquakes comprising the seismic swarm discussed above were omitted. The prominent seismic peak during 1988 coincided with the installation of a new telemetered seismic system just prior to an interval when fumarolic areas expanded, when fumarolic vigor increased, but when no phreatic eruption discharged (SEAN 13:09). Interestingly, the 1988 increases also occurred in conjunction with a seismic swarm, in this case on the volcano's S flank 6-8 km from the summit; associated hypocenters were at 12-16 km depth. Phreatic activity took place in 1981, 1982, and 1985, and then again in 1990, 1993, 1994, 1995, 1997, and 1998 (figure 3 and SEAN 06:09, 06:11, 07:06; BGVN 15:02, 15:03, 15:09, 18:02, and 23:03).
Geologic Background. Guagua Pichincha and the older Pleistocene Rucu Pichincha stratovolcanoes form a broad volcanic massif that rises immediately W of Ecuador's capital city, Quito. A lava dome grew at the head of a 6-km-wide scarp formed during a late-Pleistocene slope failure ~50,000 years ago. Subsequent late-Pleistocene and Holocene eruptions from the central vent consisted of explosive activity with pyroclastic flows accompanied by periodic growth and destruction of the lava dome. Many minor eruptions have been recorded since the mid-1500's; the largest took place in 1660, when ash fell over a 1,000 km radius and accumulated to 30 cm depth in Quito. Pyroclastic flows and surges also occurred, primarily to then W, and affected agricultural activity.
Information Contacts: Instituto Geofísico, Escuela Politécnica Nacional, Apartado 2759, Quito, Ecuador; El Comercio newspaper, Quito, Ecuador (URL: http://www.elcomercio.com); El Universo newspaper, Quito, Ecuador (URL: http://www.eluniverso.com); La Hora newspaper, Quito, Ecuador (URL: http://www.lahora.com).
Karymsky
Russia
54.049°N, 159.443°E; summit elev. 1513 m
All times are local (unless otherwise noted)
Explosions and blowouts on 26 July
Seismicity remained above background levels during 26 July-1 September. Low-level Strombolian activity, including 100-200 earthquakes and gas explosions each day, continued to characterize activity at the volcano. On 26 July, gas-and-ash explosions reached heights of 400-600 m and occasionally 1,000-1,200 m above the crater every 5-10 minutes on average. Lava continued to flow from the crater (BGVN 23:04 and 23:06). The color-coded hazard status remained at Yellow.
Geologic Background. Karymsky, the most active volcano of Kamchatka's eastern volcanic zone, is a symmetrical stratovolcano constructed within a 5-km-wide caldera that formed during the early Holocene. The caldera cuts the south side of the Pleistocene Dvor volcano and is located outside the north margin of the large mid-Pleistocene Polovinka caldera, which contains the smaller Akademia Nauk and Odnoboky calderas. Most seismicity preceding Karymsky eruptions originated beneath Akademia Nauk caldera, located immediately south. The caldera enclosing Karymsky formed about 7600-7700 radiocarbon years ago; construction of the stratovolcano began about 2000 years later. The latest eruptive period began about 500 years ago, following a 2300-year quiescence. Much of the cone is mantled by lava flows less than 200 years old. Historical eruptions have been vulcanian or vulcanian-strombolian with moderate explosive activity and occasional lava flows from the summit crater.
Information Contacts: Olga Chubarova, Kamchatka Volcanic Eruptions Response Team (KVERT), Institute of Volcanic Geology and Geochemistry; Tom Miller, Alaska Volcano Observatory.
Kerinci (Indonesia) — August 1998 Cite this Report
Kerinci
Indonesia
1.697°S, 101.264°E; summit elev. 3800 m
All times are local (unless otherwise noted)
Plume rises to 2 km on 4 July
Activity increased beginning on 4 July. A gray-to-black plume escaped the summit crater under high pressure around noon. Local residents heard a noise similar to cannon-fire. The cloud rose 800-2,000 m above the summit. The eruption ended about 1700. On 5 July the volcano had resumed its normal level of activity; the plume reached heights of 100-400 m above the summit.
Geologic Background. Gunung Kerinci in central Sumatra forms Indonesia's highest volcano and is one of the most active in Sumatra. It is capped by an unvegetated young summit cone that was constructed NE of an older crater remnant. There is a deep 600-m-wide summit crater often partially filled by a small crater lake that lies on the NE crater floor, opposite the SW-rim summit. The massive 13 x 25 km wide volcano towers 2400-3300 m above surrounding plains and is elongated in a N-S direction. Frequently active, Kerinci has been the source of numerous moderate explosive eruptions since its first recorded eruption in 1838.
Information Contacts: R. Sukhyar, Director, Volcanological Survey of Indonesia (VSI), Bandung, Indonesia (URL: http://www.vsi.esdm.go.id/).
Kilauea (United States) — August 1998 Cite this Report
Kilauea
United States
19.421°N, 155.287°W; summit elev. 1222 m
All times are local (unless otherwise noted)
Eruptive pause (No. 20) followed by a new pahoehoe flow to the sea
Lava continued erupting from vents on the SW of Pu`u `O`o and traveling 12 km to the coast through lava tubes. Following a pause in the magma supply on 12-14 August, lava escaping from the tubes resulted in a new pahoehoe flow at the base of the fault scarp (pali), but a new lava tube eventually developed within the flow. The flow front reached the sea on 30 August, entering ~400 m W of the long-established Kamokuna entry.
Above the shoreline, spreading lava formed small pahoehoe toes along its margins. The new flow was extremely hot and made the approach from the W difficult and hazardous. Lava at the new entry initially poured over a sea cliff (created by previous bench collapses) onto a black-sand beach. Material arriving at both new and old entry points added to the Kamokuna bench.
Twenty pauses, lasting from a few hours to a few days, have occurred since Episode 55 began in March 1997. These short-term interruptions in magma supply to Pu`u `O`o result from blockages in the conduit system between the summit magma reservoir and Pu`u `O`o. The most recent pause (No. 20) began on 12 August and lasted approximately 42 hours, during which time Kīlauea's summit inflated ~2 µrad. The slight inflation indicated magma was still rising into the summit but not moving to the rift zone.
When lava reemerged from Pu`u `O`o and again flowed through the tubes, several flows broke out on the pali and at its base (figure 122). The largest flow originated from the same breakout point that was active following a pause in July (BGVN 23:06). Daily lava-discharge rates from Pu`u `O`o remained little changed; surveys made during the last few weeks of August indicated that ~250,000 m3 of lava per day traveled through the tube. Since March 1998, the average daily lava discharge was ~300,000 m3.
Seismologists noted a series of more than two dozen seismic signals at Pu`u `O`o on 26 August. The signals had a frequency lower than is typical of most earthquakes, and were likely caused by the partial collapse of a spatter cone on the W flank of Pu`u `O`o (figure 123). By 3 September the the spatter cone crater had grown to ~50 m in diameter.
Geologic Background. Kilauea overlaps the E flank of the massive Mauna Loa shield volcano in the island of Hawaii. Eruptions are prominent in Polynesian legends; written documentation since 1820 records frequent summit and flank lava flow eruptions interspersed with periods of long-term lava lake activity at Halemaumau crater in the summit caldera until 1924. The 3 x 5 km caldera was formed in several stages about 1,500 years ago and during the 18th century; eruptions have also originated from the lengthy East and Southwest rift zones, which extend to the ocean in both directions. About 90% of the surface of the basaltic shield volcano is formed of lava flows less than about 1,100 years old; 70% of the surface is younger than 600 years. The long-term eruption from the East rift zone between 1983 and 2018 produced lava flows covering more than 100 km2, destroyed hundreds of houses, and added new coastline.
Information Contacts: Hawaiian Volcano Observatory (HVO), U.S. Geological Survey, PO Box 51, Hawaii Volcanoes National Park, HI 96718, USA (URL: https://volcanoes.usgs.gov/observatories/hvo/); Ken Rubin and Mike Garcia, Hawaii Center for Volcanology, University of Hawaii, Dept. of Geology & Geophysics, 2525 Correa Rd., Honolulu, HI 96822 USA (URL: http://www.soest.hawaii.edu/GG/hcv.html).
Klyuchevskoy (Russia) — August 1998 Cite this Report
Klyuchevskoy
Russia
56.056°N, 160.642°E; summit elev. 4754 m
All times are local (unless otherwise noted)
Gas-and-ash explosions during 23-25 July
During 27 July-1 September seismicity under the volcano was generally above background. Hypocenters of earthquakes were concentrated at two levels: near the summit crater and at depths of 25-30 km. Shallow events were more numerous than deeper ones. Clouds often prevented direct summit observations. The level-of-concern fluctuated between Yellow and Green throughout the period.
Beginning on the afternoon of 23 July gas-and-ash explosions occurred every 15-20 minutes. A plume rose 300-500 m over the summit. No unusual changes in seismicity were recorded until noon on 25 July, when earthquake numbers and energy abruptly decreased, and tremor amplitude increased. During the first two weeks of August, earthquakes were concentrated near the summit accompanied by weak tremor. On 19 August tremor decreased but the number of shallow earthquakes increased. No tremor was recorded after 21 August, but on 23 August there was a 23-minute series of shallow earthquakes.
Fumarolic plumes rose to only 50 m above the volcano on 2 August, but some rose to 100 m by 9 August. Plumes rising to 400 m and extending 10 km NE were seen on 18 August. No plumes were seen on 11 and 16 August. On other days the summit was obscured by clouds.
Geologic Background. Klyuchevskoy (also spelled Kliuchevskoi) is Kamchatka's highest and most active volcano. Since its origin about 6000 years ago, the beautifully symmetrical, 4835-m-high basaltic stratovolcano has produced frequent moderate-volume explosive and effusive eruptions without major periods of inactivity. It rises above a saddle NE of sharp-peaked Kamen volcano and lies SE of the broad Ushkovsky massif. More than 100 flank eruptions have occurred during the past roughly 3000 years, with most lateral craters and cones occurring along radial fissures between the unconfined NE-to-SE flanks of the conical volcano between 500 m and 3600 m elevation. The morphology of the 700-m-wide summit crater has been frequently modified by historical eruptions, which have been recorded since the late-17th century. Historical eruptions have originated primarily from the summit crater, but have also included numerous major explosive and effusive eruptions from flank craters.
Information Contacts: Olga Chubarova, Kamchatka Volcanic Eruptions Response Team (KVERT), Institute of Volcanic Geology and Geochemistry, Piip Ave. 9, Petropavlovsk-Kamchatsky, 683006, Russia; Tom Miller, Alaska Volcano Observatory (AVO), a cooperative program of a) U.S. Geological Survey, 4200 University Drive, Anchorage, AK 99508-4667, USA (URL: http://www.avo.alaska.edu/), b) Geophysical Institute, University of Alaska, PO Box 757320, Fairbanks, AK 99775-7320, USA, and c) Alaska Division of Geological & Geophysical Surveys, 794 University Ave., Suite 200, Fairbanks, AK 99709, USA.
Langila (Papua New Guinea) — August 1998 Cite this Report
Langila
Papua New Guinea
5.525°S, 148.42°E; summit elev. 1330 m
All times are local (unless otherwise noted)
Weak vapor and ash emissions continue
During July, Crater 2 continued to release weak-to-moderate white vapor with occasional pale-gray ash. During 13-15 and 29 July the pale gray ash emissions changed to dark gray ash clouds that rose 2,000-2,500 m above the summit. Low roaring noises were heard 4-6, 8-9, and 16 July. No activity was reported from Crater 3 during July, and no glow was observed at either crater throughout the month.
During August both Crater 2 and 3 released low-to-moderate volumes of white vapor. There were also small amounts of blue vapor seen at Crater 2. One loud roaring and rumbling sound was heard at Crater 2 on 28 July accompanied by the emission of a dark-gray ash-laden cloud rising 1,000-2,000 m above the summit. This cloud was blown to the NW. The seismograph remained inoperative throughout July and August.
Geologic Background. Langila, one of the most active volcanoes of New Britain, consists of a group of four small overlapping composite basaltic-andesitic cones on the lower E flank of the extinct Talawe volcano in the Cape Gloucester area of NW New Britain. A rectangular, 2.5-km-long crater is breached widely to the SE; Langila was constructed NE of the breached crater of Talawe. An extensive lava field reaches the coast on the N and NE sides of Langila. Frequent mild-to-moderate explosive eruptions, sometimes accompanied by lava flows, have been recorded since the 19th century from three active craters at the summit. The youngest and smallest crater (no. 3 crater) was formed in 1960 and has a diameter of 150 m.
Information Contacts: Ben Talai, RVO.
Lokon-Empung (Indonesia) — August 1998 Cite this Report
Lokon-Empung
Indonesia
1.358°N, 124.792°E; summit elev. 1580 m
All times are local (unless otherwise noted)
Noteworthy plume and slight increase in seismic activity
A slight increase in shallow volcanic seismic activity was recorded in late June lasting through August, although there was a minor decrease in July. Observers saw a plume of white vapor rising 25-75 m above the summit.
Geologic Background. The Lokong-Empung volcanic complex, rising above the plain of Tondano in North Sulawesi, includes four peaks and an active crater. Lokon, the highest peak, has a flat craterless top. The morphologically younger Empung cone 2 km NE has a 400-m-wide, 150-m-deep crater that erupted last in the 18th century. A ridge extending 3 km WNW from Lokon includes the Tatawiran and Tetempangan peaks. All eruptions since 1829 have originated from Tompaluan, a 150 x 250 m crater in the saddle between Lokon and Empung. These eruptions have primarily produced small-to-moderate ash plumes that sometimes damaged croplands and houses, but lava-dome growth and pyroclastic flows have also occurred.
Information Contacts: R. Sukhyar, Director, Volcanological Survey of Indonesia (VSI), Bandung, Indonesia (URL: http://www.vsi.esdm.go.id/).
Manam (Papua New Guinea) — August 1998 Cite this Report
Manam
Papua New Guinea
4.08°S, 145.037°E; summit elev. 1807 m
All times are local (unless otherwise noted)
Weak emissions of white vapor during July and August
The summit area of Manam was obscured for almost half of the month of July. When weather was clear, emissions of weak white vapor were observed from Southern Crater. Main Crater released weak-to-moderate volumes of white vapor. Manam was generally quiet during August with only discrete small emissions of pale-gray ash clouds from Southern Crater on 2, 3, 21, and 25-31 August. Ash clouds rose 500 m above the summit and were blown NW of the volcano resulting in light ash falls. Ash emissions were not accompanied by any audible sounds and there were no night glows above the summit craters. When there were no ash emissions occurring, Southern and Main Craters released small volumes of white vapor.
Seismicity remained at a low level. Counts of low-frequency volcanic events remained generally unchanged from previous months with about 980-1,420 B-type events of very low amplitude being recorded daily. The water-filled tiltmeter at Tabele Observatory (4 km SW of the summit) showed about 1 µrad of inflation in July and was relatively steady throughout August.
Geologic Background. The 10-km-wide island of Manam, lying 13 km off the northern coast of mainland Papua New Guinea, is one of the country's most active volcanoes. Four large radial valleys extend from the unvegetated summit of the conical basaltic-andesitic stratovolcano to its lower flanks. These valleys channel lava flows and pyroclastic avalanches that have sometimes reached the coast. Five small satellitic centers are located near the island's shoreline on the northern, southern, and western sides. Two summit craters are present; both are active, although most observed eruptions have originated from the southern crater, concentrating eruptive products during much of the past century into the SE valley. Frequent eruptions, typically of mild-to-moderate scale, have been recorded since 1616. Occasional larger eruptions have produced pyroclastic flows and lava flows that reached flat-lying coastal areas and entered the sea, sometimes impacting populated areas.
Information Contacts: Ben Talai, RVO.
Merapi (Indonesia) — August 1998 Cite this Report
Merapi
Indonesia
7.54°S, 110.446°E; summit elev. 2910 m
All times are local (unless otherwise noted)
Details of July eruptions, new monitoring equipment
The relative calm in seismic, gas, and rockfall activity at Merapi ended in late June (BGVN 23:07). Activity since November 1994 had been concentrated on the S of the volcano, but activity in July occurred mainly on the W slopes. Further details of the July eruptions are reported below, followed by an account of new monitoring equipment.
Changes in the measured tilt began in early June on the W flank, forecasting an increase in activity. Tilt increased at the end of June and an extension of 1 m was detected by electronic distance measurement during the first week of July. Also, the tilt measured by station ST3, located at the crater rim near the active dome, showed strong inflation at extraordinarily high rates of up to 200 µrad/hour. This high tilt rate was likely influenced by heat radiated from the new dome; an accurate estimate of tilt with this effect removed remains problematic. After the nuée ardente of 8 July, no further signals from ST3 were recorded and an early August field trip failed to find any remnants of the station.
Increases in accumulated seismic energy indicated an approaching change in the eruption regime. Soon after a small explosion on 30 June a plume emerged from the summit and a glowing avalanche rushed down the W slope. The explosion opened at least one hole on the W slope close to the summit. New lava was squeezed out of the opening "like toothpaste" without friction or pressure; the volcano seemed to be partially open. During the next week, avalanches connected to new dome building were observed from Babadan on the W slope. Based on observation of these avalanches, the nuée ardente on 8 July was expected. The daily number of rockfalls increased strongly from a few, to dozens, and then to more than 100; some rockfalls were glowing.
Seismicity (especially multi-phase events) strongly increased in early July (figure 19) before peaking on 11 July when 37 nuées ardentes occurred between midnight and 0500. The most powerful eruption that day happened at 0445; volcanic material flowed 4 km from the summit. The plume reached a height of ~4 km and ash was distributed 15-20 km away. During 11-19 July, 128 nuées ardentes were seen, including a final strong pyroclastic ash-and-block flow at 1500 on 19 July. Seismic activity, except the number of rock falls, decreased after 19 July. Four episodes of volcanic tremor were recorded in July (usually during vigorous eruptive activity), indicating magma movement. The dome grew briskly without special seismic activity, although much of the new lava collapsed, causing hundreds of daily avalanches. Many local residents watched huge glowing rockfalls at night on the W slope.
Explosion sounds were heard only close to the dome (for example, in Klatakan but not in Babadan). On 30 June a seismologist working on the W slope in Klatakan on an active seismic experiment heard a sharp noise at about 1130 that preceded both a plume and pyroclastic flows.
Some W-side stations were covered with more than 2.5 cm of ash. Pyroclastic-flow deposits filled parts of a valley on the W slope, almost reaching the town of Jerung Jeru, 7 km from the summit. The total amount of material erupted during July was estimated to be 8.8 x 10⁶ m3. The huge amount of ash released during July suggested an explosive process rather than gravity collapse, as happened in November 1994 when far less ash was emitted.
New seismic warning installations. German scientists Joachim Wassermann and Juergen Gossler installed an infrasonic network at Babadan on the W slope. Three clusters, each with four microphones installed in tubes directed at the summit, collect infrasonic noise.
Infrasonic noise was recorded beginning three days before the events of 19 July. The data showed a good correlation between seismicity and infrasonic signals during avalanche and lahar activity. A signal recorded before the main pyroclastic flow could have been a precursory event. A volcanic explosion was recorded before 19 July by a member of the active seismic experiment group during fieldwork at Klatakan. No event was heard in Babadan at that time, but the subsequent avalanche was recorded. A few explosions may have occurred earlier in the month, but no acoustic signals were detected, probably because Babadan is too far from the source.
A broad-band seismic station was installed on Pasar Bubar, on a plateau just below the summit, to complement the three stations on the slopes of Merapi. A program is under development that would select different signals automatically and thus enable a "quasi-online calculation" for the hypocenters and epicenters of volcanic events. Infrasonic data together with seismic data could be sent to the Volcano Technical Research Center (Balai Penyelidikan dan Pengembangan Teknologi Kegunungapian, "BPPTK") of VSI to improve the early warning system. Combined data from the same site would help in locating volcanic events and could provide information about source mechanics.
Geologic Background. Merapi, one of Indonesia's most active volcanoes, lies in one of the world's most densely populated areas and dominates the landscape immediately north of the major city of Yogyakarta. It is the youngest and southernmost of a volcanic chain extending NNW to Ungaran volcano. Growth of Old Merapi during the Pleistocene ended with major edifice collapse perhaps about 2,000 years ago, leaving a large arcuate scarp cutting the eroded older Batulawang volcano. Subsequent growth of the steep-sided Young Merapi edifice, its upper part unvegetated due to frequent activity, began SW of the earlier collapse scarp. Pyroclastic flows and lahars accompanying growth and collapse of the steep-sided active summit lava dome have devastated cultivated lands on the western-to-southern flanks and caused many fatalities.
Information Contacts: Volcanological Survey of Indonesia (VSI), Bandung, Indonesia (URL: http://www.vsi.esdm.go.id/); Mas Atje Purbowinata, Merapi Volcano Observatory, Jalan Cendana 15 Yogyakarta 55166, Indonesia (URL: http://www.vsi.esdm.go.id/); A. Brodscholl, BPPTK, Volcanological Survey of Indonesia, Bandung, Indonesia; J. Gossler, GeoForschungs Zentrum (GFZ), Potsdam, Germany; J. Wassermann, University of Potsdam, Potsdam, Germany.
Popocatepetl (Mexico) — August 1998 Cite this Report
Popocatepetl
Mexico
19.023°N, 98.622°W; summit elev. 5393 m
All times are local (unless otherwise noted)
Moderate, intermittent ash emissions continue
Following moderate eruptive outbursts in mid-August (BGVN 23:07), Popocatépetl returned to the low-level activity that has prevailed since May 1998. A few minor increases in ash emissions during subsequent weeks were noted by CENAPRED in the daily internet log.
Frequent moderate emissions took place on 24 August. The largest events occurred at 0402 and 1215. A small plume from a steam fumarole drifted to the SW. At 1553 a tectonic earthquake of magnitude M 2 occurred, and was located 2.5 km SE of the crater at a depth of 3.7 km. At 1613 40 minutes of high-frequency tremor of variable amplitude began, accompanied by the emission of ash, gas, and steam in a column rising 1,500 m above the summit. Activity diminished to normal by the next day.
Isolated, moderately large exhalations of short duration were noted on 28 August. Some of these exhalations were accompanied by small puffs of ash, steam, and gas. At 1807 a high-frequency tremor signal was recorded followed 2 minutes later by mild explosions lasting 8 minutes. Visibility was limited throughout the day by intense meteorological cloudiness, but presumably the explosions caused a gas, steam, and low-density-ash column that was blown NE. After this event activity returned to previous levels.
A slight increase in activity early on 31 August consisted of several moderate, but short, exhalations and some small high-frequency tremor episodes. The largest occurred at 0418 followed 6 minutes later by an exhalation. The tremor continued for about 15 minutes. At that time glow from inside the crater could be seen on the summit video camera. During the night several rockfalls were recorded.
After several days of low activity, a moderately large exhalation occurred at 0539 on 8 September. Its intense phase lasted 6 minutes, followed by a 15-minute-long tremor. Although the volcano was obscured by cloud, Doppler radar indicated ash close to the crater (figure 26). Reports were received of slight ashfall to the SW at Huequechula, Puebla. At 0844 another exhalation, much smaller than the one recorded earlier, lasted only 2 minutes; no ash emission was detected. At 1439 a low-frequency tremor signal started and persisted until 2100. Although scientists suggested that this signal might herald more intense and explosive exhalations in the next hours or days, similar to last April, activity decreased the next day.
Geologic Background. Volcán Popocatépetl, whose name is the Aztec word for smoking mountain, rises 70 km SE of Mexico City to form North America's 2nd-highest volcano. The glacier-clad stratovolcano contains a steep-walled, 400 x 600 m wide crater. The generally symmetrical volcano is modified by the sharp-peaked Ventorrillo on the NW, a remnant of an earlier volcano. At least three previous major cones were destroyed by gravitational failure during the Pleistocene, producing massive debris-avalanche deposits covering broad areas to the south. The modern volcano was constructed south of the late-Pleistocene to Holocene El Fraile cone. Three major Plinian eruptions, the most recent of which took place about 800 CE, have occurred since the mid-Holocene, accompanied by pyroclastic flows and voluminous lahars that swept basins below the volcano. Frequent historical eruptions, first recorded in Aztec codices, have occurred since Pre-Columbian time.
Information Contacts: Servando De la Cruz-Reyna1,2, Roberto Quaas1,2 Carlos Valdés G.2, and Alicia Martinez Bringas1. 1Centro Nacional de Prevencion de Desastres (CENAPRED) Delfin Madrigal 665, Col. Pedregal de Santo Domingo,Coyoacan, 04360, México D.F. (URL: https://www.gob.mx/cenapred/); 2Instituto de Geofisica, UNAM, Coyoacán 04510, México D.F., México.
Rabaul (Papua New Guinea) — August 1998 Cite this Report
Rabaul
Papua New Guinea
4.2459°S, 152.1937°E; summit elev. 688 m
All times are local (unless otherwise noted)
Scattered ash emissions during July and August
Tavurvur's ash emissions diminished during July and parts of August, but there was a larger-than-usual outburst on 20 August. Caldera deformation continued in July and August.
Ash emissions from Tavurvur continued in July although at a reduced level compared to previous months. During the first two weeks of July emissions were associated with discrete low-frequency seismic events. Occasionally (e.g. on 3, 7, 12, and 16 July) there were moderate explosions producing pale-gray ash plumes that rose ~1,500 m above the summit. Some of these explosions ejected lava fragments onto the flanks. Following lessened activity during 17-24 July, the pattern of emissions changed slightly: in addition to discrete ash emissions, there were periods of continuous emission lasting from a few minutes to a maximum of ten minutes. Ash from these emissions, like that from the explosions earlier in the month, fell NW of Tavurvur in Rabaul Town.
During the first three days of August, intermittent ash emissions generally were pale-gray and poor in ash content. Only one emission, on the 1st, was accompanied by a moderate explosion. A loud roaring and rumbling sound without an ash emission was heard on the following day. There were no ash emissions from 4 to 11 August. Following 12 August, intermittent moderate emissions of pale-gray ash resumed, although there were periods of continuous ash emissions lasting from a few minutes to about an hour. Later in the month, long intervals (12-20 hours) of relative calm were followed by large emissions that generated hot ash flows down the W, S, and E slopes of Tavurvur. On 20 August a violent explosion produced a dense dark-gray ash-laden cloud that rose ~2,500 m above the summit. The explosion ejected many lava fragments high above the summit that showered the slopes of the volcano. Some fragments landed 1 km from the base of the cone.
The reduced level of activity in July was accompanied by a drop in the general level of seismicity as recorded at the KPT seismic station, which is ~1.8 km from Tavurvur's summit. Real-time Seismic Amplitude Measurement (RSAM) values dropped from 55 to 20 units and the hourly event counts dropped from 10 to 2. During July a total of ~200 low-frequency volcanic events was recorded, the lowest count since February 1998. Only four high-frequency earthquakes were recorded; two were located outside of the caldera to the E. Seismicity remained low in August despite a minor increase during the second week of the month associated with ash emissions. These emissions were recorded as discontinuous non-harmonic tremors lasting from a few minutes to about an hour. There were no significant changes from July in either RSAM values or hourly event counts. The total number of low-frequency earthquakes for August was 152, but the count may have been affected by the intermittent functioning of one of the triggering stations. The two high-frequency earthquakes recorded in August were too small to be located.
Ground-deformation measurements continued to show a slow, ongoing inflationary trend through July and August. During each month an inflation of about 2-3 µrad towards Tavurvur was recorded at the Sulphur Creek water-filled tiltmeter (3.5 km NW of Tavurvur). Sea-shore surveys in Rabaul Harbour showed ~1 cm of uplift in the Greet Harbour area. A lower amount of uplift also occurred around the Vulcan area. GPS measurements confirmed an increase in altitude at Matupit Island. The inflation trend had been accompanied by a SW-directed horizontal movement of about 2.5 cm in the previous two months. On the W of the harbour a GPS site on the SE of Vulcan Island showed no significant inflation; however the horizontal components showed a significant deformation of 4 cm towards to NW in the preceding 6 months.
Geologic Background. The low-lying Rabaul caldera on the tip of the Gazelle Peninsula at the NE end of New Britain forms a broad sheltered harbor utilized by what was the island's largest city prior to a major eruption in 1994. The outer flanks of the asymmetrical shield volcano are formed by thick pyroclastic-flow deposits. The 8 x 14 km caldera is widely breached on the east, where its floor is flooded by Blanche Bay and was formed about 1,400 years ago. An earlier caldera-forming eruption about 7,100 years ago is thought to have originated from Tavui caldera, offshore to the north. Three small stratovolcanoes lie outside the N and NE caldera rims. Post-caldera eruptions built basaltic-to-dacitic pyroclastic cones on the caldera floor near the NE and W caldera walls. Several of these, including Vulcan cone, which was formed during a large eruption in 1878, have produced major explosive activity during historical time. A powerful explosive eruption in 1994 occurred simultaneously from Vulcan and Tavurvur volcanoes and forced the temporary abandonment of Rabaul city.
Information Contacts: Ben Talai, Rabaul Volcano Observatory (RVO), P.O. Box 386, Rabaul, Papua New Guinea.
Sabancaya
Peru
15.787°S, 71.857°W; summit elev. 5960 m
All times are local (unless otherwise noted)
Increases in August gas emissions
Activity was monitored during 13-31 August using satellite remote sensing data and detailed field observations. During this time, the amount of gas being emitted from the central crater increased. At the height of emission, gas clouds from the crater rose over 1 km. Most frequently, plumes attained heights of 300-500 m before dissipating due to strong winds. However, on several occasions cumulo-type clouds formed and moved over the surrounding Pampa. Gas emissions were predominantly white in color but occasionally gray, yellow, and brown. During active phases new plumes emerged on average every 2-3 minutes. Nearly continuous venting occurred from two fumaroles on the N and S sides of the crater.
At 0640 on 16 August a pronounced increase in gas emission was observed. Dense white clouds filled the crater and formed a plume rising over 300 m. At 0645 material was seen falling from a gray/brown cloud onto the S flank of the cone. This small ash ejection lasted for a few minutes (figure 9). A noticeable decline in the emission rate occurred from 0726 until 0847, when gas clouds became infrequent. Activity continued at this reduced level into the next day. At 1355 on the 18th a yellow/brown and gray cloud rose ~800 m above the crater. Following this, activity returned to faint gas emissions. Increased activity was observed again at 1019 on the 20th when dense yellow and brown clouds were emitted. Another thick brown gas cloud emerged at 1044, after which there was a return to white emissions. Activity decreased noticeably from 1100 to 1200, by which time the gas was only faintly visible. On the 22nd at 1420 dense white clouds rose 500 m over the crater. Plumes emerged predominantly from the S side of the crater every 2-3 minutes.
No emissions were seen on 23 August until 1325; a large dense gas cloud emerged from the whole crater at 1510. At 1524 the cloud on the S side of the crater formed a brown plume that rose straight upwards more than 400 m. Gas clouds descended the upper S slopes of the cone at 1530. Five minutes later a light brown-white and yellow gas plume formed on the N side of the crater. Emissions continued until dusk when observations ceased. On the morning of the 24th at 0740 dark gray clouds rose slowly from the crater. At 0756 gas from the lower portion of an ascending plume moved down the upper slopes of the cone on the N side. By 0804 the color of the plumes emerging from the crater altered to white. However, at 0816 a gray/brown gas cloud emerged and dispersed <100 m above the crater. After this no further emissions were seen until 1359 when white emissions commenced, forming cumulo-type clouds that sat over Ampato. At 0700 on the 25th, dark gray and brown clouds were emitted from the center of the crater. At 0714 a white, brown, and gray cloud emerged from the middle of the crater. Emissions were light for the rest of the day.
On 26 August at 0757 a light brown-and-gray cloud emerged. Only faint emissions were noted until 0804 when a new brown and white cloud rose 300 m. The amount of gas released then diminished to very small clouds every 2-3 minutes. At 1430 gas was rising from the whole crater; activity remained at a similar level for the rest of the afternoon. At dusk, a brown haze sat over the crater. Only limited observations were possible on 28 August. Activity was first noted at 0857 when a gray cloud emerged from the S side of the crater. Gas emission was observed at 1430 but not at 1630. The next observation was at 1447 on the 31st, at which time white clouds were being emitted from the center of the crater. At 1625 the amount of gas being released appeared to increase and became grayer. Evening sunlight was seen refracted in gas clouds ~1 km above the crater, producing a rainbow effect.
Geologic Background. Sabancaya, located in the saddle NE of Ampato and SE of Hualca Hualca volcanoes, is the youngest of these volcanic centers and the only one to have erupted in historical time. The oldest of the three, Nevado Hualca Hualca, is of probable late-Pliocene to early Pleistocene age. The name Sabancaya (meaning "tongue of fire" in the Quechua language) first appeared in records in 1595 CE, suggesting activity prior to that date. Holocene activity has consisted of Plinian eruptions followed by emission of voluminous andesitic and dacitic lava flows, which form an extensive apron around the volcano on all sides but the south. Records of historical eruptions date back to 1750.
Information Contacts: Mark Bulmer, Frederick Engle, and Andrew Johnston, Center for Earth and Planetary Studies, National Air and Space Museum, Smithsonian Institution, Washington DC 20560-0315.
Sheveluch (Russia) — August 1998 Cite this Report
Sheveluch
Russia
56.653°N, 161.36°E; summit elev. 3283 m
All times are local (unless otherwise noted)
Series of shallow earthquakes in late July
Seismicity was generally at background levels during 25 July-1 September. On 25 July a fumarolic plume rose 300 m above the summit and extended more than 15 km SE. The following day the plume varied between 200 and 400 m in height and extended 5 km to the SE. During a period of just over 3 hours on 26 July, a series of strong, shallow earthquakes accompanied by volcanic tremor was recorded. Tremor was also recorded on 9 August. On 15 August a plume rising to 250 m extended 5 km E. Clouds obscured the volcano throughout much of the reporting period.
Geologic Background. The high, isolated massif of Sheveluch volcano (also spelled Shiveluch) rises above the lowlands NNE of the Kliuchevskaya volcano group. The 1,300 km3 andesitic volcano is one of Kamchatka's largest and most active volcanic structures, with at least 60 large eruptions during the Holocene. The summit of roughly 65,000-year-old Stary Shiveluch is truncated by a broad 9-km-wide late-Pleistocene caldera breached to the south. Many lava domes occur on its outer flanks. The Molodoy Shiveluch lava dome complex was constructed during the Holocene within the large open caldera; Holocene lava dome extrusion also took place on the flanks of Stary Shiveluch. Widespread tephra layers from these eruptions have provided valuable time markers for dating volcanic events in Kamchatka. Frequent collapses of dome complexes, most recently in 1964, have produced debris avalanches whose deposits cover much of the floor of the breached caldera.
Information Contacts: Olga Chubarova, Kamchatka Volcanic Eruptions Response Team (KVERT), Institute of Volcanic Geology and Geochemistry, Piip Ave. 9, Petropavlovsk-Kamchatsky, 683006, Russia; Tom Miller, Alaska Volcano Observatory (AVO), a cooperative program of a) U.S. Geological Survey, 4200 University Drive, Anchorage, AK 99508-4667, USA (URL: http://www.avo.alaska.edu/), b) Geophysical Institute, University of Alaska, PO Box 757320, Fairbanks, AK 99775-7320, USA, and c) Alaska Division of Geological & Geophysical Surveys, 794 University Ave., Suite 200, Fairbanks, AK 99709, USA.
Whakaari/White Island (New Zealand) — August 1998 Cite this Report
Whakaari/White Island
New Zealand
37.52°S, 177.18°E; summit elev. 294 m
All times are local (unless otherwise noted)
Non-seismic eruptions confirmed during 31 August visit
On 21 August steam-and-gas plumes were reported rising to 1,500 m above White Island. There was no significant change in seismicity at that time, so the plume was taken to be atmospheric in nature (it is common for tall vapor plumes to form above the island on the first day of clear weather after a frontal system has passed). Visits by tour operators, however, indicated that on 22 August the plume was gray colored and presumably ash-laden, and on 23 August red colored. None of this activity was accompanied by seismic signals. A surveillance team visited on 31 August to confirm eruptive activity, make a ground deformation survey, and sample fumaroles and newly deposited ash. The hazard status was raised to Level 2.
A new active vent had arisen in the NW corner of the 1978/90 Crater Complex, in an area characterized by high-temperature fumaroles and gas vents over the last 2-3 years. This vent was in approximately the same area as one formed in May 1991. A maximum temperature of 463°C was measured for the venting ash column at the point of discharge. The progression from high-temperature fumarole, to active vent, and eventually active crater has been a common process at White Island. The lake on the floor of 1978/90 crater was greenish-brown in color, cool (20°C), and lacked visible zones of up-welling lake water.
Numerous impact craters had covered the mud flats adjacent to the lake. There were numerous fumarolic discharges on the crater floor, many of which appeared accessible since a collapse feature called "The Sag" had formed a rampart into the main crater. Visible cracking had appeared on the crater floor adjacent to The Sag and steam (at ~90°C) discharged through these cracks; sulfur was actively precipitating in the largest vents. This area is now unsafe to approach.
The ground-deformation survey revealed that inflation of the crater floor was reoccurring. Several survey marks that showed uplift until 1995-96, followed later by minor subsidence, had reversed again and uplift was observed. Experience from the 1976-82 eruption episode suggests that uplift occurs before eruptive episodes. Large-scale subsidence was apparent in The Sag area, with a drop of over 1,300 mm recorded (beyond Peg M). This subsidence overrode all deformation signals from the active vent in this area. Further collapse can be expected.
The volcanic ash deposit included two distinct layers. The lower one consisted almost entirely of varied and intensely altered fine white tuff together with altered lava chips; gypsum crystals were present as a minor component. This was interpreted as hydrothermally altered vent-filling detritus ejected during the opening phases of the newly active vent. The upper layer consisted of mixed altered fine detritus and fresh andesite crystals and matrix, but without pumiceous scoria clasts. Once cleared of altered debris, the vent appears to have discharged ash containing a high component of very fresh andesite. However, the lack of pumice or scoria suggested that the vent was not discharging directly from magma but possibly from the solidified carapace above a shallow degassing magma body.
Fumarole temperatures were generally lower than on previous visits, probably reflecting recent heavy rains. Fumarole 1 had a maximum temperature of 101.2°C (down from ~111°C in April), and the discharge remained CO2-enriched (water depleted). All fumaroles on Donald Mound were at or below the boiling point with low discharge pressures. Noisy Nellie's temperatures had declined since April (from 153 to 126°C), but the pressures had apparently increased. Steam also discharged around the rim of Noisy Nellie flat, and a new fumarole discharged strongly on the E slope of the hill adjacent to Noisy Nellie crater. Fumarole 13a temperatures, at 105°C, were 8°C lower than in April and the discharges appeared to be CO2-enriched.
Observations from the crater floor were generally consistent with increased degassing associated with new eruptive activity. It is anticipated that fumarolic discharge temperatures will increase as the hydrothermal system heats up. None of the eruptive activity had been accompanied by seismic signals; this is very unusual for White Island and if it persists it will be difficult to remotely assess activity.
The uninhabited 2 x 2.4 km White Island is the emergent summit of a 16 x 18 km submarine volcano. The island consists of two overlapping stratovolcanoes; the summit crater appears to be breached to the SE, where the shoreline conforms to several notches in the SE crater wall. Intermittent steam and tephra eruptions have occurred throughout the short historical period, but activity at White Island also forms a prominent part of Maori legends.
Geologic Background. The uninhabited Whakaari/White Island is the 2 x 2.4 km emergent summit of a 16 x 18 km submarine volcano in the Bay of Plenty about 50 km offshore of North Island. The island consists of two overlapping andesitic-to-dacitic stratovolcanoes. The SE side of the crater is open at sea level, with the recent activity centered about 1 km from the shore close to the rear crater wall. Volckner Rocks, sea stacks that are remnants of a lava dome, lie 5 km NW. Descriptions of volcanism since 1826 have included intermittent moderate phreatic, phreatomagmatic, and Strombolian eruptions; activity there also forms a prominent part of Maori legends. The formation of many new vents during the 19th and 20th centuries caused rapid changes in crater floor topography. Collapse of the crater wall in 1914 produced a debris avalanche that buried buildings and workers at a sulfur-mining project. Explosive activity in December 2019 took place while tourists were present, resulting in many fatalities. The official government name Whakaari/White Island is a combination of the full Maori name of Te Puia o Whakaari ("The Dramatic Volcano") and White Island (referencing the constant steam plume) given by Captain James Cook in 1769.
Information Contacts: B.J. Scott, Manager of Volcano Surveillance, Institute of Geological and Nuclear Sciences (IGNS), Private Bag 2000, Wairakei, New Zealand (URL: https://www.gns.cri.nz/).