Recently Published Bulletin Reports
Kadovar (Papua New Guinea) An ash plume and weak thermal anomaly during May 2023
San Miguel (El Salvador) Small gas-and-ash explosions during March and May 2023
Ebeko (Russia) Continued explosions, ash plumes, and ashfall during October 2022-May 2023
Home Reef (Tonga) Discolored plumes continued during November 2022-April 2023
Semisopochnoi (United States) Occasional explosions, ash deposits, and gas-and-steam plumes during December 2022-May 2023
Ambae (Vanuatu) New lava flow, ash plumes, and sulfur dioxide plumes during February-May 2023
Ibu (Indonesia) Daily ash explosions continue, along with thermal anomalies in the crater, October 2022-May 2023
Dukono (Indonesia) Continuing ash emissions, SO2 plumes, and thermal signals during October 2022-May 2023
Sabancaya (Peru) Explosions, gas-and-ash plumes, and thermal activity persist during November 2022-April 2023
Sheveluch (Russia) Significant explosions destroyed part of the lava-dome complex during April 2023
Bezymianny (Russia) Explosions, ash plumes, lava flows, and avalanches during November 2022-April 2023
Chikurachki (Russia) New explosive eruption during late January-early February 2023
Kadovar (Papua New Guinea) — June 2023  Cite this Report
Kadovar
Papua New Guinea
3.608°S, 144.588°E; summit elev. 365 m
All times are local (unless otherwise noted)
An ash plume and weak thermal anomaly during May 2023
Kadovar is a 2-km-wide island that is the emergent summit of a Bismarck Sea stratovolcano. It lies off the coast of New Guinea, about 25 km N of the mouth of the Sepik River. Prior to an eruption that began in 2018, a lava dome formed the high point of the volcano, filling an arcuate landslide scarp open to the S. Submarine debris-avalanche deposits occur to the S of the island. The current eruption began in January 2018 and has comprised lava effusion from vents at the summit and at the E coast; more recent activity has consisted of ash plumes, weak thermal activity, and gas-and-steam plumes (BGVN 48:02). This report covers activity during February through May 2023 using information from the Darwin Volcanic Ash Advisory Center (VAAC) and satellite data.
Activity during the reporting period was relatively low and mainly consisted of white gas-and-steam plumes that were visible in natural color satellite images on clear weather days (figure 67). According to a Darwin VAAC report, at 2040 on 6 May an ash plume rose to 4.6 km altitude and drifted W; by 2300 the plume had dissipated. MODIS satellite instruments using the MODVOLC thermal algorithm detected a single thermal hotspot on the SE side of the island on 7 May. Weak thermal activity was also detected in a satellite image on the E side of the island on 14 May, accompanied by a white gas-and-steam plume that drifted SE (figure 68).
Geologic Background. The 2-km-wide island of Kadovar is the emergent summit of a Bismarck Sea stratovolcano of Holocene age. It is part of the Schouten Islands, and lies off the coast of New Guinea, about 25 km N of the mouth of the Sepik River. Prior to an eruption that began in 2018, a lava dome formed the high point of the andesitic volcano, filling an arcuate landslide scarp open to the south; submarine debris-avalanche deposits occur in that direction. Thick lava flows with columnar jointing forms low cliffs along the coast. The youthful island lacks fringing or offshore reefs. A period of heightened thermal phenomena took place in 1976. An eruption began in January 2018 that included lava effusion from vents at the summit and at the E coast.
Information Contacts: Darwin Volcanic Ash Advisory Centre (VAAC), Bureau of Meteorology, Northern Territory Regional Office, PO Box 40050, Casuarina, NT 0811, Australia (URL: http://www.bom.gov.au/info/vaac/); Hawai'i Institute of Geophysics and Planetology (HIGP) - MODVOLC Thermal Alerts System, School of Ocean and Earth Science and Technology (SOEST), Univ. of Hawai'i, 2525 Correa Road, Honolulu, HI 96822, USA (URL: http://modis.higp.hawaii.edu/); Copernicus Browser, Copernicus Data Space Ecosystem, European Space Agency (URL: https://dataspace.copernicus.eu/browser/).
San Miguel (El Salvador) — June 2023 Cite this Report
San Miguel
El Salvador
13.434°N, 88.269°W; summit elev. 2130 m
All times are local (unless otherwise noted)
Small gas-and-ash explosions during March and May 2023
San Miguel in El Salvador is a broad, deep crater complex that has been frequently modified by eruptions recorded since the early 16th century and consists of the summit known locally as Chaparrastique. Flank eruptions have produced lava flows that extended to the N, NE, and SE during the 17-19th centuries. The most recent activity has consisted of minor ash eruptions from the summit crater. The current eruption period began in November 2022 and has been characterized by frequent phreatic explosions, gas-and-ash emissions, and sulfur dioxide plumes (BGVN 47:12). This report describes small gas-and-ash explosions during December 2022 through May 2023 based on special reports from the Ministero de Medio Ambiente y Recursos Naturales (MARN).
Activity has been relatively low since the last recorded explosions on 29 November 2022. Seismicity recorded by the San Miguel Volcano Station (VSM) located on the N flank at 1.7 km elevation had decreased by 7 December. Sulfur dioxide gas measurements taken with DOAS (Differential Optical Absorption Spectroscopy) mobile equipment were below typical previously recorded values: 300 tons per day (t/d). During December, small explosions were recorded by the seismic network and manifested as gas-and-steam emissions.
Gas-and-ash explosions in the crater occurred during January 2023, which were recorded by the seismic network. Sulfur dioxide values remained low, between 300-400 t/d through 10 March. At 0817 on 14 January a gas-and-ash emission was visible in webcam images, rising just above the crater rim. Some mornings during February, small gas-and-steam plumes were visible in the crater. On 7 March at 2252 MARN noted an increase in degassing from the central crater; gas emissions were constantly observed through the early morning hours on 8 March. During the early morning of 8 March through the afternoon on 9 March, 12 emissions were registered, some accompanied by ash. The last gas-and-ash emission was recorded at 1210 on 9 March; very fine ashfall was reported in El Tránsito (10 km S), La Morita (6 km W), and La Piedrita (3 km W). The smell of sulfur was reported in Piedra Azul (5 km SW). On 16 March MARN reported that gas-and-steam emissions decreased.
Low degassing and very low seismicity were reported during April; no explosions have been detected between 9 March and 27 May. The sulfur dioxide emissions remained between 350-400 t/d; during 13-20 April sulfur dioxide values fluctuated between 30-300 t/d. Activity remained low through most of May; on 23 May seismicity increased. An explosion was detected at 1647 on 27 May generated a gas-and-ash plume that rose 700 m high (figure 32); a decrease in seismicity and gas emissions followed. The DOAS station installed on the W flank recorded sulfur dioxide values that reached 400 t/d on 27 May; subsequent measurements showed a decrease to 268 t/d on 28 May and 100 t/d on 29 May.
Geologic Background. The symmetrical cone of San Miguel, one of the most active volcanoes in El Salvador, rises from near sea level to form one of the country's most prominent landmarks. A broad, deep, crater complex that has been frequently modified by eruptions recorded since the early 16th century caps the truncated unvegetated summit, also known locally as Chaparrastique. Flanks eruptions of the basaltic-andesitic volcano have produced many lava flows, including several during the 17th-19th centuries that extended to the N, NE, and SE. The SE-flank flows are the largest and form broad, sparsely vegetated lava fields crossed by highways and a railroad skirting the base of the volcano. Flank vent locations have migrated higher on the edifice during historical time, and the most recent activity has consisted of minor ash eruptions from the summit crater.
Information Contacts: Ministero de Medio Ambiente y Recursos Naturales (MARN), Km. 5½ Carretera a Nueva San Salvador, Avenida las Mercedes, San Salvador, El Salvador (URL: http://www.snet.gob.sv/ver/vulcanologia).
Ebeko
Russia
50.686°N, 156.014°E; summit elev. 1103 m
All times are local (unless otherwise noted)
Continued explosions, ash plumes, and ashfall during October 2022-May 2023
Ebeko, located on the N end of Paramushir Island in the Kuril Islands, consists of three summit craters along a SSW-NNE line at the northern end of a complex of five volcanic cones. Eruptions date back to the late 18th century and have been characterized as small-to-moderate explosions from the summit crater, accompanied by intense fumarolic activity. The current eruption period began in June 2022 and has recently consisted of frequent explosions, ash plumes, and thermal activity (BGVN 47:10). This report covers similar activity during October 2022 through May 2023, based on information from the Kamchatka Volcanic Eruptions Response Team (KVERT) and satellite data.
Activity during October consisted of explosive activity, ash plumes, and occasional thermal anomalies. Visual data by volcanologists from Severo-Kurilsk showed explosions producing ash clouds up to 2.1-3 km altitude which drifted E, N, NE, and SE during 1-8, 10, 16, and 18 October. KVERT issued several Volcano Observatory Notices for Aviation (VONA) on 7, 13-15, and 27 October 2022, stating that explosions generated ash plumes that rose to 2.3-4 km altitude and drifted 5 km E, NE, and SE. Ashfall was reported in Severo-Kurilsk (Paramushir Island, about 7 km E) on 7 and 13 October. Satellite data showed a thermal anomaly over the volcano on 15-16 October. Visual data showed ash plumes rising to 2.5-3.6 km altitude on 22, 25-29, and 31 October and moving NE due to constant explosions.
Similar activity continued during November, with explosions, ash plumes, and ashfall occurring. KVERT issued VONAs on 1-2, 4, 6-7, 9, 13, and 16 November that reported explosions and resulting ash plumes that rose to 1.7-3.6 km altitude and drifted 3-5 km SE, ESE, E, and NE. On 1 November ash plumes extended as far as 110 km SE. On 5, 8, 12, and 24-25 November explosions and ash plumes rose to 2-3.1 km altitude and drifted N and E. Ashfall was observed in Severo-Kurilsk on 7 and 16 November. A thermal anomaly was visible during 1-4, 16, and 20 November. Explosions during 26 November rose as high as 2.7 km altitude and drifted NE (figure 45).
Explosions and ash plumes continued to occur in December. During 1-2 and 4 December volcanologists from Severo-Kurilsk observed explosions that sent ash to 1.9-2.5 km altitude and drifted NE and SE (figure 46). VONAs were issued on 5, 9, and 16 December reporting that explosions generated ash plumes rising to 1.9 km, 2.6 km, and 2.4 km altitude and drifted 5 km SE, E, and NE, respectively. A thermal anomaly was visible in satellite imagery on 16 December. On 18 and 27-28 December explosions produced ash plumes that rose to 2.5 km altitude and drifted NE and SE. On 31 December an ash plume rose to 2 km altitude and drifted NE.
Explosions continued during January 2023, based on visual observations by volcanologists from Severo-Kurilsk. During 1-7 January explosions generated ash plumes that rose to 4 km altitude and drifted NE, E, W, and SE. According to VONAs issued by KVERT on 2, 4, 10, and 23 January, explosions produced ash plumes that rose to 2-4 km altitude and drifted 5 km N, NE, E, and ENE; the ash plume that rose to 4 km altitude occurred on 10 January (figure 47). Satellite data showed a thermal anomaly during 3-4, 10, 13, 16, 21, 22, and 31 January. KVERT reported that an ash cloud on 4 January moved 12 km NE. On 6 and 9-11 January explosions sent ash plumes to 4.5 km altitude and drifted W and ESE. On 13 January an ash plume rose to 3 km altitude and drifted SE. During 20-24 January ash plumes from explosions rose to 3.7 km altitude and drifted SE, N, and NE. On 21 January the ash plume drifted as far as 40 km NE. During 28-29 and 31 January and 1 February ash plumes rose to 4 km altitude and drifted NE.
During February, explosions, ash plumes, and ashfall were reported. During 1, 4-5 and 7-8 February explosions generated ash plumes that rose to 4.5 km altitude and drifted E and NE; ashfall was observed on 5 and 8 February. On 6 February an explosion produced an ash plume that rose to 3 km altitude and drifted 7 km E, causing ashfall in Severo-Kurilsk. A thermal anomaly was visible in satellite data on 8, 9, 13, and 21 February. Explosions on 9 and 12-13 February produced ash plumes that rose to 4 km altitude and drifted E and NE; the ash cloud on 12 February extended as far as 45 km E. On 22 February explosions sent ash to 3 km altitude that drifted E. During 24 and 26-27 February ash plumes rose to 4 km altitude and drifted E. On 28 February an explosion sent ash to 2.5-3 km altitude and drifted 5 km E; ashfall was observed in Severo-Kurilsk.
Activity continued during March; visual observations showed that explosions generated ash plumes that rose to 3.6 km altitude on 3, 5-7, and 9-12 March and drifted E, NE, and NW. Thermal anomalies were visible on 10, 13, and 29-30 March in satellite imagery. On 18, 21-23, 26, and 29-30 March explosions produced ash plumes that rose to 2.8 km altitude and drifted NE and E; the ash plumes during 22-23 March extended up to 76 km E. A VONA issued on 21 March reported an explosion that produced an ash plume that rose to 2.8 km altitude and drifted 5 km E. Another VONA issued on 23 March reported that satellite data showed an ash plume rising to 3 km altitude and drifted 14 km E.
Explosions during April continued to generate ash plumes. On 1 and 4 April an ash plume rose to 2.8-3.5 km altitude and drifted SE and NE. A thermal anomaly was visible in satellite imagery during 1-6 April. Satellite data showed ash plumes and clouds rising to 2-3 km altitude and drifting up to 12 km SW and E on 3 and 6 April (figure 48). KVERT issued VONAs on 3, 5, 14, 16 April describing explosions that produced ash plumes rising to 3 km, 3.5 km, 3.5 km, and 3 km altitude and drifting 5 km S, 5 km NE and SE, 72 km NNE, and 5 km NE, respectively. According to satellite data, the resulting ash cloud from the explosion on 14 April was 25 x 7 km in size and drifted 72-104 km NNE during 14-15 April. According to visual data by volcanologists from Severo-Kurilsk explosions sent ash up to 3.5 km altitude that drifted NE and E during 15-16, 22, 25-26, and 29 April.
The explosive eruption continued during May. Explosions during 3-4, 6-7, and 9-10 May generated ash plumes that rose to 4 km altitude and drifted SW and E. Satellite data showed a thermal anomaly on 3, 9, 13-14, and 24 May. During 12-16, 23-25, and 27-28 May ash plumes rose to 3.5 km altitude and drifted in different directions due to explosions. Two VONA notices were issued on 16 and 25 May, describing explosions that generated ash plumes rising to 3 km and 3.5 km altitude, respectively and extending 5 km E. The ash cloud on 25 May drifted 75 km SE.
Thermal activity in the summit crater, occasionally accompanied by ash plumes and ash deposits on the SE and E flanks due to frequent explosions, were visible in infrared and true color satellite images (figure 49).
Geologic Background. The flat-topped summit of the central cone of Ebeko volcano, one of the most active in the Kuril Islands, occupies the northern end of Paramushir Island. Three summit craters located along a SSW-NNE line form Ebeko volcano proper, at the northern end of a complex of five volcanic cones. Blocky lava flows extend west from Ebeko and SE from the neighboring Nezametnyi cone. The eastern part of the southern crater contains strong solfataras and a large boiling spring. The central crater is filled by a lake about 20 m deep whose shores are lined with steaming solfataras; the northern crater lies across a narrow, low barrier from the central crater and contains a small, cold crescentic lake. Historical activity, recorded since the late-18th century, has been restricted to small-to-moderate explosive eruptions from the summit craters. Intense fumarolic activity occurs in the summit craters, on the outer flanks of the cone, and in lateral explosion craters.
Information Contacts: Kamchatka Volcanic Eruptions Response Team (KVERT), Far Eastern Branch, Russian Academy of Sciences, 9 Piip Blvd., Petropavlovsk-Kamchatsky, 683006, Russia (URL: http://www.kscnet.ru/ivs/kvert/); MIROVA (Middle InfraRed Observation of Volcanic Activity), a collaborative project between the Universities of Turin and Florence (Italy) supported by the Centre for Volcanic Risk of the Italian Civil Protection Department (URL: http://www.mirovaweb.it/); Copernicus Browser, Copernicus Data Space Ecosystem, European Space Agency (URL: https://dataspace.copernicus.eu/browser/).
Home Reef
Tonga
18.992°S, 174.775°W; summit elev. -10 m
All times are local (unless otherwise noted)
Discolored plumes continued during November 2022-April 2023
Home Reef is a submarine volcano located in the central Tonga islands between Lateiki (Metis Shoal) and Late Island. The first recorded eruption occurred in the mid-19th century, when an ephemeral island formed. An eruption in 1984 produced a 12-km-high eruption plume, a large volume of floating pumice, and an ephemeral island 500 x 1,500 m wide, with cliffs 30-50 m high that enclosed a water-filled crater. Another island-forming eruption in 2006 produced widespread pumice rafts that drifted as far as Australia; by 2008 the island had eroded below sea level. The previous eruption occurred during October 2022 and was characterized by a new island-forming eruption, lava effusion, ash plumes, discolored water, and gas-and-steam plumes (BGVN 47:11). This report covers discolored water plumes during November 2022 through April 2023 using satellite data.
Discolored plumes continued during the reporting period and were observed in true color satellite images on clear weather days. Satellite images show light green-yellow discolored water extending W on 8 and 28 November 2022 (figure 31), and SW on 18 November. Light green-yellow plumes extended W on 3 December, S on 13 December, SW on 18 December, and W and S on 23 December (figure 31). On 12 January 2023 discolored green-yellow plumes extended to the NE, E, SE, and N. The plume moved SE on 17 January and NW on 22 January. Faint discolored water in February was visible moving NE on 1 February. A discolored plume extended NW on 8 and 28 March and NW on 13 March (figure 31). During April, clear weather showed green-blue discolored plumes moving S on 2 April, W on 7 April, and NE and S on 12 April. A strong green-yellow discolored plume extended E and NE on 22 April for several kilometers (figure 31).
Geologic Background. Home Reef, a submarine volcano midway between Metis Shoal and Late Island in the central Tonga islands, was first reported active in the mid-19th century, when an ephemeral island formed. An eruption in 1984 produced a 12-km-high eruption plume, large amounts of floating pumice, and an ephemeral 500 x 1,500 m island, with cliffs 30-50 m high that enclosed a water-filled crater. In 2006 an island-forming eruption produced widespread dacitic pumice rafts that drifted as far as Australia. Another island was built during a September-October 2022 eruption.
Information Contacts: Copernicus Browser, Copernicus Data Space Ecosystem, European Space Agency (URL: https://dataspace.copernicus.eu/browser/).
Semisopochnoi (United States) — June 2023 Cite this Report
Semisopochnoi
United States
51.93°N, 179.58°E; summit elev. 1221 m
All times are local (unless otherwise noted)
Occasional explosions, ash deposits, and gas-and-steam plumes during December 2022-May 2023
Semisopochnoi is located in the western Aleutians, is 20-km-wide at sea level, and contains an 8-km-wide caldera. The three-peaked Mount Young (formerly Cerberus) was constructed within the caldera during the Holocene. Each of these peaks contains a summit crater; the lava flows on the N flank appear younger than those on the S side. The current eruption period began in early February 2021 and has more recently consisted of intermittent explosions and ash emissions (BGVN 47:12). This report updates activity during December 2022 through May 2023 using daily, weekly, and special reports from the Alaska Volcano Observatory (AVO). AVO monitors the volcano using local seismic and infrasound sensors, satellite data, web cameras, and remote infrasound and lightning networks.
Activity during most of December 2022 was relatively quiet; according to AVO no eruptive or explosive activity was observed since 7 November 2022. Intermittent tremor and occasional small earthquakes were observed in geophysical data. Continuous gas-and-steam emissions were observed from the N crater of Mount Young in webcam images on clear weather days (figure 25). On 24 December, there was a slight increase in earthquake activity and several small possible explosion signals were detected in infrasound data. Eruptive activity resumed on 27 December at the N crater of Mount Young; AVO issued a Volcano Activity Notice (VAN) that reported minor ash deposits on the flanks of Mount Young that extended as far as 1 km from the vent, according to webcam images taken during 27-28 December (figure 26). No ash plumes were observed in webcam or satellite imagery, but a persistent gas-and-steam plume that might have contained some ash rose to 1.5 km altitude. As a result, AVO raised the Aviation Color Code (ACC) to Orange (the second highest level on a four-color scale) and the Volcano Alert Level (VAL) to Watch (the second highest level on a four-level scale). Possible explosions were detected during 21 December 2022 through 1 January 2023 and seismic tremor was recorded during 30-31 December.
During January 2023 eruptive activity continued at the active N crater of Mount Young. Minor ash deposits were observed on the flanks, extending about 2 km SSW, based on webcam images from 1 and 3 January. A possible explosion occurred during 1-2 January based on elevated seismicity recorded on local seismometers and an infrasound signal recorded minutes later by an array at Adak. Though no ash plumes were observed in webcam or satellite imagery, a persistent gas-and-steam plume rose to 1.5 km altitude that might have carried minor traces of ash. Ash deposits were accompanied by periods of elevated seismicity and infrasound signals from the local geophysical network, which AVO reported were likely due to weak explosive activity. Low-level explosive activity was also detected during 2-3 January, with minor gas-and-steam emissions and a new ash deposit that was visible in webcam images. Low-level explosive activity was detected in geophysical data during 4-5 January, with elevated seismicity and infrasound signals observed on local stations. Volcanic tremor was detected during 7-9 January and very weak explosive activity was detected in seismic and infrasound data on 9 January. Weak seismic and infrasound signals were recorded on 17 January, which indicated minor explosive activity, but no ash emissions were observed in clear webcam images; a gas-and-steam plume continued to rise to 1.5 km altitude. During 29-30 January, ash deposits near the summit were observed on fresh snow, according to webcam images.
The active N cone at Mount Young continued to produce a gas-and-steam plume during February, but no ash emissions or explosive events were detected. Seismicity remained elevated with faint tremor during early February. Gas-and-steam emissions from the N crater were observed in clear webcam images on 11-13 and 16 February; no explosive activity was detected in seismic, infrasound, or satellite data. Seismicity has also decreased, with no significant seismic tremor observed since 25 January. Therefore, the ACC was lowered to Yellow (the second lowest level on a four-color scale) and the VAL was lowered to Advisory (the second lowest level on a four-color scale) on 22 February.
Gas-and-steam emissions persisted during March from the N cone of Mount Young, based on clear webcam images. A few brief episodes of weak tremor were detected in seismic data, although seismicity decreased over the month. A gas-and-steam plume detected in satellite data extended 150 km on 18 March. Low-level ash emissions from the N cone at Mount Young were observed in several webcam images during 18-19 March, in addition to small explosions and volcanic tremor. The ACC was raised to Orange and the VAL increased to Watch on 19 March. A small explosion was detected in seismic and infrasound data on 21 March.
Low-level unrest continued during April, although cloudy weather often obscured views of the summit; periods of seismic tremor and local earthquakes were recorded. During 3-4 April a gas-and-steam plume was visible traveling more than 200 km overnight; no ash was evident in the plume, according to AVO. A gas-and-steam plume was observed during 4-6 April that extended 400 km but did not seem to contain ash. Small explosions were detected in seismic and infrasound data on 5 April. Occasional clear webcam images showed continuing gas-and-steam emissions rose from Mount Young, but no ash deposits were observed on the snow. On 19 April small explosions and tremor were detected in seismic and infrasound data. A period of seismic tremor was detected during 22-25 April, with possible weak explosions on 25 April. Ash deposits were visible near the crater rim, but it was unclear if these deposits were recent or due to older deposits.
Occasional small earthquakes were recorded during May, but there were no signs of explosive activity seen in geophysical data. Gas-and-steam emissions continued from the N crater of Mount Young, based on webcam images, and seismicity remained slightly elevated. A new, light ash deposit was visible during the morning of 5 May on fresh snow on the NW flank of Mount Young. During 10 May periods of volcanic tremor were observed. The ACC was lowered to Yellow and the VAL to Advisory on 17 May due to no additional evidence of activity.
Geologic Background. Semisopochnoi, the largest subaerial volcano of the western Aleutians, is 20 km wide at sea level and contains an 8-km-wide caldera. It formed as a result of collapse of a low-angle, dominantly basaltic volcano following the eruption of a large volume of dacitic pumice. The high point of the island is Anvil Peak, a double-peaked late-Pleistocene cone that forms much of the island's northern part. The three-peaked Mount Cerberus (renamed Mount Young in 2023) was constructed within the caldera during the Holocene. Each of the peaks contains a summit crater; lava flows on the N flank appear younger than those on the south side. Other post-caldera volcanoes include the symmetrical Sugarloaf Peak SSE of the caldera and Lakeshore Cone, a small cinder cone at the edge of Fenner Lake in the NE part of the caldera. Most documented eruptions have originated from Young, although Coats (1950) considered that both Sugarloaf and Lakeshore Cone could have been recently active.
Information Contacts: Alaska Volcano Observatory (AVO), a cooperative program of a) U.S. Geological Survey, 4200 University Drive, Anchorage, AK 99508-4667 USA (URL: https://avo.alaska.edu/), b) Geophysical Institute, University of Alaska, PO Box 757320, Fairbanks, AK 99775-7320, USA, and c) Alaska Division of Geological & Geophysical Surveys, 794 University Ave., Suite 200, Fairbanks, AK 99709, USA (URL: http://dggs.alaska.gov/).
Ambae
Vanuatu
15.389°S, 167.835°E; summit elev. 1496 m
All times are local (unless otherwise noted)
New lava flow, ash plumes, and sulfur dioxide plumes during February-May 2023
Ambae, also known as Aoba, is a large basaltic shield volcano in Vanuatu. A broad pyroclastic cone containing three crater lakes (Manaro Ngoru, Voui, and Manaro Lakua) is located at the summit within the youngest of at least two nested calderas. Periodic phreatic and pyroclastic explosions have been reported since the 16th century. A large eruption more than 400 years ago resulted in a volcanic cone within the summit crater that is now filled by Lake Voui; the similarly sized Lake Manaro fills the western third of the caldera. The previous eruption ended in August 2022 that was characterized by gas-and-steam and ash emissions and explosions of wet tephra (BGVN 47:10). This report covers a new eruption during February through May 2023 that consisted of a new lava flow, ash plumes, and sulfur dioxide emissions, using information from the Vanuatu Meteorology and Geo-Hazards Department (VMGD) and satellite data.
During the reporting period, the Alert Level remained at a 2 (on a scale of 0-5), which has been in place since December 2021. Activity during October 2022 through March 2023 remained relatively low and mostly consisted of gas-and-steam emissions in Lake Voui. VMGD reported that at 1300 on 15 November a satellite image captured a strong amount of sulfur dioxide rising above the volcano (figure 99), and that seismicity slightly increased. The southern and northern part of the island reported a strong sulfur dioxide smell and heard explosions. On 20 February 2023 a gas-and-ash plume rose 1.3 km above the summit and drifted SSW, according to a webcam image (figure 100). Gas-and-steam and possibly ash emissions continued on 23 February and volcanic earthquakes were recorded by the seismic network.
During April, volcanic earthquakes and gas-and-steam and ash emissions were reported from the cone in Lake Voui. VMGD reported that activity increased during 5-7 April; high gas-and-steam and ash plumes were visible, accompanied by nighttime incandescence. According to a Wellington VAAC report, a low-level ash plume rose as high as 2.5 km above the summit and drifted W and SW on 5 April, based on satellite imagery. Reports in Saratamata stated that a dark ash plume drifted to the WSW, but no loud explosion was heard. Webcam images from 2100 showed incandescence above the crater and reflected in the clouds. According to an aerial survey, field observations, and satellite data, water was no longer present in the lake. A lava flow was reported effusing from the vent and traveling N into the dry Lake Voui, which lasted three days. The next morning at 0745 on 6 April a gas-and-steam and ash plume rose 5.4 km above the summit and drifted ESE, based on information from VMGD (figure 101). The Wellington VAAC also reported that light ashfall was observed on the island. Intermittent gas-and-steam and ash emissions were visible on 7 April, some of which rose to an estimated 3 km above the summit and drifted E. Webcam images during 0107-0730 on 7 April showed continuing ash emissions. A gas-and-steam and ash plume rose 695 m above the summit crater at 0730 on 19 April and drifted ESE, based on a webcam image (figure 102).
According to visual and infrared satellite data, water was visible in Lake Voui as late as 24 March 2023 (figure 103). The vent in the caldera showed a gas-and-steam plume drifted SE. On 3 April thermal activity was first detected, accompanied by a gas-and-ash plume that drifted W (figure 103). The lava flow moved N within the dry lake and was shown cooling by 8 April. By 23 April much of the water in the lake had returned. Occasional sulfur dioxide plumes were detected by the TROPOMI instrument on the Sentinel-5P satellite that exceeded 2 Dobson Units (DU) and drifted in different directions (figure 104).
Geologic Background. The island of Ambae, also known as Aoba, is a massive 2,500 km3 basaltic shield that is the most voluminous volcano of the New Hebrides archipelago. A pronounced NE-SW-trending rift zone with numerous scoria cones gives the 16 x 38 km island an elongated form. A broad pyroclastic cone containing three crater lakes (Manaro Ngoru, Voui, and Manaro Lakua) is located at the summit within the youngest of at least two nested calderas, the largest of which is 6 km in diameter. That large central edifice is also called Manaro Voui or Lombenben volcano. Post-caldera explosive eruptions formed the summit craters about 360 years ago. A tuff cone was constructed within Lake Voui (or Vui) about 60 years later. The latest known flank eruption, about 300 years ago, destroyed the population of the Nduindui area near the western coast.
Information Contacts: Geo-Hazards Division, Vanuatu Meteorology and Geo-Hazards Department (VMGD), Ministry of Climate Change Adaptation, Meteorology, Geo-Hazards, Energy, Environment and Disaster Management, Private Mail Bag 9054, Lini Highway, Port Vila, Vanuatu (URL: http://www.vmgd.gov.vu/, https://www.facebook.com/VanuatuGeohazardsObservatory/); Wellington Volcanic Ash Advisory Centre (VAAC), Meteorological Service of New Zealand Ltd (MetService), PO Box 722, Wellington, New Zealand (URL: http://www.metservice.com/vaac/, http://www.ssd.noaa.gov/VAAC/OTH/NZ/messages.html); MIROVA (Middle InfraRed Observation of Volcanic Activity), a collaborative project between the Universities of Turin and Florence (Italy) supported by the Centre for Volcanic Risk of the Italian Civil Protection Department (URL: http://www.mirovaweb.it/); Global Sulfur Dioxide Monitoring Page, Atmospheric Chemistry and Dynamics Laboratory, NASA Goddard Space Flight Center (NASA/GSFC), 8800 Greenbelt Road, Goddard, Maryland, USA (URL: https://so2.gsfc.nasa.gov/); Copernicus Browser, Copernicus Data Space Ecosystem, European Space Agency (URL: https://dataspace.copernicus.eu/browser/).
Ibu
Indonesia
1.488°N, 127.63°E; summit elev. 1325 m
All times are local (unless otherwise noted)
Daily ash explosions continue, along with thermal anomalies in the crater, October 2022-May 2023
Persistent eruptive activity since April 2008 at Ibu, a stratovolcano on Indonesian’s Halmahera Island, has consisted of daily explosive ash emissions and plumes, along with observations of thermal anomalies (BGVN 47:04). The current eruption continued during October 2022-May 2023, described below, based on advisories issued by the Pusat Vulkanologi dan Mitigasi Bencana Geologi (PVMBG, also known as Indonesian Center for Volcanology and Geological Hazard Mitigation, CVGHM), daily reports by MAGMA Indonesia (a PVMBG platform), and the Darwin Volcanic Ash Advisory Centre (VAAC), and various satellite data. The Alert Level during the reporting period remained at 2 (on a scale of 1-4), except raised briefly to 3 on 27 May, and the public was warned to stay at least 2 km away from the active crater and 3.5 km away on the N side of the volcano.
According to MAGMA Indonesia, during October 2022-May 2023, daily gray-and-white ash plumes of variable densities rose 200-1,000 m above the summit and drifted in multiple directions. On 30 October and 11 November, plumes rose a maximum of 2 km and 1.5 km above the summit, respectively (figures 42 and 43). According to the Darwin VAAC, discrete ash emissions on 13 November rose to 2.1 km altitude, or 800 m above the summit, and drifted W, and multiple ash emissions on 15 November rose 1.4 km above the summit and drifted NE. Occasional larger ash explosions through May 2023 prompted PVMBG to issue Volcano Observatory Notice for Aviation (VONA) alerts (table 6); the Aviation Color Code remained at Orange throughout this period.
Table 6. Volcano Observatory Notice for Aviation (VONA) ash plume alerts for Ibu issued by PVMBG during October 2022-May 2023. Maximum height above the summit was estimated by a ground observer. VONAs in January-May 2023 all described the ash plumes as dense.
| Date |
Time (local) |
Max height above summit |
Direction |
| 17 Oct 2022 |
0858 |
800 m |
SW |
| 18 Oct 2022 |
1425 |
800 m |
S |
| 19 Oct 2022 |
2017 |
600 m |
SW |
| 21 Oct 2022 |
0916 |
800 m |
NW |
| 16 Jan 2023 |
1959 |
600 m |
NE |
| 22 Jan 2023 |
0942 |
1,000 m |
E |
| 29 Jan 2023 |
2138 |
1,000 m |
E |
| 10 May 2023 |
0940 |
800 m |
NW |
| 10 May 2023 |
2035 |
600 m |
E |
| 21 May 2023 |
2021 |
600 m |
W |
| 21 May 2023 |
2140 |
1,000 m |
W |
| 29 May 2023 |
1342 |
800 m |
N |
| 31 May 2023 |
1011 |
1,000 m |
SW |
Sentinel-2 L1C satellite images throughout the reporting period show two, sometimes three persistent thermal anomalies in the summit crater, with the most prominent hotspot from the top of a cone within the crater. Clear views were more common during March-April 2023, when a vent and lava flows on the NE flank of the intra-crater cone could be distinguished (figure 44). White-to-grayish emissions were also observed during brief periods when weather clouds allowed clear views.
The MIROVA space-based volcano hotspot detection system recorded almost daily thermal anomalies throughout the reporting period, though cloud cover often interfered with detections. Data from imaging spectroradiometers aboard NASA’s Aqua and Terra satellites and processed using the MODVOLC algorithm (MODIS-MODVOLC) recorded hotspots on one day during October 2022 and December 2022, two days in April 2023, three days in November 2022 and May 2023, and four days in March 2023.
Geologic Background. The truncated summit of Gunung Ibu stratovolcano along the NW coast of Halmahera Island has large nested summit craters. The inner crater, 1 km wide and 400 m deep, has contained several small crater lakes. The 1.2-km-wide outer crater is breached on the N, creating a steep-walled valley. A large cone grew ENE of the summit, and a smaller one to the WSW has fed a lava flow down the W flank. A group of maars is located below the N and W flanks. The first observed and recorded eruption was a small explosion from the summit crater in 1911. Eruptive activity began again in December 1998, producing a lava dome that eventually covered much of the floor of the inner summit crater along with ongoing explosive ash emissions.
Information Contacts: Pusat Vulkanologi dan Mitigasi Bencana Geologi (PVMBG, also known as Indonesian Center for Volcanology and Geological Hazard Mitigation, CVGHM), Jalan Diponegoro 57, Bandung 40122, Indonesia (URL: http://www.vsi.esdm.go.id/); MAGMA Indonesia (Multiplatform Application for Geohazard Mitigation and Assessment in Indonesia), Kementerian Energi dan Sumber Daya Mineral (URL: https://magma.esdm.go.id/v1); Copernicus Browser, Copernicus Data Space Ecosystem, European Space Agency (URL: https://dataspace.copernicus.eu/browser/); MIROVA (Middle InfraRed Observation of Volcanic Activity), a collaborative project between the Universities of Turin and Florence (Italy) supported by the Centre for Volcanic Risk of the Italian Civil Protection Department (URL: http://www.mirovaweb.it/); Hawai'i Institute of Geophysics and Planetology (HIGP) - MODVOLC Thermal Alerts System, School of Ocean and Earth Science and Technology (SOEST), Univ. of Hawai'i, 2525 Correa Road, Honolulu, HI 96822, USA (URL: http://modis.higp.hawaii.edu/).
Dukono
Indonesia
1.6992°N, 127.8783°E; summit elev. 1273 m
All times are local (unless otherwise noted)
Continuing ash emissions, SO2 plumes, and thermal signals during October 2022-May 2023
Dukono, a remote volcano on Indonesia’s Halmahera Island, has been erupting continuously since 1933, with frequent ash explosions and sulfur dioxide plumes (BGVN 46:11, 47:10). This activity continued during October 2022 through May 2023, based on reports from the Pusat Vulkanologi dan Mitigasi Bencana Geologi (PVMBG; also known as Indonesian Center for Volcanology and Geological Hazard Mitigation, CVGHM), the Darwin Volcanic Ash Advisory Centre (VAAC), and satellite data. During this period, the Alert Level remained at 2 (on a scale of 1-4) and the public was warned to remain outside of the 2-km exclusion zone. The highest reported plume of the period reached 9.4 km above the summit on 14 November 2022.
According to MAGMA Indonesia (a platform developed by PVMBG), white, gray, or dark plumes of variable densities were observed almost every day during the reporting period, except when fog obscured the volcano (figure 33). Plumes generally rose 25-450 m above the summit, but rose as high as 700-800 m on several days, somewhat lower than the maximum heights reached earlier in 2022 when plumes reached as high as 1 km. However, the Darwin VAAC reported that on 14 November 2022, a discrete ash plume rose 9.4 km above the summit (10.7 km altitude), accompanied by a strong hotspot and a sulfur dioxide signal observed in satellite imagery; a continuous ash plume that day and through the 15th rose to 2.1-2.4 km altitude and drifted NE.
Sentinel-2 images were obscured by weather clouds almost every viewing day during the reporting period. However, the few reasonably clear images showed a hotspot and white or gray emissions and plumes. Strong SO2 plumes from Dukono were present on many days during October 2022-May 2023, as detected using the TROPOMI instrument on the Sentinel-5P satellite (figure 34).
Geologic Background. Reports from this remote volcano in northernmost Halmahera are rare, but Dukono has been one of Indonesia's most active volcanoes. More-or-less continuous explosive eruptions, sometimes accompanied by lava flows, have occurred since 1933. During a major eruption in 1550 CE, a lava flow filled in the strait between Halmahera and the N-flank Gunung Mamuya cone. This complex volcano presents a broad, low profile with multiple summit peaks and overlapping craters. Malupang Wariang, 1 km SW of the summit crater complex, contains a 700 x 570 m crater that has also been active during historical time.
Information Contacts: Pusat Vulkanologi dan Mitigasi Bencana Geologi (PVMBG, also known as Indonesian Center for Volcanology and Geological Hazard Mitigation, CVGHM), Jalan Diponegoro 57, Bandung 40122, Indonesia (URL: http://www.vsi.esdm.go.id/); MAGMA Indonesia (Multiplatform Application for Geohazard Mitigation and Assessment in Indonesia), Kementerian Energi dan Sumber Daya Mineral (URL: https://magma.esdm.go.id/v1); Darwin Volcanic Ash Advisory Centre (VAAC), Bureau of Meteorology, Northern Territory Regional Office, PO Box 40050, Casuarina, NT 0811, Australia (URL: http://www.bom.gov.au/info/vaac/); NASA Global Sulfur Dioxide Monitoring Page, Atmospheric Chemistry and Dynamics Laboratory, NASA Goddard Space Flight Center (NASA/GSFC), 8800 Greenbelt Road, Goddard, Maryland, USA (URL: https://so2.gsfc.nasa.gov/); Sentinel Hub Playground (URL: https://www.sentinel-hub.com/explore/sentinel-playground).
Sabancaya
Peru
15.787°S, 71.857°W; summit elev. 5960 m
All times are local (unless otherwise noted)
Explosions, gas-and-ash plumes, and thermal activity persist during November 2022-April 2023
Sabancaya is located in Peru, NE of Ampato and SE of Hualca Hualca. Eruptions date back to 1750 and have been characterized by explosions, phreatic activity, ash plumes, and ashfall. The current eruption period began in November 2016 and has more recently consisted of daily explosions, gas-and-ash plumes, and thermal activity (BGVN 47:11). This report updates activity during November 2022 through April 2023 using information from Instituto Geophysico del Peru (IGP) that use weekly activity reports and various satellite data.
Intermittent low-to-moderate power thermal anomalies were reported by the MIROVA project during November 2022 through April 2023 (figure 119). There were few short gaps in thermal activity during mid-December 2022, late December-to-early January 2023, late January to mid-February, and late February. According to data recorded by the MODVOLC thermal algorithm, there were a total of eight thermal hotspots: three in November 2022, three in February 2023, one in March, and one in April. On clear weather days, some of this thermal anomaly was visible in infrared satellite imagery showing the active lava dome in the summit crater (figure 120). Almost daily moderate-to-strong sulfur dioxide plumes were recorded during the reporting period by the TROPOMI instrument on the Sentinel-5P satellite (figure 121). Many of these plumes exceeded 2 Dobson Units (DU) and drifted in multiple directions.
IGP reported that moderate activity during November and December 2022 continued; during November, an average number of explosions were reported each week: 30, 33, 36, and 35, and during December, it was 32, 40, 47, 52, and 67. Gas-and-ash plumes in November rose 3-3.5 km above the summit and drifted E, NE, SE, S, N, W, and SW. During December the gas-and-ash plumes rose 2-4 km above the summit and drifted in different directions. There were 1,259 volcanic earthquakes recorded during November and 1,693 during December. Seismicity also included volcano-tectonic-type events that indicate rock fracturing events. Slight inflation was observed in the N part of the volcano near Hualca Hualca (4 km N). Thermal activity was frequently reported in the crater at the active lava dome (figure 120).
Explosive activity continued during January and February 2023. The average number of explosions were reported each week during January (51, 50, 60, and 59) and February (43, 54, 51, and 50). Gas-and-ash plumes rose 1.6-2.9 km above the summit and drifted NW, SW, and W during January and rose 1.4-2.8 above the summit and drifted W, SW, E, SE, N, S, NW, and NE during February. IGP also detected 1,881 volcanic earthquakes during January and 1,661 during February. VT-type earthquakes were also reported. Minor inflation persisted near Hualca Hualca. Satellite imagery showed continuous thermal activity in the crater at the lava dome (figure 120).
During March, the average number of explosions each week was 46, 48, 31, 35, and 22 and during April, it was 29, 41, 31, and 27. Accompanying gas-and-ash plumes rose 1.7-2.6 km above the summit crater and drifted W, SW, NW, S, and SE during March. According to a Buenos Aires Volcano Ash Advisory Center (VAAC) notice, on 22 March at 1800 through 23 March an ash plume rose to 7 km altitude and drifted NW. By 0430 an ash plume rose to 7.6 km altitude and drifted W. On 24 and 26 March continuous ash emissions rose to 7.3 km altitude and drifted SW and on 28 March ash emissions rose to 7.6 km altitude. During April, gas-and-ash plumes rose 1.6-2.5 km above the summit and drifted W, SW, S, NW, NE, and E. Frequent volcanic earthquakes were recorded, with 1,828 in March and 1,077 in April, in addition to VT-type events. Thermal activity continued to be reported in the summit crater at the lava dome (figure 120).
Geologic Background. Sabancaya, located in the saddle NE of Ampato and SE of Hualca Hualca volcanoes, is the youngest of these volcanic centers and the only one to have erupted in historical time. The oldest of the three, Nevado Hualca Hualca, is of probable late-Pliocene to early Pleistocene age. The name Sabancaya (meaning "tongue of fire" in the Quechua language) first appeared in records in 1595 CE, suggesting activity prior to that date. Holocene activity has consisted of Plinian eruptions followed by emission of voluminous andesitic and dacitic lava flows, which form an extensive apron around the volcano on all sides but the south. Records of historical eruptions date back to 1750.
Information Contacts: Instituto Geofisico del Peru (IGP), Centro Vulcanológico Nacional (CENVUL), Calle Badajoz N° 169 Urb. Mayorazgo IV Etapa, Ate, Lima 15012, Perú (URL: https://www.igp.gob.pe/servicios/centro-vulcanologico-nacional/inicio); Buenos Aires Volcanic Ash Advisory Center (VAAC), Servicio Meteorológico Nacional-Fuerza Aérea Argentina, 25 de mayo 658, Buenos Aires, Argentina (URL: http://www.smn.gov.ar/vaac/buenosaires/inicio.php); MIROVA (Middle InfraRed Observation of Volcanic Activity), a collaborative project between the Universities of Turin and Florence (Italy) supported by the Centre for Volcanic Risk of the Italian Civil Protection Department (URL: http://www.mirovaweb.it/); Hawai'i Institute of Geophysics and Planetology (HIGP) - MODVOLC Thermal Alerts System, School of Ocean and Earth Science and Technology (SOEST), Univ. of Hawai'i, 2525 Correa Road, Honolulu, HI 96822, USA (URL: http://modis.higp.hawaii.edu/); NASA Global Sulfur Dioxide Monitoring Page, Atmospheric Chemistry and Dynamics Laboratory, NASA Goddard Space Flight Center (NASA/GSFC), 8800 Greenbelt Road, Goddard MD 20771, USA (URL: https://so2.gsfc.nasa.gov/); Copernicus Browser, Copernicus Data Space Ecosystem, European Space Agency (URL: https://dataspace.copernicus.eu/browser/).
Sheveluch
Russia
56.653°N, 161.36°E; summit elev. 3283 m
All times are local (unless otherwise noted)
Significant explosions destroyed part of the lava-dome complex during April 2023
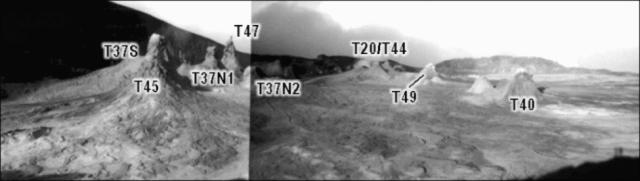
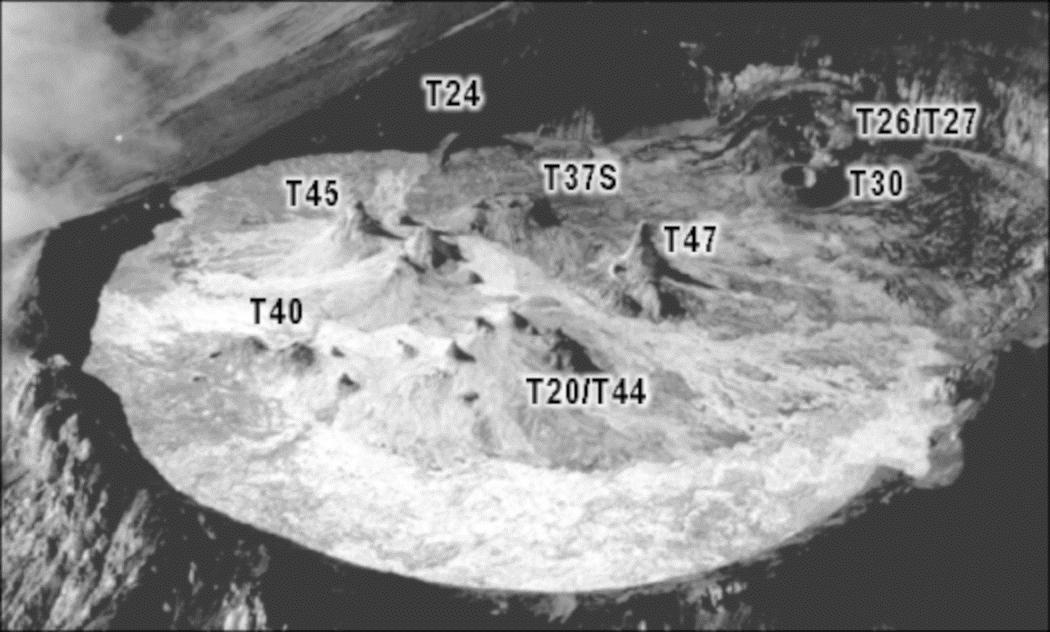
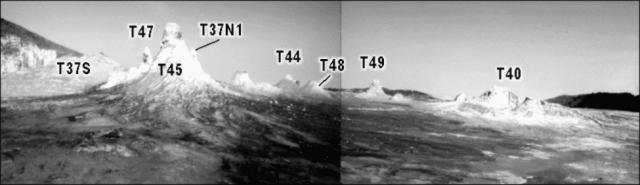
Sheveluch (also spelled Shiveluch) in Kamchatka, has had at least 60 large eruptions during the last 10,000 years. The summit is truncated by a broad 9-km-wide caldera that is breached to the S, and many lava domes occur on the outer flanks. The lava dome complex was constructed within the large open caldera. Frequent collapses of the dome complex have produced debris avalanches; the resulting deposits cover much of the caldera floor. A major south-flank collapse during a 1964 Plinian explosion produced a scarp in which a “Young Sheveluch” dome began to form in 1980. Repeated episodes of dome formation and destruction since then have produced major and minor ash plumes, pyroclastic flows, block-and-ash flows, and “whaleback domes” of spine-like extrusions in 1993 and 2020 (BGVN 45:11). The current eruption period began in August 1999 and has more recently consisted of lava dome growth, explosions, ash plumes, and avalanches (BGVN 48:01). This report covers a significant explosive eruption during early-to-mid-April 2023 that generated a 20 km altitude ash plume, produced a strong sulfur dioxide plume, and destroyed part of the lava-dome complex; activity described during January through April 2023 use information primarily from the Kamchatka Volcanic Eruptions Response Team (KVERT) and various satellite data.
Satellite data. Activity during the majority of this reporting period was characterized by continued lava dome growth, strong fumarole activity, explosions, and hot avalanches. According to the MODVOLC Thermal Alerts System, 140 hotspots were detected through the reporting period, with 33 recorded in January 2023, 29 in February, 44 in March, and 34 in April. Frequent strong thermal activity was recorded during January 2023 through April, according to the MIROVA (Middle InfraRed Observation of Volcanic Activity) graph and resulted from the continuously growing lava dome (figure 94). A slightly stronger pulse in thermal activity was detected in early-to-mid-April, which represented the significant eruption that destroyed part of the lava-dome complex. Thermal anomalies were also visible in infrared satellite imagery at the summit crater (figure 95).
During January 2023 KVERT reported continued growth of the lava dome, accompanied by strong fumarolic activity, incandescence from the lava dome, explosions, ash plumes, and avalanches. Satellite data showed a daily thermal anomaly over the volcano. Video data showed ash plumes associated with collapses at the dome that generated avalanches that in turn produced ash plumes rising to 3.5 km altitude and drifting 40 km W on 4 January and rising to 7-7.5 km altitude and drifting 15 km SW on 5 January. A gas-and-steam plume containing some ash that was associated with avalanches rose to 5-6 km altitude and extended 52-92 km W on 7 January. Explosions that same day produced ash plumes that rose to 7-7.5 km altitude and drifted 10 km W. According to a Volcano Observatory Notice for Aviation (VONA) issued at 1344 on 19 January, explosions produced an ash cloud that was 15 x 25 km in size and rose to 9.6-10 km altitude, drifting 21-25 km W; as a result, the Aviation Color Code (ACC) was raised to Red (the highest level on a four-color scale). Another VONA issued at 1635 reported that no more ash plumes were observed, and the ACC was lowered to Orange (the second highest level on a four-color scale). On 22 January an ash plume from collapses and avalanches rose to 5 km altitude and drifted 25 km NE and SW; ash plumes associated with collapses extended 70 km NE on 27 and 31 January.
Lava dome growth, fumarolic activity, dome incandescence, and occasional explosions and avalanches continued during February and March. A daily thermal anomaly was visible in satellite data. Explosions on 1 February generated ash plumes that rose to 6.3-6.5 km altitude and extended 15 km NE. Video data showed an ash cloud from avalanches rising to 5.5 km altitude and drifting 5 km SE on 2 February. Satellite data showed gas-and-steam plumes containing some ash rose to 5-5.5 km altitude and drifted 68-110 km ENE and NE on 6 February, to 4.5-5 km altitude and drifted 35 km WNW on 22 February, and to 3.7-4 km altitude and drifted 47 km NE on 28 February. Scientists from the Kamchatka Volcanological Station (KVS) went on a field excursion on 25 February to document the growing lava dome, and although it was cloudy most of the day, nighttime incandescence was visible. Satellite data showed an ash plume extending up to 118 km E during 4-5 March. Video data from 1150 showed an ash cloud from avalanches rose to 3.7-5.5 km altitude and drifted 5-10 km ENE and E on 5 March. On 11 March an ash plume drifted 62 km E. On 27 March ash plumes rose to 3.5 km altitude and drifted 100 km E. Avalanches and constant incandescence at the lava dome was focused on the E and NE slopes on 28 March. A gas-and-steam plume containing some ash rose to 3.5 km altitude and moved 40 km E on 29 March. Ash plumes on 30 March rose to 3.5-3.7 km altitude and drifted 70 km NE.
Similar activity continued during April, with lava dome growth, strong fumarolic activity, incandescence in the dome, occasional explosions, and avalanches. A thermal anomaly persisted throughout the month. During 1-4 April weak ash plumes rose to 2.5-3 km altitude and extended 13-65 km SE and E.
Activity during 11 April 2023. The Institute of Volcanology and Seismology, Far Eastern Branch, Russian Academy of Sciences (IVS FEB RAS) reported a significant increase in seismicity around 0054 on 11 April, as reported by strong explosions detected on 11 April beginning at 0110 that sent ash plumes up to 7-10 km altitude and extended 100-435 km W, WNW, NNW, WSW, and SW. According to a Tokyo VAAC report the ash plume rose to 15.8 km altitude. By 0158 the plume extended over a 75 x 100 km area. According to an IVS FEB RAS report, the eruptive column was not vertical: the initial plume at 0120 on 11 April deviated to the NNE, at 0000 on 12 April, it drifted NW, and by 1900 it drifted SW. KVS reported that significant pulses of activity occurred at around 0200, 0320, and then a stronger phase around 0600. Levin Dmitry took a video from near Békés (3 km away) at around 0600 showing a rising plume; he also reported that a pyroclastic flow traveled across the road behind him as he left the area. According to IVS FEB RAS, the pyroclastic flow traveled several kilometers SSE, stopping a few hundred meters from a bridge on the road between Klyuchi and Petropavlovsk-Kamchatsky.
Ashfall was first observed in Klyuchi (45 km SW) at 0630, and a large, black ash plume blocked light by 0700. At 0729 KVERT issued a Volcano Observatory Notice for Aviation (VONA) raising the Aviation Color Code to Red (the highest level on a four-color scale). It also stated that a large ash plume had risen to 10 km altitude and drifted 100 km W. Near-constant lightning strikes were reported in the plume and sounds like thunderclaps were heard until about 1000. According to IVS FEB RAS the cloud was 200 km long and 76 km wide by 0830, and was spreading W at altitudes of 6-12 km. In the Klyuchi Village, the layer of both ash and snow reached 8.5 cm (figure 96); ashfall was also reported in Kozyrevsk (112 km SW) at 0930, Mayskoye, Anavgay, Atlasovo, Lazo, and Esso. Residents in Klyuchi reported continued darkness and ashfall at 1100. In some areas, ashfall was 6 cm deep and some residents reported dirty water coming from their plumbing. According to IVS FEB RAS, an ash cloud at 1150 rose to 5-20 km altitude and was 400 km long and 250 km wide, extending W. A VONA issued at 1155 reported that ash had risen to 10 km and drifted 340 km NNW and 240 km WSW. According to Simon Carn (Michigan Technological University), about 0.2 Tg of sulfur dioxide in the plume was measured in a satellite image from the TROPOMI instrument on the Sentinel-5P satellite acquired at 1343 that covered an area of about 189,000 km2 (figure 97). Satellite data at 1748 showed an ash plume that rose to 8 km altitude and drifted 430 km WSW and S, according to a VONA.
Activity during 12-15 April 2023. On 12 April at 0730 satellite images showed ash plumes rose to 7-8 km altitude and extended 600 km SW, 1,050 km ESE, and 1,300-3,000 km E. By 1710 that day, the explosions weakened. According to news sources, the ash-and-gas plumes drifted E toward the Aleutian Islands and reached the Gulf of Alaska by 13 April, causing flight disruptions. More than 100 flights involving Alaska airspace were cancelled due to the plume. Satellite data showed ash plumes rising to 4-5.5 km altitude and drifted 400-415 km SE and ESE on 13 April. KVS volcanologists observed the pyroclastic flow deposits and noted that steam rose from downed, smoldering trees. They also noted that the deposits were thin with very few large fragments, which differed from previous flows. The ash clouds traveled across the Pacific Ocean. Flight cancellations were also reported in NW Canada (British Columbia) during 13-14 April. During 14-15 April ash plumes rose to 6 km altitude and drifted 700 km NW.
Alaskan flight schedules were mostly back to normal by 15 April, with only minor delays and far less cancellations; a few cancellations continued to be reported in Canada. Clear weather on 15 April showed that most of the previous lava-dome complex was gone and a new crater roughly 1 km in diameter was observed (figure 98); gas-and-steam emissions were rising from this crater. Evidence suggested that there had been a directed blast to the SE, and pyroclastic flows traveled more than 20 km. An ash plume rose to 4.5-5.2 km altitude and drifted 93-870 km NW on 15 April.
Activity during 16-30 April 2023. Resuspended ash was lifted by the wind from the slopes and rose to 4 km altitude and drifted 224 km NW on 17 April. KVERT reported a plume of resuspended ash from the activity during 10-13 April on 19 April that rose to 3.5-4 km altitude and drifted 146-204 km WNW. During 21-22 April a plume stretched over the Scandinavian Peninsula. A gas-and-steam plume containing some ash rose to 3-3.5 km altitude and drifted 60 km SE on 30 April. A possible new lava dome was visible on the W slope of the volcano on 29-30 April (figure 99); satellite data showed two thermal anomalies, a bright one over the existing lava dome and a weaker one over the possible new one.
References. Girina, O., Loupian, E., Horvath, A., Melnikov, D., Manevich, A., Nuzhdaev, A., Bril, A., Ozerov, A., Kramareva, L., Sorokin, A., 2023, Analysis of the development of the paroxysmal eruption of Sheveluch volcano on April 10–13, 2023, based on data from various satellite systems, ??????????? ???????? ??? ?? ???????, 20(2).
Geologic Background. The high, isolated massif of Sheveluch volcano (also spelled Shiveluch) rises above the lowlands NNE of the Kliuchevskaya volcano group. The 1,300 km3 andesitic volcano is one of Kamchatka's largest and most active volcanic structures, with at least 60 large eruptions during the Holocene. The summit of roughly 65,000-year-old Stary Shiveluch is truncated by a broad 9-km-wide late-Pleistocene caldera breached to the south. Many lava domes occur on its outer flanks. The Molodoy Shiveluch lava dome complex was constructed during the Holocene within the large open caldera; Holocene lava dome extrusion also took place on the flanks of Stary Shiveluch. Widespread tephra layers from these eruptions have provided valuable time markers for dating volcanic events in Kamchatka. Frequent collapses of dome complexes, most recently in 1964, have produced debris avalanches whose deposits cover much of the floor of the breached caldera.
Information Contacts: Kamchatka Volcanic Eruptions Response Team (KVERT), Far Eastern Branch, Russian Academy of Sciences, 9 Piip Blvd., Petropavlovsk-Kamchatsky, 683006, Russia (URL: http://www.kscnet.ru/ivs/kvert/); Institute of Volcanology and Seismology, Far Eastern Branch, Russian Academy of Sciences (IVS FEB RAS), 9 Piip Blvd., Petropavlovsk-Kamchatsky 683006, Russia (URL: http://www.kscnet.ru/ivs/eng/); Kamchatka Volcanological Station, Kamchatka Branch of Geophysical Survey, (KB GS RAS), Klyuchi, Kamchatka Krai, Russia (URL: http://volkstat.ru/); Hawai'i Institute of Geophysics and Planetology (HIGP) - MODVOLC Thermal Alerts System, School of Ocean and Earth Science and Technology (SOEST), Univ. of Hawai'i, 2525 Correa Road, Honolulu, HI 96822, USA (URL: http://modis.higp.hawaii.edu/); MIROVA (Middle InfraRed Observation of Volcanic Activity), a collaborative project between the Universities of Turin and Florence (Italy) supported by the Centre for Volcanic Risk of the Italian Civil Protection Department (URL: http://www.mirovaweb.it/); Copernicus Browser, Copernicus Data Space Ecosystem, European Space Agency (URL: https://dataspace.copernicus.eu/browser/); Kam 24 News Agency, 683032, Kamchatka Territory, Petropavlovsk-Kamchatsky, Vysotnaya St., 2A (URL: https://kam24.ru/news/main/20230411/96657.html#.Cj5Jrky6.dpuf); Simon Carn, Geological and Mining Engineering and Sciences, Michigan Technological University, 1400 Townsend Drive, Houghton, MI 49931, USA (URL: http://www.volcarno.com/, Twitter: @simoncarn).
Bezymianny
Russia
55.972°N, 160.595°E; summit elev. 2882 m
All times are local (unless otherwise noted)
Explosions, ash plumes, lava flows, and avalanches during November 2022-April 2023
Bezymianny is located on the Kamchatka Peninsula of Russia as part of the Klyuchevskoy volcano group. Historic eruptions began in 1955 and have been characterized by dome growth, explosions, pyroclastic flows, ash plumes, and ashfall. During the 1955-56 eruption a large open crater was formed by collapse of the summit and an associated lateral blast. Subsequent episodic but ongoing lava-dome growth, accompanied by intermittent explosive activity and pyroclastic flows, has largely filled the 1956 crater. The current eruption period began in December 2016 and more recent activity has consisted of strong explosions, ash plumes, and thermal activity (BGVN 47:11). This report covers activity during November 2022 through April 2023, based on weekly and daily reports from the Kamchatka Volcano Eruptions Response Team (KVERT) and satellite data.
Activity during November and March 2023 was relatively low and mostly consisted of gas-and-steam emissions, occasional small collapses that generated avalanches along the lava dome slopes, and a persistent thermal anomaly over the volcano that was observed in satellite data on clear weather days. According to the Tokyo VAAC and KVERT, an explosion produced an ash plume that rose to 6 km altitude and drifted 25 km NE at 1825 on 29 March.
Gas-and-steam emissions, collapses generating avalanches, and thermal activity continued during April. According to two Volcano Observatory Notice for Aviation (VONA) issued on 2 and 6 April (local time) ash plumes rose to 3 km and 3.5-3.8 km altitude and drifted 35 km E and 140 km E, respectively. Satellite data from KVERT showed weak ash plumes extending up to 550 km E on 2 and 5-6 April.
A VONA issued at 0843 on 7 April described an ash plume that rose to 4.5-5 km altitude and drifted 250 km ESE. Later that day at 1326 satellite data showed an ash plume that rose to 5.5-6 km altitude and drifted 150 km ESE. A satellite image from 1600 showed an ash plume extending as far as 230 km ESE; KVERT noted that ash emissions were intensifying, likely due to avalanches from the growing lava dome. The Aviation Color Code (ACC) was raised to Red (the highest level on a four-color scale). At 1520 satellite data showed an ash plume rising to 5-5.5 km altitude and drifting 230 km ESE. That same day, Kamchatka Volcanological Station (KVS) volcanologists traveled to Ambon to collect ash; they reported that a notable eruption began at 1730, and within 20 minutes a large ash plume rose to 10 km altitude and drifted NW. KVERT reported that the strong explosive phase began at 1738. Video and satellite data taken at 1738 showed an ash plume that rose to 10-12 km altitude and drifted up to 2,800 km SE and E. Explosions were clearly audible 20 km away for 90 minutes, according to KVS. Significant amounts of ash fell at the Apakhonchich station, which turned the snow gray; ash continued to fall until the morning of 8 April. In a VONA issued at 0906 on 8 April, KVERT stated that the explosive eruption had ended; ash plumes had drifted 2,000 km E. The ACC was lowered to Orange (the third highest level on a four-color scale). The KVS team saw a lava flow on the active dome once the conditions were clear that same day (figure 53). On 20 April lava dome extrusion was reported; lava flows were noted on the flanks of the dome, and according to KVERT satellite data, a thermal anomaly was observed in the area. The ACC was lowered to Yellow (the second lowest on a four-color scale).
Satellite data showed an increase in thermal activity beginning in early April 2023. A total of 31 thermal hotspots were detected by the MODVOLC thermal algorithm on 4, 5, 7, and 12 April 2023. The elevated thermal activity resulted from an increase in explosive activity and the start of an active lava flow. The MIROVA (Middle InfraRed Observation of Volcanic Activity) volcano hotspot detection system based on the analysis of MODIS data also showed a pulse in thermal activity during the same time (figure 54). Infrared satellite imagery captured a continuous thermal anomaly at the summit crater, often accompanied by white gas-and-steam emissions (figure 55). On 4 April 2023 an active lava flow was observed descending the SE flank.
Geologic Background. The modern Bezymianny, much smaller than its massive neighbors Kamen and Kliuchevskoi on the Kamchatka Peninsula, was formed about 4,700 years ago over a late-Pleistocene lava-dome complex and an edifice built about 11,000-7,000 years ago. Three periods of intensified activity have occurred during the past 3,000 years. The latest period, which was preceded by a 1,000-year quiescence, began with the dramatic 1955-56 eruption. This eruption, similar to that of St. Helens in 1980, produced a large open crater that was formed by collapse of the summit and an associated lateral blast. Subsequent episodic but ongoing lava-dome growth, accompanied by intermittent explosive activity and pyroclastic flows, has largely filled the 1956 crater.
Information Contacts: Kamchatka Volcanic Eruptions Response Team (KVERT), Far Eastern Branch, Russian Academy of Sciences, 9 Piip Blvd., Petropavlovsk-Kamchatsky, 683006, Russia (URL: http://www.kscnet.ru/ivs/kvert/); Kamchatka Volcanological Station, Kamchatka Branch of Geophysical Survey, (KB GS RAS), Klyuchi, Kamchatka Krai, Russia (URL: http://volkstat.ru/); Hawai'i Institute of Geophysics and Planetology (HIGP) - MODVOLC Thermal Alerts System, School of Ocean and Earth Science and Technology (SOEST), Univ. of Hawai'i, 2525 Correa Road, Honolulu, HI 96822, USA (URL: http://modis.higp.hawaii.edu/); MIROVA (Middle InfraRed Observation of Volcanic Activity), a collaborative project between the Universities of Turin and Florence (Italy) supported by the Centre for Volcanic Risk of the Italian Civil Protection Department (URL: http://www.mirovaweb.it/); Copernicus Browser, Copernicus Data Space Ecosystem, European Space Agency (URL: https://dataspace.copernicus.eu/browser/).
Chikurachki
Russia
50.324°N, 155.461°E; summit elev. 1781 m
All times are local (unless otherwise noted)
New explosive eruption during late January-early February 2023
Chikurachki, located on Paramushir Island in the northern Kuriles, has had Plinian eruptions during the Holocene. Lava flows have reached the sea and formed capes on the NW coast; several young lava flows are also present on the E flank beneath a scoria deposit. Reported eruptions date back to 1690, with the most recent eruption period occurring during January through October 2022, characterized by occasional explosions, ash plumes, and thermal activity (BGVN 47:11). This report covers a new eruptive period during January through February 2023 that consisted of ash explosions and ash plumes, based on information from the Kamchatka Volcanic Eruptions Response Team (KVERT) and satellite data.
According to reports from KVERT, an explosive eruption began around 0630 on 29 January. Explosions generated ash plumes that rose to 3-3.5 km altitude and drifted 6-75 km SE and E, based on satellite data. As a result, the Aviation Color Code (ACC) was raised to Orange (the second highest level on a four-color scale). At 1406 and 1720 ash plumes were identified in satellite images that rose to 4.3 km altitude and extended 70 km E. By 2320 the ash plume had dissipated. A thermal anomaly was visible at the volcano on 31 January, according to a satellite image, and an ash plume was observed drifting 66 km NE.
Occasional explosions and ash plumes continued during early February. At 0850 on 1 February an ash plume rose to 3.5 km altitude and drifted 35 km NE. Satellite data showed an ash plume that rose to 3.2-3.5 km altitude and drifted 50 km NE at 1222 later that day (figure 22). A thermal anomaly was detected over the volcano during 5-6 February and ash plumes drifted as far as 125 km SE, E, and NE. Explosive events were reported at 0330 on 6 February that produced ash plumes rising to 4-4.5 km altitude and drifting 72-90 km N, NE, and ENE. KVERT noted that the last gas-and steam plume that contained some ash was observed on 8 February and drifted 55 km NE before the explosive eruption ended. The ACC was lowered to Yellow and then Green (the lowest level on a four-color scale) on 18 February.
Geologic Background. Chikurachki, the highest volcano on Paramushir Island in the northern Kuriles, is a relatively small cone constructed on a high Pleistocene edifice. Oxidized basaltic-to-andesitic scoria deposits covering the upper part of the young cone give it a distinctive red color. Frequent basaltic Plinian eruptions have occurred during the Holocene. Lava flows have reached the sea and formed capes on the NW coast; several young lava flows are also present on the E flank beneath a scoria deposit. The Tatarinov group of six volcanic centers is located immediately to the south, and the Lomonosov cinder cone group, the source of an early Holocene lava flow that reached the saddle between it and Fuss Peak to the west, lies at the southern end of the N-S-trending Chikurachki-Tatarinov complex. In contrast to the frequently active Chikurachki, the Tatarinov centers are extensively modified by erosion and have a more complex structure. Tephrochronology gives evidence of an eruption around 1690 CE from Tatarinov, although its southern cone contains a sulfur-encrusted crater with fumaroles that were active along the margin of a crater lake until 1959.
Information Contacts: Kamchatka Volcanic Eruptions Response Team (KVERT), Far East Division, Russian Academy of Sciences, 9 Piip Blvd., Petropavlovsk-Kamchatsky, 683006, Russia (URL: http://www.kscnet.ru/ivs/); Copernicus Browser, Copernicus Data Space Ecosystem, European Space Agency (URL: https://dataspace.copernicus.eu/browser/).
Search Bulletin Archive by Publication Date
Select a month and year from the drop-downs and click "Show Issue" to have that issue displayed in this tab.
The default month and year is the latest issue available.
Bulletin of the Global Volcanism Network - Volume 23, Number 09 (September 1998)
Managing Editor: Richard Wunderman
Ambrym (Vanuatu)
Long-active lava lake continues to hold bubbling lava
Azul, Cerro (Ecuador)
Flank and caldera eruptions continue
Colima (Mexico)
Explosion on 6 July follows seven months of seismic unrest
Etna (Italy)
Summary of summit eruptive activity during August 1997-January 1998
Fournaise, Piton de la (France)
Activity ends with fissure eruptions outside the caldera
Guagua Pichincha (Ecuador)
Phreatic discharges and shallow, near-vent seismicity continue
Hokkaido-Komagatake (Japan)
Phreatic eruption spreads ash 25 October
Iwatesan (Japan)
Nearby M 6.2 earthquake on 3 September, but volcano still slumbering
Klyuchevskoy (Russia)
Explosions, ash 2-3 September raise concern to yellow alert
Lengai, Ol Doinyo (Tanzania)
New cones, vigorous activity since February
Masaya (Nicaragua)
Integrated scientific studies of the caldera area
Obituary Notices (Unknown)
Death of Oleg Volynets in Petropavlovsk-Kamchatsky
Popocatepetl (Mexico)
Several episodes of ash emission during September
Sete Cidades (Portugal)
Seismic swarm on submarine flank
Sheveluch (Russia)
Ash explosions and pyroclastic flow during 3 September
Soufriere Hills (United Kingdom)
Continuing decrease in activity; hazards reassessed
Yasur (Vanuatu)
Ongoing eruption, felt earthquake, and fresh glass chemical analysis
Ambrym (Vanuatu) — September 1998 Cite this Report
Ambrym
Vanuatu
16.25°S, 168.12°E; summit elev. 1334 m
All times are local (unless otherwise noted)
Long-active lava lake continues to hold bubbling lava
This long-active caldera was visited by John Seach during 4-7 September 1998. At Niri Mbwelesu Taten, a small collapse pit, strong degassing was observed as well as yellow sulfurous deposits on the NW wall. During the night, degassing was heard from a distance of 4 km and white vapor tinged with blue was constantly emitted from the pit.
Niri Mbelesu crater was constantly full of vapor resulting in poor visibility. But bubbling lava was heard and at night the clouds reflected a red glow from the crater.
At Mbwelesu crater, an active elongated lava lake (~100 x 30 m) was observed. The larger explosions threw lava high into the air and onto the crater wall. To the east of the lava lake a smaller elongated vent contained lava. On the NW wall of the crater was a circular vent 20 m in diameter from which no lava was extruded.
Benbow crater was climbed from the S. The sound of bubbling lava was heard but not observed, and there was a very intense night glow.
Geologic Background. Ambrym, a large basaltic volcano with a 12-km-wide caldera, is one of the most active volcanoes of the New Hebrides Arc. A thick, almost exclusively pyroclastic sequence, initially dacitic then basaltic, overlies lava flows of a pre-caldera shield volcano. The caldera was formed during a major Plinian eruption with dacitic pyroclastic flows about 1,900 years ago. Post-caldera eruptions, primarily from Marum and Benbow cones, have partially filled the caldera floor and produced lava flows that ponded on the floor or overflowed through gaps in the caldera rim. Post-caldera eruptions have also formed a series of scoria cones and maars along a fissure system oriented ENE-WSW. Eruptions have apparently occurred almost yearly during historical time from cones within the caldera or from flank vents. However, from 1850 to 1950, reporting was mostly limited to extra-caldera eruptions that would have affected local populations.
Information Contacts: John Seach, P.O. Box 16, Chatsworth Island, N.S.W. 2469, Australia.
Cerro Azul (Ecuador) — September 1998 Cite this Report
Cerro Azul
Ecuador
0.92°S, 91.408°W; summit elev. 1640 m
All times are local (unless otherwise noted)
Flank and caldera eruptions continue
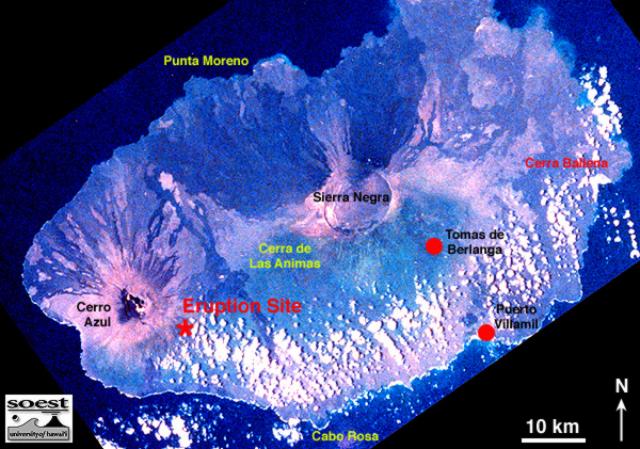
This eruption began between 1229 and 1304 on 15 September (BGVN 23:08). The event was first recognized by University of Hawaii scientists monitoring thermal images from the GOES-8 geostationary satellite. A dominant plume reaching over 150 km SW developed between 1345 and 1545 on 15 September, and a minor plume trended NW carried by the prevailing surface winds. Overflights revealed two new vents in the summit caldera, and a flank fissure eruption 8 km SE of the caldera (figure 1).
The first scientists reaching the volcano were from Ecuador's Instituto Geofísico-Escuela Politécnica Nacional (IG-EPN) and ORSTOM. They described the flank eruption site as a SE-directed radial fissure, 400-500 m long, and between 680 and 630 m elevation. Lava fountaining (to ~200 m) built an elongate cinder cone 50 m high during the team's 19-25 September observations. The main cone was breeched on the E, issuing flows that traveled over 8 km E before turning S toward the sea. During the night of 24-25 September a break in the main cone fed a new flow to the SE. All were 3-5-m-thick aa flows, and the longest ended 2 km from the coast.
University of Idaho graduate student Rachel Ellisor arrived on the night of 22 September, and described additional details of the flank eruption, including a smaller cone (NW of the main cone) with low fountains feeding a flow moving more directly S toward the sea. This flow was sampled daily; its velocity ranged from 0.001 to 10-20 km/hour and its thickness was described as 2-3 m at the front but 10-12 m in the interior. Gas clouds billowed from the fissure's SE end, and fountains issued from the main vent.
Ellisor took a 1 October overflight and described the intracaldera flows. One issued from a small vent (20-30 m high) on the S bench and flowed NW onto the caldera floor, while a larger cone (~60 m high) on the W caldera floor fed flows eastward into the shallow lake. Intracaldera activity had ended by 1 October.
Returning to the flank eruption, Ellisor reported that three large cones (60-80 m high) had been built in a N-S orientation. The mid-September flows (to the E, then S) had stagnated on the coastal flats, and their thickness was estimated at 5-15 m (interior) to 1-3 m (fronts). Increased activity on 6 October fed new flows building a channel system directly S of the main fissure. Ellisor's most recent report was dated 13 October, but GOES-8 images showed a thermal anomaly continuing through 4 November, the eruption's 51st day.
During 19-25 September, scientists from IG-EPN and ORSTOM installed three digital and one analog seismic station between the coast and the active vent. The distance between end stations was 8.5 km. Seismic signals registered during the study were composed of permanent tremor with an amplitude of 20 µm/s (2.4 km from the vent) and with a dominant frequency of 1.6 Hz. No rock-fall or long-period events were registered. One station 4 km from the vent continued working after the group returned to Quito.
Geologic Background. Located at the SW tip of the J-shaped Isabela Island, Cerro Azul contains a steep-walled 4 x 5 km nested summit caldera complex that is one of the smallest diameter, but at 650 m one of the deepest in the Galápagos Islands. The shield volcano is the second highest of the archipelago. A conspicuous bench occupies the SW and west sides of the caldera, which formed during several episodes of collapse. Youthful lava flows cover much of the caldera floor, which has also contained ephemeral lakes. A prominent tuff cone located at the ENE side of the caldera is evidence of episodic hydrovolcanism. Numerous spatter cones dot the western flanks. Fresh-looking lava flows, many erupted from circumferential fissures, descend the NE and NW flanks. Historical eruptions date back only to 1932, but Cerro Azul has been one of the most active Galápagos volcanoes since that time. Solfataric activity continues within the caldera.
Information Contacts: P. Samaniego, F. Desmulier, J.P. Metaxian, M. Ruiz, and M. Vaca, Instituto Geofísico, Escuela Politécnica Nacional, AP 17-01-2759, Quito, Ecuador; ORSTOM (L'Institut Français de Recherche Scientifique pour le Développement en Coopération), AP 17-11-6596, Quito, Ecuador (URL: http://www.ird.fr/); Rachel Ellisor and Dennis Geist, Dept. of Geology and Geological Engineering, University of Idaho, Moscow, ID 83843 USA (URL: https://www.uidaho.edu/sci/geology/); Peter Mouginis-Mark and Luke Flynn, GOES Hotspot Monitoring System, Hawaii Institute of Geophysics and Planetology, University of Hawaii, 2525 Correa Road, Honolulu, Hawaii 96822 USA (URL: http://modis.higp.hawaii.edu/).
Colima (Mexico) — September 1998 Cite this Report
Colima
Mexico
19.514°N, 103.62°W; summit elev. 3850 m
All times are local (unless otherwise noted)
Explosion on 6 July follows seven months of seismic unrest
After seven months of seismic unrest (small swarms, with durations lasting some few hours to as much as 90 hours), at 1858 on 6 July an explosion at the summit dome was similar in behavior and about half of the magnitude of an explosion in 1994.
A microbarograph 8 km SW of the summit at La Yerbabuena failed to register the explosion's shock wave, and the events were not noticed by residents of that settlement or La Becerrera (12 km SW of the summit), nor were these effects noticed by rangers at Rancho El Jabali (12 km SSW of the summit). Residents did report light rain and a bit of thunder and lightning at 1900, which may have helped conceal, or have been confused with, the sound of the explosion.
Seen through a microscope, plant leaves contained ash residue left after rainfall: mineral particles and hydrothermally altered rock fragments under 0.5 mm in diameter, often of light cream color, and similar to those collected at Yerbabuena after the 1994 explosion.
Melchor Ursua of the Civil Defense reported that at 1900 residents of Tonila (13.5 km SE of the summit) observed a small black mushroom cloud rise above the summit accompanied by the sound of thunder or explosion. At 2300 that day from La Yerbabuena, observers Navarro, Breton, and Santaana saw fumarolic gases blown around the W face of the volcano, but in the faint moonlight he failed to discern any glow or ash from the crater.
The last seismic crisis started around 2200 on 2 July 1998 and ended at 1858 on 6 July: a vigorous swarm of earthquakes, which according to Gabriel Reyes comprised ~1,000 events a day for the last 3 days. One event with coda magnitude (Mc) 3.5-4.0 gained registry at all network stations including those near the coast at Tecoman and Armeria; it was interpreted as related to the above-discussed explosion. The seismic quiet afterwards consisted of zero events in a pattern reminiscent of 1994 when quiet prevailed for about 12 hours.
Noteworthy swarms during 1997 occurred on 20 March, 16, 21, and 30 June, 28 November, and 5 December. Compared to the 1997 swarms, this one (2-6 July 1998) was the largest and most energetic.
During the latest swarm the volcano was only visible from 0800 to 1000. After 160 mm of rain had fallen at La Yerbabuena, a lahar swept downslope between 1400 and 1800 on 2 July, blocking passage across the Becerrera River valley 12.5 km SW of the summit.
During 1900-2000 on 7 July, the seismic station closest to the W flank (SOMA, 1.7 km NW from the summit) registered strong, continuous mass wasting and later, during 2200-2300, a relatively strong volcanic event. Seismic quiet returned later, but vigorous fumarolic emissions were blown W. An update on 28 October noted that for a few weeks after the explosion the volcano displayed unrest, including about 23 seismic swarms, each enduring for 2 to 6-8 hours. All the seismic information was provided by the Colima seismic network (RESCO). The last swarm occurred on 25 October and prevailed for 13 hours.
Geologic Background. The Colima complex is the most prominent volcanic center of the western Mexican Volcanic Belt. It consists of two southward-younging volcanoes, Nevado de Colima (the high point of the complex) on the north and the historically active Volcán de Colima at the south. A group of late-Pleistocene cinder cones is located on the floor of the Colima graben west and east of the complex. Volcán de Colima (also known as Volcán Fuego) is a youthful stratovolcano constructed within a 5-km-wide scarp, breached to the south, that has been the source of large debris avalanches. Major slope failures have occurred repeatedly from both the Nevado and Colima cones, producing thick debris-avalanche deposits on three sides of the complex. Frequent recorded eruptions date back to the 16th century. Occasional major explosive eruptions have destroyed the summit (most recently in 1913) and left a deep, steep-sided crater that was slowly refilled and then overtopped by lava dome growth.
Information Contacts: Carlos Navarro Ochoa, Colima Volcano Observatory, Universidad de Colima, Ave. 25 de Julio 965, Colima 28045, Colima, México.
Etna
Italy
37.748°N, 14.999°E; summit elev. 3357 m
All times are local (unless otherwise noted)
Summary of summit eruptive activity during August 1997-January 1998
The following report summarizes activity observed at each of the four summit craters of Etna from August 1997 through 15 January 1998. Events through 8 January 1998 at Bocca Nuova, Southeast Crater, Northeast Crater, and Voragine are described below separately. A seismic crisis during 9-12 January was followed by a brief decrease in activity at all of the craters. Significant eruptive episodes after mid-January 1998 will be described in future issues.
Information for this report was compiled by Boris Behncke at the University of Catania and published on his internet web site. The compilation was based on personal visits to the summit, telescopic observations from Catania, monitoring of images posted on the internet from the camera maintained by the Istituto Internazionale di Vulcanologia (IIV), and other sources.
Visits to the summit craters in late September and early October 1997 revealed continuing vigorous activity from Bocca Nuova and Southeast Crater while more sporadic activity was occurring at the Voragine and Northeast Crater. This pattern continued through November and December. The overall activity on 8 January 1998 at Bocca Nuova, Northeast Crater, and Voragine was notably diminished; it was the lowest observed in six months.
Activity at Bocca Nuova. During late August, lava ejections from Bocca Nuova (BN) became significantly more vigorous. Both eruptive centers in this crater often ejected lava bombs outside the crater, with many falling on its S rim. Occasional explosions ejected bombs on the lower S flank of the central cone. The number of active vents in Bocca Nuova increased to seven on 28 August, but was down to five just two days later. The bombardment and explosions led to collapse on the E side of Bocca Nuova, lowering the septum between BN and Voragine (informally named "diaframma" among local volcanologists), and eroding the remains of a 1964 cone.
Visits to the summit in late September and early October revealed continuing activity. As of 14 October, Bocca Nuova's activity was gradually increasing, and the crater was being filled in. The northern of its two eruptive centers had a broad cone with a crater 50-100 m wide, which at times was completely filled with fountaining lava. Fountains often sent spatter and bombs high above the rim, and large ejecta fell outside the crater up to 100 m away. Bombs as large as 40 cm in diameter fell onto the area where the best views of the erupting cone in BN are obtained. Explosions in the SE eruptive center at times sent pyroclastic material all over the S flank of Etna's summit cone.
On 6 November the northern eruptive center was vigorously active. The cone at that site had grown to ~50 m below the NW crater rim. The SE eruptive center was much less violent than in previous months; on the crater wall above it a large overhanging hollow had been carved out by explosions. On the evening of 6 November, Strombolian explosions occurred at intervals of 1-5 seconds, with some jets rising up to 200 m above the cone's summit. An episode of spectacular lava fountaining from BN occurred on 25 November when huge bursts of incandescent bombs developed into a continuous fountain from the SE eruptive center. On 28 November the clouds over the mountain cleared, permitting the view of a huge vapor column rising almost vertically to about 1,500 m above the summit. This unusually large plume was due to an approaching cold front that led to increased condensation.
Explosive activity and gas emissions within BN accompanied a lava flow from Southeast Crater during 9-11 December. Intermittent activity on 12 December, stronger than during the previous 17 days, ejected high bursts of incandescent bombs from BN's southeastern vents. Activity through 15 December was very vigorous, and eruptions continued through 21 December. Glow was visible above BN's two eruptive centers on 26 December and over the E part of the crater on 31 December.
On the evening of 7 January, several jets of incandescent bombs rose over the SE crater lip, and a few bombs fell onto the remains of the 1964 cone. As of 8 January the large cone in the N part of the crater floor had partially collapsed, creating a crater ~150 m in diameter. Frequent rockfalls occurred within this crater. Subsidence of the cone and the adjacent crater floor had created a set of circumferential fractures several meters wide. The most recent activity at this eruptive center appears to have been the extrusion of a lava flow that covered the E and SE sides of the BN floor. The vents at the SE eruptive center were the site of weak Strombolian explosions every 10-15 minutes. Most, if not all, activity occurred from the lowermost vent in the SW part of the eruptive center. A complex cone around these vents had grown notably since the visit on 6 November 1997, with the rim of the highest vent being at about the same elevation as the N rim of Bocca Nuova. Large parts of the crater wall above the SE eruptive center had collapsed, probably before the most recent cone growth (all collapse debris was buried).
Activity at Southeast Crater. Strombolian and effusive activity continued from Southeast Crater (SEC), whose intracrater cone could be seen on 1 September through a gap in the NE crater rim from coastal areas to the E. During a visit on 30 August, lava fountains rose up to 150 m above the cone, and three vents were active. There had been significant infilling of the deep southern part of SEC since effusive activity shifted to the cone's NW flank sometime before 11 August. Before then, lava had repeatedly spilled onto the SE flank of the cone.
Visits to the summit craters in late September and early October revealed continuing vigorous activity. While effusive vents were active on the W base of the cone from 10 August to mid-September, lava again issued from E-flank vents in late September, causing renewed overflows onto the outer SW flank of the cone. By mid-October the cone within SEC had grown to about the height of the highest point on the crater rim. Explosive activity was the same as during previous months, and lava effusion continued from the flanks of the cone.
At dusk on 2 November there were continuous Strombolian bursts from SEC. A visit on 6 November revealed very weak and erratic Strombolian activity. For the first time in many months there was no lava effusion at SEC, although guides at Torre del Filosofo reported that a small lava flow had spilled over the low SE rim of the crater three days earlier. After sunset on 6 November, Strombolian bursts from SEC could be seen from Catania (Palazzo delle Scienze).
Telescope observations from the roof of the Palazzo delle Scienze in Catania on 3-4 December revealed vigorous Strombolian activity at SEC and significant growth of its central conelet, which stood much higher than the surrounding crater rims. Activity on the evening of 5 December was documented with the IIV camera until bad weather hid the summit. At dusk, activity at SEC increased, and strong explosions heralded lava emission to the NE side of the intracrater cone. A more significant lava flow was erupted from SEC on the late afternoon of 9 December, accompanied by vigorous explosive activity at the intracrater cone and within Bocca Nuova. The SEC lava flow overrode previous flows on the SE flank of the cone.
The 9 December lava flow was visible on 11 December, contrasting against freshly fallen snow. Seen from Palazzo delle Scienze, this flow extended much farther downslope than previous flows on the SE flank of the cone, but its front was still several hundred meters from the steep W flank of Valle del Bove. The flow had apparently stopped (no steam was visible at the contact of the lava with the snow). Two smaller lava lobes were erupted onto the SE flank of SEC's cone, about two-thirds of the way down the cone's flank. The active central cone appeared to have lost some height during the strong explosions; Strombolian activity was still vigorous and at times accompanied by weak ash emissions. Vigorous activity at SEC, with some large explosions, continued during 12-15 December, with lava flows spilling over the SE rim and some SE-flank lava extending far beyond the base of the cone. The new flow passed only about 600 meters NE from the Torre del Filosofo mountain hut, ~1 km from SEC. As of 17 December the lava flows erupted from SEC during the previous few days were still confined to the SE flank of the cone. None of the new flows had extended as far as those on 9 and 12-13 December. Over 20-21 December, nearly continuous explosive activity at the SEC intracrater cone sent lava onto its SE and SSE flanks. The cone regained the height lost after 5 December. A 22 December afternoon episode of vigorous lava fountaining as high as 200 m from SEC lasted about 1 hour. A lava flow erupted onto the SE flank of SEC appeared to be no longer than ~200 m.
Activity at SEC in late December and early January was spectacular. On 25 December, continuous Strombolian activity occurred from the central conelet and lava flowed down the SE flank to its base, covering previous flows. Three active lava flows were visible on the SE flank on the 26th. Sometime between early 29 and early 30 December, more lava flows spilled down the S flank of SEC, and a peculiar flow moved down on the SW flank, bifurcating on the lower slope. On the evening of the 30th, active flows were visible on the S flank while the SW flow only showed incandescence in its upper part. On the evening of 31 December, incandescent lava was visible on the lip of SEC in many places while active flows were descending on the S flank. On 7 January the SW flow was incandescent along its full length, with the W lobe extending to the base of the SEC cone.
On 8 January Southeast Crater gave off continuous Strombolian explosions from two vents at the summit of the intracrater cone and lava emission from its SE base. The summit of the cone was distinctly (~5-7 m) higher than the highest point ("Fortino") on the NE rim of SEC. Lateral growth of the cone was most significant in the N and NE parts of SEC where all lava flows and effusive vents active between July and September 1997 had been buried. The lava field surrounding the central cone had risen significantly, causing overflows on the E, SE, S, and SW sides. Only a segment of the NE crater rim stood a few meters above the lava fill; the W and NW part of the rim stood 20 m above the lava field and the cone's base. Three craters were present on the central cone, two of which were erupting. Activity would occur from one vent at any given time while the other was silent. The N vent ejected bombs and scoriae onto the N and NW crater rim and beyond. The S vent produced loud bangs and showered the E and SE flanks of the cone with pyroclastics. The effusive vent on the SE side of the cone had crusted over, and lava issued only on the SW rim of SEC where it overflowed, forming a narrow (1.5 m) flow with distinct lateral levees extending to the base of the SEC cone. The flow bypassed a cone formed in 1971 on its E side; when reaching the almost horizontal plain below the steep SW flank of SEC, it broadened and thickened notably and advanced slowly in the direction of the 1971 "Observatory cone." Within 3.5 hours on 8 January, the flow front advanced ~15 m through thick snow, forming an offshoot on the W side of the ~20-m-wide lava front. None of the other flows on the S flank of SEC showed any signs of movement or incandescence. The distance from the Torre del Filosofo mountain hut to the nearest flow front was ~1 km; the active flow did not threaten this structure.
Activity at Northeast Crater. During the second half of July Northeast Crater (NEC) occasionally ejected incandescent bombs from a deep pit in the central part of the crater; fine ash fell outside the pit. Visits to the summit craters in late September and early October revealed sporadic activity. NEC frequently emitted ash plumes during the first week of October, and on the evening of 10 October, incandescent ejections rose as high as 50 m above the crater rim. Strong gas emission was occurring from NEC on 11 December. NEC was essentially quiet on 8 January, with only light steam emissions from its central pit and some of the June-August 1996 vents in the SW part of the crater. Steam emission was more abundant, and at times pulsating, from a collapse pit in the S part of the crater. This pit was also the site of frequent avalanching and rockfalls that generated plumes of brown ash. No fresh magmatic products were found in the vicinity of the central and southern pits.
Activity at Voragine. A small cone began to form on the floor of Voragine in late July, and Strombolian activity was observed on 5 August. On 30 August, the cone was mildly steaming, and the surrounding deposit of black scoriae was partly covered by blocks that had collapsed from the septum between Voragine and Bocca Nuova. The first effusive activity from the Voragine in many years occurred in late September, forming a small lava field on the crater floor. Strombolian activity was weak on 28 September but very vigorous on 9 October; one day later it was again weak. The Voragine was explosively active from the central conelet on 6 November, and another weakly explosive vent had formed at the SW base of the diaframma between the Voragine from Bocca Nuova.
The cone in the central part of the Voragine was quiet on 8 January, with only slight emission of bluish gas. Its horseshoe-shaped crater was open to the SE; a small lava flow had issued from the open side of the cone. The vent on the SW side of the crater floor, which was first observed on 6 November 1997, had enlarged and was surrounded by a low half-cone leaning against the base of the diaframma. This vent produced weak explosions that mainly expulsed hot gas and a few pyroclasts. When viewed from the E rim of the Voragine, the conduit of this vent was seen to be inclined SW, diving below the diaframma.
Seismic crisis of 9-12 January 1998. The most intense seismic crisis during the current eruptive cycle occurred during 9-12 January and caused widespread media attention. From the afternoon of 9 January through 11 January about 200 earthquakes occurred in an area on the W and SW flanks of the volcano. The strongest shock (M 3.7) damaged a church in Biancavilla. No other damage or injuries were reported. Most epicenters were between Monte Nunziata and Monte Palestra, two ancient cones on the W flank. Seismicity diminished late on 10 January.
Strong ash emissions from BN on the morning of 11 January indicated further collapse in that crater, caused by earlier subsidence of the magmatic column. It is assumed that the magma intruded into a new fracture within the W side of the volcanic edifice. On 12 January ash emission from BN was almost continuous, but strong ash emissions also occurred from NEC. Activity at SEC continued with Strombolian bursts and emission of lava flows onto the SW, S, and SE flanks of the cone. The peculiar SW flow seemed to be waning; during the previous few days it had formed several minor lobes adjacent to the main one; the flow front seemed to have reached the base of the 1971 "Observatory cone."
Another seismic swarm occurred below the W flank on the afternoon of 12 January, with twelve earthquakes in 20 minutes, the strongest being M 3.1. Epicenters were closer to the summit craters than those of the preceding swarm, clustering 2-3 km E of Monte Palestra. Focal depths were ~4 km below sea level; no damage was reported. No significant change was noted in the eruptive activity at Southeast Crater, which had three active flows moving down its SW, S, and SE flanks.
Summit activity during 13-15 January 1998. Strombolian activity on the evening of 13 January at the intracrater cone in SEC was vigorous, while active lava was only visible near the crater rim in three places. A very faint glow reappeared at the SE eruptive center in BN. Strong ash emissions occurred from BN throughout the day. Seismic and eruptive activity were low on 14 January. The only visibly active crater was SEC, which was vigorous on the 13th but showed a marked diminution of activity towards midnight. At nightfall on 14 January SEC had very few and weak explosions, and there was no active lava flow on its outer flanks. No glow was visible above BN. This was the lowest level of activity observed in about a year. Seismic activity resumed late on 14 January with a series of about ten weak earthquakes below the W flank (Monte Palestra area) and several shocks beneath the SW slope, some 5 km above Biancavilla. Hypocenters were ~6 km below the surface on the W flank but much shallower on the SW flank. Activity at SEC dropped to very low levels: very few and weak explosions from the intracrater cone were observed on 14 January and no active lava was visible on the outer flanks of the crater.
Geologic Background. Mount Etna, towering above Catania on the island of Sicily, has one of the world's longest documented records of volcanism, dating back to 1500 BCE. Historical lava flows of basaltic composition cover much of the surface of this massive volcano, whose edifice is the highest and most voluminous in Italy. The Mongibello stratovolcano, truncated by several small calderas, was constructed during the late Pleistocene and Holocene over an older shield volcano. The most prominent morphological feature of Etna is the Valle del Bove, a 5 x 10 km caldera open to the east. Two styles of eruptive activity typically occur, sometimes simultaneously. Persistent explosive eruptions, sometimes with minor lava emissions, take place from one or more summit craters. Flank vents, typically with higher effusion rates, are less frequently active and originate from fissures that open progressively downward from near the summit (usually accompanied by Strombolian eruptions at the upper end). Cinder cones are commonly constructed over the vents of lower-flank lava flows. Lava flows extend to the foot of the volcano on all sides and have reached the sea over a broad area on the SE flank.
Information Contacts: Boris Behncke, Istituto di Geologia e Geofisico, Palazzo delle Scienze, Università di Catania, Corso Italia 55, 95129 Catania, Italy.
Piton de la Fournaise (France) — September 1998 Cite this Report
Piton de la Fournaise
France
21.244°S, 55.708°E; summit elev. 2632 m
All times are local (unless otherwise noted)
Activity ends with fissure eruptions outside the caldera
The eruption that began in March (BGVN 23:03) diminished during August and September. Observatoire Volcanologique du Piton de la Fournaise (OVPF) considers the eruption ended. The most significant activity during the last two months took place outside the caldera.
A small fissure eruption began on 9 August north of the caldera. Lava issued from this fissure, which was located ~500 m from the caldera wall near Nez Coupé Sainte Rose (figure 49). The initial eruption lasted only 24 hours, but a second fissure eruption began 14 August in the same area closer to the caldera wall. No fountains were observed with the second fissure, although the lava was very fluid. Flows eventually measured 200-300 m wide and ~2 km long. They moved parallel to the caldera wall until 14 September when they stopped ~500 m above Trou Caron. Some of the lava reached the edge of the caldera and spilled over onto the Plaine des Osmondes through three separate rivulets. A flow that was moving towards the upper part of Bois Blanc (a village located on the east coast) stopped by 25 August.
During September, some night incandescence due to the lava lake at Piton Kapor was seen. Only weak tremor was observed. Beginning 5 September some gas-piston events were recorded; these had likely taken place before, but had remained undetected during stronger episodes of tremor.
This eruption, including all tremor and degassing at Piton Kapor, ended 21 September, after 196 days of activity. It thus comprised the volcano's longest and one of it's most voluminous eruptions of this century.
Geologic Background. Piton de la Fournaise is a massive basaltic shield volcano on the French island of Réunion in the western Indian Ocean. Much of its more than 530,000-year history overlapped with eruptions of the deeply dissected Piton des Neiges shield volcano to the NW. Three scarps formed at about 250,000, 65,000, and less than 5,000 years ago by progressive eastward slumping, leaving caldera-sized embayments open to the E and SE. Numerous pyroclastic cones are present on the floor of the scarps and their outer flanks. Most recorded eruptions have originated from the summit and flanks of Dolomieu, a 400-m-high lava shield that has grown within the youngest scarp, which is about 9 km wide and about 13 km from the western wall to the ocean on the E side. More than 150 eruptions, most of which have produced fluid basaltic lava flows, have occurred since the 17th century. Only six eruptions, in 1708, 1774, 1776, 1800, 1977, and 1986, have originated from fissures outside the scarps.
Information Contacts: Thomas Staudacher, Observatoire Volcanologique du Piton de la Fournaise (OVPF), 14 RN3, le 27Km, 97418 La Plaine des Cafres, La Réunion, France.
Guagua Pichincha (Ecuador) — September 1998 Cite this Report
Guagua Pichincha
Ecuador
0.171°S, 78.598°W; summit elev. 4784 m
All times are local (unless otherwise noted)
Phreatic discharges and shallow, near-vent seismicity continue
The volcanic crisis near Quito (figure 10) continued with a series of phreatic discharges and an E-dipping zone of earthquakes that rose to within a few kilometers of the surface (figure 2). With potentially dramatic significance to Ecuador's Capital (1995 urban population, 1,270,000 residents; suburban, 258,000 residents), the eruption has spurred a strong educational response in both the regional press and on an official web site. These discourses have repeated noteworthy points: the volcano's last vigorous eruption was in 1660; its recurrence intervals have oscillated between about 400 and 600 years; its last major eruption took place 338 years ago; and its phreatic eruptions have repeated during the past 15 years. Phreatic eruptions began on on 7 August (BGVN 23:08); since then the Instituto Geofísico, Escuela Politécnica Nacional (IG-EPN) has made available daily reports on activity during 30 September to 27 October, which we summarize here.
Activity and observations. The epicenters of located earthquakes during April-October 1988 generally clustered around the caldera (figure 11). This was particularly the case for volcano-tectonic (VT) earthquakes, which in cross-section view tended to lie underneath the caldera. The located long-period (LP) events generally propagated from greater depths and in cross-section view defined a broad E-dipping zone. Thus far in the crisis there has been an alternating pattern of seismicity and seismically detected explosions (figure 12). During late September through late October there were often 1-2 daily explosions.
On 3 October observers confirmed the presence of new fumaroles on the dome's W edge; nearby, in the headwaters of the Rio Cristal, they noted a new fumarole field. A phreatic explosion was heard at 0400 on 5 October by residents of Lloa. The explosion was the thirty-first such event in the sequence initiated on 7 August. It ranked among the most energetic seen to this point of the crisis, comparable to those on 8 and 24 August, and 29 September. The 5 October explosion followed 50 minutes of tremor registered at station YANA (7 km NE of the crater; "C" on figure 13). Small seismic events continued until 0800 that day. This explosion left a fresh ash layer in the caldera that revealed a new vent near the older one but above it to the S.
The seismic swarm NE of the caldera (BGVN 23:08) continued; between June and early October there were 3,200 events; ~10 had a magnitude (MR) over 3.9. On 4 October instruments detected ~30 earthquakes, the strongest MR 3.5. A MR 3.6 earthquake struck this zone on 10 October and was felt locally in the settlements of Pomasqui and San Antonio.
Measured deformation was not detected for the interval 15 September-7 October. Although not plotted, tremor has occurred. For example, at 2214 on 7 October station PINO detected tremor for 19 minutes while station YANA registered it for 7 minutes. On 11 and 12 October tremor followed phreatic explosions and in the former case, prevailed for 20 minutes at stations near the crater.
Mass wasting on the SE flank ~11 km from the caldera (in Quito's San Roque sector) on 9 October covered an old school, part of a church, threatened several smaller structures, and blocked vehicular traffic. Roughly 20 people were evacuated.
On 12 October condensing gases escaping the dome at a fumarole called "La Locomotora" rose 200 m. Around this time the 1981 explosion crater also emitted a moderate flow of gray gases but new fractures or fumaroles were absent.
At 1621 on 14 October a phreatic explosion at the 1981 vent sent fine material over the NE part of the caldera and left a visible coating ~300 m up the caldera walls. The associated grayish-white plume formed a ~3-km-tall column. Clear weather enabled residents of Quito to see the plume. Geophysical instruments detected the event at widely scattered locations. COSPEC registered the first clear SO2 signal, a 300 ppm concentration in the plume. Guards at a local observation post smelled strong sulfur, particularly when gases from La Locomotra fumarole blew past.
An explosion at 0947 on 16 October sent a plume to ~2 km. Again, Quito residents saw the plume, but an explosion the next morning was shrouded from view by weather clouds. The latter explosion was considered moderate; it was associated with ~5 minutes of tremor centered around 1.2-Hz frequency and scientists working nearby (at station PINO) saw a gray-white cloud develop. A 17 October explosion was shrouded in clouds. The phreatic explosions on 14, 15, 16, and 17 October yielded respective reduced seismic displacements of 11, 4.2, 9.8, and 3.2 cm2.
A view into the caldera on the morning of 18 October disclosed relatively passive outgassing from the 1981 and 1988 explosion craters. La Locomotra and other fumaroles on the central dome had clearly increased their output, feeding a plume ~700 m high. Another moderate explosion on 25 October was followed by 3 hours of tremor.
A flight on the morning of 27 October revealed only modest degassing, a 300-m-high plume, and an SO2 concentration below the COSPEC's detection limit. Minard Hall also recognized that the 1981 crater and one formed in September 1998 had coalesced. The wall isolating them had apparently been weakened by repeated phreatic eruptions.
Risk mapping. The highest risk settlements include Lloa (figures 1 and 4) and Mindo. The latter lies on the river of the same name about 22 km NW of the caldera; it lies off of maps in this report but is depicted on the larger hazard map of Hall and von Hillebrandt (1988). One branch of the Mindo river's headwaters begin just N of the breach in the caldera (figure 4). Rivers draining the breached W-flank and nearby NW-flank (e.g. Rio Cristal and Rio Mindo) were assigned a higher category of risk for lahars than any lahar-risk zones on the E flanks (figure 1).
New fieldwork has been aimed at inspecting older lahar deposits in vicinity of the settlements of Mindo and Nono. Nono, on the NNE flank (figures 2 and 4), lies at mouth of a narrow N-S valley that cuts across much of the volcano's E to NNE flanks.
Partnerships. The following describes some of the civic and media efforts to communicate volcanic hazards. On 30 September Ecuador's president requested that a safety committee be formed (Comité Especial de Seguimento, CES). The committee was charged with integrating Civil Defense, the IG-EPN, and the City of Quito. In overcast conditions on 24 August a film crew from TeleAmazonas shot footage of an explosion plume not otherwise visible in Quito. These glimpses, and later examples of widely visible plumes, surely helped residents grasp the immediacy and some of the power of the eruption.
Authorities raised the hazard status to Yellow on 1 October. On 3 October a new video system started to monitor the inner crater. This advance was supported by "Ecuavista" in coordination with "911 of the City of Quito," the phone number for the City's communications base.
A 2 October announcement told of a downtown Quito information center implemented to release daily circulars at bearing official volcanological information. Thanks to a partnership between the information center and IBM of Ecuador, the former gained access to the internet, email, and a modern computing environment The radio station "Zaracay," which can be received widely, including the urban and Mindo areas, was also designated as a conduit for public announcements.
By 7 October the seismic network consisted of 12 stations with real-time data transmission. Collaborating scientific teams and monitoring equipment have come from both the U.S. Geological Survey as well as ORSTOM (the French Scientific Research Institute for Development through cooperation). Contingency plans have surfaced, dealing with the issue of transportation during the higher stages of alert (Orange and Red). Public announcements have broached the need to maintain the integrity of the municipal infrastrucure in the event of an eruption, including crews to clean ash (from roads, power lines, etc.).
Reference. Hall, Minard, and von Hillebrandt M., Christa G., 1988, Mapa de los peligros volcanicos poteciales asociados con el volcan Guagua Pichincha; Republica del Ecuador (1:50,000).
Geologic Background. Guagua Pichincha and the older Pleistocene Rucu Pichincha stratovolcanoes form a broad volcanic massif that rises immediately W of Ecuador's capital city, Quito. A lava dome grew at the head of a 6-km-wide scarp formed during a late-Pleistocene slope failure ~50,000 years ago. Subsequent late-Pleistocene and Holocene eruptions from the central vent consisted of explosive activity with pyroclastic flows accompanied by periodic growth and destruction of the lava dome. Many minor eruptions have been recorded since the mid-1500's; the largest took place in 1660, when ash fell over a 1,000 km radius and accumulated to 30 cm depth in Quito. Pyroclastic flows and surges also occurred, primarily to then W, and affected agricultural activity.
Information Contacts: Instituto Geofísico, Escuela Politécnica Nacional, Apartado 17-01-2759, Quito, Ecuador; El Comercio newspaper, Quito, Ecuador (URL: http://www.elcomercio.com); El Universo newspaper, Quito, Ecuador (URL: http://www.eluniverso.com); La Hora newspaper, Quito, Ecuador (URL: http://www.lahora.com); Volcanic Disaster Assistance Program, U.S. Geological Survey, 5400 MacArthur Blvd., Vancouver, Washington 98661 USA (URL: https://volcanoes.usgs.gov/observatories/cvo/); ORSTOM, A.P. 17-11-6596, Quito, Ecuador (URL: http://www.ird.fr/).
Hokkaido-Komagatake (Japan) — September 1998 Cite this Report
Hokkaido-Komagatake
Japan
42.063°N, 140.677°E; summit elev. 1131 m
All times are local (unless otherwise noted)
Phreatic eruption spreads ash 25 October
The Japan Meteorological Agency (JMA) issued an advisory and three observation reports concerning Hokkaido-Komaga-take volcano on 25 October following a small-scale phreatic eruption that began at 0912 the same day. Ash rose in a column to a height of ~1,200 m above the crater. The eruptive activity soon declined. There were no report of injuries or damage caused by the eruption, and no evacuation order was issued.
Volcanologists surveyed the activity from a helicopter the afternoon of 25 October (figure 2). They reported that the eruption originated from the same crater that opened during the 1929 eruption, which was also the site of the March 1996 eruption. Ash covered a significant area around and to the E of the crater. The scale of this eruption apparently was smaller than that of the March 1996 eruption.
Volcanic tremor lasting six minutes was associated with this eruption. In addition, five volcanic earthquakes were recorded in the 12 hours following the first eruption signs.
Komaga-take is located 30 km N of Hakodate City (population 320,000). The andesitic stratovolcano has a 2-km-wide horseshoe-shaped caldera open to the E. The volcano has generated large pyroclastic eruptions, including major historical eruptions in 1640, 1856, and 1929. In the 1640 eruption, debris from a partial summit collapse entered the sea resulting in a tsunami that killed 700 people. Although the 1929 eruption was one of the largest 20th-century eruptions in Japan, it may not have had clear geophysical precursors.
Geologic Background. Much of the truncated Hokkaido-Komagatake andesitic volcano on the Oshima Peninsula of southern Hokkaido is Pleistocene in age. The sharp-topped summit lies at the western side of a large breached crater that formed as a result of edifice collapse in 1640 CE. Hummocky debris avalanche material occurs at the base of the volcano on three sides. Two late-Pleistocene and two Holocene Plinian eruptions occurred prior to the first historical eruption in 1640, which began a period of more frequent explosive activity. The 1640 eruption, one of the largest in Japan during historical time, deposited ash as far away as central Honshu and produced a debris avalanche that reached the sea. The resulting tsunami caused 700 fatalities. Three Plinian eruptions have occurred since 1640; in 1694, 1856, and 1929.
Information Contacts: J. Miyamura, Sapporo District, Japan Meteorological Agency, 1-3-4 Ote-machi, Chiyoda-ku, Tokyo 100, Japan; Hiromu Okada, Usu Volcano Observatory, Institute of Seismology and Volcanology, Hokkaido University, Sohbetsu-cho, Hokkaido 052-0103, Japan.
Iwatesan (Japan) — September 1998 Cite this Report
Iwatesan
Japan
39.853°N, 141.001°E; summit elev. 2038 m
All times are local (unless otherwise noted)
Nearby M 6.2 earthquake on 3 September, but volcano still slumbering
A strong earthquake occurred 10 km SW of the summit of Iwate volcano at 1658 on 3 September. The Richter magnitude was 6.1 and the depth ~7 km. The mechanism was E-W compression on a reverse fault. A N-S-trending surface rupture appeared, despite the event's non-extreme magnitude. The aftershock area resulting from the earthquake differed from typical earthquakes on Iwate and the relationship between the earthquake and the volcano, if any, is not understood. This was the largest earthquake since August 1996 when a M 5.9 tremor struck.
A 3 September Reuters news article mentioned that a powerful earthquake took place, centered in the ski resort area of Shizukuishi, a mountainous region near Iwate volcano. The report claimed the epicenter was 5 km underground and police said that the event slightly injured at least nine people.
Geologic Background. Viewed from the east, Iwatesan volcano has a symmetrical profile that invites comparison with Fuji, but on the west an older cone is visible containing an oval-shaped, 1.8 x 3 km caldera. After the growth of Nishi-Iwate volcano beginning about 700,000 years ago, activity migrated eastward to form Higashi-Iwate volcano. Iwate has collapsed seven times during the past 230,000 years, most recently between 739 and 1615 CE. The dominantly basaltic summit cone of Higashi-Iwate volcano, Yakushidake, is truncated by a 500-m-wide crater. It rises well above and buries the eastern rim of the caldera, which is breached by a narrow gorge on the NW. A central cone containing a 500-m-wide crater partially filled by a lake is located in the center of the oval-shaped caldera. A young lava flow from Yakushidake descended into the caldera, and a fresh-looking lava flow from the 1732 eruption traveled down the NE flank.
Information Contacts: Yukio Hayakawa, Faculty of Education, Gunma University, Aramaki, Maebashi 371, Japan; Reuters Limited, 1700 Broadway, New York, NY 10019 USA (URL: http://www.reuters.com/).
Klyuchevskoy (Russia) — September 1998 Cite this Report
Klyuchevskoy
Russia
56.056°N, 160.642°E; summit elev. 4754 m
All times are local (unless otherwise noted)
Explosions, ash 2-3 September raise concern to yellow alert
During 2-28 September, seismicity under the volcano was generally above background levels. Hypocenters were concentrated at two levels: near the summit crater and at depths of 25-30 km. Clouds often prevented observations.
On 2 September a fumarolic plume was observed during the daylight hours rising 50 m above the summit. Beginning at 2218 that day, a 33-minute series of explosive earthquakes was recorded, and at 2245 an ash explosion produced a plume that rose 4-5 km above the crater. On 3 September, scientists noticed that ash had been deposited in a 2-km-long zone on the NE slope. A plume of gas, with no ash content, rose 500 m above the volcano during 3-4 September, but had stopped by 5 September. Because of the increase in activity, the alert status was changed to Yellow, meaning more significant eruptions may occur.
No fumarolic plumes were seen during 8, 18, and 27 September, but plumes rising up to 100 m above the summit were seen during 13, 16, 17, 21, and 24 September. The alert color code returned to Green on 21 September, indicating normal activity.
Geologic Background. Klyuchevskoy (also spelled Kliuchevskoi) is Kamchatka's highest and most active volcano. Since its origin about 6000 years ago, the beautifully symmetrical, 4835-m-high basaltic stratovolcano has produced frequent moderate-volume explosive and effusive eruptions without major periods of inactivity. It rises above a saddle NE of sharp-peaked Kamen volcano and lies SE of the broad Ushkovsky massif. More than 100 flank eruptions have occurred during the past roughly 3000 years, with most lateral craters and cones occurring along radial fissures between the unconfined NE-to-SE flanks of the conical volcano between 500 m and 3600 m elevation. The morphology of the 700-m-wide summit crater has been frequently modified by historical eruptions, which have been recorded since the late-17th century. Historical eruptions have originated primarily from the summit crater, but have also included numerous major explosive and effusive eruptions from flank craters.
Information Contacts: Olga Chubarova, Kamchatka Volcanic Eruptions Response Team (KVERT), Institute of Volcanic Geology and Geochemistry, Piip Ave. 9, Petropavlovsk-Kamchatsky, 683006, Russia; Tom Miller, Alaska Volcano Observatory (AVO), a cooperative program of a) U.S. Geological Survey, 4200 University Drive, Anchorage, AK 99508-4667, USA (URL: http://www.avo.alaska.edu/), b) Geophysical Institute, University of Alaska, PO Box 757320, Fairbanks, AK 99775-7320, USA, and c) Alaska Division of Geological & Geophysical Surveys, 794 University Ave., Suite 200, Fairbanks, AK 99709, USA.
Ol Doinyo Lengai (Tanzania) — September 1998 Cite this Report
Ol Doinyo Lengai
Tanzania
2.764°S, 35.914°E; summit elev. 2962 m
All times are local (unless otherwise noted)
New cones, vigorous activity since February
From February through August 1998, several visitors to the crater of Ol Doinyo Lengai produced photographs and descriptions of eruptive activity. The following are taken from a summary of those visits provided by Celia Nyamweru, including detailed observations of certain hornitos made by Fred Belton and Chris Weber during their visits in June and August.
Orientation. Figure 51 locates the prominent features in the crater based on a photograph taken on 23 February 1998. A similar sketch map based on a photograph taken in February 1997 from nearly the same perspective appeared in a previous report (BGVN 23:06). Among the conspicuous new features appearing in 1998 are three large hornitos labeled T45, T46, and T47. T45 was described in February 1998 as being "possibly a new cone," but it may have been active as early as December 1997; by August it had grown to a height of ~7 m and was the dominant landmark in the E of the crater. T46 is a broad, darkly colored feature near the T20/T44 cluster. T46 was erroneously identified as T47 in the last Bulletin report. T47 is a tall, very narrow cone with a pointed top. It is located in the south-central area of the crater near the site of T23, which has nearly vanished. The cone cluster known as "A" has completely disappeared beneath recent lava.
General appearance. During a visit to the summit on 12 March, observers noted no major changes to the crater since 23 February. Pale-brown, brown, and gray lava of differing ages covered the floor (figure 52). Pahoehoe flow patterns were clear in some areas, particularly N and NE of T45. An open vent in the T23 area contained a bubbling lava pool and steam issued from various vents. T47 was described as a very tall cone with a vertical crack and sharp peak, making it easily distinguishable from other nearby cones.
An aerial photograph taken during May showed no important changes (figure 53). No steam or fresh lava was seen. The crater floor was covered with white or pale gray lava. A summit visit on 12 June revealed few changes (figure 54). No fresh lavas were seen, but recent flows of gray and brown lava were noticed, particularly in the area of T45 and from T37S in the direction of T24.
There were no signs of fresh surface activity when observers arrived on 17 June. The entire crater floor was grayish white and mostly soft, and no new spatter was visible on any hornito. The lowest point on the crater rim, to the NW, was 30 cm above the crater floor. T47 was the tallest cone in the crater (~11 m) and was lightly steaming. A 150-m-long steaming fracture, rich in sulfur deposits, was oriented SW-NE; the fracture passed over the site of T41 and T42, both of which had disappeared.
During visits through the first week of August, the steaming fissure was no longer visible, but a new fissure of the same type had developed. This was oriented NW-SE with its SE end located near the base of T20. T37S had two small cones recently added to the S part of its summit and a small lava flow down its W flank. A few clots of lava were ejected from T44C around 1300 on 2 August; although no taller, it showed recently added lava cascades on its N flank. At 0615 on 7 August T44 splashed black liquid lava out of its 6-m-high peak.
T37N1. On 17 June, T37N1 was open to the SE and contained a lava platform consisting of a 2-m-diameter circular pit beneath a 5-m overhanging wall. The pit opened into a cave that was ~4 m deep. A small spatter cone, 4 m W and 2.5 m above the pit, was located on the shoulder of the overhanging wall. At 0630 on 18 June a vigorously sloshing pond of very gas-rich lava rose slowly inside the circular pit. Lava was also visible through the vent of the spatter cone. Within an hour the pond overflowed and the spatter cone began ejecting lava clots up to 2 m above the cone, eventually producing pahoehoe and aa flows that traveled ~100 m ESE. This activity continued until 1200. At 1815 on 19 June a 20-minute eruption resulted in an overflow of the pond. Continuous lava fountains rose up to 1 m above the spatter cone, covering the flows from the previous day. At 1600 on 20 June an eruption lasting more than 15 hours began with a high-volume pond overflow and explosions every 2 seconds from the spatter cone. By 2245 the explosions had stopped and an orange flame was seen at the cone's vent. Lava continued to pour from the pond all night. A tube-fed flow first traveled N, then curved E as a narrow strip ~80 m long containing a single tube, and finally spread out into a wide stacked flow-field that piled up against the E rim.
At 1800 on 5 August a lava lake was seen in the cave under the spatter cone, ~5 m below the rim. At 1930 the lake began to glow dull red in the darkness, revealing that the cave was much larger than it had first appeared. The entire T37N1 hornito was hollow with a lake slowly rising inside that flowed toward the SW and entered a westward-directed tube or cave. As the lake rose higher lava appeared on the crater floor at the W base of T37N1, flowing slowly along the bottom of an old tube. Within 10 minutes the lake rose up to vent level and began to slosh over the rim, but lava could no longer be seen on the crater floor. From 2000 to 2330 the lake overflowed numerous times and lava advanced to a point near the base of T5T9. Due to frequent fluctuations in lake level, no long tubes developed; instead the flows were short and thickly stacked.
Similar activity occurred in the early morning hours of 6 August; just before 0715 the lake was ~3 m below the rim of the spatter cone, which had been increased in height and reduced in diameter during the eruption. The open interior of T37N1 filled with lava to a depth of 2 m, completely burying the pit that had contained the overflowing lava pond in June. The T37N1 spatter cone, positioned on the W side of the new, higher lava platform, was taller and had a larger vent than in June. Foaming white to pale gray carbonatite lava splashed out and fed short lava flows a few meters long down the W slope. Its vent opened into a large cave, ~8 m deep. A recent tube-fed flow from the vent extended to the W crater wall. The vesiculation of the gas-rich lava was high. Activity stopped around 1100 causing a 4-m drop of the lava level.
T48. At 0800 on 18 June (while T37N1 was erupting) T48 produced lava fountains up to 3 m high for 10 minutes, forming short aa flows on its N side. Throughout the morning of 19 June it occasionally ejected solid lapilli along with loud puffs of steam. At 2335 that night it began exploding loudly every 2 seconds and produced lava fountains up to 7 m high. After less than 2 minutes of these explosions the fountains decreased in height to 3 m but increased in volume. Each explosion covered the NW half of T48 with a thick layer of spatter that glowed dull red.
By August T48 had increased in height by at least 2 m and had produced many fresh flows extending in all directions. Aerial photographs taken by Benoit Wangermez on 1 August showed several fresh lava flows originating from vents in the approximate location of T48 and T49 extending to the NE and W crater rims. At 1300 on 2 August, low lava fountaining began from the summit vent and within an hour a lava stream was cascading down the nearly vertical SW flank of T48. Over the next 7 hours a large tube formed from the summit down the SW flank. Lava from this tube advanced past the N slope of T20 more than halfway to the WNW crater wall. Near the base of T48 the tube was ~60 cm in diameter and had several skylights from which lava often overflowed. The lava was gas-rich with a surface that appeared to be covered with gray foam.
The eruption continued all night but lava never reached the crater wall. At 0800 on 3 August a close inspection of the vertical lava tube revealed a small crack expelling hot air. Near 1000 the tube ruptured at that point, creating a powerful horizontal lava fountain that played on the N flank and base of nearby T44C. As the rupture progressed, other fountains directed at various angles of inclination developed, and eventually a flow began to form a second tube. The original tube was still full of flowing lava. By 1800 no lava was visible in the skylights. At 1930 a thin lava stream was spraying horizontally from the E side of T48's summit. At 0600 on 4 August T48 was inactive but at 0800 fountains developed on its upper east flank, creating pahoehoe and aa flows that reached the base of T40B. Similar activity continued until 2000. There was no further activity until 2330 on 5 August when a wide lava fountain sprayed horizontally for 20 minutes from just above a small ledge on the E flank, 2 m below the summit.
On 6 August at 1400 lava splashed out of two openings close to the peak of T48. Black, degassed, very liquid lava fed little lava flows reaching 8 m down the E slope. The activity stopped shortly after 1600.
T40. Sloshing lava was heard inside T40 during the entire June visit. During the night of June 19 a pahoehoe flow traveled ~10 m from a small vent in its base. Lava flowed into a cave under a low, broad hornito just NE of T40. This new lava flow was ~1 m thick. The cave had contained an impressive group of white lava stalactites. On 20 June a 3-m2 section of the SW flank collapsed into its interior.
On 2 August at 1000 occasional lava clots were being ejected from T40's summit, but this continued for only ~30 minutes. During the August visit T40 was noisily degassing. The collapse pit that formed on 20 June in the SW flank of T40 was no longer visible, having been filled in by lava. Recent flows extended a short distance SW and SE of T40, partially covering a low mound to the SE. A tall, narrow cone had very recently been formed on the summit of T40 and was the source of several very fresh aa flows extending to the base of T40.
T49. A small cone just NE of T49 extended toward the NW and grew in height between visits. Sloshing lava was frequently heard there. After several earthquakes during the night of 6 August, at 0408 on 7 August a loud explosion blew off the top and N side of T49. Rocks up to 1 m3 were thrown or rolled a few meters. A dark-red lava fountain ~15 m high continued until 0413 with a loud, jet-like noise. Pahoehoe lava with little viscosity (1-5 Pa s) splashed N of T49 and traveled NW. The flow was thin (10-20 cm) and stopped shortly after the end of the eruption. The amount of erupted lava was ~70-100 m3. Lava pearls up to 4 mm diameter and fine ash were blown over 200 m NW.
Geologic Background. The symmetrical Ol Doinyo Lengai is the only volcano known to have erupted carbonatite tephras and lavas in historical time. The prominent stratovolcano, known to the Maasai as "The Mountain of God," rises abruptly above the broad plain south of Lake Natron in the Gregory Rift Valley. The cone-building stage ended about 15,000 years ago and was followed by periodic ejection of natrocarbonatitic and nephelinite tephra during the Holocene. Historical eruptions have consisted of smaller tephra ejections and emission of numerous natrocarbonatitic lava flows on the floor of the summit crater and occasionally down the upper flanks. The depth and morphology of the northern crater have changed dramatically during the course of historical eruptions, ranging from steep crater walls about 200 m deep in the mid-20th century to shallow platforms mostly filling the crater. Long-term lava effusion in the summit crater beginning in 1983 had by the turn of the century mostly filled the northern crater; by late 1998 lava had begun overflowing the crater rim.
Information Contacts: Celia Nyamweru, Department of Anthropology, St. Lawrence University, Canton, NY 13617 USA (URL: http://blogs.stlawu.edu/lengai/); Fredrick A. Belton, 3555 Philsdale Ave., Memphis, TN 38111; Christoph Weber, Kruppstr 171, 42113 Wuppertal, Germany.
Masaya (Nicaragua) — September 1998 Cite this Report
Masaya
Nicaragua
11.9844°N, 86.1688°W; summit elev. 594 m
All times are local (unless otherwise noted)
Integrated scientific studies of the caldera area
Four teams of Canadian, British, and Nicaraguan volcanologists carried out studies of Masaya caldera during January-April and September 1998. The volcano was examined using correlation spectroscopy (COSPEC), microgravity, Open Path Fourier Transform Infrared spectroscopy (OP-FTIR), and soil-gas studies.
Vent degassing appeared to have increased significantly. COSPEC measurements during February-April 1998 showed SO2 flux varying from 680 t/d to a maximum of 5,580 t/d. Measurements made during the previous year (January-March 1997) showed more stable fluxes of approximately 380 t/d. Measurements in September 1998 showed flux levels varying from 320 to 1,420 t/d.
OP-FTIR measured from the Plaza Oviedo overlooking the "Santiago" pit crater showed consistent SO2/HCl and HCl/HF volume ratios of 2 and 7, respectively. Using the COSPEC-derived SO2 flux, scientists inferred HCl fluxes of 340 to 2,790 t/d and HF fluxes of 97 to 797 t/d.
CO2 soil-gas measurements at the foot of the Comalito cinder cone increased from 23 to 31.3% between March 1997 and February 1998. Fumarole temperatures also increased from 70 to 84°C during February 1998.
Microgravity surveys during March 1997-February 1998 showed a slight increase in gravity immediately beneath the Santiago pit crater. They also showed evidence (increased noise recorded on the meter) of significant seismic activity around the Santiago crater. Similar measurements acquired in September 1998 indicated increased seismic activity throughout the caldera.
Temperatures at the active vent, measured using a Cyclops infrared camera, ranged between 170 and 400°C. The higher measurements occurred when incandescence of the vent walls was visible. In March, a small fumarole emitting low levels of gas appeared, ~15 m from the active vent.
Geologic Background. Masaya volcano in Nicaragua has erupted frequently since the time of the Spanish Conquistadors, when an active lava lake prompted attempts to extract the volcano's molten "gold" until it was found to be basalt rock upon cooling. It lies within the massive Pleistocene Las Sierras caldera and is itself a broad, 6 x 11 km basaltic caldera with steep-sided walls up to 300 m high. The caldera is filled on its NW end by more than a dozen vents that erupted along a circular, 4-km-diameter fracture system. The Nindirí and Masaya cones, the source of observed eruptions, were constructed at the southern end of the fracture system and contain multiple summit craters, including the currently active Santiago crater. A major basaltic Plinian tephra erupted from Masaya about 6,500 years ago. Recent lava flows cover much of the caldera floor and there is a lake at the far eastern end. A lava flow from the 1670 eruption overtopped the north caldera rim. Periods of long-term vigorous gas emission at roughly quarter-century intervals have caused health hazards and crop damage.
Information Contacts: Glyn Williams-Jones, Dave Rothery, Hazel Rymer, Peter Francis, and Lisa Boardman, Department of Earth Sciences, The Open University, Milton Keynes MK7 6AA, United Kingdom; Alexandre Beaulieu, Dany Harvey, Pierre Delmelle, Katie St-Amand, and John Stix, Département de Géologie, Université de Montréal, Montréal, Québec H3C 3J7, Canada; Mike Burton, Clive Oppenheimer, and Matthew Watson, Department of Geography, University of Cambridge, Downing Place, Cambridge, CB2 3EN, United Kingdom (URL: http://www.geog.cam.ac.uk/); Hélène Gaonac'h, Département des sciences de la Terre, Université du Québec - Montréal, Montréal, Québec H3C 3P8, Canada; Martha Navarro and Wilfried Strauch, INETER, Apartado Postal 2110, Managua, Nicaragua; Benjamin van Wyk de Vries, Departement des Sciences de la Terre, Universite Blaise Pascal, 63038 Clermont-Ferrand, France.
Obituary Notices (Unknown) — September 1998 Cite this Report
Obituary Notices
Unknown
Unknown, Unknown; summit elev. m
All times are local (unless otherwise noted)
Death of Oleg Volynets in Petropavlovsk-Kamchatsky
On 24 October, in Petropavlovsk-Kamchatsky, the volcano community lost a distinguished scientist and an exceptionally kind, warm human being. Oleg Volynets worked for over 39 years on the volcanoes of the NW Pacific rim, and died at the peak of an unusually productive career. His colleague Vera Ponomareva wrote that he "combined the qualities of a unique expert in Kamchatka rocks with broad knowledge in modern geochemistry. More important, he was our conscience, a true 'chevalier sans peur et sans reproche.' His death is a deep personal grief for many people." He found time to share his extensive knowledge of Russian volcanoes with us here at the Smithsonian, and we are among those "many people."
Geologic Background. Obituary notices for volcanologists are sometimes written when scientists are killed during an eruption or have had a special relationship with the Global Volcanism Program.
Information Contacts:
Popocatepetl (Mexico) — September 1998 Cite this Report
Popocatepetl
Mexico
19.023°N, 98.622°W; summit elev. 5393 m
All times are local (unless otherwise noted)
Several episodes of ash emission during September
Following a large ash exhalation on 8 September (BGVN 23:08), eruptive activity at Popocatépetl decreased in intensity and duration. CENEPRED reported a few moderate emissions during September that caused local ashfall.
Small-volume, discrete, short-duration emissions containing ash, sometimes accompanied by steam and gas, were recorded occasionally during the period 9-15 September. Brief episodes of harmonic tremor were also recorded. During the night of 14 September glow reflected from clouds over the crater was seen.
Moderate exhalations of steam, gas, and light ash took place during 16 September. Several brief episodes of high-frequency tremor were recorded that afternoon; the largest emissions occurred at 1546-1552, 1604, and 1611. Ashfall was reported at Amecameca, 20 km NW of the volcano. Despite bad weather that reduced visibility most of the day, a dense column of steam and gas was seen rising 700 m above the summit before being blown to the NW. Activity decreased to stable background levels on 17 September. A dense steam and gas cloud seen on the morning of 18 September dispersed to the NE; as the cloud gained altitude, its direction changed to the south. SO2 measurements showed significant increases following the 16 September explosion over levels earlier in the month.
Another moderate increase in eruptive activity began a few days later. A steam and gas column rising 1 km above the summit was observed during 20 September. Brief, moderately intense emissions of steam and gas, sometimes with light ash puffs, took place throughout the morning of 21 September. An explosion at 1148 that morning produced light ashfall in towns up to 20 km NW of Popocatépetl. A similar but less intense event occurred at 1543. Emissions decreased to relatively low levels until 1225 on 22 September when a moderate explosion lasting 7 minutes produced a steam, gas, and ash plume that rose 4 km above the summit. Visibility during 22 August was poor due to bad weather, but a large ash cloud near the crater was detected by Doppler radar. Ash was dispersed during the afternoon NW of the volcano, producing light ash falls in the suburban SE of metropolitan México City.
Following the explosion on 22 September, eruptive activity paused until a similar explosion occurred at 1829 on 23 September. This explosion lasted 6 minutes and produced a 3-km high column of steam, gas, and ash. Ash fall was reported in towns SW of the volcano. Eruptive activity soon decreased again, stabilizing at low levels of small, isolated emissions of steam and gas, typical of earlier in September. An exhalation at 1025 on 24 September was followed by 30 minutes of low-frequency harmonic tremor. An A-type earthquake of M 2.1 located 1.8 km E of the crater at a depth of 3.9 km was recorded at 2224 on 24 September, and another moderate exhalation lasting 7 minutes began at 2332.
Geologic Background. Volcán Popocatépetl, whose name is the Aztec word for smoking mountain, rises 70 km SE of Mexico City to form North America's 2nd-highest volcano. The glacier-clad stratovolcano contains a steep-walled, 400 x 600 m wide crater. The generally symmetrical volcano is modified by the sharp-peaked Ventorrillo on the NW, a remnant of an earlier volcano. At least three previous major cones were destroyed by gravitational failure during the Pleistocene, producing massive debris-avalanche deposits covering broad areas to the south. The modern volcano was constructed south of the late-Pleistocene to Holocene El Fraile cone. Three major Plinian eruptions, the most recent of which took place about 800 CE, have occurred since the mid-Holocene, accompanied by pyroclastic flows and voluminous lahars that swept basins below the volcano. Frequent historical eruptions, first recorded in Aztec codices, have occurred since Pre-Columbian time.
Information Contacts: Servando De la Cruz-Reyna1,2 Roberto Quaas1,2 Carlos Valdés G.2 and Alicia Martinez Bringas1; 1 Centro Nacional de Prevencion de Desastres (CENAPRED) Delfin Madrigal 665, Col. Pedregal de Santo Domingo, Coyoacan, 04360, México D.F. (URL: https://www.gob.mx/cenapred/); and 2 Instituto de Geofisico, UNAM, Coyoacán 04510, México D.F., México.
Sete Cidades (Portugal) — September 1998 Cite this Report
Sete Cidades
Portugal
37.865°N, 25.785°W; summit elev. 842 m
All times are local (unless otherwise noted)
Seismic swarm on submarine flank
Since June 1998, increasing seismic activity in the vicinity of Sete Cidades volcano has resulted in occasional seismic swarms. On the night of 2-3 August about 120 events were registered in 3 hours. During that period, five earthquakes were felt along the W coast, the strongest with a magnitude of 3.1 reached a maximum intensity of V (MM) at Ginetes e Varzea. Similarly, on 2 September in Sao Miguel more than 120 events occurred beneath the sea floor over a period of about 4 hours near shore between Ponta da Ferraria and Mosteiros. One of the five felt earthquakes during this period also reached an intensity of V (MM). There were no reports of injury or damage from any of these events.
Geologic Background. Sete Cidades volcano at the western end of Sao Miguel Island contains a 5-km-wide summit caldera occupied by two caldera lakes. The steep-walled, 500-m-deep caldera was formed about 22,000 years ago, and at least 22 post-caldera eruptions have occurred. A large group of Pleistocene post-caldera trachytic lava domes, lava flows, and pyroclastic-flow deposits is found on the western-to-northern flanks. A nearly circular ring of six Holocene pyroclastic cones on the caldera floor have been the source of a dozen trachytic pumice-fall deposits erupted during the past 5,000 years. Recorded eruptions date back to the 15th century and have occurred both within the caldera and from submarine vents off the west coast.
Information Contacts: João Luis Gaspar and Nicolau Wallenstein, Departamento de Geociencias, Centro de Vulcanologia, Universidade dos Açores, Rua Mae de Deus, 9500 - Ponta Delgada, Sao Miguel, Açores, Portugal.
Sheveluch (Russia) — September 1998 Cite this Report
Sheveluch
Russia
56.653°N, 161.36°E; summit elev. 3283 m
All times are local (unless otherwise noted)
Ash explosions and pyroclastic flow during 3 September
Seismicity remained generally at background levels during 2-28 September. A plume on 2-3 September was seen rising 200 m above the volcano. At 1622 on 3 September, ash explosions produced a cloud that rose 5 km above the summit, and extended 100 km NNE. Pyroclastic flows moving SW were observed at this time. The explosion was also accompanied by a 9-minute series of shallow earthquakes and tremor. The level-of-concern color code remained Green. Observation was restricted by cloud during much of the month.
Geologic Background. The high, isolated massif of Sheveluch volcano (also spelled Shiveluch) rises above the lowlands NNE of the Kliuchevskaya volcano group. The 1,300 km3 andesitic volcano is one of Kamchatka's largest and most active volcanic structures, with at least 60 large eruptions during the Holocene. The summit of roughly 65,000-year-old Stary Shiveluch is truncated by a broad 9-km-wide late-Pleistocene caldera breached to the south. Many lava domes occur on its outer flanks. The Molodoy Shiveluch lava dome complex was constructed during the Holocene within the large open caldera; Holocene lava dome extrusion also took place on the flanks of Stary Shiveluch. Widespread tephra layers from these eruptions have provided valuable time markers for dating volcanic events in Kamchatka. Frequent collapses of dome complexes, most recently in 1964, have produced debris avalanches whose deposits cover much of the floor of the breached caldera.
Information Contacts: Olga Chubarova, Kamchatka Volcanic Eruptions Response Team (KVERT), Institute of Volcanic Geology and Geochemistry, Piip Ave. 9, Petropavlovsk-Kamchatsky, 683006, Russia; Tom Miller, Alaska Volcano Observatory (AVO), a cooperative program of a) U.S. Geological Survey, 4200 University Drive, Anchorage, AK 99508-4667, USA (URL: http://www.avo.alaska.edu/), b) Geophysical Institute, University of Alaska, PO Box 757320, Fairbanks, AK 99775-7320, USA, and c) Alaska Division of Geological & Geophysical Surveys, 794 University Ave., Suite 200, Fairbanks, AK 99709, USA.
Soufriere Hills (United Kingdom) — September 1998 Cite this Report
Soufriere Hills
United Kingdom
16.72°N, 62.18°W; summit elev. 915 m
All times are local (unless otherwise noted)
Continuing decrease in activity; hazards reassessed
The following summarizes the Montserrat Volcano Observatory's (MVO) scientific reports for July and August, except information concerning the 3 July pyroclastic flows, which was reported in BGVN 23:07.
Summary. In the weeks following the 3 July pyroclastic flows, no fresh magma reached the surface; however, vesicular ballistic blocks were recovered from craters on Perches Mountain suggesting that there may have been a small Vulcanian explosion. SO2-flux levels declined steadily throughout July to an average of 1,000 metric tons/day (t/d). Vigorous steam-and-ash venting continued from the dome-collapse scar until the end of July. Activity in August was dominated by several small dome-collapse events and a period of enhanced steam-and-ash venting in the middle of the month. The dome-collapse events were caused by the gravitational collapse of weakened dome rock. The ash venting was intense one day but waned over following days to normal levels. MiniCOSPEC results showed a peak that coincided with the enhanced venting, but there was an overall decline from ~1,000 t/d at the beginning of the month to ~500 t/d at the end of the month.
Visual observations. Ash-and-steam venting immediately after the 3 July event was vigorous. Significant pulses of steam-and-ash continued for 2-3 weeks and fumarolic activity was evident on the S and N flanks of the dome.
A steep buttress overhanging the 3 July scar collapsed on 16 August generating pyroclastic flows that reached the Tar River delta. Large fragments of the buttress were left in the area of the scar's mouth. On 19 August fumarolic activity in the scar increased in intensity: fumaroles on the back wall and at the base of the scar discharged copious quantities of steam and ash in jets. The next day activity decreased in intensity and the fumaroles were generally issuing steam only. Some of the fumaroles were temporarily buried following a rockfall within the scar on 20 August. The fumarolic activity declined steadily, and by 22 August activity had declined to levels observed in the first week of August.
Mudflows continued to be a problem in July. Mudflow deposits built up beneath the Belham Bridge until there was a clearance of only about 30 cm.
Seismicity. After 5 July, seismicity returned to levels similar to the previous month, with the exception of a swarm of volcano-tectonic earthquakes on 25 July (figure 43). This swarm had no outward manifestation at the volcano and activity returned to low levels by the next day.
Seismicity during August was generally low. Activity was dominated by small volcano-tectonic earthquakes located ~3 km below the dome, with occasional rockfalls and pyroclastic-flow signals. On 13 August there were two episodes (at 0519 and 1455) of pyroclastic flow in the White River valley. These flows traveled 1.8 km from the dome and were caused by the collapse of weakened dome rock. Active fumaroles on the Galways side of the dome near Chances Peak undermined part of the dome. A scar immediately above the fumarolic area is believed to be the source of the pyroclastic flows. Each episode was followed by about an hour of continuous rockfall activity. On 19 August a rockfall signal was followed by tremor, which corresponded to vigorous ash venting. The signal lasted two days and varied in amplitude. At times of highest amplitude the tremor was nearly monochromatic at 4 Hz.
Ground deformation. Measurements from GPS survey sites on the flanks of the volcano and in the N of the island indicated widespread major reductions in movement during July. The Hermitage site indicated continued slow movement NE at rate of ~0.5 cm/month. The GPS site at Perches was destroyed in the 3 July event; ballistics were scattered over Perches Mountain and the GPS site was later found at the edge of a 3.4 m diameter impact crater. The rates of movement of sites in August were within the instrumental error. The GPS kit was used for one week by volcanologists from the University of Rhode Island who were conducting a bathymetric survey of the fans at the mouths of the Tar River and White Rivers valleys.
The EDM reflector on Peak B was measured from Windy Hill. The increase in distance of 5 cm during the period May-July may have been caused partially by release associated with the 3 July collapse. The line had shortened by 9 cm between 25 January and 13 May, but between May and August the distance lengthened by a total 8 cm (within 1 cm of its original length) possibly indicating a relaxation in the confining pressure.
Volume measurements. A kinematic GPS survey of the Tar River fan was completed in July. The total volume of the fan was estimated to be 22.1 x 10⁶ m3. A previous survey in August 1997 gave a volume of 15.7 x 10⁶ m3. Much of the increase resulted from the 3 July collapse, which extended the fan 350 m N, although a small part of the increase was due to the accumulation of pyroclastic-flow deposits during the September-October 1997 explosion sequence (BGVN 22:10 and 22:11). The E limit of the fan, defined by a steep shelf extending into the sea, was unchanged. A small deposit was left on the S side of the fan, although above the established shoreline there was only a thin layer of pyroclastic-flow deposits.
No volume measurements were made in August. Attempts to survey the 3 July collapse scar were foiled by deteriorating weather conditions and a lack of helicopter fuel.
Environmental monitoring. MiniCOSPEC observations recommenced on 5 July. In early July SO2 flux was generally between 1,000 and 2,500 metric tons/day (t/d). On 13 July SO2 flux measured 4,150 t/d, the highest ever recorded at Montserrat. Throughout the remainder of July there was a gradual decline in SO2 flux to an average of 1,000 t/d at the end of the month. The cause of the relatively high gas flux in the apparent absence of magmatic activity was being investigated, but may relate to perturbations in the hydrothermal system caused by the dome collapse on 3 July 1998.
MiniCOSPEC measurements in early August showed a consistent SO2 flux of ~500-1000 t/d. On 19 August levels rose to 1,400 t/d as a result of enhanced venting. Towards the end of the month poor weather limited the number of COSPEC measurements, but there appeared to be a slight decrease to an average of ~500 t/d. Throughout late August the wind direction was variable due to tropical storms in the area. On occasions when the wind blew to the N or NW a strong smell of sulfurous gases was detected in the inhabited area of Montserrat.
Sulfur dioxide diffusion tubes exposed between 29 June and 13 July clearly reflect the high emissions in early July (table 31). The Plymouth area in particular was subjected to very high concentrations of gas. In the second half of July SO2 concentrations in Plymouth were reduced by half. Populated areas N of the Belham River valley were, as usual, only subjected to very low SO2 levels in July. In August there was a general decline of SO2 in the atmosphere. An additional monitoring site in the N of the island was installed to assess SO2 during shifts in wind direction.
Table 31. Sulfur dioxide diffusion-tube results, 29 June-11 August 1998. Levels are in parts per billion (ppb). Courtesy of MVO.
| Station |
29 Jun-13 Jul 1998 |
13 Jul-27 Jul 1998 |
27 Jul-11 Aug 1998 |
| Police HQ, Plymouth |
207.9 |
116.5 |
131.5 |
| St. George's Hill |
22.05 |
8.55 |
9.55 |
| Weekes |
5.75 |
4.1 |
2.85 |
| MVO south |
4.3 |
3.85 |
-- |
| Lawyers |
2.2 |
0 |
3.8 |
| Vue Pointe Hotel |
-- |
-- |
3.25 |
Hazard assessment. A meeting was held 14-16 July at McChesney's Estate to assess the current hazards and risks associated with Soufriere Hills Volcano. The meeting brought together many of the senior scientists who have worked at MVO during the three-year volcanic crisis. Those who took part were Richie Robertson, Lloyd Lynch and John Shepherd from the Seismic Research Unit in Trinidad; Simon Young, Sue Loughlin, Tony Reedman, and Gill Norton from the British Geological Survey; and many other senior scientists from around the world including Steve Sparks from Bristol University, Peter Baxter from Cambridge University, Barry Voight from Penn State University, Joe Devine from Brown University, Peter Francis from the Open University, Keith Rowley, and Willy Aspinall. Richard Luckett and Richard Herd from MVO provided up-to-date information about the current status of Soufriere Hills volcano.
Discussion was held on various aspects of the activity over the previous six months, including the event on 3 July. Related issues, including the safety of Bramble airport, were also addressed. An assessment of the level of risk associated with the volcano was undertaken. A report was presented to the government of Montserrat and the U.K. on 29 July after which the findings were made public.
According to the report, MVO judged it likely that the volcano has entered a period of repose, with the probability of no further magmatic eruptions in the next 6 months set at about 95%. MVO was confident that renewed magma ascent and escalation to dangerous levels of activity could be identified, although they cautioned that escalation might take place in a very short period of time (e.g. a matter of hours). Most of the island was perceived to be under reduced risk, but areas S of the Belham River Valley remain vulnerable to serious volcanic hazards including pyroclastic flows related to the collapse of the dome, mud flows, and exposure to fine ash. Further dome collapses were deemed likely and could affect all flanks of the volcano, especially the Tar River, Gages Valley, Plymouth area, Galways, and the NE slopes. There is potential for a variety of events to take place, including steam explosions, mud flows, and ash falls, for many years to come but the risks will decline with time. Health risk analysis showed that if magmatic activity does not resume, the potential for harmful exposure to ash will be limited and the risk of developing silicosis will be low in Zones 1 to 3. The same would apply to Population Zone 4 north of the Belham Valley after a clean-up operation has been safely completed. A public education program on the health risks of ash was recommended, including guidance on protection measures during the clean up. Certain groups could be at risk from much higher exposure (e.g. outdoor workers and asthma sufferers) and there may be unknown long-term health risks to young children.
The Volcanic Executive Group (VEG), chaired by Governor Tony Abbott, met to consider the Scientific Review. A statement from the Governor's Office following the meeting rescinded the recommendation that residents leave the Central Zone. Also, there was no longer any objection to commercial organizations operating within the Central Zone. The clean up of Friths, Salem, and Old Towne, which commenced some weeks ago, was intensified. The VEG sought advice on how to ensure that the Zone will be cleaned so that children and those with respiratory problems will not be affected on reoccupation.
Geologic Background. The complex, dominantly andesitic Soufrière Hills volcano occupies the southern half of the island of Montserrat. The summit area consists primarily of a series of lava domes emplaced along an ESE-trending zone. The volcano is flanked by Pleistocene complexes to the north and south. English's Crater, a 1-km-wide crater breached widely to the east by edifice collapse, was formed about 2000 years ago as a result of the youngest of several collapse events producing submarine debris-avalanche deposits. Block-and-ash flow and surge deposits associated with dome growth predominate in flank deposits, including those from an eruption that likely preceded the 1632 CE settlement of the island, allowing cultivation on recently devegetated land to near the summit. Non-eruptive seismic swarms occurred at 30-year intervals in the 20th century, but no historical eruptions were recorded until 1995. Long-term small-to-moderate ash eruptions beginning in that year were later accompanied by lava-dome growth and pyroclastic flows that forced evacuation of the southern half of the island and ultimately destroyed the capital city of Plymouth, causing major social and economic disruption.
Information Contacts: Montserrat Volcano Observatory (MVO), c/o Chief Minister's Office, PO Box 292, Plymouth, Montserrat, West Indies (URL: http://www.mvo.ms/); Richard Aspin, Information & Education Unit, Emergency Dept., St Johns Village, Montserrat, Leeward Islands, West Indies.
Yasur (Vanuatu) — September 1998 Cite this Report
Yasur
Vanuatu
19.532°S, 169.447°E; summit elev. 361 m
All times are local (unless otherwise noted)
Ongoing eruption, felt earthquake, and fresh glass chemical analysis
On 9 September 1998, an earthquake was felt in a village 3 km from Yasur; simultaneously, loud explosions were heard from the volcano. When the summit was visited by John Seach during 10-11 September, five craters inside the main summit crater in the pyroclastic cone were found to be active. Crater A, large and on the S, displayed quiet explosions followed by brown ash emission. Other craters were quiet with only gas emissions. These included the smaller Crater B, in the center of the main crater; the larger Crater C, on the N; the small Crater D located W of Crater B; and Crater E, on the SW wall of the main crater.
During 4 hours of observation on 10 September, 51 explosions were observed from four craters: Crater A, 25 explosions; Crater B, 9; Crater C, 13; and Crater D, 4. Bombs thrown from Craters B, C, and D fell back into the vent or onto the crater wall. Some larger explosions, every 20-30 minutes, threw bombs 350 m high. During the night, bombs thrown onto the crater wall glowed for up to 6 minutes. The explosions and shaking were felt up to 3 km away.
A fresh bomb collected in August 1997 (BGVN 22:08) was recently analyzed by microprobe (table 1).
Table 1. Major element analysis of Yasur glass taken from an average of five analyses on fresh glass bomb collected in August 1997. All iron is shown as FeO. Microprobe analysis courtesy of Timothy O'Hearn; sample courtesy of Steve and Donna O'Meara, and Robert Benward.
| Component |
Weight % |
| SiO2 |
58.61 |
| TiO2 |
0.95 |
| Al203 |
15.07 |
| FeOt |
8.68 |
| MnO |
0.25 |
| MgO |
2.49 |
| CaO |
5.44 |
| Na2O |
3.52 |
| K2O |
3.78 |
| P2O5 |
0.66 |
| Total |
99.46 |
Geologic Background. Yasur has exhibited essentially continuous Strombolian and Vulcanian activity at least since Captain Cook observed ash eruptions in 1774. This style of activity may have continued for the past 800 years. Located at the SE tip of Tanna Island in Vanuatu, this pyroclastic cone has a nearly circular, 400-m-wide summit crater. The active cone is largely contained within the small Yenkahe caldera, and is the youngest of a group of Holocene volcanic centers constructed over the down-dropped NE flank of the Pleistocene Tukosmeru volcano. The Yenkahe horst is located within the Siwi ring fracture, a 4-km-wide open feature associated with eruption of the andesitic Siwi pyroclastic sequence. Active tectonism along the Yenkahe horst accompanying eruptions has raised Port Resolution harbor more than 20 m during the past century.
Information Contacts: John Seach, P.O. Box 16, Chatsworth Island, N.S.W. 2469, Australia; Tim O'Hearn, Department of Mineral Sciences, Smithsonian Institution, Washington, DC 20560-0119 USA.