Recently Published Bulletin Reports
Kadovar (Papua New Guinea) An ash plume and weak thermal anomaly during May 2023
San Miguel (El Salvador) Small gas-and-ash explosions during March and May 2023
Ebeko (Russia) Continued explosions, ash plumes, and ashfall during October 2022-May 2023
Home Reef (Tonga) Discolored plumes continued during November 2022-April 2023
Semisopochnoi (United States) Occasional explosions, ash deposits, and gas-and-steam plumes during December 2022-May 2023
Ambae (Vanuatu) New lava flow, ash plumes, and sulfur dioxide plumes during February-May 2023
Ibu (Indonesia) Daily ash explosions continue, along with thermal anomalies in the crater, October 2022-May 2023
Dukono (Indonesia) Continuing ash emissions, SO2 plumes, and thermal signals during October 2022-May 2023
Sabancaya (Peru) Explosions, gas-and-ash plumes, and thermal activity persist during November 2022-April 2023
Sheveluch (Russia) Significant explosions destroyed part of the lava-dome complex during April 2023
Bezymianny (Russia) Explosions, ash plumes, lava flows, and avalanches during November 2022-April 2023
Chikurachki (Russia) New explosive eruption during late January-early February 2023
Kadovar (Papua New Guinea) — June 2023  Cite this Report
Kadovar
Papua New Guinea
3.608°S, 144.588°E; summit elev. 365 m
All times are local (unless otherwise noted)
An ash plume and weak thermal anomaly during May 2023
Kadovar is a 2-km-wide island that is the emergent summit of a Bismarck Sea stratovolcano. It lies off the coast of New Guinea, about 25 km N of the mouth of the Sepik River. Prior to an eruption that began in 2018, a lava dome formed the high point of the volcano, filling an arcuate landslide scarp open to the S. Submarine debris-avalanche deposits occur to the S of the island. The current eruption began in January 2018 and has comprised lava effusion from vents at the summit and at the E coast; more recent activity has consisted of ash plumes, weak thermal activity, and gas-and-steam plumes (BGVN 48:02). This report covers activity during February through May 2023 using information from the Darwin Volcanic Ash Advisory Center (VAAC) and satellite data.
Activity during the reporting period was relatively low and mainly consisted of white gas-and-steam plumes that were visible in natural color satellite images on clear weather days (figure 67). According to a Darwin VAAC report, at 2040 on 6 May an ash plume rose to 4.6 km altitude and drifted W; by 2300 the plume had dissipated. MODIS satellite instruments using the MODVOLC thermal algorithm detected a single thermal hotspot on the SE side of the island on 7 May. Weak thermal activity was also detected in a satellite image on the E side of the island on 14 May, accompanied by a white gas-and-steam plume that drifted SE (figure 68).
Geologic Background. The 2-km-wide island of Kadovar is the emergent summit of a Bismarck Sea stratovolcano of Holocene age. It is part of the Schouten Islands, and lies off the coast of New Guinea, about 25 km N of the mouth of the Sepik River. Prior to an eruption that began in 2018, a lava dome formed the high point of the andesitic volcano, filling an arcuate landslide scarp open to the south; submarine debris-avalanche deposits occur in that direction. Thick lava flows with columnar jointing forms low cliffs along the coast. The youthful island lacks fringing or offshore reefs. A period of heightened thermal phenomena took place in 1976. An eruption began in January 2018 that included lava effusion from vents at the summit and at the E coast.
Information Contacts: Darwin Volcanic Ash Advisory Centre (VAAC), Bureau of Meteorology, Northern Territory Regional Office, PO Box 40050, Casuarina, NT 0811, Australia (URL: http://www.bom.gov.au/info/vaac/); Hawai'i Institute of Geophysics and Planetology (HIGP) - MODVOLC Thermal Alerts System, School of Ocean and Earth Science and Technology (SOEST), Univ. of Hawai'i, 2525 Correa Road, Honolulu, HI 96822, USA (URL: http://modis.higp.hawaii.edu/); Copernicus Browser, Copernicus Data Space Ecosystem, European Space Agency (URL: https://dataspace.copernicus.eu/browser/).
San Miguel (El Salvador) — June 2023 Cite this Report
San Miguel
El Salvador
13.434°N, 88.269°W; summit elev. 2130 m
All times are local (unless otherwise noted)
Small gas-and-ash explosions during March and May 2023
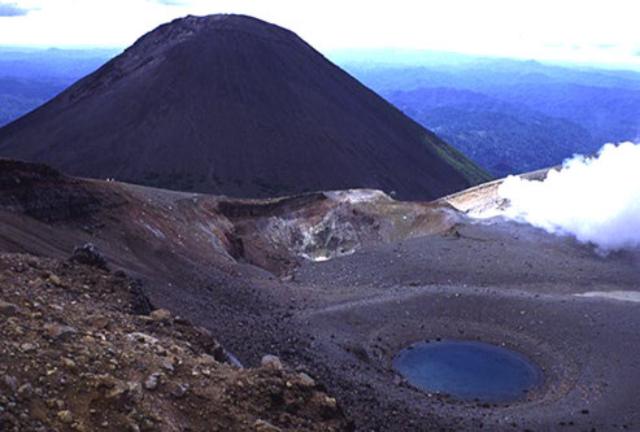
San Miguel in El Salvador is a broad, deep crater complex that has been frequently modified by eruptions recorded since the early 16th century and consists of the summit known locally as Chaparrastique. Flank eruptions have produced lava flows that extended to the N, NE, and SE during the 17-19th centuries. The most recent activity has consisted of minor ash eruptions from the summit crater. The current eruption period began in November 2022 and has been characterized by frequent phreatic explosions, gas-and-ash emissions, and sulfur dioxide plumes (BGVN 47:12). This report describes small gas-and-ash explosions during December 2022 through May 2023 based on special reports from the Ministero de Medio Ambiente y Recursos Naturales (MARN).
Activity has been relatively low since the last recorded explosions on 29 November 2022. Seismicity recorded by the San Miguel Volcano Station (VSM) located on the N flank at 1.7 km elevation had decreased by 7 December. Sulfur dioxide gas measurements taken with DOAS (Differential Optical Absorption Spectroscopy) mobile equipment were below typical previously recorded values: 300 tons per day (t/d). During December, small explosions were recorded by the seismic network and manifested as gas-and-steam emissions.
Gas-and-ash explosions in the crater occurred during January 2023, which were recorded by the seismic network. Sulfur dioxide values remained low, between 300-400 t/d through 10 March. At 0817 on 14 January a gas-and-ash emission was visible in webcam images, rising just above the crater rim. Some mornings during February, small gas-and-steam plumes were visible in the crater. On 7 March at 2252 MARN noted an increase in degassing from the central crater; gas emissions were constantly observed through the early morning hours on 8 March. During the early morning of 8 March through the afternoon on 9 March, 12 emissions were registered, some accompanied by ash. The last gas-and-ash emission was recorded at 1210 on 9 March; very fine ashfall was reported in El Tránsito (10 km S), La Morita (6 km W), and La Piedrita (3 km W). The smell of sulfur was reported in Piedra Azul (5 km SW). On 16 March MARN reported that gas-and-steam emissions decreased.
Low degassing and very low seismicity were reported during April; no explosions have been detected between 9 March and 27 May. The sulfur dioxide emissions remained between 350-400 t/d; during 13-20 April sulfur dioxide values fluctuated between 30-300 t/d. Activity remained low through most of May; on 23 May seismicity increased. An explosion was detected at 1647 on 27 May generated a gas-and-ash plume that rose 700 m high (figure 32); a decrease in seismicity and gas emissions followed. The DOAS station installed on the W flank recorded sulfur dioxide values that reached 400 t/d on 27 May; subsequent measurements showed a decrease to 268 t/d on 28 May and 100 t/d on 29 May.
Geologic Background. The symmetrical cone of San Miguel, one of the most active volcanoes in El Salvador, rises from near sea level to form one of the country's most prominent landmarks. A broad, deep, crater complex that has been frequently modified by eruptions recorded since the early 16th century caps the truncated unvegetated summit, also known locally as Chaparrastique. Flanks eruptions of the basaltic-andesitic volcano have produced many lava flows, including several during the 17th-19th centuries that extended to the N, NE, and SE. The SE-flank flows are the largest and form broad, sparsely vegetated lava fields crossed by highways and a railroad skirting the base of the volcano. Flank vent locations have migrated higher on the edifice during historical time, and the most recent activity has consisted of minor ash eruptions from the summit crater.
Information Contacts: Ministero de Medio Ambiente y Recursos Naturales (MARN), Km. 5½ Carretera a Nueva San Salvador, Avenida las Mercedes, San Salvador, El Salvador (URL: http://www.snet.gob.sv/ver/vulcanologia).
Ebeko
Russia
50.686°N, 156.014°E; summit elev. 1103 m
All times are local (unless otherwise noted)
Continued explosions, ash plumes, and ashfall during October 2022-May 2023
Ebeko, located on the N end of Paramushir Island in the Kuril Islands, consists of three summit craters along a SSW-NNE line at the northern end of a complex of five volcanic cones. Eruptions date back to the late 18th century and have been characterized as small-to-moderate explosions from the summit crater, accompanied by intense fumarolic activity. The current eruption period began in June 2022 and has recently consisted of frequent explosions, ash plumes, and thermal activity (BGVN 47:10). This report covers similar activity during October 2022 through May 2023, based on information from the Kamchatka Volcanic Eruptions Response Team (KVERT) and satellite data.
Activity during October consisted of explosive activity, ash plumes, and occasional thermal anomalies. Visual data by volcanologists from Severo-Kurilsk showed explosions producing ash clouds up to 2.1-3 km altitude which drifted E, N, NE, and SE during 1-8, 10, 16, and 18 October. KVERT issued several Volcano Observatory Notices for Aviation (VONA) on 7, 13-15, and 27 October 2022, stating that explosions generated ash plumes that rose to 2.3-4 km altitude and drifted 5 km E, NE, and SE. Ashfall was reported in Severo-Kurilsk (Paramushir Island, about 7 km E) on 7 and 13 October. Satellite data showed a thermal anomaly over the volcano on 15-16 October. Visual data showed ash plumes rising to 2.5-3.6 km altitude on 22, 25-29, and 31 October and moving NE due to constant explosions.
Similar activity continued during November, with explosions, ash plumes, and ashfall occurring. KVERT issued VONAs on 1-2, 4, 6-7, 9, 13, and 16 November that reported explosions and resulting ash plumes that rose to 1.7-3.6 km altitude and drifted 3-5 km SE, ESE, E, and NE. On 1 November ash plumes extended as far as 110 km SE. On 5, 8, 12, and 24-25 November explosions and ash plumes rose to 2-3.1 km altitude and drifted N and E. Ashfall was observed in Severo-Kurilsk on 7 and 16 November. A thermal anomaly was visible during 1-4, 16, and 20 November. Explosions during 26 November rose as high as 2.7 km altitude and drifted NE (figure 45).
Explosions and ash plumes continued to occur in December. During 1-2 and 4 December volcanologists from Severo-Kurilsk observed explosions that sent ash to 1.9-2.5 km altitude and drifted NE and SE (figure 46). VONAs were issued on 5, 9, and 16 December reporting that explosions generated ash plumes rising to 1.9 km, 2.6 km, and 2.4 km altitude and drifted 5 km SE, E, and NE, respectively. A thermal anomaly was visible in satellite imagery on 16 December. On 18 and 27-28 December explosions produced ash plumes that rose to 2.5 km altitude and drifted NE and SE. On 31 December an ash plume rose to 2 km altitude and drifted NE.
Explosions continued during January 2023, based on visual observations by volcanologists from Severo-Kurilsk. During 1-7 January explosions generated ash plumes that rose to 4 km altitude and drifted NE, E, W, and SE. According to VONAs issued by KVERT on 2, 4, 10, and 23 January, explosions produced ash plumes that rose to 2-4 km altitude and drifted 5 km N, NE, E, and ENE; the ash plume that rose to 4 km altitude occurred on 10 January (figure 47). Satellite data showed a thermal anomaly during 3-4, 10, 13, 16, 21, 22, and 31 January. KVERT reported that an ash cloud on 4 January moved 12 km NE. On 6 and 9-11 January explosions sent ash plumes to 4.5 km altitude and drifted W and ESE. On 13 January an ash plume rose to 3 km altitude and drifted SE. During 20-24 January ash plumes from explosions rose to 3.7 km altitude and drifted SE, N, and NE. On 21 January the ash plume drifted as far as 40 km NE. During 28-29 and 31 January and 1 February ash plumes rose to 4 km altitude and drifted NE.
During February, explosions, ash plumes, and ashfall were reported. During 1, 4-5 and 7-8 February explosions generated ash plumes that rose to 4.5 km altitude and drifted E and NE; ashfall was observed on 5 and 8 February. On 6 February an explosion produced an ash plume that rose to 3 km altitude and drifted 7 km E, causing ashfall in Severo-Kurilsk. A thermal anomaly was visible in satellite data on 8, 9, 13, and 21 February. Explosions on 9 and 12-13 February produced ash plumes that rose to 4 km altitude and drifted E and NE; the ash cloud on 12 February extended as far as 45 km E. On 22 February explosions sent ash to 3 km altitude that drifted E. During 24 and 26-27 February ash plumes rose to 4 km altitude and drifted E. On 28 February an explosion sent ash to 2.5-3 km altitude and drifted 5 km E; ashfall was observed in Severo-Kurilsk.
Activity continued during March; visual observations showed that explosions generated ash plumes that rose to 3.6 km altitude on 3, 5-7, and 9-12 March and drifted E, NE, and NW. Thermal anomalies were visible on 10, 13, and 29-30 March in satellite imagery. On 18, 21-23, 26, and 29-30 March explosions produced ash plumes that rose to 2.8 km altitude and drifted NE and E; the ash plumes during 22-23 March extended up to 76 km E. A VONA issued on 21 March reported an explosion that produced an ash plume that rose to 2.8 km altitude and drifted 5 km E. Another VONA issued on 23 March reported that satellite data showed an ash plume rising to 3 km altitude and drifted 14 km E.
Explosions during April continued to generate ash plumes. On 1 and 4 April an ash plume rose to 2.8-3.5 km altitude and drifted SE and NE. A thermal anomaly was visible in satellite imagery during 1-6 April. Satellite data showed ash plumes and clouds rising to 2-3 km altitude and drifting up to 12 km SW and E on 3 and 6 April (figure 48). KVERT issued VONAs on 3, 5, 14, 16 April describing explosions that produced ash plumes rising to 3 km, 3.5 km, 3.5 km, and 3 km altitude and drifting 5 km S, 5 km NE and SE, 72 km NNE, and 5 km NE, respectively. According to satellite data, the resulting ash cloud from the explosion on 14 April was 25 x 7 km in size and drifted 72-104 km NNE during 14-15 April. According to visual data by volcanologists from Severo-Kurilsk explosions sent ash up to 3.5 km altitude that drifted NE and E during 15-16, 22, 25-26, and 29 April.
The explosive eruption continued during May. Explosions during 3-4, 6-7, and 9-10 May generated ash plumes that rose to 4 km altitude and drifted SW and E. Satellite data showed a thermal anomaly on 3, 9, 13-14, and 24 May. During 12-16, 23-25, and 27-28 May ash plumes rose to 3.5 km altitude and drifted in different directions due to explosions. Two VONA notices were issued on 16 and 25 May, describing explosions that generated ash plumes rising to 3 km and 3.5 km altitude, respectively and extending 5 km E. The ash cloud on 25 May drifted 75 km SE.
Thermal activity in the summit crater, occasionally accompanied by ash plumes and ash deposits on the SE and E flanks due to frequent explosions, were visible in infrared and true color satellite images (figure 49).
Geologic Background. The flat-topped summit of the central cone of Ebeko volcano, one of the most active in the Kuril Islands, occupies the northern end of Paramushir Island. Three summit craters located along a SSW-NNE line form Ebeko volcano proper, at the northern end of a complex of five volcanic cones. Blocky lava flows extend west from Ebeko and SE from the neighboring Nezametnyi cone. The eastern part of the southern crater contains strong solfataras and a large boiling spring. The central crater is filled by a lake about 20 m deep whose shores are lined with steaming solfataras; the northern crater lies across a narrow, low barrier from the central crater and contains a small, cold crescentic lake. Historical activity, recorded since the late-18th century, has been restricted to small-to-moderate explosive eruptions from the summit craters. Intense fumarolic activity occurs in the summit craters, on the outer flanks of the cone, and in lateral explosion craters.
Information Contacts: Kamchatka Volcanic Eruptions Response Team (KVERT), Far Eastern Branch, Russian Academy of Sciences, 9 Piip Blvd., Petropavlovsk-Kamchatsky, 683006, Russia (URL: http://www.kscnet.ru/ivs/kvert/); MIROVA (Middle InfraRed Observation of Volcanic Activity), a collaborative project between the Universities of Turin and Florence (Italy) supported by the Centre for Volcanic Risk of the Italian Civil Protection Department (URL: http://www.mirovaweb.it/); Copernicus Browser, Copernicus Data Space Ecosystem, European Space Agency (URL: https://dataspace.copernicus.eu/browser/).
Home Reef
Tonga
18.992°S, 174.775°W; summit elev. -10 m
All times are local (unless otherwise noted)
Discolored plumes continued during November 2022-April 2023
Home Reef is a submarine volcano located in the central Tonga islands between Lateiki (Metis Shoal) and Late Island. The first recorded eruption occurred in the mid-19th century, when an ephemeral island formed. An eruption in 1984 produced a 12-km-high eruption plume, a large volume of floating pumice, and an ephemeral island 500 x 1,500 m wide, with cliffs 30-50 m high that enclosed a water-filled crater. Another island-forming eruption in 2006 produced widespread pumice rafts that drifted as far as Australia; by 2008 the island had eroded below sea level. The previous eruption occurred during October 2022 and was characterized by a new island-forming eruption, lava effusion, ash plumes, discolored water, and gas-and-steam plumes (BGVN 47:11). This report covers discolored water plumes during November 2022 through April 2023 using satellite data.
Discolored plumes continued during the reporting period and were observed in true color satellite images on clear weather days. Satellite images show light green-yellow discolored water extending W on 8 and 28 November 2022 (figure 31), and SW on 18 November. Light green-yellow plumes extended W on 3 December, S on 13 December, SW on 18 December, and W and S on 23 December (figure 31). On 12 January 2023 discolored green-yellow plumes extended to the NE, E, SE, and N. The plume moved SE on 17 January and NW on 22 January. Faint discolored water in February was visible moving NE on 1 February. A discolored plume extended NW on 8 and 28 March and NW on 13 March (figure 31). During April, clear weather showed green-blue discolored plumes moving S on 2 April, W on 7 April, and NE and S on 12 April. A strong green-yellow discolored plume extended E and NE on 22 April for several kilometers (figure 31).
Geologic Background. Home Reef, a submarine volcano midway between Metis Shoal and Late Island in the central Tonga islands, was first reported active in the mid-19th century, when an ephemeral island formed. An eruption in 1984 produced a 12-km-high eruption plume, large amounts of floating pumice, and an ephemeral 500 x 1,500 m island, with cliffs 30-50 m high that enclosed a water-filled crater. In 2006 an island-forming eruption produced widespread dacitic pumice rafts that drifted as far as Australia. Another island was built during a September-October 2022 eruption.
Information Contacts: Copernicus Browser, Copernicus Data Space Ecosystem, European Space Agency (URL: https://dataspace.copernicus.eu/browser/).
Semisopochnoi (United States) — June 2023 Cite this Report
Semisopochnoi
United States
51.93°N, 179.58°E; summit elev. 1221 m
All times are local (unless otherwise noted)
Occasional explosions, ash deposits, and gas-and-steam plumes during December 2022-May 2023
Semisopochnoi is located in the western Aleutians, is 20-km-wide at sea level, and contains an 8-km-wide caldera. The three-peaked Mount Young (formerly Cerberus) was constructed within the caldera during the Holocene. Each of these peaks contains a summit crater; the lava flows on the N flank appear younger than those on the S side. The current eruption period began in early February 2021 and has more recently consisted of intermittent explosions and ash emissions (BGVN 47:12). This report updates activity during December 2022 through May 2023 using daily, weekly, and special reports from the Alaska Volcano Observatory (AVO). AVO monitors the volcano using local seismic and infrasound sensors, satellite data, web cameras, and remote infrasound and lightning networks.
Activity during most of December 2022 was relatively quiet; according to AVO no eruptive or explosive activity was observed since 7 November 2022. Intermittent tremor and occasional small earthquakes were observed in geophysical data. Continuous gas-and-steam emissions were observed from the N crater of Mount Young in webcam images on clear weather days (figure 25). On 24 December, there was a slight increase in earthquake activity and several small possible explosion signals were detected in infrasound data. Eruptive activity resumed on 27 December at the N crater of Mount Young; AVO issued a Volcano Activity Notice (VAN) that reported minor ash deposits on the flanks of Mount Young that extended as far as 1 km from the vent, according to webcam images taken during 27-28 December (figure 26). No ash plumes were observed in webcam or satellite imagery, but a persistent gas-and-steam plume that might have contained some ash rose to 1.5 km altitude. As a result, AVO raised the Aviation Color Code (ACC) to Orange (the second highest level on a four-color scale) and the Volcano Alert Level (VAL) to Watch (the second highest level on a four-level scale). Possible explosions were detected during 21 December 2022 through 1 January 2023 and seismic tremor was recorded during 30-31 December.
During January 2023 eruptive activity continued at the active N crater of Mount Young. Minor ash deposits were observed on the flanks, extending about 2 km SSW, based on webcam images from 1 and 3 January. A possible explosion occurred during 1-2 January based on elevated seismicity recorded on local seismometers and an infrasound signal recorded minutes later by an array at Adak. Though no ash plumes were observed in webcam or satellite imagery, a persistent gas-and-steam plume rose to 1.5 km altitude that might have carried minor traces of ash. Ash deposits were accompanied by periods of elevated seismicity and infrasound signals from the local geophysical network, which AVO reported were likely due to weak explosive activity. Low-level explosive activity was also detected during 2-3 January, with minor gas-and-steam emissions and a new ash deposit that was visible in webcam images. Low-level explosive activity was detected in geophysical data during 4-5 January, with elevated seismicity and infrasound signals observed on local stations. Volcanic tremor was detected during 7-9 January and very weak explosive activity was detected in seismic and infrasound data on 9 January. Weak seismic and infrasound signals were recorded on 17 January, which indicated minor explosive activity, but no ash emissions were observed in clear webcam images; a gas-and-steam plume continued to rise to 1.5 km altitude. During 29-30 January, ash deposits near the summit were observed on fresh snow, according to webcam images.
The active N cone at Mount Young continued to produce a gas-and-steam plume during February, but no ash emissions or explosive events were detected. Seismicity remained elevated with faint tremor during early February. Gas-and-steam emissions from the N crater were observed in clear webcam images on 11-13 and 16 February; no explosive activity was detected in seismic, infrasound, or satellite data. Seismicity has also decreased, with no significant seismic tremor observed since 25 January. Therefore, the ACC was lowered to Yellow (the second lowest level on a four-color scale) and the VAL was lowered to Advisory (the second lowest level on a four-color scale) on 22 February.
Gas-and-steam emissions persisted during March from the N cone of Mount Young, based on clear webcam images. A few brief episodes of weak tremor were detected in seismic data, although seismicity decreased over the month. A gas-and-steam plume detected in satellite data extended 150 km on 18 March. Low-level ash emissions from the N cone at Mount Young were observed in several webcam images during 18-19 March, in addition to small explosions and volcanic tremor. The ACC was raised to Orange and the VAL increased to Watch on 19 March. A small explosion was detected in seismic and infrasound data on 21 March.
Low-level unrest continued during April, although cloudy weather often obscured views of the summit; periods of seismic tremor and local earthquakes were recorded. During 3-4 April a gas-and-steam plume was visible traveling more than 200 km overnight; no ash was evident in the plume, according to AVO. A gas-and-steam plume was observed during 4-6 April that extended 400 km but did not seem to contain ash. Small explosions were detected in seismic and infrasound data on 5 April. Occasional clear webcam images showed continuing gas-and-steam emissions rose from Mount Young, but no ash deposits were observed on the snow. On 19 April small explosions and tremor were detected in seismic and infrasound data. A period of seismic tremor was detected during 22-25 April, with possible weak explosions on 25 April. Ash deposits were visible near the crater rim, but it was unclear if these deposits were recent or due to older deposits.
Occasional small earthquakes were recorded during May, but there were no signs of explosive activity seen in geophysical data. Gas-and-steam emissions continued from the N crater of Mount Young, based on webcam images, and seismicity remained slightly elevated. A new, light ash deposit was visible during the morning of 5 May on fresh snow on the NW flank of Mount Young. During 10 May periods of volcanic tremor were observed. The ACC was lowered to Yellow and the VAL to Advisory on 17 May due to no additional evidence of activity.
Geologic Background. Semisopochnoi, the largest subaerial volcano of the western Aleutians, is 20 km wide at sea level and contains an 8-km-wide caldera. It formed as a result of collapse of a low-angle, dominantly basaltic volcano following the eruption of a large volume of dacitic pumice. The high point of the island is Anvil Peak, a double-peaked late-Pleistocene cone that forms much of the island's northern part. The three-peaked Mount Cerberus (renamed Mount Young in 2023) was constructed within the caldera during the Holocene. Each of the peaks contains a summit crater; lava flows on the N flank appear younger than those on the south side. Other post-caldera volcanoes include the symmetrical Sugarloaf Peak SSE of the caldera and Lakeshore Cone, a small cinder cone at the edge of Fenner Lake in the NE part of the caldera. Most documented eruptions have originated from Young, although Coats (1950) considered that both Sugarloaf and Lakeshore Cone could have been recently active.
Information Contacts: Alaska Volcano Observatory (AVO), a cooperative program of a) U.S. Geological Survey, 4200 University Drive, Anchorage, AK 99508-4667 USA (URL: https://avo.alaska.edu/), b) Geophysical Institute, University of Alaska, PO Box 757320, Fairbanks, AK 99775-7320, USA, and c) Alaska Division of Geological & Geophysical Surveys, 794 University Ave., Suite 200, Fairbanks, AK 99709, USA (URL: http://dggs.alaska.gov/).
Ambae
Vanuatu
15.389°S, 167.835°E; summit elev. 1496 m
All times are local (unless otherwise noted)
New lava flow, ash plumes, and sulfur dioxide plumes during February-May 2023
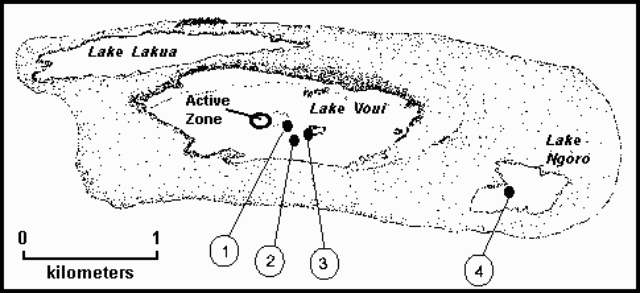
Ambae, also known as Aoba, is a large basaltic shield volcano in Vanuatu. A broad pyroclastic cone containing three crater lakes (Manaro Ngoru, Voui, and Manaro Lakua) is located at the summit within the youngest of at least two nested calderas. Periodic phreatic and pyroclastic explosions have been reported since the 16th century. A large eruption more than 400 years ago resulted in a volcanic cone within the summit crater that is now filled by Lake Voui; the similarly sized Lake Manaro fills the western third of the caldera. The previous eruption ended in August 2022 that was characterized by gas-and-steam and ash emissions and explosions of wet tephra (BGVN 47:10). This report covers a new eruption during February through May 2023 that consisted of a new lava flow, ash plumes, and sulfur dioxide emissions, using information from the Vanuatu Meteorology and Geo-Hazards Department (VMGD) and satellite data.
During the reporting period, the Alert Level remained at a 2 (on a scale of 0-5), which has been in place since December 2021. Activity during October 2022 through March 2023 remained relatively low and mostly consisted of gas-and-steam emissions in Lake Voui. VMGD reported that at 1300 on 15 November a satellite image captured a strong amount of sulfur dioxide rising above the volcano (figure 99), and that seismicity slightly increased. The southern and northern part of the island reported a strong sulfur dioxide smell and heard explosions. On 20 February 2023 a gas-and-ash plume rose 1.3 km above the summit and drifted SSW, according to a webcam image (figure 100). Gas-and-steam and possibly ash emissions continued on 23 February and volcanic earthquakes were recorded by the seismic network.
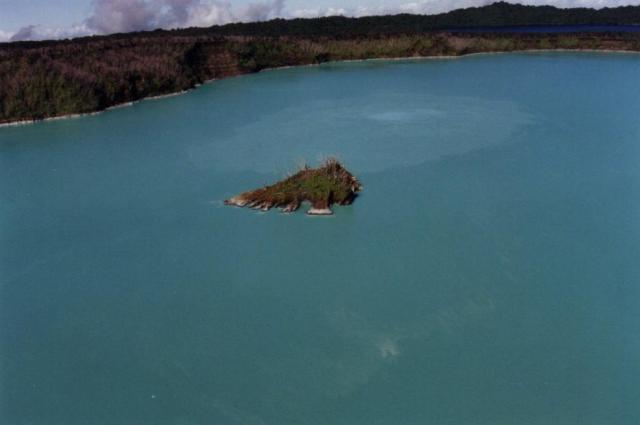
During April, volcanic earthquakes and gas-and-steam and ash emissions were reported from the cone in Lake Voui. VMGD reported that activity increased during 5-7 April; high gas-and-steam and ash plumes were visible, accompanied by nighttime incandescence. According to a Wellington VAAC report, a low-level ash plume rose as high as 2.5 km above the summit and drifted W and SW on 5 April, based on satellite imagery. Reports in Saratamata stated that a dark ash plume drifted to the WSW, but no loud explosion was heard. Webcam images from 2100 showed incandescence above the crater and reflected in the clouds. According to an aerial survey, field observations, and satellite data, water was no longer present in the lake. A lava flow was reported effusing from the vent and traveling N into the dry Lake Voui, which lasted three days. The next morning at 0745 on 6 April a gas-and-steam and ash plume rose 5.4 km above the summit and drifted ESE, based on information from VMGD (figure 101). The Wellington VAAC also reported that light ashfall was observed on the island. Intermittent gas-and-steam and ash emissions were visible on 7 April, some of which rose to an estimated 3 km above the summit and drifted E. Webcam images during 0107-0730 on 7 April showed continuing ash emissions. A gas-and-steam and ash plume rose 695 m above the summit crater at 0730 on 19 April and drifted ESE, based on a webcam image (figure 102).
According to visual and infrared satellite data, water was visible in Lake Voui as late as 24 March 2023 (figure 103). The vent in the caldera showed a gas-and-steam plume drifted SE. On 3 April thermal activity was first detected, accompanied by a gas-and-ash plume that drifted W (figure 103). The lava flow moved N within the dry lake and was shown cooling by 8 April. By 23 April much of the water in the lake had returned. Occasional sulfur dioxide plumes were detected by the TROPOMI instrument on the Sentinel-5P satellite that exceeded 2 Dobson Units (DU) and drifted in different directions (figure 104).
Geologic Background. The island of Ambae, also known as Aoba, is a massive 2,500 km3 basaltic shield that is the most voluminous volcano of the New Hebrides archipelago. A pronounced NE-SW-trending rift zone with numerous scoria cones gives the 16 x 38 km island an elongated form. A broad pyroclastic cone containing three crater lakes (Manaro Ngoru, Voui, and Manaro Lakua) is located at the summit within the youngest of at least two nested calderas, the largest of which is 6 km in diameter. That large central edifice is also called Manaro Voui or Lombenben volcano. Post-caldera explosive eruptions formed the summit craters about 360 years ago. A tuff cone was constructed within Lake Voui (or Vui) about 60 years later. The latest known flank eruption, about 300 years ago, destroyed the population of the Nduindui area near the western coast.
Information Contacts: Geo-Hazards Division, Vanuatu Meteorology and Geo-Hazards Department (VMGD), Ministry of Climate Change Adaptation, Meteorology, Geo-Hazards, Energy, Environment and Disaster Management, Private Mail Bag 9054, Lini Highway, Port Vila, Vanuatu (URL: http://www.vmgd.gov.vu/, https://www.facebook.com/VanuatuGeohazardsObservatory/); Wellington Volcanic Ash Advisory Centre (VAAC), Meteorological Service of New Zealand Ltd (MetService), PO Box 722, Wellington, New Zealand (URL: http://www.metservice.com/vaac/, http://www.ssd.noaa.gov/VAAC/OTH/NZ/messages.html); MIROVA (Middle InfraRed Observation of Volcanic Activity), a collaborative project between the Universities of Turin and Florence (Italy) supported by the Centre for Volcanic Risk of the Italian Civil Protection Department (URL: http://www.mirovaweb.it/); Global Sulfur Dioxide Monitoring Page, Atmospheric Chemistry and Dynamics Laboratory, NASA Goddard Space Flight Center (NASA/GSFC), 8800 Greenbelt Road, Goddard, Maryland, USA (URL: https://so2.gsfc.nasa.gov/); Copernicus Browser, Copernicus Data Space Ecosystem, European Space Agency (URL: https://dataspace.copernicus.eu/browser/).
Ibu
Indonesia
1.488°N, 127.63°E; summit elev. 1325 m
All times are local (unless otherwise noted)
Daily ash explosions continue, along with thermal anomalies in the crater, October 2022-May 2023
Persistent eruptive activity since April 2008 at Ibu, a stratovolcano on Indonesian’s Halmahera Island, has consisted of daily explosive ash emissions and plumes, along with observations of thermal anomalies (BGVN 47:04). The current eruption continued during October 2022-May 2023, described below, based on advisories issued by the Pusat Vulkanologi dan Mitigasi Bencana Geologi (PVMBG, also known as Indonesian Center for Volcanology and Geological Hazard Mitigation, CVGHM), daily reports by MAGMA Indonesia (a PVMBG platform), and the Darwin Volcanic Ash Advisory Centre (VAAC), and various satellite data. The Alert Level during the reporting period remained at 2 (on a scale of 1-4), except raised briefly to 3 on 27 May, and the public was warned to stay at least 2 km away from the active crater and 3.5 km away on the N side of the volcano.
According to MAGMA Indonesia, during October 2022-May 2023, daily gray-and-white ash plumes of variable densities rose 200-1,000 m above the summit and drifted in multiple directions. On 30 October and 11 November, plumes rose a maximum of 2 km and 1.5 km above the summit, respectively (figures 42 and 43). According to the Darwin VAAC, discrete ash emissions on 13 November rose to 2.1 km altitude, or 800 m above the summit, and drifted W, and multiple ash emissions on 15 November rose 1.4 km above the summit and drifted NE. Occasional larger ash explosions through May 2023 prompted PVMBG to issue Volcano Observatory Notice for Aviation (VONA) alerts (table 6); the Aviation Color Code remained at Orange throughout this period.
Table 6. Volcano Observatory Notice for Aviation (VONA) ash plume alerts for Ibu issued by PVMBG during October 2022-May 2023. Maximum height above the summit was estimated by a ground observer. VONAs in January-May 2023 all described the ash plumes as dense.
| Date |
Time (local) |
Max height above summit |
Direction |
| 17 Oct 2022 |
0858 |
800 m |
SW |
| 18 Oct 2022 |
1425 |
800 m |
S |
| 19 Oct 2022 |
2017 |
600 m |
SW |
| 21 Oct 2022 |
0916 |
800 m |
NW |
| 16 Jan 2023 |
1959 |
600 m |
NE |
| 22 Jan 2023 |
0942 |
1,000 m |
E |
| 29 Jan 2023 |
2138 |
1,000 m |
E |
| 10 May 2023 |
0940 |
800 m |
NW |
| 10 May 2023 |
2035 |
600 m |
E |
| 21 May 2023 |
2021 |
600 m |
W |
| 21 May 2023 |
2140 |
1,000 m |
W |
| 29 May 2023 |
1342 |
800 m |
N |
| 31 May 2023 |
1011 |
1,000 m |
SW |
Sentinel-2 L1C satellite images throughout the reporting period show two, sometimes three persistent thermal anomalies in the summit crater, with the most prominent hotspot from the top of a cone within the crater. Clear views were more common during March-April 2023, when a vent and lava flows on the NE flank of the intra-crater cone could be distinguished (figure 44). White-to-grayish emissions were also observed during brief periods when weather clouds allowed clear views.
The MIROVA space-based volcano hotspot detection system recorded almost daily thermal anomalies throughout the reporting period, though cloud cover often interfered with detections. Data from imaging spectroradiometers aboard NASA’s Aqua and Terra satellites and processed using the MODVOLC algorithm (MODIS-MODVOLC) recorded hotspots on one day during October 2022 and December 2022, two days in April 2023, three days in November 2022 and May 2023, and four days in March 2023.
Geologic Background. The truncated summit of Gunung Ibu stratovolcano along the NW coast of Halmahera Island has large nested summit craters. The inner crater, 1 km wide and 400 m deep, has contained several small crater lakes. The 1.2-km-wide outer crater is breached on the N, creating a steep-walled valley. A large cone grew ENE of the summit, and a smaller one to the WSW has fed a lava flow down the W flank. A group of maars is located below the N and W flanks. The first observed and recorded eruption was a small explosion from the summit crater in 1911. Eruptive activity began again in December 1998, producing a lava dome that eventually covered much of the floor of the inner summit crater along with ongoing explosive ash emissions.
Information Contacts: Pusat Vulkanologi dan Mitigasi Bencana Geologi (PVMBG, also known as Indonesian Center for Volcanology and Geological Hazard Mitigation, CVGHM), Jalan Diponegoro 57, Bandung 40122, Indonesia (URL: http://www.vsi.esdm.go.id/); MAGMA Indonesia (Multiplatform Application for Geohazard Mitigation and Assessment in Indonesia), Kementerian Energi dan Sumber Daya Mineral (URL: https://magma.esdm.go.id/v1); Copernicus Browser, Copernicus Data Space Ecosystem, European Space Agency (URL: https://dataspace.copernicus.eu/browser/); MIROVA (Middle InfraRed Observation of Volcanic Activity), a collaborative project between the Universities of Turin and Florence (Italy) supported by the Centre for Volcanic Risk of the Italian Civil Protection Department (URL: http://www.mirovaweb.it/); Hawai'i Institute of Geophysics and Planetology (HIGP) - MODVOLC Thermal Alerts System, School of Ocean and Earth Science and Technology (SOEST), Univ. of Hawai'i, 2525 Correa Road, Honolulu, HI 96822, USA (URL: http://modis.higp.hawaii.edu/).
Dukono
Indonesia
1.6992°N, 127.8783°E; summit elev. 1273 m
All times are local (unless otherwise noted)
Continuing ash emissions, SO2 plumes, and thermal signals during October 2022-May 2023
Dukono, a remote volcano on Indonesia’s Halmahera Island, has been erupting continuously since 1933, with frequent ash explosions and sulfur dioxide plumes (BGVN 46:11, 47:10). This activity continued during October 2022 through May 2023, based on reports from the Pusat Vulkanologi dan Mitigasi Bencana Geologi (PVMBG; also known as Indonesian Center for Volcanology and Geological Hazard Mitigation, CVGHM), the Darwin Volcanic Ash Advisory Centre (VAAC), and satellite data. During this period, the Alert Level remained at 2 (on a scale of 1-4) and the public was warned to remain outside of the 2-km exclusion zone. The highest reported plume of the period reached 9.4 km above the summit on 14 November 2022.
According to MAGMA Indonesia (a platform developed by PVMBG), white, gray, or dark plumes of variable densities were observed almost every day during the reporting period, except when fog obscured the volcano (figure 33). Plumes generally rose 25-450 m above the summit, but rose as high as 700-800 m on several days, somewhat lower than the maximum heights reached earlier in 2022 when plumes reached as high as 1 km. However, the Darwin VAAC reported that on 14 November 2022, a discrete ash plume rose 9.4 km above the summit (10.7 km altitude), accompanied by a strong hotspot and a sulfur dioxide signal observed in satellite imagery; a continuous ash plume that day and through the 15th rose to 2.1-2.4 km altitude and drifted NE.
Sentinel-2 images were obscured by weather clouds almost every viewing day during the reporting period. However, the few reasonably clear images showed a hotspot and white or gray emissions and plumes. Strong SO2 plumes from Dukono were present on many days during October 2022-May 2023, as detected using the TROPOMI instrument on the Sentinel-5P satellite (figure 34).
Geologic Background. Reports from this remote volcano in northernmost Halmahera are rare, but Dukono has been one of Indonesia's most active volcanoes. More-or-less continuous explosive eruptions, sometimes accompanied by lava flows, have occurred since 1933. During a major eruption in 1550 CE, a lava flow filled in the strait between Halmahera and the N-flank Gunung Mamuya cone. This complex volcano presents a broad, low profile with multiple summit peaks and overlapping craters. Malupang Wariang, 1 km SW of the summit crater complex, contains a 700 x 570 m crater that has also been active during historical time.
Information Contacts: Pusat Vulkanologi dan Mitigasi Bencana Geologi (PVMBG, also known as Indonesian Center for Volcanology and Geological Hazard Mitigation, CVGHM), Jalan Diponegoro 57, Bandung 40122, Indonesia (URL: http://www.vsi.esdm.go.id/); MAGMA Indonesia (Multiplatform Application for Geohazard Mitigation and Assessment in Indonesia), Kementerian Energi dan Sumber Daya Mineral (URL: https://magma.esdm.go.id/v1); Darwin Volcanic Ash Advisory Centre (VAAC), Bureau of Meteorology, Northern Territory Regional Office, PO Box 40050, Casuarina, NT 0811, Australia (URL: http://www.bom.gov.au/info/vaac/); NASA Global Sulfur Dioxide Monitoring Page, Atmospheric Chemistry and Dynamics Laboratory, NASA Goddard Space Flight Center (NASA/GSFC), 8800 Greenbelt Road, Goddard, Maryland, USA (URL: https://so2.gsfc.nasa.gov/); Sentinel Hub Playground (URL: https://www.sentinel-hub.com/explore/sentinel-playground).
Sabancaya
Peru
15.787°S, 71.857°W; summit elev. 5960 m
All times are local (unless otherwise noted)
Explosions, gas-and-ash plumes, and thermal activity persist during November 2022-April 2023
Sabancaya is located in Peru, NE of Ampato and SE of Hualca Hualca. Eruptions date back to 1750 and have been characterized by explosions, phreatic activity, ash plumes, and ashfall. The current eruption period began in November 2016 and has more recently consisted of daily explosions, gas-and-ash plumes, and thermal activity (BGVN 47:11). This report updates activity during November 2022 through April 2023 using information from Instituto Geophysico del Peru (IGP) that use weekly activity reports and various satellite data.
Intermittent low-to-moderate power thermal anomalies were reported by the MIROVA project during November 2022 through April 2023 (figure 119). There were few short gaps in thermal activity during mid-December 2022, late December-to-early January 2023, late January to mid-February, and late February. According to data recorded by the MODVOLC thermal algorithm, there were a total of eight thermal hotspots: three in November 2022, three in February 2023, one in March, and one in April. On clear weather days, some of this thermal anomaly was visible in infrared satellite imagery showing the active lava dome in the summit crater (figure 120). Almost daily moderate-to-strong sulfur dioxide plumes were recorded during the reporting period by the TROPOMI instrument on the Sentinel-5P satellite (figure 121). Many of these plumes exceeded 2 Dobson Units (DU) and drifted in multiple directions.
IGP reported that moderate activity during November and December 2022 continued; during November, an average number of explosions were reported each week: 30, 33, 36, and 35, and during December, it was 32, 40, 47, 52, and 67. Gas-and-ash plumes in November rose 3-3.5 km above the summit and drifted E, NE, SE, S, N, W, and SW. During December the gas-and-ash plumes rose 2-4 km above the summit and drifted in different directions. There were 1,259 volcanic earthquakes recorded during November and 1,693 during December. Seismicity also included volcano-tectonic-type events that indicate rock fracturing events. Slight inflation was observed in the N part of the volcano near Hualca Hualca (4 km N). Thermal activity was frequently reported in the crater at the active lava dome (figure 120).
Explosive activity continued during January and February 2023. The average number of explosions were reported each week during January (51, 50, 60, and 59) and February (43, 54, 51, and 50). Gas-and-ash plumes rose 1.6-2.9 km above the summit and drifted NW, SW, and W during January and rose 1.4-2.8 above the summit and drifted W, SW, E, SE, N, S, NW, and NE during February. IGP also detected 1,881 volcanic earthquakes during January and 1,661 during February. VT-type earthquakes were also reported. Minor inflation persisted near Hualca Hualca. Satellite imagery showed continuous thermal activity in the crater at the lava dome (figure 120).
During March, the average number of explosions each week was 46, 48, 31, 35, and 22 and during April, it was 29, 41, 31, and 27. Accompanying gas-and-ash plumes rose 1.7-2.6 km above the summit crater and drifted W, SW, NW, S, and SE during March. According to a Buenos Aires Volcano Ash Advisory Center (VAAC) notice, on 22 March at 1800 through 23 March an ash plume rose to 7 km altitude and drifted NW. By 0430 an ash plume rose to 7.6 km altitude and drifted W. On 24 and 26 March continuous ash emissions rose to 7.3 km altitude and drifted SW and on 28 March ash emissions rose to 7.6 km altitude. During April, gas-and-ash plumes rose 1.6-2.5 km above the summit and drifted W, SW, S, NW, NE, and E. Frequent volcanic earthquakes were recorded, with 1,828 in March and 1,077 in April, in addition to VT-type events. Thermal activity continued to be reported in the summit crater at the lava dome (figure 120).
Geologic Background. Sabancaya, located in the saddle NE of Ampato and SE of Hualca Hualca volcanoes, is the youngest of these volcanic centers and the only one to have erupted in historical time. The oldest of the three, Nevado Hualca Hualca, is of probable late-Pliocene to early Pleistocene age. The name Sabancaya (meaning "tongue of fire" in the Quechua language) first appeared in records in 1595 CE, suggesting activity prior to that date. Holocene activity has consisted of Plinian eruptions followed by emission of voluminous andesitic and dacitic lava flows, which form an extensive apron around the volcano on all sides but the south. Records of historical eruptions date back to 1750.
Information Contacts: Instituto Geofisico del Peru (IGP), Centro Vulcanológico Nacional (CENVUL), Calle Badajoz N° 169 Urb. Mayorazgo IV Etapa, Ate, Lima 15012, Perú (URL: https://www.igp.gob.pe/servicios/centro-vulcanologico-nacional/inicio); Buenos Aires Volcanic Ash Advisory Center (VAAC), Servicio Meteorológico Nacional-Fuerza Aérea Argentina, 25 de mayo 658, Buenos Aires, Argentina (URL: http://www.smn.gov.ar/vaac/buenosaires/inicio.php); MIROVA (Middle InfraRed Observation of Volcanic Activity), a collaborative project between the Universities of Turin and Florence (Italy) supported by the Centre for Volcanic Risk of the Italian Civil Protection Department (URL: http://www.mirovaweb.it/); Hawai'i Institute of Geophysics and Planetology (HIGP) - MODVOLC Thermal Alerts System, School of Ocean and Earth Science and Technology (SOEST), Univ. of Hawai'i, 2525 Correa Road, Honolulu, HI 96822, USA (URL: http://modis.higp.hawaii.edu/); NASA Global Sulfur Dioxide Monitoring Page, Atmospheric Chemistry and Dynamics Laboratory, NASA Goddard Space Flight Center (NASA/GSFC), 8800 Greenbelt Road, Goddard MD 20771, USA (URL: https://so2.gsfc.nasa.gov/); Copernicus Browser, Copernicus Data Space Ecosystem, European Space Agency (URL: https://dataspace.copernicus.eu/browser/).
Sheveluch
Russia
56.653°N, 161.36°E; summit elev. 3283 m
All times are local (unless otherwise noted)
Significant explosions destroyed part of the lava-dome complex during April 2023
Sheveluch (also spelled Shiveluch) in Kamchatka, has had at least 60 large eruptions during the last 10,000 years. The summit is truncated by a broad 9-km-wide caldera that is breached to the S, and many lava domes occur on the outer flanks. The lava dome complex was constructed within the large open caldera. Frequent collapses of the dome complex have produced debris avalanches; the resulting deposits cover much of the caldera floor. A major south-flank collapse during a 1964 Plinian explosion produced a scarp in which a “Young Sheveluch” dome began to form in 1980. Repeated episodes of dome formation and destruction since then have produced major and minor ash plumes, pyroclastic flows, block-and-ash flows, and “whaleback domes” of spine-like extrusions in 1993 and 2020 (BGVN 45:11). The current eruption period began in August 1999 and has more recently consisted of lava dome growth, explosions, ash plumes, and avalanches (BGVN 48:01). This report covers a significant explosive eruption during early-to-mid-April 2023 that generated a 20 km altitude ash plume, produced a strong sulfur dioxide plume, and destroyed part of the lava-dome complex; activity described during January through April 2023 use information primarily from the Kamchatka Volcanic Eruptions Response Team (KVERT) and various satellite data.
Satellite data. Activity during the majority of this reporting period was characterized by continued lava dome growth, strong fumarole activity, explosions, and hot avalanches. According to the MODVOLC Thermal Alerts System, 140 hotspots were detected through the reporting period, with 33 recorded in January 2023, 29 in February, 44 in March, and 34 in April. Frequent strong thermal activity was recorded during January 2023 through April, according to the MIROVA (Middle InfraRed Observation of Volcanic Activity) graph and resulted from the continuously growing lava dome (figure 94). A slightly stronger pulse in thermal activity was detected in early-to-mid-April, which represented the significant eruption that destroyed part of the lava-dome complex. Thermal anomalies were also visible in infrared satellite imagery at the summit crater (figure 95).
During January 2023 KVERT reported continued growth of the lava dome, accompanied by strong fumarolic activity, incandescence from the lava dome, explosions, ash plumes, and avalanches. Satellite data showed a daily thermal anomaly over the volcano. Video data showed ash plumes associated with collapses at the dome that generated avalanches that in turn produced ash plumes rising to 3.5 km altitude and drifting 40 km W on 4 January and rising to 7-7.5 km altitude and drifting 15 km SW on 5 January. A gas-and-steam plume containing some ash that was associated with avalanches rose to 5-6 km altitude and extended 52-92 km W on 7 January. Explosions that same day produced ash plumes that rose to 7-7.5 km altitude and drifted 10 km W. According to a Volcano Observatory Notice for Aviation (VONA) issued at 1344 on 19 January, explosions produced an ash cloud that was 15 x 25 km in size and rose to 9.6-10 km altitude, drifting 21-25 km W; as a result, the Aviation Color Code (ACC) was raised to Red (the highest level on a four-color scale). Another VONA issued at 1635 reported that no more ash plumes were observed, and the ACC was lowered to Orange (the second highest level on a four-color scale). On 22 January an ash plume from collapses and avalanches rose to 5 km altitude and drifted 25 km NE and SW; ash plumes associated with collapses extended 70 km NE on 27 and 31 January.
Lava dome growth, fumarolic activity, dome incandescence, and occasional explosions and avalanches continued during February and March. A daily thermal anomaly was visible in satellite data. Explosions on 1 February generated ash plumes that rose to 6.3-6.5 km altitude and extended 15 km NE. Video data showed an ash cloud from avalanches rising to 5.5 km altitude and drifting 5 km SE on 2 February. Satellite data showed gas-and-steam plumes containing some ash rose to 5-5.5 km altitude and drifted 68-110 km ENE and NE on 6 February, to 4.5-5 km altitude and drifted 35 km WNW on 22 February, and to 3.7-4 km altitude and drifted 47 km NE on 28 February. Scientists from the Kamchatka Volcanological Station (KVS) went on a field excursion on 25 February to document the growing lava dome, and although it was cloudy most of the day, nighttime incandescence was visible. Satellite data showed an ash plume extending up to 118 km E during 4-5 March. Video data from 1150 showed an ash cloud from avalanches rose to 3.7-5.5 km altitude and drifted 5-10 km ENE and E on 5 March. On 11 March an ash plume drifted 62 km E. On 27 March ash plumes rose to 3.5 km altitude and drifted 100 km E. Avalanches and constant incandescence at the lava dome was focused on the E and NE slopes on 28 March. A gas-and-steam plume containing some ash rose to 3.5 km altitude and moved 40 km E on 29 March. Ash plumes on 30 March rose to 3.5-3.7 km altitude and drifted 70 km NE.
Similar activity continued during April, with lava dome growth, strong fumarolic activity, incandescence in the dome, occasional explosions, and avalanches. A thermal anomaly persisted throughout the month. During 1-4 April weak ash plumes rose to 2.5-3 km altitude and extended 13-65 km SE and E.
Activity during 11 April 2023. The Institute of Volcanology and Seismology, Far Eastern Branch, Russian Academy of Sciences (IVS FEB RAS) reported a significant increase in seismicity around 0054 on 11 April, as reported by strong explosions detected on 11 April beginning at 0110 that sent ash plumes up to 7-10 km altitude and extended 100-435 km W, WNW, NNW, WSW, and SW. According to a Tokyo VAAC report the ash plume rose to 15.8 km altitude. By 0158 the plume extended over a 75 x 100 km area. According to an IVS FEB RAS report, the eruptive column was not vertical: the initial plume at 0120 on 11 April deviated to the NNE, at 0000 on 12 April, it drifted NW, and by 1900 it drifted SW. KVS reported that significant pulses of activity occurred at around 0200, 0320, and then a stronger phase around 0600. Levin Dmitry took a video from near Békés (3 km away) at around 0600 showing a rising plume; he also reported that a pyroclastic flow traveled across the road behind him as he left the area. According to IVS FEB RAS, the pyroclastic flow traveled several kilometers SSE, stopping a few hundred meters from a bridge on the road between Klyuchi and Petropavlovsk-Kamchatsky.
Ashfall was first observed in Klyuchi (45 km SW) at 0630, and a large, black ash plume blocked light by 0700. At 0729 KVERT issued a Volcano Observatory Notice for Aviation (VONA) raising the Aviation Color Code to Red (the highest level on a four-color scale). It also stated that a large ash plume had risen to 10 km altitude and drifted 100 km W. Near-constant lightning strikes were reported in the plume and sounds like thunderclaps were heard until about 1000. According to IVS FEB RAS the cloud was 200 km long and 76 km wide by 0830, and was spreading W at altitudes of 6-12 km. In the Klyuchi Village, the layer of both ash and snow reached 8.5 cm (figure 96); ashfall was also reported in Kozyrevsk (112 km SW) at 0930, Mayskoye, Anavgay, Atlasovo, Lazo, and Esso. Residents in Klyuchi reported continued darkness and ashfall at 1100. In some areas, ashfall was 6 cm deep and some residents reported dirty water coming from their plumbing. According to IVS FEB RAS, an ash cloud at 1150 rose to 5-20 km altitude and was 400 km long and 250 km wide, extending W. A VONA issued at 1155 reported that ash had risen to 10 km and drifted 340 km NNW and 240 km WSW. According to Simon Carn (Michigan Technological University), about 0.2 Tg of sulfur dioxide in the plume was measured in a satellite image from the TROPOMI instrument on the Sentinel-5P satellite acquired at 1343 that covered an area of about 189,000 km2 (figure 97). Satellite data at 1748 showed an ash plume that rose to 8 km altitude and drifted 430 km WSW and S, according to a VONA.
Activity during 12-15 April 2023. On 12 April at 0730 satellite images showed ash plumes rose to 7-8 km altitude and extended 600 km SW, 1,050 km ESE, and 1,300-3,000 km E. By 1710 that day, the explosions weakened. According to news sources, the ash-and-gas plumes drifted E toward the Aleutian Islands and reached the Gulf of Alaska by 13 April, causing flight disruptions. More than 100 flights involving Alaska airspace were cancelled due to the plume. Satellite data showed ash plumes rising to 4-5.5 km altitude and drifted 400-415 km SE and ESE on 13 April. KVS volcanologists observed the pyroclastic flow deposits and noted that steam rose from downed, smoldering trees. They also noted that the deposits were thin with very few large fragments, which differed from previous flows. The ash clouds traveled across the Pacific Ocean. Flight cancellations were also reported in NW Canada (British Columbia) during 13-14 April. During 14-15 April ash plumes rose to 6 km altitude and drifted 700 km NW.
Alaskan flight schedules were mostly back to normal by 15 April, with only minor delays and far less cancellations; a few cancellations continued to be reported in Canada. Clear weather on 15 April showed that most of the previous lava-dome complex was gone and a new crater roughly 1 km in diameter was observed (figure 98); gas-and-steam emissions were rising from this crater. Evidence suggested that there had been a directed blast to the SE, and pyroclastic flows traveled more than 20 km. An ash plume rose to 4.5-5.2 km altitude and drifted 93-870 km NW on 15 April.
Activity during 16-30 April 2023. Resuspended ash was lifted by the wind from the slopes and rose to 4 km altitude and drifted 224 km NW on 17 April. KVERT reported a plume of resuspended ash from the activity during 10-13 April on 19 April that rose to 3.5-4 km altitude and drifted 146-204 km WNW. During 21-22 April a plume stretched over the Scandinavian Peninsula. A gas-and-steam plume containing some ash rose to 3-3.5 km altitude and drifted 60 km SE on 30 April. A possible new lava dome was visible on the W slope of the volcano on 29-30 April (figure 99); satellite data showed two thermal anomalies, a bright one over the existing lava dome and a weaker one over the possible new one.
References. Girina, O., Loupian, E., Horvath, A., Melnikov, D., Manevich, A., Nuzhdaev, A., Bril, A., Ozerov, A., Kramareva, L., Sorokin, A., 2023, Analysis of the development of the paroxysmal eruption of Sheveluch volcano on April 10–13, 2023, based on data from various satellite systems, ??????????? ???????? ??? ?? ???????, 20(2).
Geologic Background. The high, isolated massif of Sheveluch volcano (also spelled Shiveluch) rises above the lowlands NNE of the Kliuchevskaya volcano group. The 1,300 km3 andesitic volcano is one of Kamchatka's largest and most active volcanic structures, with at least 60 large eruptions during the Holocene. The summit of roughly 65,000-year-old Stary Shiveluch is truncated by a broad 9-km-wide late-Pleistocene caldera breached to the south. Many lava domes occur on its outer flanks. The Molodoy Shiveluch lava dome complex was constructed during the Holocene within the large open caldera; Holocene lava dome extrusion also took place on the flanks of Stary Shiveluch. Widespread tephra layers from these eruptions have provided valuable time markers for dating volcanic events in Kamchatka. Frequent collapses of dome complexes, most recently in 1964, have produced debris avalanches whose deposits cover much of the floor of the breached caldera.
Information Contacts: Kamchatka Volcanic Eruptions Response Team (KVERT), Far Eastern Branch, Russian Academy of Sciences, 9 Piip Blvd., Petropavlovsk-Kamchatsky, 683006, Russia (URL: http://www.kscnet.ru/ivs/kvert/); Institute of Volcanology and Seismology, Far Eastern Branch, Russian Academy of Sciences (IVS FEB RAS), 9 Piip Blvd., Petropavlovsk-Kamchatsky 683006, Russia (URL: http://www.kscnet.ru/ivs/eng/); Kamchatka Volcanological Station, Kamchatka Branch of Geophysical Survey, (KB GS RAS), Klyuchi, Kamchatka Krai, Russia (URL: http://volkstat.ru/); Hawai'i Institute of Geophysics and Planetology (HIGP) - MODVOLC Thermal Alerts System, School of Ocean and Earth Science and Technology (SOEST), Univ. of Hawai'i, 2525 Correa Road, Honolulu, HI 96822, USA (URL: http://modis.higp.hawaii.edu/); MIROVA (Middle InfraRed Observation of Volcanic Activity), a collaborative project between the Universities of Turin and Florence (Italy) supported by the Centre for Volcanic Risk of the Italian Civil Protection Department (URL: http://www.mirovaweb.it/); Copernicus Browser, Copernicus Data Space Ecosystem, European Space Agency (URL: https://dataspace.copernicus.eu/browser/); Kam 24 News Agency, 683032, Kamchatka Territory, Petropavlovsk-Kamchatsky, Vysotnaya St., 2A (URL: https://kam24.ru/news/main/20230411/96657.html#.Cj5Jrky6.dpuf); Simon Carn, Geological and Mining Engineering and Sciences, Michigan Technological University, 1400 Townsend Drive, Houghton, MI 49931, USA (URL: http://www.volcarno.com/, Twitter: @simoncarn).
Bezymianny
Russia
55.972°N, 160.595°E; summit elev. 2882 m
All times are local (unless otherwise noted)
Explosions, ash plumes, lava flows, and avalanches during November 2022-April 2023
Bezymianny is located on the Kamchatka Peninsula of Russia as part of the Klyuchevskoy volcano group. Historic eruptions began in 1955 and have been characterized by dome growth, explosions, pyroclastic flows, ash plumes, and ashfall. During the 1955-56 eruption a large open crater was formed by collapse of the summit and an associated lateral blast. Subsequent episodic but ongoing lava-dome growth, accompanied by intermittent explosive activity and pyroclastic flows, has largely filled the 1956 crater. The current eruption period began in December 2016 and more recent activity has consisted of strong explosions, ash plumes, and thermal activity (BGVN 47:11). This report covers activity during November 2022 through April 2023, based on weekly and daily reports from the Kamchatka Volcano Eruptions Response Team (KVERT) and satellite data.
Activity during November and March 2023 was relatively low and mostly consisted of gas-and-steam emissions, occasional small collapses that generated avalanches along the lava dome slopes, and a persistent thermal anomaly over the volcano that was observed in satellite data on clear weather days. According to the Tokyo VAAC and KVERT, an explosion produced an ash plume that rose to 6 km altitude and drifted 25 km NE at 1825 on 29 March.
Gas-and-steam emissions, collapses generating avalanches, and thermal activity continued during April. According to two Volcano Observatory Notice for Aviation (VONA) issued on 2 and 6 April (local time) ash plumes rose to 3 km and 3.5-3.8 km altitude and drifted 35 km E and 140 km E, respectively. Satellite data from KVERT showed weak ash plumes extending up to 550 km E on 2 and 5-6 April.
A VONA issued at 0843 on 7 April described an ash plume that rose to 4.5-5 km altitude and drifted 250 km ESE. Later that day at 1326 satellite data showed an ash plume that rose to 5.5-6 km altitude and drifted 150 km ESE. A satellite image from 1600 showed an ash plume extending as far as 230 km ESE; KVERT noted that ash emissions were intensifying, likely due to avalanches from the growing lava dome. The Aviation Color Code (ACC) was raised to Red (the highest level on a four-color scale). At 1520 satellite data showed an ash plume rising to 5-5.5 km altitude and drifting 230 km ESE. That same day, Kamchatka Volcanological Station (KVS) volcanologists traveled to Ambon to collect ash; they reported that a notable eruption began at 1730, and within 20 minutes a large ash plume rose to 10 km altitude and drifted NW. KVERT reported that the strong explosive phase began at 1738. Video and satellite data taken at 1738 showed an ash plume that rose to 10-12 km altitude and drifted up to 2,800 km SE and E. Explosions were clearly audible 20 km away for 90 minutes, according to KVS. Significant amounts of ash fell at the Apakhonchich station, which turned the snow gray; ash continued to fall until the morning of 8 April. In a VONA issued at 0906 on 8 April, KVERT stated that the explosive eruption had ended; ash plumes had drifted 2,000 km E. The ACC was lowered to Orange (the third highest level on a four-color scale). The KVS team saw a lava flow on the active dome once the conditions were clear that same day (figure 53). On 20 April lava dome extrusion was reported; lava flows were noted on the flanks of the dome, and according to KVERT satellite data, a thermal anomaly was observed in the area. The ACC was lowered to Yellow (the second lowest on a four-color scale).
Satellite data showed an increase in thermal activity beginning in early April 2023. A total of 31 thermal hotspots were detected by the MODVOLC thermal algorithm on 4, 5, 7, and 12 April 2023. The elevated thermal activity resulted from an increase in explosive activity and the start of an active lava flow. The MIROVA (Middle InfraRed Observation of Volcanic Activity) volcano hotspot detection system based on the analysis of MODIS data also showed a pulse in thermal activity during the same time (figure 54). Infrared satellite imagery captured a continuous thermal anomaly at the summit crater, often accompanied by white gas-and-steam emissions (figure 55). On 4 April 2023 an active lava flow was observed descending the SE flank.
Geologic Background. The modern Bezymianny, much smaller than its massive neighbors Kamen and Kliuchevskoi on the Kamchatka Peninsula, was formed about 4,700 years ago over a late-Pleistocene lava-dome complex and an edifice built about 11,000-7,000 years ago. Three periods of intensified activity have occurred during the past 3,000 years. The latest period, which was preceded by a 1,000-year quiescence, began with the dramatic 1955-56 eruption. This eruption, similar to that of St. Helens in 1980, produced a large open crater that was formed by collapse of the summit and an associated lateral blast. Subsequent episodic but ongoing lava-dome growth, accompanied by intermittent explosive activity and pyroclastic flows, has largely filled the 1956 crater.
Information Contacts: Kamchatka Volcanic Eruptions Response Team (KVERT), Far Eastern Branch, Russian Academy of Sciences, 9 Piip Blvd., Petropavlovsk-Kamchatsky, 683006, Russia (URL: http://www.kscnet.ru/ivs/kvert/); Kamchatka Volcanological Station, Kamchatka Branch of Geophysical Survey, (KB GS RAS), Klyuchi, Kamchatka Krai, Russia (URL: http://volkstat.ru/); Hawai'i Institute of Geophysics and Planetology (HIGP) - MODVOLC Thermal Alerts System, School of Ocean and Earth Science and Technology (SOEST), Univ. of Hawai'i, 2525 Correa Road, Honolulu, HI 96822, USA (URL: http://modis.higp.hawaii.edu/); MIROVA (Middle InfraRed Observation of Volcanic Activity), a collaborative project between the Universities of Turin and Florence (Italy) supported by the Centre for Volcanic Risk of the Italian Civil Protection Department (URL: http://www.mirovaweb.it/); Copernicus Browser, Copernicus Data Space Ecosystem, European Space Agency (URL: https://dataspace.copernicus.eu/browser/).
Chikurachki
Russia
50.324°N, 155.461°E; summit elev. 1781 m
All times are local (unless otherwise noted)
New explosive eruption during late January-early February 2023
Chikurachki, located on Paramushir Island in the northern Kuriles, has had Plinian eruptions during the Holocene. Lava flows have reached the sea and formed capes on the NW coast; several young lava flows are also present on the E flank beneath a scoria deposit. Reported eruptions date back to 1690, with the most recent eruption period occurring during January through October 2022, characterized by occasional explosions, ash plumes, and thermal activity (BGVN 47:11). This report covers a new eruptive period during January through February 2023 that consisted of ash explosions and ash plumes, based on information from the Kamchatka Volcanic Eruptions Response Team (KVERT) and satellite data.
According to reports from KVERT, an explosive eruption began around 0630 on 29 January. Explosions generated ash plumes that rose to 3-3.5 km altitude and drifted 6-75 km SE and E, based on satellite data. As a result, the Aviation Color Code (ACC) was raised to Orange (the second highest level on a four-color scale). At 1406 and 1720 ash plumes were identified in satellite images that rose to 4.3 km altitude and extended 70 km E. By 2320 the ash plume had dissipated. A thermal anomaly was visible at the volcano on 31 January, according to a satellite image, and an ash plume was observed drifting 66 km NE.
Occasional explosions and ash plumes continued during early February. At 0850 on 1 February an ash plume rose to 3.5 km altitude and drifted 35 km NE. Satellite data showed an ash plume that rose to 3.2-3.5 km altitude and drifted 50 km NE at 1222 later that day (figure 22). A thermal anomaly was detected over the volcano during 5-6 February and ash plumes drifted as far as 125 km SE, E, and NE. Explosive events were reported at 0330 on 6 February that produced ash plumes rising to 4-4.5 km altitude and drifting 72-90 km N, NE, and ENE. KVERT noted that the last gas-and steam plume that contained some ash was observed on 8 February and drifted 55 km NE before the explosive eruption ended. The ACC was lowered to Yellow and then Green (the lowest level on a four-color scale) on 18 February.
Geologic Background. Chikurachki, the highest volcano on Paramushir Island in the northern Kuriles, is a relatively small cone constructed on a high Pleistocene edifice. Oxidized basaltic-to-andesitic scoria deposits covering the upper part of the young cone give it a distinctive red color. Frequent basaltic Plinian eruptions have occurred during the Holocene. Lava flows have reached the sea and formed capes on the NW coast; several young lava flows are also present on the E flank beneath a scoria deposit. The Tatarinov group of six volcanic centers is located immediately to the south, and the Lomonosov cinder cone group, the source of an early Holocene lava flow that reached the saddle between it and Fuss Peak to the west, lies at the southern end of the N-S-trending Chikurachki-Tatarinov complex. In contrast to the frequently active Chikurachki, the Tatarinov centers are extensively modified by erosion and have a more complex structure. Tephrochronology gives evidence of an eruption around 1690 CE from Tatarinov, although its southern cone contains a sulfur-encrusted crater with fumaroles that were active along the margin of a crater lake until 1959.
Information Contacts: Kamchatka Volcanic Eruptions Response Team (KVERT), Far East Division, Russian Academy of Sciences, 9 Piip Blvd., Petropavlovsk-Kamchatsky, 683006, Russia (URL: http://www.kscnet.ru/ivs/); Copernicus Browser, Copernicus Data Space Ecosystem, European Space Agency (URL: https://dataspace.copernicus.eu/browser/).
Search Bulletin Archive by Publication Date
Select a month and year from the drop-downs and click "Show Issue" to have that issue displayed in this tab.
The default month and year is the latest issue available.
Bulletin of the Global Volcanism Network - Volume 23, Number 10 (October 1998)
Managing Editor: Richard Wunderman
Akan (Japan)
Small-scale ash eruption on 9 November
Ambae (Vanuatu)
Monitoring and water chemistry at Voui crater lake
Colima (Mexico)
Lava dome begins erupting, fills crater, and spills out
Etna (Italy)
Summary of eruptive activity from summit craters during January-May 1998
Guagua Pichincha (Ecuador)
Crisis continues into November; many days with one phreatic explosion
Iwatesan (Japan)
Seismic crisis ends on 3 November
Karymsky (Russia)
Strombolian eruptions and elevated seismicity continue
Kerinci (Indonesia)
Rumbling, ash, and sulfur smell on 3 November
Kilauea (United States)
Lava from Pu`u `O`o continues to build bench
Klyuchevskoy (Russia)
Background seismic and fumarolic activity during October
Langila (Papua New Guinea)
Large explosion on 21 September causes ashfall
Manam (Papua New Guinea)
Intense eruptive activity resumes in late September
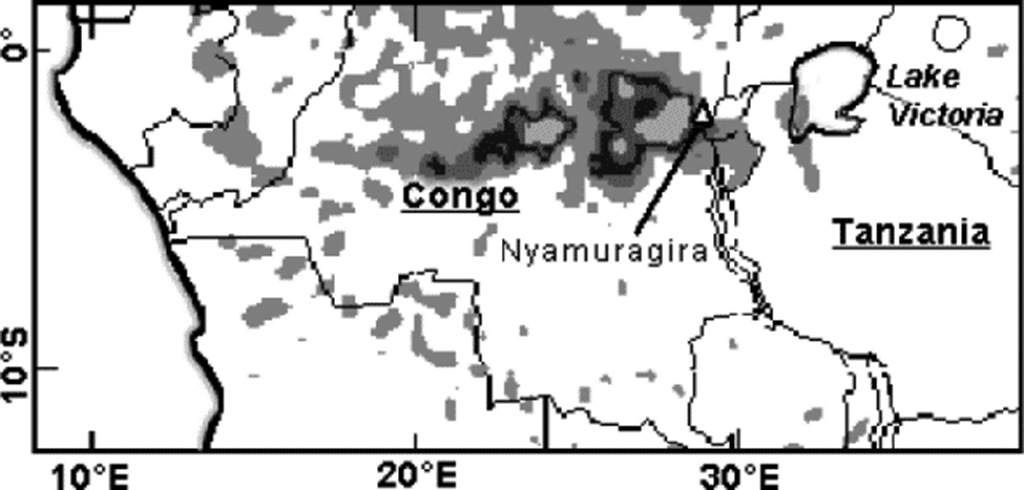
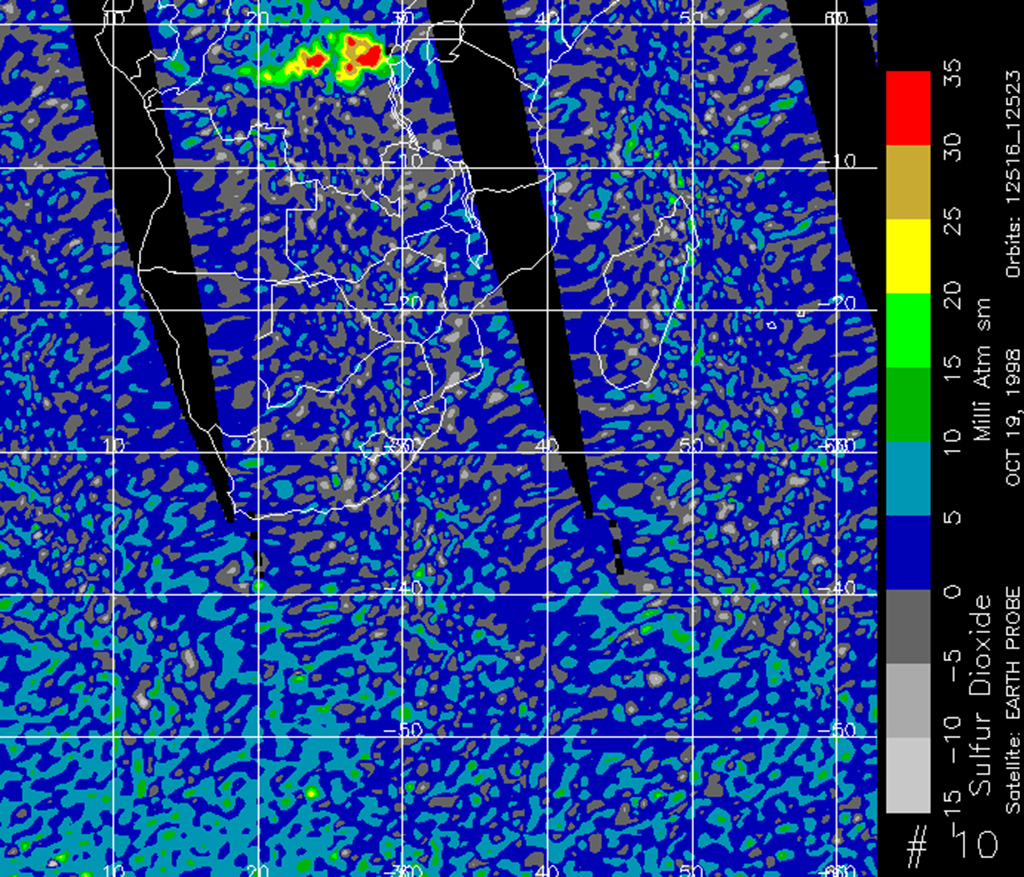
Nyamulagira (DR Congo)
Flank lava flow in October; TOMS data
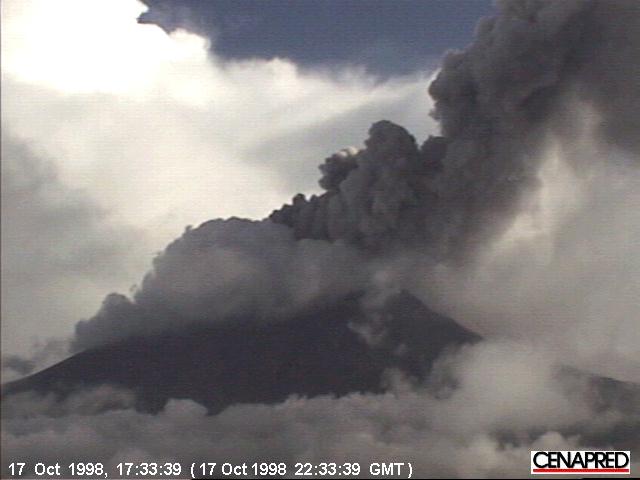
Popocatepetl (Mexico)
Moderate eruptions, 17 October ashfall in Mexico City
Rabaul (Papua New Guinea)
Low seismicity, but regular eruptions continue
Sabancaya (Peru)
Intermittent gas plumes in early September, some with ash
San Cristobal (Nicaragua)
Heavy rains from hurricane Mitch result in deadly avalanche and lahar from Casita
Sheveluch (Russia)
A few minor gas-and-steam plumes in October
Stromboli (Italy)
Larger explosions in January, August, and September 1998
Ulawun (Papua New Guinea)
White vapor plumes throughout September
Whakaari/White Island (New Zealand)
Minor gas-and-ash eruptions in August and October
Akan
Japan
43.384°N, 144.013°E; summit elev. 1499 m
All times are local (unless otherwise noted)
Small-scale ash eruption on 9 November
On 9 November the Japanese Meteorological Agency (JMA) issued two "Volcanic Advisories" and a "Volcano Observation Report" following a small-scale eruption at Me-Akan volcano ~225 km E of Sapporo. New ash deposits were observed on trees in the nearby town of Akan, located E of the volcano near Lake Akan, and trace amounts of ash were distributed up to ~10 km E from the summit crater. JMA and Hokkaido University seismometers detected 4 minutes of tremor beginning at 1441 on 9 November. No additional earthquake or tremor events followed.
According to the local news agency, Asahi Shinbun, one of their aircraft flew near the snow-covered summit of the volcano at approximately 0900 on 10 November. White-colored "smoke" was seen to rise 700 m above the Ponmachineshiri crater (figure 7). Observers also noted that snow fields up to 1 km S and E of the crater were gray in color. There were no reports of injuries or damage.
Researchers from Hokkaido University, the Geological Survey of Japan (Hokkaido Branch), Geological Survey of Hokkaido, and JMA (Sapporo and Kushiro) surveyed ash deposits from the 9 November eruption, and examined the ash under a petrological microscope. They estimated the total mass of the deposits as ~1,000 metric tons (t), smaller than the ~2,000 t eruption in 1996 (BGVN 21:10). The ash consisted of older, altered rock-fragments (andesite), minerals and clay. They found trace amounts of angular, fresh basalt fragments containing gray glass. They considered it likely that new magma reacted with water in a hydrothermal system, resulting in a phreatomagmatic eruption in which chips of solidified new magma were issued together with larger amounts of fragments of older rocks altered hydrothermally beneath the crater.
Geologic Background. Akan is a 13 x 24 km caldera located immediately SW of Kussharo caldera. The elongated, irregular outline of the caldera rim reflects its incremental formation during major explosive eruptions from the early to mid-Pleistocene. Growth of four post-caldera stratovolcanoes, three at the SW end of the caldera and the other at the NE side, has restricted the size of the caldera lake. Conical Oakandake was frequently active during the Holocene. The 1-km-wide Nakamachineshiri crater of Meakandake was formed during a major pumice-and-scoria eruption about 13,500 years ago. Within the Akan volcanic complex, only the Meakandake group, east of Lake Akan, has been historically active, producing mild phreatic eruptions since the beginning of the 19th century. Meakandake is composed of nine overlapping cones. The main cone of Meakandake proper has a triple crater at its summit. Historical eruptions at Meakandake have consisted of minor phreatic explosions, but four major magmatic eruptions including pyroclastic flows have occurred during the Holocene.
Information Contacts: J. Miyamura, Japan Meteorological Agency, Kishocho-881, 3-4 Ote-machi, Chiyoda-ku, Tokyo 100-0004, Japan; Mitsuhiro Nakagawa, Department of Earth and Planetary Material Sciences, Graduate School of Science, Hokkaido University, N-10 W-8 Kita-ku, Sapporo 060, Japan; Asahi Shimbun News, Tokyo, Japan (URL: http://www.asahi.com/); Keiji Wada, Hokkaido University of Education at Asahikawa, Hokumoncho 9-chome, Asahikawa 070,Japan (URL: http://www.asa.hokkyodai.ac.jp/research/staff/wada/EV/E-Welcome.html); Volcano Research Center, Earthquake Research Institute (ERI), University of Tokyo, Yayoi 1-1-1, Bunkyo-ku, Tokyo 113, Japan (URL: http://www.eri.u-tokyo.ac.jp/VRC/index_E.html).
Ambae
Vanuatu
15.389°S, 167.835°E; summit elev. 1496 m
All times are local (unless otherwise noted)
Monitoring and water chemistry at Voui crater lake
Following the 1995 phreatic explosion at Lake Voui (BGVN 20:02 and 20:08) a bathymetric survey of the crater lake was carried out. The 1996 survey confirmed the location of activity that had first been observed in 1992 on a SPOT satellite image. Monitoring of Lake Voui has continued through November 1998.
The average temperature over the whole 1 x 2 km surface of the lake (figures 7 and 8) stayed at ~30°C during November 1996-November 1998, due in part to constant streams of gas that issued from the main vent. As a comparison, in June 1995, three months after the phreatic explosion, the surface temperature was 45°C.
The ten major compounds dissolved in the lake's water have changed in concentration with time (table 1), but the samples, taken at the surface and at depths of 15-50 m, were consistent throughout the lake at any one time.
Table 1. Synopsis of the physical and chemical analysis of the waters of Voui lake derived from samples taken during 1995-98. Chemical constituents and ratios are given in mg/L. Courtesy Centre ORSTOM, Vanuatu.
| Date |
pH |
Conductivity (mS) |
Temp.(°C) |
Cl |
SO4 |
SO4/Cl |
Mg |
Mg/Cl |
Ca |
Na |
K |
Fe |
Mn |
Al |
| 27 Jun 1995 |
2.2 |
19.5 |
40 |
3240 |
8560 |
2.6 |
1910 |
0.589 |
288 |
1030 |
440 |
425 |
74 |
75 |
| 01 Dec 1995 |
2.3 |
18.9 |
35 |
2700 |
8350 |
3.1 |
1840 |
0.681 |
193 |
1030 |
317 |
253 |
65 |
39 |
| 01 May 1996 |
2.0 |
21.4 |
35 |
2560 |
9900 |
3.9 |
2190 |
0.858 |
230 |
1110 |
307 |
274 |
69 |
41 |
| 25 Nov 1996 |
1.5 |
28.8 |
30 |
2530 |
9510 |
3.8 |
2140 |
0.848 |
174 |
810 |
219 |
246 |
64 |
-- |
| 17 Jun 1997 |
1.1 |
33.2 |
30 |
2410 |
13130 |
5.4 |
2100 |
0.872 |
160 |
690 |
161 |
252 |
56 |
62 |
| 30 Nov 1997 |
1.3 |
36.9 |
30 |
2280 |
15260 |
6.7 |
2150 |
0.942 |
130 |
520 |
113 |
304 |
54 |
60 |
| 19 Jul 1998 |
1.4 |
34.4 |
30 |
2100 |
18010 |
8.6 |
1802 |
0.859 |
42 |
521 |
97 |
287 |
50 |
77 |
The average volume of the lake was estimated at 50 x 106 m3, but the level varied significantly. A drop of 275 cm in surface elevation was observed between June 1997 and October 1998. Rainfall varied between 500 and 600 cm/year in the summit area.
Monitoring was conducted twice per year, complemented by seismic recordings taken from a station set up in the dry lake bed of Ngoro. This system is similar to that used on Tanna Island, Vanuatu (BGVN 21:08). The range of monitoring equipment in place on Aoba since 1996 was extended in October 1998 by the installation of an acoustic recording station (0.1-150 KHz) and a device for continuous measurement of lake-water temperature. The data are relayed through an ARGOS satellite transmitter. Identical stations have been set up on Kelut in Indonesia and at Lake Taal in the Philippines.
Geologic Background. The island of Ambae, also known as Aoba, is a massive 2,500 km3 basaltic shield that is the most voluminous volcano of the New Hebrides archipelago. A pronounced NE-SW-trending rift zone with numerous scoria cones gives the 16 x 38 km island an elongated form. A broad pyroclastic cone containing three crater lakes (Manaro Ngoru, Voui, and Manaro Lakua) is located at the summit within the youngest of at least two nested calderas, the largest of which is 6 km in diameter. That large central edifice is also called Manaro Voui or Lombenben volcano. Post-caldera explosive eruptions formed the summit craters about 360 years ago. A tuff cone was constructed within Lake Voui (or Vui) about 60 years later. The latest known flank eruption, about 300 years ago, destroyed the population of the Nduindui area near the western coast.
Information Contacts: Michel Lardy, Inès Rodriguez, Douglas Charley, and Pascal Gineste, Centre ORSTOM, P.O.Box 76, Port-Vila, Vanuatu; Michel Halbwachs, and Jacques Grangeon, Université de Savoie, Campus Scientifique, F3376, Le Bourget du Lac, Cédex France; Janette Tabbagh, Centre de Téléobservation Informatisée des volcans, CNRS-CRG, Garchy, France.
Colima
Mexico
19.514°N, 103.62°W; summit elev. 3850 m
All times are local (unless otherwise noted)
Lava dome begins erupting, fills crater, and spills out
Rapid lava effusion began from Colima's summit lava dome in late November. The 1998 lava extrusion, the first since 1991, followed months of seismic unrest and a subsequent explosion at the summit on 6 July, leading to local evacuations.
The night of 19 November was marked by strong seismicity and a large number of rockfalls (lasting 2-4 minutes) down the summit's W, SW, and S sectors. Although a previous helicopter flight could not confirm the prescence of new lava, at 0730 on 20 November geologists saw that the crater formed by explosions in 1994 contained a fresh, nearly black circular lava dome with a rough, wrinkled surface. At that time, based on the 1994 crater's dimensions (135 m in diameter and 50 m deep), the dome was approximately 30 x 50 x 15 m in size. Fumaroles were noted along the dome's margins. Other fumaroles in the area of the N-NW summit continued to emit a high output of gases. By 1800 on 20 November both seismicity and rockfalls had dropped to low levels.
Surprisingly rapid dome growth took place that night, and a 0730 flight on 21 November disclosed that the 1994 crater (~3.8 x 10⁵ m3 in volume) was then full and new lava spilled out the S side. Up to this point Colima's eruption appeared quite similar to the 1991 lava extrusion episode, but the new lava erupted at a considerably higher rate. In 1991 it took about 16 days to form a dome of comparable size.
Geologic Background. The Colima complex is the most prominent volcanic center of the western Mexican Volcanic Belt. It consists of two southward-younging volcanoes, Nevado de Colima (the high point of the complex) on the north and the historically active Volcán de Colima at the south. A group of late-Pleistocene cinder cones is located on the floor of the Colima graben west and east of the complex. Volcán de Colima (also known as Volcán Fuego) is a youthful stratovolcano constructed within a 5-km-wide scarp, breached to the south, that has been the source of large debris avalanches. Major slope failures have occurred repeatedly from both the Nevado and Colima cones, producing thick debris-avalanche deposits on three sides of the complex. Frequent recorded eruptions date back to the 16th century. Occasional major explosive eruptions have destroyed the summit (most recently in 1913) and left a deep, steep-sided crater that was slowly refilled and then overtopped by lava dome growth.
Information Contacts: Carlos Navarro Ochoa, Colima Volcano Observatory, Universidad de Colima, Ave. 25 de Julio 965, Colima 28045, Colima, México.
Etna
Italy
37.748°N, 14.999°E; summit elev. 3357 m
All times are local (unless otherwise noted)
Summary of eruptive activity from summit craters during January-May 1998
The following report summarizes activity observed at each of the four summit craters of Etna from 15 January through May 1998. Southeast Crater was active throughout this period, with explosions and lava flows both within the crater and on the flanks of the cone. Activity at Bocca Nuova alternated between ash emissions from collapses and vigorous magmatic eruptions until early April. Voragine exhibited intermittent low-level activity. Northeast Crater had a lava fountaining episode in late March, its first significant activity since August 1996. Additional summit crater eruptive episodes after May 1998 will be described in future issues.
Information for this report was compiled by Boris Behncke at the University of Catania and published on his internet web site. The compilation was based on personal visits to the summit, telescopic observations from Catania, and other sources.
Seismicity on the W flank. Seismic activity resumed on 15 January with weak tremors ~6 km below the W flank (Monte Palestra area) and several shallow shocks on the SW slope. Seismicity was low but a tremor occurred on the W flank, and another directly below the summit craters, on 19 January. After about two weeks of relative seismic quiet, earthquakes occurred again below the W flank on 31 January and below the summit craters on 1 February. Mild seismic activity was occurring again on 9 February in the Monte Palestra area (W flank at around 2,000 m), in the same area that has been affected repeatedly by seismic activity since late December.
Activity at Southeast Crater. On 16 January, explosive and effusive activity resumed at Southeast Crater (SEC). On 18 January there were three active lava flows on the southern slopes of SEC. A lava flow which moved towards the W rim of Valle del Bove stopped shortly on 20 January. After two days of weak or absent eruptive activity, SEC resumed Strombolian activity on 22 January. On 28 January a lava tongue extended to the W rim of Valle del Bove; at dusk there was vigorous explosive activity and two small lava flows were visible. During the evening of 29 January, Strombolian activity occurred from the intracrater cone while a lava flow was overflowing down the SE flank.
Clear weather on 4 February revealed fresh lava flows on the S and ESE flanks of SEC. Explosive activity continued on 9 February while small lava flows moved down its SE flank. On 10 February, SEC was the site of continuous powerful Strombolian explosions that dropped bombs and scoriae beyond the crater rims. Activity alternated between two vents, only one erupting at any given time. The S vent produced fountains that showered the whole southern sector of SEC with bombs. The N vent sent vertical fountains of bombs up to 200 m high. Some bombs that fell on the W crater rim were up to 30 cm long. Smaller projectiles even fell at the lower slope of the main cone, 100 m from the erupting vent. Lava flowed from a vent on the SE side of the intracrater cone. A lava tongue spilled over the crater rim on its ENE side. Other recent lava tongues had extended just beyond the base of the cone; the longest flow to the ESE (produced in mid-December 1997) had advanced to within ~50 m of the W rim of Valle del Bove. The only significant remainder of SEC's former rim is on the W and NW side where it stands 15 m above the lava field surrounding the central cone. In all other areas the crater is filled and has overflowed in many places. The appearance of the crater's interior is that of a low lava shield topped by a cone that is 30-40 m high.
By 11 February, growth on the NW side of the intracrater cone had raised its summit by at least 1 m since the day before. Two vents were active in its summit crater, and for the first time these were seen to erupt simultaneously. The vigor of the activity increased notably after 1930, when jets of bombs frequently rose up to 250 m above the vent. Lava from the vent on the SE base of the intracrater cone rapidly covered the SE sector of the crater floor and began to spill down the upper outer flank of SEC. By 2000, it had extended some 50-100 m downslope. Activity continued at similar levels through 15 February.
Strombolian activity was intermittent on 17 February, and degassing alternated with bomb ejections while a lava flow slowly moved down the SSE flank of the SEC cone. New lava flows from the intracrater cone covered ~25% of the crater floor, and a new lava lobe began spilling down the outer flank of SEC adjacent to the still-active SSE flow. A lava flow on the SW flank of SEC during 20-25 February appeared to be flowing on the NW side of the January flow. Strombolian activity occurred on the night of 25 February, and a very minor lava lobe spilled over the SE crater rim.
The eruption continued on 5 March with lava effusion on the flanks of SEC. As of 11 March lava continued to spill down the SE flank of SEC. Around 16-19 March, SEC appeared to be the only center of eruptive activity with weak Strombolian activity accompanied by minor overflows of lava. Lava flows began moving down the SSW flank of SEC on 20 and 21 March, but explosive activity was weak. During the Northeast Crater episode of 27-28 March, SEC was intensely active, with vigorous and continuous Strombolian bursts, and a lava flow spilling down the SW flank of the SEC cone. Moderate Strombolian activity continued, but effusive activity on the SW flank ceased sometime during 29 March.
Significant morphologic changes were noted on 6 April that had occurred since the previous visit on 17 February. The summit of the intracrater conelet had collapsed or been destroyed in late March. A depression on the lower E flank of the conelet was the site of a new effusive vent. The effusive vent area that had been active for many months in the S and SE sectors of the conelet's flank was inactive. Lava had buried the old rim of SEC on all sides except the W and NW where the old rim stood a few meters above the lava field. Lava had overflowed onto the northern outer flank of SEC, forming a short lobe. On the SW flank of SEC a lava flow active from mid-February until early March had extended to near the base of the 1971 "Observatory Cone".
The new effusive vent on the eastern base of the conelet had apparently formed only shortly before the visit because the depression around it had not yet been filled. Extrusion at this site had been preceded by subsidence at the base of the conelet. Meter-sized slabs of older lava had been uplifted and tilted, and fresh lava was being squeezed through the cracks, accompanied by high-pressure gas venting. A more vigorous flow issued from a U-shaped vent, similar to ephemeral vents seen on other occasions. Yet another flow began to issue from below an upheaved slab of older lava with spectacular lava stalagtites on its bottom. These two flows spilled 150 m down the NE flank of SEC.
Explosive activity on 6 April occurred from two vents within the crater of the central conelet, but they never erupted simultaneously; one vent was very noisy while the other erupted silently. SEC continued to erupt on 27 April, with small Strombolian explosions and lava effusion. Scientists who visited the crater on 14 May reported that lava was overflowing onto the flanks, and Strombolian activity was occurring from the summit of the conelet.
Vigorous explosive and continuous effusive activity as well as morphological changes were observed at SEC during a visit on 21 May with students from North Dakota State University. The central conelet was observed at close range, and the main effusive vent could be approached amidst a rain of light scoriae. Strombolian activity occurred from a single vent in the NW summit area of the conelet. Explosions occurred incessantly, and many ejected bombs 200 m above the vent. As on many other occasions, a distinct periodicity could be noted in the activity, each cycle culminating in a series of powerful Strombolian blasts heavily charged with meter-sized bombs. Overlapping lobes on the E side of the conelet had built a low shield, and the depression which had formed at the E base of the conelet was completely filled.
Vigorous explosive activity occurred on 24 May from the central conelet of SEC, and two flows were descending the SE cone. Some explosions ejected incandescent bombs at least 200 m high. Giovanni Sturiale and Boris Behncke, both of Catania University, visited SEC on 28 May; the central conelet was somewhat higher in the vent area than on 20 May. The main vent at the E base of the conelet was issuing lava that spilled over the E rim of SEC (buried under at least 30 m of lava since July 1997). Most flows stop at the base of the cone and are followed by the formation of new flows. Vigorous explosive activity dropped bombs on the N side of the central conelet. The current activity is known as Etna's "persistent summit activity" which became famous from descriptions of Northeast Crater which in the 1950's to 1970's produced similar activity.
Activity at Bocca Nuova. Very dense gas emissions were occurring from Bocca Nuova (BN) on 19 January; some contained ash. Explosions from BN were audible 8 km from the summit on 20 January, but magmatic activity alternated with collapses, generating dense ash plumes. Bright glow was visible on 22 January. BN was emitting white steam with some dark ash plumes derived from crater wall collapse on 28 January. On 28-29 January periods of intense incandescence indicated vigorous but intermittent activity at both the SE and the N eruptive centers.
Intense glow was again visible at BN on 4 February, indicating vigorous intracrater activity. Activity on 8 February continued without significant changes; there were emissions of dark ash indicating collapse of the crater walls. Magma again withdrew from BN (as indicated by internal collapse) on 9 February. Later that day collapse in BN ended; at nightfall, bright incandescence was visible.
The overall appearance of BN on 10 February was similar to before the collapses that accompanied the seismic crises on the W flank. The collapse had affected only the summit areas of the two large cones, and the N cone had subsided several meters. Activity had resumed at both cones. Jets of bombs, at times mixed with ash, rose tens of meters above the vents, and occasional explosions ejected bombs. Eruptive activity from the northern cone had resumed at a new vent close to the center of BN. A vent in the deepest part of the ~150-m-wide crater of the cone was vigorously degassing. A third vent rarely produced spectacular ash emissions. The main eruptive vent (on the S rim of the cone) was in constant eruption, with powerful bomb ejections about every 2 seconds. Many ejections rose above the W rim of BN, which stands 70-80 m above the vent. Every 5-10 minutes, this vent would produce larger eruptions, ejecting continuous fountains mixed with ash.
Activity in BN increased notably when seen on 11 February. Activity was continuous at both cones. During the afternoon, periods of near-continuous ash emissions were accompanied by powerful explosions. At night, both eruptive areas produced intense continuous glow. Occasional larger explosions ejected bombs up to 150 m above the SE rim of Bocca Nuova. The eruption in BN continued on 15 February without significant modifications. There were vigorous bomb ejections, many of which dropped bombs on the outer slopes of the main summit cone.
During another visit on 17 February, both eruptive centers of BN were active. One vent, 30-35 m in diamater, was ejecting continuous lava fountains and occasional large jets to above the crater rim. The northern eruptive center was the site of continuous very narrow incandescent fountains, and a small lava flow. Occasional violent explosions occurred from the vent on the southern rim of the collapse structure which had been the most active vent in this area one week earlier. Activity in BN during 20-23 February was characterized by low-level bomb ejections with occasional larger jets of bombs. Virtually continuous ash emissions began at BN on the afternoon of 24 February. The ash emissions were followed that evening by vigorous magmatic activity, probably from the SE vents, that caused a bright fluctuating glow until daylight.
BN continued to erupt in early March, although the activity appeared to decrease. On 5 March there was weak activity at BN. As of 11 March sporadic night glow was visible at BN. This crater was completely inactive during a 6 April visit. Wholesale collapse had occurred at the N and SE eruptive areas. A vast collapse depression had formed at the former, leaving only the N part of the large cone that had grown there until the end of 1997. Explosion sounds heard on 27 April possibly came from BN. The local mountain guides reported on 21 May that there had been no recent activity at BN. Activity resumed from BN at the end of May after several months of little activity.
Activity at Voragine. Eruptive activity reportedly included the Voragine on 20 January, but it was inactive during a summit visit on 10 February. During a 6 April visit, the first to this crater since 10 February, a few minor morphologic changes were noted. The most significant was the formation of a new crater <10 m in diameter on the central conelet. Some growth had occurred, and the crater floor was covered with finer-grained tephra. The SW vent at the base of the septum between Voragine and BN had enlarged to ~40 m in diameter. This vent was the only site of eruptive activity within the crater during the visit. Large explosions every 3-5 minutes ejected bombs tens of meters high, some of which flew into BN. Scientists at the summit on 14 May reported vigorous activity from the vent in the SW part of the Voragine and numerous fresh bombs. Loud detonations on 24 May indicated explosive activity; some were accompanied by dense vapor and gas plumes.
Activity at Northeast Crater. In one of the most spectacular eruptive events of the past few years, Northeast Crater (NEC) produced a 2-hour episode of lava fountaining during the night of 27-28 March. The event marks a resumption of more vigorous activity at NEC, which has displayed only weak activity since August 1996.
Volcanic tremor was registered by seismic stations in the summit area early on 27 March. At about 1000, Northeast Crater began to emit ash plumes that continued until shortly after 1600. By nightfall, sporadic ejections of incandescent bombs sometimes rose several hundred meters above the crater. The Strombolian ejections gradually increased in intensity and became virtually continuous by 2200. Shortly before midnight, the ejections merged into a continuous pulsating fountain rising 300-350 m above the rim of the active vent within the collapse pit in the S-central part of the crater. Large bombs fell onto the lava platform and into the adjacent Voragine and BN craters, some fell 1 km S and SW of the vent. Loud detonations were heard on the E and SE flanks where hundreds of thousands of people watched the display at a safe distance. By about 0130, the activity began to decline and was virtually over after 0200. This eruption appears to be another episode of lava fountaining similar to those at the same crater between November 1995 and June 1996, and many times during the late 1970's and early 1980's. The next day, NEC emitted a few ash plumes several hundred meters above the summit, but there was no evidence of renewed Strombolian activity.
When the crater was visited on 6 April, centimeter-sized, highly inflated scoriae were abundant a few hundred meters S of the 1971 "Observatory Cone," and the deposit was nearly continuous on the W side of that cone, with maximum clast sizes exceeding 5 cm. Closer to SEC the deposit was no longer continuous, but clasts up to 10 cm long were found. Close to NEC, little fallout was found. A few impact craters were seen in the N part of the Voragine floor while on its N wall bombs had formed a nearly continuous cover. On the S and SE rim of NEC the deposit was at most a few meters thick. The inner terrace surrounding the central pit, previously 5-10 m below the outer terrace, had subsided at least 10 m, exposing huge caverns in the vertical scarp along which subsidence took place; these were formed during the summer of 1996 when the crater was filled with lava which crusted over and later drained. The dimensions of the central pit had changed little, but its floor had risen to within ~50-60 m of the lowest point on the rim. There was no evidence of fresh ejecta around these vents indicating that no significant eruptive activity had taken place there since the 27-28 March eruption.
Local mountain guides reported on 21 May that there had been no recent activity at NEC. However, on the morning of 1 June there was a series of ash emissions.
Geologic Background. Mount Etna, towering above Catania on the island of Sicily, has one of the world's longest documented records of volcanism, dating back to 1500 BCE. Historical lava flows of basaltic composition cover much of the surface of this massive volcano, whose edifice is the highest and most voluminous in Italy. The Mongibello stratovolcano, truncated by several small calderas, was constructed during the late Pleistocene and Holocene over an older shield volcano. The most prominent morphological feature of Etna is the Valle del Bove, a 5 x 10 km caldera open to the east. Two styles of eruptive activity typically occur, sometimes simultaneously. Persistent explosive eruptions, sometimes with minor lava emissions, take place from one or more summit craters. Flank vents, typically with higher effusion rates, are less frequently active and originate from fissures that open progressively downward from near the summit (usually accompanied by Strombolian eruptions at the upper end). Cinder cones are commonly constructed over the vents of lower-flank lava flows. Lava flows extend to the foot of the volcano on all sides and have reached the sea over a broad area on the SE flank.
Information Contacts: Boris Behncke, Istituto di Geologia e Geofisica, Palazzo delle Scienze, Università di Catania, Corso Italia 55, 95129 Catania, Italy.
Guagua Pichincha (Ecuador) — October 1998 Cite this Report
Guagua Pichincha
Ecuador
0.171°S, 78.598°W; summit elev. 4784 m
All times are local (unless otherwise noted)
Crisis continues into November; many days with one phreatic explosion
The sequence of phreatic explosions initiated on 7 August (BGVN 23:09) continued from 28 October through 17 November (table 1). A substantial number of days were marked by one phreatic explosion. Visible explosions rose at most a few kilometers above the summit. Many explosions were accompanied by tremor; they were seismically characterized with reduced displacements.
Table 1. Some details of Guagua Pichincha's phreatic explosions, their size (as reduced displacements), and associated tremor, 27 October through 17 November 1998. A "--" signifies the data is either inapplicable or not reported. Extracted from the daily reports posted on the website of IG-EPN.
| Date |
Phreatic explosions |
Reduced displacement |
Post-explosion tremor |
Remarks |
| 27-29 Oct 1998 |
0 |
-- |
-- |
-- |
| 30 Oct 1998 |
1 |
3.6 cm2 |
8 hours |
-- |
| 31 Oct 1998 |
1 |
-- |
30 minutes |
-- |
| 31 Oct 1998 |
1 |
-- |
20 minutes |
-- |
| 01 Nov 1998 |
1 |
5.7 cm2 |
-- |
-- |
| 01 Nov 1998 |
1 |
10.7 cm2 |
3 hours |
-- |
| 02 Nov 1998 |
1 |
12.2 cm2 |
-- |
-- |
| 03 Nov 1998 |
1 |
7.7 cm2 |
-- |
Plume rose to 3 km altitude. |
| 04 Nov 1998 |
1 |
-- |
-- |
High amplitude, spasmodic tremor. |
| 04 Nov 1998 |
1 |
14.8 cm2 |
4 hours |
-- |
| 05 Nov 1998 |
1 |
6.0 cm2 |
30 minuntes |
-- |
| 06 Nov 1998 |
1 |
5.3 cm2 |
-- |
-- |
| 07 Nov 1998 |
4 |
<~3.0 cm2 |
-- |
-- |
| 08 Nov 1998 |
0 |
-- |
-- |
-- |
| 09 Nov 1998 |
0 |
-- |
-- |
Fumarole "La Locomotora" gave off a 300-m-tall plume. |
| 11 Nov 1998 |
0 |
-- |
-- |
Fumarole "La Locomotora" gave off a 600-m-tall plume. |
| 12 Nov 1998 |
1 |
4.4 cm2 |
-- |
-- |
| 13 Nov 1998 |
0 |
-- |
-- |
Two-hour interval of tremor. |
| 14 Nov 1998 |
0 |
-- |
-- |
Plume reaching 1 km tall. |
| 15 Nov 1998 |
1 |
5.7 cm2 |
20 minutes |
Poor crater visibility; rockfalls and loud fumaroles heard by park rangers. |
| 16 Nov 1998 |
1 |
2.1 cm2 |
-- |
-- |
| 17 Nov 1998 |
1 |
1.7 cm2 |
-- |
Spasmodic tremor. |
As illustrated in the previous report (BGVN 23:09), volcano-tectonic, long-period, and multiphase earthquakes all escalated prominently during mid-September. During the current reporting interval, these remained elevated but did not increase, and the numbers of the various events, particularly volcano-tectonic and multiphase earthquakes, may have moderated or diminished slightly.
The number of explosions in a single day reached a new high for this crisis: four occurred on 7 November. The previous one-day record, three, had occurred only on two days in mid-October. Yet, the 7 November blasts were followed by four consecutive days with no explosions and, during 8-20 November no day had more than one explosion. As an indication of the pace of the venting, during 7 August-3 November the daily reports noted 59 explosions.
The highest plume seen during the reporting interval came from an explosion at 0715 on 3 November. It rose to ~3 km above the summit. Clear atmospheric conditions enabled residents to see it from the city of Quito. Although atmospheric conditions frequently blocked visibility, local observers saw fumarolic plumes rising from 100 to 1000 m. Thus, on 28 October a plume rose 100 m; on 9, 11, and 14 November, respectively, plumes rose 300, 600, and 1,000 m high. A plume on 4 November was of ambiguous origin, but it rose 1,000 m.
Geologic Background. Guagua Pichincha and the older Pleistocene Rucu Pichincha stratovolcanoes form a broad volcanic massif that rises immediately W of Ecuador's capital city, Quito. A lava dome grew at the head of a 6-km-wide scarp formed during a late-Pleistocene slope failure ~50,000 years ago. Subsequent late-Pleistocene and Holocene eruptions from the central vent consisted of explosive activity with pyroclastic flows accompanied by periodic growth and destruction of the lava dome. Many minor eruptions have been recorded since the mid-1500's; the largest took place in 1660, when ash fell over a 1,000 km radius and accumulated to 30 cm depth in Quito. Pyroclastic flows and surges also occurred, primarily to then W, and affected agricultural activity.
Information Contacts: Instituto Geofísico, Escuela Politécnica Nacional, Apartado 17-01-2759, Quito, Ecuador; El Comercio newspaper, Quito, Ecuador (URL: http://www.elcomercio.com); El Universo newspaper, Quito, Ecuador (URL: http://www.eluniverso.com); La Hora newspaper, Quito, Ecuador (URL: http://www.lahora.com); Volcanic Disaster Assistance Program, U.S. Geological Survey, 5400 MacArthur Blvd., Vancouver, Washington 98661 USA (URL: https://volcanoes.usgs.gov/observatories/cvo/); ORSTOM, A.P. 17-11-6596, Quito, Ecuador (URL: http://www.ird.fr/).
Iwatesan
Japan
39.853°N, 141.001°E; summit elev. 2038 m
All times are local (unless otherwise noted)
Seismic crisis ends on 3 November
Subsequent to the 3 September earthquake (BGVN 23:09), seismicity was low. Except for a few days, the number of tremors during October was <10/day, about the same level as in February-March 1998. The last tremor was observed on 3 November. This implies that the volcanic seismicity crisis (BGVN 23:09) has ended.
Geologic Background. Viewed from the east, Iwatesan volcano has a symmetrical profile that invites comparison with Fuji, but on the west an older cone is visible containing an oval-shaped, 1.8 x 3 km caldera. After the growth of Nishi-Iwate volcano beginning about 700,000 years ago, activity migrated eastward to form Higashi-Iwate volcano. Iwate has collapsed seven times during the past 230,000 years, most recently between 739 and 1615 CE. The dominantly basaltic summit cone of Higashi-Iwate volcano, Yakushidake, is truncated by a 500-m-wide crater. It rises well above and buries the eastern rim of the caldera, which is breached by a narrow gorge on the NW. A central cone containing a 500-m-wide crater partially filled by a lake is located in the center of the oval-shaped caldera. A young lava flow from Yakushidake descended into the caldera, and a fresh-looking lava flow from the 1732 eruption traveled down the NE flank.
Information Contacts: Yukio Hayakawa, Faculty of Education, Gunma University, Aramaki, Maebashi 371, Japan.
Karymsky (Russia) — October 1998 Cite this Report
Karymsky
Russia
54.049°N, 159.443°E; summit elev. 1513 m
All times are local (unless otherwise noted)
Strombolian eruptions and elevated seismicity continue
On 5 October, the Kamchatka Volcanic Eruptions Response Team reported that seismicity remained above background level. The low-level Strombolian eruptive activity that has characterized the volcano for more than two years continued. About 100-200 earthquakes and gas explosions occurred every day.
On 24 October Tass reported that a Russian-Japanese expedition of volcanologists had finished their work on Karymsky. The participants had spent two weeks at a location 3 km from the mountain studying seismic, acoustic, and other phenomena related to the eruption.
Geologic Background. Karymsky, the most active volcano of Kamchatka's eastern volcanic zone, is a symmetrical stratovolcano constructed within a 5-km-wide caldera that formed during the early Holocene. The caldera cuts the south side of the Pleistocene Dvor volcano and is located outside the north margin of the large mid-Pleistocene Polovinka caldera, which contains the smaller Akademia Nauk and Odnoboky calderas. Most seismicity preceding Karymsky eruptions originated beneath Akademia Nauk caldera, located immediately south. The caldera enclosing Karymsky formed about 7600-7700 radiocarbon years ago; construction of the stratovolcano began about 2000 years later. The latest eruptive period began about 500 years ago, following a 2300-year quiescence. Much of the cone is mantled by lava flows less than 200 years old. Historical eruptions have been vulcanian or vulcanian-strombolian with moderate explosive activity and occasional lava flows from the summit crater.
Information Contacts: Olga Chubarova, Kamchatka Volcanic Eruptions Response Team (KVERT), Institute of Volcanic Geology and Geochemistry; Tom Miller, Alaska Volcano Observatory.
Kerinci (Indonesia) — October 1998 Cite this Report
Kerinci
Indonesia
1.697°S, 101.264°E; summit elev. 3800 m
All times are local (unless otherwise noted)
Rumbling, ash, and sulfur smell on 3 November
Increasing activity culminated in an eruption on 3 November. In the early afternoon the volcano rumbled three times and ash covered the nearby village of Palempok. Residents also noticed a strong sulfur smell. Rumbling was heard twice on 6 November by residents of Tangkil and Palempok. Unfortunately, the seismograph used to monitor the volcano had been inoperative since 3 November.
Geologic Background. Gunung Kerinci in central Sumatra forms Indonesia's highest volcano and is one of the most active in Sumatra. It is capped by an unvegetated young summit cone that was constructed NE of an older crater remnant. There is a deep 600-m-wide summit crater often partially filled by a small crater lake that lies on the NE crater floor, opposite the SW-rim summit. The massive 13 x 25 km wide volcano towers 2400-3300 m above surrounding plains and is elongated in a N-S direction. Frequently active, Kerinci has been the source of numerous moderate explosive eruptions since its first recorded eruption in 1838.
Information Contacts: R. Sukhyar, Volcanological Survey of Indonesia (VSI), Bandung, Indonesia (URL: http://www.vsi.esdm.go.id/).
Kilauea (United States) — October 1998 Cite this Report
Kilauea
United States
19.421°N, 155.287°W; summit elev. 1222 m
All times are local (unless otherwise noted)
Lava from Pu`u `O`o continues to build bench
The eruption of Pu`u `O`o continued in October as lava moved 11 km to the sea through both small, intermittent surface flows and through a lava tube that developed after a pause on 12-14 August (BGVN 23:08).
By 19 October, a 300-m-wide lava bench had grown W of the prominent littoral cone at a new ocean entry, extending 60 m beyond the old shoreline. Surface flows obscured the old sea cliff that once marked the relatively safe visitor viewing areas (figure 124).
Dense volcanic fumes from Pu`u `O`o obscured its crater for several weeks, and no lava has been seen in the crater for many months, although there have been reports of glow at night near the summit. In late October, Pu`u `O`o was releasing ~2,000 tons/day of SO2. This discharge is equivalent to the gas contained in ~400,000 m3 of lava, in concurrence with measurements of lava discharge above the lava tube ~5 km from the vent.
A new skylight formed above the lava tube at 635 m elevation showed lava moving 7-9 m below the surface. This part of the tube formed in August 1997, and since then flowing lava eroded the underlying flows to form a tube that is taller than it is wide.
Pu`u `O`o is the only active vent at Kīlauea. The vent area is complex and slowly forms new pits, cracks, and collapse areas. Since the current eruption began in January 1983, a mosaic of flows has buried 16 km of the coastal highway to a depth of 23 m and created nearly 2.6 km2 of new land. Recently, lava has flowed into the sea at three entry points near Kamokuna, 4.8 km E of the end of the "Chain of Craters Road" in Hawaii Volcanoes National Park. The easternmost entry has been active since August 1997, but is slowly dying as ruptures in the main tube divert lava elsewhere. Other entry points evolved in September and October 1998. The deltas or benches formed at sea entry points are unstable, collapsing without warning. The largest such collapse occurred a few years ago and involved 10 ha of bench material (105 m2).
Geologic Background. Kilauea overlaps the E flank of the massive Mauna Loa shield volcano in the island of Hawaii. Eruptions are prominent in Polynesian legends; written documentation since 1820 records frequent summit and flank lava flow eruptions interspersed with periods of long-term lava lake activity at Halemaumau crater in the summit caldera until 1924. The 3 x 5 km caldera was formed in several stages about 1,500 years ago and during the 18th century; eruptions have also originated from the lengthy East and Southwest rift zones, which extend to the ocean in both directions. About 90% of the surface of the basaltic shield volcano is formed of lava flows less than about 1,100 years old; 70% of the surface is younger than 600 years. The long-term eruption from the East rift zone between 1983 and 2018 produced lava flows covering more than 100 km2, destroyed hundreds of houses, and added new coastline.
Information Contacts: Hawaiian Volcano Observatory (HVO), U.S. Geological Survey, PO Box 51, Hawaii Volcanoes National Park, HI 96718, USA (URL: https://volcanoes.usgs.gov/observatories/hvo/); Ken Rubin and Mike Garcia, Hawaii Center for Volcanology, University of Hawaii, Dept. of Geology & Geophysics, 2525 Correa Rd., Honolulu, HI 96822 USA (URL: http://www.soest.hawaii.edu/GG/hcv.htm).
Klyuchevskoy (Russia) — October 1998 Cite this Report
Klyuchevskoy
Russia
56.056°N, 160.642°E; summit elev. 4754 m
All times are local (unless otherwise noted)
Background seismic and fumarolic activity during October
During October seismicity under the volcano was generally above background levels. Hypocenters of earthquakes recorded through the period were concentrated at two levels: near the summit crater and at depths of 25-30 km. On 1, 14, 15, 18, and 19 October a fumarolic plume was observed during the daylight hours rising 50 m above the summit. On 9 October the plume rose to 100 m above the summit. No fumarolic plumes were seen on 30 September, 2, 3, 6, 11, or 16 October. Clouds prevented direct observation of the summit during the remainder of the month. The alert status remained "green" indicating normal activity through October.
Geologic Background. Klyuchevskoy (also spelled Kliuchevskoi) is Kamchatka's highest and most active volcano. Since its origin about 6000 years ago, the beautifully symmetrical, 4835-m-high basaltic stratovolcano has produced frequent moderate-volume explosive and effusive eruptions without major periods of inactivity. It rises above a saddle NE of sharp-peaked Kamen volcano and lies SE of the broad Ushkovsky massif. More than 100 flank eruptions have occurred during the past roughly 3000 years, with most lateral craters and cones occurring along radial fissures between the unconfined NE-to-SE flanks of the conical volcano between 500 m and 3600 m elevation. The morphology of the 700-m-wide summit crater has been frequently modified by historical eruptions, which have been recorded since the late-17th century. Historical eruptions have originated primarily from the summit crater, but have also included numerous major explosive and effusive eruptions from flank craters.
Information Contacts: Olga Chubarova, Kamchatka Volcanic Eruptions Response Team (KVERT), Institute of Volcanic Geology and Geochemistry, Piip Ave. 9, Petropavlovsk-Kamchatsky, 683006, Russia; Tom Miller, Alaska Volcano Observatory (AVO), a cooperative program of a) U.S. Geological Survey, 4200 University Drive, Anchorage, AK 99508-4667, USA (URL: http://www.avo.alaska.edu/), b) Geophysical Institute, University of Alaska, PO Box 757320, Fairbanks, AK 99775-7320, USA, and c) Alaska Division of Geological & Geophysical Surveys, 794 University Ave., Suite 200, Fairbanks, AK 99709, USA.
Langila (Papua New Guinea) — October 1998 Cite this Report
Langila
Papua New Guinea
5.525°S, 148.42°E; summit elev. 1330 m
All times are local (unless otherwise noted)
Large explosion on 21 September causes ashfall
Crater 2 emitted thin to thick white vapor throughout September, with an occasional ash component. Weak roaring noises were reported on 1 September. One large explosion on 21 September sent ash to an altitude of 2-3 km and resulted in ashfalls to the SW. Crater 3 was quiet, emitting only thin white vapor.
The activity at Crater 2 during October was moderate and uneventful. Pale gray ash clouds rose intermittently to ~500 m, without sound. On 21 October, however, weak roaring and rumbling sounds accompanied emissions to 1,000-1,500 m and a bright fluctuating night glow.
Geologic Background. Langila, one of the most active volcanoes of New Britain, consists of a group of four small overlapping composite basaltic-andesitic cones on the lower E flank of the extinct Talawe volcano in the Cape Gloucester area of NW New Britain. A rectangular, 2.5-km-long crater is breached widely to the SE; Langila was constructed NE of the breached crater of Talawe. An extensive lava field reaches the coast on the N and NE sides of Langila. Frequent mild-to-moderate explosive eruptions, sometimes accompanied by lava flows, have been recorded since the 19th century from three active craters at the summit. The youngest and smallest crater (no. 3 crater) was formed in 1960 and has a diameter of 150 m.
Information Contacts: Patrice de Saint-Ours, Steve Saunders, and Ben Talai, RVO.
Manam (Papua New Guinea) — October 1998 Cite this Report
Manam
Papua New Guinea
4.08°S, 145.037°E; summit elev. 1807 m
All times are local (unless otherwise noted)
Intense eruptive activity resumes in late September
An inflation of ~10 µrad for September was recorded at Tabele Observatory, ~3 km SW of the summit. This deformation, together with increased seismicity, audible rumblings, and night glow evident in the middle of the month, was thought to indicate the onset of renewed activity.
Intense eruptive activity resumed at Manam in late September for the first time since its fatal eruption of November-December 1996. A visible increase in activity started during 23-26 September, with intermittent dark ash emissions and incandescent projections at night to ~200 m above South Crater. On subsequent days activity decreased to continuous white vapor emissions, first profuse then very weak, and occasional roaring sounds and fluctuating red glow. This corresponded to a slight decrease in seismic amplitude levels, but the radial tilt kept showing inflation.
Significant eruptive activity throughout October, including ash emissions, pyroclastic flows, and lava flows, will be described in the next issue.
Geologic Background. The 10-km-wide island of Manam, lying 13 km off the northern coast of mainland Papua New Guinea, is one of the country's most active volcanoes. Four large radial valleys extend from the unvegetated summit of the conical basaltic-andesitic stratovolcano to its lower flanks. These valleys channel lava flows and pyroclastic avalanches that have sometimes reached the coast. Five small satellitic centers are located near the island's shoreline on the northern, southern, and western sides. Two summit craters are present; both are active, although most observed eruptions have originated from the southern crater, concentrating eruptive products during much of the past century into the SE valley. Frequent eruptions, typically of mild-to-moderate scale, have been recorded since 1616. Occasional larger eruptions have produced pyroclastic flows and lava flows that reached flat-lying coastal areas and entered the sea, sometimes impacting populated areas.
Information Contacts: Patrice de Saint-Ours, Steve Saunders, and Ben Talai, RVO.
Nyamulagira (DR Congo) — October 1998 Cite this Report
Nyamulagira
DR Congo
1.408°S, 29.2°E; summit elev. 3058 m
All times are local (unless otherwise noted)
Flank lava flow in October; TOMS data
Eruptive activity occurred at Nyamuragira volcano beginning on 17 October. During the following week several Strombolian explosions and effusive activity were reported. Lava "gently gushed" from the cone and through a fissure in its side, according to an official at the National Scientific Research Centre (CNRS) quoted in a Reuters news report. On 19 October the central crater opened and the lava flowed into the surrounding forest. Glow was visible at night from the city of Goma, ~30 km SE of the volcano. The flows were still active but diminishing at the time of the last report on 25 October. Scientists are not able to visit the site because of the threat of civil unrest. Virunga National Park has been closed for months.
An SO2 plume was first detected by the Earth Probe Total Ozone Mapping Spectrometer (TOMS) on 18 October. Although the image resolution is not sufficient to differentiate between Nyamuragira and Nyiragongo as a plume source, the former has previously emitted large amounts of sulfur dioxide. Imagery the next day (figures 16 and 17) showed that the plume extended ~700 km SW from the volcano and covered an area of 300,000 km2. Scientists at the Goddard Space Flight Center calculated that this plume contained 115 kilotons (kt) of SO2. An SO2 plume was detected on each day from 18 through 29 October. On 29 October the plume was directed to the N and contained 10 kt of SO2. No SO2 was detected in images taken from 30 October through 4 November. Visible satellite imagery acquired by the Toulouse Volcanic Ash Advisory Center on 20 October did not show any evidence of an ash plume, but convective clouds were obscuring the area.
Geologic Background. Africa's most active volcano, Nyamulagira (also known as Nyamuragira), is a massive high-potassium basaltic shield about 25 km N of Lake Kivu and 13 km NNW of the steep-sided Nyiragongo volcano. The summit is truncated by a small 2 x 2.3 km caldera that has walls up to about 100 m high. Documented eruptions have occurred within the summit caldera, as well as from the numerous flank fissures and cinder cones. A lava lake in the summit crater, active since at least 1921, drained in 1938, at the time of a major flank eruption. Recent lava flows extend down the flanks more than 30 km from the summit as far as Lake Kivu; extensive lava flows from this volcano have covered 1,500 km2 of the western branch of the East African Rift.
Information Contacts: C. Akumbi, Goma Volcano Observatory, Departement de Geophysique, Centre de Recherche en Sciences Naturelles, Lwiro, D.S. Bukavu, DR Congo; Stephen J. Schaefer, Joint Center for Earth System Technology (NASA-UMBC), Mail Code 921, NASA Goddard Space Flight Center, Greenbelt, MD 20771 USA; George Stephens, NOAA/NESDIS, E/SP22, 5200 Auth Road, Camp Springs, MD 20746-4304, USA; Robert D. Farquhar, NOAA/NESDIS, FB-4, Suitland, MD 20233-9909 USA; Volcanic Ash Advisory Center (VAAC) Toulouse, Météo-France, 42 Avenue Gaspard Coriolis, F-31057 Toulouse cedex, France; Reuters Limited.
Popocatepetl (Mexico) — October 1998 Cite this Report
Popocatepetl
Mexico
19.023°N, 98.622°W; summit elev. 5393 m
All times are local (unless otherwise noted)
Moderate eruptions, 17 October ashfall in Mexico City
There were a few instances of moderate disturbance during October, and a relatively large emission occurred on 17 October; otherwise, Popocatépetl remained generally stable at low levels of eruptive activity, including almost daily emissions of steam and gas. Since the possibility of explosions remained, authorities recommended that no one approach within 4 km of the crater. The caution light remained "yellow" throughout the month.
Steam-and-gas fumaroles rose up to 500 m above the summit several times during the first week of October. The emissions usually blew SE. Two slightly larger exhalations lasting 5 minutes each at 0218 and 1409 on 4 October may have also released ash, but this was unconfirmed owing to bad weather obstructing views of the volcano. At 2312 on 5 October an explosive event began. An intense two minute phase was followed by 30 minutes of steam, gas, and ash emission that formed a plume 4 km above the crater. Glow was also seen at this time. Activity quickly diminished to previous low levels.
At 1715 on 17 October a larger exhalation began: its intense phase lasted about 16 minutes and produced an ash column (figure 27). The plume rose 2 km above the summit and blew NW (towards Mexico City).
The ash column was initially detected by Doppler radar located at CENAPRED headquarters in Mexico City, and staff there immediately informed air-traffic controllers. The ash emission persisted for 20 minutes, after which the volcano returned to its previous low-level activity (steam and gas emissions only). One hour after the beginning of the event, reports were received of ashfall at Amecameca, Tenango del Aire, and other towns NW of the volcano.
At 2040 another smaller exhalation took place with a duration of only 1 minute. At about 2100 light ash from the earlier eruption fell at CENAPRED headquarters, UNAM, and at other places in SW Mexico City. Activity soon dropped to characteristic low-intensity exhalations. A similar moderate emission lasted 1 minute at 1859 on 24 October; the event was followed by low-amplitude, high-frequency tremor for about 20 minutes, producing a 2,500-m-high column of gas, water vapor, and ash.
A-type earthquakes were recorded at 0956 on 16 October (M 2.6, at a point 6.6 km below the summit), at 2227 on 22 October (M 2.0, at a point 7 km below the crater), at 1751 (M 2.1) and 1919 (M 1.8) on 29 October, and at 0942 (M 2.4) on 30 October. Two minutes of low-amplitude, low-frequency tremor began at 1355 on 29 October. None of these events seemed to affect activity at the volcano.
Geologic Background. Volcán Popocatépetl, whose name is the Aztec word for smoking mountain, rises 70 km SE of Mexico City to form North America's 2nd-highest volcano. The glacier-clad stratovolcano contains a steep-walled, 400 x 600 m wide crater. The generally symmetrical volcano is modified by the sharp-peaked Ventorrillo on the NW, a remnant of an earlier volcano. At least three previous major cones were destroyed by gravitational failure during the Pleistocene, producing massive debris-avalanche deposits covering broad areas to the south. The modern volcano was constructed south of the late-Pleistocene to Holocene El Fraile cone. Three major Plinian eruptions, the most recent of which took place about 800 CE, have occurred since the mid-Holocene, accompanied by pyroclastic flows and voluminous lahars that swept basins below the volcano. Frequent historical eruptions, first recorded in Aztec codices, have occurred since Pre-Columbian time.
Information Contacts: Servando De la Cruz-Reyna1,2, Roberto Quaas1,2, Carlos Valdés G.2, and Alicia Martinez Bringas1. 1Centro Nacional de Prevencion de Desastres (CENAPRED) Delfin Madrigal 665, Col. Pedregal de Santo Domingo,Coyoacan, 04360, México D.F. (URL: https://www.gob.mx/cenapred/); 2Instituto de Geofisica, UNAM, Coyoacán 04510, México D.F., México.
Rabaul (Papua New Guinea) — October 1998 Cite this Report
Rabaul
Papua New Guinea
4.2459°S, 152.1937°E; summit elev. 688 m
All times are local (unless otherwise noted)
Low seismicity, but regular eruptions continue
The activity at Tavurvur continued as in previous months, with regular Vulcanian eruptions mainly emitting dust with few blocks. These events occurred at intervals of ten minutes to one hour; the longer the preceding interval, the more powerful the eruption.
The overall trend of seismic activity remained low, although short periods of increased activity were observed. During the first two weeks, on 5, 6, 8, and 10 September, bands of discontinuous non-harmonic low-amplitude tremor lasted from a few minutes to about an hour. This activity was coupled with a daily average of 10 discrete low-frequency earthquakes. From 13 September, an increase in low-frequency events became more apparent, with the highest number of 128 recorded on the 18th. This increase continued until 23 September, after which the activity declined to previous levels. Event counts recorded at the KPT seismic station, ~1.5 km W from Tavurvur crater, showed an increase during the month. The total number of events was about 675 compared to about 154 in August. RSAM values also showed a general increase. A few high-frequency earthquakes on 3 September were too small to be located, only seismic stations to the N of the Rabaul Harbor Network recorded them.
A water-tube tiltmeter at Sulphur Creek (3.5 km from Tavurvur) showed a 3.5-mm inflation of Tavurvur for the month. This inflation has been continuing ever since a 20-µrad deflation associated with an eruption on 14 March 1997. In other words, eruptions after 14 March 1997 have lacked significant deflation, and since then cumulative inflation has totaled ~30 µrad.
Geologic Background. The low-lying Rabaul caldera on the tip of the Gazelle Peninsula at the NE end of New Britain forms a broad sheltered harbor utilized by what was the island's largest city prior to a major eruption in 1994. The outer flanks of the asymmetrical shield volcano are formed by thick pyroclastic-flow deposits. The 8 x 14 km caldera is widely breached on the east, where its floor is flooded by Blanche Bay and was formed about 1,400 years ago. An earlier caldera-forming eruption about 7,100 years ago is thought to have originated from Tavui caldera, offshore to the north. Three small stratovolcanoes lie outside the N and NE caldera rims. Post-caldera eruptions built basaltic-to-dacitic pyroclastic cones on the caldera floor near the NE and W caldera walls. Several of these, including Vulcan cone, which was formed during a large eruption in 1878, have produced major explosive activity during historical time. A powerful explosive eruption in 1994 occurred simultaneously from Vulcan and Tavurvur volcanoes and forced the temporary abandonment of Rabaul city.
Information Contacts: Patrice de Saint-Ours, Steve Saunders, and Ben Talai, Rabaul Volcano Observatory (RVO), P.O. Box 386, Rabaul, Papua New Guinea.
Sabancaya
Peru
15.787°S, 71.857°W; summit elev. 5960 m
All times are local (unless otherwise noted)
Intermittent gas plumes in early September, some with ash
Activity was monitored during 1-9 September using detailed field observations combined with satellite and aerial remote sensing data. Activity was generally similar to that reported in August. On 6 September a large eruption began. In the preceding days activity had fluctuated. On 1 September, the only activity observed was a small white gas cloud at 0944. Gas clouds were emitted from 0748 until 0942 on 2 September. These predominantly white and gray clouds rose only 200 m above the crater before dissipating. The only exception was a period of ten minutes when brown and dark gray clouds issued from the crater. The sole emission the following day was a small white gas cloud at 1506. On 4 and 5 September small gas emissions were observed from the fumarole on the S side of the cone.
Activity on 6 September was first noted at 0702 when large white and gray gas clouds rose from the whole crater. At 0704 part of the gas column began to sink and move down the upper flanks, obscuring the E-flank ice walls. The gray and brown gas cloud was densest on the S side of the crater and appeared to be expanding as it rose. At 0711, the whiter part of the cloud rose upward while the dark gray portion dropped ash on the N side of the cone. Wind speeds at the summit appeared to increase, and the 400-m-high column began to be pushed N. At 0716 more gas descended the flanks. At 0735 observers on the edge of the easternmost lava flow could smell sulfur.
The main gas emission continued to be from the S side of the crater and at 0740 another cloud descended over halfway down the flanks. At 0743 a large white and dark gray gas cloud emerged from the crater. Ash fell from it onto the upper and mid-slopes. Another large gray, white, and brown plume filled the whole crater at 0746 and billowing to 400 m. At 0749 the plume color changed to brown, yellow, and dark gray. Ash was blown N. New gas clouds emerged from the crater on average every 30 seconds. At 0824 the cloud color returned to white and light gray for a few minutes before it once again became brown, gray, and yellow. The brown portion seemed to contain the ash. Gas once again descended the upper slopes at 0846. Winds at the summit began to pull the top of the plumes apart and by 0854 they were almost flat across the crater.
There was a reduction in gas emission at 1143. Gas continued to periodically descend the upper slopes and ashfall appeared to be mainly on the N slopes. At 1155 a gas cloud descended to mid-slope. The interval between gas emissions grew during the afternoon. After three hours of white- and gray-colored gas clouds, yellow, white, and brown clouds emerged again at 1604. This marked renewal of activity was similar to that in the early morning. Gas originated mainly from the southern fumarole and occasionally descended the upper slopes. Gas clouds rose 500 m and formed a cumulo-like mass. At 1737 there was a big gas release, part of which descended the cone slope while the main cloud rose and curled N over the crater. After this the intensity of the activity from the cone diminished and gas clouds became light gray.
On 7 September a faint brown haze was noted over Sabancaya at 0630. Dust in the atmosphere obscured viewing. Gas clouds were observed at 0643, 0704, 0719, and 1210. Visibility improved around mid-day, and ashfall was observed on the S side of the cone at 1243. At 1652 a small gas cloud descended the upper slopes. From 1740 until dark, gas emissions were continuous, but none were seen the following day. On 9 September observers on a morning flight around the volcano observed light emissions from fumaroles on the N and S crater rims. Fresh sulfur deposits existed on the crater walls. The crater itself was deeper than the year before and the floor could not be seen. Recent ash eruptions had covered the ice walls on the E side.
Geologic Background. Sabancaya, located in the saddle NE of Ampato and SE of Hualca Hualca volcanoes, is the youngest of these volcanic centers and the only one to have erupted in historical time. The oldest of the three, Nevado Hualca Hualca, is of probable late-Pliocene to early Pleistocene age. The name Sabancaya (meaning "tongue of fire" in the Quechua language) first appeared in records in 1595 CE, suggesting activity prior to that date. Holocene activity has consisted of Plinian eruptions followed by emission of voluminous andesitic and dacitic lava flows, which form an extensive apron around the volcano on all sides but the south. Records of historical eruptions date back to 1750.
Information Contacts: Mark Bulmer, Frederick Engle, and Andrew Johnston, Center for Earth and Planetary Studies, National Air and Space Museum, Smithsonian Institution, Washington DC 20560-0315 USA; Guido Salas, Departamento Academico de Geoloia y Geofisica, Universidad Nacional de San Augustin, Arequipa, Perú; Elian Perea, Universidad Nacional de San Augustin, Arequipa, Perú.
San Cristobal (Nicaragua) — October 1998 Cite this Report
San Cristobal
Nicaragua
12.702°N, 87.004°W; summit elev. 1745 m
All times are local (unless otherwise noted)
Heavy rains from hurricane Mitch result in deadly avalanche and lahar from Casita
On 30 October 1998 a disastrous event (called a "mudflow" in newspapers) occurred on the S flank of Casita volcano. According to official reports, the incident killed between 1,560 and 1,680 people, displaced hundreds more, destroyed several towns and settlements, and disrupted the Pan American Highway at numerous bridges. On 11 and 12 November the first scientific team visited the volcano to investigate the disaster. The team examined the summit area on the first day and made a complete traverse of the devastated zone as far S as the Pan American Highway on the second day. This report presents the team's conclusions and provides some recommendations regarding future risks.
Background. Casita is within the Cordillera Maribios, a 70-km-long volcanic chain that extends from the N shore of Lake Managua to the vicinity of Chinandega. Casita is part of the San Cristóbal volcanic complex, which consists of five principal volcanic edifices. The largest volcano in Nicaragua, San Cristóbal lies 4 km WNW of Casita and has exhibited frequent episodes of historical activity; at present it is emitting a vigorous fumarolic plume. For these reasons San Cristóbal has been studied in greater detail.
Casita is a composite volcano with deeply dissected morphology. The top of the volcano consists of a cluster of dacite domes. At its summit is a 1-km diameter crater that could be reached by a road - now impassable - to service telecommunication towers. A set of prominent NE-trending normal faults cut the summit area bounding each side of the crater. Explosion craters on the southern plain are aligned along a conjugate set of fractures trending NW-SE. No historical volcanic activity has been reported at Casita; however, the domes of the summit area are autobrecciated and exhibit strong hydrothermal alteration, which is consistent with low-temperature fumarolic activity.
Meteorological conditions. Hurricane Mitch was a major factor in the disaster. Abnormal rainfall related to Mitch began on 25 October. By 27 October the precipitation reached 100 mm/day and increased continuously to a maximum of ~500 mm/day on 30 October, the day of the avalanche. The total rainfall in October was 1,984 mm. Within three days, precipitation dropped to normal levels. For comparison, the average rainfall for October is 328 mm; thus the rainfall associated with the disaster was more than 6 times the average.
Source zone. The main source of the avalanche was 200 m SW of the volcano summit, and 60 to 80 m below the telecommunication towers. A secondary source was located at the same elevation but 100 m SE of the summit. The rock in this area is a hydrothermally altered and brecciated dacite dome. The principal rupture occurred along a ~500-m-long segment of a NE-trending fault that intersects the summit. A slab measuring ~20 m thick, 60 m high, and 150 m long detached slid down the fault plane that was inclined about 45 degrees SE. The volume of source block for the first rockslide was ~200,000 m3.
Avalanche event. Inhabitants of the lower plains described the sound of the avalanche as similar to a helicopter. Multiple witnesses gave the time as between 1030 and 1100 on 30 October. The main slide mass immediately shattered into its original breccia blocks coated by vein precipitates. The initial SE movement of the avalanche blocks was deflected to the SW along a deep gully oriented parallel to the fault. A smaller part of the avalanche surmounted a small ridge and continued SE towards the village of Argelia.
For the first 2 km the main avalanche remained confined to a narrow valley. The top of the flow was 150 to 250 m wide; its depth, 30 to 60 m. A typical cross section of the peak flow was 7,500 to 9,000 m2. The flow swashed back and forth on its downward course. Super-elevation calculations at locations of overbank flow gave a velocity of ~15 m/s in the upper reaches. Deposits high on the volcano consisted of altered dacite blocks up to meter-size. They contained essentially no matrix, with the finest particles centimeter-sized. The margin of the avalanche was sharp and flying rocks scarred the adjacent trees at 2-3 m height. A few trees were decapitated at heights of several meters.
At a prominent break in slope 2-3 km from the source, large ramps of avalanche materials formed imbricate ridges. Here the deposits, 4-6 m thick, still lacked matrix. The avalanche materials were essentially clast supported. The avalanche scoured blocks of lava from the walls, and up to 10 m deep into clay-rich soil in the base of the valley where it passed.
Lahar runout flow. Soon after the onset of the avalanche, a lahar runout flow, as defined in Scott (1988), initiated from the major accumulation zone of the primary avalanche. In other words, the source of the lahar runout flow formed in the thickest accumulation of debris at the mouth of the avalanche valley, 3 km from the summit and 3 km above the towns of El Porvenir (formerly Augusto Cesar Sandino) and Rolando Rodriguez. The populations of these two towns were respectively 600 and 1,250 according to the last census. The location of the sites of El Porvenir and Rolando Rodriguez could only be found by GPS data; there remained almost no evidence of former human habitation.
Apparently the lahar runout flow resulted from rapid dewatering of the saturated avalanche. The flood surge moved as a hyperconcentrated flow, depositing a thin (~40 cm thick) layer of gravel with some clay matrix on the overbank zones, and transporting meter-size blocks within the incised channels. The peak height of the flood surge was 3 m as it entered El Porvenir, as evidenced by stripped bark from the few standing trees. Nearly all vegetation and soil was removed by the leading edge of the wave. However, a few islands of vegetation were spared on some hills. The width of the flood surge in its upper reaches was ~1,500 m. Assuming an average peak depth of about 3 m, this yields a cross sectional area of flood surge at 4,500 m2.
Casualties and damage. Based on observations in the field, the towns of El Porvenir and Rolando Rodriguez were destroyed beyond recognition. It is unknow how many people survived. Visible cadavers and dead livestock on the overbank had been burned for sanitary reasons. Many other small hamlets, residences, and farms were destroyed.
Future hazard potential. The disaster of 30 October, was produced by the coincidence of two discrete events: extraordinarily heavy rains and an avalanche. Neither of these alone would have produced such extensive damage to the surrounding area. In this respect note that the towns of El Porvenir and Rolando Rodriguez were established only a few decades ago in this area of high geologic risk. To reduce threats for new settlements, comprehensive geologic hazard studies can help identify regions with elevated risk.
In the absence of another episode of heavy rainfall, the new deposits seem to be stable. In fact, there is little mud or silt within the deposits at higher elevations to facilitate remobilization. However, the conditions near the summit that favored the rockslide avalanche still exist. Altered and fractured dacite occurs on steep slopes at a high elevation. Destabilizing events, such as an earthquake or torrential rains, could produce another avalanche in an adjacent area. The probability of such an extreme avalanche seems remote. However, an assessment of the associated hazards and risks should be undertaken.
Reference. Scott, Kevin M., 1988, Origins, behavior, and sedimentology of lahars and lahar-runout flows in the Toutle-Cowlitz River system: U.S.G.S. Professional Paper 1447-A, 74 p.
Geologic Background. The San Cristóbal volcanic complex, consisting of five principal volcanic edifices, forms the NW end of the Marrabios Range. The symmetrical 1745-m-high youngest cone, named San Cristóbal (also known as El Viejo), is Nicaragua's highest volcano and is capped by a 500 x 600 m wide crater. El Chonco, with several flank lava domes, is located 4 km W of San Cristóbal; it and the eroded Moyotepe volcano, 4 km NE of San Cristóbal, are of Pleistocene age. Volcán Casita, containing an elongated summit crater, lies immediately east of San Cristóbal and was the site of a catastrophic landslide and lahar in 1998. The Plio-Pleistocene La Pelona caldera is located at the eastern end of the complex. Historical eruptions from San Cristóbal, consisting of small-to-moderate explosive activity, have been reported since the 16th century. Some other 16th-century eruptions attributed to Casita volcano are uncertain and may pertain to other Marrabios Range volcanoes.
Information Contacts: Michael F. Sheridan, SUNY, Buffalo, New York; Claus Siebe, UNAM, Mexico; Christophe Bonnard, EPFL Lausanne, Switzerland; Wilfried Strauch; Martha Navarro, Jorge Cruz Calero, and Nelson Buitrago Trujillo, INETER, Nicaragua.
Sheveluch (Russia) — October 1998 Cite this Report
Sheveluch
Russia
56.653°N, 161.36°E; summit elev. 3283 m
All times are local (unless otherwise noted)
A few minor gas-and-steam plumes in October
Seismicity remained generally at background levels during October. During 1, 16, and 23 October plumes were seen rising 200 m above the volcano. On 19 and 24 October, gas-and-steam plumes rose 100 m above the volcano. No plumes were seen on 2, 3, and 9 October. During other days the summit was obscured by cloud. The level-of-concern color code remained green.
Geologic Background. The high, isolated massif of Sheveluch volcano (also spelled Shiveluch) rises above the lowlands NNE of the Kliuchevskaya volcano group. The 1,300 km3 andesitic volcano is one of Kamchatka's largest and most active volcanic structures, with at least 60 large eruptions during the Holocene. The summit of roughly 65,000-year-old Stary Shiveluch is truncated by a broad 9-km-wide late-Pleistocene caldera breached to the south. Many lava domes occur on its outer flanks. The Molodoy Shiveluch lava dome complex was constructed during the Holocene within the large open caldera; Holocene lava dome extrusion also took place on the flanks of Stary Shiveluch. Widespread tephra layers from these eruptions have provided valuable time markers for dating volcanic events in Kamchatka. Frequent collapses of dome complexes, most recently in 1964, have produced debris avalanches whose deposits cover much of the floor of the breached caldera.
Information Contacts: Olga Chubarova, Kamchatka Volcanic Eruptions Response Team (KVERT), Institute of Volcanic Geology and Geochemistry, Piip Ave. 9, Petropavlovsk-Kamchatsky, 683006, Russia; Tom Miller, Alaska Volcano Observatory (AVO), a cooperative program of a) U.S. Geological Survey, 4200 University Drive, Anchorage, AK 99508-4667, USA (URL: http://www.avo.alaska.edu/), b) Geophysical Institute, University of Alaska, PO Box 757320, Fairbanks, AK 99775-7320, USA, and c) Alaska Division of Geological & Geophysical Surveys, 794 University Ave., Suite 200, Fairbanks, AK 99709, USA.
Stromboli (Italy) — October 1998 Cite this Report
Stromboli
Italy
38.789°N, 15.213°E; summit elev. 924 m
All times are local (unless otherwise noted)
Larger explosions in January, August, and September 1998
Moderate activity prevailed at Stromboli from January to May 1997 (BGVN 22:03). During this period there was a slight decrease in tremor intensity and a slight increase in the number of recorded events (figure 56). Events exceeding the saturation level of the summit seismic station numbered fewer than 10% of the total recorded.
There was a marked increase in the total number of events during June-July 1997, sometimes in excess of 300 per day. Following a month-long lapse, an even larger long-term increase began in September that continued until November 1997. There were several days in this interval when triggering of the seismic station was almost continuous and tremor intensity reached high values, behavior that usually coincided with continuous spattering at the vents. No seismic data were recorded between 24 November 1997 and 9 January 1998. Activity had returned to moderate levels by the time seismic data acquisition resumed on 10 January 1998 (figure 56). The number of daily events rapidly decreased, as did tremor intensity.
At 1130 on 16 January 1998, a strong explosion in the crater area was similar to others at Stromboli during the last few years; one comparable event occurred on 4 September 1996 (BGVN 22:03). Such explosions are not a danger to the villages of Stromboli and Ginostra (figure 57), but they may be dangerous for tourists visiting the summit because bombs easily reach the usual observation points. Another risk is that fires, started by incandescent bombs, may spread in the vegetation. In the case of the 16 January eruption, bad weather prevented tourists from climbing the volcano and rain extinguished any wildfires.
A new rise in seismicity began a few days after the explosion. A peak was reached during 16-20 February; on 19 February, 405 events were recorded, and on 20 February tremor intensity was high and 43 saturating events were noted. After this increase, activity decreased steadily with only a few fluctuations until the end of April. The total number of events recorded during the decrease was sometimes
During May-June seismic activity increased. During July two sharp drops in the level of activity were observed: the number of events did not exceed 80 per day during 1-3 July, and went below 50 per day during 22-24 July. Tremor intensity reached the minimum of the year on 22 July. There was a slight upturn in August.
At 1726 on 23 August, another powerful explosion occurred at the craters. The strong blast was heard throughout the island, and a column of ash and lapilli shot over the craters. Incandescent bombs fell over a vast area towards Vallonazzo, Labronzo, and Forgia Vecchia. At least one other explosion followed. Several fires started in vegetation on the upper slopes; the largest one, near Forgia Vecchia, was not extinguished until the next day. Fortunately, although a high number of tourists were on the island, no one was hurt. A dark ash column was eventually replaced by a large, light ash cloud. Small lapilli fell in Ginostra. Bombs were found on the tourist path down to 750 m elevation, and in other directions bombs fell to 500 m. Authorities immediately blocked public access to the upper part of the volcano. The explosion also caused significant morphological changes to the rim of Crater 1 towards Semaforo Labronzo.
Another strong explosion, perhaps more energetic than that of 23 August, happened at 1914 on 8 September. A considerable atmospheric shock wave was reported at the village of Stromboli, and broken windows were reported near San Bartolo. Ash and small lapilli fell near Ginostra and several bush fires were started by bombs on the volcano's slopes. Unfortunately, the seismic station was not operational at the time due to a technical problem.
Stromboli, a small island N of Sicily, has been in almost continuous eruption for over 2,000 years. It is the namesake for small Strombolian explosions, which hurl incandescent scoriae above the crater rim several times a day, with infrequent larger eruptions.
Geologic Background. Spectacular incandescent nighttime explosions at Stromboli have long attracted visitors to the "Lighthouse of the Mediterranean" in the NE Aeolian Islands. This volcano has lent its name to the frequent mild explosive activity that has characterized its eruptions throughout much of historical time. The small island is the emergent summit of a volcano that grew in two main eruptive cycles, the last of which formed the western portion of the island. The Neostromboli eruptive period took place between about 13,000 and 5,000 years ago. The active summit vents are located at the head of the Sciara del Fuoco, a prominent scarp that formed about 5,000 years ago due to a series of slope failures which extends to below sea level. The modern volcano has been constructed within this scarp, which funnels pyroclastic ejecta and lava flows to the NW. Essentially continuous mild Strombolian explosions, sometimes accompanied by lava flows, have been recorded for more than a millennium.
Information Contacts: Roberto Carniel, Dipartimento di Georisorse e Territorio, Universitá di Udine, Via Cotonificio, 114 I-33100 Udine; Jürg Alean, Kantonsschule Zürcher Unterland, CH-8180 Bülach, Switzerland.
Ulawun (Papua New Guinea) — October 1998 Cite this Report
Ulawun
Papua New Guinea
5.05°S, 151.33°E; summit elev. 2334 m
All times are local (unless otherwise noted)
White vapor plumes throughout September
A white vapor plume was present throughout September; it appeared to vary in thickness, probably as a result of atmospheric conditions. Observed seismicity was low to moderate. An aerial inspection on 1 October, as part of the Ulawun Decade Volcano workshop, showed the summit crater to be open, ~150-200 m in diameter, with vertical sides descending at least 50 m before being lost in thick white fume.
Geologic Background. The symmetrical basaltic-to-andesitic Ulawun stratovolcano is the highest volcano of the Bismarck arc, and one of Papua New Guinea's most frequently active. The volcano, also known as the Father, rises above the N coast of the island of New Britain across a low saddle NE of Bamus volcano, the South Son. The upper 1,000 m is unvegetated. A prominent E-W escarpment on the south may be the result of large-scale slumping. Satellitic cones occupy the NW and E flanks. A steep-walled valley cuts the NW side, and a flank lava-flow complex lies to the south of this valley. Historical eruptions date back to the beginning of the 18th century. Twentieth-century eruptions were mildly explosive until 1967, but after 1970 several larger eruptions produced lava flows and basaltic pyroclastic flows, greatly modifying the summit crater.
Information Contacts: Patrice de Saint-Ours, Steve Saunders, and Ben Talai, RVO.
Whakaari/White Island (New Zealand) — October 1998 Cite this Report
Whakaari/White Island
New Zealand
37.52°S, 177.18°E; summit elev. 294 m
All times are local (unless otherwise noted)
Minor gas-and-ash eruptions in August and October
A minor eruption at White Island in August (BGVN 23:08), which was investigated by volcanologists from the Institute of Geological and Nuclear Sciences (IGNS), persisted until late in September. Analysis of samples collected during the visits continued through September. Eruptive activity recommenced in late October, prompting another investigative visit on 2 November. The following reports is summarized from IGNS Science Alert Bulletins.
A new active vent in the NW corner of the 1978-1990 Crater Complex produced intermittent weak ash emissions during late August and early September that rose 100-1,500 m above the island. September ash contained more fresh volcanic glass than previous samples, but this failed to give clear indication of new magma being the source because the eruptions came from a crusted-over magma body.
Weak volcanic tremor on 10-11 September appeared on seismic records and impacted estimates of the Real-Time Seismic Amplitude (RSAM). The RSAM outputs a number of 'counts' over set time intervals. The higher the counts the stronger the volcanic tremor signal and the stronger the volcanic activity. The RSAM count level in mid-September was about 12-13, on a scale of several thousand, having risen from the typical background of 2-3 counts. There were no reports of ash after 18 September and seismicity was reduced to background levels. The Alert Level was reduced from 2 to 1 on 29 September.
Minor eruptive activity recommenced on 24 October. Small amounts of ash were emitted on 24-25 October, and on 31 October a steam-and-ash column rose in calm conditions to 1,500-1,600 m above the volcano. Weak volcanic tremor reappeared at about the same time as the ash eruptions recommenced; however seismicity remained low.
A surveillance visit was made on 2 November to assess the activity, conduct a deformation survey, and collect ash and gas samples. The level of activity varied during this visit, but the most energetic activity observed was not sufficient to raise the Alert Level. The active vent at the base of the NW wall of the 1978-1990 crater had grown slightly since August. A very weak ash-charged reddish-gray convecting plume was emitted. Occasional yellowish hues were present in the plume, consistent with the periodic eruption of hydrothermal sulfur from the vent. The maximum temperature measured in the ash column was 451°C.
Eruptive activity over previous days had deposited 15 mm of fine dark gray ash at the crater rim. Examination of the ash indicated no change in character from that of the July-August eruptions. Ground-deformation surveys showed a consistent trend of minor deflation across the main crater floor, with the largest changes (20-30 mm) near the crater rim. However, fumarole temperatures had increased nominally since August 31. Fumarole ##1 was at 113°C (up from 101°C), was moderately dry, and had molten sulfur in the orifice (indicating temperatures in excess of 119°C in the vent). Donald Mound continued to discharge only low-pressure steam from diffuse areas of steaming ground, and the cracks around Peg M continued to discharge steam close to the boiling point. Maximum temperature at Noisy Nellie was 140°C (up from 126°C), whereas pressures were similar to those observed in August. Fumarole 13a was 111°C, a slight increase from August (105°C). The plume from the island appeared to carry a heavier SO2 burden than observed in August.
The uninhabited 2 x 2.4 km White Island is the emergent summit of a 16 x 18 km submarine volcano. The island consists of two overlapping stratovolcanoes; the summit crater appears to be breached to the SE because the shoreline corresponds to the level of several notches in the SE crater wall. Intermittent steam and tephra eruptions have occurred throughout the short historical period, but its activity also forms a prominent part of Maori legends.
Geologic Background. The uninhabited Whakaari/White Island is the 2 x 2.4 km emergent summit of a 16 x 18 km submarine volcano in the Bay of Plenty about 50 km offshore of North Island. The island consists of two overlapping andesitic-to-dacitic stratovolcanoes. The SE side of the crater is open at sea level, with the recent activity centered about 1 km from the shore close to the rear crater wall. Volckner Rocks, sea stacks that are remnants of a lava dome, lie 5 km NW. Descriptions of volcanism since 1826 have included intermittent moderate phreatic, phreatomagmatic, and Strombolian eruptions; activity there also forms a prominent part of Maori legends. The formation of many new vents during the 19th and 20th centuries caused rapid changes in crater floor topography. Collapse of the crater wall in 1914 produced a debris avalanche that buried buildings and workers at a sulfur-mining project. Explosive activity in December 2019 took place while tourists were present, resulting in many fatalities. The official government name Whakaari/White Island is a combination of the full Maori name of Te Puia o Whakaari ("The Dramatic Volcano") and White Island (referencing the constant steam plume) given by Captain James Cook in 1769.
Information Contacts: B.J. Scott, Institute of Geological and Nuclear Sciences (IGNS), Private Bag 2000, Wairakei, New Zealand.