Recently Published Bulletin Reports
Kadovar (Papua New Guinea) An ash plume and weak thermal anomaly during May 2023
San Miguel (El Salvador) Small gas-and-ash explosions during March and May 2023
Ebeko (Russia) Continued explosions, ash plumes, and ashfall during October 2022-May 2023
Home Reef (Tonga) Discolored plumes continued during November 2022-April 2023
Semisopochnoi (United States) Occasional explosions, ash deposits, and gas-and-steam plumes during December 2022-May 2023
Ambae (Vanuatu) New lava flow, ash plumes, and sulfur dioxide plumes during February-May 2023
Ibu (Indonesia) Daily ash explosions continue, along with thermal anomalies in the crater, October 2022-May 2023
Dukono (Indonesia) Continuing ash emissions, SO2 plumes, and thermal signals during October 2022-May 2023
Sabancaya (Peru) Explosions, gas-and-ash plumes, and thermal activity persist during November 2022-April 2023
Sheveluch (Russia) Significant explosions destroyed part of the lava-dome complex during April 2023
Bezymianny (Russia) Explosions, ash plumes, lava flows, and avalanches during November 2022-April 2023
Chikurachki (Russia) New explosive eruption during late January-early February 2023
Kadovar (Papua New Guinea) — June 2023  Cite this Report
Kadovar
Papua New Guinea
3.608°S, 144.588°E; summit elev. 365 m
All times are local (unless otherwise noted)
An ash plume and weak thermal anomaly during May 2023
Kadovar is a 2-km-wide island that is the emergent summit of a Bismarck Sea stratovolcano. It lies off the coast of New Guinea, about 25 km N of the mouth of the Sepik River. Prior to an eruption that began in 2018, a lava dome formed the high point of the volcano, filling an arcuate landslide scarp open to the S. Submarine debris-avalanche deposits occur to the S of the island. The current eruption began in January 2018 and has comprised lava effusion from vents at the summit and at the E coast; more recent activity has consisted of ash plumes, weak thermal activity, and gas-and-steam plumes (BGVN 48:02). This report covers activity during February through May 2023 using information from the Darwin Volcanic Ash Advisory Center (VAAC) and satellite data.
Activity during the reporting period was relatively low and mainly consisted of white gas-and-steam plumes that were visible in natural color satellite images on clear weather days (figure 67). According to a Darwin VAAC report, at 2040 on 6 May an ash plume rose to 4.6 km altitude and drifted W; by 2300 the plume had dissipated. MODIS satellite instruments using the MODVOLC thermal algorithm detected a single thermal hotspot on the SE side of the island on 7 May. Weak thermal activity was also detected in a satellite image on the E side of the island on 14 May, accompanied by a white gas-and-steam plume that drifted SE (figure 68).
Geologic Background. The 2-km-wide island of Kadovar is the emergent summit of a Bismarck Sea stratovolcano of Holocene age. It is part of the Schouten Islands, and lies off the coast of New Guinea, about 25 km N of the mouth of the Sepik River. Prior to an eruption that began in 2018, a lava dome formed the high point of the andesitic volcano, filling an arcuate landslide scarp open to the south; submarine debris-avalanche deposits occur in that direction. Thick lava flows with columnar jointing forms low cliffs along the coast. The youthful island lacks fringing or offshore reefs. A period of heightened thermal phenomena took place in 1976. An eruption began in January 2018 that included lava effusion from vents at the summit and at the E coast.
Information Contacts: Darwin Volcanic Ash Advisory Centre (VAAC), Bureau of Meteorology, Northern Territory Regional Office, PO Box 40050, Casuarina, NT 0811, Australia (URL: http://www.bom.gov.au/info/vaac/); Hawai'i Institute of Geophysics and Planetology (HIGP) - MODVOLC Thermal Alerts System, School of Ocean and Earth Science and Technology (SOEST), Univ. of Hawai'i, 2525 Correa Road, Honolulu, HI 96822, USA (URL: http://modis.higp.hawaii.edu/); Copernicus Browser, Copernicus Data Space Ecosystem, European Space Agency (URL: https://dataspace.copernicus.eu/browser/).
San Miguel (El Salvador) — June 2023 Cite this Report
San Miguel
El Salvador
13.434°N, 88.269°W; summit elev. 2130 m
All times are local (unless otherwise noted)
Small gas-and-ash explosions during March and May 2023
San Miguel in El Salvador is a broad, deep crater complex that has been frequently modified by eruptions recorded since the early 16th century and consists of the summit known locally as Chaparrastique. Flank eruptions have produced lava flows that extended to the N, NE, and SE during the 17-19th centuries. The most recent activity has consisted of minor ash eruptions from the summit crater. The current eruption period began in November 2022 and has been characterized by frequent phreatic explosions, gas-and-ash emissions, and sulfur dioxide plumes (BGVN 47:12). This report describes small gas-and-ash explosions during December 2022 through May 2023 based on special reports from the Ministero de Medio Ambiente y Recursos Naturales (MARN).
Activity has been relatively low since the last recorded explosions on 29 November 2022. Seismicity recorded by the San Miguel Volcano Station (VSM) located on the N flank at 1.7 km elevation had decreased by 7 December. Sulfur dioxide gas measurements taken with DOAS (Differential Optical Absorption Spectroscopy) mobile equipment were below typical previously recorded values: 300 tons per day (t/d). During December, small explosions were recorded by the seismic network and manifested as gas-and-steam emissions.
Gas-and-ash explosions in the crater occurred during January 2023, which were recorded by the seismic network. Sulfur dioxide values remained low, between 300-400 t/d through 10 March. At 0817 on 14 January a gas-and-ash emission was visible in webcam images, rising just above the crater rim. Some mornings during February, small gas-and-steam plumes were visible in the crater. On 7 March at 2252 MARN noted an increase in degassing from the central crater; gas emissions were constantly observed through the early morning hours on 8 March. During the early morning of 8 March through the afternoon on 9 March, 12 emissions were registered, some accompanied by ash. The last gas-and-ash emission was recorded at 1210 on 9 March; very fine ashfall was reported in El Tránsito (10 km S), La Morita (6 km W), and La Piedrita (3 km W). The smell of sulfur was reported in Piedra Azul (5 km SW). On 16 March MARN reported that gas-and-steam emissions decreased.
Low degassing and very low seismicity were reported during April; no explosions have been detected between 9 March and 27 May. The sulfur dioxide emissions remained between 350-400 t/d; during 13-20 April sulfur dioxide values fluctuated between 30-300 t/d. Activity remained low through most of May; on 23 May seismicity increased. An explosion was detected at 1647 on 27 May generated a gas-and-ash plume that rose 700 m high (figure 32); a decrease in seismicity and gas emissions followed. The DOAS station installed on the W flank recorded sulfur dioxide values that reached 400 t/d on 27 May; subsequent measurements showed a decrease to 268 t/d on 28 May and 100 t/d on 29 May.
Geologic Background. The symmetrical cone of San Miguel, one of the most active volcanoes in El Salvador, rises from near sea level to form one of the country's most prominent landmarks. A broad, deep, crater complex that has been frequently modified by eruptions recorded since the early 16th century caps the truncated unvegetated summit, also known locally as Chaparrastique. Flanks eruptions of the basaltic-andesitic volcano have produced many lava flows, including several during the 17th-19th centuries that extended to the N, NE, and SE. The SE-flank flows are the largest and form broad, sparsely vegetated lava fields crossed by highways and a railroad skirting the base of the volcano. Flank vent locations have migrated higher on the edifice during historical time, and the most recent activity has consisted of minor ash eruptions from the summit crater.
Information Contacts: Ministero de Medio Ambiente y Recursos Naturales (MARN), Km. 5½ Carretera a Nueva San Salvador, Avenida las Mercedes, San Salvador, El Salvador (URL: http://www.snet.gob.sv/ver/vulcanologia).
Ebeko
Russia
50.686°N, 156.014°E; summit elev. 1103 m
All times are local (unless otherwise noted)
Continued explosions, ash plumes, and ashfall during October 2022-May 2023
Ebeko, located on the N end of Paramushir Island in the Kuril Islands, consists of three summit craters along a SSW-NNE line at the northern end of a complex of five volcanic cones. Eruptions date back to the late 18th century and have been characterized as small-to-moderate explosions from the summit crater, accompanied by intense fumarolic activity. The current eruption period began in June 2022 and has recently consisted of frequent explosions, ash plumes, and thermal activity (BGVN 47:10). This report covers similar activity during October 2022 through May 2023, based on information from the Kamchatka Volcanic Eruptions Response Team (KVERT) and satellite data.
Activity during October consisted of explosive activity, ash plumes, and occasional thermal anomalies. Visual data by volcanologists from Severo-Kurilsk showed explosions producing ash clouds up to 2.1-3 km altitude which drifted E, N, NE, and SE during 1-8, 10, 16, and 18 October. KVERT issued several Volcano Observatory Notices for Aviation (VONA) on 7, 13-15, and 27 October 2022, stating that explosions generated ash plumes that rose to 2.3-4 km altitude and drifted 5 km E, NE, and SE. Ashfall was reported in Severo-Kurilsk (Paramushir Island, about 7 km E) on 7 and 13 October. Satellite data showed a thermal anomaly over the volcano on 15-16 October. Visual data showed ash plumes rising to 2.5-3.6 km altitude on 22, 25-29, and 31 October and moving NE due to constant explosions.
Similar activity continued during November, with explosions, ash plumes, and ashfall occurring. KVERT issued VONAs on 1-2, 4, 6-7, 9, 13, and 16 November that reported explosions and resulting ash plumes that rose to 1.7-3.6 km altitude and drifted 3-5 km SE, ESE, E, and NE. On 1 November ash plumes extended as far as 110 km SE. On 5, 8, 12, and 24-25 November explosions and ash plumes rose to 2-3.1 km altitude and drifted N and E. Ashfall was observed in Severo-Kurilsk on 7 and 16 November. A thermal anomaly was visible during 1-4, 16, and 20 November. Explosions during 26 November rose as high as 2.7 km altitude and drifted NE (figure 45).
Explosions and ash plumes continued to occur in December. During 1-2 and 4 December volcanologists from Severo-Kurilsk observed explosions that sent ash to 1.9-2.5 km altitude and drifted NE and SE (figure 46). VONAs were issued on 5, 9, and 16 December reporting that explosions generated ash plumes rising to 1.9 km, 2.6 km, and 2.4 km altitude and drifted 5 km SE, E, and NE, respectively. A thermal anomaly was visible in satellite imagery on 16 December. On 18 and 27-28 December explosions produced ash plumes that rose to 2.5 km altitude and drifted NE and SE. On 31 December an ash plume rose to 2 km altitude and drifted NE.
Explosions continued during January 2023, based on visual observations by volcanologists from Severo-Kurilsk. During 1-7 January explosions generated ash plumes that rose to 4 km altitude and drifted NE, E, W, and SE. According to VONAs issued by KVERT on 2, 4, 10, and 23 January, explosions produced ash plumes that rose to 2-4 km altitude and drifted 5 km N, NE, E, and ENE; the ash plume that rose to 4 km altitude occurred on 10 January (figure 47). Satellite data showed a thermal anomaly during 3-4, 10, 13, 16, 21, 22, and 31 January. KVERT reported that an ash cloud on 4 January moved 12 km NE. On 6 and 9-11 January explosions sent ash plumes to 4.5 km altitude and drifted W and ESE. On 13 January an ash plume rose to 3 km altitude and drifted SE. During 20-24 January ash plumes from explosions rose to 3.7 km altitude and drifted SE, N, and NE. On 21 January the ash plume drifted as far as 40 km NE. During 28-29 and 31 January and 1 February ash plumes rose to 4 km altitude and drifted NE.
During February, explosions, ash plumes, and ashfall were reported. During 1, 4-5 and 7-8 February explosions generated ash plumes that rose to 4.5 km altitude and drifted E and NE; ashfall was observed on 5 and 8 February. On 6 February an explosion produced an ash plume that rose to 3 km altitude and drifted 7 km E, causing ashfall in Severo-Kurilsk. A thermal anomaly was visible in satellite data on 8, 9, 13, and 21 February. Explosions on 9 and 12-13 February produced ash plumes that rose to 4 km altitude and drifted E and NE; the ash cloud on 12 February extended as far as 45 km E. On 22 February explosions sent ash to 3 km altitude that drifted E. During 24 and 26-27 February ash plumes rose to 4 km altitude and drifted E. On 28 February an explosion sent ash to 2.5-3 km altitude and drifted 5 km E; ashfall was observed in Severo-Kurilsk.
Activity continued during March; visual observations showed that explosions generated ash plumes that rose to 3.6 km altitude on 3, 5-7, and 9-12 March and drifted E, NE, and NW. Thermal anomalies were visible on 10, 13, and 29-30 March in satellite imagery. On 18, 21-23, 26, and 29-30 March explosions produced ash plumes that rose to 2.8 km altitude and drifted NE and E; the ash plumes during 22-23 March extended up to 76 km E. A VONA issued on 21 March reported an explosion that produced an ash plume that rose to 2.8 km altitude and drifted 5 km E. Another VONA issued on 23 March reported that satellite data showed an ash plume rising to 3 km altitude and drifted 14 km E.
Explosions during April continued to generate ash plumes. On 1 and 4 April an ash plume rose to 2.8-3.5 km altitude and drifted SE and NE. A thermal anomaly was visible in satellite imagery during 1-6 April. Satellite data showed ash plumes and clouds rising to 2-3 km altitude and drifting up to 12 km SW and E on 3 and 6 April (figure 48). KVERT issued VONAs on 3, 5, 14, 16 April describing explosions that produced ash plumes rising to 3 km, 3.5 km, 3.5 km, and 3 km altitude and drifting 5 km S, 5 km NE and SE, 72 km NNE, and 5 km NE, respectively. According to satellite data, the resulting ash cloud from the explosion on 14 April was 25 x 7 km in size and drifted 72-104 km NNE during 14-15 April. According to visual data by volcanologists from Severo-Kurilsk explosions sent ash up to 3.5 km altitude that drifted NE and E during 15-16, 22, 25-26, and 29 April.
The explosive eruption continued during May. Explosions during 3-4, 6-7, and 9-10 May generated ash plumes that rose to 4 km altitude and drifted SW and E. Satellite data showed a thermal anomaly on 3, 9, 13-14, and 24 May. During 12-16, 23-25, and 27-28 May ash plumes rose to 3.5 km altitude and drifted in different directions due to explosions. Two VONA notices were issued on 16 and 25 May, describing explosions that generated ash plumes rising to 3 km and 3.5 km altitude, respectively and extending 5 km E. The ash cloud on 25 May drifted 75 km SE.
Thermal activity in the summit crater, occasionally accompanied by ash plumes and ash deposits on the SE and E flanks due to frequent explosions, were visible in infrared and true color satellite images (figure 49).
Geologic Background. The flat-topped summit of the central cone of Ebeko volcano, one of the most active in the Kuril Islands, occupies the northern end of Paramushir Island. Three summit craters located along a SSW-NNE line form Ebeko volcano proper, at the northern end of a complex of five volcanic cones. Blocky lava flows extend west from Ebeko and SE from the neighboring Nezametnyi cone. The eastern part of the southern crater contains strong solfataras and a large boiling spring. The central crater is filled by a lake about 20 m deep whose shores are lined with steaming solfataras; the northern crater lies across a narrow, low barrier from the central crater and contains a small, cold crescentic lake. Historical activity, recorded since the late-18th century, has been restricted to small-to-moderate explosive eruptions from the summit craters. Intense fumarolic activity occurs in the summit craters, on the outer flanks of the cone, and in lateral explosion craters.
Information Contacts: Kamchatka Volcanic Eruptions Response Team (KVERT), Far Eastern Branch, Russian Academy of Sciences, 9 Piip Blvd., Petropavlovsk-Kamchatsky, 683006, Russia (URL: http://www.kscnet.ru/ivs/kvert/); MIROVA (Middle InfraRed Observation of Volcanic Activity), a collaborative project between the Universities of Turin and Florence (Italy) supported by the Centre for Volcanic Risk of the Italian Civil Protection Department (URL: http://www.mirovaweb.it/); Copernicus Browser, Copernicus Data Space Ecosystem, European Space Agency (URL: https://dataspace.copernicus.eu/browser/).
Home Reef
Tonga
18.992°S, 174.775°W; summit elev. -10 m
All times are local (unless otherwise noted)
Discolored plumes continued during November 2022-April 2023
Home Reef is a submarine volcano located in the central Tonga islands between Lateiki (Metis Shoal) and Late Island. The first recorded eruption occurred in the mid-19th century, when an ephemeral island formed. An eruption in 1984 produced a 12-km-high eruption plume, a large volume of floating pumice, and an ephemeral island 500 x 1,500 m wide, with cliffs 30-50 m high that enclosed a water-filled crater. Another island-forming eruption in 2006 produced widespread pumice rafts that drifted as far as Australia; by 2008 the island had eroded below sea level. The previous eruption occurred during October 2022 and was characterized by a new island-forming eruption, lava effusion, ash plumes, discolored water, and gas-and-steam plumes (BGVN 47:11). This report covers discolored water plumes during November 2022 through April 2023 using satellite data.
Discolored plumes continued during the reporting period and were observed in true color satellite images on clear weather days. Satellite images show light green-yellow discolored water extending W on 8 and 28 November 2022 (figure 31), and SW on 18 November. Light green-yellow plumes extended W on 3 December, S on 13 December, SW on 18 December, and W and S on 23 December (figure 31). On 12 January 2023 discolored green-yellow plumes extended to the NE, E, SE, and N. The plume moved SE on 17 January and NW on 22 January. Faint discolored water in February was visible moving NE on 1 February. A discolored plume extended NW on 8 and 28 March and NW on 13 March (figure 31). During April, clear weather showed green-blue discolored plumes moving S on 2 April, W on 7 April, and NE and S on 12 April. A strong green-yellow discolored plume extended E and NE on 22 April for several kilometers (figure 31).
Geologic Background. Home Reef, a submarine volcano midway between Metis Shoal and Late Island in the central Tonga islands, was first reported active in the mid-19th century, when an ephemeral island formed. An eruption in 1984 produced a 12-km-high eruption plume, large amounts of floating pumice, and an ephemeral 500 x 1,500 m island, with cliffs 30-50 m high that enclosed a water-filled crater. In 2006 an island-forming eruption produced widespread dacitic pumice rafts that drifted as far as Australia. Another island was built during a September-October 2022 eruption.
Information Contacts: Copernicus Browser, Copernicus Data Space Ecosystem, European Space Agency (URL: https://dataspace.copernicus.eu/browser/).
Semisopochnoi (United States) — June 2023 Cite this Report
Semisopochnoi
United States
51.93°N, 179.58°E; summit elev. 1221 m
All times are local (unless otherwise noted)
Occasional explosions, ash deposits, and gas-and-steam plumes during December 2022-May 2023
Semisopochnoi is located in the western Aleutians, is 20-km-wide at sea level, and contains an 8-km-wide caldera. The three-peaked Mount Young (formerly Cerberus) was constructed within the caldera during the Holocene. Each of these peaks contains a summit crater; the lava flows on the N flank appear younger than those on the S side. The current eruption period began in early February 2021 and has more recently consisted of intermittent explosions and ash emissions (BGVN 47:12). This report updates activity during December 2022 through May 2023 using daily, weekly, and special reports from the Alaska Volcano Observatory (AVO). AVO monitors the volcano using local seismic and infrasound sensors, satellite data, web cameras, and remote infrasound and lightning networks.
Activity during most of December 2022 was relatively quiet; according to AVO no eruptive or explosive activity was observed since 7 November 2022. Intermittent tremor and occasional small earthquakes were observed in geophysical data. Continuous gas-and-steam emissions were observed from the N crater of Mount Young in webcam images on clear weather days (figure 25). On 24 December, there was a slight increase in earthquake activity and several small possible explosion signals were detected in infrasound data. Eruptive activity resumed on 27 December at the N crater of Mount Young; AVO issued a Volcano Activity Notice (VAN) that reported minor ash deposits on the flanks of Mount Young that extended as far as 1 km from the vent, according to webcam images taken during 27-28 December (figure 26). No ash plumes were observed in webcam or satellite imagery, but a persistent gas-and-steam plume that might have contained some ash rose to 1.5 km altitude. As a result, AVO raised the Aviation Color Code (ACC) to Orange (the second highest level on a four-color scale) and the Volcano Alert Level (VAL) to Watch (the second highest level on a four-level scale). Possible explosions were detected during 21 December 2022 through 1 January 2023 and seismic tremor was recorded during 30-31 December.
During January 2023 eruptive activity continued at the active N crater of Mount Young. Minor ash deposits were observed on the flanks, extending about 2 km SSW, based on webcam images from 1 and 3 January. A possible explosion occurred during 1-2 January based on elevated seismicity recorded on local seismometers and an infrasound signal recorded minutes later by an array at Adak. Though no ash plumes were observed in webcam or satellite imagery, a persistent gas-and-steam plume rose to 1.5 km altitude that might have carried minor traces of ash. Ash deposits were accompanied by periods of elevated seismicity and infrasound signals from the local geophysical network, which AVO reported were likely due to weak explosive activity. Low-level explosive activity was also detected during 2-3 January, with minor gas-and-steam emissions and a new ash deposit that was visible in webcam images. Low-level explosive activity was detected in geophysical data during 4-5 January, with elevated seismicity and infrasound signals observed on local stations. Volcanic tremor was detected during 7-9 January and very weak explosive activity was detected in seismic and infrasound data on 9 January. Weak seismic and infrasound signals were recorded on 17 January, which indicated minor explosive activity, but no ash emissions were observed in clear webcam images; a gas-and-steam plume continued to rise to 1.5 km altitude. During 29-30 January, ash deposits near the summit were observed on fresh snow, according to webcam images.
The active N cone at Mount Young continued to produce a gas-and-steam plume during February, but no ash emissions or explosive events were detected. Seismicity remained elevated with faint tremor during early February. Gas-and-steam emissions from the N crater were observed in clear webcam images on 11-13 and 16 February; no explosive activity was detected in seismic, infrasound, or satellite data. Seismicity has also decreased, with no significant seismic tremor observed since 25 January. Therefore, the ACC was lowered to Yellow (the second lowest level on a four-color scale) and the VAL was lowered to Advisory (the second lowest level on a four-color scale) on 22 February.
Gas-and-steam emissions persisted during March from the N cone of Mount Young, based on clear webcam images. A few brief episodes of weak tremor were detected in seismic data, although seismicity decreased over the month. A gas-and-steam plume detected in satellite data extended 150 km on 18 March. Low-level ash emissions from the N cone at Mount Young were observed in several webcam images during 18-19 March, in addition to small explosions and volcanic tremor. The ACC was raised to Orange and the VAL increased to Watch on 19 March. A small explosion was detected in seismic and infrasound data on 21 March.
Low-level unrest continued during April, although cloudy weather often obscured views of the summit; periods of seismic tremor and local earthquakes were recorded. During 3-4 April a gas-and-steam plume was visible traveling more than 200 km overnight; no ash was evident in the plume, according to AVO. A gas-and-steam plume was observed during 4-6 April that extended 400 km but did not seem to contain ash. Small explosions were detected in seismic and infrasound data on 5 April. Occasional clear webcam images showed continuing gas-and-steam emissions rose from Mount Young, but no ash deposits were observed on the snow. On 19 April small explosions and tremor were detected in seismic and infrasound data. A period of seismic tremor was detected during 22-25 April, with possible weak explosions on 25 April. Ash deposits were visible near the crater rim, but it was unclear if these deposits were recent or due to older deposits.
Occasional small earthquakes were recorded during May, but there were no signs of explosive activity seen in geophysical data. Gas-and-steam emissions continued from the N crater of Mount Young, based on webcam images, and seismicity remained slightly elevated. A new, light ash deposit was visible during the morning of 5 May on fresh snow on the NW flank of Mount Young. During 10 May periods of volcanic tremor were observed. The ACC was lowered to Yellow and the VAL to Advisory on 17 May due to no additional evidence of activity.
Geologic Background. Semisopochnoi, the largest subaerial volcano of the western Aleutians, is 20 km wide at sea level and contains an 8-km-wide caldera. It formed as a result of collapse of a low-angle, dominantly basaltic volcano following the eruption of a large volume of dacitic pumice. The high point of the island is Anvil Peak, a double-peaked late-Pleistocene cone that forms much of the island's northern part. The three-peaked Mount Cerberus (renamed Mount Young in 2023) was constructed within the caldera during the Holocene. Each of the peaks contains a summit crater; lava flows on the N flank appear younger than those on the south side. Other post-caldera volcanoes include the symmetrical Sugarloaf Peak SSE of the caldera and Lakeshore Cone, a small cinder cone at the edge of Fenner Lake in the NE part of the caldera. Most documented eruptions have originated from Young, although Coats (1950) considered that both Sugarloaf and Lakeshore Cone could have been recently active.
Information Contacts: Alaska Volcano Observatory (AVO), a cooperative program of a) U.S. Geological Survey, 4200 University Drive, Anchorage, AK 99508-4667 USA (URL: https://avo.alaska.edu/), b) Geophysical Institute, University of Alaska, PO Box 757320, Fairbanks, AK 99775-7320, USA, and c) Alaska Division of Geological & Geophysical Surveys, 794 University Ave., Suite 200, Fairbanks, AK 99709, USA (URL: http://dggs.alaska.gov/).
Ambae
Vanuatu
15.389°S, 167.835°E; summit elev. 1496 m
All times are local (unless otherwise noted)
New lava flow, ash plumes, and sulfur dioxide plumes during February-May 2023
Ambae, also known as Aoba, is a large basaltic shield volcano in Vanuatu. A broad pyroclastic cone containing three crater lakes (Manaro Ngoru, Voui, and Manaro Lakua) is located at the summit within the youngest of at least two nested calderas. Periodic phreatic and pyroclastic explosions have been reported since the 16th century. A large eruption more than 400 years ago resulted in a volcanic cone within the summit crater that is now filled by Lake Voui; the similarly sized Lake Manaro fills the western third of the caldera. The previous eruption ended in August 2022 that was characterized by gas-and-steam and ash emissions and explosions of wet tephra (BGVN 47:10). This report covers a new eruption during February through May 2023 that consisted of a new lava flow, ash plumes, and sulfur dioxide emissions, using information from the Vanuatu Meteorology and Geo-Hazards Department (VMGD) and satellite data.
During the reporting period, the Alert Level remained at a 2 (on a scale of 0-5), which has been in place since December 2021. Activity during October 2022 through March 2023 remained relatively low and mostly consisted of gas-and-steam emissions in Lake Voui. VMGD reported that at 1300 on 15 November a satellite image captured a strong amount of sulfur dioxide rising above the volcano (figure 99), and that seismicity slightly increased. The southern and northern part of the island reported a strong sulfur dioxide smell and heard explosions. On 20 February 2023 a gas-and-ash plume rose 1.3 km above the summit and drifted SSW, according to a webcam image (figure 100). Gas-and-steam and possibly ash emissions continued on 23 February and volcanic earthquakes were recorded by the seismic network.
During April, volcanic earthquakes and gas-and-steam and ash emissions were reported from the cone in Lake Voui. VMGD reported that activity increased during 5-7 April; high gas-and-steam and ash plumes were visible, accompanied by nighttime incandescence. According to a Wellington VAAC report, a low-level ash plume rose as high as 2.5 km above the summit and drifted W and SW on 5 April, based on satellite imagery. Reports in Saratamata stated that a dark ash plume drifted to the WSW, but no loud explosion was heard. Webcam images from 2100 showed incandescence above the crater and reflected in the clouds. According to an aerial survey, field observations, and satellite data, water was no longer present in the lake. A lava flow was reported effusing from the vent and traveling N into the dry Lake Voui, which lasted three days. The next morning at 0745 on 6 April a gas-and-steam and ash plume rose 5.4 km above the summit and drifted ESE, based on information from VMGD (figure 101). The Wellington VAAC also reported that light ashfall was observed on the island. Intermittent gas-and-steam and ash emissions were visible on 7 April, some of which rose to an estimated 3 km above the summit and drifted E. Webcam images during 0107-0730 on 7 April showed continuing ash emissions. A gas-and-steam and ash plume rose 695 m above the summit crater at 0730 on 19 April and drifted ESE, based on a webcam image (figure 102).
According to visual and infrared satellite data, water was visible in Lake Voui as late as 24 March 2023 (figure 103). The vent in the caldera showed a gas-and-steam plume drifted SE. On 3 April thermal activity was first detected, accompanied by a gas-and-ash plume that drifted W (figure 103). The lava flow moved N within the dry lake and was shown cooling by 8 April. By 23 April much of the water in the lake had returned. Occasional sulfur dioxide plumes were detected by the TROPOMI instrument on the Sentinel-5P satellite that exceeded 2 Dobson Units (DU) and drifted in different directions (figure 104).
Geologic Background. The island of Ambae, also known as Aoba, is a massive 2,500 km3 basaltic shield that is the most voluminous volcano of the New Hebrides archipelago. A pronounced NE-SW-trending rift zone with numerous scoria cones gives the 16 x 38 km island an elongated form. A broad pyroclastic cone containing three crater lakes (Manaro Ngoru, Voui, and Manaro Lakua) is located at the summit within the youngest of at least two nested calderas, the largest of which is 6 km in diameter. That large central edifice is also called Manaro Voui or Lombenben volcano. Post-caldera explosive eruptions formed the summit craters about 360 years ago. A tuff cone was constructed within Lake Voui (or Vui) about 60 years later. The latest known flank eruption, about 300 years ago, destroyed the population of the Nduindui area near the western coast.
Information Contacts: Geo-Hazards Division, Vanuatu Meteorology and Geo-Hazards Department (VMGD), Ministry of Climate Change Adaptation, Meteorology, Geo-Hazards, Energy, Environment and Disaster Management, Private Mail Bag 9054, Lini Highway, Port Vila, Vanuatu (URL: http://www.vmgd.gov.vu/, https://www.facebook.com/VanuatuGeohazardsObservatory/); Wellington Volcanic Ash Advisory Centre (VAAC), Meteorological Service of New Zealand Ltd (MetService), PO Box 722, Wellington, New Zealand (URL: http://www.metservice.com/vaac/, http://www.ssd.noaa.gov/VAAC/OTH/NZ/messages.html); MIROVA (Middle InfraRed Observation of Volcanic Activity), a collaborative project between the Universities of Turin and Florence (Italy) supported by the Centre for Volcanic Risk of the Italian Civil Protection Department (URL: http://www.mirovaweb.it/); Global Sulfur Dioxide Monitoring Page, Atmospheric Chemistry and Dynamics Laboratory, NASA Goddard Space Flight Center (NASA/GSFC), 8800 Greenbelt Road, Goddard, Maryland, USA (URL: https://so2.gsfc.nasa.gov/); Copernicus Browser, Copernicus Data Space Ecosystem, European Space Agency (URL: https://dataspace.copernicus.eu/browser/).
Ibu
Indonesia
1.488°N, 127.63°E; summit elev. 1325 m
All times are local (unless otherwise noted)
Daily ash explosions continue, along with thermal anomalies in the crater, October 2022-May 2023
Persistent eruptive activity since April 2008 at Ibu, a stratovolcano on Indonesian’s Halmahera Island, has consisted of daily explosive ash emissions and plumes, along with observations of thermal anomalies (BGVN 47:04). The current eruption continued during October 2022-May 2023, described below, based on advisories issued by the Pusat Vulkanologi dan Mitigasi Bencana Geologi (PVMBG, also known as Indonesian Center for Volcanology and Geological Hazard Mitigation, CVGHM), daily reports by MAGMA Indonesia (a PVMBG platform), and the Darwin Volcanic Ash Advisory Centre (VAAC), and various satellite data. The Alert Level during the reporting period remained at 2 (on a scale of 1-4), except raised briefly to 3 on 27 May, and the public was warned to stay at least 2 km away from the active crater and 3.5 km away on the N side of the volcano.
According to MAGMA Indonesia, during October 2022-May 2023, daily gray-and-white ash plumes of variable densities rose 200-1,000 m above the summit and drifted in multiple directions. On 30 October and 11 November, plumes rose a maximum of 2 km and 1.5 km above the summit, respectively (figures 42 and 43). According to the Darwin VAAC, discrete ash emissions on 13 November rose to 2.1 km altitude, or 800 m above the summit, and drifted W, and multiple ash emissions on 15 November rose 1.4 km above the summit and drifted NE. Occasional larger ash explosions through May 2023 prompted PVMBG to issue Volcano Observatory Notice for Aviation (VONA) alerts (table 6); the Aviation Color Code remained at Orange throughout this period.
Table 6. Volcano Observatory Notice for Aviation (VONA) ash plume alerts for Ibu issued by PVMBG during October 2022-May 2023. Maximum height above the summit was estimated by a ground observer. VONAs in January-May 2023 all described the ash plumes as dense.
| Date |
Time (local) |
Max height above summit |
Direction |
| 17 Oct 2022 |
0858 |
800 m |
SW |
| 18 Oct 2022 |
1425 |
800 m |
S |
| 19 Oct 2022 |
2017 |
600 m |
SW |
| 21 Oct 2022 |
0916 |
800 m |
NW |
| 16 Jan 2023 |
1959 |
600 m |
NE |
| 22 Jan 2023 |
0942 |
1,000 m |
E |
| 29 Jan 2023 |
2138 |
1,000 m |
E |
| 10 May 2023 |
0940 |
800 m |
NW |
| 10 May 2023 |
2035 |
600 m |
E |
| 21 May 2023 |
2021 |
600 m |
W |
| 21 May 2023 |
2140 |
1,000 m |
W |
| 29 May 2023 |
1342 |
800 m |
N |
| 31 May 2023 |
1011 |
1,000 m |
SW |
Sentinel-2 L1C satellite images throughout the reporting period show two, sometimes three persistent thermal anomalies in the summit crater, with the most prominent hotspot from the top of a cone within the crater. Clear views were more common during March-April 2023, when a vent and lava flows on the NE flank of the intra-crater cone could be distinguished (figure 44). White-to-grayish emissions were also observed during brief periods when weather clouds allowed clear views.
The MIROVA space-based volcano hotspot detection system recorded almost daily thermal anomalies throughout the reporting period, though cloud cover often interfered with detections. Data from imaging spectroradiometers aboard NASA’s Aqua and Terra satellites and processed using the MODVOLC algorithm (MODIS-MODVOLC) recorded hotspots on one day during October 2022 and December 2022, two days in April 2023, three days in November 2022 and May 2023, and four days in March 2023.
Geologic Background. The truncated summit of Gunung Ibu stratovolcano along the NW coast of Halmahera Island has large nested summit craters. The inner crater, 1 km wide and 400 m deep, has contained several small crater lakes. The 1.2-km-wide outer crater is breached on the N, creating a steep-walled valley. A large cone grew ENE of the summit, and a smaller one to the WSW has fed a lava flow down the W flank. A group of maars is located below the N and W flanks. The first observed and recorded eruption was a small explosion from the summit crater in 1911. Eruptive activity began again in December 1998, producing a lava dome that eventually covered much of the floor of the inner summit crater along with ongoing explosive ash emissions.
Information Contacts: Pusat Vulkanologi dan Mitigasi Bencana Geologi (PVMBG, also known as Indonesian Center for Volcanology and Geological Hazard Mitigation, CVGHM), Jalan Diponegoro 57, Bandung 40122, Indonesia (URL: http://www.vsi.esdm.go.id/); MAGMA Indonesia (Multiplatform Application for Geohazard Mitigation and Assessment in Indonesia), Kementerian Energi dan Sumber Daya Mineral (URL: https://magma.esdm.go.id/v1); Copernicus Browser, Copernicus Data Space Ecosystem, European Space Agency (URL: https://dataspace.copernicus.eu/browser/); MIROVA (Middle InfraRed Observation of Volcanic Activity), a collaborative project between the Universities of Turin and Florence (Italy) supported by the Centre for Volcanic Risk of the Italian Civil Protection Department (URL: http://www.mirovaweb.it/); Hawai'i Institute of Geophysics and Planetology (HIGP) - MODVOLC Thermal Alerts System, School of Ocean and Earth Science and Technology (SOEST), Univ. of Hawai'i, 2525 Correa Road, Honolulu, HI 96822, USA (URL: http://modis.higp.hawaii.edu/).
Dukono
Indonesia
1.6992°N, 127.8783°E; summit elev. 1273 m
All times are local (unless otherwise noted)
Continuing ash emissions, SO2 plumes, and thermal signals during October 2022-May 2023
Dukono, a remote volcano on Indonesia’s Halmahera Island, has been erupting continuously since 1933, with frequent ash explosions and sulfur dioxide plumes (BGVN 46:11, 47:10). This activity continued during October 2022 through May 2023, based on reports from the Pusat Vulkanologi dan Mitigasi Bencana Geologi (PVMBG; also known as Indonesian Center for Volcanology and Geological Hazard Mitigation, CVGHM), the Darwin Volcanic Ash Advisory Centre (VAAC), and satellite data. During this period, the Alert Level remained at 2 (on a scale of 1-4) and the public was warned to remain outside of the 2-km exclusion zone. The highest reported plume of the period reached 9.4 km above the summit on 14 November 2022.
According to MAGMA Indonesia (a platform developed by PVMBG), white, gray, or dark plumes of variable densities were observed almost every day during the reporting period, except when fog obscured the volcano (figure 33). Plumes generally rose 25-450 m above the summit, but rose as high as 700-800 m on several days, somewhat lower than the maximum heights reached earlier in 2022 when plumes reached as high as 1 km. However, the Darwin VAAC reported that on 14 November 2022, a discrete ash plume rose 9.4 km above the summit (10.7 km altitude), accompanied by a strong hotspot and a sulfur dioxide signal observed in satellite imagery; a continuous ash plume that day and through the 15th rose to 2.1-2.4 km altitude and drifted NE.
Sentinel-2 images were obscured by weather clouds almost every viewing day during the reporting period. However, the few reasonably clear images showed a hotspot and white or gray emissions and plumes. Strong SO2 plumes from Dukono were present on many days during October 2022-May 2023, as detected using the TROPOMI instrument on the Sentinel-5P satellite (figure 34).
Geologic Background. Reports from this remote volcano in northernmost Halmahera are rare, but Dukono has been one of Indonesia's most active volcanoes. More-or-less continuous explosive eruptions, sometimes accompanied by lava flows, have occurred since 1933. During a major eruption in 1550 CE, a lava flow filled in the strait between Halmahera and the N-flank Gunung Mamuya cone. This complex volcano presents a broad, low profile with multiple summit peaks and overlapping craters. Malupang Wariang, 1 km SW of the summit crater complex, contains a 700 x 570 m crater that has also been active during historical time.
Information Contacts: Pusat Vulkanologi dan Mitigasi Bencana Geologi (PVMBG, also known as Indonesian Center for Volcanology and Geological Hazard Mitigation, CVGHM), Jalan Diponegoro 57, Bandung 40122, Indonesia (URL: http://www.vsi.esdm.go.id/); MAGMA Indonesia (Multiplatform Application for Geohazard Mitigation and Assessment in Indonesia), Kementerian Energi dan Sumber Daya Mineral (URL: https://magma.esdm.go.id/v1); Darwin Volcanic Ash Advisory Centre (VAAC), Bureau of Meteorology, Northern Territory Regional Office, PO Box 40050, Casuarina, NT 0811, Australia (URL: http://www.bom.gov.au/info/vaac/); NASA Global Sulfur Dioxide Monitoring Page, Atmospheric Chemistry and Dynamics Laboratory, NASA Goddard Space Flight Center (NASA/GSFC), 8800 Greenbelt Road, Goddard, Maryland, USA (URL: https://so2.gsfc.nasa.gov/); Sentinel Hub Playground (URL: https://www.sentinel-hub.com/explore/sentinel-playground).
Sabancaya
Peru
15.787°S, 71.857°W; summit elev. 5960 m
All times are local (unless otherwise noted)
Explosions, gas-and-ash plumes, and thermal activity persist during November 2022-April 2023
Sabancaya is located in Peru, NE of Ampato and SE of Hualca Hualca. Eruptions date back to 1750 and have been characterized by explosions, phreatic activity, ash plumes, and ashfall. The current eruption period began in November 2016 and has more recently consisted of daily explosions, gas-and-ash plumes, and thermal activity (BGVN 47:11). This report updates activity during November 2022 through April 2023 using information from Instituto Geophysico del Peru (IGP) that use weekly activity reports and various satellite data.
Intermittent low-to-moderate power thermal anomalies were reported by the MIROVA project during November 2022 through April 2023 (figure 119). There were few short gaps in thermal activity during mid-December 2022, late December-to-early January 2023, late January to mid-February, and late February. According to data recorded by the MODVOLC thermal algorithm, there were a total of eight thermal hotspots: three in November 2022, three in February 2023, one in March, and one in April. On clear weather days, some of this thermal anomaly was visible in infrared satellite imagery showing the active lava dome in the summit crater (figure 120). Almost daily moderate-to-strong sulfur dioxide plumes were recorded during the reporting period by the TROPOMI instrument on the Sentinel-5P satellite (figure 121). Many of these plumes exceeded 2 Dobson Units (DU) and drifted in multiple directions.
IGP reported that moderate activity during November and December 2022 continued; during November, an average number of explosions were reported each week: 30, 33, 36, and 35, and during December, it was 32, 40, 47, 52, and 67. Gas-and-ash plumes in November rose 3-3.5 km above the summit and drifted E, NE, SE, S, N, W, and SW. During December the gas-and-ash plumes rose 2-4 km above the summit and drifted in different directions. There were 1,259 volcanic earthquakes recorded during November and 1,693 during December. Seismicity also included volcano-tectonic-type events that indicate rock fracturing events. Slight inflation was observed in the N part of the volcano near Hualca Hualca (4 km N). Thermal activity was frequently reported in the crater at the active lava dome (figure 120).
Explosive activity continued during January and February 2023. The average number of explosions were reported each week during January (51, 50, 60, and 59) and February (43, 54, 51, and 50). Gas-and-ash plumes rose 1.6-2.9 km above the summit and drifted NW, SW, and W during January and rose 1.4-2.8 above the summit and drifted W, SW, E, SE, N, S, NW, and NE during February. IGP also detected 1,881 volcanic earthquakes during January and 1,661 during February. VT-type earthquakes were also reported. Minor inflation persisted near Hualca Hualca. Satellite imagery showed continuous thermal activity in the crater at the lava dome (figure 120).
During March, the average number of explosions each week was 46, 48, 31, 35, and 22 and during April, it was 29, 41, 31, and 27. Accompanying gas-and-ash plumes rose 1.7-2.6 km above the summit crater and drifted W, SW, NW, S, and SE during March. According to a Buenos Aires Volcano Ash Advisory Center (VAAC) notice, on 22 March at 1800 through 23 March an ash plume rose to 7 km altitude and drifted NW. By 0430 an ash plume rose to 7.6 km altitude and drifted W. On 24 and 26 March continuous ash emissions rose to 7.3 km altitude and drifted SW and on 28 March ash emissions rose to 7.6 km altitude. During April, gas-and-ash plumes rose 1.6-2.5 km above the summit and drifted W, SW, S, NW, NE, and E. Frequent volcanic earthquakes were recorded, with 1,828 in March and 1,077 in April, in addition to VT-type events. Thermal activity continued to be reported in the summit crater at the lava dome (figure 120).
Geologic Background. Sabancaya, located in the saddle NE of Ampato and SE of Hualca Hualca volcanoes, is the youngest of these volcanic centers and the only one to have erupted in historical time. The oldest of the three, Nevado Hualca Hualca, is of probable late-Pliocene to early Pleistocene age. The name Sabancaya (meaning "tongue of fire" in the Quechua language) first appeared in records in 1595 CE, suggesting activity prior to that date. Holocene activity has consisted of Plinian eruptions followed by emission of voluminous andesitic and dacitic lava flows, which form an extensive apron around the volcano on all sides but the south. Records of historical eruptions date back to 1750.
Information Contacts: Instituto Geofisico del Peru (IGP), Centro Vulcanológico Nacional (CENVUL), Calle Badajoz N° 169 Urb. Mayorazgo IV Etapa, Ate, Lima 15012, Perú (URL: https://www.igp.gob.pe/servicios/centro-vulcanologico-nacional/inicio); Buenos Aires Volcanic Ash Advisory Center (VAAC), Servicio Meteorológico Nacional-Fuerza Aérea Argentina, 25 de mayo 658, Buenos Aires, Argentina (URL: http://www.smn.gov.ar/vaac/buenosaires/inicio.php); MIROVA (Middle InfraRed Observation of Volcanic Activity), a collaborative project between the Universities of Turin and Florence (Italy) supported by the Centre for Volcanic Risk of the Italian Civil Protection Department (URL: http://www.mirovaweb.it/); Hawai'i Institute of Geophysics and Planetology (HIGP) - MODVOLC Thermal Alerts System, School of Ocean and Earth Science and Technology (SOEST), Univ. of Hawai'i, 2525 Correa Road, Honolulu, HI 96822, USA (URL: http://modis.higp.hawaii.edu/); NASA Global Sulfur Dioxide Monitoring Page, Atmospheric Chemistry and Dynamics Laboratory, NASA Goddard Space Flight Center (NASA/GSFC), 8800 Greenbelt Road, Goddard MD 20771, USA (URL: https://so2.gsfc.nasa.gov/); Copernicus Browser, Copernicus Data Space Ecosystem, European Space Agency (URL: https://dataspace.copernicus.eu/browser/).
Sheveluch
Russia
56.653°N, 161.36°E; summit elev. 3283 m
All times are local (unless otherwise noted)
Significant explosions destroyed part of the lava-dome complex during April 2023
Sheveluch (also spelled Shiveluch) in Kamchatka, has had at least 60 large eruptions during the last 10,000 years. The summit is truncated by a broad 9-km-wide caldera that is breached to the S, and many lava domes occur on the outer flanks. The lava dome complex was constructed within the large open caldera. Frequent collapses of the dome complex have produced debris avalanches; the resulting deposits cover much of the caldera floor. A major south-flank collapse during a 1964 Plinian explosion produced a scarp in which a “Young Sheveluch” dome began to form in 1980. Repeated episodes of dome formation and destruction since then have produced major and minor ash plumes, pyroclastic flows, block-and-ash flows, and “whaleback domes” of spine-like extrusions in 1993 and 2020 (BGVN 45:11). The current eruption period began in August 1999 and has more recently consisted of lava dome growth, explosions, ash plumes, and avalanches (BGVN 48:01). This report covers a significant explosive eruption during early-to-mid-April 2023 that generated a 20 km altitude ash plume, produced a strong sulfur dioxide plume, and destroyed part of the lava-dome complex; activity described during January through April 2023 use information primarily from the Kamchatka Volcanic Eruptions Response Team (KVERT) and various satellite data.
Satellite data. Activity during the majority of this reporting period was characterized by continued lava dome growth, strong fumarole activity, explosions, and hot avalanches. According to the MODVOLC Thermal Alerts System, 140 hotspots were detected through the reporting period, with 33 recorded in January 2023, 29 in February, 44 in March, and 34 in April. Frequent strong thermal activity was recorded during January 2023 through April, according to the MIROVA (Middle InfraRed Observation of Volcanic Activity) graph and resulted from the continuously growing lava dome (figure 94). A slightly stronger pulse in thermal activity was detected in early-to-mid-April, which represented the significant eruption that destroyed part of the lava-dome complex. Thermal anomalies were also visible in infrared satellite imagery at the summit crater (figure 95).
During January 2023 KVERT reported continued growth of the lava dome, accompanied by strong fumarolic activity, incandescence from the lava dome, explosions, ash plumes, and avalanches. Satellite data showed a daily thermal anomaly over the volcano. Video data showed ash plumes associated with collapses at the dome that generated avalanches that in turn produced ash plumes rising to 3.5 km altitude and drifting 40 km W on 4 January and rising to 7-7.5 km altitude and drifting 15 km SW on 5 January. A gas-and-steam plume containing some ash that was associated with avalanches rose to 5-6 km altitude and extended 52-92 km W on 7 January. Explosions that same day produced ash plumes that rose to 7-7.5 km altitude and drifted 10 km W. According to a Volcano Observatory Notice for Aviation (VONA) issued at 1344 on 19 January, explosions produced an ash cloud that was 15 x 25 km in size and rose to 9.6-10 km altitude, drifting 21-25 km W; as a result, the Aviation Color Code (ACC) was raised to Red (the highest level on a four-color scale). Another VONA issued at 1635 reported that no more ash plumes were observed, and the ACC was lowered to Orange (the second highest level on a four-color scale). On 22 January an ash plume from collapses and avalanches rose to 5 km altitude and drifted 25 km NE and SW; ash plumes associated with collapses extended 70 km NE on 27 and 31 January.
Lava dome growth, fumarolic activity, dome incandescence, and occasional explosions and avalanches continued during February and March. A daily thermal anomaly was visible in satellite data. Explosions on 1 February generated ash plumes that rose to 6.3-6.5 km altitude and extended 15 km NE. Video data showed an ash cloud from avalanches rising to 5.5 km altitude and drifting 5 km SE on 2 February. Satellite data showed gas-and-steam plumes containing some ash rose to 5-5.5 km altitude and drifted 68-110 km ENE and NE on 6 February, to 4.5-5 km altitude and drifted 35 km WNW on 22 February, and to 3.7-4 km altitude and drifted 47 km NE on 28 February. Scientists from the Kamchatka Volcanological Station (KVS) went on a field excursion on 25 February to document the growing lava dome, and although it was cloudy most of the day, nighttime incandescence was visible. Satellite data showed an ash plume extending up to 118 km E during 4-5 March. Video data from 1150 showed an ash cloud from avalanches rose to 3.7-5.5 km altitude and drifted 5-10 km ENE and E on 5 March. On 11 March an ash plume drifted 62 km E. On 27 March ash plumes rose to 3.5 km altitude and drifted 100 km E. Avalanches and constant incandescence at the lava dome was focused on the E and NE slopes on 28 March. A gas-and-steam plume containing some ash rose to 3.5 km altitude and moved 40 km E on 29 March. Ash plumes on 30 March rose to 3.5-3.7 km altitude and drifted 70 km NE.
Similar activity continued during April, with lava dome growth, strong fumarolic activity, incandescence in the dome, occasional explosions, and avalanches. A thermal anomaly persisted throughout the month. During 1-4 April weak ash plumes rose to 2.5-3 km altitude and extended 13-65 km SE and E.
Activity during 11 April 2023. The Institute of Volcanology and Seismology, Far Eastern Branch, Russian Academy of Sciences (IVS FEB RAS) reported a significant increase in seismicity around 0054 on 11 April, as reported by strong explosions detected on 11 April beginning at 0110 that sent ash plumes up to 7-10 km altitude and extended 100-435 km W, WNW, NNW, WSW, and SW. According to a Tokyo VAAC report the ash plume rose to 15.8 km altitude. By 0158 the plume extended over a 75 x 100 km area. According to an IVS FEB RAS report, the eruptive column was not vertical: the initial plume at 0120 on 11 April deviated to the NNE, at 0000 on 12 April, it drifted NW, and by 1900 it drifted SW. KVS reported that significant pulses of activity occurred at around 0200, 0320, and then a stronger phase around 0600. Levin Dmitry took a video from near Békés (3 km away) at around 0600 showing a rising plume; he also reported that a pyroclastic flow traveled across the road behind him as he left the area. According to IVS FEB RAS, the pyroclastic flow traveled several kilometers SSE, stopping a few hundred meters from a bridge on the road between Klyuchi and Petropavlovsk-Kamchatsky.
Ashfall was first observed in Klyuchi (45 km SW) at 0630, and a large, black ash plume blocked light by 0700. At 0729 KVERT issued a Volcano Observatory Notice for Aviation (VONA) raising the Aviation Color Code to Red (the highest level on a four-color scale). It also stated that a large ash plume had risen to 10 km altitude and drifted 100 km W. Near-constant lightning strikes were reported in the plume and sounds like thunderclaps were heard until about 1000. According to IVS FEB RAS the cloud was 200 km long and 76 km wide by 0830, and was spreading W at altitudes of 6-12 km. In the Klyuchi Village, the layer of both ash and snow reached 8.5 cm (figure 96); ashfall was also reported in Kozyrevsk (112 km SW) at 0930, Mayskoye, Anavgay, Atlasovo, Lazo, and Esso. Residents in Klyuchi reported continued darkness and ashfall at 1100. In some areas, ashfall was 6 cm deep and some residents reported dirty water coming from their plumbing. According to IVS FEB RAS, an ash cloud at 1150 rose to 5-20 km altitude and was 400 km long and 250 km wide, extending W. A VONA issued at 1155 reported that ash had risen to 10 km and drifted 340 km NNW and 240 km WSW. According to Simon Carn (Michigan Technological University), about 0.2 Tg of sulfur dioxide in the plume was measured in a satellite image from the TROPOMI instrument on the Sentinel-5P satellite acquired at 1343 that covered an area of about 189,000 km2 (figure 97). Satellite data at 1748 showed an ash plume that rose to 8 km altitude and drifted 430 km WSW and S, according to a VONA.
Activity during 12-15 April 2023. On 12 April at 0730 satellite images showed ash plumes rose to 7-8 km altitude and extended 600 km SW, 1,050 km ESE, and 1,300-3,000 km E. By 1710 that day, the explosions weakened. According to news sources, the ash-and-gas plumes drifted E toward the Aleutian Islands and reached the Gulf of Alaska by 13 April, causing flight disruptions. More than 100 flights involving Alaska airspace were cancelled due to the plume. Satellite data showed ash plumes rising to 4-5.5 km altitude and drifted 400-415 km SE and ESE on 13 April. KVS volcanologists observed the pyroclastic flow deposits and noted that steam rose from downed, smoldering trees. They also noted that the deposits were thin with very few large fragments, which differed from previous flows. The ash clouds traveled across the Pacific Ocean. Flight cancellations were also reported in NW Canada (British Columbia) during 13-14 April. During 14-15 April ash plumes rose to 6 km altitude and drifted 700 km NW.
Alaskan flight schedules were mostly back to normal by 15 April, with only minor delays and far less cancellations; a few cancellations continued to be reported in Canada. Clear weather on 15 April showed that most of the previous lava-dome complex was gone and a new crater roughly 1 km in diameter was observed (figure 98); gas-and-steam emissions were rising from this crater. Evidence suggested that there had been a directed blast to the SE, and pyroclastic flows traveled more than 20 km. An ash plume rose to 4.5-5.2 km altitude and drifted 93-870 km NW on 15 April.
Activity during 16-30 April 2023. Resuspended ash was lifted by the wind from the slopes and rose to 4 km altitude and drifted 224 km NW on 17 April. KVERT reported a plume of resuspended ash from the activity during 10-13 April on 19 April that rose to 3.5-4 km altitude and drifted 146-204 km WNW. During 21-22 April a plume stretched over the Scandinavian Peninsula. A gas-and-steam plume containing some ash rose to 3-3.5 km altitude and drifted 60 km SE on 30 April. A possible new lava dome was visible on the W slope of the volcano on 29-30 April (figure 99); satellite data showed two thermal anomalies, a bright one over the existing lava dome and a weaker one over the possible new one.
References. Girina, O., Loupian, E., Horvath, A., Melnikov, D., Manevich, A., Nuzhdaev, A., Bril, A., Ozerov, A., Kramareva, L., Sorokin, A., 2023, Analysis of the development of the paroxysmal eruption of Sheveluch volcano on April 10–13, 2023, based on data from various satellite systems, ??????????? ???????? ??? ?? ???????, 20(2).
Geologic Background. The high, isolated massif of Sheveluch volcano (also spelled Shiveluch) rises above the lowlands NNE of the Kliuchevskaya volcano group. The 1,300 km3 andesitic volcano is one of Kamchatka's largest and most active volcanic structures, with at least 60 large eruptions during the Holocene. The summit of roughly 65,000-year-old Stary Shiveluch is truncated by a broad 9-km-wide late-Pleistocene caldera breached to the south. Many lava domes occur on its outer flanks. The Molodoy Shiveluch lava dome complex was constructed during the Holocene within the large open caldera; Holocene lava dome extrusion also took place on the flanks of Stary Shiveluch. Widespread tephra layers from these eruptions have provided valuable time markers for dating volcanic events in Kamchatka. Frequent collapses of dome complexes, most recently in 1964, have produced debris avalanches whose deposits cover much of the floor of the breached caldera.
Information Contacts: Kamchatka Volcanic Eruptions Response Team (KVERT), Far Eastern Branch, Russian Academy of Sciences, 9 Piip Blvd., Petropavlovsk-Kamchatsky, 683006, Russia (URL: http://www.kscnet.ru/ivs/kvert/); Institute of Volcanology and Seismology, Far Eastern Branch, Russian Academy of Sciences (IVS FEB RAS), 9 Piip Blvd., Petropavlovsk-Kamchatsky 683006, Russia (URL: http://www.kscnet.ru/ivs/eng/); Kamchatka Volcanological Station, Kamchatka Branch of Geophysical Survey, (KB GS RAS), Klyuchi, Kamchatka Krai, Russia (URL: http://volkstat.ru/); Hawai'i Institute of Geophysics and Planetology (HIGP) - MODVOLC Thermal Alerts System, School of Ocean and Earth Science and Technology (SOEST), Univ. of Hawai'i, 2525 Correa Road, Honolulu, HI 96822, USA (URL: http://modis.higp.hawaii.edu/); MIROVA (Middle InfraRed Observation of Volcanic Activity), a collaborative project between the Universities of Turin and Florence (Italy) supported by the Centre for Volcanic Risk of the Italian Civil Protection Department (URL: http://www.mirovaweb.it/); Copernicus Browser, Copernicus Data Space Ecosystem, European Space Agency (URL: https://dataspace.copernicus.eu/browser/); Kam 24 News Agency, 683032, Kamchatka Territory, Petropavlovsk-Kamchatsky, Vysotnaya St., 2A (URL: https://kam24.ru/news/main/20230411/96657.html#.Cj5Jrky6.dpuf); Simon Carn, Geological and Mining Engineering and Sciences, Michigan Technological University, 1400 Townsend Drive, Houghton, MI 49931, USA (URL: http://www.volcarno.com/, Twitter: @simoncarn).
Bezymianny
Russia
55.972°N, 160.595°E; summit elev. 2882 m
All times are local (unless otherwise noted)
Explosions, ash plumes, lava flows, and avalanches during November 2022-April 2023
Bezymianny is located on the Kamchatka Peninsula of Russia as part of the Klyuchevskoy volcano group. Historic eruptions began in 1955 and have been characterized by dome growth, explosions, pyroclastic flows, ash plumes, and ashfall. During the 1955-56 eruption a large open crater was formed by collapse of the summit and an associated lateral blast. Subsequent episodic but ongoing lava-dome growth, accompanied by intermittent explosive activity and pyroclastic flows, has largely filled the 1956 crater. The current eruption period began in December 2016 and more recent activity has consisted of strong explosions, ash plumes, and thermal activity (BGVN 47:11). This report covers activity during November 2022 through April 2023, based on weekly and daily reports from the Kamchatka Volcano Eruptions Response Team (KVERT) and satellite data.
Activity during November and March 2023 was relatively low and mostly consisted of gas-and-steam emissions, occasional small collapses that generated avalanches along the lava dome slopes, and a persistent thermal anomaly over the volcano that was observed in satellite data on clear weather days. According to the Tokyo VAAC and KVERT, an explosion produced an ash plume that rose to 6 km altitude and drifted 25 km NE at 1825 on 29 March.
Gas-and-steam emissions, collapses generating avalanches, and thermal activity continued during April. According to two Volcano Observatory Notice for Aviation (VONA) issued on 2 and 6 April (local time) ash plumes rose to 3 km and 3.5-3.8 km altitude and drifted 35 km E and 140 km E, respectively. Satellite data from KVERT showed weak ash plumes extending up to 550 km E on 2 and 5-6 April.
A VONA issued at 0843 on 7 April described an ash plume that rose to 4.5-5 km altitude and drifted 250 km ESE. Later that day at 1326 satellite data showed an ash plume that rose to 5.5-6 km altitude and drifted 150 km ESE. A satellite image from 1600 showed an ash plume extending as far as 230 km ESE; KVERT noted that ash emissions were intensifying, likely due to avalanches from the growing lava dome. The Aviation Color Code (ACC) was raised to Red (the highest level on a four-color scale). At 1520 satellite data showed an ash plume rising to 5-5.5 km altitude and drifting 230 km ESE. That same day, Kamchatka Volcanological Station (KVS) volcanologists traveled to Ambon to collect ash; they reported that a notable eruption began at 1730, and within 20 minutes a large ash plume rose to 10 km altitude and drifted NW. KVERT reported that the strong explosive phase began at 1738. Video and satellite data taken at 1738 showed an ash plume that rose to 10-12 km altitude and drifted up to 2,800 km SE and E. Explosions were clearly audible 20 km away for 90 minutes, according to KVS. Significant amounts of ash fell at the Apakhonchich station, which turned the snow gray; ash continued to fall until the morning of 8 April. In a VONA issued at 0906 on 8 April, KVERT stated that the explosive eruption had ended; ash plumes had drifted 2,000 km E. The ACC was lowered to Orange (the third highest level on a four-color scale). The KVS team saw a lava flow on the active dome once the conditions were clear that same day (figure 53). On 20 April lava dome extrusion was reported; lava flows were noted on the flanks of the dome, and according to KVERT satellite data, a thermal anomaly was observed in the area. The ACC was lowered to Yellow (the second lowest on a four-color scale).
Satellite data showed an increase in thermal activity beginning in early April 2023. A total of 31 thermal hotspots were detected by the MODVOLC thermal algorithm on 4, 5, 7, and 12 April 2023. The elevated thermal activity resulted from an increase in explosive activity and the start of an active lava flow. The MIROVA (Middle InfraRed Observation of Volcanic Activity) volcano hotspot detection system based on the analysis of MODIS data also showed a pulse in thermal activity during the same time (figure 54). Infrared satellite imagery captured a continuous thermal anomaly at the summit crater, often accompanied by white gas-and-steam emissions (figure 55). On 4 April 2023 an active lava flow was observed descending the SE flank.
Geologic Background. The modern Bezymianny, much smaller than its massive neighbors Kamen and Kliuchevskoi on the Kamchatka Peninsula, was formed about 4,700 years ago over a late-Pleistocene lava-dome complex and an edifice built about 11,000-7,000 years ago. Three periods of intensified activity have occurred during the past 3,000 years. The latest period, which was preceded by a 1,000-year quiescence, began with the dramatic 1955-56 eruption. This eruption, similar to that of St. Helens in 1980, produced a large open crater that was formed by collapse of the summit and an associated lateral blast. Subsequent episodic but ongoing lava-dome growth, accompanied by intermittent explosive activity and pyroclastic flows, has largely filled the 1956 crater.
Information Contacts: Kamchatka Volcanic Eruptions Response Team (KVERT), Far Eastern Branch, Russian Academy of Sciences, 9 Piip Blvd., Petropavlovsk-Kamchatsky, 683006, Russia (URL: http://www.kscnet.ru/ivs/kvert/); Kamchatka Volcanological Station, Kamchatka Branch of Geophysical Survey, (KB GS RAS), Klyuchi, Kamchatka Krai, Russia (URL: http://volkstat.ru/); Hawai'i Institute of Geophysics and Planetology (HIGP) - MODVOLC Thermal Alerts System, School of Ocean and Earth Science and Technology (SOEST), Univ. of Hawai'i, 2525 Correa Road, Honolulu, HI 96822, USA (URL: http://modis.higp.hawaii.edu/); MIROVA (Middle InfraRed Observation of Volcanic Activity), a collaborative project between the Universities of Turin and Florence (Italy) supported by the Centre for Volcanic Risk of the Italian Civil Protection Department (URL: http://www.mirovaweb.it/); Copernicus Browser, Copernicus Data Space Ecosystem, European Space Agency (URL: https://dataspace.copernicus.eu/browser/).
Chikurachki
Russia
50.324°N, 155.461°E; summit elev. 1781 m
All times are local (unless otherwise noted)
New explosive eruption during late January-early February 2023
Chikurachki, located on Paramushir Island in the northern Kuriles, has had Plinian eruptions during the Holocene. Lava flows have reached the sea and formed capes on the NW coast; several young lava flows are also present on the E flank beneath a scoria deposit. Reported eruptions date back to 1690, with the most recent eruption period occurring during January through October 2022, characterized by occasional explosions, ash plumes, and thermal activity (BGVN 47:11). This report covers a new eruptive period during January through February 2023 that consisted of ash explosions and ash plumes, based on information from the Kamchatka Volcanic Eruptions Response Team (KVERT) and satellite data.
According to reports from KVERT, an explosive eruption began around 0630 on 29 January. Explosions generated ash plumes that rose to 3-3.5 km altitude and drifted 6-75 km SE and E, based on satellite data. As a result, the Aviation Color Code (ACC) was raised to Orange (the second highest level on a four-color scale). At 1406 and 1720 ash plumes were identified in satellite images that rose to 4.3 km altitude and extended 70 km E. By 2320 the ash plume had dissipated. A thermal anomaly was visible at the volcano on 31 January, according to a satellite image, and an ash plume was observed drifting 66 km NE.
Occasional explosions and ash plumes continued during early February. At 0850 on 1 February an ash plume rose to 3.5 km altitude and drifted 35 km NE. Satellite data showed an ash plume that rose to 3.2-3.5 km altitude and drifted 50 km NE at 1222 later that day (figure 22). A thermal anomaly was detected over the volcano during 5-6 February and ash plumes drifted as far as 125 km SE, E, and NE. Explosive events were reported at 0330 on 6 February that produced ash plumes rising to 4-4.5 km altitude and drifting 72-90 km N, NE, and ENE. KVERT noted that the last gas-and steam plume that contained some ash was observed on 8 February and drifted 55 km NE before the explosive eruption ended. The ACC was lowered to Yellow and then Green (the lowest level on a four-color scale) on 18 February.
Geologic Background. Chikurachki, the highest volcano on Paramushir Island in the northern Kuriles, is a relatively small cone constructed on a high Pleistocene edifice. Oxidized basaltic-to-andesitic scoria deposits covering the upper part of the young cone give it a distinctive red color. Frequent basaltic Plinian eruptions have occurred during the Holocene. Lava flows have reached the sea and formed capes on the NW coast; several young lava flows are also present on the E flank beneath a scoria deposit. The Tatarinov group of six volcanic centers is located immediately to the south, and the Lomonosov cinder cone group, the source of an early Holocene lava flow that reached the saddle between it and Fuss Peak to the west, lies at the southern end of the N-S-trending Chikurachki-Tatarinov complex. In contrast to the frequently active Chikurachki, the Tatarinov centers are extensively modified by erosion and have a more complex structure. Tephrochronology gives evidence of an eruption around 1690 CE from Tatarinov, although its southern cone contains a sulfur-encrusted crater with fumaroles that were active along the margin of a crater lake until 1959.
Information Contacts: Kamchatka Volcanic Eruptions Response Team (KVERT), Far East Division, Russian Academy of Sciences, 9 Piip Blvd., Petropavlovsk-Kamchatsky, 683006, Russia (URL: http://www.kscnet.ru/ivs/); Copernicus Browser, Copernicus Data Space Ecosystem, European Space Agency (URL: https://dataspace.copernicus.eu/browser/).
Search Bulletin Archive by Publication Date
Select a month and year from the drop-downs and click "Show Issue" to have that issue displayed in this tab.
The default month and year is the latest issue available.
Bulletin of the Global Volcanism Network - Volume 24, Number 03 (March 1999)
Managing Editor: Richard Wunderman
Arenal (Costa Rica)
Eruptions increase in volume and number during February
Cameroon (Cameroon)
Eruptions and lava flows discharge from multiple S-flank vents
Etna (Italy)
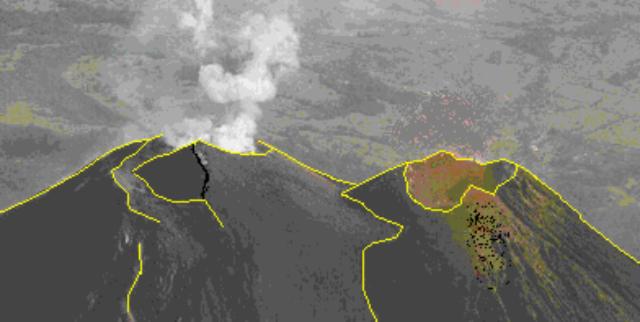
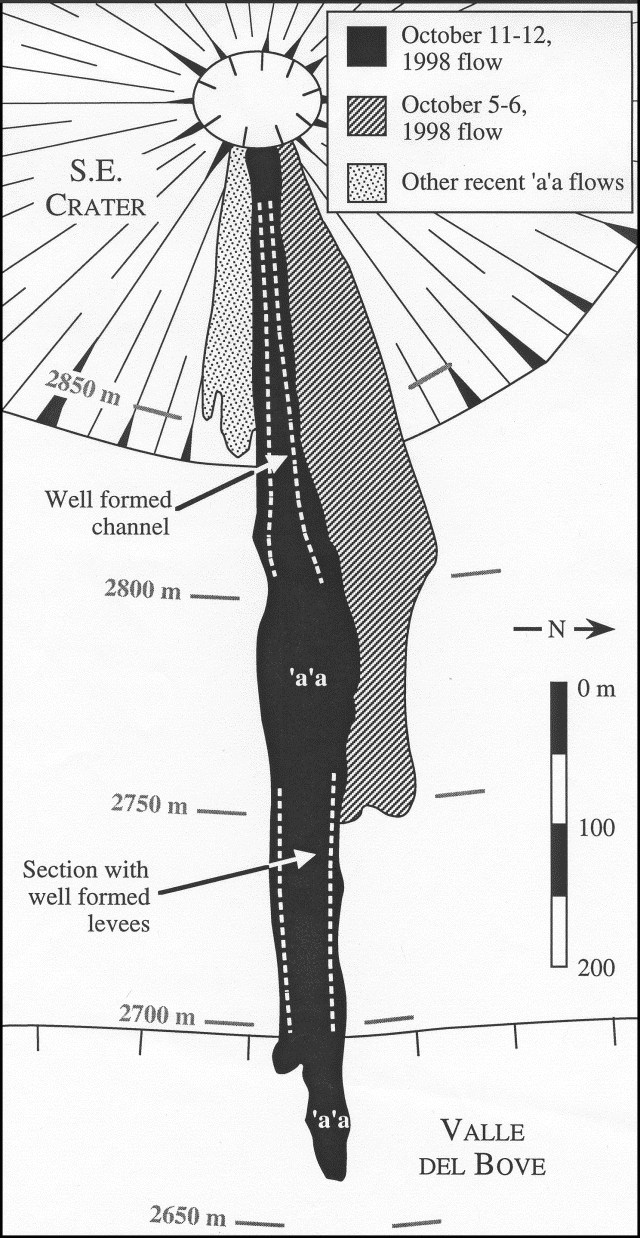
Additional details of mid-October 1998 activity at Southeast Crater
Karymsky (Russia)
Ash eruptions continue during February
Kilauea (United States)
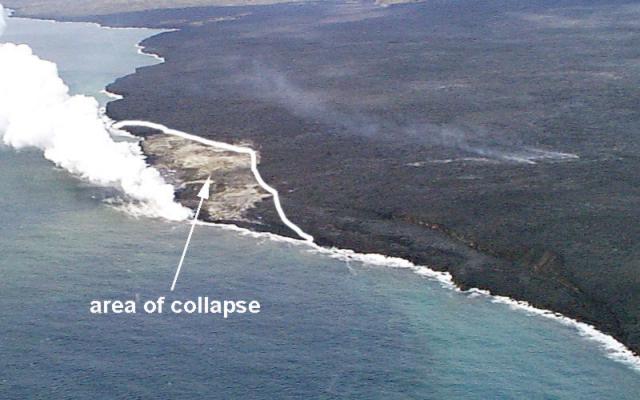
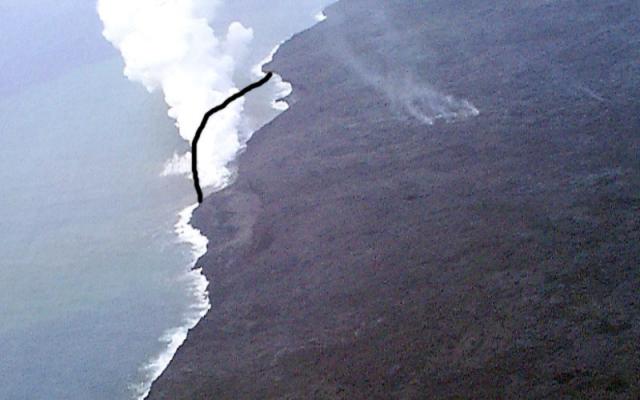
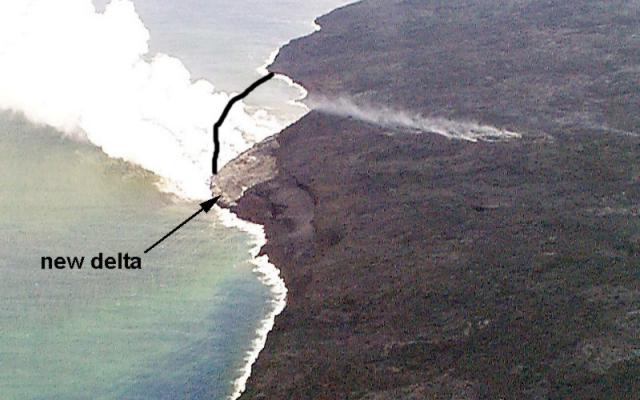
Large delta collapse on 8 March nearly claims victims
Klyuchevskoy (Russia)
Elevated seismicity and large steam plumes continue through March
Planchon-Peteroa (Chile)
Unrest including ashfall and SO2 emissions in November 1998
Poas (Costa Rica)
Relative seismic quiet; fumarole in the N crater remains active
Popocatepetl (Mexico)
Intermittent explosions and ash clouds during February and March
Rabaul (Papua New Guinea)
Small pyroclastic flows following explosions during 15-20 February
Santa Maria (Guatemala)
Explosions, lava flows, and lahars; summary of 1995-98 activity
Shishaldin (United States)
Increased shallow seismicity precede April Strombolian eruptions
Tenorio (Costa Rica)
Tectonic earthquake swarm in late 1998
Terceira (Portugal)
Migrating vents; floating blocks with large internal cavities ("lava balloons")
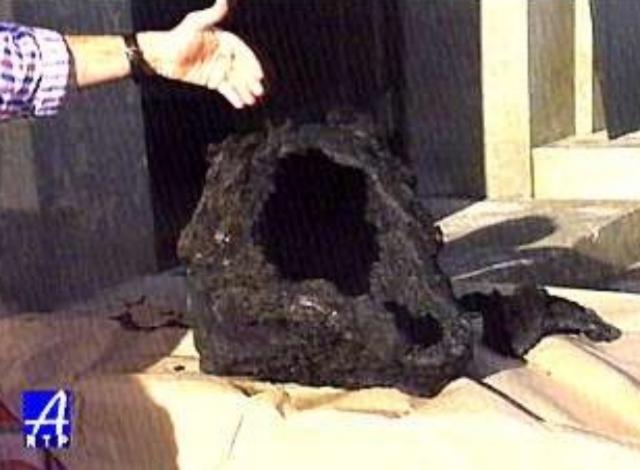
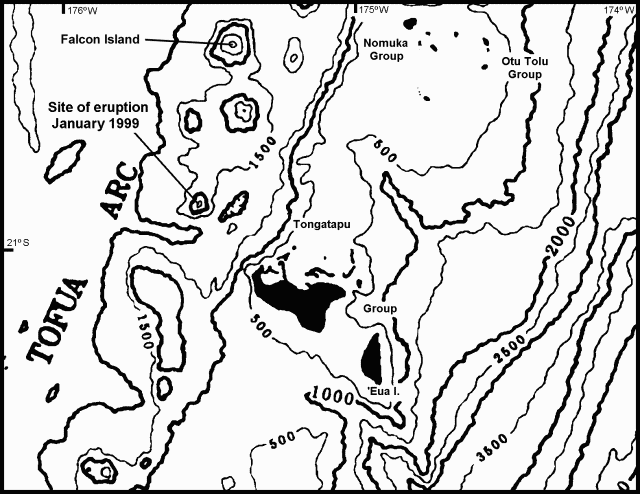
Unnamed (Tonga)
Eruption NW of Tongatapu builds temporary island in January
Villarrica (Chile)
Three years of seasonal fluctuations in lava pond height
Arenal (Costa Rica) — March 1999 Cite this Report
Arenal
Costa Rica
10.463°N, 84.703°W; summit elev. 1670 m
All times are local (unless otherwise noted)
Eruptions increase in volume and number during February
This report covers August 1998 through March 1999. Early in this interval a small dome grew at a point adjacent and S of Crater C's lava vent; during September the dome reached ~10-m tall. Figure 88 shows Arenal's summit topography in April 1998.
The volume and number of explosive eruptions in April 1999 diminished with respect to February, continuing a trend of decreasing activity going back to late 1998. Lava pulses first emitted during December traveled down the N flank and during February made it to 1,200 m elevation. Others descended the NE flank; since April 1998 lavas traveling in other directions have been absent. During January through April ash columns rarely rose more than 500 m.
Also during January-April, EDM surveys detected a contraction of 20 ppm/year; tiltmeters measured a deflation of 7-10 µrad/year. Seismic data transmission problems plagued the local station (VACR) during August, September, March, and April. Seismically detected eruptions registered between 48 and 473 times a month. Tremor prevailed for between 25 and 120 hours a month.
Despite ongoing Strombolian eruptions venting adjacent to Arenal's summit at crater C during 1999, there occurred no measurable gain in summit height. Most pyroclastic material entered channels and descended the summit area. As is typical, crater D remained fumarolically active.
Acid rain most strongly affected the flanks on the NW, W, and SW. Rainwater chemistry collected at station Cáracava for January 1997 through September 1998 showed these variations: pH, 3.4- 4.5; SO4 ion, ~2-13 mg/L; Cl ion, ~3-27 mg/L. For both 1997-98, peaks in pH appeared during September; similarly, peaks in the two ions appeared in the first half of the year (during the months January-May). The chlorine ion in rainwater was enriched compared to rainwater collected at Poás, a case where degassing occurs though a substantial crater lake that is thought to absorb a large portion of the fumarolic HCl.
Geologic Background. Conical Volcán Arenal is the youngest stratovolcano in Costa Rica and one of its most active. The 1670-m-high andesitic volcano towers above the eastern shores of Lake Arenal, which has been enlarged by a hydroelectric project. Arenal lies along a volcanic chain that has migrated to the NW from the late-Pleistocene Los Perdidos lava domes through the Pleistocene-to-Holocene Chato volcano, which contains a 500-m-wide, lake-filled summit crater. The earliest known eruptions of Arenal took place about 7000 years ago, and it was active concurrently with Cerro Chato until the activity of Chato ended about 3500 years ago. Growth of Arenal has been characterized by periodic major explosive eruptions at several-hundred-year intervals and periods of lava effusion that armor the cone. An eruptive period that began with a major explosive eruption in 1968 ended in December 2010; continuous explosive activity accompanied by slow lava effusion and the occasional emission of pyroclastic flows characterized the eruption from vents at the summit and on the upper western flank.
Information Contacts: E. Fernández, V. Barboza, M. Martinez, E. Duarte, R. Sáenz, E. Malavassi, R. Van der Laat, E. Hernández, and T. Marino, Observatorio Vulcanologico y Sismologico de Costa Rica, Universidad Nacional (OVSICORI-UNA), Apartado 86-3000, Heredia, Costa Rica; Wendy Perez Fernandez, Seccion de Seismologia, Vulcanologia y Exploracion Geofisica, Escuela Centroamericana de Geologia, Universidad de Costa Rica, POB 35-2060, San José, Costa Rica.
Cameroon (Cameroon) — March 1999 Cite this Report
Cameroon
Cameroon
4.203°N, 9.17°E; summit elev. 4095 m
All times are local (unless otherwise noted)
Eruptions and lava flows discharge from multiple S-flank vents
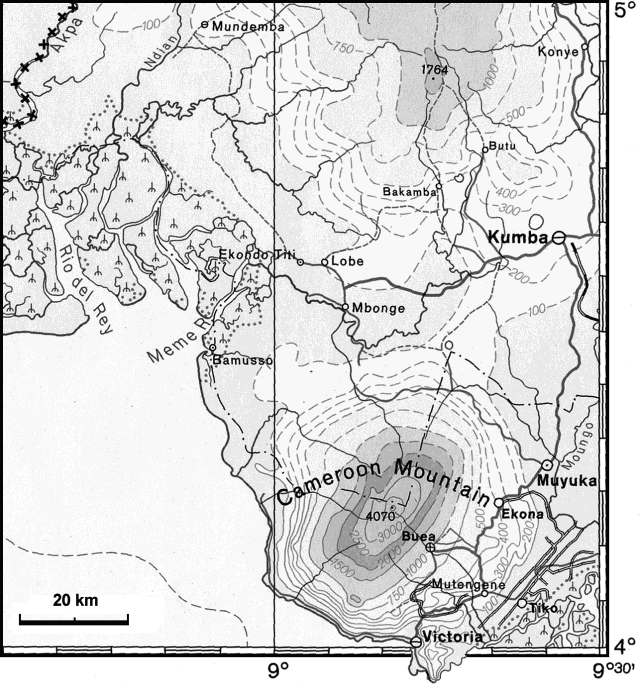
During 1993 the Mt. Cameroon region (figure 3) experienced an earthquake swarm. Since then, the frequency of seismic events in the region had remained low, with a mean of 15 earthquakes per month, although some months had more than 30 events (BGVN 23:02). On 26 March 1999, although only one out of a network of six Institute for Mining and Geological Research (IRGM) seismographs was functioning, more than 15 seismic events were detected from the mountain. This increase in seismicity continued on 27 and 28 March, with more than 200 seismic events.
Around 1930 on 28 March a volcanic eruption began on the S flank at about 2,650 m elevation. According to news reports, earthquakes were felt up to 70 km away from the volcano, in Douala and Kumba, on 29 and 30 March. A second vent opened on the evening of 30 March at ~1,400 m elevation, and sent a voluminous aa flow SSW through dense equatorial forest toward the coastal village of Bakingili. This flow traveled swiftly down the steep upper slopes, but slowed to an estimated 10-25 m/hour on the gentle flanks of the coastal plain. The flow eventually consumed hundreds of hectares of forest and destroyed plantations of palm trees as it moved towards the Atlantic Ocean.
News reports noted that by 31 March there were nine vents. Twelve vents were located during an observation trip by a National Scientific Committee on 3 April. The vents were aligned along a pre-existing fracture zone bearing N40°E. At this time the two vents on the SW end were already in fumarolic a post-volcanic phase. The other ten vents exhibited strong explosive activity, emitting gases, lapilli, ash, and incandescent lava blocks. Scoriaceous bombs were ejected 500 m laterally from one vent. The aa lava flows divided into various branches, the largest of which was 3 km long. The lava-flow temperature measured at 300 m from one of the vents was 972°C.
The main hazards from this eruption were lava flows and volcanic ash, which was blown SW into villages along the coast. A few eye and respiratory problems were reported among residents. Because of the risk the government decided to temporarily evacuate Bakingili, the village closest to where the lava is expected to enter the ocean.
Mount Cameroon, one of Africa's largest volcanoes, rises above the coast of west Cameroon. More than 100 small cinder cones, often fissure-controlled parallel to the long axis of the volcano, occur on the flanks and surrounding lowlands. A large satellitic peak, Etinde, is located on the SW flank. Historical activity, the most frequent of West African volcanoes, was first observed in the 5th century BC by the Carthaginian navigator Hannon. During historical time, moderate explosive and effusive eruptions have occurred from both summit and flank vents.
An eruption during February-March 1959 produced a large E-flank lava flow. Increased seismicity was recorded in November 1975, but no eruption occurred. An eruption during October-November 1982 produced lava fountaining from a radial fissure 6.5 km SW of the summit and a lava flow that moved 12 km down the SW flank. Two towns were evacuated, and tephra caused damage to plantations. In 1989 a minor explosive eruption formed a new crater at 2,860 m on the SW flank. The first seismic network was installed in 1984 by the Ekona Unit for Geophysical and Volcanological Research (ARGV) of the IRGM.
Geologic Background. Mount Cameroon, one of Africa's largest volcanoes, rises above the coast of west Cameroon. The massive steep-sided volcano of dominantly basaltic-to-trachybasaltic composition forms a volcanic horst constructed above a basement of Precambrian metamorphic rocks covered with Cretaceous to Quaternary sediments. More than 100 small cinder cones, often fissure-controlled parallel to the long axis of the 1400 km3 edifice, occur on the flanks and surrounding lowlands. A large satellitic peak, Etinde (also known as Little Cameroon), is located on the S flank near the coast. Historical activity was first observed in the 5th century BCE by the Carthaginian navigator Hannon. During historical time, moderate explosive and effusive eruptions have occurred from both summit and flank vents. A 1922 SW-flank eruption produced a lava flow that reached the Atlantic coast, and a lava flow from a 1999 south-flank eruption stopped only 200 m from the sea. Explosive activity from two vents on the upper SE flank was reported in May 2000.
Information Contacts: B. Ateba, N. Ntepe, J. Nni, and R. Ubangoh, Ekona Unit for Geophysical and Volcanological Research (ARGV), Institute for Mining and Geological Research (IRGM), P.O. Box 370, Buea, Cameroon; J.V. Hell and J.M. Nnange, IRGM, P.O. Box 4110, Yaounde, Cameroon (URL: http://www.irgm-cameroun.org/); J. P. Lockwood and Jean-Baptiste Katabarwa, Geohazards Consultants International, Inc., PO Box 479, Volcano, HI 96785, USA (URL: http://www.geohazardsconsultants.com/), and Office of Foreign Disaster Assistance, U.S. Agency for International Development, 1300 Pennsylvania Avenue NW, Washington, DC 20523 USA (URL: https://www.usaid.gov/who-we-are/organization/bureaus/bureau-democracy-conflict-and-humanitarian-assistance/office-us); Isaha'a Boh Cameroon, Media Research and Strengthening Institute, P.O. Box 731, Yaounde, Cameroon.
Etna
Italy
37.748°N, 14.999°E; summit elev. 3357 m
All times are local (unless otherwise noted)
Additional details of mid-October 1998 activity at Southeast Crater
This report provides additional details of activity during 10-15 October 1998, along with a map of the lava flows emplaced at that time. These events were the seventh episode in a cycle of activity beginning on 15 September 1998. The cycle was characterized by periods of low or no activity interrupted by intense Strombolian fountains and lava flows at Southeast Crater (SEC) (BGVN 23:12). Observations of SEC between 1900 and 1920 on 10 October revealed Strombolian explosions which sent ejecta ~100 m above the crater rim approximately twice every 10 minutes. By 1800 on the 11th, observations from Nicolosi, ~15 km from SEC, indicated that Strombolian activity was increasing, with 16-17 explosions/minute sending ejecta to heights of ~200 m. By nightfall on the 11th, glow from the lava flow extending E from SEC was observed. Upon arrival at Torre del Filosofo (~1 km S of the SEC) at 1930, the explosions had increased to roughly one every 3 seconds and channelized aa lava proceeded down the E flank of SEC. Ejecta reached 100-300 m, typically landing within 300 m of the rim. By midnight, Strombolian activity was near-continuous. The lava fountaining was not Hawaiian in style because discrete explosions could be discerned.
By the morning of 12 October activity had declined to 6-12 explosions/minute, and by the morning of 14 October no explosions were observed. On 14 October, Harris, Sherman, and Wright mapped the flow emplaced during the night of 11-12 October (figure 76). The flow was a single-unit, ~750 m-long aa flow with distinct channelized and leveed portions in the proximal and medial sections. The distal section extended ~100 m into the Valle del Bove. Flow thicknesses were typically ~2 m, but levees were up to ~5 m high. Temperatures measured in cracks varied from 70 to 457 °C. The flow followed the S margin of another recent flow. The latter flow was presumably emplaced during 5-6 October and the highest temperature obtained on it was 55°C (BGVN 23:12). Measurements taken at this time indicated a length of ~500 m for the 5-6 October flow (figure 76).
Geologic Background. Mount Etna, towering above Catania on the island of Sicily, has one of the world's longest documented records of volcanism, dating back to 1500 BCE. Historical lava flows of basaltic composition cover much of the surface of this massive volcano, whose edifice is the highest and most voluminous in Italy. The Mongibello stratovolcano, truncated by several small calderas, was constructed during the late Pleistocene and Holocene over an older shield volcano. The most prominent morphological feature of Etna is the Valle del Bove, a 5 x 10 km caldera open to the east. Two styles of eruptive activity typically occur, sometimes simultaneously. Persistent explosive eruptions, sometimes with minor lava emissions, take place from one or more summit craters. Flank vents, typically with higher effusion rates, are less frequently active and originate from fissures that open progressively downward from near the summit (usually accompanied by Strombolian eruptions at the upper end). Cinder cones are commonly constructed over the vents of lower-flank lava flows. Lava flows extend to the foot of the volcano on all sides and have reached the sea over a broad area on the SE flank.
Information Contacts: Andrew Harris, HIGP/SOEST, University of Hawaii, 2525 Correa Road, Honolulu, HI 96822 USA; John Murray and Robert Wright, Department of Earth Sciences, The Open University, Milton Keynes, MK7 6AA, UK; Andrew George, Gwel an Bendra, Penhale Lane, St. Cleer, Liskeard, Cornwall, PL14 5EB, UK; Jon Hearn, 20 Ringwood Rd., Twerton, Bath BA2 3JJ, UK; Sarah Sherman, 3015A Alencastre Pl., Honolulu, HI 96816, USA.
Karymsky
Russia
54.049°N, 159.443°E; summit elev. 1513 m
All times are local (unless otherwise noted)
Ash eruptions continue during February
Seismicity remained above background during February and March, and the Level of the Concern Color Code remained at Yellow. Low-level Strombolian eruptive activity that has characterized the volcano for more than 3 years continued with ~150-200 daily earthquakes and gas explosions.
An ash plume observed on 10 February rose ~5 km above the summit. Satellite images on 15 and 17 February showed a thermal anomaly. Small earthquakes close to Karymsky Lake began to be recorded on 7 February. According to a pilot's report, an ash plume on the morning of 25 February rose as high as 3,500 m.
Geologic Background. Karymsky, the most active volcano of Kamchatka's eastern volcanic zone, is a symmetrical stratovolcano constructed within a 5-km-wide caldera that formed during the early Holocene. The caldera cuts the south side of the Pleistocene Dvor volcano and is located outside the north margin of the large mid-Pleistocene Polovinka caldera, which contains the smaller Akademia Nauk and Odnoboky calderas. Most seismicity preceding Karymsky eruptions originated beneath Akademia Nauk caldera, located immediately south. The caldera enclosing Karymsky formed about 7600-7700 radiocarbon years ago; construction of the stratovolcano began about 2000 years later. The latest eruptive period began about 500 years ago, following a 2300-year quiescence. Much of the cone is mantled by lava flows less than 200 years old. Historical eruptions have been vulcanian or vulcanian-strombolian with moderate explosive activity and occasional lava flows from the summit crater.
Information Contacts: Olga Chubarova, Kamchatka Volcanic Eruptions Response Team (KVERT), Institute of Volcanic Geology and Geochemistry; Tom Miller, Alaska Volcano Observatory.
Kilauea (United States) — March 1999 Cite this Report
Kilauea
United States
19.421°N, 155.287°W; summit elev. 1222 m
All times are local (unless otherwise noted)
Large delta collapse on 8 March nearly claims victims
During February and early March the eruption of Pu`u `O`o continued to deliver lava to the sea through the lava-tube system that developed on the coastal plain in August 1998 (figure 130). During this time no changes were observed at the Pu`u `O`o vent.
Favorable wind conditions permitted a good view into the crater of Pu`u `O`o during late February. Lava was visible in the bottom of one pit as were several ledges around the edges of the pits; these ledges are remnants of the crater floor that collapsed into the pits as lava beneath Pu`u `O`o lowered during the past year. The most recent overflow of lava from the crater occurred in January 1998 (BGVN 22:12); the decline in crater activity since then is thought to be due to a change in an outlet in the local tube system located beneath the S flank of Pu`u `O`o. This outlet has moved downward as the lava tube has eroded through more than 20 m of loose tephra. As lava eroded the tephra, the lava level within the crater fell because the outlet is presumably hydraulically connected and in equilibrium.
On 8 March nearly all of the new land built since 11 December 1998 (BGVN 23:11 and 24:01) slid into the ocean. Several associated explosions hurled lava landward and the collapse removed part of the old sea cliff on the E and W sides of the active delta. Prior to the collapse, the ~10 hectare lava delta stood ~700 m long and extended as far as 200 m seaward from the previous shoreline's cliff face (figure 131). On the E side of the delta (foreground in figure 131), the former sea cliff was completely buried by lava, allowing easy though unauthorized access for visitors hoping for closer views of lava entering the sea. Landward of the W part of the delta, however, was a cliff standing 10-15 m tall, a vestige of a delta collapse on 11 December 1998 (BGVN 23:11). Warning signs posted by the National Park Service were at least 50 m landward of this cliff.
According to an anonymous eyewitness, seven people were on the delta when the 8 March collapse began. The first sign of a change in activity was a strong explosion that rocked the eyewitness where he lay on the ground above the buried cliff. An initial, energetic burst of lava from the edge of the delta threw spatter up to 70-80 m into the air (an estimate scaled from the people on the delta next to the explosion source). As large splatter clots fell around them, the seven retreated from the shoreline but became temporarily trapped by the sea cliff on the W side of the delta. The eyewitness used his flashlight to guide the endangered people to safety across to the E part of the delta.
Based on the eyewitness account, the collapse probably occurred between 0030 and 0200. The eyewitness left the area after the explosions began, and the delta was gone the next morning. The experience reinforced Park Service warnings that the ocean entry area remains extremely hazardous; visitors remain advised not to venture onto the active lava delta. After the collapse, lava began constructing a new delta into the sea (figure 133).
When seawater and lava mixed within the confines of the lava tube, a steam explosion often resulted, sometimes blasting lava up through a hole in the roof of the tube. In figure 134 such a steam-driven explosion sent a dome-shaped sheet of lava, the skin of a bursting bubble, about 5 m into the air. Similar but larger explosions occurred intermittently for several days after the delta collapse on 8 March. As lava began rebuilding new land into the sea, water was apparently able to enter the developing lava-tube system within the delta.
New tiltmeter. A new tiltmeter station was successfully installed in February near Pu`u `O`o in order better to monitor the middle east rift zone and the intermittent pauses in supply of magma to the vent. The new site design and improved electronics have yielded data 10 times better than those from older tiltmeter stations. This was the first of several new tiltmeters planned for Kīlauea and Mauna Loa. Because the new instrument is about 5 m below the ground, the daily temperature effects on the rocks around the instrument are much less than for the older, shallower instruments, which were typically less than 1 m deep.
Geologic Background. Kilauea overlaps the E flank of the massive Mauna Loa shield volcano in the island of Hawaii. Eruptions are prominent in Polynesian legends; written documentation since 1820 records frequent summit and flank lava flow eruptions interspersed with periods of long-term lava lake activity at Halemaumau crater in the summit caldera until 1924. The 3 x 5 km caldera was formed in several stages about 1,500 years ago and during the 18th century; eruptions have also originated from the lengthy East and Southwest rift zones, which extend to the ocean in both directions. About 90% of the surface of the basaltic shield volcano is formed of lava flows less than about 1,100 years old; 70% of the surface is younger than 600 years. The long-term eruption from the East rift zone between 1983 and 2018 produced lava flows covering more than 100 km2, destroyed hundreds of houses, and added new coastline.
Information Contacts: Hawaiian Volcano Observatory (HVO), U.S. Geological Survey, PO Box 51, Hawaii Volcanoes National Park, HI 96718, USA (URL: https://volcanoes.usgs.gov/observatories/hvo/).
Klyuchevskoy (Russia) — March 1999 Cite this Report
Klyuchevskoy
Russia
56.056°N, 160.642°E; summit elev. 4754 m
All times are local (unless otherwise noted)
Elevated seismicity and large steam plumes continue through March
Elevated seismicity persisted through February and March. Earthquake hypocenters were concentrated at levels near the summit crater and at depths of 25-30 km. Visual observations were hindered by bad weather on many days. Because of increases in activity, the Level of Concern Color Code was changed to Yellow from Green and back three times during the reporting period.
Deeper earthquakes increased toward the end of 1-7 February, and fumarolic plumes rose several hundred meters above the crater during this week. On 5 February a gas explosion sent a plume 2,500 m above the crater. Earthquakes at both shallow and deeper depths continued through 25 February, as did the fumarolic plumes.
Fumarolic or steam plumes were observed during most of the period 15-30 March rising hundreds of meters above the summit before being blown about 5 km. At 1422 on 17 March satellite images showed a steam plume extending 40 km NE. On 20 March separate gas and steam explosions occurring at a rate of 2-3 per hour rose 500 m above the crater. A 17-minute series of earthquakes and tremor was recorded on 3 March and low-amplitude tremor began to be recorded again on 12 March. Between 1918 and 2137 on 20 March a series of near-surface M <1.6 earthquakes occurred.
Geologic Background. Klyuchevskoy (also spelled Kliuchevskoi) is Kamchatka's highest and most active volcano. Since its origin about 6000 years ago, the beautifully symmetrical, 4835-m-high basaltic stratovolcano has produced frequent moderate-volume explosive and effusive eruptions without major periods of inactivity. It rises above a saddle NE of sharp-peaked Kamen volcano and lies SE of the broad Ushkovsky massif. More than 100 flank eruptions have occurred during the past roughly 3000 years, with most lateral craters and cones occurring along radial fissures between the unconfined NE-to-SE flanks of the conical volcano between 500 m and 3600 m elevation. The morphology of the 700-m-wide summit crater has been frequently modified by historical eruptions, which have been recorded since the late-17th century. Historical eruptions have originated primarily from the summit crater, but have also included numerous major explosive and effusive eruptions from flank craters.
Information Contacts: Olga Chubarova, Kamchatka Volcanic Eruptions Response Team (KVERT), Institute of Volcanic Geology and Geochemistry, Piip Ave. 9, Petropavlovsk-Kamchatsky, 683006, Russia; Tom Miller, Alaska Volcano Observatory (AVO), a cooperative program of a) U.S. Geological Survey, 4200 University Drive, Anchorage, AK 99508-4667, USA (URL: http://www.avo.alaska.edu/), b) Geophysical Institute, University of Alaska, PO Box 757320, Fairbanks, AK 99775-7320, USA, and c) Alaska Division of Geological & Geophysical Surveys, 794 University Ave., Suite 200, Fairbanks, AK 99709, USA.
Planchon-Peteroa (Chile) — March 1999 Cite this Report
Planchon-Peteroa
Chile
35.223°S, 70.568°W; summit elev. 3977 m
All times are local (unless otherwise noted)
Unrest including ashfall and SO2 emissions in November 1998
Information from the city of Romeral's Emergency Office indicated that Planchón-Peteroa emitted noteworthy amounts of SO2 in October 1998 and showed signs of unrest in November 1998. Apparently, small phreatic eruptions produced minor explosions. Ash fell on Carrizales, ~8 km NW of the volcano, on 18 and 21 November, and fumaroles were observed from Carrizales on 24 November along with an intense SO2 odor. A local herdsman observed fine ashfall and intense fumaroles on 18 November and reported that fumes continued up to 24 November when he came down from the volcano. No seismic activity was felt. On 30 November, observers at ~3,050 m elevation on the E flank saw no fresh ash.
The volcano last erupted in February 1991 producing a 500-1,000 m column of gas and dispersing fine ash as far as 30 km ESE of the volcano.
Geologic Background. Planchón-Peteroa is an elongated complex volcano along the Chile-Argentina border with several overlapping calderas. Activity began in the Pleistocene with construction of the basaltic-andesite to dacitic Volcán Azufre, followed by formation of basaltic and basaltic-andesite Volcán Planchón, 6 km to the north. About 11,500 years ago, much of Azufre and part of Planchón collapsed, forming the massive Río Teno debris avalanche, which traveled 95 km to reach Chile's Central Valley. Subsequently, Volcán Planchón II was formed. The youngest volcano, andesitic and basaltic-andesite Volcán Peteroa, consists of scattered vents between Azufre and Planchón. Peteroa has been active into historical time and contains a small steaming crater lake. Historical eruptions from the complex have been dominantly explosive, although lava flows were erupted in 1837 and 1937.
Information Contacts: José Antonio Naranjo, Programa Riesgo Volcánico Servicio Nacional de Geología y Minería, (SERNAGEOMIN), Av. Santa María 0104, Casilla 10465, Santiago, Chile.
Poas
Costa Rica
10.2°N, 84.233°W; summit elev. 2697 m
All times are local (unless otherwise noted)
Relative seismic quiet; fumarole in the N crater remains active
This report covers late 1998 through March 1999. During this time, the terrace SE of the active crater lake continued to slide. The active crater lake, the northernmost of the two summit lakes, remained sky-blue to green-turquoise in color. The pyroclastic cone within the active crater remained the principal source of fumarolic outgassing, sometimes giving off plumes that rose 500 m and during November occasionally reaching 500-600 m. OVSICORI-UNA noted that fumaroles alongside the cone typically had temperatures up to 93°C. They found identical maximum temperatures at fumaroles along the crater walls and on the terrace N of the active crater lake. However, in September 1998, Wendy Perez Fernandez reported hotter temperatures (elevated by 19°C) and greater than usual fumarolic vigor.
Seismicity during January 1998-March 1999 was dominated on the OVSICORI-UNA system by low-frequency events. They occurred in largest number during early 1998 with the highest number recorded (during February 1998) consisting of 2,718 events. A substantial decrease in low-frequency events occurred during late 1998 and early 1999 with the lowest number recorded (during January 1999) consisting of 381 events. Tremor duration followed roughly similar patterns: the maxima (during February 1998) consisted of 55 hours. Tremor was absent for the four months after November 1998.
Scientists measured the comparatively clear waters of the southernmost, less-active lake (Laguna Botos). During January 1995 through 21 September 1998 they recorded rises in both temperature (from ~14°C in 1995 to ~28°C in 1998) and pH (from ~4 in 1995 to ~6 in 1998). Sulfate ion, although highly variable, also tended to climb during the four-year interval. Chloride ion concentrations decreased (from ~4 down to ~1 ppm).
Geologic Background. The broad vegetated edifice of Poás, one of the most active volcanoes of Costa Rica, contains three craters along a N-S line. The frequently visited multi-hued summit crater lakes of the basaltic-to-dacitic volcano are easily accessible by vehicle from the nearby capital city of San José. A N-S-trending fissure cutting the complex stratovolcano extends to the lower N flank, where it has produced the Congo stratovolcano and several lake-filled maars. The southernmost of the two summit crater lakes, Botos, last erupted about 7,500 years ago. The more prominent geothermally heated northern lake, Laguna Caliente, is one of the world's most acidic natural lakes, with a pH of near zero. It has been the site of frequent phreatic and phreatomagmatic eruptions since an eruption was reported in 1828. Eruptions often include geyser-like ejections of crater-lake water.
Information Contacts: E. Fernández, V. Barboza, M. Martinez, E. Duarte, R. Sáenz, E. Malavassi, R. Van der Laat, E. Hernández, and T. Marino, Observatorio Vulcanologico y Sismologico de Costa Rica, Universidad Nacional (OVSICORI-UNA).
Popocatepetl (Mexico) — March 1999 Cite this Report
Popocatepetl
Mexico
19.023°N, 98.622°W; summit elev. 5393 m
All times are local (unless otherwise noted)
Intermittent explosions and ash clouds during February and March
Frequent low-intensity short-period exhalations, with occasional ash plumes and incandescent ejecta, and periodic low-frequency tremor episodes characterized activity at the volcano during February and March. Due to the possibility of explosions, authorities continued to recommend that no one approach closer than 7 km to the crater. The volcanic alert status remains yellow.
Beginning at 0315 on 2 February a low-frequency tremor fluctuating in amplitude was recorded; it persisted for about 24 hours. During the next few days low-intensity events produced small steam, gas, and light ash emissions. Some high-frequency tremors were recorded on 9 February beginning at 2225 and lasting 14 minutes. Also on 9 February, three tectono-volcanic earthquakes occurred (at 0845, 1151, and 1152) SE of the summit at distances of ~8 km. These ranged from M 2.0 to 2.5. Low-frequency harmonic tremor was recorded on 12, 17, and 21 February. An A-type M 2.8 earthquake occurred at 2000 on 18 February.
Small exhalations preceded by low-frequency, low-amplitude harmonic tremor continued in March. "Pulgas" (small pulsating signals) were recorded; occasionally these preceded explosive events by a few hours. On 1 March small emissions of incandescent fragments were contained within and, later, an ash plume rose 1,000 m above the summit before moving E. Pulgas and low-frequency harmonic tremor of variable amplitude continued intermittently for a few days. The shape of recorded signals suggested a growing lava dome in the crater. During a flight on 4 March to measure CO2 volumes, gas and light ash could be seen emanating from the crater. On 8 March a vertical ash plume rose 5 km above the summit before being blown NE and, at a higher altitude, SW. Light ashfall was recorded E of the volcano.
Good weather on 8 March permitted several close-up images to be taken with the video camera. These images showed the glacier partially covered with ash and several impacts from explosions in December 1998. Small flows of melting snow or ice were seen.
At 1940 on 11 March a moderate explosion ejected incandescent fragments over the N flank. Radar showed an ash plume directed to the NE. At 2211 on 12 March another moderate explosion ejected incandescent fragments over the NE flank to a distance of 500 m. A larger explosion at 0531 on 18 March sent incandescent fragments over the E and SE flanks in a radius of 3 km. Poor weather obscured the summit on 19 March when another large explosion occurred. Ash was initially detected by radar and at 1845 an airplane reported a plume 16 km NE from the crater. The explosion was heard and felt in the town of Amecameca.
Geologic Background. Volcán Popocatépetl, whose name is the Aztec word for smoking mountain, rises 70 km SE of Mexico City to form North America's 2nd-highest volcano. The glacier-clad stratovolcano contains a steep-walled, 400 x 600 m wide crater. The generally symmetrical volcano is modified by the sharp-peaked Ventorrillo on the NW, a remnant of an earlier volcano. At least three previous major cones were destroyed by gravitational failure during the Pleistocene, producing massive debris-avalanche deposits covering broad areas to the south. The modern volcano was constructed south of the late-Pleistocene to Holocene El Fraile cone. Three major Plinian eruptions, the most recent of which took place about 800 CE, have occurred since the mid-Holocene, accompanied by pyroclastic flows and voluminous lahars that swept basins below the volcano. Frequent historical eruptions, first recorded in Aztec codices, have occurred since Pre-Columbian time.
Information Contacts: Servando De la Cruz-Reyna1,2, Roberto Quaas1,2, Carlos Valdés G.2, and Alicia Martinez Bringas1. 1Centro Nacional de Prevencion de Desastres (CENAPRED) Delfin Madrigal 665, Col. Pedregal de Santo Domingo, Coyoacán, 04360, México D.F. (URL: https://www.gob.mx/cenapred/); 2Instituto de Geofisica, UNAM, Coyoacán 04510, México D.F., México.
Rabaul (Papua New Guinea) — March 1999 Cite this Report
Rabaul
Papua New Guinea
4.2459°S, 152.1937°E; summit elev. 688 m
All times are local (unless otherwise noted)
Small pyroclastic flows following explosions during 15-20 February
Moderate activity at Tavurvur continued during February with quiet, intermittent emissions of pale gray ash rising 600-1,000 m above the summit. Variable NW winds led to light ashfalls at Talwat and Matupit. A short period of more energetic activity during 15-20 February included moderate explosions ejecting lava blocks and dark gray ash. Small pyroclastic flows were generated down the S flank and ash rose to about 2,000 m. Some light ashfall was reported as far south as Kokopo.
Although the caldera was still restless, leveling, tilt, and GPS showed minor deformation with few significant movements during February. Seismicity was much lower than that previous months; low-frequency events totaled 465, compared with 2,843 in December 1998 and 1,413 in January 1999. Twenty-four explosive events were recorded, on 3, 4, 8, 12-18, 20, 21, 23, and 24 February. Only two high-frequency events were detected NE of the caldera, compared with 28 in that direction during January.
Geologic Background. The low-lying Rabaul caldera on the tip of the Gazelle Peninsula at the NE end of New Britain forms a broad sheltered harbor utilized by what was the island's largest city prior to a major eruption in 1994. The outer flanks of the asymmetrical shield volcano are formed by thick pyroclastic-flow deposits. The 8 x 14 km caldera is widely breached on the east, where its floor is flooded by Blanche Bay and was formed about 1,400 years ago. An earlier caldera-forming eruption about 7,100 years ago is thought to have originated from Tavui caldera, offshore to the north. Three small stratovolcanoes lie outside the N and NE caldera rims. Post-caldera eruptions built basaltic-to-dacitic pyroclastic cones on the caldera floor near the NE and W caldera walls. Several of these, including Vulcan cone, which was formed during a large eruption in 1878, have produced major explosive activity during historical time. A powerful explosive eruption in 1994 occurred simultaneously from Vulcan and Tavurvur volcanoes and forced the temporary abandonment of Rabaul city.
Information Contacts: Herman Patia, Rabaul Volcano Observatory (RVO), P.O. Box 386, Rabaul, Papua New Guinea.
Santa Maria (Guatemala) — March 1999 Cite this Report
Santa Maria
Guatemala
14.757°N, 91.552°W; summit elev. 3745 m
All times are local (unless otherwise noted)
Explosions, lava flows, and lahars; summary of 1995-98 activity
Explosive activity and lava extrusion from the Caliente vent of the Santiaguito lava dome complex on the SW flank of Santa María continued in January 1999. Explosive activity in January was smaller (with plumes 150-500 m in height) following strong activity in November 1998 (see below). Recent plumes differed from typical explosive activity at Santiaguito; white-to-gray plumes, sometimes partially translucent, were denser and did not disperse rapidly, but draped the flanks of the dome. The lava flow extended ~500 m SW of the vent and had an oversteepened flow front, which periodically collapsed forming small pyroclastic flows and plumes 400-500 m high.
Summary of activity 1995-98. Frequent small-to-moderate explosive eruptions from Caliente vent accompanied by lava extrusion, periodic small pyroclastic flows, and lahars, took place throughout the 1990's. Lava extrusion down the ESE flank of Caliente that began in 1991 continued until 1995, gradually filling the barranco at the head waters of Río Nimá II (figure 28). In September 1995, the lava flow stopped after overtopping the barranca wall and spilling into the Río Nimá I drainage. From September 1995 until May 1996, lahars from the lava spillover traveled down the Río Nimá I, depositing fine sediments.
Lava extrusion resumed in March 1996, shifting to an easterly direction. The first large lahar down the Río Nimá I took place on 17 May 1997. Lahars 5 m deep swept down the river, destroyed a bridge at Finca El Faro, and deposited 20-25 cm of sediment at the village of El Palmar, 10 km S of Santiaguito. Ten additional lahars took place from May to September 1997.
In 1998 continued lava extrusion into the Río Nimá I contributed to the generation of lahars downstream. From March to May 1998 the government dredged the river from 200 m above to 800 m below the bridge to protect the downstream towns of San Sebastian and Retalhuleu. The major highway was repeatedly overrun and then cleared.
On 28 May 1998, a large lahar descended the Río Nimá I and entered the N end of El Palmar, depositing 40 cm of fine sediment in the streets. The lahar was 7 m deep when it passed the Santiaguito Volcano Observatory, ~6 km S of Santiaguito. About 60 families were evacuated from El Palmar during the lahar, which was reported to be as loud as a jet engine; there were no fatalities. Following the May lahar the government declared El Palmar to be uninhabitable and the village was moved E across the Río Samalá.
From May to September an additional 12-15 lahars raised the river bed. From May to August, 5 m of hyperconcentrated-flow deposits were deposited in the Río Samalá above and below the town of San Felipe.
In August the largest lahar swept through the abandoned El Palmar, covering the S end of the town and destroying the cathedral, leaving only the front tower and the back wall standing. The lahar was 7 m deep and deposited about 2 m of sediment near the town hall. The Río Nimá I, which since 1991 had been diverted just south of town into the Río Samalá, shifted to a new course directly through the abandoned town. The lahar also produced major sedimentation downstream. Before May there had been 10 m of clearance below the Interamericana Pacifica highway bridge over the Río Samalá, 18 km from Santiaguito. After the August lahar there was only 1.5 m of clearance.
In November 1998 lahars down the Río Nimá I filled the channel above Finca La Mosquela, north of El Palmar, covering coffee plantations. There were, however, no major lahars resulting from Hurricane Mitch. The channel of the Río Nimá I, which in 1997 was ~12 m deep and 4-5 m wide at Finca Faro, below the Observatory, is now 15-20 m wide and 3-5 m deep. Farther downstream, between Finca La Mosquela and Finca Santa Marla, above El Palmar, the channel is only 1-3 m deep.
A strong effusive pulse began in November 1998, the first major magmatic event at Santiaguito since the explosions of 1989 and 1990. On 4 November a new lava flow began descending the SW flank of Caliente. Rapid effusion formed a cupola over the vent that collapsed repeatedly 8-20 November, producing pyroclastic flows in all directions, but principally SW. Pyroclastic flows traveled 4-5 km SW and S, and ash clouds rose 2 km. On 11-13 November collapses occurred at intervals of 15-60 minutes. Ashfall was reported in the towns of Retalhuleu and Coatepeque, where 2 mm of dark-gray ash accumulated.
Geologic Background. Symmetrical, forest-covered Santa María volcano is part of a chain of large stratovolcanoes that rise above the Pacific coastal plain of Guatemala. The sharp-topped, conical profile is cut on the SW flank by a 1.5-km-wide crater. The oval-shaped crater extends from just below the summit to the lower flank, and was formed during a catastrophic eruption in 1902. The renowned Plinian eruption of 1902 that devastated much of SW Guatemala followed a long repose period after construction of the large basaltic-andesite stratovolcano. The massive dacitic Santiaguito lava-dome complex has been growing at the base of the 1902 crater since 1922. Compound dome growth at Santiaguito has occurred episodically from four vents, with activity progressing E towards the most recent, Caliente. Dome growth has been accompanied by almost continuous minor explosions, with periodic lava extrusion, larger explosions, pyroclastic flows, and lahars.
Information Contacts: Otoniel Matías, Instituto Nacional de Sismologia, Vulcanologia, Meteorologia e Hydrologia (INSIVUMEH), Ministerio de Communicaciones, Transporte y Obras Publicas, 7A Avenida 14-57, Zona 13, Guatemala City, Guatemala.
Shishaldin (United States) — March 1999 Cite this Report
Shishaldin
United States
54.756°N, 163.97°W; summit elev. 2857 m
All times are local (unless otherwise noted)
Increased shallow seismicity precede April Strombolian eruptions
Low-level seismicity and a thermal anomaly visible in satellite imagery continued at Shishaldin during March, preceding Strombolian eruptions on 17 April. On many days no observations were obtained due to bad weather.
A new seismic net at Shishaldin recorded elevated seismicity beginning near the end of January. On 9 February a thermal anomaly appeared on satellite imagery and vigorous steam plumes were reported through the next week (BGVN 24:02). No ash was detected on the satellite imagery. Low-level tremor prompted the Alaska Volcano Observatory (AVO) to raise the Level of Concern Color Code to Yellow on 18 February. The tremor subsequently diminished, but seismicity remained above normal.
National Weather Service observers in Cold Bay, 90 km NE, reported that no steam plume was present during the first week of March, but that the upper summit was snow-free. Apparently, heating in the summit area caused the snow to melt. A shallow M 5.0 earthquake ~14 km SW of Shishaldin on 4 March was followed by hundreds of small aftershocks that persisted until late in the month.
Seismic activity, chiefly strong tremor, substantially increased above previous levels at 0800 on 7 April, causing AVO to raise the hazard status to Orange. Weather in the area was overcast with haze, preventing views of the summit area. The strong tremor declined by the afternoon and returned to previous levels. Tremor remained steady from 8 April without significant changes through 12 April, when the hazard status was decreased to Yellow. The thermal anomaly observed in satellite imagery persisted.
On 12 April a M 4.5 earthquake struck W of the volcano; aftershocks followed. Tremor increased markedly late on 13 April. This tremor episode lasted over one day and decreased somewhat for the next three days. AVO again raised the hazard status to Orange on 14 April.
AVO staff flying with Alaska State Troopers saw a minor Strombolian eruption at 1700 on 17 April. Incandescent blocks and spatter rose as high as 200 m above the vent, but at that time no lava had come over the crater rim. On the morning of 18 April, National Weather Service observers NW of the volcano both in Cold Bay and on a ship saw incandescent lava at the summit and snow melt running down the NW flank. A small steam plume with little or no ash developed as hot lava contacted snow at the summit. Tremor remained elevated.
On 19 April at 1145 a pilot saw a steam-and-ash plume that reached ~9 km altitude. In accord with this observation, tremor amplitudes increased dramatically after 1133 in the wake of a steady, two-day tremor increase. Observers interpreted these as signs of a significant eruption and raised the hazard status to Red. By early afternoon the eruption column reached at least 13.7 km altitude. The eruption lasted about 7 hours with one ash plume at higher elevations moving N and another, at lower elevations, S. Aviation warnings ("Graphic Volcanic Meteorological Impact Statements") for 0410-1610 on 19 April indicated two separate areas to avoid; one area spread ~300 km N over an elliptically shaped zone and the other, ~500 km S over a broadly spreading pattern that also included a lobe reaching ~375 km NW of Shishaldin (to Chignik). Late on the night of 19 April seismic tremor decreased substantially, but the Strombolian eruption continued at moderate levels.
On 20 April at about 0345, seismicity abruptly and significantly declined, indicating that explosive activity had subsided; still, satellite imagery after 0650 (1450 GMT) revealed a summit-crater thermal anomaly. Authorities decreased the hazard status to Orange. Seismic activity increased again about 1600. The increase in seismicity strengthened at about 2300 and on the morning of 21 April reached levels similar to those recorded in the hours before the explosive eruption on 19 April, and the hazard status returned to Red. Moderate Strombolian eruptions were thought to be occurring, though at the time satellite imagery failed to show a major ash cloud.
A moderate Strombolian eruption occurred through the night of 21 April. Seismicity became elevated and a very large thermal anomaly became visible on satellite imagery. Lava fountains shot tens of meters above the summit and satellite imagery indicated occasional steam and clouds of sparse ash extending for less than 50 km at altitudes under 5,000 m.
Geologic Background. The symmetrical glacier-covered Shishaldin in the Aleutian Islands is the westernmost of three large stratovolcanoes in the eastern half of Unimak Island. The Aleuts named the volcano Sisquk, meaning "mountain which points the way when I am lost." Constructed atop an older glacially dissected edifice, it is largely basaltic in composition. Remnants of an older edifice are exposed on the W and NE sides at 1,500-1,800 m elevation. There are over two dozen pyroclastic cones on its NW flank, which is covered by massive aa lava flows. Frequent explosive activity, primarily consisting of Strombolian ash eruptions from the small summit crater, but sometimes producing lava flows, has been recorded since the 18th century. A steam plume often rises from the summit crater.
Information Contacts: Alaska Volcano Observatory (AVO), a cooperative program of a) U.S. Geological Survey, 4200 University Drive, Anchorage, AK 99508-4667, USA (URL: http://www.avo.alaska.edu/), b) Geophysical Institute, University of Alaska, PO Box 757320, Fairbanks, AK 99775-7320, USA, and c) Alaska Division of Geological & Geophysical Surveys, 794 University Ave., Suite 200, Fairbanks, AK 99709, USA.
Tenorio (Costa Rica) — March 1999 Cite this Report
Tenorio
Costa Rica
10.673°N, 85.015°W; summit elev. 1916 m
All times are local (unless otherwise noted)
Tectonic earthquake swarm in late 1998
Tenorio volcano is located between Rincón de la Vieja (to the NW) and Arenal (to the SE). This region now has a new telemetric, digital seismic network consisting of six stations. Although not well instrumented for seismic measurements, Tenorio normally has very little seismic activity. In contrast to this historically moderate seismicity, an earthquake swarm with many tectonic events was recorded at both Tenorio and nearby Miravalles volcano during October and November 1997 (BGVN 22:10).
During October-November 1998 a total of 170 microearthquakes were recorded in the Tenorio area, 82 of which were located. Most events were recorded during 17-23 October, with up to 10 felt by people near the epicenter in Tierras Morenas (Barquero and Taylor, 1998). Magnitudes were 0.9-3.3 at depths of 0.5-10 km (most <2 km) and a maximum intensity of MM IV.
Within the Tenorio area are several fault systems oriented mainly NW-SE and NE-SW. There are also complex old volcanic caldera structures. The seismic swarms recorded in 1997 and 1998 denoted tectonic activity in these fault systems, considered neotectonic structures, and so they are not thought to be related to volcanic activity.
References. Barquero, R., and Taylor, W., 1998, Proyecto Geotérmico Tenorio: Los enjambres sísmicos periodo octubre-noviembre de 1997 y 1998: Informe preliminar. Inf. OSV 98.11 ICE, 15 p.
Further References. Boschini, I., 1998, Análisis preliminar del enjambre de sismos de la región de Miravalles-Tenorio de octubre y noviembre de 1997: Inf. OSV 98.08 ICE, 36 p.
ENEL, 1990: Estudios de reconocimiento y prefactibilidad geotérmica en la República de Costa Rica. Fase II. Estudio de prefactiblidad del area de Tenorio: Informe de Síntesis, 66 p.
ICE-ELC, 1983, informe geo-vulcanológico, Pyrotecto Geotérmico Miravalles: Informe interno ICE, 53 p.
Guillot, P.Y., Chiesa, S., and Alvarado, G., 1994, Chronostratigraphy of Upper Miocene-Quaternary volcanism in northern Costa Rica: Rev. Geol. Amér. Central, v. 17, p. 45-53.
Geologic Background. The 225 km2 dominantly andesitic Tenorio volcanic massif anchors the SE end of the Guanacaste Range and consists of a cluster of densely forested NNW-SSE-trending volcanic cones. Overlapping lava flows from the principal peak, Tenorio, cover the NW-to-SW flanks and descend the NE flank. The NW-most of three craters on the central cone is sparsely vegetated and appears to be the most recently active. Volcán Montezuma to the north has two craters, the northern of which was the source of a lava flow to the NE. Additional pyroclastic cones are found to the NE and SW of the central complex, and the Bijagua lava domes were constructed on the N flank. A major debris avalanche covered about 100 km2 below the S flank. A legend exists of an eruption in 1816 CE, but the volcano was densely forested at the time of an 1864 visit by Seebach and no documented eruptions are known. Fumarolic activity is present on the NE flank.
Information Contacts: Rafael Barquero, Observatorio Sismológico y Vulcanológico Arenal-Miravalles (OSIVAM), Instituo Costaricense de Electricidad (ICE), Apdo. 10032-1000, San José, Costa Rica.
Terceira (Portugal) — March 1999 Cite this Report
Terceira
Portugal
38.73°N, 27.32°W; summit elev. 1023 m
All times are local (unless otherwise noted)
Migrating vents; floating blocks with large internal cavities ("lava balloons")
During February and March 1999 the submarine eruption that began late 1998 continued at the Serreta volcanic ridge, ~9-14 km W of Terceira island (BGVN 23:01; Luis and others, 1999). The activity decreased slightly until the end of February, but eruptive areas clearly defined two main volcanic trends in both NE-SW and NW-SE directions (figure 2). In March, activity became less vigorous and observers saw sea surface manifestations only during intermittent short periods.
The eruption of Serreta is interpreted as being a fissure-style vent that started along a NE-SW fracture system over 5 km long. During the eruption, the regional NW-SE fracture system also reactivated and eruptive vents developed on these two main trends. Plotting vent locations on published bathymetric maps made by the Instituto Hidrográfico puts them at depths of 300-800 m. However, bathymetric surveys carried out by the Portuguese Navy between January and March detected big anomalies in the area, perhaps due to gas bubbles, volcanic particles, and sharp thermal boundaries. Well-constrained depths for the active vents remain unknown and construction of a new bathymetric map of the area was planned for April.
This eruption involved basaltic, and probably very gas-rich, magma. Petrographic studies of the collected rock samples revealed olivine, pyroxene, and feldspars phenocrysts in a glassy groundmass with similar microlites that also include oxides. Chemical analysis made by colleagues from the Nordic Volcanological Institute showed that it is an alkaline magma with a composition along the magmatic trend defined by the Azores oceanic island basalts.
Floating blocks were seen on the surface (BGVN 23:01) and some were collected (figures 3 and 4). The scientific team attributed their seismic observations coupled with the floating blocks to the following mechanism. The magma, being low in viscosity, moves very easily through the already opened fractures and was thought to escape without producing high seismic signals. Floating lava blocks could result from the detachment of pillow-lava edges followed by the ascent of blocks with sufficient gas content. It is also possible that hot, gas-rich lava fragments result from small submarine lava lakes or fountains. A thin frozen skin of lava seals the gas cavity, and the block might then rise as a hot lava balloon. During ascent, the gas exsolves and nucleates inside the hot fragment while the blocks expand. Once at the surface the interaction between the hot blocks and the seawater produces white steam columns. At the same time, while cooling at the surface, the blocks crack slowly, lose their magmatic gas and sink. Sometimes when water enters inside the hot blocks, they blow up, violently throwing fragments several meters high.
Since the beginning of this volcanic crisis the physical and chemical parameters of waters and fumarolic gases from the Terceira Island have been monitored and no changes have been detected. Azores Civil Protection (SRPCA) devised a series of emergency plans.
Another submarine eruption took place near the current one in mid-1867 (figure 1). Five months of strong seismicity around the time of the eruption destroyed about 200 houses on Terceira in the coastal settlement of Serreta. Websites associated with Azores civil defense and a local TV station have more photos of the eruption, including floating blocks.
References. Azores civil defense website, April 1999, Açores crise sismovulcania: URL:.
Luis, J.F., Lourenço, N., Miranda, J.M., Gaspar, J.L., and G. Queiroz, 1999, A submarine eruption W of Terceira Island (Azores Archipelao): InterRidge News, Initiative for international cooperation in ridge-crest studies, vol. 8, no. 1, Spring 1999, p. 13-14.
Machado, F., 1967, Active volcanoes of the Azores, in Neumann Van Padang, M., and others, 1967, Catalogue of the Active Volcanoes of the World: International Assoc. of Volcanology, Part XXI, p. 28-30.
Geologic Background. Terceira Island contains multiple stratovolcanoes constructed along a prominent ESE-WNW fissure zone that cuts across the island. Historically active Santa Barbara volcano at the western end of the island is truncated by two calderas, the youngest of which formed about 15,000 years ago. Comenditic lava domes fill and surround the caldera. Pico Alto lies north of the fissure zone in the north-central part of the island and contains a Pleistocene caldera largely filled by lava domes and lava flows. Guilherme Moniz caldera lies along the fissure zone immediately to the south, and 7-km-wide Cinquio Picos caldera is at the SE end of the island. Historical eruptions have occurred from Pico Alto, the fissure zone between Pico Alto and Santa Barbara, and from submarine vents west of Santa Barbara. Most Holocene eruptions have produced basaltic-to-rhyolitic lava flows from the fissure zone.
Information Contacts: J.L. Gaspar, T. Ferreira, G. Queiroz, R. Coutinho, M.H. Almeida, N. Wallenstein, and J.M. Pacheco, Centre of Volcanology of the Azores University (CVUA), Departamento de Geociencias, Rua da Mae de Deus, 9502 Ponta Delgada, Azores, Portugal (URL: http://www.uac.pt/).
Unnamed
Tonga
20.852°S, 175.55°W; summit elev. -296 m
All times are local (unless otherwise noted)
Eruption NW of Tongatapu builds temporary island in January
This volcanic center in the Tonga Islands, 35 km NW of Tongatapu (figure 1) and S of Falcon Island, forms part of the Tofua Volcanic Arc (TVA). The following report was compiled from various sources, as well as a submission from Paul Taylor based in part on information obtained from Tongan colleagues.
The Tonga Chronicle noted that the activity was first reported to Tonga Defense Services on 8 January by Carl Riechelmann, who had seen a plume coming from the site. On 12 January 1999 the Tonga Defence Services flew a photographic mission to record the reported appearance of a new island. Shortly after departing Tongatapu's Fua'amoto Airport in a Twin Beech equipped for surveillance operations, the crew sighted billowing white plumes from the volcano. The aircraft approached cautiously at 300 m altitude, made one circuit, then descended to 150 m for closer observation. The plane circled for almost an hour while a series of still photographs, as well as a video, were taken. During this time the crew noted that the island appeared to exhibit a pattern of rising, then receding. The island was estimated to be roughly 200-300 m long and 30-40 m wide. The crew also saw lava in a small vent that appeared to be located within a 100-m cone. The island was located at 20° 51.55'S, 175° 32.47'W (20.86°S, 175.54°W). Photographs and a report of their observations were posted on the website of Tonga Cable and Wireless.
Submarine activity continued on 14 January, with turbulent water present around a 40 x 300 m shoal, but no island was observed. Reports described a vent producing an ash-and-steam column and ejecting lava fragments, and floating pumice near the eruption site.
A precautionary Notice to Airmen (NOTAM) was issued to aviators on 14 January by the Nadi Aviation Control Center declaring an area within 5.5 km of the eruption site a danger area. Pilots were requested to report any signs of volcanic activity. Tongan officials also issued a warning to shipping transiting the area.
On 15 January a survey team, including two geologists from the Ministry of Land, Survey, and Natural Resources, inspected the island from the deck of the VOEA Savea, according to a report in the Tonga Chronicle. At that time the island had disappeared beneath the ocean surface, but the site was still emitting smoke and fumes. Because of possible danger, boats were warned to stay away.
Geologic Background. An unnamed submarine volcano is located along the Tofus volcanic arc 35 km NW of the Niu Aunofo lighthouse on Tongatapu Island. The first documented eruptions took place in 1911 and 1923; an ephemeral island was formed in 1999. A submarine eruption in January 2017 produced discolored water visible in satellite imagery.
Information Contacts: Paul W. Taylor, Australian Volcanological Investigations, PO Box 291, Pymble, NSW 2073, Australia; Kelepi Mafi, Ministry of Lands, Survey, and Natural Resources, P.O. Box 5, Nuku'Alofa, Kingdom of Tonga; Tonga Cable and Wireless, Private Bag 4, Nuku'alofa, Kingdom of Tonga (URL: http://www.candw.to/); Tonga Chronicle, PO Box 197, Nuku'alofa, Kingdom of Tonga; Tom Fox, International Civil Aviation Organization, 999 University Street, Montreal, Quebec H3C 5H7, Canada; Brad Scott, Wairakei Research Centre, Institute of Geological and Nuclear Sciences (IGNS) Limited, Private Bag 2000, Wairakei, New Zealand (URL: https://www.gns.cri.nz/).
Villarrica
Chile
39.42°S, 71.93°W; summit elev. 2847 m
All times are local (unless otherwise noted)
Three years of seasonal fluctuations in lava pond height
This report summarizes daily visual observations by members of the Proyecto de Observación Villarrica during December 1998 to March 1999. From mid-October through November 1998 team members noted a descent in the lava pond and a drop in visible activity (BGVN 23:11). On 2, 3 and 5 December 1998 a faint red glow was visible above the summit. Afterwards the magma was thought to have reached its lowest level.
When Jürg Alean visited the summit on 21 January, the faint noises caused by degassing could be clearly heard. No recent impacts of bombs were seen in the crater. Early on 5 February, after a break of 2 months, the lava pond reappeared on the crater floor. At about 1300 on 21 February observers saw several dark ash and gas emissions. During 1-26 March the summit remained cloud-covered but apparently little magmatic activity occurred. In the evenings of 29 and 31 March, observers saw glowing pyroclastic material ejected from the crater.
During 1998 the magma column underwent a complete cycle of activity. In January 1998 the column had reached its low; during February-March, the column began slow ascent. From March to September, the column reached hydrostatic equilibrium with its upper surface at the crater floor and this accompanied displays of weak-to-moderate Strombolian eruptions and convective activity in the lava pond. During October-December the column slowly subsided and by January 1999 it again stood at a low level in the vent.
This seasonal sequence has been observed in successive years since 1997 (BGVN 22:04 and 22:08). The seasonal changes in snow and ice mass on the volcano and a well-developed hydrothermal system may affect the magma within the volcanic edifice in a cyclic manner.
Geologic Background. The glacier-covered Villarrica stratovolcano, in the northern Lakes District of central Chile, is ~15 km south of the city of Pucon. A 2-km-wide caldera that formed about 3,500 years ago is located at the base of the presently active, dominantly basaltic to basaltic-andesite cone at the NW margin of a 6-km-wide Pleistocene caldera. More than 30 scoria cones and fissure vents are present on the flanks. Plinian eruptions and pyroclastic flows that have extended up to 20 km from the volcano were produced during the Holocene. Lava flows up to 18 km long have issued from summit and flank vents. Eruptions documented since 1558 CE have consisted largely of mild-to-moderate explosive activity with occasional lava effusion. Glaciers cover 40 km2 of the volcano, and lahars have damaged towns on its flanks.
Information Contacts: Jürg Alean, Stromboli On-Line, Rheinstrasse 6, CH-8193 Egisau, Switzerland (URL: http://www.swisseduc.ch/stromboli/); Werner Keller Ulrich, Proyecto de Observacion Villarrica (P.O.V.I.), Casilla 150, Correo Villa La Reina, Santiago, Chile (URL: https://www.povi.cl/).