Recently Published Bulletin Reports
Kadovar (Papua New Guinea) An ash plume and weak thermal anomaly during May 2023
San Miguel (El Salvador) Small gas-and-ash explosions during March and May 2023
Ebeko (Russia) Continued explosions, ash plumes, and ashfall during October 2022-May 2023
Home Reef (Tonga) Discolored plumes continued during November 2022-April 2023
Semisopochnoi (United States) Occasional explosions, ash deposits, and gas-and-steam plumes during December 2022-May 2023
Ambae (Vanuatu) New lava flow, ash plumes, and sulfur dioxide plumes during February-May 2023
Ibu (Indonesia) Daily ash explosions continue, along with thermal anomalies in the crater, October 2022-May 2023
Dukono (Indonesia) Continuing ash emissions, SO2 plumes, and thermal signals during October 2022-May 2023
Sabancaya (Peru) Explosions, gas-and-ash plumes, and thermal activity persist during November 2022-April 2023
Sheveluch (Russia) Significant explosions destroyed part of the lava-dome complex during April 2023
Bezymianny (Russia) Explosions, ash plumes, lava flows, and avalanches during November 2022-April 2023
Chikurachki (Russia) New explosive eruption during late January-early February 2023
Kadovar (Papua New Guinea) — June 2023  Cite this Report
Kadovar
Papua New Guinea
3.608°S, 144.588°E; summit elev. 365 m
All times are local (unless otherwise noted)
An ash plume and weak thermal anomaly during May 2023
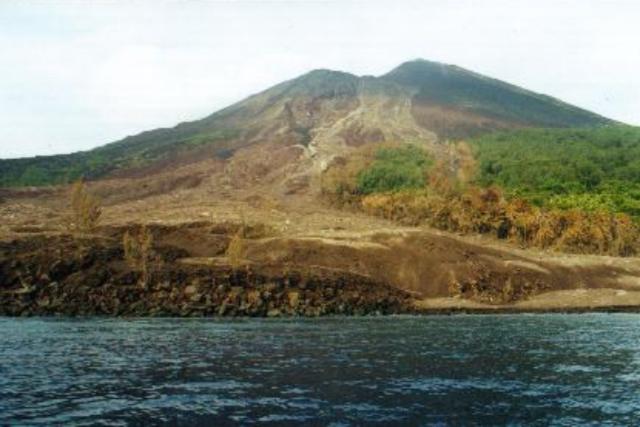
Kadovar is a 2-km-wide island that is the emergent summit of a Bismarck Sea stratovolcano. It lies off the coast of New Guinea, about 25 km N of the mouth of the Sepik River. Prior to an eruption that began in 2018, a lava dome formed the high point of the volcano, filling an arcuate landslide scarp open to the S. Submarine debris-avalanche deposits occur to the S of the island. The current eruption began in January 2018 and has comprised lava effusion from vents at the summit and at the E coast; more recent activity has consisted of ash plumes, weak thermal activity, and gas-and-steam plumes (BGVN 48:02). This report covers activity during February through May 2023 using information from the Darwin Volcanic Ash Advisory Center (VAAC) and satellite data.
Activity during the reporting period was relatively low and mainly consisted of white gas-and-steam plumes that were visible in natural color satellite images on clear weather days (figure 67). According to a Darwin VAAC report, at 2040 on 6 May an ash plume rose to 4.6 km altitude and drifted W; by 2300 the plume had dissipated. MODIS satellite instruments using the MODVOLC thermal algorithm detected a single thermal hotspot on the SE side of the island on 7 May. Weak thermal activity was also detected in a satellite image on the E side of the island on 14 May, accompanied by a white gas-and-steam plume that drifted SE (figure 68).
Geologic Background. The 2-km-wide island of Kadovar is the emergent summit of a Bismarck Sea stratovolcano of Holocene age. It is part of the Schouten Islands, and lies off the coast of New Guinea, about 25 km N of the mouth of the Sepik River. Prior to an eruption that began in 2018, a lava dome formed the high point of the andesitic volcano, filling an arcuate landslide scarp open to the south; submarine debris-avalanche deposits occur in that direction. Thick lava flows with columnar jointing forms low cliffs along the coast. The youthful island lacks fringing or offshore reefs. A period of heightened thermal phenomena took place in 1976. An eruption began in January 2018 that included lava effusion from vents at the summit and at the E coast.
Information Contacts: Darwin Volcanic Ash Advisory Centre (VAAC), Bureau of Meteorology, Northern Territory Regional Office, PO Box 40050, Casuarina, NT 0811, Australia (URL: http://www.bom.gov.au/info/vaac/); Hawai'i Institute of Geophysics and Planetology (HIGP) - MODVOLC Thermal Alerts System, School of Ocean and Earth Science and Technology (SOEST), Univ. of Hawai'i, 2525 Correa Road, Honolulu, HI 96822, USA (URL: http://modis.higp.hawaii.edu/); Copernicus Browser, Copernicus Data Space Ecosystem, European Space Agency (URL: https://dataspace.copernicus.eu/browser/).
San Miguel (El Salvador) — June 2023 Cite this Report
San Miguel
El Salvador
13.434°N, 88.269°W; summit elev. 2130 m
All times are local (unless otherwise noted)
Small gas-and-ash explosions during March and May 2023
San Miguel in El Salvador is a broad, deep crater complex that has been frequently modified by eruptions recorded since the early 16th century and consists of the summit known locally as Chaparrastique. Flank eruptions have produced lava flows that extended to the N, NE, and SE during the 17-19th centuries. The most recent activity has consisted of minor ash eruptions from the summit crater. The current eruption period began in November 2022 and has been characterized by frequent phreatic explosions, gas-and-ash emissions, and sulfur dioxide plumes (BGVN 47:12). This report describes small gas-and-ash explosions during December 2022 through May 2023 based on special reports from the Ministero de Medio Ambiente y Recursos Naturales (MARN).
Activity has been relatively low since the last recorded explosions on 29 November 2022. Seismicity recorded by the San Miguel Volcano Station (VSM) located on the N flank at 1.7 km elevation had decreased by 7 December. Sulfur dioxide gas measurements taken with DOAS (Differential Optical Absorption Spectroscopy) mobile equipment were below typical previously recorded values: 300 tons per day (t/d). During December, small explosions were recorded by the seismic network and manifested as gas-and-steam emissions.
Gas-and-ash explosions in the crater occurred during January 2023, which were recorded by the seismic network. Sulfur dioxide values remained low, between 300-400 t/d through 10 March. At 0817 on 14 January a gas-and-ash emission was visible in webcam images, rising just above the crater rim. Some mornings during February, small gas-and-steam plumes were visible in the crater. On 7 March at 2252 MARN noted an increase in degassing from the central crater; gas emissions were constantly observed through the early morning hours on 8 March. During the early morning of 8 March through the afternoon on 9 March, 12 emissions were registered, some accompanied by ash. The last gas-and-ash emission was recorded at 1210 on 9 March; very fine ashfall was reported in El Tránsito (10 km S), La Morita (6 km W), and La Piedrita (3 km W). The smell of sulfur was reported in Piedra Azul (5 km SW). On 16 March MARN reported that gas-and-steam emissions decreased.
Low degassing and very low seismicity were reported during April; no explosions have been detected between 9 March and 27 May. The sulfur dioxide emissions remained between 350-400 t/d; during 13-20 April sulfur dioxide values fluctuated between 30-300 t/d. Activity remained low through most of May; on 23 May seismicity increased. An explosion was detected at 1647 on 27 May generated a gas-and-ash plume that rose 700 m high (figure 32); a decrease in seismicity and gas emissions followed. The DOAS station installed on the W flank recorded sulfur dioxide values that reached 400 t/d on 27 May; subsequent measurements showed a decrease to 268 t/d on 28 May and 100 t/d on 29 May.
Geologic Background. The symmetrical cone of San Miguel, one of the most active volcanoes in El Salvador, rises from near sea level to form one of the country's most prominent landmarks. A broad, deep, crater complex that has been frequently modified by eruptions recorded since the early 16th century caps the truncated unvegetated summit, also known locally as Chaparrastique. Flanks eruptions of the basaltic-andesitic volcano have produced many lava flows, including several during the 17th-19th centuries that extended to the N, NE, and SE. The SE-flank flows are the largest and form broad, sparsely vegetated lava fields crossed by highways and a railroad skirting the base of the volcano. Flank vent locations have migrated higher on the edifice during historical time, and the most recent activity has consisted of minor ash eruptions from the summit crater.
Information Contacts: Ministero de Medio Ambiente y Recursos Naturales (MARN), Km. 5½ Carretera a Nueva San Salvador, Avenida las Mercedes, San Salvador, El Salvador (URL: http://www.snet.gob.sv/ver/vulcanologia).
Ebeko
Russia
50.686°N, 156.014°E; summit elev. 1103 m
All times are local (unless otherwise noted)
Continued explosions, ash plumes, and ashfall during October 2022-May 2023
Ebeko, located on the N end of Paramushir Island in the Kuril Islands, consists of three summit craters along a SSW-NNE line at the northern end of a complex of five volcanic cones. Eruptions date back to the late 18th century and have been characterized as small-to-moderate explosions from the summit crater, accompanied by intense fumarolic activity. The current eruption period began in June 2022 and has recently consisted of frequent explosions, ash plumes, and thermal activity (BGVN 47:10). This report covers similar activity during October 2022 through May 2023, based on information from the Kamchatka Volcanic Eruptions Response Team (KVERT) and satellite data.
Activity during October consisted of explosive activity, ash plumes, and occasional thermal anomalies. Visual data by volcanologists from Severo-Kurilsk showed explosions producing ash clouds up to 2.1-3 km altitude which drifted E, N, NE, and SE during 1-8, 10, 16, and 18 October. KVERT issued several Volcano Observatory Notices for Aviation (VONA) on 7, 13-15, and 27 October 2022, stating that explosions generated ash plumes that rose to 2.3-4 km altitude and drifted 5 km E, NE, and SE. Ashfall was reported in Severo-Kurilsk (Paramushir Island, about 7 km E) on 7 and 13 October. Satellite data showed a thermal anomaly over the volcano on 15-16 October. Visual data showed ash plumes rising to 2.5-3.6 km altitude on 22, 25-29, and 31 October and moving NE due to constant explosions.
Similar activity continued during November, with explosions, ash plumes, and ashfall occurring. KVERT issued VONAs on 1-2, 4, 6-7, 9, 13, and 16 November that reported explosions and resulting ash plumes that rose to 1.7-3.6 km altitude and drifted 3-5 km SE, ESE, E, and NE. On 1 November ash plumes extended as far as 110 km SE. On 5, 8, 12, and 24-25 November explosions and ash plumes rose to 2-3.1 km altitude and drifted N and E. Ashfall was observed in Severo-Kurilsk on 7 and 16 November. A thermal anomaly was visible during 1-4, 16, and 20 November. Explosions during 26 November rose as high as 2.7 km altitude and drifted NE (figure 45).
Explosions and ash plumes continued to occur in December. During 1-2 and 4 December volcanologists from Severo-Kurilsk observed explosions that sent ash to 1.9-2.5 km altitude and drifted NE and SE (figure 46). VONAs were issued on 5, 9, and 16 December reporting that explosions generated ash plumes rising to 1.9 km, 2.6 km, and 2.4 km altitude and drifted 5 km SE, E, and NE, respectively. A thermal anomaly was visible in satellite imagery on 16 December. On 18 and 27-28 December explosions produced ash plumes that rose to 2.5 km altitude and drifted NE and SE. On 31 December an ash plume rose to 2 km altitude and drifted NE.
Explosions continued during January 2023, based on visual observations by volcanologists from Severo-Kurilsk. During 1-7 January explosions generated ash plumes that rose to 4 km altitude and drifted NE, E, W, and SE. According to VONAs issued by KVERT on 2, 4, 10, and 23 January, explosions produced ash plumes that rose to 2-4 km altitude and drifted 5 km N, NE, E, and ENE; the ash plume that rose to 4 km altitude occurred on 10 January (figure 47). Satellite data showed a thermal anomaly during 3-4, 10, 13, 16, 21, 22, and 31 January. KVERT reported that an ash cloud on 4 January moved 12 km NE. On 6 and 9-11 January explosions sent ash plumes to 4.5 km altitude and drifted W and ESE. On 13 January an ash plume rose to 3 km altitude and drifted SE. During 20-24 January ash plumes from explosions rose to 3.7 km altitude and drifted SE, N, and NE. On 21 January the ash plume drifted as far as 40 km NE. During 28-29 and 31 January and 1 February ash plumes rose to 4 km altitude and drifted NE.
During February, explosions, ash plumes, and ashfall were reported. During 1, 4-5 and 7-8 February explosions generated ash plumes that rose to 4.5 km altitude and drifted E and NE; ashfall was observed on 5 and 8 February. On 6 February an explosion produced an ash plume that rose to 3 km altitude and drifted 7 km E, causing ashfall in Severo-Kurilsk. A thermal anomaly was visible in satellite data on 8, 9, 13, and 21 February. Explosions on 9 and 12-13 February produced ash plumes that rose to 4 km altitude and drifted E and NE; the ash cloud on 12 February extended as far as 45 km E. On 22 February explosions sent ash to 3 km altitude that drifted E. During 24 and 26-27 February ash plumes rose to 4 km altitude and drifted E. On 28 February an explosion sent ash to 2.5-3 km altitude and drifted 5 km E; ashfall was observed in Severo-Kurilsk.
Activity continued during March; visual observations showed that explosions generated ash plumes that rose to 3.6 km altitude on 3, 5-7, and 9-12 March and drifted E, NE, and NW. Thermal anomalies were visible on 10, 13, and 29-30 March in satellite imagery. On 18, 21-23, 26, and 29-30 March explosions produced ash plumes that rose to 2.8 km altitude and drifted NE and E; the ash plumes during 22-23 March extended up to 76 km E. A VONA issued on 21 March reported an explosion that produced an ash plume that rose to 2.8 km altitude and drifted 5 km E. Another VONA issued on 23 March reported that satellite data showed an ash plume rising to 3 km altitude and drifted 14 km E.
Explosions during April continued to generate ash plumes. On 1 and 4 April an ash plume rose to 2.8-3.5 km altitude and drifted SE and NE. A thermal anomaly was visible in satellite imagery during 1-6 April. Satellite data showed ash plumes and clouds rising to 2-3 km altitude and drifting up to 12 km SW and E on 3 and 6 April (figure 48). KVERT issued VONAs on 3, 5, 14, 16 April describing explosions that produced ash plumes rising to 3 km, 3.5 km, 3.5 km, and 3 km altitude and drifting 5 km S, 5 km NE and SE, 72 km NNE, and 5 km NE, respectively. According to satellite data, the resulting ash cloud from the explosion on 14 April was 25 x 7 km in size and drifted 72-104 km NNE during 14-15 April. According to visual data by volcanologists from Severo-Kurilsk explosions sent ash up to 3.5 km altitude that drifted NE and E during 15-16, 22, 25-26, and 29 April.
The explosive eruption continued during May. Explosions during 3-4, 6-7, and 9-10 May generated ash plumes that rose to 4 km altitude and drifted SW and E. Satellite data showed a thermal anomaly on 3, 9, 13-14, and 24 May. During 12-16, 23-25, and 27-28 May ash plumes rose to 3.5 km altitude and drifted in different directions due to explosions. Two VONA notices were issued on 16 and 25 May, describing explosions that generated ash plumes rising to 3 km and 3.5 km altitude, respectively and extending 5 km E. The ash cloud on 25 May drifted 75 km SE.
Thermal activity in the summit crater, occasionally accompanied by ash plumes and ash deposits on the SE and E flanks due to frequent explosions, were visible in infrared and true color satellite images (figure 49).
Geologic Background. The flat-topped summit of the central cone of Ebeko volcano, one of the most active in the Kuril Islands, occupies the northern end of Paramushir Island. Three summit craters located along a SSW-NNE line form Ebeko volcano proper, at the northern end of a complex of five volcanic cones. Blocky lava flows extend west from Ebeko and SE from the neighboring Nezametnyi cone. The eastern part of the southern crater contains strong solfataras and a large boiling spring. The central crater is filled by a lake about 20 m deep whose shores are lined with steaming solfataras; the northern crater lies across a narrow, low barrier from the central crater and contains a small, cold crescentic lake. Historical activity, recorded since the late-18th century, has been restricted to small-to-moderate explosive eruptions from the summit craters. Intense fumarolic activity occurs in the summit craters, on the outer flanks of the cone, and in lateral explosion craters.
Information Contacts: Kamchatka Volcanic Eruptions Response Team (KVERT), Far Eastern Branch, Russian Academy of Sciences, 9 Piip Blvd., Petropavlovsk-Kamchatsky, 683006, Russia (URL: http://www.kscnet.ru/ivs/kvert/); MIROVA (Middle InfraRed Observation of Volcanic Activity), a collaborative project between the Universities of Turin and Florence (Italy) supported by the Centre for Volcanic Risk of the Italian Civil Protection Department (URL: http://www.mirovaweb.it/); Copernicus Browser, Copernicus Data Space Ecosystem, European Space Agency (URL: https://dataspace.copernicus.eu/browser/).
Home Reef
Tonga
18.992°S, 174.775°W; summit elev. -10 m
All times are local (unless otherwise noted)
Discolored plumes continued during November 2022-April 2023
Home Reef is a submarine volcano located in the central Tonga islands between Lateiki (Metis Shoal) and Late Island. The first recorded eruption occurred in the mid-19th century, when an ephemeral island formed. An eruption in 1984 produced a 12-km-high eruption plume, a large volume of floating pumice, and an ephemeral island 500 x 1,500 m wide, with cliffs 30-50 m high that enclosed a water-filled crater. Another island-forming eruption in 2006 produced widespread pumice rafts that drifted as far as Australia; by 2008 the island had eroded below sea level. The previous eruption occurred during October 2022 and was characterized by a new island-forming eruption, lava effusion, ash plumes, discolored water, and gas-and-steam plumes (BGVN 47:11). This report covers discolored water plumes during November 2022 through April 2023 using satellite data.
Discolored plumes continued during the reporting period and were observed in true color satellite images on clear weather days. Satellite images show light green-yellow discolored water extending W on 8 and 28 November 2022 (figure 31), and SW on 18 November. Light green-yellow plumes extended W on 3 December, S on 13 December, SW on 18 December, and W and S on 23 December (figure 31). On 12 January 2023 discolored green-yellow plumes extended to the NE, E, SE, and N. The plume moved SE on 17 January and NW on 22 January. Faint discolored water in February was visible moving NE on 1 February. A discolored plume extended NW on 8 and 28 March and NW on 13 March (figure 31). During April, clear weather showed green-blue discolored plumes moving S on 2 April, W on 7 April, and NE and S on 12 April. A strong green-yellow discolored plume extended E and NE on 22 April for several kilometers (figure 31).
Geologic Background. Home Reef, a submarine volcano midway between Metis Shoal and Late Island in the central Tonga islands, was first reported active in the mid-19th century, when an ephemeral island formed. An eruption in 1984 produced a 12-km-high eruption plume, large amounts of floating pumice, and an ephemeral 500 x 1,500 m island, with cliffs 30-50 m high that enclosed a water-filled crater. In 2006 an island-forming eruption produced widespread dacitic pumice rafts that drifted as far as Australia. Another island was built during a September-October 2022 eruption.
Information Contacts: Copernicus Browser, Copernicus Data Space Ecosystem, European Space Agency (URL: https://dataspace.copernicus.eu/browser/).
Semisopochnoi (United States) — June 2023 Cite this Report
Semisopochnoi
United States
51.93°N, 179.58°E; summit elev. 1221 m
All times are local (unless otherwise noted)
Occasional explosions, ash deposits, and gas-and-steam plumes during December 2022-May 2023
Semisopochnoi is located in the western Aleutians, is 20-km-wide at sea level, and contains an 8-km-wide caldera. The three-peaked Mount Young (formerly Cerberus) was constructed within the caldera during the Holocene. Each of these peaks contains a summit crater; the lava flows on the N flank appear younger than those on the S side. The current eruption period began in early February 2021 and has more recently consisted of intermittent explosions and ash emissions (BGVN 47:12). This report updates activity during December 2022 through May 2023 using daily, weekly, and special reports from the Alaska Volcano Observatory (AVO). AVO monitors the volcano using local seismic and infrasound sensors, satellite data, web cameras, and remote infrasound and lightning networks.
Activity during most of December 2022 was relatively quiet; according to AVO no eruptive or explosive activity was observed since 7 November 2022. Intermittent tremor and occasional small earthquakes were observed in geophysical data. Continuous gas-and-steam emissions were observed from the N crater of Mount Young in webcam images on clear weather days (figure 25). On 24 December, there was a slight increase in earthquake activity and several small possible explosion signals were detected in infrasound data. Eruptive activity resumed on 27 December at the N crater of Mount Young; AVO issued a Volcano Activity Notice (VAN) that reported minor ash deposits on the flanks of Mount Young that extended as far as 1 km from the vent, according to webcam images taken during 27-28 December (figure 26). No ash plumes were observed in webcam or satellite imagery, but a persistent gas-and-steam plume that might have contained some ash rose to 1.5 km altitude. As a result, AVO raised the Aviation Color Code (ACC) to Orange (the second highest level on a four-color scale) and the Volcano Alert Level (VAL) to Watch (the second highest level on a four-level scale). Possible explosions were detected during 21 December 2022 through 1 January 2023 and seismic tremor was recorded during 30-31 December.
During January 2023 eruptive activity continued at the active N crater of Mount Young. Minor ash deposits were observed on the flanks, extending about 2 km SSW, based on webcam images from 1 and 3 January. A possible explosion occurred during 1-2 January based on elevated seismicity recorded on local seismometers and an infrasound signal recorded minutes later by an array at Adak. Though no ash plumes were observed in webcam or satellite imagery, a persistent gas-and-steam plume rose to 1.5 km altitude that might have carried minor traces of ash. Ash deposits were accompanied by periods of elevated seismicity and infrasound signals from the local geophysical network, which AVO reported were likely due to weak explosive activity. Low-level explosive activity was also detected during 2-3 January, with minor gas-and-steam emissions and a new ash deposit that was visible in webcam images. Low-level explosive activity was detected in geophysical data during 4-5 January, with elevated seismicity and infrasound signals observed on local stations. Volcanic tremor was detected during 7-9 January and very weak explosive activity was detected in seismic and infrasound data on 9 January. Weak seismic and infrasound signals were recorded on 17 January, which indicated minor explosive activity, but no ash emissions were observed in clear webcam images; a gas-and-steam plume continued to rise to 1.5 km altitude. During 29-30 January, ash deposits near the summit were observed on fresh snow, according to webcam images.
The active N cone at Mount Young continued to produce a gas-and-steam plume during February, but no ash emissions or explosive events were detected. Seismicity remained elevated with faint tremor during early February. Gas-and-steam emissions from the N crater were observed in clear webcam images on 11-13 and 16 February; no explosive activity was detected in seismic, infrasound, or satellite data. Seismicity has also decreased, with no significant seismic tremor observed since 25 January. Therefore, the ACC was lowered to Yellow (the second lowest level on a four-color scale) and the VAL was lowered to Advisory (the second lowest level on a four-color scale) on 22 February.
Gas-and-steam emissions persisted during March from the N cone of Mount Young, based on clear webcam images. A few brief episodes of weak tremor were detected in seismic data, although seismicity decreased over the month. A gas-and-steam plume detected in satellite data extended 150 km on 18 March. Low-level ash emissions from the N cone at Mount Young were observed in several webcam images during 18-19 March, in addition to small explosions and volcanic tremor. The ACC was raised to Orange and the VAL increased to Watch on 19 March. A small explosion was detected in seismic and infrasound data on 21 March.
Low-level unrest continued during April, although cloudy weather often obscured views of the summit; periods of seismic tremor and local earthquakes were recorded. During 3-4 April a gas-and-steam plume was visible traveling more than 200 km overnight; no ash was evident in the plume, according to AVO. A gas-and-steam plume was observed during 4-6 April that extended 400 km but did not seem to contain ash. Small explosions were detected in seismic and infrasound data on 5 April. Occasional clear webcam images showed continuing gas-and-steam emissions rose from Mount Young, but no ash deposits were observed on the snow. On 19 April small explosions and tremor were detected in seismic and infrasound data. A period of seismic tremor was detected during 22-25 April, with possible weak explosions on 25 April. Ash deposits were visible near the crater rim, but it was unclear if these deposits were recent or due to older deposits.
Occasional small earthquakes were recorded during May, but there were no signs of explosive activity seen in geophysical data. Gas-and-steam emissions continued from the N crater of Mount Young, based on webcam images, and seismicity remained slightly elevated. A new, light ash deposit was visible during the morning of 5 May on fresh snow on the NW flank of Mount Young. During 10 May periods of volcanic tremor were observed. The ACC was lowered to Yellow and the VAL to Advisory on 17 May due to no additional evidence of activity.
Geologic Background. Semisopochnoi, the largest subaerial volcano of the western Aleutians, is 20 km wide at sea level and contains an 8-km-wide caldera. It formed as a result of collapse of a low-angle, dominantly basaltic volcano following the eruption of a large volume of dacitic pumice. The high point of the island is Anvil Peak, a double-peaked late-Pleistocene cone that forms much of the island's northern part. The three-peaked Mount Cerberus (renamed Mount Young in 2023) was constructed within the caldera during the Holocene. Each of the peaks contains a summit crater; lava flows on the N flank appear younger than those on the south side. Other post-caldera volcanoes include the symmetrical Sugarloaf Peak SSE of the caldera and Lakeshore Cone, a small cinder cone at the edge of Fenner Lake in the NE part of the caldera. Most documented eruptions have originated from Young, although Coats (1950) considered that both Sugarloaf and Lakeshore Cone could have been recently active.
Information Contacts: Alaska Volcano Observatory (AVO), a cooperative program of a) U.S. Geological Survey, 4200 University Drive, Anchorage, AK 99508-4667 USA (URL: https://avo.alaska.edu/), b) Geophysical Institute, University of Alaska, PO Box 757320, Fairbanks, AK 99775-7320, USA, and c) Alaska Division of Geological & Geophysical Surveys, 794 University Ave., Suite 200, Fairbanks, AK 99709, USA (URL: http://dggs.alaska.gov/).
Ambae
Vanuatu
15.389°S, 167.835°E; summit elev. 1496 m
All times are local (unless otherwise noted)
New lava flow, ash plumes, and sulfur dioxide plumes during February-May 2023
Ambae, also known as Aoba, is a large basaltic shield volcano in Vanuatu. A broad pyroclastic cone containing three crater lakes (Manaro Ngoru, Voui, and Manaro Lakua) is located at the summit within the youngest of at least two nested calderas. Periodic phreatic and pyroclastic explosions have been reported since the 16th century. A large eruption more than 400 years ago resulted in a volcanic cone within the summit crater that is now filled by Lake Voui; the similarly sized Lake Manaro fills the western third of the caldera. The previous eruption ended in August 2022 that was characterized by gas-and-steam and ash emissions and explosions of wet tephra (BGVN 47:10). This report covers a new eruption during February through May 2023 that consisted of a new lava flow, ash plumes, and sulfur dioxide emissions, using information from the Vanuatu Meteorology and Geo-Hazards Department (VMGD) and satellite data.
During the reporting period, the Alert Level remained at a 2 (on a scale of 0-5), which has been in place since December 2021. Activity during October 2022 through March 2023 remained relatively low and mostly consisted of gas-and-steam emissions in Lake Voui. VMGD reported that at 1300 on 15 November a satellite image captured a strong amount of sulfur dioxide rising above the volcano (figure 99), and that seismicity slightly increased. The southern and northern part of the island reported a strong sulfur dioxide smell and heard explosions. On 20 February 2023 a gas-and-ash plume rose 1.3 km above the summit and drifted SSW, according to a webcam image (figure 100). Gas-and-steam and possibly ash emissions continued on 23 February and volcanic earthquakes were recorded by the seismic network.
During April, volcanic earthquakes and gas-and-steam and ash emissions were reported from the cone in Lake Voui. VMGD reported that activity increased during 5-7 April; high gas-and-steam and ash plumes were visible, accompanied by nighttime incandescence. According to a Wellington VAAC report, a low-level ash plume rose as high as 2.5 km above the summit and drifted W and SW on 5 April, based on satellite imagery. Reports in Saratamata stated that a dark ash plume drifted to the WSW, but no loud explosion was heard. Webcam images from 2100 showed incandescence above the crater and reflected in the clouds. According to an aerial survey, field observations, and satellite data, water was no longer present in the lake. A lava flow was reported effusing from the vent and traveling N into the dry Lake Voui, which lasted three days. The next morning at 0745 on 6 April a gas-and-steam and ash plume rose 5.4 km above the summit and drifted ESE, based on information from VMGD (figure 101). The Wellington VAAC also reported that light ashfall was observed on the island. Intermittent gas-and-steam and ash emissions were visible on 7 April, some of which rose to an estimated 3 km above the summit and drifted E. Webcam images during 0107-0730 on 7 April showed continuing ash emissions. A gas-and-steam and ash plume rose 695 m above the summit crater at 0730 on 19 April and drifted ESE, based on a webcam image (figure 102).
According to visual and infrared satellite data, water was visible in Lake Voui as late as 24 March 2023 (figure 103). The vent in the caldera showed a gas-and-steam plume drifted SE. On 3 April thermal activity was first detected, accompanied by a gas-and-ash plume that drifted W (figure 103). The lava flow moved N within the dry lake and was shown cooling by 8 April. By 23 April much of the water in the lake had returned. Occasional sulfur dioxide plumes were detected by the TROPOMI instrument on the Sentinel-5P satellite that exceeded 2 Dobson Units (DU) and drifted in different directions (figure 104).
Geologic Background. The island of Ambae, also known as Aoba, is a massive 2,500 km3 basaltic shield that is the most voluminous volcano of the New Hebrides archipelago. A pronounced NE-SW-trending rift zone with numerous scoria cones gives the 16 x 38 km island an elongated form. A broad pyroclastic cone containing three crater lakes (Manaro Ngoru, Voui, and Manaro Lakua) is located at the summit within the youngest of at least two nested calderas, the largest of which is 6 km in diameter. That large central edifice is also called Manaro Voui or Lombenben volcano. Post-caldera explosive eruptions formed the summit craters about 360 years ago. A tuff cone was constructed within Lake Voui (or Vui) about 60 years later. The latest known flank eruption, about 300 years ago, destroyed the population of the Nduindui area near the western coast.
Information Contacts: Geo-Hazards Division, Vanuatu Meteorology and Geo-Hazards Department (VMGD), Ministry of Climate Change Adaptation, Meteorology, Geo-Hazards, Energy, Environment and Disaster Management, Private Mail Bag 9054, Lini Highway, Port Vila, Vanuatu (URL: http://www.vmgd.gov.vu/, https://www.facebook.com/VanuatuGeohazardsObservatory/); Wellington Volcanic Ash Advisory Centre (VAAC), Meteorological Service of New Zealand Ltd (MetService), PO Box 722, Wellington, New Zealand (URL: http://www.metservice.com/vaac/, http://www.ssd.noaa.gov/VAAC/OTH/NZ/messages.html); MIROVA (Middle InfraRed Observation of Volcanic Activity), a collaborative project between the Universities of Turin and Florence (Italy) supported by the Centre for Volcanic Risk of the Italian Civil Protection Department (URL: http://www.mirovaweb.it/); Global Sulfur Dioxide Monitoring Page, Atmospheric Chemistry and Dynamics Laboratory, NASA Goddard Space Flight Center (NASA/GSFC), 8800 Greenbelt Road, Goddard, Maryland, USA (URL: https://so2.gsfc.nasa.gov/); Copernicus Browser, Copernicus Data Space Ecosystem, European Space Agency (URL: https://dataspace.copernicus.eu/browser/).
Ibu
Indonesia
1.488°N, 127.63°E; summit elev. 1325 m
All times are local (unless otherwise noted)
Daily ash explosions continue, along with thermal anomalies in the crater, October 2022-May 2023
Persistent eruptive activity since April 2008 at Ibu, a stratovolcano on Indonesian’s Halmahera Island, has consisted of daily explosive ash emissions and plumes, along with observations of thermal anomalies (BGVN 47:04). The current eruption continued during October 2022-May 2023, described below, based on advisories issued by the Pusat Vulkanologi dan Mitigasi Bencana Geologi (PVMBG, also known as Indonesian Center for Volcanology and Geological Hazard Mitigation, CVGHM), daily reports by MAGMA Indonesia (a PVMBG platform), and the Darwin Volcanic Ash Advisory Centre (VAAC), and various satellite data. The Alert Level during the reporting period remained at 2 (on a scale of 1-4), except raised briefly to 3 on 27 May, and the public was warned to stay at least 2 km away from the active crater and 3.5 km away on the N side of the volcano.
According to MAGMA Indonesia, during October 2022-May 2023, daily gray-and-white ash plumes of variable densities rose 200-1,000 m above the summit and drifted in multiple directions. On 30 October and 11 November, plumes rose a maximum of 2 km and 1.5 km above the summit, respectively (figures 42 and 43). According to the Darwin VAAC, discrete ash emissions on 13 November rose to 2.1 km altitude, or 800 m above the summit, and drifted W, and multiple ash emissions on 15 November rose 1.4 km above the summit and drifted NE. Occasional larger ash explosions through May 2023 prompted PVMBG to issue Volcano Observatory Notice for Aviation (VONA) alerts (table 6); the Aviation Color Code remained at Orange throughout this period.
Table 6. Volcano Observatory Notice for Aviation (VONA) ash plume alerts for Ibu issued by PVMBG during October 2022-May 2023. Maximum height above the summit was estimated by a ground observer. VONAs in January-May 2023 all described the ash plumes as dense.
| Date |
Time (local) |
Max height above summit |
Direction |
| 17 Oct 2022 |
0858 |
800 m |
SW |
| 18 Oct 2022 |
1425 |
800 m |
S |
| 19 Oct 2022 |
2017 |
600 m |
SW |
| 21 Oct 2022 |
0916 |
800 m |
NW |
| 16 Jan 2023 |
1959 |
600 m |
NE |
| 22 Jan 2023 |
0942 |
1,000 m |
E |
| 29 Jan 2023 |
2138 |
1,000 m |
E |
| 10 May 2023 |
0940 |
800 m |
NW |
| 10 May 2023 |
2035 |
600 m |
E |
| 21 May 2023 |
2021 |
600 m |
W |
| 21 May 2023 |
2140 |
1,000 m |
W |
| 29 May 2023 |
1342 |
800 m |
N |
| 31 May 2023 |
1011 |
1,000 m |
SW |
Sentinel-2 L1C satellite images throughout the reporting period show two, sometimes three persistent thermal anomalies in the summit crater, with the most prominent hotspot from the top of a cone within the crater. Clear views were more common during March-April 2023, when a vent and lava flows on the NE flank of the intra-crater cone could be distinguished (figure 44). White-to-grayish emissions were also observed during brief periods when weather clouds allowed clear views.
The MIROVA space-based volcano hotspot detection system recorded almost daily thermal anomalies throughout the reporting period, though cloud cover often interfered with detections. Data from imaging spectroradiometers aboard NASA’s Aqua and Terra satellites and processed using the MODVOLC algorithm (MODIS-MODVOLC) recorded hotspots on one day during October 2022 and December 2022, two days in April 2023, three days in November 2022 and May 2023, and four days in March 2023.
Geologic Background. The truncated summit of Gunung Ibu stratovolcano along the NW coast of Halmahera Island has large nested summit craters. The inner crater, 1 km wide and 400 m deep, has contained several small crater lakes. The 1.2-km-wide outer crater is breached on the N, creating a steep-walled valley. A large cone grew ENE of the summit, and a smaller one to the WSW has fed a lava flow down the W flank. A group of maars is located below the N and W flanks. The first observed and recorded eruption was a small explosion from the summit crater in 1911. Eruptive activity began again in December 1998, producing a lava dome that eventually covered much of the floor of the inner summit crater along with ongoing explosive ash emissions.
Information Contacts: Pusat Vulkanologi dan Mitigasi Bencana Geologi (PVMBG, also known as Indonesian Center for Volcanology and Geological Hazard Mitigation, CVGHM), Jalan Diponegoro 57, Bandung 40122, Indonesia (URL: http://www.vsi.esdm.go.id/); MAGMA Indonesia (Multiplatform Application for Geohazard Mitigation and Assessment in Indonesia), Kementerian Energi dan Sumber Daya Mineral (URL: https://magma.esdm.go.id/v1); Copernicus Browser, Copernicus Data Space Ecosystem, European Space Agency (URL: https://dataspace.copernicus.eu/browser/); MIROVA (Middle InfraRed Observation of Volcanic Activity), a collaborative project between the Universities of Turin and Florence (Italy) supported by the Centre for Volcanic Risk of the Italian Civil Protection Department (URL: http://www.mirovaweb.it/); Hawai'i Institute of Geophysics and Planetology (HIGP) - MODVOLC Thermal Alerts System, School of Ocean and Earth Science and Technology (SOEST), Univ. of Hawai'i, 2525 Correa Road, Honolulu, HI 96822, USA (URL: http://modis.higp.hawaii.edu/).
Dukono
Indonesia
1.6992°N, 127.8783°E; summit elev. 1273 m
All times are local (unless otherwise noted)
Continuing ash emissions, SO2 plumes, and thermal signals during October 2022-May 2023
Dukono, a remote volcano on Indonesia’s Halmahera Island, has been erupting continuously since 1933, with frequent ash explosions and sulfur dioxide plumes (BGVN 46:11, 47:10). This activity continued during October 2022 through May 2023, based on reports from the Pusat Vulkanologi dan Mitigasi Bencana Geologi (PVMBG; also known as Indonesian Center for Volcanology and Geological Hazard Mitigation, CVGHM), the Darwin Volcanic Ash Advisory Centre (VAAC), and satellite data. During this period, the Alert Level remained at 2 (on a scale of 1-4) and the public was warned to remain outside of the 2-km exclusion zone. The highest reported plume of the period reached 9.4 km above the summit on 14 November 2022.
According to MAGMA Indonesia (a platform developed by PVMBG), white, gray, or dark plumes of variable densities were observed almost every day during the reporting period, except when fog obscured the volcano (figure 33). Plumes generally rose 25-450 m above the summit, but rose as high as 700-800 m on several days, somewhat lower than the maximum heights reached earlier in 2022 when plumes reached as high as 1 km. However, the Darwin VAAC reported that on 14 November 2022, a discrete ash plume rose 9.4 km above the summit (10.7 km altitude), accompanied by a strong hotspot and a sulfur dioxide signal observed in satellite imagery; a continuous ash plume that day and through the 15th rose to 2.1-2.4 km altitude and drifted NE.
Sentinel-2 images were obscured by weather clouds almost every viewing day during the reporting period. However, the few reasonably clear images showed a hotspot and white or gray emissions and plumes. Strong SO2 plumes from Dukono were present on many days during October 2022-May 2023, as detected using the TROPOMI instrument on the Sentinel-5P satellite (figure 34).
Geologic Background. Reports from this remote volcano in northernmost Halmahera are rare, but Dukono has been one of Indonesia's most active volcanoes. More-or-less continuous explosive eruptions, sometimes accompanied by lava flows, have occurred since 1933. During a major eruption in 1550 CE, a lava flow filled in the strait between Halmahera and the N-flank Gunung Mamuya cone. This complex volcano presents a broad, low profile with multiple summit peaks and overlapping craters. Malupang Wariang, 1 km SW of the summit crater complex, contains a 700 x 570 m crater that has also been active during historical time.
Information Contacts: Pusat Vulkanologi dan Mitigasi Bencana Geologi (PVMBG, also known as Indonesian Center for Volcanology and Geological Hazard Mitigation, CVGHM), Jalan Diponegoro 57, Bandung 40122, Indonesia (URL: http://www.vsi.esdm.go.id/); MAGMA Indonesia (Multiplatform Application for Geohazard Mitigation and Assessment in Indonesia), Kementerian Energi dan Sumber Daya Mineral (URL: https://magma.esdm.go.id/v1); Darwin Volcanic Ash Advisory Centre (VAAC), Bureau of Meteorology, Northern Territory Regional Office, PO Box 40050, Casuarina, NT 0811, Australia (URL: http://www.bom.gov.au/info/vaac/); NASA Global Sulfur Dioxide Monitoring Page, Atmospheric Chemistry and Dynamics Laboratory, NASA Goddard Space Flight Center (NASA/GSFC), 8800 Greenbelt Road, Goddard, Maryland, USA (URL: https://so2.gsfc.nasa.gov/); Sentinel Hub Playground (URL: https://www.sentinel-hub.com/explore/sentinel-playground).
Sabancaya
Peru
15.787°S, 71.857°W; summit elev. 5960 m
All times are local (unless otherwise noted)
Explosions, gas-and-ash plumes, and thermal activity persist during November 2022-April 2023
Sabancaya is located in Peru, NE of Ampato and SE of Hualca Hualca. Eruptions date back to 1750 and have been characterized by explosions, phreatic activity, ash plumes, and ashfall. The current eruption period began in November 2016 and has more recently consisted of daily explosions, gas-and-ash plumes, and thermal activity (BGVN 47:11). This report updates activity during November 2022 through April 2023 using information from Instituto Geophysico del Peru (IGP) that use weekly activity reports and various satellite data.
Intermittent low-to-moderate power thermal anomalies were reported by the MIROVA project during November 2022 through April 2023 (figure 119). There were few short gaps in thermal activity during mid-December 2022, late December-to-early January 2023, late January to mid-February, and late February. According to data recorded by the MODVOLC thermal algorithm, there were a total of eight thermal hotspots: three in November 2022, three in February 2023, one in March, and one in April. On clear weather days, some of this thermal anomaly was visible in infrared satellite imagery showing the active lava dome in the summit crater (figure 120). Almost daily moderate-to-strong sulfur dioxide plumes were recorded during the reporting period by the TROPOMI instrument on the Sentinel-5P satellite (figure 121). Many of these plumes exceeded 2 Dobson Units (DU) and drifted in multiple directions.
IGP reported that moderate activity during November and December 2022 continued; during November, an average number of explosions were reported each week: 30, 33, 36, and 35, and during December, it was 32, 40, 47, 52, and 67. Gas-and-ash plumes in November rose 3-3.5 km above the summit and drifted E, NE, SE, S, N, W, and SW. During December the gas-and-ash plumes rose 2-4 km above the summit and drifted in different directions. There were 1,259 volcanic earthquakes recorded during November and 1,693 during December. Seismicity also included volcano-tectonic-type events that indicate rock fracturing events. Slight inflation was observed in the N part of the volcano near Hualca Hualca (4 km N). Thermal activity was frequently reported in the crater at the active lava dome (figure 120).
Explosive activity continued during January and February 2023. The average number of explosions were reported each week during January (51, 50, 60, and 59) and February (43, 54, 51, and 50). Gas-and-ash plumes rose 1.6-2.9 km above the summit and drifted NW, SW, and W during January and rose 1.4-2.8 above the summit and drifted W, SW, E, SE, N, S, NW, and NE during February. IGP also detected 1,881 volcanic earthquakes during January and 1,661 during February. VT-type earthquakes were also reported. Minor inflation persisted near Hualca Hualca. Satellite imagery showed continuous thermal activity in the crater at the lava dome (figure 120).
During March, the average number of explosions each week was 46, 48, 31, 35, and 22 and during April, it was 29, 41, 31, and 27. Accompanying gas-and-ash plumes rose 1.7-2.6 km above the summit crater and drifted W, SW, NW, S, and SE during March. According to a Buenos Aires Volcano Ash Advisory Center (VAAC) notice, on 22 March at 1800 through 23 March an ash plume rose to 7 km altitude and drifted NW. By 0430 an ash plume rose to 7.6 km altitude and drifted W. On 24 and 26 March continuous ash emissions rose to 7.3 km altitude and drifted SW and on 28 March ash emissions rose to 7.6 km altitude. During April, gas-and-ash plumes rose 1.6-2.5 km above the summit and drifted W, SW, S, NW, NE, and E. Frequent volcanic earthquakes were recorded, with 1,828 in March and 1,077 in April, in addition to VT-type events. Thermal activity continued to be reported in the summit crater at the lava dome (figure 120).
Geologic Background. Sabancaya, located in the saddle NE of Ampato and SE of Hualca Hualca volcanoes, is the youngest of these volcanic centers and the only one to have erupted in historical time. The oldest of the three, Nevado Hualca Hualca, is of probable late-Pliocene to early Pleistocene age. The name Sabancaya (meaning "tongue of fire" in the Quechua language) first appeared in records in 1595 CE, suggesting activity prior to that date. Holocene activity has consisted of Plinian eruptions followed by emission of voluminous andesitic and dacitic lava flows, which form an extensive apron around the volcano on all sides but the south. Records of historical eruptions date back to 1750.
Information Contacts: Instituto Geofisico del Peru (IGP), Centro Vulcanológico Nacional (CENVUL), Calle Badajoz N° 169 Urb. Mayorazgo IV Etapa, Ate, Lima 15012, Perú (URL: https://www.igp.gob.pe/servicios/centro-vulcanologico-nacional/inicio); Buenos Aires Volcanic Ash Advisory Center (VAAC), Servicio Meteorológico Nacional-Fuerza Aérea Argentina, 25 de mayo 658, Buenos Aires, Argentina (URL: http://www.smn.gov.ar/vaac/buenosaires/inicio.php); MIROVA (Middle InfraRed Observation of Volcanic Activity), a collaborative project between the Universities of Turin and Florence (Italy) supported by the Centre for Volcanic Risk of the Italian Civil Protection Department (URL: http://www.mirovaweb.it/); Hawai'i Institute of Geophysics and Planetology (HIGP) - MODVOLC Thermal Alerts System, School of Ocean and Earth Science and Technology (SOEST), Univ. of Hawai'i, 2525 Correa Road, Honolulu, HI 96822, USA (URL: http://modis.higp.hawaii.edu/); NASA Global Sulfur Dioxide Monitoring Page, Atmospheric Chemistry and Dynamics Laboratory, NASA Goddard Space Flight Center (NASA/GSFC), 8800 Greenbelt Road, Goddard MD 20771, USA (URL: https://so2.gsfc.nasa.gov/); Copernicus Browser, Copernicus Data Space Ecosystem, European Space Agency (URL: https://dataspace.copernicus.eu/browser/).
Sheveluch
Russia
56.653°N, 161.36°E; summit elev. 3283 m
All times are local (unless otherwise noted)
Significant explosions destroyed part of the lava-dome complex during April 2023
Sheveluch (also spelled Shiveluch) in Kamchatka, has had at least 60 large eruptions during the last 10,000 years. The summit is truncated by a broad 9-km-wide caldera that is breached to the S, and many lava domes occur on the outer flanks. The lava dome complex was constructed within the large open caldera. Frequent collapses of the dome complex have produced debris avalanches; the resulting deposits cover much of the caldera floor. A major south-flank collapse during a 1964 Plinian explosion produced a scarp in which a “Young Sheveluch” dome began to form in 1980. Repeated episodes of dome formation and destruction since then have produced major and minor ash plumes, pyroclastic flows, block-and-ash flows, and “whaleback domes” of spine-like extrusions in 1993 and 2020 (BGVN 45:11). The current eruption period began in August 1999 and has more recently consisted of lava dome growth, explosions, ash plumes, and avalanches (BGVN 48:01). This report covers a significant explosive eruption during early-to-mid-April 2023 that generated a 20 km altitude ash plume, produced a strong sulfur dioxide plume, and destroyed part of the lava-dome complex; activity described during January through April 2023 use information primarily from the Kamchatka Volcanic Eruptions Response Team (KVERT) and various satellite data.
Satellite data. Activity during the majority of this reporting period was characterized by continued lava dome growth, strong fumarole activity, explosions, and hot avalanches. According to the MODVOLC Thermal Alerts System, 140 hotspots were detected through the reporting period, with 33 recorded in January 2023, 29 in February, 44 in March, and 34 in April. Frequent strong thermal activity was recorded during January 2023 through April, according to the MIROVA (Middle InfraRed Observation of Volcanic Activity) graph and resulted from the continuously growing lava dome (figure 94). A slightly stronger pulse in thermal activity was detected in early-to-mid-April, which represented the significant eruption that destroyed part of the lava-dome complex. Thermal anomalies were also visible in infrared satellite imagery at the summit crater (figure 95).
During January 2023 KVERT reported continued growth of the lava dome, accompanied by strong fumarolic activity, incandescence from the lava dome, explosions, ash plumes, and avalanches. Satellite data showed a daily thermal anomaly over the volcano. Video data showed ash plumes associated with collapses at the dome that generated avalanches that in turn produced ash plumes rising to 3.5 km altitude and drifting 40 km W on 4 January and rising to 7-7.5 km altitude and drifting 15 km SW on 5 January. A gas-and-steam plume containing some ash that was associated with avalanches rose to 5-6 km altitude and extended 52-92 km W on 7 January. Explosions that same day produced ash plumes that rose to 7-7.5 km altitude and drifted 10 km W. According to a Volcano Observatory Notice for Aviation (VONA) issued at 1344 on 19 January, explosions produced an ash cloud that was 15 x 25 km in size and rose to 9.6-10 km altitude, drifting 21-25 km W; as a result, the Aviation Color Code (ACC) was raised to Red (the highest level on a four-color scale). Another VONA issued at 1635 reported that no more ash plumes were observed, and the ACC was lowered to Orange (the second highest level on a four-color scale). On 22 January an ash plume from collapses and avalanches rose to 5 km altitude and drifted 25 km NE and SW; ash plumes associated with collapses extended 70 km NE on 27 and 31 January.
Lava dome growth, fumarolic activity, dome incandescence, and occasional explosions and avalanches continued during February and March. A daily thermal anomaly was visible in satellite data. Explosions on 1 February generated ash plumes that rose to 6.3-6.5 km altitude and extended 15 km NE. Video data showed an ash cloud from avalanches rising to 5.5 km altitude and drifting 5 km SE on 2 February. Satellite data showed gas-and-steam plumes containing some ash rose to 5-5.5 km altitude and drifted 68-110 km ENE and NE on 6 February, to 4.5-5 km altitude and drifted 35 km WNW on 22 February, and to 3.7-4 km altitude and drifted 47 km NE on 28 February. Scientists from the Kamchatka Volcanological Station (KVS) went on a field excursion on 25 February to document the growing lava dome, and although it was cloudy most of the day, nighttime incandescence was visible. Satellite data showed an ash plume extending up to 118 km E during 4-5 March. Video data from 1150 showed an ash cloud from avalanches rose to 3.7-5.5 km altitude and drifted 5-10 km ENE and E on 5 March. On 11 March an ash plume drifted 62 km E. On 27 March ash plumes rose to 3.5 km altitude and drifted 100 km E. Avalanches and constant incandescence at the lava dome was focused on the E and NE slopes on 28 March. A gas-and-steam plume containing some ash rose to 3.5 km altitude and moved 40 km E on 29 March. Ash plumes on 30 March rose to 3.5-3.7 km altitude and drifted 70 km NE.
Similar activity continued during April, with lava dome growth, strong fumarolic activity, incandescence in the dome, occasional explosions, and avalanches. A thermal anomaly persisted throughout the month. During 1-4 April weak ash plumes rose to 2.5-3 km altitude and extended 13-65 km SE and E.
Activity during 11 April 2023. The Institute of Volcanology and Seismology, Far Eastern Branch, Russian Academy of Sciences (IVS FEB RAS) reported a significant increase in seismicity around 0054 on 11 April, as reported by strong explosions detected on 11 April beginning at 0110 that sent ash plumes up to 7-10 km altitude and extended 100-435 km W, WNW, NNW, WSW, and SW. According to a Tokyo VAAC report the ash plume rose to 15.8 km altitude. By 0158 the plume extended over a 75 x 100 km area. According to an IVS FEB RAS report, the eruptive column was not vertical: the initial plume at 0120 on 11 April deviated to the NNE, at 0000 on 12 April, it drifted NW, and by 1900 it drifted SW. KVS reported that significant pulses of activity occurred at around 0200, 0320, and then a stronger phase around 0600. Levin Dmitry took a video from near Békés (3 km away) at around 0600 showing a rising plume; he also reported that a pyroclastic flow traveled across the road behind him as he left the area. According to IVS FEB RAS, the pyroclastic flow traveled several kilometers SSE, stopping a few hundred meters from a bridge on the road between Klyuchi and Petropavlovsk-Kamchatsky.
Ashfall was first observed in Klyuchi (45 km SW) at 0630, and a large, black ash plume blocked light by 0700. At 0729 KVERT issued a Volcano Observatory Notice for Aviation (VONA) raising the Aviation Color Code to Red (the highest level on a four-color scale). It also stated that a large ash plume had risen to 10 km altitude and drifted 100 km W. Near-constant lightning strikes were reported in the plume and sounds like thunderclaps were heard until about 1000. According to IVS FEB RAS the cloud was 200 km long and 76 km wide by 0830, and was spreading W at altitudes of 6-12 km. In the Klyuchi Village, the layer of both ash and snow reached 8.5 cm (figure 96); ashfall was also reported in Kozyrevsk (112 km SW) at 0930, Mayskoye, Anavgay, Atlasovo, Lazo, and Esso. Residents in Klyuchi reported continued darkness and ashfall at 1100. In some areas, ashfall was 6 cm deep and some residents reported dirty water coming from their plumbing. According to IVS FEB RAS, an ash cloud at 1150 rose to 5-20 km altitude and was 400 km long and 250 km wide, extending W. A VONA issued at 1155 reported that ash had risen to 10 km and drifted 340 km NNW and 240 km WSW. According to Simon Carn (Michigan Technological University), about 0.2 Tg of sulfur dioxide in the plume was measured in a satellite image from the TROPOMI instrument on the Sentinel-5P satellite acquired at 1343 that covered an area of about 189,000 km2 (figure 97). Satellite data at 1748 showed an ash plume that rose to 8 km altitude and drifted 430 km WSW and S, according to a VONA.
Activity during 12-15 April 2023. On 12 April at 0730 satellite images showed ash plumes rose to 7-8 km altitude and extended 600 km SW, 1,050 km ESE, and 1,300-3,000 km E. By 1710 that day, the explosions weakened. According to news sources, the ash-and-gas plumes drifted E toward the Aleutian Islands and reached the Gulf of Alaska by 13 April, causing flight disruptions. More than 100 flights involving Alaska airspace were cancelled due to the plume. Satellite data showed ash plumes rising to 4-5.5 km altitude and drifted 400-415 km SE and ESE on 13 April. KVS volcanologists observed the pyroclastic flow deposits and noted that steam rose from downed, smoldering trees. They also noted that the deposits were thin with very few large fragments, which differed from previous flows. The ash clouds traveled across the Pacific Ocean. Flight cancellations were also reported in NW Canada (British Columbia) during 13-14 April. During 14-15 April ash plumes rose to 6 km altitude and drifted 700 km NW.
Alaskan flight schedules were mostly back to normal by 15 April, with only minor delays and far less cancellations; a few cancellations continued to be reported in Canada. Clear weather on 15 April showed that most of the previous lava-dome complex was gone and a new crater roughly 1 km in diameter was observed (figure 98); gas-and-steam emissions were rising from this crater. Evidence suggested that there had been a directed blast to the SE, and pyroclastic flows traveled more than 20 km. An ash plume rose to 4.5-5.2 km altitude and drifted 93-870 km NW on 15 April.
Activity during 16-30 April 2023. Resuspended ash was lifted by the wind from the slopes and rose to 4 km altitude and drifted 224 km NW on 17 April. KVERT reported a plume of resuspended ash from the activity during 10-13 April on 19 April that rose to 3.5-4 km altitude and drifted 146-204 km WNW. During 21-22 April a plume stretched over the Scandinavian Peninsula. A gas-and-steam plume containing some ash rose to 3-3.5 km altitude and drifted 60 km SE on 30 April. A possible new lava dome was visible on the W slope of the volcano on 29-30 April (figure 99); satellite data showed two thermal anomalies, a bright one over the existing lava dome and a weaker one over the possible new one.
References. Girina, O., Loupian, E., Horvath, A., Melnikov, D., Manevich, A., Nuzhdaev, A., Bril, A., Ozerov, A., Kramareva, L., Sorokin, A., 2023, Analysis of the development of the paroxysmal eruption of Sheveluch volcano on April 10–13, 2023, based on data from various satellite systems, ??????????? ???????? ??? ?? ???????, 20(2).
Geologic Background. The high, isolated massif of Sheveluch volcano (also spelled Shiveluch) rises above the lowlands NNE of the Kliuchevskaya volcano group. The 1,300 km3 andesitic volcano is one of Kamchatka's largest and most active volcanic structures, with at least 60 large eruptions during the Holocene. The summit of roughly 65,000-year-old Stary Shiveluch is truncated by a broad 9-km-wide late-Pleistocene caldera breached to the south. Many lava domes occur on its outer flanks. The Molodoy Shiveluch lava dome complex was constructed during the Holocene within the large open caldera; Holocene lava dome extrusion also took place on the flanks of Stary Shiveluch. Widespread tephra layers from these eruptions have provided valuable time markers for dating volcanic events in Kamchatka. Frequent collapses of dome complexes, most recently in 1964, have produced debris avalanches whose deposits cover much of the floor of the breached caldera.
Information Contacts: Kamchatka Volcanic Eruptions Response Team (KVERT), Far Eastern Branch, Russian Academy of Sciences, 9 Piip Blvd., Petropavlovsk-Kamchatsky, 683006, Russia (URL: http://www.kscnet.ru/ivs/kvert/); Institute of Volcanology and Seismology, Far Eastern Branch, Russian Academy of Sciences (IVS FEB RAS), 9 Piip Blvd., Petropavlovsk-Kamchatsky 683006, Russia (URL: http://www.kscnet.ru/ivs/eng/); Kamchatka Volcanological Station, Kamchatka Branch of Geophysical Survey, (KB GS RAS), Klyuchi, Kamchatka Krai, Russia (URL: http://volkstat.ru/); Hawai'i Institute of Geophysics and Planetology (HIGP) - MODVOLC Thermal Alerts System, School of Ocean and Earth Science and Technology (SOEST), Univ. of Hawai'i, 2525 Correa Road, Honolulu, HI 96822, USA (URL: http://modis.higp.hawaii.edu/); MIROVA (Middle InfraRed Observation of Volcanic Activity), a collaborative project between the Universities of Turin and Florence (Italy) supported by the Centre for Volcanic Risk of the Italian Civil Protection Department (URL: http://www.mirovaweb.it/); Copernicus Browser, Copernicus Data Space Ecosystem, European Space Agency (URL: https://dataspace.copernicus.eu/browser/); Kam 24 News Agency, 683032, Kamchatka Territory, Petropavlovsk-Kamchatsky, Vysotnaya St., 2A (URL: https://kam24.ru/news/main/20230411/96657.html#.Cj5Jrky6.dpuf); Simon Carn, Geological and Mining Engineering and Sciences, Michigan Technological University, 1400 Townsend Drive, Houghton, MI 49931, USA (URL: http://www.volcarno.com/, Twitter: @simoncarn).
Bezymianny
Russia
55.972°N, 160.595°E; summit elev. 2882 m
All times are local (unless otherwise noted)
Explosions, ash plumes, lava flows, and avalanches during November 2022-April 2023
Bezymianny is located on the Kamchatka Peninsula of Russia as part of the Klyuchevskoy volcano group. Historic eruptions began in 1955 and have been characterized by dome growth, explosions, pyroclastic flows, ash plumes, and ashfall. During the 1955-56 eruption a large open crater was formed by collapse of the summit and an associated lateral blast. Subsequent episodic but ongoing lava-dome growth, accompanied by intermittent explosive activity and pyroclastic flows, has largely filled the 1956 crater. The current eruption period began in December 2016 and more recent activity has consisted of strong explosions, ash plumes, and thermal activity (BGVN 47:11). This report covers activity during November 2022 through April 2023, based on weekly and daily reports from the Kamchatka Volcano Eruptions Response Team (KVERT) and satellite data.
Activity during November and March 2023 was relatively low and mostly consisted of gas-and-steam emissions, occasional small collapses that generated avalanches along the lava dome slopes, and a persistent thermal anomaly over the volcano that was observed in satellite data on clear weather days. According to the Tokyo VAAC and KVERT, an explosion produced an ash plume that rose to 6 km altitude and drifted 25 km NE at 1825 on 29 March.
Gas-and-steam emissions, collapses generating avalanches, and thermal activity continued during April. According to two Volcano Observatory Notice for Aviation (VONA) issued on 2 and 6 April (local time) ash plumes rose to 3 km and 3.5-3.8 km altitude and drifted 35 km E and 140 km E, respectively. Satellite data from KVERT showed weak ash plumes extending up to 550 km E on 2 and 5-6 April.
A VONA issued at 0843 on 7 April described an ash plume that rose to 4.5-5 km altitude and drifted 250 km ESE. Later that day at 1326 satellite data showed an ash plume that rose to 5.5-6 km altitude and drifted 150 km ESE. A satellite image from 1600 showed an ash plume extending as far as 230 km ESE; KVERT noted that ash emissions were intensifying, likely due to avalanches from the growing lava dome. The Aviation Color Code (ACC) was raised to Red (the highest level on a four-color scale). At 1520 satellite data showed an ash plume rising to 5-5.5 km altitude and drifting 230 km ESE. That same day, Kamchatka Volcanological Station (KVS) volcanologists traveled to Ambon to collect ash; they reported that a notable eruption began at 1730, and within 20 minutes a large ash plume rose to 10 km altitude and drifted NW. KVERT reported that the strong explosive phase began at 1738. Video and satellite data taken at 1738 showed an ash plume that rose to 10-12 km altitude and drifted up to 2,800 km SE and E. Explosions were clearly audible 20 km away for 90 minutes, according to KVS. Significant amounts of ash fell at the Apakhonchich station, which turned the snow gray; ash continued to fall until the morning of 8 April. In a VONA issued at 0906 on 8 April, KVERT stated that the explosive eruption had ended; ash plumes had drifted 2,000 km E. The ACC was lowered to Orange (the third highest level on a four-color scale). The KVS team saw a lava flow on the active dome once the conditions were clear that same day (figure 53). On 20 April lava dome extrusion was reported; lava flows were noted on the flanks of the dome, and according to KVERT satellite data, a thermal anomaly was observed in the area. The ACC was lowered to Yellow (the second lowest on a four-color scale).
Satellite data showed an increase in thermal activity beginning in early April 2023. A total of 31 thermal hotspots were detected by the MODVOLC thermal algorithm on 4, 5, 7, and 12 April 2023. The elevated thermal activity resulted from an increase in explosive activity and the start of an active lava flow. The MIROVA (Middle InfraRed Observation of Volcanic Activity) volcano hotspot detection system based on the analysis of MODIS data also showed a pulse in thermal activity during the same time (figure 54). Infrared satellite imagery captured a continuous thermal anomaly at the summit crater, often accompanied by white gas-and-steam emissions (figure 55). On 4 April 2023 an active lava flow was observed descending the SE flank.
Geologic Background. The modern Bezymianny, much smaller than its massive neighbors Kamen and Kliuchevskoi on the Kamchatka Peninsula, was formed about 4,700 years ago over a late-Pleistocene lava-dome complex and an edifice built about 11,000-7,000 years ago. Three periods of intensified activity have occurred during the past 3,000 years. The latest period, which was preceded by a 1,000-year quiescence, began with the dramatic 1955-56 eruption. This eruption, similar to that of St. Helens in 1980, produced a large open crater that was formed by collapse of the summit and an associated lateral blast. Subsequent episodic but ongoing lava-dome growth, accompanied by intermittent explosive activity and pyroclastic flows, has largely filled the 1956 crater.
Information Contacts: Kamchatka Volcanic Eruptions Response Team (KVERT), Far Eastern Branch, Russian Academy of Sciences, 9 Piip Blvd., Petropavlovsk-Kamchatsky, 683006, Russia (URL: http://www.kscnet.ru/ivs/kvert/); Kamchatka Volcanological Station, Kamchatka Branch of Geophysical Survey, (KB GS RAS), Klyuchi, Kamchatka Krai, Russia (URL: http://volkstat.ru/); Hawai'i Institute of Geophysics and Planetology (HIGP) - MODVOLC Thermal Alerts System, School of Ocean and Earth Science and Technology (SOEST), Univ. of Hawai'i, 2525 Correa Road, Honolulu, HI 96822, USA (URL: http://modis.higp.hawaii.edu/); MIROVA (Middle InfraRed Observation of Volcanic Activity), a collaborative project between the Universities of Turin and Florence (Italy) supported by the Centre for Volcanic Risk of the Italian Civil Protection Department (URL: http://www.mirovaweb.it/); Copernicus Browser, Copernicus Data Space Ecosystem, European Space Agency (URL: https://dataspace.copernicus.eu/browser/).
Chikurachki
Russia
50.324°N, 155.461°E; summit elev. 1781 m
All times are local (unless otherwise noted)
New explosive eruption during late January-early February 2023
Chikurachki, located on Paramushir Island in the northern Kuriles, has had Plinian eruptions during the Holocene. Lava flows have reached the sea and formed capes on the NW coast; several young lava flows are also present on the E flank beneath a scoria deposit. Reported eruptions date back to 1690, with the most recent eruption period occurring during January through October 2022, characterized by occasional explosions, ash plumes, and thermal activity (BGVN 47:11). This report covers a new eruptive period during January through February 2023 that consisted of ash explosions and ash plumes, based on information from the Kamchatka Volcanic Eruptions Response Team (KVERT) and satellite data.
According to reports from KVERT, an explosive eruption began around 0630 on 29 January. Explosions generated ash plumes that rose to 3-3.5 km altitude and drifted 6-75 km SE and E, based on satellite data. As a result, the Aviation Color Code (ACC) was raised to Orange (the second highest level on a four-color scale). At 1406 and 1720 ash plumes were identified in satellite images that rose to 4.3 km altitude and extended 70 km E. By 2320 the ash plume had dissipated. A thermal anomaly was visible at the volcano on 31 January, according to a satellite image, and an ash plume was observed drifting 66 km NE.
Occasional explosions and ash plumes continued during early February. At 0850 on 1 February an ash plume rose to 3.5 km altitude and drifted 35 km NE. Satellite data showed an ash plume that rose to 3.2-3.5 km altitude and drifted 50 km NE at 1222 later that day (figure 22). A thermal anomaly was detected over the volcano during 5-6 February and ash plumes drifted as far as 125 km SE, E, and NE. Explosive events were reported at 0330 on 6 February that produced ash plumes rising to 4-4.5 km altitude and drifting 72-90 km N, NE, and ENE. KVERT noted that the last gas-and steam plume that contained some ash was observed on 8 February and drifted 55 km NE before the explosive eruption ended. The ACC was lowered to Yellow and then Green (the lowest level on a four-color scale) on 18 February.
Geologic Background. Chikurachki, the highest volcano on Paramushir Island in the northern Kuriles, is a relatively small cone constructed on a high Pleistocene edifice. Oxidized basaltic-to-andesitic scoria deposits covering the upper part of the young cone give it a distinctive red color. Frequent basaltic Plinian eruptions have occurred during the Holocene. Lava flows have reached the sea and formed capes on the NW coast; several young lava flows are also present on the E flank beneath a scoria deposit. The Tatarinov group of six volcanic centers is located immediately to the south, and the Lomonosov cinder cone group, the source of an early Holocene lava flow that reached the saddle between it and Fuss Peak to the west, lies at the southern end of the N-S-trending Chikurachki-Tatarinov complex. In contrast to the frequently active Chikurachki, the Tatarinov centers are extensively modified by erosion and have a more complex structure. Tephrochronology gives evidence of an eruption around 1690 CE from Tatarinov, although its southern cone contains a sulfur-encrusted crater with fumaroles that were active along the margin of a crater lake until 1959.
Information Contacts: Kamchatka Volcanic Eruptions Response Team (KVERT), Far East Division, Russian Academy of Sciences, 9 Piip Blvd., Petropavlovsk-Kamchatsky, 683006, Russia (URL: http://www.kscnet.ru/ivs/); Copernicus Browser, Copernicus Data Space Ecosystem, European Space Agency (URL: https://dataspace.copernicus.eu/browser/).
Search Bulletin Archive by Publication Date
Select a month and year from the drop-downs and click "Show Issue" to have that issue displayed in this tab.
The default month and year is the latest issue available.
Bulletin of the Global Volcanism Network - Volume 25, Number 04 (April 2000)
Managing Editor: Richard Wunderman
Ambrym (Vanuatu)
Vapor emissions observed in February; pilots report seeing lava in vents
Bezymianny (Russia)
Volcanic tremor in mid-February and mid-March, ash clouds in mid-March
Karymsky (Russia)
Low-level eruptive activity; intense ash-and-gas explosions in April
Kavachi (Solomon Islands)
Scientists aboard a research vessel observe a new submarine eruption
Kilauea (United States)
An eruptive pause occurred in September; intrusion of magma in February
Klyuchevskoy (Russia)
Frequent fumarolic plumes, one to 10 km altitude on 30 January
Lopevi (Vanuatu)
Intermittent ash eruptions October 1999-April 2000; pyroclastic flow in February
Mayon (Philippines)
Decreasing activity; small eruptions, lava flows, secondary pyroclastic flows
Mutnovsky (Russia)
Two short-lived gas-and-ash explosions on 17 March
Sheveluch (Russia)
Intermittent ash explosions from January through March
Soufriere Hills (United Kingdom)
Dome growth continues through May; Vulcanian eruption 20 March
Tungurahua (Ecuador)
Frequent early-2000 explosions with loud reports; ash plumes to 10 km altitude
Whakaari/White Island (New Zealand)
Continuous ash emissions in April; high SO2 and fluctuating tremor
Yasur (Vanuatu)
Typical explosive activity observed in February
Ambrym
Vanuatu
16.25°S, 168.12°E; summit elev. 1334 m
All times are local (unless otherwise noted)
Vapor emissions observed in February; pilots report seeing lava in vents
Ambrym was observed during an aircraft overflight on 25 February 2000. Pilot reports indicated that lava was beginning to reappear in some vents. As previously reported (BGVN 25:02), the long-standing lava lakes in Benbow and Mbwelesu craters had disappeared after the 26 November 1999 earthquake. Activity increased slightly from January indicating the magma column may be rising again.
Brown vapor was being emitted from Mbwelesu crater. The bottom of the crater could be seen but no lava was observed. Four craters, each ~8 m in diameter, were located on a 40 x 10 m section of the sill on the E rim of the crater. This rim had been weakened by the November 1999 earthquake and appeared ready to fall. Both vents inside Benbow crater emitted white vapor, which rose 1.5 km as one plume. The bottom of the vents could not be seen.
Geologic Background. Ambrym, a large basaltic volcano with a 12-km-wide caldera, is one of the most active volcanoes of the New Hebrides Arc. A thick, almost exclusively pyroclastic sequence, initially dacitic then basaltic, overlies lava flows of a pre-caldera shield volcano. The caldera was formed during a major Plinian eruption with dacitic pyroclastic flows about 1,900 years ago. Post-caldera eruptions, primarily from Marum and Benbow cones, have partially filled the caldera floor and produced lava flows that ponded on the floor or overflowed through gaps in the caldera rim. Post-caldera eruptions have also formed a series of scoria cones and maars along a fissure system oriented ENE-WSW. Eruptions have apparently occurred almost yearly during historical time from cones within the caldera or from flank vents. However, from 1850 to 1950, reporting was mostly limited to extra-caldera eruptions that would have affected local populations.
Information Contacts: John Seach, PO Box 16, Chatsworth Island, N.S.W. 2469, Australia.
Bezymianny (Russia) — April 2000 Cite this Report
Bezymianny
Russia
55.972°N, 160.595°E; summit elev. 2882 m
All times are local (unless otherwise noted)
Volcanic tremor in mid-February and mid-March, ash clouds in mid-March
This report covers the period January-April 2000. As of 28 April 2000, KVERT (Kamchatkan Volcanic Eruption Response Team) temporarily suspended operations because of a lack of funding. Except for brief episodes of volcanic and seismic activity in mid-February and mid-March, little to no seismicity was registered beneath the volcano through the remainder of the period. Occasional, weak fumarolic activity was frequently accompanied by fumarolic plumes rising 50-800 m above the volcano and extending up to 50 km away. The volcano frequently was obscured by clouds, which prevented both visual and satellite observations.
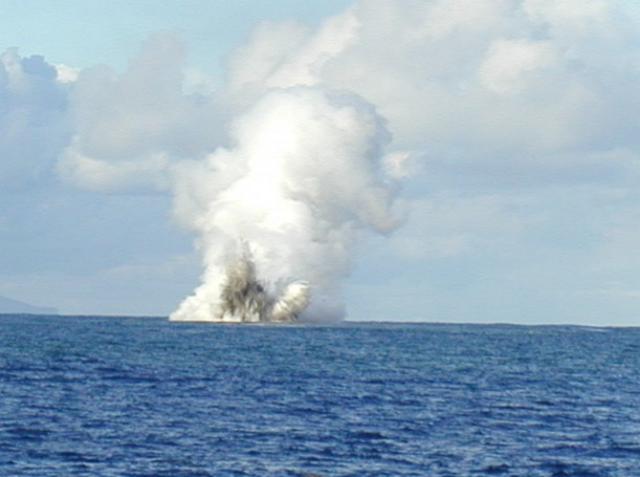
During the week of 11-17 February seven shallow earthquakes were registered beneath the volcano. Seismic activity increased above background levels during 10-13 March, and on 14 March the hazard level color code was raised to Red due to continuous volcanic tremor after 0425, which occasionally registered at distances 100 km. At 0430, a satellite image showed a 4-pixel thermal anomaly with a temperature of 50°C and a small ash cloud. At 0742, the ash cloud rose to 5 km altitude and spread to the W; at 0815 ashfall was recorded in Kozirevsk; and at 1100 the ash cloud covered Kozirevsk and spread up to the Sredinny Range, a distance of 225 km. After 1000, the level of volcanic activity decreased and on 15 March the hazard status was reduced to Yellow after seismicity decreased to background levels. Analysis by the Alaska Volcano Observatory (AVO) of a satellite image taken at 0630 on 15 March revealed a 6-pixel thermal anomaly but no ash cloud. According to GMS-5 satellite data (Tokyo VAAC), between 0932 and 2032 on 15 March the ash cloud drifted across Shelekhov Bay and moved NW at an altitude of ~7 km.
At 0500 on the morning of 16 March the volcano erupted again, prompting a hazard status change to Orange. AVO reported that a satellite image taken at 0530 showed an 8-pixel thermal anomaly and a detached ash cloud drifting SW with the leading edge ~140 km from the volcano. The size of the cloud was estimated to be ~100 km E-W by 60 km N-S, but no height estimate was available. KVERT detected increased seismic activity under the volcano with volcanic tremor beginning around 2350 on 15 March and continuing until 0930 the next morning.
Visual reports at 2106 on 18 March from the village of Kozirevsk indicated that a dark dense plume rose to 5,000 m altitude and extended more than 150 km SW. The base of the cloud was not distinct and ashfall may have occurred. Seismicity returned to background levels after 19 March. Rock avalanches continued, although no volcanic tremor was recorded. On 19-22 March, a steam-and-gas plume rose 1-2 km above the volcano and extended up to 10 km NE and E. On 23 March, a plume rose 200 m above the volcano and satellite images analyzed by AVO continued to show a thermal anomaly, but of decreased intensity.
During the last week in March and throughout April seismicity returned to background levels and occasional fumarolic activity and shallow earthquakes were typical of the activity during the earlier part of the year.
Geologic Background. The modern Bezymianny, much smaller than its massive neighbors Kamen and Kliuchevskoi on the Kamchatka Peninsula, was formed about 4,700 years ago over a late-Pleistocene lava-dome complex and an edifice built about 11,000-7,000 years ago. Three periods of intensified activity have occurred during the past 3,000 years. The latest period, which was preceded by a 1,000-year quiescence, began with the dramatic 1955-56 eruption. This eruption, similar to that of St. Helens in 1980, produced a large open crater that was formed by collapse of the summit and an associated lateral blast. Subsequent episodic but ongoing lava-dome growth, accompanied by intermittent explosive activity and pyroclastic flows, has largely filled the 1956 crater.
Information Contacts: Olga Chubarova, Kamchatka Volcanic Eruptions Response Team (KVERT), Institute of Volcanic Geology and Geochemistry, Piip Ave. 9, Petropavlovsk-Kamchatsky, 683006, Russia; Tom Miller, Alaska Volcano Observatory (AVO), a cooperative program of a) U.S. Geological Survey, 4200 University Drive, Anchorage, AK 99508-4667, USA (URL: http://www.avo.alaska.edu/), b) Geophysical Institute, University of Alaska, PO Box 757320, Fairbanks, AK 99775-7320, USA, and c) Alaska Division of Geological & Geophysical Surveys, 794 University Ave., Suite 200, Fairbanks, AK 99709, USA.
Karymsky
Russia
54.049°N, 159.443°E; summit elev. 1513 m
All times are local (unless otherwise noted)
Low-level eruptive activity; intense ash-and-gas explosions in April
This report covers the period from January-April 2000. As of 28 April 2000, KVERT (Kamchatkan Volcanic Eruption Response Team) temporarily suspended operations because of a lack of funding. Throughout January and early February, seismicity was at background levels with about 1-5 small local earthquakes each day. However, after two months of quiescence, seismic activity beneath the volcano renewed at 0635 on 12 February; seismic data indicated the occurrence of a probable, short-lived gas-and-ash (or gas) explosion as a 5-minute-long seismic signal was recorded by the nearest seismic station (KRY). As a result of this activity, the hazard level was raised to Yellow.
Following this event, an average of 5-10 seismic events/hour occurred, mainly corresponding to explosions along with a few blowouts and pyroclastic flow (?) signals. After 1200 on 15 February, seismicity increased to 40 events/hour. A continuous series of seismic events (pyroclastic flows?) were registered from 1620 to 1810 on 15 February, but satellite images at 1715 and 1855 that day did not show a plume rising above the weather clouds at ~4 km altitude. From 1800 on 15 February to 1340 on 16 February, activity varied from 40-60 events/hour at the end of which a new 80-minute-long series of seismic events was registered. Subsequently, during 1500-1750, 200 events occurred and, at 1750, strong low-frequency, 4-minute-long events were registered. Activity decreased from 40 to 20 events/hour from 1800 on 16 February until 1200 on 17 February. A satellite image from 0630 on 17 February, the first clear image that the Alaska Volcano Observatory had received since the increase of activity on 12 February, showed no plume, but a thermal anomaly covered at least four pixels with a maximum temperature of 40°C.
The low-level Strombolian eruptive activity that has characterized the volcanism for much of the past four years continued for the remainder of February and throughout March. The number of gas-and-ash explosions decreased from 600/day to 25/day during late February. From 1230 to 1620 on 18 February weak volcanic tremor was registered. According to pilot reports on 20 and 21 February, these explosions sent material up to 1,500 m above the volcano. The number of gas-and-ash explosions varied from 5 to 300/day (although 5-50/day was most typical) through March; suspected small pyroclastic flows were occasionally detected.
At 0625 and 2336 on 3 April and 0743 on 4 April, seismic data indicated short-lived ash-and-gas explosions more intense than those previously recorded. These explosions probably occurred during 3-6-minute-long seismic events recorded by the nearest seismic station (KRY). However, during the following week, no more than three small events/day were recorded and the hazard level was returned to Green. This level of activity continued through April with occasional 2-15-minute-long seismic events, related rock avalanches, and possible short-lived explosions.
Geologic Background. Karymsky, the most active volcano of Kamchatka's eastern volcanic zone, is a symmetrical stratovolcano constructed within a 5-km-wide caldera that formed during the early Holocene. The caldera cuts the south side of the Pleistocene Dvor volcano and is located outside the north margin of the large mid-Pleistocene Polovinka caldera, which contains the smaller Akademia Nauk and Odnoboky calderas. Most seismicity preceding Karymsky eruptions originated beneath Akademia Nauk caldera, located immediately south. The caldera enclosing Karymsky formed about 7600-7700 radiocarbon years ago; construction of the stratovolcano began about 2000 years later. The latest eruptive period began about 500 years ago, following a 2300-year quiescence. Much of the cone is mantled by lava flows less than 200 years old. Historical eruptions have been vulcanian or vulcanian-strombolian with moderate explosive activity and occasional lava flows from the summit crater.
Information Contacts: Olga Chubarova, Kamchatka Volcanic Eruptions Response Team (KVERT), Institute of Volcanic Geology and Geochemistry, Piip Ave. 9, Petropavlovsk-Kamchatsky, 683006, Russia; Tom Miller, Alaska Volcano Observatory (AVO), a cooperative program of a) U.S. Geological Survey, 4200 University Drive, Anchorage, AK 99508-4667, USA (URL: http://www.avo.alaska.edu/), b) Geophysical Institute, University of Alaska, PO Box 757320, Fairbanks, AK 99775-7320, USA, and c) Alaska Division of Geological & Geophysical Surveys, 794 University Ave., Suite 200, Fairbanks, AK 99709, USA.
Kavachi (Solomon Islands) — April 2000 Cite this Report
Kavachi
Solomon Islands
8.991°S, 157.979°E; summit elev. -20 m
All times are local (unless otherwise noted)
Scientists aboard a research vessel observe a new submarine eruption
On 14 May 2000 Australian research vessel Franklin visited Kavachi seamount to discover that... a new eruption was underway (figure 6). The vessel was supporting an Australian Commonwealth Scientific and Industrial Research Organization (CSIRO) research cruise (FR04/00) entitled Project SHAARC (Submarine Hydrothermally Active Arc Volcanoes). Upon arrival at 0600 hours observers saw waves breaking on the peak of the volcano. Every 5-7 minutes the scientists on the CSIRO vessel witnessed violent eruptions that lasted 2-3 minutes each, prevailing for the approximately 20 hours that they observed the volcano. The position of the eruption column was fixed specifically at 8.99°S, 157.97°E, and the volcano's peak was estimated at 2-5 m below the water surface. The eruptions ejected ash and incandescent blocks of lava up to 70 m above the sea surface and sulfurous steam plumes rose to heights of 500 m.
The science team aboard Franklin documented the apparent new phase of island-building eruptive activity. A bathymetric map was produced that differed significantly from the previous map of the volcano made in 1984. Hydrocast/CTD (conductivity-temperature-depth) surveys were undertaken; these detected numerous chemical and particle plumes in the water column; the plumes extended at least 5 km from the eruptive center. Systematic sampling of rocks and ash from the flanks of the volcano returned glassy, vesicular basalts and hydrothermally altered sulfide-rich volcanic breccias. In addition, approximately 500 photographs and 2 hours of digital video captured ~20 eruptions during daylight.
The scientific participants on the CSIRO-led cruise were: Brent McInnes, CSIRO Exploration & Mining Chief Scientist; Richard Arculus, Principal Investigator, and Cromwell Qopoto, Australian National University (ANU); Gary Massoth, Principal Investigator, and Cornel DeRonde, New Zealand Institute of Geological and Nuclear Sciences Ltd (IGNS); Ed Baker, National Oceanic and Atmospheric Administration (NOAA); Pamela Brodie, Dan Conwell, Tim MacConachy, and Ron Plaschke, CSIRO; John Chadwick, University of Florida; and Philip Pousai, University of Papua New Guinea.
Geologic Background. Named for a sea-god of the Gatokae and Vangunu peoples, Kavachi is located in the Solomon Islands south of Vangunu Island. Sometimes referred to as Rejo te Kvachi ("Kavachi's Oven"), this shallow submarine basaltic-to-andesitic volcano has produced ephemeral islands up to 1 km long many times since its first recorded eruption during 1939. Residents of the nearby islands of Vanguna and Nggatokae (Gatokae) reported "fire on the water" prior to 1939, a possible reference to earlier eruptions. The roughly conical edifice rises from water depths of 1.1-1.2 km on the north and greater depths to the SE. Frequent shallow submarine and occasional subaerial eruptions produce phreatomagmatic explosions that eject steam, ash, and incandescent bombs. On a number of occasions lava flows were observed on the ephemeral islands.
Information Contacts: Brent McInnes, Chieft Scientist (FRO4/00), Division of Exploration & Mining, Australian Commonwealth Scientific and Industrial Organization (CSIRO), PO Box 136, North Ryde, NSW 1670, Australia (URL: http://www.csiro.au/).
Kilauea (United States) — April 2000 Cite this Report
Kilauea
United States
19.421°N, 155.287°W; summit elev. 1222 m
All times are local (unless otherwise noted)
An eruptive pause occurred in September; intrusion of magma in February
The period of activity at Kīlauea between 13 September 1999 and May 2000 was marked by multiple lava breakouts that were caused by damming of the lava-tube system. The lava flows traveled from Pu`u `O`o crater, down Pulama pali, and along the coastal plain towards the sea, covering an area several kilometers wide (figure 145).
On 12 September 1999 magma intruded into the upper rift zone of the volcano (BGVN 25:01), with most of it draining underground afterwards leaving a small lava lake near the center of Pu`u `O`o crater. By 16 September the lake was 50-60 m in diameter and ~92 m below the E rim of the crater. From September to mid-October the level of the lava lake was ~63 m below the E rim of the crater with periods of episodic ascent by 10-15 m. During the intrusion and withdrawal of the lava lake a new collapse pit, termed the West Gap Pit, formed in the W gap of the crater. The pit is 30-50 m wide and 12-15 m deep.
After the intrusion of magma, the 25th eruptive pause of the current eruptive episode (55) occurred when the supply of lava to a well-established lava-tube system, that ended near Kamokuna, stopped. Activity recommenced 23 September when lava erupted from a new spatter cone termed the 'mini-vent,' in Puka Nui collapse pit. Puka Nui is located on the S side of Pu`u `O`o crater. The pit formed in December 1997 and has been growing ever since by the collapse of tephra from the north wall of the pit and by engulfing other cones and smaller pits. Lava had not previously erupted from Puka Nui.
From 12 September through 22 October the lava-tube system was blocked by dams made up of debris that fell from the roof and walls of the tube. After the lava drained from the tube following intrusion, the walls cooled, shrank, and broke, causing the roof to collapse in places and the walls to crumble forming piles of debris. When lava re-entered the system it was blocked by a dam at 530 m elevation and reached the surface through cracks and holes in the tube upstream of the dam. Upslope breakout points were originally thought to be perched ponds (low shield-shaped structures with a pond of lava on top), but because the features were not vents and there was no ponded lava at the sites, they are referred to as breakout points from the lava tube. The lava traveled down Pulama pali towards the sea, but did not reach it. By 16 October activity occurred at the West Gap Pit with spattering from a vent in the floor of the pit, and by 18 or 19 October it filled with lava and overflowed, producing a shelly pahoehoe flow 160 m long.
Over the next several months the lava continued to flow down Pulama pali and just after sunset on 13 December lava reached the sea for the first time since the September intrusion. This took place at Highcastle entry and continued until 17-18 December. On 19 December lava reached the sea at the Lae`apuki lava bench, which had not been active since January 1997. As the lava flowed to the sea, it traveled down the sea cliff with some of it eventually cooling and solidifying to form wonderful examples of lava drapery (structures resembling the drips of wax down a candle). Throughout January lava continued to flow towards the sea causing the Lae`apuki bench to grow. On 3 February a second ocean entry became active at Waha`ula, 4 km E of Lae`apuki. Waha`ula was last active in July 1997 to late 1998.
On 23 February at 0142 tiltmeters at the summit showed a downward tilt toward the caldera (figure 146). The downward tilt indicated that magma was moving out of the summit reservoir; data from two other tiltmeters on the east rift zone indicated that the magma was moving into the rift zone. Concurrently, seismometers recorded a swarm of shallow earthquakes at the upper rift zone of the volcano. The swarm was centered near Pauahi Crater, ~7 km SE of Halema`uma`u Crater along the Chain of Craters Road. Hawaiian Volcano Observatory staff believed that the swarm probably recorded the movement of magma intruding to within 1-2 km of the ground surface. Such swarms commonly precede new fissure eruptions, but they more often record intrusions rather than eruptions. The reversal of the summit tilt a few hours later indicated when the intrusion stopped and magma once again moved into the summit reservoir. No new ground cracks were noted. The intrusion caused minor, but noticeable, changes in the ongoing eruption. Lava continued to enter the tube system at Pu`u `O`o, but blockages in the lava-tube system above the Pulama pali resulted in many breakouts on the active flow field. Lava stopped flowing to Lae`apuki entry on 25 March and intermittent ocean entries began along 2 km of coast centered on Waha`ula, which is currently the main entry.
Geologic Background. Kilauea overlaps the E flank of the massive Mauna Loa shield volcano in the island of Hawaii. Eruptions are prominent in Polynesian legends; written documentation since 1820 records frequent summit and flank lava flow eruptions interspersed with periods of long-term lava lake activity at Halemaumau crater in the summit caldera until 1924. The 3 x 5 km caldera was formed in several stages about 1,500 years ago and during the 18th century; eruptions have also originated from the lengthy East and Southwest rift zones, which extend to the ocean in both directions. About 90% of the surface of the basaltic shield volcano is formed of lava flows less than about 1,100 years old; 70% of the surface is younger than 600 years. The long-term eruption from the East rift zone between 1983 and 2018 produced lava flows covering more than 100 km2, destroyed hundreds of houses, and added new coastline.
Information Contacts: Hawaiian Volcano Observatory (HVO), U.S. Geological Survey, PO Box 51, Hawaii National Park, HI 96718, USA (URL: https://volcanoes.usgs.gov/observatories/hvo/).
Klyuchevskoy (Russia) — April 2000 Cite this Report
Klyuchevskoy
Russia
56.056°N, 160.642°E; summit elev. 4754 m
All times are local (unless otherwise noted)
Frequent fumarolic plumes, one to 10 km altitude on 30 January
This report covers the period January-April 2000. As of 28 April 2000, KVERT (Kamchatkan Volcanic Eruption Response Team) temporarily suspended operations because of a lack of funding. During most of this four-month period, seismicity at the volcano was at background levels, with shallow earthquakes and weak fumarolic activity accompanied frequently by fumarolic plumes. The plumes rose from 50 to 1,500 m above the volcano and extended in various directions as far as 10 km from the vent. The volcano frequently was obscured by clouds.
Twice during the reporting period, however, the activity level increased sufficiently so that the hazard level was raised from Green to Yellow. The first of these events occurred during 29 January-3 February when seismicity was above background levels with shallow earthquakes and tremor registered. On 29 January, a fumarolic plume rose 1,500 m above the crater extending 30 km to the SE. On 30 January and 1 February, a plume rose 50-500 m above the crater and extended up to 15 km S. According to reports from pilots of Northwest and Reeve Aleutian Airlines, and an observer from Alaska Volcano Observatory on the Reeve flight, a gas-and-steam plume was observed at 1440 on 30 January rising as high as 8-10 km altitude. On the morning of 3 February the volcano was quiet. According to visual reports from from Kliuchi (~30 km NE of the volcano) and pilot reports, a short-lived eruption at 1708 on 3 February sent an ash-poor plume to altitudes of 8-9 km; instruments measured an accompanying increase in seismicity. According to analysis of a satellite image at 1825 on 3 February the plume extended 40 km SSE and contained a large amount of water or ice.
During the subsequent week (4-10 February), seismicity continued above background levels and shallow earthquakes and tremor were registered. At 1815 on 8 February, seismic data indicated that a short-lived explosion probably occurred, because a series of shallow events were recorded. On 4-5 February, a fumarolic plume rose 200-500 m above the crater and extended 3-40 km W and SW.
During the period 11 February to 2 March, seismicity at the volcano returned to near background level accompanied by typical events noted earlier. But during 3-9 March, seismicity at the volcano increased again and the hazard level was raised again to Yellow. During this period, shallow earthquakes were registered. On 3-4 March a steam-and-gas plume rose 1,500 m above the volcano. On 5-7 March, a fumarolic plume rose 100-300 m above the crater. On 8 March, a steam-and-gas plume rose 1,000 m above the volcano extending 5 km to the NW.
Seismicity returned to background levels on 13 March and the hazard level was reduced to Green. This situation prevailed throughout the remainder of March and April. Shallow earthquakes, fumarolic activity, and plumes continued as in the earlier portion of the reporting period.
Geologic Background. Klyuchevskoy (also spelled Kliuchevskoi) is Kamchatka's highest and most active volcano. Since its origin about 6000 years ago, the beautifully symmetrical, 4835-m-high basaltic stratovolcano has produced frequent moderate-volume explosive and effusive eruptions without major periods of inactivity. It rises above a saddle NE of sharp-peaked Kamen volcano and lies SE of the broad Ushkovsky massif. More than 100 flank eruptions have occurred during the past roughly 3000 years, with most lateral craters and cones occurring along radial fissures between the unconfined NE-to-SE flanks of the conical volcano between 500 m and 3600 m elevation. The morphology of the 700-m-wide summit crater has been frequently modified by historical eruptions, which have been recorded since the late-17th century. Historical eruptions have originated primarily from the summit crater, but have also included numerous major explosive and effusive eruptions from flank craters.
Information Contacts: Olga Chubarova, Kamchatka Volcanic Eruptions Response Team (KVERT), Institute of Volcanic Geology and Geochemistry, Piip Ave. 9, Petropavlovsk-Kamchatsky, 683006, Russia; Tom Miller, Alaska Volcano Observatory (AVO), a cooperative program of a) U.S. Geological Survey, 4200 University Drive, Anchorage, AK 99508-4667, USA (URL: http://www.avo.alaska.edu/), b) Geophysical Institute, University of Alaska, PO Box 757320, Fairbanks, AK 99775-7320, USA, and c) Alaska Division of Geological & Geophysical Surveys, 794 University Ave., Suite 200, Fairbanks, AK 99709, USA.
Lopevi
Vanuatu
16.507°S, 168.346°E; summit elev. 1413 m
All times are local (unless otherwise noted)
Intermittent ash eruptions October 1999-April 2000; pyroclastic flow in February
Intermittent activity in October and December 1999 and February-March 2000 was reported by pilots flying near the island. Reports sent to the Wellington Volcanic Ash Advisory Center and the Port Vila control tower resulted in aviation advisories that formed the basis for this summary. Additional information about February activity was provided by John Seach, who visited the volcano (figure 7) during 23-24 February and talked to local residents.
During 1963-82, ash emissions, lava flows, lava fountains, and Strombolian explosions occurred intermittently. This twenty-year pattern ended on 24 October 1982. Eruptive activity resumed in July 1998. A series of Strombolian explosions in the main 1963 crater (just NW of the central crater) was observed during November-December 1998 (BGVN 24:02). Lava extrusion in December 1998 produced a small intracrater flow from a cone at the NW end of the 1963 crater (BGVN 24:07). Sporadic eruptive activity observed between the end of December 1998 and March 1999 was confined to the 1963 crater at ~1,000 m elevation on the NW flank.
Ground observers reported on 15 October 1999 that a minor eruption approximately one week earlier consisted of a continuous ash plume rising to an altitude of 300-600 m. An ash cloud up to 2,700 m altitude was reported by pilots on 9-10 December.
Activity during February 2000. At 1422 on 3 February an ash cloud was reported up to 4,500 m over the island. Between 0507 and 0520 on 18 February a Vanair pilot reported an ash cloud initially as high as 9 km and then around 4.8 km altitude. A plume was identified on infrared and early morning visible satellite imagery, but there was considerable cloudiness in the area. Activity was continuing as of 0602 on 19 February, with an ash plume to ~5.5 km altitude. Convective activity through the day rapidly obscured any traces of the ash plume on satellite imagery. Analyses indicated that the plume may have contained significant ash that was expected to move ESE-SE and extend to 370 km. Due to the convective activity pilots were advised to respond as though the plume was rising to ~9 km altitude. However, another pilot report at 0621 indicated that activity had ceased.
According to John Seach, around midday on 19 February villagers on the neighboring island of Paama heard two loud explosions from the volcano; the second was the loudest heard in two years. This was followed by a brown ash cloud rising to ~4.5 km altitude visible from an aircraft en route from Sydney to Hawaii. Ashfalls occurred on Paama. A pyroclastic flow from the NW-flank crater (figure 8) traveled 2.5 km SW and reached the sea along a 300-m-wide front, where it created a delta. Blocks of 4 m in diameter were carried down to sea level. A 3-m-diameter block 50 m from the sea had a surface temperature of 170°C.
Trees buried in the ash were only visible as circular, black smoking areas when observed on 23 February. On the edge of the pyroclastic-flow deposit trees 0.5 m in diameter were snapped off 2 m from the ground (figure 9); some were upturned and redeposited in the ash. Standing devastated trees were burnt to a height of 18 m and debris was lodged in the canopy. Some fallen trees were still burning. Within 20 m of the edge of the pyroclastic-flow deposit were fallen devastated trees, and standing burnt trees were present for another 10 m beyond that. Observers were forced back when ground temperatures (over 200°C) melted boots. The air was filled with the smell of burnt trees and sulfur. Coconuts superheated and exploded. Sap in smaller branches boiled and formed bubbles on the outside of the branch.
The active NW crater (figure 10) was climbed by Seach and Geoff Mackley on 23 and 24 February 2000. A lava dome was present on the SW crater rim from where the pyroclastic flow had originated along a 100-m-wide front. Lighter colored deposits marked its track down the volcano. On the N edge of the pyroclastic-flow deposit and 200 m below the NW crater was the source of a debris avalanche. A debris volume on the order of a million cubic meters had moved, exposing a large hole and producing two branching flows that moved ~250 m SW towards the sea. A new 150-m-high cinder cone formed inside the old crater was smoking with blue and white vapor being emitted. Ground temperature was 81°C at the base of the cinder cone. A two-week-old flank lava flow was observed to have traveled 1.5 km WNW to an elevation 250 m below the NW crater, burning trees and vegetation.
Additional eruptions during March and April 2000. Another minor eruption on 15 March sent ash to 1,500 m, where it mixed with meteorological clouds. A stronger eruption began on 21 March with ash reported to 2,700 m altitude along with steam to 450 m. Activity increased the next day, when the plume was reported to be at levels of 4,200-4,500 m. The eruption continued during 23-24 March with plumes rising to altitudes of about 2,400 m.
A pilot report around 1100 on 24 April indicated a very dark-brown ash cloud rising from the volcano to an altitude of ~4,800 m and drifting NW. The report also noted that a new vent on the W side was emitting lava. A notice to aviators stated that they should expect ash to 5,400 m altitude within 550 km in the NW quadrant of the volcano. Ash warnings to aviators in the late morning and night of 25 April indicated that ash and lava continued to be emitted from the W vent. Pilot reports indicated that the height of the ash cloud was difficult to determine due to cloud cover, but was at least to 600 m altitude. The ash appeared to be thinning out beyond 18 km W of the volcano, but the extent of the plume could not be determined from satellite imagery. A notice at 2155 on 26 April stated that no further visual activity reports had been received since 25 April.
Geologic Background. The small 7-km-wide conical island of Lopevi, known locally as Vanei Vollohulu, is one of Vanuatu's most active volcanoes. A small summit crater containing a cinder cone is breached to the NW and tops an older cone that is rimmed by the remnant of a larger crater. The basaltic-to-andesitic volcano has been active during historical time at both summit and flank vents, primarily along a NW-SE-trending fissure that cuts across the island, producing moderate explosive eruptions and lava flows that reached the coast. Historical eruptions at the 1413-m-high volcano date back to the mid-19th century. The island was evacuated following major eruptions in 1939 and 1960. The latter eruption, from a NW-flank fissure vent, produced a pyroclastic flow that swept to the sea and a lava flow that formed a new peninsula on the western coast.
Information Contacts: Wellington Volcanic Ash Advisory Center (VAAC), MetService, PO Box 722, Wellington, New Zealand (URL: http://www.metservice.co.nz/); John Seach, PO Box 16, Chatsworth Island, N.S.W. 2469, Australia.
Mayon (Philippines) — April 2000 Cite this Report
Mayon
Philippines
13.257°N, 123.685°E; summit elev. 2462 m
All times are local (unless otherwise noted)
Decreasing activity; small eruptions, lava flows, secondary pyroclastic flows
Volcanic unrest that began at Mayon during May 1999 led to growth of the lava dome beginning on 12 February 2000, and continued in the form of explosive eruptions from 23 February through 1 March (BGVN 25:02). Since the 1 March 2000 eruption, observations have indicated that activity is declining.
After 1 March activity was relatively quiet with the largest event being an ash puff that was produced on 12 March when hot lava at the summit came in contact with surface water. The ash puff rose to a height of ~1 km and drifted to the NW. After 1 March there was moderate seismicity, high volcanic gas outputs, no increase in ground deformation, continuing glow of the summit, and new lava effusion. These conditions were associated with very gradual return to repose. Therefore on 16 March PHIVOLCS reduced the alert status of Mayan volcano from Alert Level 4 (hazardous eruption imminent, possible within days) to alert Level 3 (less probability of a hazardous eruption).
On 17 March at 1254, 1350, 1609, and 1619 partial collapse of the new lava flow on the volcano's upper middle slopes produced voluminous secondary pyroclastic flows, with the associated ash clouds blown to the SW. On 19 March at 0138, 0203, and 0300 similar secondary pyroclastic flows occurred with ash clouds that blew NE. The billowing ash clouds did not originate from the crater, but from the side of the lava flow that failed on the volcano's upper slope, and from descending detached lava fragments along Bonga Gully. Scientists expected the series of secondary pyroclastic flows due to the instability of volcanic material deposited on steep ground.
After 25 March the number of low-frequency volcanic earthquakes was relatively high (up to 40 per day), presumably due to strong jetting of hot gases emanating from the crater. In addition, relatively high levels of SO2 emissions (up to 9,000 metric tons per day) also occurred after 1 March that were associated with degassing of residual magma. Since the volcano showed no signs of an imminent eruption, on 1 April PHIVOLCS reduced the Alert Level to 2 (the probability of hazardous explosive eruption is minimal). The volcanic system is expected to continue producing earthquakes and to vent a large amount of gas because fresh magma still resides along the whole length of the volcanic conduit and near the summit. Due to the possibility of sudden explosions caused by the release of gas from localized pockets within the magmatic system, and the threat of secondary pyroclastic flows, rockfalls, and ash fallout, PHIVOLCS maintains off-limit zones around the volcano up to 7 km in radius.
Geologic Background. Symmetrical Mayon, which rises above the Albay Gulf NW of Legazpi City, is the most active volcano of the Philippines. The steep upper slopes are capped by a small summit crater. Recorded eruptions since 1616 CE range from Strombolian to basaltic Plinian, with cyclical activity beginning with basaltic eruptions, followed by longer term andesitic lava flows. Eruptions occur predominately from the central conduit and have also produced lava flows that travel far down the flanks. Pyroclastic flows and mudflows have commonly swept down many of the approximately 40 ravines that radiate from the summit and have often damaged populated lowland areas. A violent eruption in 1814 killed more than 1,200 people and devastated several towns.
Information Contacts: Raymundo S. Punongbayan and Ernesto Corpuz, Philippine Institute of Volcanology and Seismology (PHIVOLCS), C.P. Garcia St. Diliman, Quezon City, Philippines (URL: http://www.phivolcs.dost. gov.ph/).
Mutnovsky
Russia
52.449°N, 158.196°E; summit elev. 2288 m
All times are local (unless otherwise noted)
Two short-lived gas-and-ash explosions on 17 March
Prior to 24 March 2000, KVERT (Kamchatkan Volcanic Eruption Response Team) had not included Mutnovsky in any activity reports this year. As of 28 April 2000, KVERT temporarily suspended operations because of a lack of funding.
After more precise analysis of visual reports from Petropavlovsk-Kamchatsky and a comparison of signals from several seismic stations, KVERT determined that at 0700 on 17 March, a short-lived explosion sent a gas-and-steam plume to heights of ~1,000 m above the volcano; the plume disappeared within 30 minutes. At 1300 on 17 March, another gas-and-steam plume rose to about the same altitude and extended to the SE; activity ended by 1700. A corresponding shallow seismic event was registered at 1856, followed by a low-frequency (1 Hz) volcanic tremor. The hazard level was originally Yellow but was returned to Green later in the month, although episodes of low-level, low-frequency volcanic tremor continued. The volcano occasionally was obscured by clouds.
An increase in volcanic tremor occurred on 1 April from 1300-2100 and again at 0930-1700 on 13 April. The volcano remained quiet through the rest of April.
Geologic Background. Massive Mutnovsky, one of the most active volcanoes of southern Kamchatka, is formed of four coalescing stratovolcanoes of predominantly basaltic composition. Multiple summit craters cap the volcanic complex. Growth of Mutnovsky IV, the youngest cone, began during the early Holocene. An intracrater cone was constructed along the northern wall of the 1.3-km-wide summit crater. Abundant flank cinder cones were concentrated on the SW side. Holocene activity was characterized by mild-to-moderate phreatic and phreatomagmatic eruptions from the summit crater. Explosive eruptions have been common since the 17th century, with lava flows produced during the 1904 eruption.
Information Contacts: Olga Chubarova, Kamchatka Volcanic Eruptions Response Team (KVERT), Institute of Volcanic Geology and Geochemistry, Piip Ave. 9, Petropavlovsk-Kamchatsky, 683006, Russia; Tom Miller, Alaska Volcano Observatory (AVO), a cooperative program of a) U.S. Geological Survey, 4200 University Drive, Anchorage, AK 99508-4667, USA (URL: http://www.avo.alaska.edu/), b) Geophysical Institute, University of Alaska, PO Box 757320, Fairbanks, AK 99775-7320, USA, and c) Alaska Division of Geological & Geophysical Surveys, 794 University Ave., Suite 200, Fairbanks, AK 99709, USA.
Sheveluch
Russia
56.653°N, 161.36°E; summit elev. 3283 m
All times are local (unless otherwise noted)
Intermittent ash explosions from January through March
This report covers the period January-April 2000. As of 28 April 2000, KVERT (Kamchatkan Volcanic Eruption Response Team) temporarily suspended operations because of a lack of funding. Seismic activity was at or near background level throughout this period. Occasional weak fumarolic activity occurred, accompanied by fumarolic plumes that rose from 50 m to several hundred meters above the volcano and extended to 10 km in various directions. The volcano frequently was obscured by clouds, which prevented both visual and satellite observations. The hazard level was Green throughout most of the period except for a few days in late January and a period in March when seismic events caused the level to be raised to Yellow.
At 0329 on 9 January, seismic data indicated that a short-lived ash explosion may have occurred. An 81-minute-long series of shallow events was recorded. However, no ash plume was seen on the satellite images at 0513. At 0100 on 23 January, and again at 0428 on 26 January, 20-minute episodes of shallow earthquakes and tremor indicated that brief gas-and-ash explosions may have occurred. The hazard level was raised to Yellow. The volcano was obscured by clouds on 23-26 January; however, on the morning of the 27th the volcano was quiet but its W flanks were covered with gray ash, perhaps from dome explosions. The hazard level was returned to Green.
During the first week of February, seismicity under the volcano was mainly at background levels with occasional fumarolic plumes. At 1653 on 7 February, visual sightings from Klyuchi town reported short-lived, explosive eruptions that sent an ash-poor plume to heights of 1,500 m above the dome. An accompanying increase in seismic activity occurred. At 1800 a plume rose 700 m above the dome and extended 5 km to the NW.
On 9 March, there was a possible ash-gas plume and the nature of the seismicity suggested that this plume may have risen 3-4 km above the crater, but the volcano was obscured by clouds. Again during the week ending on 17 March, seismic data suggested a short-lived explosive eruption sending a plume to 3-4 km above the dome. On 11-13 March, shallow earthquakes and volcanic tremor were registered, but the volcano was obscured by clouds the entire week. During 17-23 March, a steam-and-gas plume rose 500-1,000 m above the volcano, spreading up to 10 km to the NE and E. Visual sightings from Klyuchi at 1752 on 17 March revealed that a short-lived explosive eruption sent an ash-poor plume to about 1,000 m above the dome; it drifted 7 km to the W. This event was accompanied by increased seismicity. At 1345 on 18 March, seismic data indicated another short-lived weak explosive eruption. At 0249 on 24 March, in contrast, seismic data indicated a short-lived but vigorous explosive eruption. The hazard level was raised to Yellow during most of this two-week period but was returned to Green after the seismicity returned to background levels, where it remained throughout April.
Geologic Background. The high, isolated massif of Sheveluch volcano (also spelled Shiveluch) rises above the lowlands NNE of the Kliuchevskaya volcano group. The 1,300 km3 andesitic volcano is one of Kamchatka's largest and most active volcanic structures, with at least 60 large eruptions during the Holocene. The summit of roughly 65,000-year-old Stary Shiveluch is truncated by a broad 9-km-wide late-Pleistocene caldera breached to the south. Many lava domes occur on its outer flanks. The Molodoy Shiveluch lava dome complex was constructed during the Holocene within the large open caldera; Holocene lava dome extrusion also took place on the flanks of Stary Shiveluch. Widespread tephra layers from these eruptions have provided valuable time markers for dating volcanic events in Kamchatka. Frequent collapses of dome complexes, most recently in 1964, have produced debris avalanches whose deposits cover much of the floor of the breached caldera.
Information Contacts: Olga Chubarova, Kamchatka Volcanic Eruptions Response Team (KVERT), Institute of Volcanic Geology and Geochemistry, Piip Ave. 9, Petropavlovsk-Kamchatsky, 683006, Russia; Tom Miller, Alaska Volcano Observatory (AVO), a cooperative program of a) U.S. Geological Survey, 4200 University Drive, Anchorage, AK 99508-4667, USA (URL: http://www.avo.alaska.edu/), b) Geophysical Institute, University of Alaska, PO Box 757320, Fairbanks, AK 99775-7320, USA, and c) Alaska Division of Geological & Geophysical Surveys, 794 University Ave., Suite 200, Fairbanks, AK 99709, USA.
Soufriere Hills (United Kingdom) — April 2000 Cite this Report
Soufriere Hills
United Kingdom
16.72°N, 62.18°W; summit elev. 915 m
All times are local (unless otherwise noted)
Dome growth continues through May; Vulcanian eruption 20 March
Volcanism at Soufriere Hills volcano between 5 February and 26 May 2000 consisted of tremor, continuous dome growth, dome collapses, several pyroclastic flows, and a Vulcanian eruption.
Dome growth that began in November 1999 (BGVN 25:01) continued this report period with growth concentrated in the NE and E portion of the dome through February 2000. On 7 March a switch in the focus of dome growth was marked by a small swarm of earthquakes recorded from 1530 to 1730. The swarm consisted of a mixture of volcano-tectonic, long-period, and hybrid earthquakes with a total of 25 recorded events. Between 2342 on 7 March and 0349 on 8 March a second swarm of different types of earthquakes occurred. The appearance of spiny material in the summit area on 7 March suggested that some growth occurred to the W of the new dome towards Gages wall. Further observations on 9 and 10 March showed a large spine, ~30 m high in the S part of the new dome.
A magmatic explosion occurred at 1530 on 20 March, which was the largest event of this report period. According to MVO, a series of pyroclastic-flow signals started shortly after 1530. These were probably triggered by heavy rainfall and gradually built up in size. Between 1800 and 1900, there were several large pulses of activity with each pulse successively larger. At about 1915, a very large pyroclastic flow traveled out across the sea. This was followed by at least one, and probably more, vulcanian explosions from the volcano's summit. Lightning was seen, and near-continuous thunder was heard during this eruption. Satellite imagery suggested that the ash cloud reached over 9 km and mostly traveled E and SE. However, all of Montserrat received some light ashfall as part of the ash cloud spread to the N. Reports of ashfall in Guadeloupe and Antigua were also received. The following night, heavy rain washed away most of the ash in Montserrat. Observations of the lava dome after the explosion showed that virtually all of the new dome, growing since November 1999, had collapsed and some of the interior of the old dome had been eroded.
On 24 March observations of the scar confirmed that a new spine of lava had been extruded over the vent area. In addition, excellent views of the lava dome on 31 March showed blocky growth in the base of the scar with abundant steaming from around the dome. The new dome was estimated to be 150 m wide and about 100 m high; three small spiny lobes could be seen on top of the new growth. By 20 April the dome's volume was estimated to be 12 to 15 million m3. The average growth rate was 5-6 m3/s, which was higher than the rate in December and July (above ~3 m3/s: BGVN 25:01). Two areas of active growth were noted; one on the dome's S side, and another on its E side. The highest point on the new lava dome was measured at 848 m above sea level, which means the new lava dome had a total height of ~120 m.
Between 28 April and 5 May there was a significant increase in both hybrid and long-period earthquakes. About half of the long-period earthquakes recorded immediately preceded rockfalls, and visual observations confirmed that these events comprised powerful, vertical ash emissions immediately prior to the start of the rockfall. The nature of the seismicity indicated increased levels of pressure within the upper conduit and lava dome. The main dome growth area was on the dome's NE flank. The increased activity culminated on 6 May when there was a moderate collapse of several million m3 of rock from the dome's NE flank. The pyroclastic flows generated from the collapse traveled down Tar River Valley and the longest flows just reached the sea. Observations on 12 May revealed refilling of the small scar created by the 6 May collapse. As of 26 May growth was concentrated in the dome's NE side, with indications that it may move towards the SE. Also, between 19 and 26 May a continuous, low-level ash plume visible in GOES 8 imagery emanated from the volcano.
Geologic Background. The complex, dominantly andesitic Soufrière Hills volcano occupies the southern half of the island of Montserrat. The summit area consists primarily of a series of lava domes emplaced along an ESE-trending zone. The volcano is flanked by Pleistocene complexes to the north and south. English's Crater, a 1-km-wide crater breached widely to the east by edifice collapse, was formed about 2000 years ago as a result of the youngest of several collapse events producing submarine debris-avalanche deposits. Block-and-ash flow and surge deposits associated with dome growth predominate in flank deposits, including those from an eruption that likely preceded the 1632 CE settlement of the island, allowing cultivation on recently devegetated land to near the summit. Non-eruptive seismic swarms occurred at 30-year intervals in the 20th century, but no historical eruptions were recorded until 1995. Long-term small-to-moderate ash eruptions beginning in that year were later accompanied by lava-dome growth and pyroclastic flows that forced evacuation of the southern half of the island and ultimately destroyed the capital city of Plymouth, causing major social and economic disruption.
Information Contacts: Montserrat Volcano Observatory (MVO), Mongo Hill, Montserrat, West Indies (URL: http://www.mvomrat.com/).
Tungurahua (Ecuador) — April 2000 Cite this Report
Tungurahua
Ecuador
1.467°S, 78.442°W; summit elev. 5023 m
All times are local (unless otherwise noted)
Frequent early-2000 explosions with loud reports; ash plumes to 10 km altitude
This report covers the interval from 1 January to 18 February 2000. What follows are excerpts of the Geophysical Institute's daily reports. Basically, they disclose a pattern of noisy ash-bearing eruptions, tremor, and elevated seismicity. The alert status remained at Orange. As noted on table 3, some ash columns rose as high as 5-10 km; the sounds from one explosion were heard 75 km N in Quito. Tephra frequently blew towards the W (the major population center, Baños, lies N of the summit).
Table 3. Tungurahua plumes and other activity during 1 January-18 February 2000. Plume composition was further described as follows: dominantly ash plumes (a), dominantly steam plumes (s); and direction blown (e.g., N, S, E, W). Where available, selected comments on active processes also follow. Courtesy of the Geophysical Institute.
| Date |
Plume height (km) and Observations |
| 01 Jan 2000 |
2a, W. Banded tremor. |
| 02 Jan 2000 |
0.5 a, W (fines fell on Rio Bamba). Banded tremor. |
| 03 Jan 2000 |
"Significant explosions"a, W. Following the explosions there was high-amplitude tremor for 30 minutes. |
| 04 Jan 2000 |
5a, W. |
| 05 Jan 2000 |
2a, N. |
| 06 Jan 2000 |
3a, NE. |
| 07 Jan 2000 |
Poor visibility, 1-2 a. |
| 08 Jan 2000 |
Poor visibility, 3-4a, SW. |
| 10 Jan 2000 |
6,700-7,000 t/d SO2. High tremor. |
| 11 Jan 2000 |
1.5s, NW. |
| 12 Jan 2000 |
~ 8a, with two plumes seen in satellite imagery, trailing off S and W. 8,400 t/d SO2. |
| 13 Jan 2000 |
Restricted visibility but incandescent ash seen falling on upper slopes. 5,000 t/d SO2. |
| 14 Jan 2000 |
~ 0.2a; the plume was highly concentrated in ash, thus the column collapsed soon after it began discharging; later, incandescent tephra fell over the upper sides. |
| 15 Jan 2000 |
2a, strong detonation heard 10 km away; incandescent blocks seen. |
| 16 Jan 2000 |
Poor visibility and no explosions detected. |
| 17 Jan 2000 |
Small explosion detected. |
| 18 Jan 2000 |
One audible explosion heard during poor visibility. |
| 19 Jan 2000 |
1a, continuous discharge blown W to NW. |
| 20 Jan 2000 |
Small ash columns. |
| 21 Jan 2000 |
Bad weather, falling rocks heard; mudflows noted. |
| 23 Jan 2000 |
Observers saw a short, hazy column with a moderate concentration of ash. |
| 24 Jan 2000 |
1a, blown W and SW. |
| 25 Jan 2000 |
Seismically detected explosions with 5-8 cm2 reduced displacements. |
| 26 Jan 2000 |
Bad weather; small explosions. |
| 27 Jan 2000 |
Seismically detected explosions with 8 cm2 reduced displacements. |
| 28 Jan 2000 |
Small to moderate explosions. |
| 29 Jan 2000 |
Moderate to large explosions; cannon-like sounds reported; two mudflows crossing roads. |
| 30 Jan 2000 |
~ 1a, but American Airlines also reported a plume to ~10 km; moderate-to-large seismically detected explosions, plume blowing NW to W. |
| 01 Feb 2000 |
Slight decrease in the number of explosions with respect to previous days. |
| 02 Feb 2000 |
2a, W; 20 min. of tremor. |
| 03 Feb 2000 |
1a, W and SW; incandescent materials descended 0.5 km down flanks. |
| 04 Feb 2000 |
~2.5a, some dense columns; W, NW, and SW. |
| 05 Feb 2000 |
0.6a, W; rains caused mudflows. |
| 06 Feb 2000 |
Continued outbursts consisting of sporadic low energy explosions. Tremor episode(s) associated with gas emissions. |
| 07 Feb 2000 |
Continual ash emission; S- and W-directed winds. |
| 08 Feb 2000 |
3a, N and NW; explosion at 0438 heard by residents of Quito; ashfall closed airports in Ambato and Riobamba. |
| 12 Feb 2000 |
~8-10a (aviation report); W and SW. |
| 13 Feb 2000 |
Cloudy weather; roaring noises heard; fine ash in NW sector of volcano; at 0743, an Avianca flight en-route to Lima-Bogota reported a 7-km-radius cloud of ash over the volcano at 8 km altitude. |
| 14 Feb 2000 |
2a, SW; small amount of ash in Riobamba. |
| 15 Feb 2000 |
2a, W. |
| 16 Feb 2000 |
Plumes and emissions not discussed. |
| 17 Feb 2000 |
3a. |
| 18 Feb 2000 |
3a. |
Histograms and plots on the Institute's web site tell a story of increased activity during late 1999, but the data for 2000 were generally absent. For example, BGVN 24:11 included their plot of daily explosions during 24 October-3 December 1999. This plot showed 1 event on 24 October 1999 and 1-39 events during the first half of November. A prominent peak in the latter half of November reached 105 events. The number of daily events subsequently declined for the last data shown, ending with 39 events on 3 December 1999.
Based on a reading of the daily reports for early 2000 this decline continued. An approximate tally of daily explosions suggests 300 during the month of January, an average of about 10/day. Similarly, for the first eighteen days of February, explosions again averaged about 10/day. In addition, a regional earthquake of M 3.3 took place on 12 January centered below the volcano's S flanks.
One of the Institute's plots disclosed a positive correlation between near-term rainfall and tremor during 1993-1999. Notwithstanding that longer-term observation, rainfall decreased during the course of 1999 while tremor escalated strongly, ultimately undergoing more than a 15-fold increase over background by the latter part of 1999.
Epicenters and foci mapped for August 1999 clustered near the summit and also occurred with a much lesser density along a radial band trending NW-SE extending out on either side of the summit. Thus, the main cluster of the August 1999 earthquake swarm lay directly below the summit at less than 10 km depth; with close approach to the surface the cluster appears directed toward the volcano's SE side. A plot of measured SO2 fluxes for the interval July-8 December 1999 peaked in September-October at ~9,000-10,000 tons/day (BGVN 24:11).
On 21 and 29 January, and 6 February, rainy weather caused mudflows to descend drainages blanketed by ash deposits. On many days, explosions caused unusually strong acoustical signals; the most powerful signal was generated on 8 February when the sound of an explosion was heard 75 km N in Quito.
Some of the other noteworthy events and ideas discussed in the daily reports follow. At 1544 on 3 January significant explosions occurred, followed by high-amplitude tremor lasting about 30 minutes. The emissions continued and the columns again blew W. On the 4th, undisclosed satellite images showed a column of ash 5 km tall, again blown W. The daily report for 7 January mentioned two possible eruption scenarios involving escalating eruptive vigor and increased hazards.
At 0614 on 12 January ground observers noted a dark gray column rose 3-5 km over the summit. Thereafter, NOAA satellite technicians noted two ash clouds. One cloud extended from the volcano toward the W reaching a length of 16 km and a width of 15 km; it rose to 3 km over the summit (i.e., ~8 km altitude). A larger ash cloud extended toward the S reaching a length of 75 km; it also reached ~8 km altitude (table 1).
Ash clouds remained obscure from the ground on 13 January but in the morning roars were heard associated with the continual emission of gases and ash. A light rain of fine ash fell in the NW sector of the volcano. Peculiar, very dense clouds vented on 14 January, rising only 200 m before rapidly collapsing.
At 0743 on 13 February, an Avianca flight in route to Lima-Bogotá reported an ash cloud over the volcano at 8 km altitude (table 1). In the morning on 14 February some loud explosions foretold of ash columns; they rose 2-3 km above the summit and blew SW. In the morning the next day satellite images showed an ash cloud that had reached a length of 100-150 km and width of 15 km. This cloud was directed from Tungurahua toward the NNW, passing over the towns of Píllaro, Latacunga, and Salcedo. At 10 km distance, falling ash reached a thickness of 1 mm.
Geologic Background. Tungurahua, a steep-sided andesitic-dacitic stratovolcano that towers more than 3 km above its northern base, is one of Ecuador's most active volcanoes. Three major edifices have been sequentially constructed since the mid-Pleistocene over a basement of metamorphic rocks. Tungurahua II was built within the past 14,000 years following the collapse of the initial edifice. Tungurahua II collapsed about 3,000 years ago and produced a large debris-avalanche deposit to the west. The modern glacier-capped stratovolcano (Tungurahua III) was constructed within the landslide scarp. Historical eruptions have all originated from the summit crater, accompanied by strong explosions and sometimes by pyroclastic flows and lava flows that reached populated areas at the volcano's base. Prior to a long-term eruption beginning in 1999 that caused the temporary evacuation of the city of Baños at the foot of the volcano, the last major eruption had occurred from 1916 to 1918, although minor activity continued until 1925.
Information Contacts: Geophysical Institute (Instituto Geofísico), Escuela Politécnica Nacional, Apartado 17-01-2759, Quito, Ecuador.
Whakaari/White Island (New Zealand) — April 2000 Cite this Report
Whakaari/White Island
New Zealand
37.52°S, 177.18°E; summit elev. 294 m
All times are local (unless otherwise noted)
Continuous ash emissions in April; high SO2 and fluctuating tremor
Starting on 7 March, White Island displayed minor eruptive activity, elevated seismicity, and higher than normal SO2 gas flux (BGVN 25:03). Staff from the Institute of Geological & Nuclear Sciences (GNS) who visited on 18 April observed a gas plume, comprised of steam and small amounts of ash, being erupted to 1,300-1,700 m before being blown S. At distances of more than a few kilometers from the island no ash was visible in the plume, although reports from Whakatane indicated that trace amounts of ash fell during the night of 17-18 April. The erupting vent, named MH vent, is ~10 m across. The seismograph at White Island recorded volcanic tremor starting on 6 April 2000, the first significant tremor since April 1999. In addition, recent measurements of the SO2 flux were well above typical background levels at White Island. This eruptive activity was sufficient to increase the Alert Level from 1 to 2.
Ash was erupted almost continuously during the weekend of 22-23 April, although there was no evidence that any larger blocks were erupted. During another visit by scientists on 26 April the activity level was much reduced from that of the previous two weeks, but minor eruptive activity continued. A weak gas plume, comprised almost totally of steam, was being erupted to 1,500 m before being blown NE. The plume was not visible more than a few kilometers from the island. The seismograph continued to record moderate to strong volcanic tremor, although the level fluctuated with time. It is unclear if there was a direct relationship between the intensity of the eruptive activity and the level of volcanic tremor. COSPEC measurements on 28 April recorded a SO2 flux of 927 metric tons/day, down from previous measurements, but consistent with the activity.
Activity was similar during a monitoring visit on 2 May, with a weak gas and ash plume from MH vent. The ash plume was rising to 500 m, while the steam-and-gas plume rose to 760-900 m before being blown NNE. The plume was visible more than 10-15 km from the island. Ash emission was occurring continuously. The seismograph continued to record fluctuating moderate to strong volcanic tremor.
Geologic Background. The uninhabited Whakaari/White Island is the 2 x 2.4 km emergent summit of a 16 x 18 km submarine volcano in the Bay of Plenty about 50 km offshore of North Island. The island consists of two overlapping andesitic-to-dacitic stratovolcanoes. The SE side of the crater is open at sea level, with the recent activity centered about 1 km from the shore close to the rear crater wall. Volckner Rocks, sea stacks that are remnants of a lava dome, lie 5 km NW. Descriptions of volcanism since 1826 have included intermittent moderate phreatic, phreatomagmatic, and Strombolian eruptions; activity there also forms a prominent part of Maori legends. The formation of many new vents during the 19th and 20th centuries caused rapid changes in crater floor topography. Collapse of the crater wall in 1914 produced a debris avalanche that buried buildings and workers at a sulfur-mining project. Explosive activity in December 2019 took place while tourists were present, resulting in many fatalities. The official government name Whakaari/White Island is a combination of the full Maori name of Te Puia o Whakaari ("The Dramatic Volcano") and White Island (referencing the constant steam plume) given by Captain James Cook in 1769.
Information Contacts: Brad Scott, Brent Alloway, and Steven Sherburn, Wairakei Research Center, Institute of Geological and Nuclear Sciences (IGNS), Private Bag 2000, Wairakei, New Zealand (URL: http://www.gns.cri.nz/).
Yasur
Vanuatu
19.532°S, 169.447°E; summit elev. 361 m
All times are local (unless otherwise noted)
Typical explosive activity observed in February
Yasur volcano was visited during 18-20 February by John Seach, Geoff Mackley, and a film crew from the United Kingdom. There was a lower level of activity than in June and July 1999 (BGVN 24:07). "Level 1" activity predominated, defined as normal activity where bombs generally fall within the cone area. The three main craters within the cone, A, B, and C, are aligned S to N.
On 18 February Crater A silently emitted small amounts of white vapor tinged with blue. The following day observers saw emission of brown ash but again heard no noise from the crater. Crater B was also silent and only emitted a small amount of white vapor. Two smaller craters E of Craters A and B were continually full of vapor. Crater C exhibited the main activity. There were two active vents at the N and S ends of the crater. The inside crater wall was strongly fumarolic. Over a 2-hour period Crater C produced four explosions from the N vent and three from the S vent. Incandescent bombs were thrown to a height of 120 m. Some bombs glowed for 30 minutes after dark.
On 19 February observers lowered themselves 50 m to the floor of the Yasur cone from the SE using ropes. Ground temperature 15 m S of Crater C was 96°C. The floor was littered with black bombs up to 1.5 m in diameter and covered with ash. Explosions threw lava to a height of 250 m. Bombs were either thrown straight up or directed towards the NW edge of the cone. Explosions occurred ten times per hour and were accompanied by ground shaking and sometimes shockwaves. Degassing was heard every few seconds between explosions. Inside the cone a number of earthquakes were felt which were not accompanied by explosions or degassing; these earthquakes were not felt by observers on the crater rim, 100 m away. Inside the cone there was a strong sulfur smell and fumes irritated eyes.
On 20 February activity increased. Incandescent lava was ejected every few seconds. Larger explosions about 8 times per hour sent lava to 300 m elevation and 100 m away from the vent. The active vents glowed orange after dark.
The NW flanks of Yasur cone down to Lake Siwi were littered with large bombs from the 1999 activity. Black bombs to 3 m in diameter were observed at the base of the cone. Approaching Yasur remains dangerous at any time for visitors. Vehicles can be driven to within 20 m of the cone and this encourages tourists to visit the crater edge. Unpredictable trajectories of bombs and variable eruptive activity pose threats to visitors. It should be noted that three deaths occurred on Yasur in 1994-95 during a period of low activity (BGVN 20:08).
Geologic Background. Yasur has exhibited essentially continuous Strombolian and Vulcanian activity at least since Captain Cook observed ash eruptions in 1774. This style of activity may have continued for the past 800 years. Located at the SE tip of Tanna Island in Vanuatu, this pyroclastic cone has a nearly circular, 400-m-wide summit crater. The active cone is largely contained within the small Yenkahe caldera, and is the youngest of a group of Holocene volcanic centers constructed over the down-dropped NE flank of the Pleistocene Tukosmeru volcano. The Yenkahe horst is located within the Siwi ring fracture, a 4-km-wide open feature associated with eruption of the andesitic Siwi pyroclastic sequence. Active tectonism along the Yenkahe horst accompanying eruptions has raised Port Resolution harbor more than 20 m during the past century.
Information Contacts: John Seach, PO Box 16, Chatsworth Island, N.S.W. 2469, Australia.