Recently Published Bulletin Reports
Kadovar (Papua New Guinea) An ash plume and weak thermal anomaly during May 2023
San Miguel (El Salvador) Small gas-and-ash explosions during March and May 2023
Ebeko (Russia) Continued explosions, ash plumes, and ashfall during October 2022-May 2023
Home Reef (Tonga) Discolored plumes continued during November 2022-April 2023
Semisopochnoi (United States) Occasional explosions, ash deposits, and gas-and-steam plumes during December 2022-May 2023
Ambae (Vanuatu) New lava flow, ash plumes, and sulfur dioxide plumes during February-May 2023
Ibu (Indonesia) Daily ash explosions continue, along with thermal anomalies in the crater, October 2022-May 2023
Dukono (Indonesia) Continuing ash emissions, SO2 plumes, and thermal signals during October 2022-May 2023
Sabancaya (Peru) Explosions, gas-and-ash plumes, and thermal activity persist during November 2022-April 2023
Sheveluch (Russia) Significant explosions destroyed part of the lava-dome complex during April 2023
Bezymianny (Russia) Explosions, ash plumes, lava flows, and avalanches during November 2022-April 2023
Chikurachki (Russia) New explosive eruption during late January-early February 2023
Kadovar (Papua New Guinea) — June 2023  Cite this Report
Kadovar
Papua New Guinea
3.608°S, 144.588°E; summit elev. 365 m
All times are local (unless otherwise noted)
An ash plume and weak thermal anomaly during May 2023
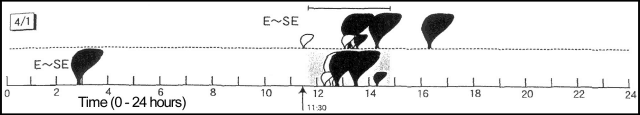
Kadovar is a 2-km-wide island that is the emergent summit of a Bismarck Sea stratovolcano. It lies off the coast of New Guinea, about 25 km N of the mouth of the Sepik River. Prior to an eruption that began in 2018, a lava dome formed the high point of the volcano, filling an arcuate landslide scarp open to the S. Submarine debris-avalanche deposits occur to the S of the island. The current eruption began in January 2018 and has comprised lava effusion from vents at the summit and at the E coast; more recent activity has consisted of ash plumes, weak thermal activity, and gas-and-steam plumes (BGVN 48:02). This report covers activity during February through May 2023 using information from the Darwin Volcanic Ash Advisory Center (VAAC) and satellite data.
Activity during the reporting period was relatively low and mainly consisted of white gas-and-steam plumes that were visible in natural color satellite images on clear weather days (figure 67). According to a Darwin VAAC report, at 2040 on 6 May an ash plume rose to 4.6 km altitude and drifted W; by 2300 the plume had dissipated. MODIS satellite instruments using the MODVOLC thermal algorithm detected a single thermal hotspot on the SE side of the island on 7 May. Weak thermal activity was also detected in a satellite image on the E side of the island on 14 May, accompanied by a white gas-and-steam plume that drifted SE (figure 68).
Geologic Background. The 2-km-wide island of Kadovar is the emergent summit of a Bismarck Sea stratovolcano of Holocene age. It is part of the Schouten Islands, and lies off the coast of New Guinea, about 25 km N of the mouth of the Sepik River. Prior to an eruption that began in 2018, a lava dome formed the high point of the andesitic volcano, filling an arcuate landslide scarp open to the south; submarine debris-avalanche deposits occur in that direction. Thick lava flows with columnar jointing forms low cliffs along the coast. The youthful island lacks fringing or offshore reefs. A period of heightened thermal phenomena took place in 1976. An eruption began in January 2018 that included lava effusion from vents at the summit and at the E coast.
Information Contacts: Darwin Volcanic Ash Advisory Centre (VAAC), Bureau of Meteorology, Northern Territory Regional Office, PO Box 40050, Casuarina, NT 0811, Australia (URL: http://www.bom.gov.au/info/vaac/); Hawai'i Institute of Geophysics and Planetology (HIGP) - MODVOLC Thermal Alerts System, School of Ocean and Earth Science and Technology (SOEST), Univ. of Hawai'i, 2525 Correa Road, Honolulu, HI 96822, USA (URL: http://modis.higp.hawaii.edu/); Copernicus Browser, Copernicus Data Space Ecosystem, European Space Agency (URL: https://dataspace.copernicus.eu/browser/).
San Miguel (El Salvador) — June 2023 Cite this Report
San Miguel
El Salvador
13.434°N, 88.269°W; summit elev. 2130 m
All times are local (unless otherwise noted)
Small gas-and-ash explosions during March and May 2023
San Miguel in El Salvador is a broad, deep crater complex that has been frequently modified by eruptions recorded since the early 16th century and consists of the summit known locally as Chaparrastique. Flank eruptions have produced lava flows that extended to the N, NE, and SE during the 17-19th centuries. The most recent activity has consisted of minor ash eruptions from the summit crater. The current eruption period began in November 2022 and has been characterized by frequent phreatic explosions, gas-and-ash emissions, and sulfur dioxide plumes (BGVN 47:12). This report describes small gas-and-ash explosions during December 2022 through May 2023 based on special reports from the Ministero de Medio Ambiente y Recursos Naturales (MARN).
Activity has been relatively low since the last recorded explosions on 29 November 2022. Seismicity recorded by the San Miguel Volcano Station (VSM) located on the N flank at 1.7 km elevation had decreased by 7 December. Sulfur dioxide gas measurements taken with DOAS (Differential Optical Absorption Spectroscopy) mobile equipment were below typical previously recorded values: 300 tons per day (t/d). During December, small explosions were recorded by the seismic network and manifested as gas-and-steam emissions.
Gas-and-ash explosions in the crater occurred during January 2023, which were recorded by the seismic network. Sulfur dioxide values remained low, between 300-400 t/d through 10 March. At 0817 on 14 January a gas-and-ash emission was visible in webcam images, rising just above the crater rim. Some mornings during February, small gas-and-steam plumes were visible in the crater. On 7 March at 2252 MARN noted an increase in degassing from the central crater; gas emissions were constantly observed through the early morning hours on 8 March. During the early morning of 8 March through the afternoon on 9 March, 12 emissions were registered, some accompanied by ash. The last gas-and-ash emission was recorded at 1210 on 9 March; very fine ashfall was reported in El Tránsito (10 km S), La Morita (6 km W), and La Piedrita (3 km W). The smell of sulfur was reported in Piedra Azul (5 km SW). On 16 March MARN reported that gas-and-steam emissions decreased.
Low degassing and very low seismicity were reported during April; no explosions have been detected between 9 March and 27 May. The sulfur dioxide emissions remained between 350-400 t/d; during 13-20 April sulfur dioxide values fluctuated between 30-300 t/d. Activity remained low through most of May; on 23 May seismicity increased. An explosion was detected at 1647 on 27 May generated a gas-and-ash plume that rose 700 m high (figure 32); a decrease in seismicity and gas emissions followed. The DOAS station installed on the W flank recorded sulfur dioxide values that reached 400 t/d on 27 May; subsequent measurements showed a decrease to 268 t/d on 28 May and 100 t/d on 29 May.
Geologic Background. The symmetrical cone of San Miguel, one of the most active volcanoes in El Salvador, rises from near sea level to form one of the country's most prominent landmarks. A broad, deep, crater complex that has been frequently modified by eruptions recorded since the early 16th century caps the truncated unvegetated summit, also known locally as Chaparrastique. Flanks eruptions of the basaltic-andesitic volcano have produced many lava flows, including several during the 17th-19th centuries that extended to the N, NE, and SE. The SE-flank flows are the largest and form broad, sparsely vegetated lava fields crossed by highways and a railroad skirting the base of the volcano. Flank vent locations have migrated higher on the edifice during historical time, and the most recent activity has consisted of minor ash eruptions from the summit crater.
Information Contacts: Ministero de Medio Ambiente y Recursos Naturales (MARN), Km. 5½ Carretera a Nueva San Salvador, Avenida las Mercedes, San Salvador, El Salvador (URL: http://www.snet.gob.sv/ver/vulcanologia).
Ebeko
Russia
50.686°N, 156.014°E; summit elev. 1103 m
All times are local (unless otherwise noted)
Continued explosions, ash plumes, and ashfall during October 2022-May 2023
Ebeko, located on the N end of Paramushir Island in the Kuril Islands, consists of three summit craters along a SSW-NNE line at the northern end of a complex of five volcanic cones. Eruptions date back to the late 18th century and have been characterized as small-to-moderate explosions from the summit crater, accompanied by intense fumarolic activity. The current eruption period began in June 2022 and has recently consisted of frequent explosions, ash plumes, and thermal activity (BGVN 47:10). This report covers similar activity during October 2022 through May 2023, based on information from the Kamchatka Volcanic Eruptions Response Team (KVERT) and satellite data.
Activity during October consisted of explosive activity, ash plumes, and occasional thermal anomalies. Visual data by volcanologists from Severo-Kurilsk showed explosions producing ash clouds up to 2.1-3 km altitude which drifted E, N, NE, and SE during 1-8, 10, 16, and 18 October. KVERT issued several Volcano Observatory Notices for Aviation (VONA) on 7, 13-15, and 27 October 2022, stating that explosions generated ash plumes that rose to 2.3-4 km altitude and drifted 5 km E, NE, and SE. Ashfall was reported in Severo-Kurilsk (Paramushir Island, about 7 km E) on 7 and 13 October. Satellite data showed a thermal anomaly over the volcano on 15-16 October. Visual data showed ash plumes rising to 2.5-3.6 km altitude on 22, 25-29, and 31 October and moving NE due to constant explosions.
Similar activity continued during November, with explosions, ash plumes, and ashfall occurring. KVERT issued VONAs on 1-2, 4, 6-7, 9, 13, and 16 November that reported explosions and resulting ash plumes that rose to 1.7-3.6 km altitude and drifted 3-5 km SE, ESE, E, and NE. On 1 November ash plumes extended as far as 110 km SE. On 5, 8, 12, and 24-25 November explosions and ash plumes rose to 2-3.1 km altitude and drifted N and E. Ashfall was observed in Severo-Kurilsk on 7 and 16 November. A thermal anomaly was visible during 1-4, 16, and 20 November. Explosions during 26 November rose as high as 2.7 km altitude and drifted NE (figure 45).
Explosions and ash plumes continued to occur in December. During 1-2 and 4 December volcanologists from Severo-Kurilsk observed explosions that sent ash to 1.9-2.5 km altitude and drifted NE and SE (figure 46). VONAs were issued on 5, 9, and 16 December reporting that explosions generated ash plumes rising to 1.9 km, 2.6 km, and 2.4 km altitude and drifted 5 km SE, E, and NE, respectively. A thermal anomaly was visible in satellite imagery on 16 December. On 18 and 27-28 December explosions produced ash plumes that rose to 2.5 km altitude and drifted NE and SE. On 31 December an ash plume rose to 2 km altitude and drifted NE.
Explosions continued during January 2023, based on visual observations by volcanologists from Severo-Kurilsk. During 1-7 January explosions generated ash plumes that rose to 4 km altitude and drifted NE, E, W, and SE. According to VONAs issued by KVERT on 2, 4, 10, and 23 January, explosions produced ash plumes that rose to 2-4 km altitude and drifted 5 km N, NE, E, and ENE; the ash plume that rose to 4 km altitude occurred on 10 January (figure 47). Satellite data showed a thermal anomaly during 3-4, 10, 13, 16, 21, 22, and 31 January. KVERT reported that an ash cloud on 4 January moved 12 km NE. On 6 and 9-11 January explosions sent ash plumes to 4.5 km altitude and drifted W and ESE. On 13 January an ash plume rose to 3 km altitude and drifted SE. During 20-24 January ash plumes from explosions rose to 3.7 km altitude and drifted SE, N, and NE. On 21 January the ash plume drifted as far as 40 km NE. During 28-29 and 31 January and 1 February ash plumes rose to 4 km altitude and drifted NE.
During February, explosions, ash plumes, and ashfall were reported. During 1, 4-5 and 7-8 February explosions generated ash plumes that rose to 4.5 km altitude and drifted E and NE; ashfall was observed on 5 and 8 February. On 6 February an explosion produced an ash plume that rose to 3 km altitude and drifted 7 km E, causing ashfall in Severo-Kurilsk. A thermal anomaly was visible in satellite data on 8, 9, 13, and 21 February. Explosions on 9 and 12-13 February produced ash plumes that rose to 4 km altitude and drifted E and NE; the ash cloud on 12 February extended as far as 45 km E. On 22 February explosions sent ash to 3 km altitude that drifted E. During 24 and 26-27 February ash plumes rose to 4 km altitude and drifted E. On 28 February an explosion sent ash to 2.5-3 km altitude and drifted 5 km E; ashfall was observed in Severo-Kurilsk.
Activity continued during March; visual observations showed that explosions generated ash plumes that rose to 3.6 km altitude on 3, 5-7, and 9-12 March and drifted E, NE, and NW. Thermal anomalies were visible on 10, 13, and 29-30 March in satellite imagery. On 18, 21-23, 26, and 29-30 March explosions produced ash plumes that rose to 2.8 km altitude and drifted NE and E; the ash plumes during 22-23 March extended up to 76 km E. A VONA issued on 21 March reported an explosion that produced an ash plume that rose to 2.8 km altitude and drifted 5 km E. Another VONA issued on 23 March reported that satellite data showed an ash plume rising to 3 km altitude and drifted 14 km E.
Explosions during April continued to generate ash plumes. On 1 and 4 April an ash plume rose to 2.8-3.5 km altitude and drifted SE and NE. A thermal anomaly was visible in satellite imagery during 1-6 April. Satellite data showed ash plumes and clouds rising to 2-3 km altitude and drifting up to 12 km SW and E on 3 and 6 April (figure 48). KVERT issued VONAs on 3, 5, 14, 16 April describing explosions that produced ash plumes rising to 3 km, 3.5 km, 3.5 km, and 3 km altitude and drifting 5 km S, 5 km NE and SE, 72 km NNE, and 5 km NE, respectively. According to satellite data, the resulting ash cloud from the explosion on 14 April was 25 x 7 km in size and drifted 72-104 km NNE during 14-15 April. According to visual data by volcanologists from Severo-Kurilsk explosions sent ash up to 3.5 km altitude that drifted NE and E during 15-16, 22, 25-26, and 29 April.
The explosive eruption continued during May. Explosions during 3-4, 6-7, and 9-10 May generated ash plumes that rose to 4 km altitude and drifted SW and E. Satellite data showed a thermal anomaly on 3, 9, 13-14, and 24 May. During 12-16, 23-25, and 27-28 May ash plumes rose to 3.5 km altitude and drifted in different directions due to explosions. Two VONA notices were issued on 16 and 25 May, describing explosions that generated ash plumes rising to 3 km and 3.5 km altitude, respectively and extending 5 km E. The ash cloud on 25 May drifted 75 km SE.
Thermal activity in the summit crater, occasionally accompanied by ash plumes and ash deposits on the SE and E flanks due to frequent explosions, were visible in infrared and true color satellite images (figure 49).
Geologic Background. The flat-topped summit of the central cone of Ebeko volcano, one of the most active in the Kuril Islands, occupies the northern end of Paramushir Island. Three summit craters located along a SSW-NNE line form Ebeko volcano proper, at the northern end of a complex of five volcanic cones. Blocky lava flows extend west from Ebeko and SE from the neighboring Nezametnyi cone. The eastern part of the southern crater contains strong solfataras and a large boiling spring. The central crater is filled by a lake about 20 m deep whose shores are lined with steaming solfataras; the northern crater lies across a narrow, low barrier from the central crater and contains a small, cold crescentic lake. Historical activity, recorded since the late-18th century, has been restricted to small-to-moderate explosive eruptions from the summit craters. Intense fumarolic activity occurs in the summit craters, on the outer flanks of the cone, and in lateral explosion craters.
Information Contacts: Kamchatka Volcanic Eruptions Response Team (KVERT), Far Eastern Branch, Russian Academy of Sciences, 9 Piip Blvd., Petropavlovsk-Kamchatsky, 683006, Russia (URL: http://www.kscnet.ru/ivs/kvert/); MIROVA (Middle InfraRed Observation of Volcanic Activity), a collaborative project between the Universities of Turin and Florence (Italy) supported by the Centre for Volcanic Risk of the Italian Civil Protection Department (URL: http://www.mirovaweb.it/); Copernicus Browser, Copernicus Data Space Ecosystem, European Space Agency (URL: https://dataspace.copernicus.eu/browser/).
Home Reef
Tonga
18.992°S, 174.775°W; summit elev. -10 m
All times are local (unless otherwise noted)
Discolored plumes continued during November 2022-April 2023
Home Reef is a submarine volcano located in the central Tonga islands between Lateiki (Metis Shoal) and Late Island. The first recorded eruption occurred in the mid-19th century, when an ephemeral island formed. An eruption in 1984 produced a 12-km-high eruption plume, a large volume of floating pumice, and an ephemeral island 500 x 1,500 m wide, with cliffs 30-50 m high that enclosed a water-filled crater. Another island-forming eruption in 2006 produced widespread pumice rafts that drifted as far as Australia; by 2008 the island had eroded below sea level. The previous eruption occurred during October 2022 and was characterized by a new island-forming eruption, lava effusion, ash plumes, discolored water, and gas-and-steam plumes (BGVN 47:11). This report covers discolored water plumes during November 2022 through April 2023 using satellite data.
Discolored plumes continued during the reporting period and were observed in true color satellite images on clear weather days. Satellite images show light green-yellow discolored water extending W on 8 and 28 November 2022 (figure 31), and SW on 18 November. Light green-yellow plumes extended W on 3 December, S on 13 December, SW on 18 December, and W and S on 23 December (figure 31). On 12 January 2023 discolored green-yellow plumes extended to the NE, E, SE, and N. The plume moved SE on 17 January and NW on 22 January. Faint discolored water in February was visible moving NE on 1 February. A discolored plume extended NW on 8 and 28 March and NW on 13 March (figure 31). During April, clear weather showed green-blue discolored plumes moving S on 2 April, W on 7 April, and NE and S on 12 April. A strong green-yellow discolored plume extended E and NE on 22 April for several kilometers (figure 31).
Geologic Background. Home Reef, a submarine volcano midway between Metis Shoal and Late Island in the central Tonga islands, was first reported active in the mid-19th century, when an ephemeral island formed. An eruption in 1984 produced a 12-km-high eruption plume, large amounts of floating pumice, and an ephemeral 500 x 1,500 m island, with cliffs 30-50 m high that enclosed a water-filled crater. In 2006 an island-forming eruption produced widespread dacitic pumice rafts that drifted as far as Australia. Another island was built during a September-October 2022 eruption.
Information Contacts: Copernicus Browser, Copernicus Data Space Ecosystem, European Space Agency (URL: https://dataspace.copernicus.eu/browser/).
Semisopochnoi (United States) — June 2023 Cite this Report
Semisopochnoi
United States
51.93°N, 179.58°E; summit elev. 1221 m
All times are local (unless otherwise noted)
Occasional explosions, ash deposits, and gas-and-steam plumes during December 2022-May 2023
Semisopochnoi is located in the western Aleutians, is 20-km-wide at sea level, and contains an 8-km-wide caldera. The three-peaked Mount Young (formerly Cerberus) was constructed within the caldera during the Holocene. Each of these peaks contains a summit crater; the lava flows on the N flank appear younger than those on the S side. The current eruption period began in early February 2021 and has more recently consisted of intermittent explosions and ash emissions (BGVN 47:12). This report updates activity during December 2022 through May 2023 using daily, weekly, and special reports from the Alaska Volcano Observatory (AVO). AVO monitors the volcano using local seismic and infrasound sensors, satellite data, web cameras, and remote infrasound and lightning networks.
Activity during most of December 2022 was relatively quiet; according to AVO no eruptive or explosive activity was observed since 7 November 2022. Intermittent tremor and occasional small earthquakes were observed in geophysical data. Continuous gas-and-steam emissions were observed from the N crater of Mount Young in webcam images on clear weather days (figure 25). On 24 December, there was a slight increase in earthquake activity and several small possible explosion signals were detected in infrasound data. Eruptive activity resumed on 27 December at the N crater of Mount Young; AVO issued a Volcano Activity Notice (VAN) that reported minor ash deposits on the flanks of Mount Young that extended as far as 1 km from the vent, according to webcam images taken during 27-28 December (figure 26). No ash plumes were observed in webcam or satellite imagery, but a persistent gas-and-steam plume that might have contained some ash rose to 1.5 km altitude. As a result, AVO raised the Aviation Color Code (ACC) to Orange (the second highest level on a four-color scale) and the Volcano Alert Level (VAL) to Watch (the second highest level on a four-level scale). Possible explosions were detected during 21 December 2022 through 1 January 2023 and seismic tremor was recorded during 30-31 December.
During January 2023 eruptive activity continued at the active N crater of Mount Young. Minor ash deposits were observed on the flanks, extending about 2 km SSW, based on webcam images from 1 and 3 January. A possible explosion occurred during 1-2 January based on elevated seismicity recorded on local seismometers and an infrasound signal recorded minutes later by an array at Adak. Though no ash plumes were observed in webcam or satellite imagery, a persistent gas-and-steam plume rose to 1.5 km altitude that might have carried minor traces of ash. Ash deposits were accompanied by periods of elevated seismicity and infrasound signals from the local geophysical network, which AVO reported were likely due to weak explosive activity. Low-level explosive activity was also detected during 2-3 January, with minor gas-and-steam emissions and a new ash deposit that was visible in webcam images. Low-level explosive activity was detected in geophysical data during 4-5 January, with elevated seismicity and infrasound signals observed on local stations. Volcanic tremor was detected during 7-9 January and very weak explosive activity was detected in seismic and infrasound data on 9 January. Weak seismic and infrasound signals were recorded on 17 January, which indicated minor explosive activity, but no ash emissions were observed in clear webcam images; a gas-and-steam plume continued to rise to 1.5 km altitude. During 29-30 January, ash deposits near the summit were observed on fresh snow, according to webcam images.
The active N cone at Mount Young continued to produce a gas-and-steam plume during February, but no ash emissions or explosive events were detected. Seismicity remained elevated with faint tremor during early February. Gas-and-steam emissions from the N crater were observed in clear webcam images on 11-13 and 16 February; no explosive activity was detected in seismic, infrasound, or satellite data. Seismicity has also decreased, with no significant seismic tremor observed since 25 January. Therefore, the ACC was lowered to Yellow (the second lowest level on a four-color scale) and the VAL was lowered to Advisory (the second lowest level on a four-color scale) on 22 February.
Gas-and-steam emissions persisted during March from the N cone of Mount Young, based on clear webcam images. A few brief episodes of weak tremor were detected in seismic data, although seismicity decreased over the month. A gas-and-steam plume detected in satellite data extended 150 km on 18 March. Low-level ash emissions from the N cone at Mount Young were observed in several webcam images during 18-19 March, in addition to small explosions and volcanic tremor. The ACC was raised to Orange and the VAL increased to Watch on 19 March. A small explosion was detected in seismic and infrasound data on 21 March.
Low-level unrest continued during April, although cloudy weather often obscured views of the summit; periods of seismic tremor and local earthquakes were recorded. During 3-4 April a gas-and-steam plume was visible traveling more than 200 km overnight; no ash was evident in the plume, according to AVO. A gas-and-steam plume was observed during 4-6 April that extended 400 km but did not seem to contain ash. Small explosions were detected in seismic and infrasound data on 5 April. Occasional clear webcam images showed continuing gas-and-steam emissions rose from Mount Young, but no ash deposits were observed on the snow. On 19 April small explosions and tremor were detected in seismic and infrasound data. A period of seismic tremor was detected during 22-25 April, with possible weak explosions on 25 April. Ash deposits were visible near the crater rim, but it was unclear if these deposits were recent or due to older deposits.
Occasional small earthquakes were recorded during May, but there were no signs of explosive activity seen in geophysical data. Gas-and-steam emissions continued from the N crater of Mount Young, based on webcam images, and seismicity remained slightly elevated. A new, light ash deposit was visible during the morning of 5 May on fresh snow on the NW flank of Mount Young. During 10 May periods of volcanic tremor were observed. The ACC was lowered to Yellow and the VAL to Advisory on 17 May due to no additional evidence of activity.
Geologic Background. Semisopochnoi, the largest subaerial volcano of the western Aleutians, is 20 km wide at sea level and contains an 8-km-wide caldera. It formed as a result of collapse of a low-angle, dominantly basaltic volcano following the eruption of a large volume of dacitic pumice. The high point of the island is Anvil Peak, a double-peaked late-Pleistocene cone that forms much of the island's northern part. The three-peaked Mount Cerberus (renamed Mount Young in 2023) was constructed within the caldera during the Holocene. Each of the peaks contains a summit crater; lava flows on the N flank appear younger than those on the south side. Other post-caldera volcanoes include the symmetrical Sugarloaf Peak SSE of the caldera and Lakeshore Cone, a small cinder cone at the edge of Fenner Lake in the NE part of the caldera. Most documented eruptions have originated from Young, although Coats (1950) considered that both Sugarloaf and Lakeshore Cone could have been recently active.
Information Contacts: Alaska Volcano Observatory (AVO), a cooperative program of a) U.S. Geological Survey, 4200 University Drive, Anchorage, AK 99508-4667 USA (URL: https://avo.alaska.edu/), b) Geophysical Institute, University of Alaska, PO Box 757320, Fairbanks, AK 99775-7320, USA, and c) Alaska Division of Geological & Geophysical Surveys, 794 University Ave., Suite 200, Fairbanks, AK 99709, USA (URL: http://dggs.alaska.gov/).
Ambae
Vanuatu
15.389°S, 167.835°E; summit elev. 1496 m
All times are local (unless otherwise noted)
New lava flow, ash plumes, and sulfur dioxide plumes during February-May 2023
Ambae, also known as Aoba, is a large basaltic shield volcano in Vanuatu. A broad pyroclastic cone containing three crater lakes (Manaro Ngoru, Voui, and Manaro Lakua) is located at the summit within the youngest of at least two nested calderas. Periodic phreatic and pyroclastic explosions have been reported since the 16th century. A large eruption more than 400 years ago resulted in a volcanic cone within the summit crater that is now filled by Lake Voui; the similarly sized Lake Manaro fills the western third of the caldera. The previous eruption ended in August 2022 that was characterized by gas-and-steam and ash emissions and explosions of wet tephra (BGVN 47:10). This report covers a new eruption during February through May 2023 that consisted of a new lava flow, ash plumes, and sulfur dioxide emissions, using information from the Vanuatu Meteorology and Geo-Hazards Department (VMGD) and satellite data.
During the reporting period, the Alert Level remained at a 2 (on a scale of 0-5), which has been in place since December 2021. Activity during October 2022 through March 2023 remained relatively low and mostly consisted of gas-and-steam emissions in Lake Voui. VMGD reported that at 1300 on 15 November a satellite image captured a strong amount of sulfur dioxide rising above the volcano (figure 99), and that seismicity slightly increased. The southern and northern part of the island reported a strong sulfur dioxide smell and heard explosions. On 20 February 2023 a gas-and-ash plume rose 1.3 km above the summit and drifted SSW, according to a webcam image (figure 100). Gas-and-steam and possibly ash emissions continued on 23 February and volcanic earthquakes were recorded by the seismic network.
During April, volcanic earthquakes and gas-and-steam and ash emissions were reported from the cone in Lake Voui. VMGD reported that activity increased during 5-7 April; high gas-and-steam and ash plumes were visible, accompanied by nighttime incandescence. According to a Wellington VAAC report, a low-level ash plume rose as high as 2.5 km above the summit and drifted W and SW on 5 April, based on satellite imagery. Reports in Saratamata stated that a dark ash plume drifted to the WSW, but no loud explosion was heard. Webcam images from 2100 showed incandescence above the crater and reflected in the clouds. According to an aerial survey, field observations, and satellite data, water was no longer present in the lake. A lava flow was reported effusing from the vent and traveling N into the dry Lake Voui, which lasted three days. The next morning at 0745 on 6 April a gas-and-steam and ash plume rose 5.4 km above the summit and drifted ESE, based on information from VMGD (figure 101). The Wellington VAAC also reported that light ashfall was observed on the island. Intermittent gas-and-steam and ash emissions were visible on 7 April, some of which rose to an estimated 3 km above the summit and drifted E. Webcam images during 0107-0730 on 7 April showed continuing ash emissions. A gas-and-steam and ash plume rose 695 m above the summit crater at 0730 on 19 April and drifted ESE, based on a webcam image (figure 102).
According to visual and infrared satellite data, water was visible in Lake Voui as late as 24 March 2023 (figure 103). The vent in the caldera showed a gas-and-steam plume drifted SE. On 3 April thermal activity was first detected, accompanied by a gas-and-ash plume that drifted W (figure 103). The lava flow moved N within the dry lake and was shown cooling by 8 April. By 23 April much of the water in the lake had returned. Occasional sulfur dioxide plumes were detected by the TROPOMI instrument on the Sentinel-5P satellite that exceeded 2 Dobson Units (DU) and drifted in different directions (figure 104).
Geologic Background. The island of Ambae, also known as Aoba, is a massive 2,500 km3 basaltic shield that is the most voluminous volcano of the New Hebrides archipelago. A pronounced NE-SW-trending rift zone with numerous scoria cones gives the 16 x 38 km island an elongated form. A broad pyroclastic cone containing three crater lakes (Manaro Ngoru, Voui, and Manaro Lakua) is located at the summit within the youngest of at least two nested calderas, the largest of which is 6 km in diameter. That large central edifice is also called Manaro Voui or Lombenben volcano. Post-caldera explosive eruptions formed the summit craters about 360 years ago. A tuff cone was constructed within Lake Voui (or Vui) about 60 years later. The latest known flank eruption, about 300 years ago, destroyed the population of the Nduindui area near the western coast.
Information Contacts: Geo-Hazards Division, Vanuatu Meteorology and Geo-Hazards Department (VMGD), Ministry of Climate Change Adaptation, Meteorology, Geo-Hazards, Energy, Environment and Disaster Management, Private Mail Bag 9054, Lini Highway, Port Vila, Vanuatu (URL: http://www.vmgd.gov.vu/, https://www.facebook.com/VanuatuGeohazardsObservatory/); Wellington Volcanic Ash Advisory Centre (VAAC), Meteorological Service of New Zealand Ltd (MetService), PO Box 722, Wellington, New Zealand (URL: http://www.metservice.com/vaac/, http://www.ssd.noaa.gov/VAAC/OTH/NZ/messages.html); MIROVA (Middle InfraRed Observation of Volcanic Activity), a collaborative project between the Universities of Turin and Florence (Italy) supported by the Centre for Volcanic Risk of the Italian Civil Protection Department (URL: http://www.mirovaweb.it/); Global Sulfur Dioxide Monitoring Page, Atmospheric Chemistry and Dynamics Laboratory, NASA Goddard Space Flight Center (NASA/GSFC), 8800 Greenbelt Road, Goddard, Maryland, USA (URL: https://so2.gsfc.nasa.gov/); Copernicus Browser, Copernicus Data Space Ecosystem, European Space Agency (URL: https://dataspace.copernicus.eu/browser/).
Ibu
Indonesia
1.488°N, 127.63°E; summit elev. 1325 m
All times are local (unless otherwise noted)
Daily ash explosions continue, along with thermal anomalies in the crater, October 2022-May 2023
Persistent eruptive activity since April 2008 at Ibu, a stratovolcano on Indonesian’s Halmahera Island, has consisted of daily explosive ash emissions and plumes, along with observations of thermal anomalies (BGVN 47:04). The current eruption continued during October 2022-May 2023, described below, based on advisories issued by the Pusat Vulkanologi dan Mitigasi Bencana Geologi (PVMBG, also known as Indonesian Center for Volcanology and Geological Hazard Mitigation, CVGHM), daily reports by MAGMA Indonesia (a PVMBG platform), and the Darwin Volcanic Ash Advisory Centre (VAAC), and various satellite data. The Alert Level during the reporting period remained at 2 (on a scale of 1-4), except raised briefly to 3 on 27 May, and the public was warned to stay at least 2 km away from the active crater and 3.5 km away on the N side of the volcano.
According to MAGMA Indonesia, during October 2022-May 2023, daily gray-and-white ash plumes of variable densities rose 200-1,000 m above the summit and drifted in multiple directions. On 30 October and 11 November, plumes rose a maximum of 2 km and 1.5 km above the summit, respectively (figures 42 and 43). According to the Darwin VAAC, discrete ash emissions on 13 November rose to 2.1 km altitude, or 800 m above the summit, and drifted W, and multiple ash emissions on 15 November rose 1.4 km above the summit and drifted NE. Occasional larger ash explosions through May 2023 prompted PVMBG to issue Volcano Observatory Notice for Aviation (VONA) alerts (table 6); the Aviation Color Code remained at Orange throughout this period.
Table 6. Volcano Observatory Notice for Aviation (VONA) ash plume alerts for Ibu issued by PVMBG during October 2022-May 2023. Maximum height above the summit was estimated by a ground observer. VONAs in January-May 2023 all described the ash plumes as dense.
| Date |
Time (local) |
Max height above summit |
Direction |
| 17 Oct 2022 |
0858 |
800 m |
SW |
| 18 Oct 2022 |
1425 |
800 m |
S |
| 19 Oct 2022 |
2017 |
600 m |
SW |
| 21 Oct 2022 |
0916 |
800 m |
NW |
| 16 Jan 2023 |
1959 |
600 m |
NE |
| 22 Jan 2023 |
0942 |
1,000 m |
E |
| 29 Jan 2023 |
2138 |
1,000 m |
E |
| 10 May 2023 |
0940 |
800 m |
NW |
| 10 May 2023 |
2035 |
600 m |
E |
| 21 May 2023 |
2021 |
600 m |
W |
| 21 May 2023 |
2140 |
1,000 m |
W |
| 29 May 2023 |
1342 |
800 m |
N |
| 31 May 2023 |
1011 |
1,000 m |
SW |
Sentinel-2 L1C satellite images throughout the reporting period show two, sometimes three persistent thermal anomalies in the summit crater, with the most prominent hotspot from the top of a cone within the crater. Clear views were more common during March-April 2023, when a vent and lava flows on the NE flank of the intra-crater cone could be distinguished (figure 44). White-to-grayish emissions were also observed during brief periods when weather clouds allowed clear views.
The MIROVA space-based volcano hotspot detection system recorded almost daily thermal anomalies throughout the reporting period, though cloud cover often interfered with detections. Data from imaging spectroradiometers aboard NASA’s Aqua and Terra satellites and processed using the MODVOLC algorithm (MODIS-MODVOLC) recorded hotspots on one day during October 2022 and December 2022, two days in April 2023, three days in November 2022 and May 2023, and four days in March 2023.
Geologic Background. The truncated summit of Gunung Ibu stratovolcano along the NW coast of Halmahera Island has large nested summit craters. The inner crater, 1 km wide and 400 m deep, has contained several small crater lakes. The 1.2-km-wide outer crater is breached on the N, creating a steep-walled valley. A large cone grew ENE of the summit, and a smaller one to the WSW has fed a lava flow down the W flank. A group of maars is located below the N and W flanks. The first observed and recorded eruption was a small explosion from the summit crater in 1911. Eruptive activity began again in December 1998, producing a lava dome that eventually covered much of the floor of the inner summit crater along with ongoing explosive ash emissions.
Information Contacts: Pusat Vulkanologi dan Mitigasi Bencana Geologi (PVMBG, also known as Indonesian Center for Volcanology and Geological Hazard Mitigation, CVGHM), Jalan Diponegoro 57, Bandung 40122, Indonesia (URL: http://www.vsi.esdm.go.id/); MAGMA Indonesia (Multiplatform Application for Geohazard Mitigation and Assessment in Indonesia), Kementerian Energi dan Sumber Daya Mineral (URL: https://magma.esdm.go.id/v1); Copernicus Browser, Copernicus Data Space Ecosystem, European Space Agency (URL: https://dataspace.copernicus.eu/browser/); MIROVA (Middle InfraRed Observation of Volcanic Activity), a collaborative project between the Universities of Turin and Florence (Italy) supported by the Centre for Volcanic Risk of the Italian Civil Protection Department (URL: http://www.mirovaweb.it/); Hawai'i Institute of Geophysics and Planetology (HIGP) - MODVOLC Thermal Alerts System, School of Ocean and Earth Science and Technology (SOEST), Univ. of Hawai'i, 2525 Correa Road, Honolulu, HI 96822, USA (URL: http://modis.higp.hawaii.edu/).
Dukono
Indonesia
1.6992°N, 127.8783°E; summit elev. 1273 m
All times are local (unless otherwise noted)
Continuing ash emissions, SO2 plumes, and thermal signals during October 2022-May 2023
Dukono, a remote volcano on Indonesia’s Halmahera Island, has been erupting continuously since 1933, with frequent ash explosions and sulfur dioxide plumes (BGVN 46:11, 47:10). This activity continued during October 2022 through May 2023, based on reports from the Pusat Vulkanologi dan Mitigasi Bencana Geologi (PVMBG; also known as Indonesian Center for Volcanology and Geological Hazard Mitigation, CVGHM), the Darwin Volcanic Ash Advisory Centre (VAAC), and satellite data. During this period, the Alert Level remained at 2 (on a scale of 1-4) and the public was warned to remain outside of the 2-km exclusion zone. The highest reported plume of the period reached 9.4 km above the summit on 14 November 2022.
According to MAGMA Indonesia (a platform developed by PVMBG), white, gray, or dark plumes of variable densities were observed almost every day during the reporting period, except when fog obscured the volcano (figure 33). Plumes generally rose 25-450 m above the summit, but rose as high as 700-800 m on several days, somewhat lower than the maximum heights reached earlier in 2022 when plumes reached as high as 1 km. However, the Darwin VAAC reported that on 14 November 2022, a discrete ash plume rose 9.4 km above the summit (10.7 km altitude), accompanied by a strong hotspot and a sulfur dioxide signal observed in satellite imagery; a continuous ash plume that day and through the 15th rose to 2.1-2.4 km altitude and drifted NE.
Sentinel-2 images were obscured by weather clouds almost every viewing day during the reporting period. However, the few reasonably clear images showed a hotspot and white or gray emissions and plumes. Strong SO2 plumes from Dukono were present on many days during October 2022-May 2023, as detected using the TROPOMI instrument on the Sentinel-5P satellite (figure 34).
Geologic Background. Reports from this remote volcano in northernmost Halmahera are rare, but Dukono has been one of Indonesia's most active volcanoes. More-or-less continuous explosive eruptions, sometimes accompanied by lava flows, have occurred since 1933. During a major eruption in 1550 CE, a lava flow filled in the strait between Halmahera and the N-flank Gunung Mamuya cone. This complex volcano presents a broad, low profile with multiple summit peaks and overlapping craters. Malupang Wariang, 1 km SW of the summit crater complex, contains a 700 x 570 m crater that has also been active during historical time.
Information Contacts: Pusat Vulkanologi dan Mitigasi Bencana Geologi (PVMBG, also known as Indonesian Center for Volcanology and Geological Hazard Mitigation, CVGHM), Jalan Diponegoro 57, Bandung 40122, Indonesia (URL: http://www.vsi.esdm.go.id/); MAGMA Indonesia (Multiplatform Application for Geohazard Mitigation and Assessment in Indonesia), Kementerian Energi dan Sumber Daya Mineral (URL: https://magma.esdm.go.id/v1); Darwin Volcanic Ash Advisory Centre (VAAC), Bureau of Meteorology, Northern Territory Regional Office, PO Box 40050, Casuarina, NT 0811, Australia (URL: http://www.bom.gov.au/info/vaac/); NASA Global Sulfur Dioxide Monitoring Page, Atmospheric Chemistry and Dynamics Laboratory, NASA Goddard Space Flight Center (NASA/GSFC), 8800 Greenbelt Road, Goddard, Maryland, USA (URL: https://so2.gsfc.nasa.gov/); Sentinel Hub Playground (URL: https://www.sentinel-hub.com/explore/sentinel-playground).
Sabancaya
Peru
15.787°S, 71.857°W; summit elev. 5960 m
All times are local (unless otherwise noted)
Explosions, gas-and-ash plumes, and thermal activity persist during November 2022-April 2023
Sabancaya is located in Peru, NE of Ampato and SE of Hualca Hualca. Eruptions date back to 1750 and have been characterized by explosions, phreatic activity, ash plumes, and ashfall. The current eruption period began in November 2016 and has more recently consisted of daily explosions, gas-and-ash plumes, and thermal activity (BGVN 47:11). This report updates activity during November 2022 through April 2023 using information from Instituto Geophysico del Peru (IGP) that use weekly activity reports and various satellite data.
Intermittent low-to-moderate power thermal anomalies were reported by the MIROVA project during November 2022 through April 2023 (figure 119). There were few short gaps in thermal activity during mid-December 2022, late December-to-early January 2023, late January to mid-February, and late February. According to data recorded by the MODVOLC thermal algorithm, there were a total of eight thermal hotspots: three in November 2022, three in February 2023, one in March, and one in April. On clear weather days, some of this thermal anomaly was visible in infrared satellite imagery showing the active lava dome in the summit crater (figure 120). Almost daily moderate-to-strong sulfur dioxide plumes were recorded during the reporting period by the TROPOMI instrument on the Sentinel-5P satellite (figure 121). Many of these plumes exceeded 2 Dobson Units (DU) and drifted in multiple directions.
IGP reported that moderate activity during November and December 2022 continued; during November, an average number of explosions were reported each week: 30, 33, 36, and 35, and during December, it was 32, 40, 47, 52, and 67. Gas-and-ash plumes in November rose 3-3.5 km above the summit and drifted E, NE, SE, S, N, W, and SW. During December the gas-and-ash plumes rose 2-4 km above the summit and drifted in different directions. There were 1,259 volcanic earthquakes recorded during November and 1,693 during December. Seismicity also included volcano-tectonic-type events that indicate rock fracturing events. Slight inflation was observed in the N part of the volcano near Hualca Hualca (4 km N). Thermal activity was frequently reported in the crater at the active lava dome (figure 120).
Explosive activity continued during January and February 2023. The average number of explosions were reported each week during January (51, 50, 60, and 59) and February (43, 54, 51, and 50). Gas-and-ash plumes rose 1.6-2.9 km above the summit and drifted NW, SW, and W during January and rose 1.4-2.8 above the summit and drifted W, SW, E, SE, N, S, NW, and NE during February. IGP also detected 1,881 volcanic earthquakes during January and 1,661 during February. VT-type earthquakes were also reported. Minor inflation persisted near Hualca Hualca. Satellite imagery showed continuous thermal activity in the crater at the lava dome (figure 120).
During March, the average number of explosions each week was 46, 48, 31, 35, and 22 and during April, it was 29, 41, 31, and 27. Accompanying gas-and-ash plumes rose 1.7-2.6 km above the summit crater and drifted W, SW, NW, S, and SE during March. According to a Buenos Aires Volcano Ash Advisory Center (VAAC) notice, on 22 March at 1800 through 23 March an ash plume rose to 7 km altitude and drifted NW. By 0430 an ash plume rose to 7.6 km altitude and drifted W. On 24 and 26 March continuous ash emissions rose to 7.3 km altitude and drifted SW and on 28 March ash emissions rose to 7.6 km altitude. During April, gas-and-ash plumes rose 1.6-2.5 km above the summit and drifted W, SW, S, NW, NE, and E. Frequent volcanic earthquakes were recorded, with 1,828 in March and 1,077 in April, in addition to VT-type events. Thermal activity continued to be reported in the summit crater at the lava dome (figure 120).
Geologic Background. Sabancaya, located in the saddle NE of Ampato and SE of Hualca Hualca volcanoes, is the youngest of these volcanic centers and the only one to have erupted in historical time. The oldest of the three, Nevado Hualca Hualca, is of probable late-Pliocene to early Pleistocene age. The name Sabancaya (meaning "tongue of fire" in the Quechua language) first appeared in records in 1595 CE, suggesting activity prior to that date. Holocene activity has consisted of Plinian eruptions followed by emission of voluminous andesitic and dacitic lava flows, which form an extensive apron around the volcano on all sides but the south. Records of historical eruptions date back to 1750.
Information Contacts: Instituto Geofisico del Peru (IGP), Centro Vulcanológico Nacional (CENVUL), Calle Badajoz N° 169 Urb. Mayorazgo IV Etapa, Ate, Lima 15012, Perú (URL: https://www.igp.gob.pe/servicios/centro-vulcanologico-nacional/inicio); Buenos Aires Volcanic Ash Advisory Center (VAAC), Servicio Meteorológico Nacional-Fuerza Aérea Argentina, 25 de mayo 658, Buenos Aires, Argentina (URL: http://www.smn.gov.ar/vaac/buenosaires/inicio.php); MIROVA (Middle InfraRed Observation of Volcanic Activity), a collaborative project between the Universities of Turin and Florence (Italy) supported by the Centre for Volcanic Risk of the Italian Civil Protection Department (URL: http://www.mirovaweb.it/); Hawai'i Institute of Geophysics and Planetology (HIGP) - MODVOLC Thermal Alerts System, School of Ocean and Earth Science and Technology (SOEST), Univ. of Hawai'i, 2525 Correa Road, Honolulu, HI 96822, USA (URL: http://modis.higp.hawaii.edu/); NASA Global Sulfur Dioxide Monitoring Page, Atmospheric Chemistry and Dynamics Laboratory, NASA Goddard Space Flight Center (NASA/GSFC), 8800 Greenbelt Road, Goddard MD 20771, USA (URL: https://so2.gsfc.nasa.gov/); Copernicus Browser, Copernicus Data Space Ecosystem, European Space Agency (URL: https://dataspace.copernicus.eu/browser/).
Sheveluch
Russia
56.653°N, 161.36°E; summit elev. 3283 m
All times are local (unless otherwise noted)
Significant explosions destroyed part of the lava-dome complex during April 2023
Sheveluch (also spelled Shiveluch) in Kamchatka, has had at least 60 large eruptions during the last 10,000 years. The summit is truncated by a broad 9-km-wide caldera that is breached to the S, and many lava domes occur on the outer flanks. The lava dome complex was constructed within the large open caldera. Frequent collapses of the dome complex have produced debris avalanches; the resulting deposits cover much of the caldera floor. A major south-flank collapse during a 1964 Plinian explosion produced a scarp in which a “Young Sheveluch” dome began to form in 1980. Repeated episodes of dome formation and destruction since then have produced major and minor ash plumes, pyroclastic flows, block-and-ash flows, and “whaleback domes” of spine-like extrusions in 1993 and 2020 (BGVN 45:11). The current eruption period began in August 1999 and has more recently consisted of lava dome growth, explosions, ash plumes, and avalanches (BGVN 48:01). This report covers a significant explosive eruption during early-to-mid-April 2023 that generated a 20 km altitude ash plume, produced a strong sulfur dioxide plume, and destroyed part of the lava-dome complex; activity described during January through April 2023 use information primarily from the Kamchatka Volcanic Eruptions Response Team (KVERT) and various satellite data.
Satellite data. Activity during the majority of this reporting period was characterized by continued lava dome growth, strong fumarole activity, explosions, and hot avalanches. According to the MODVOLC Thermal Alerts System, 140 hotspots were detected through the reporting period, with 33 recorded in January 2023, 29 in February, 44 in March, and 34 in April. Frequent strong thermal activity was recorded during January 2023 through April, according to the MIROVA (Middle InfraRed Observation of Volcanic Activity) graph and resulted from the continuously growing lava dome (figure 94). A slightly stronger pulse in thermal activity was detected in early-to-mid-April, which represented the significant eruption that destroyed part of the lava-dome complex. Thermal anomalies were also visible in infrared satellite imagery at the summit crater (figure 95).
During January 2023 KVERT reported continued growth of the lava dome, accompanied by strong fumarolic activity, incandescence from the lava dome, explosions, ash plumes, and avalanches. Satellite data showed a daily thermal anomaly over the volcano. Video data showed ash plumes associated with collapses at the dome that generated avalanches that in turn produced ash plumes rising to 3.5 km altitude and drifting 40 km W on 4 January and rising to 7-7.5 km altitude and drifting 15 km SW on 5 January. A gas-and-steam plume containing some ash that was associated with avalanches rose to 5-6 km altitude and extended 52-92 km W on 7 January. Explosions that same day produced ash plumes that rose to 7-7.5 km altitude and drifted 10 km W. According to a Volcano Observatory Notice for Aviation (VONA) issued at 1344 on 19 January, explosions produced an ash cloud that was 15 x 25 km in size and rose to 9.6-10 km altitude, drifting 21-25 km W; as a result, the Aviation Color Code (ACC) was raised to Red (the highest level on a four-color scale). Another VONA issued at 1635 reported that no more ash plumes were observed, and the ACC was lowered to Orange (the second highest level on a four-color scale). On 22 January an ash plume from collapses and avalanches rose to 5 km altitude and drifted 25 km NE and SW; ash plumes associated with collapses extended 70 km NE on 27 and 31 January.
Lava dome growth, fumarolic activity, dome incandescence, and occasional explosions and avalanches continued during February and March. A daily thermal anomaly was visible in satellite data. Explosions on 1 February generated ash plumes that rose to 6.3-6.5 km altitude and extended 15 km NE. Video data showed an ash cloud from avalanches rising to 5.5 km altitude and drifting 5 km SE on 2 February. Satellite data showed gas-and-steam plumes containing some ash rose to 5-5.5 km altitude and drifted 68-110 km ENE and NE on 6 February, to 4.5-5 km altitude and drifted 35 km WNW on 22 February, and to 3.7-4 km altitude and drifted 47 km NE on 28 February. Scientists from the Kamchatka Volcanological Station (KVS) went on a field excursion on 25 February to document the growing lava dome, and although it was cloudy most of the day, nighttime incandescence was visible. Satellite data showed an ash plume extending up to 118 km E during 4-5 March. Video data from 1150 showed an ash cloud from avalanches rose to 3.7-5.5 km altitude and drifted 5-10 km ENE and E on 5 March. On 11 March an ash plume drifted 62 km E. On 27 March ash plumes rose to 3.5 km altitude and drifted 100 km E. Avalanches and constant incandescence at the lava dome was focused on the E and NE slopes on 28 March. A gas-and-steam plume containing some ash rose to 3.5 km altitude and moved 40 km E on 29 March. Ash plumes on 30 March rose to 3.5-3.7 km altitude and drifted 70 km NE.
Similar activity continued during April, with lava dome growth, strong fumarolic activity, incandescence in the dome, occasional explosions, and avalanches. A thermal anomaly persisted throughout the month. During 1-4 April weak ash plumes rose to 2.5-3 km altitude and extended 13-65 km SE and E.
Activity during 11 April 2023. The Institute of Volcanology and Seismology, Far Eastern Branch, Russian Academy of Sciences (IVS FEB RAS) reported a significant increase in seismicity around 0054 on 11 April, as reported by strong explosions detected on 11 April beginning at 0110 that sent ash plumes up to 7-10 km altitude and extended 100-435 km W, WNW, NNW, WSW, and SW. According to a Tokyo VAAC report the ash plume rose to 15.8 km altitude. By 0158 the plume extended over a 75 x 100 km area. According to an IVS FEB RAS report, the eruptive column was not vertical: the initial plume at 0120 on 11 April deviated to the NNE, at 0000 on 12 April, it drifted NW, and by 1900 it drifted SW. KVS reported that significant pulses of activity occurred at around 0200, 0320, and then a stronger phase around 0600. Levin Dmitry took a video from near Békés (3 km away) at around 0600 showing a rising plume; he also reported that a pyroclastic flow traveled across the road behind him as he left the area. According to IVS FEB RAS, the pyroclastic flow traveled several kilometers SSE, stopping a few hundred meters from a bridge on the road between Klyuchi and Petropavlovsk-Kamchatsky.
Ashfall was first observed in Klyuchi (45 km SW) at 0630, and a large, black ash plume blocked light by 0700. At 0729 KVERT issued a Volcano Observatory Notice for Aviation (VONA) raising the Aviation Color Code to Red (the highest level on a four-color scale). It also stated that a large ash plume had risen to 10 km altitude and drifted 100 km W. Near-constant lightning strikes were reported in the plume and sounds like thunderclaps were heard until about 1000. According to IVS FEB RAS the cloud was 200 km long and 76 km wide by 0830, and was spreading W at altitudes of 6-12 km. In the Klyuchi Village, the layer of both ash and snow reached 8.5 cm (figure 96); ashfall was also reported in Kozyrevsk (112 km SW) at 0930, Mayskoye, Anavgay, Atlasovo, Lazo, and Esso. Residents in Klyuchi reported continued darkness and ashfall at 1100. In some areas, ashfall was 6 cm deep and some residents reported dirty water coming from their plumbing. According to IVS FEB RAS, an ash cloud at 1150 rose to 5-20 km altitude and was 400 km long and 250 km wide, extending W. A VONA issued at 1155 reported that ash had risen to 10 km and drifted 340 km NNW and 240 km WSW. According to Simon Carn (Michigan Technological University), about 0.2 Tg of sulfur dioxide in the plume was measured in a satellite image from the TROPOMI instrument on the Sentinel-5P satellite acquired at 1343 that covered an area of about 189,000 km2 (figure 97). Satellite data at 1748 showed an ash plume that rose to 8 km altitude and drifted 430 km WSW and S, according to a VONA.
Activity during 12-15 April 2023. On 12 April at 0730 satellite images showed ash plumes rose to 7-8 km altitude and extended 600 km SW, 1,050 km ESE, and 1,300-3,000 km E. By 1710 that day, the explosions weakened. According to news sources, the ash-and-gas plumes drifted E toward the Aleutian Islands and reached the Gulf of Alaska by 13 April, causing flight disruptions. More than 100 flights involving Alaska airspace were cancelled due to the plume. Satellite data showed ash plumes rising to 4-5.5 km altitude and drifted 400-415 km SE and ESE on 13 April. KVS volcanologists observed the pyroclastic flow deposits and noted that steam rose from downed, smoldering trees. They also noted that the deposits were thin with very few large fragments, which differed from previous flows. The ash clouds traveled across the Pacific Ocean. Flight cancellations were also reported in NW Canada (British Columbia) during 13-14 April. During 14-15 April ash plumes rose to 6 km altitude and drifted 700 km NW.
Alaskan flight schedules were mostly back to normal by 15 April, with only minor delays and far less cancellations; a few cancellations continued to be reported in Canada. Clear weather on 15 April showed that most of the previous lava-dome complex was gone and a new crater roughly 1 km in diameter was observed (figure 98); gas-and-steam emissions were rising from this crater. Evidence suggested that there had been a directed blast to the SE, and pyroclastic flows traveled more than 20 km. An ash plume rose to 4.5-5.2 km altitude and drifted 93-870 km NW on 15 April.
Activity during 16-30 April 2023. Resuspended ash was lifted by the wind from the slopes and rose to 4 km altitude and drifted 224 km NW on 17 April. KVERT reported a plume of resuspended ash from the activity during 10-13 April on 19 April that rose to 3.5-4 km altitude and drifted 146-204 km WNW. During 21-22 April a plume stretched over the Scandinavian Peninsula. A gas-and-steam plume containing some ash rose to 3-3.5 km altitude and drifted 60 km SE on 30 April. A possible new lava dome was visible on the W slope of the volcano on 29-30 April (figure 99); satellite data showed two thermal anomalies, a bright one over the existing lava dome and a weaker one over the possible new one.
References. Girina, O., Loupian, E., Horvath, A., Melnikov, D., Manevich, A., Nuzhdaev, A., Bril, A., Ozerov, A., Kramareva, L., Sorokin, A., 2023, Analysis of the development of the paroxysmal eruption of Sheveluch volcano on April 10–13, 2023, based on data from various satellite systems, ??????????? ???????? ??? ?? ???????, 20(2).
Geologic Background. The high, isolated massif of Sheveluch volcano (also spelled Shiveluch) rises above the lowlands NNE of the Kliuchevskaya volcano group. The 1,300 km3 andesitic volcano is one of Kamchatka's largest and most active volcanic structures, with at least 60 large eruptions during the Holocene. The summit of roughly 65,000-year-old Stary Shiveluch is truncated by a broad 9-km-wide late-Pleistocene caldera breached to the south. Many lava domes occur on its outer flanks. The Molodoy Shiveluch lava dome complex was constructed during the Holocene within the large open caldera; Holocene lava dome extrusion also took place on the flanks of Stary Shiveluch. Widespread tephra layers from these eruptions have provided valuable time markers for dating volcanic events in Kamchatka. Frequent collapses of dome complexes, most recently in 1964, have produced debris avalanches whose deposits cover much of the floor of the breached caldera.
Information Contacts: Kamchatka Volcanic Eruptions Response Team (KVERT), Far Eastern Branch, Russian Academy of Sciences, 9 Piip Blvd., Petropavlovsk-Kamchatsky, 683006, Russia (URL: http://www.kscnet.ru/ivs/kvert/); Institute of Volcanology and Seismology, Far Eastern Branch, Russian Academy of Sciences (IVS FEB RAS), 9 Piip Blvd., Petropavlovsk-Kamchatsky 683006, Russia (URL: http://www.kscnet.ru/ivs/eng/); Kamchatka Volcanological Station, Kamchatka Branch of Geophysical Survey, (KB GS RAS), Klyuchi, Kamchatka Krai, Russia (URL: http://volkstat.ru/); Hawai'i Institute of Geophysics and Planetology (HIGP) - MODVOLC Thermal Alerts System, School of Ocean and Earth Science and Technology (SOEST), Univ. of Hawai'i, 2525 Correa Road, Honolulu, HI 96822, USA (URL: http://modis.higp.hawaii.edu/); MIROVA (Middle InfraRed Observation of Volcanic Activity), a collaborative project between the Universities of Turin and Florence (Italy) supported by the Centre for Volcanic Risk of the Italian Civil Protection Department (URL: http://www.mirovaweb.it/); Copernicus Browser, Copernicus Data Space Ecosystem, European Space Agency (URL: https://dataspace.copernicus.eu/browser/); Kam 24 News Agency, 683032, Kamchatka Territory, Petropavlovsk-Kamchatsky, Vysotnaya St., 2A (URL: https://kam24.ru/news/main/20230411/96657.html#.Cj5Jrky6.dpuf); Simon Carn, Geological and Mining Engineering and Sciences, Michigan Technological University, 1400 Townsend Drive, Houghton, MI 49931, USA (URL: http://www.volcarno.com/, Twitter: @simoncarn).
Bezymianny
Russia
55.972°N, 160.595°E; summit elev. 2882 m
All times are local (unless otherwise noted)
Explosions, ash plumes, lava flows, and avalanches during November 2022-April 2023
Bezymianny is located on the Kamchatka Peninsula of Russia as part of the Klyuchevskoy volcano group. Historic eruptions began in 1955 and have been characterized by dome growth, explosions, pyroclastic flows, ash plumes, and ashfall. During the 1955-56 eruption a large open crater was formed by collapse of the summit and an associated lateral blast. Subsequent episodic but ongoing lava-dome growth, accompanied by intermittent explosive activity and pyroclastic flows, has largely filled the 1956 crater. The current eruption period began in December 2016 and more recent activity has consisted of strong explosions, ash plumes, and thermal activity (BGVN 47:11). This report covers activity during November 2022 through April 2023, based on weekly and daily reports from the Kamchatka Volcano Eruptions Response Team (KVERT) and satellite data.
Activity during November and March 2023 was relatively low and mostly consisted of gas-and-steam emissions, occasional small collapses that generated avalanches along the lava dome slopes, and a persistent thermal anomaly over the volcano that was observed in satellite data on clear weather days. According to the Tokyo VAAC and KVERT, an explosion produced an ash plume that rose to 6 km altitude and drifted 25 km NE at 1825 on 29 March.
Gas-and-steam emissions, collapses generating avalanches, and thermal activity continued during April. According to two Volcano Observatory Notice for Aviation (VONA) issued on 2 and 6 April (local time) ash plumes rose to 3 km and 3.5-3.8 km altitude and drifted 35 km E and 140 km E, respectively. Satellite data from KVERT showed weak ash plumes extending up to 550 km E on 2 and 5-6 April.
A VONA issued at 0843 on 7 April described an ash plume that rose to 4.5-5 km altitude and drifted 250 km ESE. Later that day at 1326 satellite data showed an ash plume that rose to 5.5-6 km altitude and drifted 150 km ESE. A satellite image from 1600 showed an ash plume extending as far as 230 km ESE; KVERT noted that ash emissions were intensifying, likely due to avalanches from the growing lava dome. The Aviation Color Code (ACC) was raised to Red (the highest level on a four-color scale). At 1520 satellite data showed an ash plume rising to 5-5.5 km altitude and drifting 230 km ESE. That same day, Kamchatka Volcanological Station (KVS) volcanologists traveled to Ambon to collect ash; they reported that a notable eruption began at 1730, and within 20 minutes a large ash plume rose to 10 km altitude and drifted NW. KVERT reported that the strong explosive phase began at 1738. Video and satellite data taken at 1738 showed an ash plume that rose to 10-12 km altitude and drifted up to 2,800 km SE and E. Explosions were clearly audible 20 km away for 90 minutes, according to KVS. Significant amounts of ash fell at the Apakhonchich station, which turned the snow gray; ash continued to fall until the morning of 8 April. In a VONA issued at 0906 on 8 April, KVERT stated that the explosive eruption had ended; ash plumes had drifted 2,000 km E. The ACC was lowered to Orange (the third highest level on a four-color scale). The KVS team saw a lava flow on the active dome once the conditions were clear that same day (figure 53). On 20 April lava dome extrusion was reported; lava flows were noted on the flanks of the dome, and according to KVERT satellite data, a thermal anomaly was observed in the area. The ACC was lowered to Yellow (the second lowest on a four-color scale).
Satellite data showed an increase in thermal activity beginning in early April 2023. A total of 31 thermal hotspots were detected by the MODVOLC thermal algorithm on 4, 5, 7, and 12 April 2023. The elevated thermal activity resulted from an increase in explosive activity and the start of an active lava flow. The MIROVA (Middle InfraRed Observation of Volcanic Activity) volcano hotspot detection system based on the analysis of MODIS data also showed a pulse in thermal activity during the same time (figure 54). Infrared satellite imagery captured a continuous thermal anomaly at the summit crater, often accompanied by white gas-and-steam emissions (figure 55). On 4 April 2023 an active lava flow was observed descending the SE flank.
Geologic Background. The modern Bezymianny, much smaller than its massive neighbors Kamen and Kliuchevskoi on the Kamchatka Peninsula, was formed about 4,700 years ago over a late-Pleistocene lava-dome complex and an edifice built about 11,000-7,000 years ago. Three periods of intensified activity have occurred during the past 3,000 years. The latest period, which was preceded by a 1,000-year quiescence, began with the dramatic 1955-56 eruption. This eruption, similar to that of St. Helens in 1980, produced a large open crater that was formed by collapse of the summit and an associated lateral blast. Subsequent episodic but ongoing lava-dome growth, accompanied by intermittent explosive activity and pyroclastic flows, has largely filled the 1956 crater.
Information Contacts: Kamchatka Volcanic Eruptions Response Team (KVERT), Far Eastern Branch, Russian Academy of Sciences, 9 Piip Blvd., Petropavlovsk-Kamchatsky, 683006, Russia (URL: http://www.kscnet.ru/ivs/kvert/); Kamchatka Volcanological Station, Kamchatka Branch of Geophysical Survey, (KB GS RAS), Klyuchi, Kamchatka Krai, Russia (URL: http://volkstat.ru/); Hawai'i Institute of Geophysics and Planetology (HIGP) - MODVOLC Thermal Alerts System, School of Ocean and Earth Science and Technology (SOEST), Univ. of Hawai'i, 2525 Correa Road, Honolulu, HI 96822, USA (URL: http://modis.higp.hawaii.edu/); MIROVA (Middle InfraRed Observation of Volcanic Activity), a collaborative project between the Universities of Turin and Florence (Italy) supported by the Centre for Volcanic Risk of the Italian Civil Protection Department (URL: http://www.mirovaweb.it/); Copernicus Browser, Copernicus Data Space Ecosystem, European Space Agency (URL: https://dataspace.copernicus.eu/browser/).
Chikurachki
Russia
50.324°N, 155.461°E; summit elev. 1781 m
All times are local (unless otherwise noted)
New explosive eruption during late January-early February 2023
Chikurachki, located on Paramushir Island in the northern Kuriles, has had Plinian eruptions during the Holocene. Lava flows have reached the sea and formed capes on the NW coast; several young lava flows are also present on the E flank beneath a scoria deposit. Reported eruptions date back to 1690, with the most recent eruption period occurring during January through October 2022, characterized by occasional explosions, ash plumes, and thermal activity (BGVN 47:11). This report covers a new eruptive period during January through February 2023 that consisted of ash explosions and ash plumes, based on information from the Kamchatka Volcanic Eruptions Response Team (KVERT) and satellite data.
According to reports from KVERT, an explosive eruption began around 0630 on 29 January. Explosions generated ash plumes that rose to 3-3.5 km altitude and drifted 6-75 km SE and E, based on satellite data. As a result, the Aviation Color Code (ACC) was raised to Orange (the second highest level on a four-color scale). At 1406 and 1720 ash plumes were identified in satellite images that rose to 4.3 km altitude and extended 70 km E. By 2320 the ash plume had dissipated. A thermal anomaly was visible at the volcano on 31 January, according to a satellite image, and an ash plume was observed drifting 66 km NE.
Occasional explosions and ash plumes continued during early February. At 0850 on 1 February an ash plume rose to 3.5 km altitude and drifted 35 km NE. Satellite data showed an ash plume that rose to 3.2-3.5 km altitude and drifted 50 km NE at 1222 later that day (figure 22). A thermal anomaly was detected over the volcano during 5-6 February and ash plumes drifted as far as 125 km SE, E, and NE. Explosive events were reported at 0330 on 6 February that produced ash plumes rising to 4-4.5 km altitude and drifting 72-90 km N, NE, and ENE. KVERT noted that the last gas-and steam plume that contained some ash was observed on 8 February and drifted 55 km NE before the explosive eruption ended. The ACC was lowered to Yellow and then Green (the lowest level on a four-color scale) on 18 February.
Geologic Background. Chikurachki, the highest volcano on Paramushir Island in the northern Kuriles, is a relatively small cone constructed on a high Pleistocene edifice. Oxidized basaltic-to-andesitic scoria deposits covering the upper part of the young cone give it a distinctive red color. Frequent basaltic Plinian eruptions have occurred during the Holocene. Lava flows have reached the sea and formed capes on the NW coast; several young lava flows are also present on the E flank beneath a scoria deposit. The Tatarinov group of six volcanic centers is located immediately to the south, and the Lomonosov cinder cone group, the source of an early Holocene lava flow that reached the saddle between it and Fuss Peak to the west, lies at the southern end of the N-S-trending Chikurachki-Tatarinov complex. In contrast to the frequently active Chikurachki, the Tatarinov centers are extensively modified by erosion and have a more complex structure. Tephrochronology gives evidence of an eruption around 1690 CE from Tatarinov, although its southern cone contains a sulfur-encrusted crater with fumaroles that were active along the margin of a crater lake until 1959.
Information Contacts: Kamchatka Volcanic Eruptions Response Team (KVERT), Far East Division, Russian Academy of Sciences, 9 Piip Blvd., Petropavlovsk-Kamchatsky, 683006, Russia (URL: http://www.kscnet.ru/ivs/); Copernicus Browser, Copernicus Data Space Ecosystem, European Space Agency (URL: https://dataspace.copernicus.eu/browser/).
Search Bulletin Archive by Publication Date
Select a month and year from the drop-downs and click "Show Issue" to have that issue displayed in this tab.
The default month and year is the latest issue available.
Bulletin of the Global Volcanism Network - Volume 25, Number 06 (June 2000)
Managing Editor: Richard Wunderman
Cameroon (Cameroon)
Explosive eruptions and a lava flow from two vents starting on 29 May
Colima (Mexico)
Low seismicity August 1999-May 2000; frequent explosions and evacuations
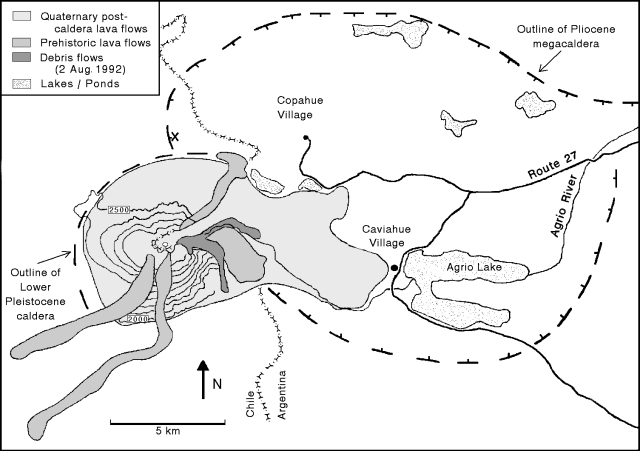
Copahue (Chile-Argentina)
Frequent ash explosions and acidic mudflows starting on 1 July
Etna (Italy)
Frequent Strombolian eruptions and high gas emissions March-June 2000
Guagua Pichincha (Ecuador)
Minor ash eruptions; partial collapse of January 2000 dome on 12 July
Hekla (Iceland)
Clarification of NASA airborne plume experiments on 29 February 2000
Irazu (Costa Rica)
Feeble microseismicity continues into early 2000
Kilauea (United States)
During May-July 2000, continued frequent surface flows and earthquakes
Lascar (Chile)
Ash eruption on 20-21 July
Miyakejima (Japan)
Magma intrusion within W flank and explosive eruption on 7 July
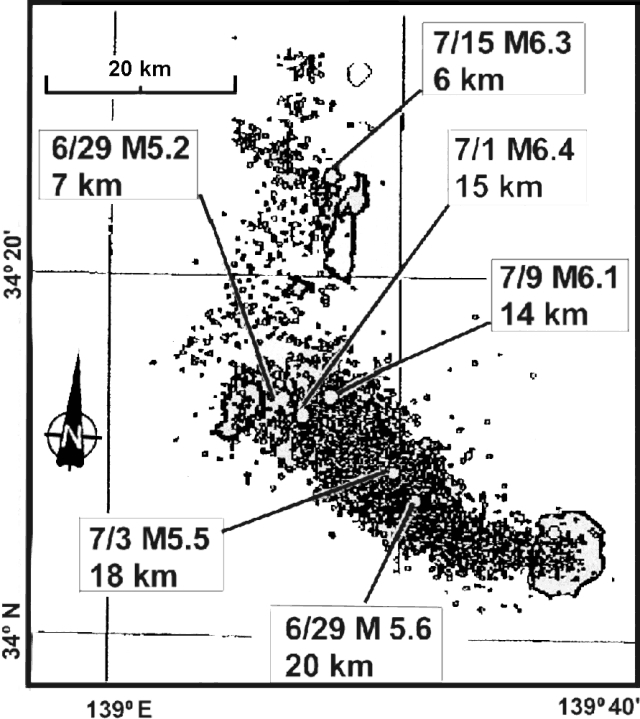
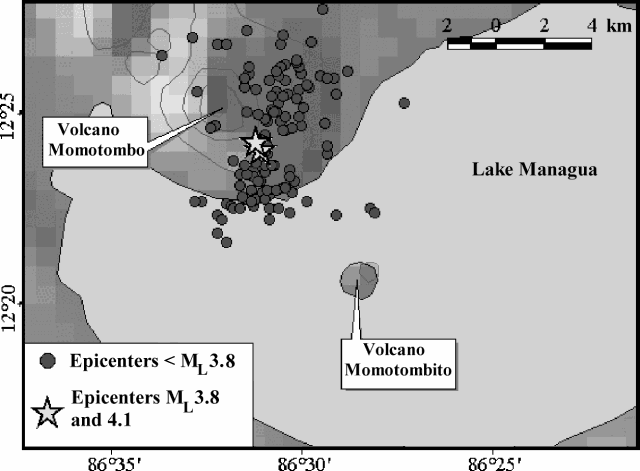
Momotombo (Nicaragua)
Increased seismic activity in June
Santa Maria (Guatemala)
January 2000 lava flow goes 2.5 km down S flank
Sheveluch (Russia)
Short-lived explosive eruptions 30 June-3 July
Soputan (Indonesia)
During May-July 2000, continued dome growth, lava flows, and several explosions
Soufriere Hills (United Kingdom)
Dome growth continues, reaches 950 m high during May-July 2000
Toya (Japan)
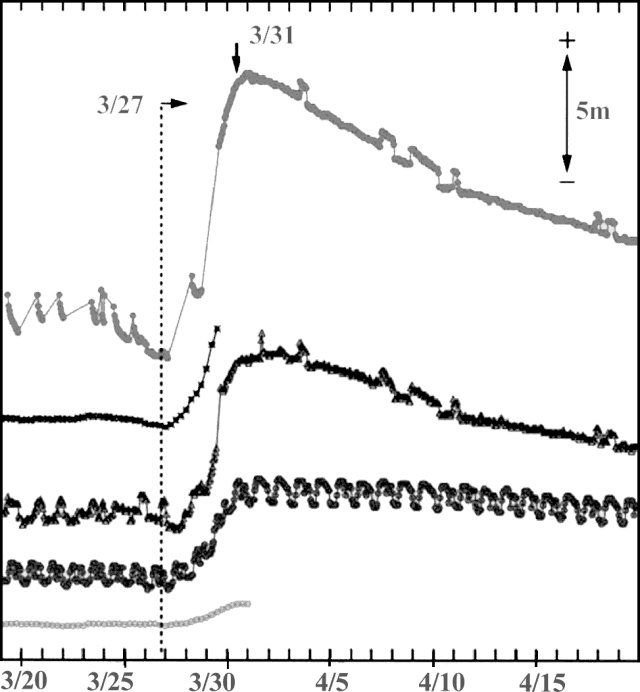
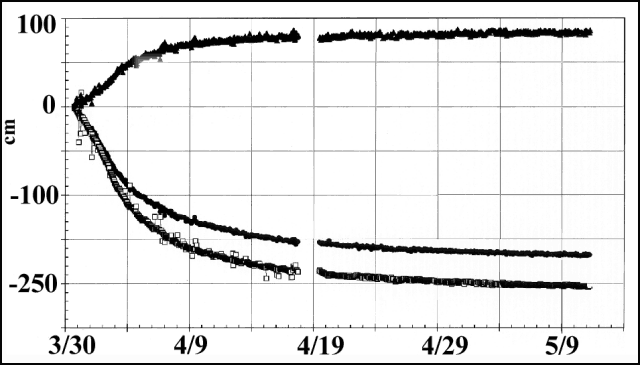
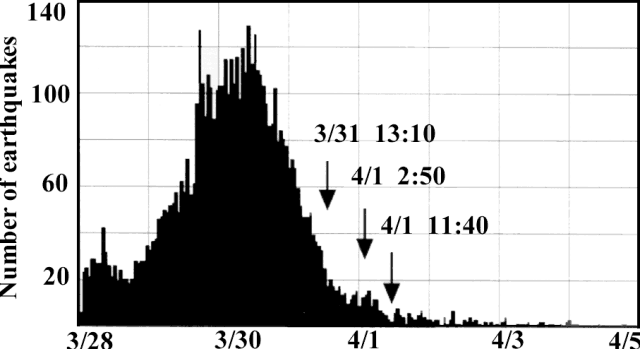
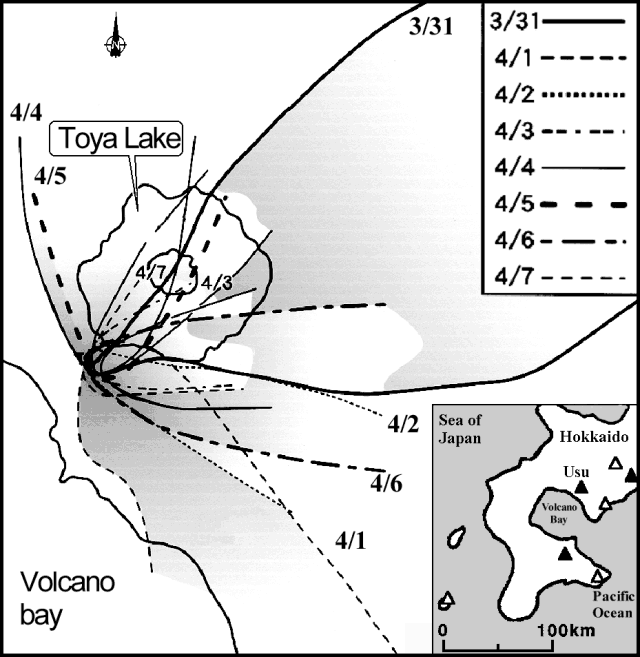
Eruption decreasing in intensity; precursors to 31 March eruption
Cameroon
Cameroon
4.203°N, 9.17°E; summit elev. 4095 m
All times are local (unless otherwise noted)
Explosive eruptions and a lava flow from two vents starting on 29 May
Mt. Cameroon began erupting during the night of 28 May 2000. On 29 May, following a violent explosion, red-tinged fumaroles were observed at an elevation of 3,300 m. On May 30, an earthquake shook the provincial capital of Buea, located to the SE of the volcano. Volcanic ash and gases that were vented during the course of the eruption were blown to the W coast by NE winds.
The eruption occurred at two principle sites separated by 3 km. These sites lie on the central portion of the upper SE flank, upslope of the town of Buea and in the vicinity of vents active in 1904 and 1922. The first site, located at latitude 04°12'40" N and longitude 09°10'45" E and an elevation of 4,000 m, is composed of two craters aligned NE to SW. Juvenile material comprises less than 1% of the total volume of the pyroclastic material surrounding the vents. The larger pyroclasts were found farther away from the vent, while the finer material was deposited closest to the crater. The NE crater, with slopes that are fissured and unstable, showed relatively little activity compared with its neighbor to the SW. The eruption at the SW crater was characterized by sporadic explosions of gas and pyroclastic materials, including juvenile materials such as volcanic bombs, blocks, and scoria. There were no lava flows reported from this site.
The second vent lies at 04°11'15" N and 09°10' E at an elevation of 3,300 m. This site consists of a large open fissure oriented at N 40° E. The following features at the site run NE to SW along the fissure: two lava lakes surrounded by spatter cones, two craters in the process of forming cones with fluid lava, and several hectometer-sized (104 m2) fissure lava flows. The spatter cones are about 40 m from the associated lava lake.
The NE lava lake forms a 60 x 40 m ellipse. This lava lake was the source of the lava flows that moved towards the ocean to the S and away from many of the inhabited parts of the volcano's flanks. There were sporadic explosions at the lava lakes.
Contrary to some media reports that suggested the lava was advancing at rates up to 20-25 m/hour, a scientist from the Ministry of Territorial Administration reported that the lava moved at ~5 m/hour. The scientist also indicated that the lava flows were far from populated areas.
However, on 8 June, various news reports placed the lava flows within 5-7 km of the town of Buea. Reuters reported on 9 June that geologist Isaac Konifer Nijah, a member of a scientific team monitoring the volcano, considered the Buea area a high risk zone. Concern for the residents in this town prompted an evacuation plan for ~3,000 residents to the towns of Limbe to the SW and Tiko to the SE. However, the evacuation plan was not implemented because on 10 June the lava front halted its advance on the town.
The BBC reported that on 19 June, the Prime Minister of Cameroon, Peter Mafany Musonge, visited the village of Bokwango, which is on the outskirts of Buea. News reports stated that at this point the lava flows were 4 km from the edge of the village. However, no new activity had been reported by seismologists for several days preceding the visit.
Thanks to Pierre Vincent and the company ELF Aquitaine, an initially proprietary report on Mount Cameroon geology, eruptions, and hazards (including a geological map) were recently made available to the Smithsonian (Vincent, 1980). The same author has some earlier published work on this volcano (Vincent, 1971).
References. Vincent, Pierre M., 1980, GNL Project in Cameroon, geology and volcanology of Mount Cameroon: Report for ELF Aquitaine (in French), 11 p., appendices, and map (plate).
Vincent, Pierre M., 1971, New data about Cameroon Mountain volcano: 6th Colloquium on African Geology, Leicester, UK, April 1971, Jour. Geol. Soc. London 127, p. 414-415.
Geologic Background. Mount Cameroon, one of Africa's largest volcanoes, rises above the coast of west Cameroon. The massive steep-sided volcano of dominantly basaltic-to-trachybasaltic composition forms a volcanic horst constructed above a basement of Precambrian metamorphic rocks covered with Cretaceous to Quaternary sediments. More than 100 small cinder cones, often fissure-controlled parallel to the long axis of the 1400 km3 edifice, occur on the flanks and surrounding lowlands. A large satellitic peak, Etinde (also known as Little Cameroon), is located on the S flank near the coast. Historical activity was first observed in the 5th century BCE by the Carthaginian navigator Hannon. During historical time, moderate explosive and effusive eruptions have occurred from both summit and flank vents. A 1922 SW-flank eruption produced a lava flow that reached the Atlantic coast, and a lava flow from a 1999 south-flank eruption stopped only 200 m from the sea. Explosive activity from two vents on the upper SE flank was reported in May 2000.
Information Contacts: US State Department, 2201 C St., NW, Washington, DC 20520 USA (URL: http://www.state.gov/); BBC (URL: http://news.bbc.co.uk/); Reuters (URL: http://www.reuters.com).
Colima
Mexico
19.514°N, 103.62°W; summit elev. 3850 m
All times are local (unless otherwise noted)
Low seismicity August 1999-May 2000; frequent explosions and evacuations
The following summarizes activity at Colima during the period from August 1999 to May 2000. As previously mentioned (BGVN 24:08), outbursts occurred on 5 and 17 July 1999. However, in the months that followed, August 1999 through May 2000, little activity occurred on Colima. Microearthquakes, sporadic eruptions and lahars were the most common events during these months.
During August through December 1999 Colima maintained low levels of seismicity, with few explosions or mudflows. Due to heavy precipitation on 2 September a lahar traveled under the Cordoban bridge without causing damage. Residents of Yerbabuena, La Becerrera, and Rancho El Jabali were told to avoid activities on the S-flank stream beds of the Cordoban, La Lumbre, San Antonio, and Montegrande rivers.
Landslides and lahars on the S and SW flanks during 5-6 September were quickly dispersed into La Lumbre and Cordoban drainages due to intense rains. Other monitored parameters showed no significant changes. During the week of 10 September seismicity remained low, with no degassing events or important explosions noted.
On 6 October at about 0120, residents from the village La Yerbabuena (8 km SW of the summit) reported a very short and light ashfall. The ashfall lasted only a few minutes, and prior to the fall residents reportedly heard "jet" sounds coming from the crater. Before the described events, the telemetered seismic network alerted the civil protection authorities, who then notified nearby villages of the activity. At 1700 on 12 October there were ground reports of an eruption that sent an ash cloud ~6 km.
During the first two weeks of November Colima ejected steam-and-ash an average of once per day. The estimated height of the columns varied from 200 to 1,000 m above the summit. Neither ballistic ejecta nor pyroclastic flows were observed. On 17 December seismicity remained stable, but some fumarolic and explosive emissions took place.
Beginning in January and continuing through May, ash explosions and steam emissions became frequent. Seismicity on 18 March remained low, yet Colima continued to produce fumes and explosions that were considered to be a high risk to the surrounding population. The evacuation of populations within a radius of 6.5-8.5 km from the summit was maintained by the State Systems of Civil Protection and the Mexican Army. After some explosions on 25 May these evacuations were again enforced.
Geologic Background. The Colima complex is the most prominent volcanic center of the western Mexican Volcanic Belt. It consists of two southward-younging volcanoes, Nevado de Colima (the high point of the complex) on the north and the historically active Volcán de Colima at the south. A group of late-Pleistocene cinder cones is located on the floor of the Colima graben west and east of the complex. Volcán de Colima (also known as Volcán Fuego) is a youthful stratovolcano constructed within a 5-km-wide scarp, breached to the south, that has been the source of large debris avalanches. Major slope failures have occurred repeatedly from both the Nevado and Colima cones, producing thick debris-avalanche deposits on three sides of the complex. Frequent recorded eruptions date back to the 16th century. Occasional major explosive eruptions have destroyed the summit (most recently in 1913) and left a deep, steep-sided crater that was slowly refilled and then overtopped by lava dome growth.
Information Contacts: Colima Volcano Observatory, University of Colima, Ave. 25 de Julio 965, Colima 28045 México (URL: https://portal.ucol.mx/cueiv/).
Copahue (Chile-Argentina) — June 2000 Cite this Report
Copahue
Chile-Argentina
37.856°S, 71.183°W; summit elev. 2953 m
All times are local (unless otherwise noted)
Frequent ash explosions and acidic mudflows starting on 1 July
An eruption of Copahue (figure 5) began on 1 July 2000. Ash-and-gas emissions, which have continued into late July, are considered to be Copahue's most vigorous activity in the past century. Reports were received from geologists in Argentina and Chile. Except where otherwise noted, Argentine geologists Adriana Bermúdez (CONICET) and Daniel Delpino (Civil Defense of Neuquén Province) reported information for 1-9 July, and Chilean geologists José Naranjo and Gustavo Fuentealba (both of SERNAGEOMIN) reported information from 10-13 July. The scientists submitted joint reports beginning on 13 July. All time references are to Argentina local time; Chilean time is one hour earlier (GMT - 4 hours).
Initial explosions, 1-2 July. Although visibility was poor in late June, at 0030 and at 0430 on 1 July local Argentine police and gendarmerie (National Guard) reported ash mixed with heavy snowfall, as well as a strong sulfur smell. At around 1145, lapilli and ashfall became heavier, eventually covering the snow and the products of previous eruptions around the summit. At 1200 the gendarmerie reported lapilli falling 7.5 km NE of the volcano, in the village of Copahue, Argentina. The alert status was set at yellow; the village's emergency committee restricted tourist access and helped to evacuate 200 people.
Explosions continued throughout 2 July with increasing intensity. Lapilli, ash, and sporadic bombs (15 cm in diameter) fell 8-9 km E on the town of Caviahue, Argentina, with up to 15 cm of materials from the day's explosions eventually being deposited in some areas (figure 6). Until 2345 there were explosions of varying intensities. Preliminary results of an examination of the deposits revealed that they were composed of a very fine silica, sulfur particles, accidental rock fragments from the conduit, and juvenile materials. In Caviahue, visibility was practically zero due to ash particles in the air, and heavy ashfall cut off power for several hours. By midday, eruption plumes blowing SE reached Loncopué, a small village 50 km from the volcano.
Alert status was raised to orange on 2 July when ash was dispersed as far as 100 km away from the crater and the plume covered a total area of 2,000 km2. Maximum ash accumulation of 3-5 cm occurred over an area of 6 km2, including the town of Caviahue and the W sector of Lake Caviahue. Due to the ashfall, the surface of Lake Caviahue changed color from its normal deep blue to gray-green, and a water sample taken had a pH of 2.l.
Tests by Argentine geologists on ash samples deposited in Caviahue revealed a grain-size distribution of 15% coarse ash (> 1 mm), 80% fine ash (0.5-1.0 mm), and 5% fine ash dust (< 0.5 mm). The coarse ash contained a small quantity of juvenile and lapilli-sized (3-6 mm) accidental fragments; the juvenile materials were dark gray vitric scoria. Non-juvenile accessory materials accounted for 7-10% of the coarse ash and consisted primarily of white-gray silica from the bottom of the crater lake. The fine ash-sized particles had similar components and characteristics.
Irregularly shaped dark gray scoriae, 3-8 cm in size, were found as far as 12 km N of the crater; scoriae completely covered the area within a 1.0-1.5 km radius around the crater. The scoriae contained spherical vesicles 3-5 mm in diameter. Cooling cracks marked the scoriae's surfaces and their shapes had been modified during flight.
Ashfall was also reported 60 km SE of the volcano in the town of Loncopué, where the stream closest to the volcano had cloudy brown-gray waters.
Continuing activity through 25 July. Activity decreased after 2345 on 2 July. The only explosion of 3 July, at 1720 in the main crater, deposited tephra on the flanks and generated a dense, dark gray ash plume that blew NW and produced a local ashfall. According to the Buenos Aires Volcanic Ash Advisory Center, the ash plume reached an altitude of 10.6 km and blew NE. On 4 July there were explosions at 1030, 1830, and 2000. In the town of Caviahue, Delpino noted a strong sulfur smell and great booming sounds that caused windows to shake. A dark gray ash plume rose 2 km above the summit. Bermúdez and Delpino reported that at 0020 on 5 July a new cycle of rhythmic explosions began; by 1325 a total of 37 explosions had occurred. The biggest explosion, at 0515, generated a pyroclastic surge down the E and N slopes.
A report was received on 5 July from Ralco-Lepoy, a town 30 km SW of the volcano, indicating that dead fish had washed up along the banks of the Lomín river. The Lomín, as well as the Agrio river, which drain the acidic, active crater, were marked by a deep, dark-colored gully but there was no evidence of lahars. However, it is possible that ashfall covered up the evidence. The dead fish found along the Lomín River on 5 July confirmed that acidic mudflows from the crater had been channeled down this river. Chilean geologists Naranjo and Fuentealba recommended that states bordering the Lomín river (to the SW) and Queuco to Trapa-Trapa (to the N) be alerted that an acidic mudflow was moving down the river. Accordingly, authorities noted that inhabitants should be evacuated outside of an enforced safety radius. It was also recommended that professionals regularly measure the pH of affected Lomín drainages, meteorological reports be kept up to date, and that town officials periodically reevaluate the yellow alert.
Naranjo and Fuentealba also noted that at 2030 on 5 July a patrol of carabineros (Chilean National Guard) approached the volcano on horseback and observed small dark ash emissions moving SE from the volcano.
Observers in Argentina during the night of 5-6 July reported an incandescent pyroclastic emission flowing down the cone and, at one point, a white light emanating from the crater for ~15 seconds. In the same time interval, gendarmerie officers from Copahue village described "an orange-red light coming up from the crater." It is thought that the light was produced when magma rose to the surface but did not spill over the crater walls. They also noted the vertical ejection of large incandescent blocks that fell back into the crater, as well as smaller incandescent fragments that fell onto the volcano's slopes, rolled downhill, and broke up into smaller pieces.
On 6 July, Delpino reported to Naranjo and Fuentealba from Caviahue that the eruption was Strombolian with explosion pulses every 1-2 hours. Winds blew ash S of Caviahue without any ashfall in the town. There was no evidence of lahars or floods. Throughout the morning of 6 July snow continued, and there was zero visibility of the volcano.
Bermúdez and Delpino reported that during 0100-1020 on 7 July, loud explosions and ash emissions occurred at 15-minute intervals. At about 2000, the wind changed, blowing W, and ash began falling over Caviahue. About 1 mm of ashfall was observed from 20 km W of the crater.
The same day, ice blocks 15-20 cm in diameter, as well as ash and lapilli, were carried down the swollen Agrio river from the volcano's permanent ice cap. At 1300, a sample of the river water taken at the bridge near Caviahue had a pH of 2, and at 2000 a sample from the same location had a pH of 1.5. The Dulce stream source lies 4.5 km E of the cone and it flows 5.5 km W of the cone into Lake Caviahue. Ashfall altered the stream's typical pH of 7 to a pH of 2.5. Preliminary investigations by Argentina's Provincial Water Division also indicated an increased iron content.
A loud explosion summit at 0300 on 8 July awakened citizens of Caviahue; a day-long ash emission moved SE through clear skies. On 9 July at 0100 a glowing light was seen over the crater, but cloud cover obscured visual observations throughout the day.
Naranjo and Fuentealba reported that on 10 July, explosions were gray to dark brown and it is thought that the ash fell over a 25 km2 area to the W, in the direction of Chile. Ash reached the summit of neighboring Callaqui volcano, covering it in gray ash. Samples from this ashfall taken 4 km W of the active crater were found to contain juvenile volcanic glass fragments, 0.3-0.5 mm in diameter.
During 1200-1230 on 12 July, a Chilean overflight revealed that explosions inside the active crater (El Agrio) occurred at 1- to 3-minute intervals, ejecting fine material up to 500 m above the crater. This material was dispersed via a plume of fine ash and gases moving NNE for more than 250 km. Observers reported that 1-2 mm of fine ash was deposited in the village of Copahue. Throughout the day, activity increased and, at 2300, there was an explosion heard in Caviahue that was thought to have deposited 1-2 cm of ash 5 km NNE of Copahue. On 12 July, scientists noted that Copahue was in an eruptive phase of lower intensity (a Volcano Explosivity Index, VEI, of 1) compared to that seen on 1-2 July (an inferred VEI of 2).
At 1100 on 13 July, explosions generated white-gray to bluish gas emissions rising 200-300 m over the crater. A gas cloud with a strong sulfur odor remained trapped in the Agrio valley over a 10 km2 area; it later descended, and strong winds spread it over a 20 km2 area. At 2310, an explosion produced a 1-km-high plume and incandescent fragments were ejected onto the flanks of the cone reaching up to 1 km from the crater. The plume covered Caviahue, obscuring the moon, but there was no ashfall on the town.
A Chilean helicopter flight on the morning of 13 July observed explosions emitting pale gray ash columns up to 300 m above the crater rim. Winds dispersed the ash ENE to Caviahue. Carabineros sampling water at the source of the Lomín river found it slightly acidic (pH = 5-6).
At 1250 on 13 July, an eruption plume that rose 3-5 km over the crater was reported by military and civilian pilots. The column dispersed to the NE and was a reddish-brown color. Reports from Caviahue stated that on 15 July the eruption stayed at the same intensity as previous days, and fine ash was dispersed to the N. Ash samples from 13 July were found to have an andesitic composition and to include juvenile fragments, the presence of which indicates the volcano's potential to produce even larger explosions. Water samples from the Lomín river on the same date revealed high fluorine and sulfate levels.
At 1700-1730 on 16 July, and also between 0300 and 0400 on 17 July, a dusting of ash fell over Caviahue and there was a strong sulfur smell in the air. At 0905 on 18 July, a civilian pilot reported a pale gray ash column at 3.5-4 km above sea level (just over the top of the cordillera) dispersed over 10 km to the volcano's NNW. At this time, the ongoing eruptions were considered to be of VEI 1. Ash from the weak explosions was dispersed by low winds as it escaped from the crater.
At 2206 on 19 July, members of the gendarmerie reported that a series of explosions continued to generate columns of ash and water vapor 0.5-1.0 km above the crater. The plumes dispersed to the NE depositing a fine dusting of ash over the village of Copahue. A strong sulfurous odor was reported at 2100 in Caviahue. On 20 July activity remained low, and no noises or odors were detected. Winds carried the gas-and-ash plume NNE, depositing a light ashfall over the N sector of Caviahue.
On 21 July, light ashfall dusted Caviahue and, although the crater was obscured, ash columns were sighted rising above the summit and through the clouds to heights of 700-1,000 m. At 1048 (Argentina), Caviahue residents heard a series of rhythmic explosions occurring every 2-5 minutes for one hour. The plume carried ash NNE toward Trapa-Trapa. The volcano was obscured by cloud cover on 22 July but intermittent explosions continued emitting ash plumes carried NE toward Trapa-Trapa.
A seismological team from the Southern Andes Volcanological Observatory (OVDAS) installed a portable seismic station on 21 July at a spot ~2 km NNW of the active crater in the vicinity of Trapa-Trapa, Chile. After taking 15 hours of readings, the team left on 23 July after cold temperatures had prematurely reduced battery power. These readings were fortunately during a time of elevated activity, and registered seismic events generally correlated with visual observations. Despite this similarity, it was impossible to establish an exact correlation between the periodicity of the explosions (occurring every 1-3 minutes) and their microseismic signals at distance.
During the stay of the seismic team, no ashfall was reported in the Queco river region and no correlation was established between seismicity and sporadic thundering sounds reported by villagers in the area. These sounds have been attributed to chunks of the ice cap breaking off and rolling down Copahue's flanks. Due to over 3 m of snowfall, access to the area is difficult.
Explosions of low to intermediate intensity continued emitting ash-and-gas plumes on 23 July. The clouds continued to partially obscure the volcano, but at 1930 an ash column blew E toward Caviahue. On 24 July, the active crater was producing small explosions and dark gray ash emissions; a dusting of ash fell over Caviahue. When the Argentina gendarmerie and the Chilean carabineros compared respective observations no discrepancies were found.
Two pilots reported a strong sulfur odor at 1.8-2.1 km altitude, ~250 km WSW of Copahue on 25 July. At 1000 another pilot reported an ash plume extending 200 km WNW from the summit; plume height was ~2 km and width was 10-15 km. Although this explosion was not seen from Caviahue, a light ashfall fell over the town.
Due to the continued frequent ashfalls over Caviahue, town officials decided to reestablish a yellow alert. The prolonged fall of fluorine-rich ash has posed a possible problem for grazing animals in the affected fields, but heavy snowfall has made it less likely that vegetation will absorb the fluorine.
Background. Volcan Copahue is a composite cone constructed along the Chile-Argentina border. The cone lies within an 8-km-wide caldera formed 0.6 million years ago at a spot near the NW rim of the Pliocene, 20 x 15 km Del Agrio caldera. Copahue's eastern summit crater, part of a 2-km-long, ENE-WSW line of nine craters, contains an acidic crater lake (also referred to as Del Agrio) and displays intense fumarolic activity. Infrequent explosive eruptions have been recorded since the 18th century. Eruptions in 1992 and 1995 produced several phreatic and phreatomagmatic explosions and emissions that contained higher levels of water vapor but lower ash particle content than the current eruption. The current eruption has been of longer duration than either of the previous two.
The Agrio river emerges from a crack in the edifice of the volcano 50 m below the active El Agrio crater. The river water is highly acidic and has a yellow color. Near Caviahue, the Agrio river enters the Caviahue lake basin. The lake is formed by 2 glacial finger lakes over a 9.2 km2 area and is a reservoir of acidic water.
Most residents of Copahue village leave each winter, but Caviahue's population of 400 can grow to 10,000 during the ski season. Eruption-related damage has cut off power and potable water, and there remains an inability to keep ski slopes cleared of ash. In late July there were reportedly only about 419 people staying in Caviahue.
Geologic Background. Volcán Copahue is an elongated composite cone constructed along the Chile-Argentina border within the 6.5 x 8.5 km wide Trapa-Trapa caldera that formed between 0.6 and 0.4 million years ago near the NW margin of the 20 x 15 km Pliocene Caviahue (Del Agrio) caldera. The eastern summit crater, part of a 2-km-long, ENE-WSW line of nine craters, contains a briny, acidic 300-m-wide crater lake (also referred to as El Agrio or Del Agrio) and displays intense fumarolic activity. Acidic hot springs occur below the eastern outlet of the crater lake, contributing to the acidity of the Río Agrio, and another geothermal zone is located within Caviahue caldera about 7 km NE of the summit. Infrequent mild-to-moderate explosive eruptions have been recorded since the 18th century. Twentieth-century eruptions from the crater lake have ejected pyroclastic rocks and chilled liquid sulfur fragments.
Information Contacts: Adriana Bermúdez, National Council of Scientific and Technical Research (CONICET) and the National University of Comahue, Buenos Aires 1400, Neuquén Capital, Argentina; Daniel Delpino, Advisor to the Civil Defense of Neuquén Province, Argentina and the National University of Comahue, Buenos Aires 1400, Neuquén Capital, Argentina; José Naranjo, National Geology and Mining Service (SERNAGEOMIN), P.O. Box 10465, Avda. Santa Maria 0104, Providencia, Santiago, Chile; Gustavo Fuentealba, Southern Andes Volcanological Observatory (OVDAS), SERNAGEOMIN, P.O. Box 10465, Avda. Santa Maria 0104, Providencia, Santiago, Chile; Buenos Aires Volcanic Ash Advisory Center, Argentina (URL: http://www.ssd.noaa.gov/ VAAC/OTH/AG/messages.html).
Etna
Italy
37.748°N, 14.999°E; summit elev. 3357 m
All times are local (unless otherwise noted)
Frequent Strombolian eruptions and high gas emissions March-June 2000
Between March and June 2000, Etna's activity was characterized by several Strombolian eruptions and high gas emissions predominantly at the Southeast Crater (SEC). Sixty-four strong eruptive episodes have occurred since the new eruptive series began on 26 January 2000 (BGVN 25:03), with 19 episodes between March and June. The information for the following report is based on official weekly monitoring reports posted on the Poseidon website.
Activity during 29 March-April. Through March lava flows and ash emissions occurred frequently, and on 29 March at about 1900, lava flows were generated on the S sector of the SEC. Shortly after 0730 on 1 April intermittent ash emissions rose to ~3 km and fell on the E flank. An episode on 3 April produced strong rumblings that were felt in the area of Zafferana Etnea, with ashfall in the area of Giardini (NE sector). On 6 April, between 1010 and 1130, explosive activity produced a lava fountain and lava flows. Over the following days the only activity at the volcano was abundant emissions of steam from Bocca Nuova (BN).
On 10 and 11 April, modest Strombolian activity was observed at BN, which became more sporadic in the following days then quieted on the evening of 14 April. On 15 April, at about 1700, weak effusive activity resumed from the vent at the S foot of SEC. At 0928 explosive activity recommenced with abundant lava emission. Ash also erupted from SEC's summit and reached 2 km altitude. Intense but irregular explosive activity was also present at the BN. Activity peaked at 1235 with an eruptive column that enveloped the SEC and rose to an estimated height of 6 km; the column produced abundant fall of ash and lapilli on the E slope. The episode ended abruptly at 1250. During this time Voragine (VOR) exhibited slow steam emission.
At 0545 on 26 April, intense Strombolian activity began and was followed at 0637 by an ash emission that rose several kilometers. In addition, a series of lava flows occurred from the SEC. Beginning at 0723, explosive activity diminished and had ended by 0740. In the following days there were no further eruptive events except for occasional, and sometimes intense, gas emissions from the BN.
Activity during May 2000. During 1-7 May, there was strong gas emission. On 5 May, a strong new gas emission phase began at the SEC, representing the 52nd episode since 26 January 2000. A dense eruptive column rose several kilometers over the volcano's summit and deposited several centimeters of ash on local villages to the SE. At about 1800 the volcanic tremors and eruptive column waned, leaving weak Strombolian activity that ended around 1824. After 5 May, the SEC returned to a state of quiet. The Northeast Crater (NEC) showed intense gas emission, with varied ash content. Weak Strombolian activity persisted at the BN.
Eruptive activity during 8-14 May consisted of abundant steam emissions, mainly from BN and NEC. The BN was the most active crater, emitting copious amounts of steam from at least two vents. The NEC also had abundant steam emissions with varied ash content. Meanwhile, VOR emitted modest amounts of gas and SEC virtually nothing.
During 15-21 May there were four strong gas emissions from the SEC. During the first strong episode, on 15 May, tephra covered the E flank of the volcano. A second episode during the night of 15-16 May consisted of a violent emission of tephra from 2100-2150 that covered the SE flank. The third episode began with Strombolian activity at the SEC then changed rapidly to well-developed lava fountains between 2240 and 2300. Activity abruptly decreased and ended completely within the space of a few minutes. A fourth strong episode occurred about 2145 on 19 May with increased activity from the lava flow on the N flank of the SEC. Violent gas emissions occurred shortly after 2200 and ended within an hour. Significant eruptive activity continued from the NEC, though more discontinuous than during the preceding weeks. The abundant emissions of ash increased significantly beginning 17 May, continuing for several hours. The ash emissions from the NEC were independent of the concurrent increase of volcanic tremors and activity of the SEC, except for occasional temporal coincidence. Steam emissions from the BN were also intense, sometimes associated with weak Strombolian intracrater activity. Slow gas emissions appeared from the VOR.
Two strong episodes occurred at SEC on 23 and 27 May. Activity at the other craters consisted of above normal ash emissions from NEC, intense gas emissions at BN, and weak fumarolic activity at VOR. The 57th eruptive episode of the series began on 23 May with strong explosive activity between 0301 and 0329 accompanied by lava flows down the S flank of the volcano. An episode on 27 May was obscured by poor meteorological conditions.
Activity through June 2000. Two eruptive episodes occurred at SEC on 1 June. First, at 0814, sustained lava fountains began, with some reaching an altitude of 600-700 m before ending around 0832. The column of ash and steam rose for several thousands of meters over the summit and produced a fall of fine pyroclastic material over much of the countryside on Etna's S slope, as far as Catania. At 1930 on 1 June another episode began with a considerable increase in the flow of lava.
On 5 June a strong gas emission at SEC went on for about thirty minutes, during which an ash-and-steam cloud rose to ~3-4 km. The ashfall covered an ample sector of the SE and S region, extending to the Plain of Catania and creating difficulties in air traffic to and from Fonatanrossa and Sigonella airports. As with preceding episodes, the gas emissions were associated with lava flows, primarily on the N slope of the SEC. Just after 1230 on 8 June, an increase in this same lava flow announced another strong gas emission phase beginning with a Strombolian eruption. There was a progressive increase in the explosive activity which reached its peak between 1356 and 1426. The fallout from the eruptive cloud was distributed toward the N.
Another strong gas emission began on 14 June at about 0700 with Strombolian characteristics. Ash emissions reached a climax between 0920 and 0940. On 24 June the 64th episode of activity at SEC occurred when a strong gas emission issued from NEC and VOR. This episode began with an increase of lava flow activity from the fracture on the N flank of the SEC. Later, Strombolian activity at the SEC's summit crater made a transition at about 2130 to a more violent, continuous gas emission phase which reached a peak about 2144, before ending shortly thereafter. After the 24 June activity there were no eruptions the rest of the month, but sporadic ash emissions occurred at all summit craters, particularly at BN and VOR.
Geologic Background. Mount Etna, towering above Catania on the island of Sicily, has one of the world's longest documented records of volcanism, dating back to 1500 BCE. Historical lava flows of basaltic composition cover much of the surface of this massive volcano, whose edifice is the highest and most voluminous in Italy. The Mongibello stratovolcano, truncated by several small calderas, was constructed during the late Pleistocene and Holocene over an older shield volcano. The most prominent morphological feature of Etna is the Valle del Bove, a 5 x 10 km caldera open to the east. Two styles of eruptive activity typically occur, sometimes simultaneously. Persistent explosive eruptions, sometimes with minor lava emissions, take place from one or more summit craters. Flank vents, typically with higher effusion rates, are less frequently active and originate from fissures that open progressively downward from near the summit (usually accompanied by Strombolian eruptions at the upper end). Cinder cones are commonly constructed over the vents of lower-flank lava flows. Lava flows extend to the foot of the volcano on all sides and have reached the sea over a broad area on the SE flank.
Information Contacts: Sistema Poseidon, a cooperative project supported by both the Italian Government and the Sicilian Regional Government, and operated by several scientific institutions (URL: http://www.ct.ingv.it/en/chi-siamo/la-sezione.html).
Guagua Pichincha (Ecuador) — June 2000 Cite this Report
Guagua Pichincha
Ecuador
0.171°S, 78.598°W; summit elev. 4784 m
All times are local (unless otherwise noted)
Minor ash eruptions; partial collapse of January 2000 dome on 12 July
This report discusses activity at Guagua Pichincha during the months of June and July 2000. A Washington Volcanic Ash Advisory Center (VAAC) advisory was issued at 1337 on 2 June after a minor ash explosion propelled a plume to 7.3 km altitude above the summit. Another small eruption occurred one week later at 0941 on 9 June. Emissions from this second eruption did not rise more than 5 km, but more earthquakes and rockfalls indicated increasing instability of the January 2000 lava dome.
At 0953 on 12 July the dome experienced a partial collapse on its W side. This is the area of the dome closest to the W opening of the horseshoe-shaped caldera. High on the slope of the volcano's W flank, just below the caldera's opening, is the origin of the Cristál river. A long-period (LP) earthquake with a reduced displacement of 14.5 cm2 probably destabilized the dome and caused the partial collapse. Judging by seismic data, the ash plume may have risen ~12 km above the crater, but cloud cover inhibited visual observations. A strong wind blew most ash W, away from the city of Quito, and very fine ash blanketed the caldera. Seismicity remained low after the eruption, but a slight increase in the number of rockfalls indicated that the dome was still unstable.
Two other events occurred during July. An ash plume was also sighted at 0900 on 23 July at an estimated height of 6.1 km moving W. An aviation notice at 0900 on 24 July described ash from six emissions over the course of the previous night that reached 4.8 km altitude, a height comparable to the volcano's summit elevation.
Over 14,530 LP events were registered in the month of March and this number decreased to 6,892 in April; there was a reported average of 271 LP events daily for the year 2000. The number of monthly explosions dropped to almost zero during the period of January to April; this was the first time there have been so few explosions since the month of July 1998. Volcano-tectonic seismicity also dropped dramatically during January-July 2000, averaging approximately the same number of monthly events as seen prior to activity that began in October 1999. The number of rockfall events has remained high since dome growth began in January 2000; thus far in the year 2000 there has been an average of 72 daily rockfalls. Beginning around June 2000 these events have occurred 100-200 times per day. Two main seismic centers have been inferred at Guagua Pichincha from data; one center is less than 1 km below the crater surface and the second ~2-4 km deeper. Continued fumarolic activity has been moderate but variable.
Geologic Background. Guagua Pichincha and the older Pleistocene Rucu Pichincha stratovolcanoes form a broad volcanic massif that rises immediately W of Ecuador's capital city, Quito. A lava dome grew at the head of a 6-km-wide scarp formed during a late-Pleistocene slope failure ~50,000 years ago. Subsequent late-Pleistocene and Holocene eruptions from the central vent consisted of explosive activity with pyroclastic flows accompanied by periodic growth and destruction of the lava dome. Many minor eruptions have been recorded since the mid-1500's; the largest took place in 1660, when ash fell over a 1,000 km radius and accumulated to 30 cm depth in Quito. Pyroclastic flows and surges also occurred, primarily to then W, and affected agricultural activity.
Information Contacts: Instituto Geofísico, Escuela Politécnica Nacional, Apartado 17-01-2759, Quito, Ecuador (URL: http://www.igepn.edu.ec/); Washington Volcanic Ash Advisory Center (VAAC), Satellite Analysis Branch, NOAA/NESDIS E/SP23, NOAA Science Center Room 401, 5200 Auth Road, Camp Springs, MD 20746, USA (URL: http://www.ssd.noaa.gov/); Associated Press.
Hekla
Iceland
63.983°N, 19.666°W; summit elev. 1490 m
All times are local (unless otherwise noted)
Clarification of NASA airborne plume experiments on 29 February 2000
NASA's Dryden Flight Research Center (DFRC) advised that information concerning two flights of their DC-8 aircraft as reported in BGVN 25:02 contained errors and requested that the information be corrected with additional details as follows:
"For approximately seven minutes starting at 0510 during a transit flight on 29 February to Kiruna, Sweden, a NASA DC-8 aircraft with a payload of SOLVE (SAGE III Ozone Loss and Validation Experiment) sensors flew through the plume ~11.3 km NNE of Iceland at 76 °N and 5 °W, just off the Greenland coastline. The plume extended up to ~13 km altitude, well into the lower stratosphere. The aircraft passed thorough the volcanic ash far N and W, and at a flight level much higher, than the predictions reported by the Volcanic Ash Advisory Center (VAAC), London. Instruments measured many in situ trace gases, SO2, HNO3, NO, NOy, O3, volatile and non-volatile aerosols, and aerosol size distribution. The scientific team reported substantial increases in CN, NOy, HNO3, CO, and particle counts, O3 went to nearly zero, H2O increased, and strong scattering layers up to 13 km were detected.
"A flight on 5 March detected enhanced aerosols and SO2 at 1301, but by that time the plume was so diluted that it represented no danger to the aircraft. During the three weeks following the initial encounter the DC-8 detected remnants of the plume trapped within the polar vortex. The resulting analysis concluded that volatile aerosols increased and the sizes of non-volatile large aerosols decreased."
NASA-DFRC also advised that the statement about the plume being a "very impressive, orange, airfoil-shaped feature in the pre-dawn sky" was erroneous. Post-flight interviews with the pilot indicated that there was no moon out, therefore pitch black sky conditions existed at the time of the encounter. The pilots had no visual evidence of flying into the plume.
Geologic Background. One of Iceland's most prominent and active volcanoes, Hekla lies near the southern end of the eastern rift zone. Hekla occupies a rift-transform junction, and has produced basaltic andesites, in contrast to the tholeiitic basalts typical of Icelandic rift zone volcanoes. Vatnafjöll, a 40-km-long, 9-km-wide group of basaltic fissures and crater rows immediately SE of Hekla forms a part of the Hekla-Vatnafjöll volcanic system. A 5.5-km-long fissure, Heklugjá, cuts across the 1491-m-high Hekla volcano and is often active along its full length during major eruptions. Repeated eruptions along this rift, which is oblique to most rifting structures in the eastern volcanic zone, are responsible for Hekla's elongated ENE-WSW profile. Frequent large silicic explosive eruptions during historical time have deposited tephra throughout Iceland, providing valuable time markers used to date eruptions from other Icelandic volcanoes. Hekla tephras are generally rich in fluorine and are consequently very hazardous to grazing animals. Extensive lava flows from historical eruptions, which date back to 1104 CE, cover much of the volcano's flanks.
Information Contacts: Gary Shelton, NASA, Dryden Flight Research Center, P.O. Box 273, Edwards, CA 93523-0273 USA.
Irazu
Costa Rica
9.979°N, 83.852°W; summit elev. 3436 m
All times are local (unless otherwise noted)
Feeble microseismicity continues into early 2000
This report covers January-June 2000. In January seismographic station IRZ2 (5 km SW of the active crater) recorded seven small-magnitude earthquakes. During February and March no activity was recorded. In April, May, and June, respectively, IRZ2 recorded 10, 12, and 30 earthquakes. The latter month included low-frequency events.
During May the level of the crater lake decreased by 50 cm. During the dry period, the lake's color was yellow/green, and a significant amount of algae covered its surface. On the lake's NE and S shore lines constant bubbling continued; the temperature of the lake was 18°C. The E, N, and W crater walls continued sliding toward the lake. Fumarolic activity on the NE flank continued at a low level.
In June the crater lake's surface rose 40 cm in comparison to May. The lake color was now green and its surface was still covered by abundant algae. The NE crater wall continued sliding, partly covering some fumaroles while others completely disappeared. Also, along the NE wall three new thermal features appeared with temperatures that fluctuated between 22 and 54°C. On the NE and S shore the bubbling stopped during June.
Geologic Background. The massive Irazú volcano in Costa Rica, immediately E of the capital city of San José, covers an area of 500 km2 and is vegetated to within a few hundred meters of its broad summit crater complex. At least 10 satellitic cones are located on its S flank. No lava effusion is known since the eruption of the Cervantes lava flows from S-flank vents about 14,000 years ago, and all known Holocene eruptions have been explosive. The focus of eruptions at the summit crater complex has migrated to the W towards the main crater, which contains a small lake. The first well-documented eruption occurred in 1723, and frequent explosive eruptions have occurred since. Ashfall from the last major eruption during 1963-65 caused significant disruption to San José and surrounding areas. Phreatic activity reported in 1994 may have been a landslide event from the fumarolic area on the NW summit (Fallas et al., 2018).
Information Contacts: Observatorio Vulcanologico y Sismologico de Costa Rica, Universidad Nacional (OVSICORI-UNA), Apartado 86-3000, Heredia, Costa Rica.
Kilauea (United States) — June 2000 Cite this Report
Kilauea
United States
19.421°N, 155.287°W; summit elev. 1222 m
All times are local (unless otherwise noted)
During May-July 2000, continued frequent surface flows and earthquakes
The period from 1 May through 17 July 2000 was characterized by frequent surface flows and earthquakes. On 9 May a thick steam and sulfur dioxide fume formed SW of Pu`u `O`o; such fumes, or vog, have often obscured the crater for the past few months. The prominent fumes came from skylights (holes in roofs of lava tubes) along the active tubes leading to a narrow dark aa flow that emerged onto the surface on 6-7 May.
On 15 May lava broke frequently onto the surface, widening the active flow field toward the E. During 16-25 May very little activity took place. On 26 May at 0457, heavy vog hung over Pulama pali and slowly drifted downslope. The ocean entry at Waha`ula remained vigorous over the past several weeks, building a bench 40-45 m seaward of the former coastline (figure 147).
On the afternoon of 29 May two successive earthquakes occurred on Kīlauea's S flank. The earthquakes had a preliminary magnitude of 4 and were felt in the town of Hilo 45 km NW of Kīlauea.
Observations of the Pu`u `O`o cone on 1 June revealed no significant changes in the crater or collapse pits on the S and W flanks (figure 148). On the E crater rim, gentle "sloshing" sounds were heard, indicating lava at a shallow level. Direct observation into the vent was prevented by heavy fume. The Pu`u `O`o crater contains three pond vents and two hornitos. Most of these originated during September-November 1999 intracrater activity. Since then the crater has often been obscured by fume, but occasionally HVO observers have witnessed active lava within these vents.
The S shield (figure 148) has about 20 m of relief; the minishield, less than 10 m. The episode 55 cone was about 10 m high; yet has subsided into a slowly expanding collapse crater. The cracks adjacent to the pit wall show the expansion of the 55 cone's pit. These cracks are as wide as 1-2 m and some have slight vertical offsets. Major subsidence occurs in abrupt stages. Entire collapse craters 10-30 m deep and 50 m across form in a few hours or less. The cracked ground then remains stable for weeks or months. The W gap, which formed in January 1997, is the result of the subsidence along the E-rift axis. An E-rift intrusion in September 1999 led to a temporary shutdown of volcanic activity at Pu`u `O`o. When activity resumed, new small spatter cones were active briefly, shedding the lava flows shown as 1999 flows on the sketch map.
Throughout the week of 11-17 June activity remained stable. Lava continued to flow to the sea from Waha`ula entry, and from the entry to its W. Surface lava flows were visible sporadically on Pulama pali and elsewhere. Volcanic tremor near Pu`u `O`o remained weak to moderate.
On 13 June rain cleared vog from Holei Pali and enabled good views of the flow field in the morning. Lava continued to enter the ocean, not only at the Waha`ula entry but also at other entries a few hundred meters to the W (figure 147). Surface flows were apparent several hundred meters inland, and visitors reported breakouts near the western edge of the present flow field for the past several days. Pulama pali remained dark, but the fumes rolling down the pali came from active lava tubes feeding the active ocean entries and surface breakouts. Due to rain clouds and volcanic gas in the crater center, Pu`u `O`o was dark on the morning of 14 June. Seismicity was low across the island. Volcanic tremor near Pu`u `O`o remained weak to moderate. Kīlauea's summit tilt and the tilt near and on Pu`u `O`o and all along the E rift zone were flat and stable.
Two moderate steam plumes rose from coastal entries on the afternoon of 15 June. Summit and rift-zone tilt remained steady, volcanic tremor at Pu`u `O`o was moderate and continued, and there was no unusual earthquake activity. Apparently on 15 June the eruption continued through tubes, with relatively little entering the sea.
On 16-17 June the lava bench at the Waha`ula entry was 30-50 m wide. On top of Pulama pali lava moved through the tube at a speed of ~10 km/hour. On 17 June, from 1330 to 1415, observations during a helicopter flight revealed more lava on the flow field a few hundred meters inland of Waha`ula. As movement of lava continued in Waha`ula, for the first time in several weeks a surface breakout was visible on Pulama pali between 1830 and 2030 on the evening of 17 June. The lava appeared from a distance to be aa and moved slowly down the middle third of the pali, near the eastern edge of the flow field W of Royal Gardens. On the evening of 17 June the Waha`ula entry , and another entry ~800 m to the W became active for several hours.
No breakouts were visible on 20 June on Waha`ula, Pulama pali, or the coastal flat. Fume continued to blanket the flow path down the pali. Above Pulama pali a new ledge was observed on 25 June, only ~1 m below the surface, at 642 m elevation. The ledge indicated that the level of lava in the tube rose temporarily and then subsided, and a breakout was observed at 686 m elevation.
During July there were frequent surface flows. On 6 July a substantial new pahoehoe flow began from a breakout point at about 200 m elevation on Pulama pali. The flow was ~500 m long and 150-200 m wide. Lava continued to spill into the sea at three sites. The most vigorous entry remained at Waha`ula, which generated two steam plumes on 6 July. The Kamokuna entry, the westernmost active bench, was less vigorous than Waha`ula but created a substantially larger steam plume. During mid-day 16 July, several entries were active: Waha`ula was the most active and Kamokuna the second most active. Several moderate-size surface flows were active in the eastern part of the flow field, between Royal Gardens and the coast. Heavy fume continued to flow down Pulama pali above the lava tube system.
Overall the seismicity and volcanic tremor for the months of May through July remained moderate and stable in the area around Kīlauea's summit. Within the summit of Kīlauea activity has remained slightly elevated.
Background. Kīlauea is one of five coalescing volcanoes that comprise the island of Hawaii. Historically its eruptions originate primarily from the summit caldera or along one of the lengthy E and SW rift zones that extend from the caldera to the sea. The latest Kīlauea eruption began in January 1983 along the E rift zone. The eruption's early phases, or episodes, occurred along a portion of the rift zone that extends from Napau Crater on the uprift end (towards the summit) to ~8 km E on the downrift end (towards the sea). Activity eventually centered on the area and crater that was later named Pu`u `O`o.
Between July 1986 and January 1992, the Kupaianaha lava lake was active ~3 km NE of Pu`u `O`o. It was during this period that the town of Kalapana and a majority of the 181 homes lost were destroyed. In December 1991, one month prior to the shutdown of Kupaianaha, eruptive activity returned to Pu`u `O`o. More than 1 km3 of lava has erupted during the 14 years of activity (January 1983-January 1997).
Geologic Background. Kilauea overlaps the E flank of the massive Mauna Loa shield volcano in the island of Hawaii. Eruptions are prominent in Polynesian legends; written documentation since 1820 records frequent summit and flank lava flow eruptions interspersed with periods of long-term lava lake activity at Halemaumau crater in the summit caldera until 1924. The 3 x 5 km caldera was formed in several stages about 1,500 years ago and during the 18th century; eruptions have also originated from the lengthy East and Southwest rift zones, which extend to the ocean in both directions. About 90% of the surface of the basaltic shield volcano is formed of lava flows less than about 1,100 years old; 70% of the surface is younger than 600 years. The long-term eruption from the East rift zone between 1983 and 2018 produced lava flows covering more than 100 km2, destroyed hundreds of houses, and added new coastline.
Information Contacts: Hawaiian Volcano Observatory (HVO), U.S. Geological Survey, PO Box 51, Hawaii National Park, HI 96718, USA (URL: https://volcanoes.usgs.gov/observatories/hvo/).
Lascar
Chile
23.37°S, 67.73°W; summit elev. 5592 m
All times are local (unless otherwise noted)
Ash eruption on 20-21 July
At about 1044 on 20 July 2000, an eruption began at Lascar volcano that lasted until 1509. The Washington VAAC reported an ash advisory at 1509 for an ash plume that extended 660 km to the E, stretching from N Chile across S Bolivia and N Argentina and into W central Paraguay. At that time, the plume was traveling at speeds of up to 130 km/hour, reached altitudes of 10.7-13.7 km, and was reported to be 103 km wide.
Residents of the village of Jama, located 60 km ENE of the volcano on the Argentina-Chile border, reported feeling an earthquake before seeing a white mushroom cloud that rose 4-5 km high and rapidly blew E, depositing 1-2 mm of ash over the village. Several explosions were felt and heard 160 km ESE in San Antonio de los Cobres, but there were no reports of any injuries or damage. Activity continued into 21 July with small explosions producing plumes 200-300 m above the summit. The volcano is in a sparsely populated area so no evacuations were necessary.
According to Matthews and others (1997) Lascar has undergone four recognized cycles between 1984 and 1993. In each of these cycles, a lava dome is extruded in the active crater accompanied by vigorous degassing through high-temperature, high-velocity fumaroles on and around the dome. The dome then subsides into the conduit while the velocity and gas output of the fumaroles decrease; the cycle ends with violent explosive activity. No new lava was immediately extruded after the dome collapsed in the explosive 1993 eruption, thus breaking the previous pattern.
Background. Lascar is the most active volcano of the northern Chilean Andes; it is characterized by its persistent fumarolic activity, steam eruptions, and occasional vulcanian eruptions. The andesitic-to-dacitic stratovolcano contains six overlapping summit craters along a NE-SW trend.
Matthews and others (1997) discussed Lascar's evolution in four phases starting at ~50 ka. During phase I, an edifice was established on the E side, and pyroxene andesite lavas erupted. Phase II saw the development of the W edifice with a subglacial andesitic eruption, and the destruction of a substantial dome, arguably the volcano's most explosive event. In Phase III, a stratocone was constructed and a major andesitic explosive eruption generated scoria flows, known as the Tumbres deposits, dated at 9.2 ka. Phase IV activity shifted back to the E, leaving pyroclastic deposits dated at 7.1 ka. Prominent Phase IV lava flows extended NW and were later truncated by the formation of three deep collapse craters that mark the W migration of the active center. The current active vent discharges in the deepest of these craters, which is 800 m in diameter and 300 m deep. Frequent explosive eruptions have been recorded since the mid-19th century.
Reference. Matthews, S.J., Gardeweg, M.C., and Sparks, R.S.J., 1997, The 1894 to 1996 cyclic activity of Lascar Volcano, northern Chile: cycles of dome growth, dome subsidence, degassing and explosive eruptions: Bulletin of Volcanology, v. 59, p. 72-82.
Geologic Background. Láscar is the most active volcano of the northern Chilean Andes. The andesitic-to-dacitic stratovolcano contains six overlapping summit craters. Prominent lava flows descend its NW flanks. An older, higher stratovolcano 5 km E, Volcán Aguas Calientes, displays a well-developed summit crater and a probable Holocene lava flow near its summit (de Silva and Francis, 1991). Láscar consists of two major edifices; activity began at the eastern volcano and then shifted to the western cone. The largest eruption took place about 26,500 years ago, and following the eruption of the Tumbres scoria flow about 9000 years ago, activity shifted back to the eastern edifice, where three overlapping craters were formed. Frequent small-to-moderate explosive eruptions have been recorded since the mid-19th century, along with periodic larger eruptions that produced ashfall hundreds of kilometers away. The largest historical eruption took place in 1993, producing pyroclastic flows to 8.5 km NW of the summit and ashfall in Buenos Aires.
Information Contacts: José Viramonte, Universidad Nacional de Salta and CONICET, Buenos Aires 177 -4400 Salta, Argentina; George Stephens, NOAA Operational Significant Events Imagery Support Team, World Weather Bldg., 5200 Auth Road, Rm. 510, NOAA/NESDIS, Camp Springs, MD 20748 (URL: https://www.nnvl.noaa.gov/); Associated Press.
Miyakejima
Japan
34.094°N, 139.526°E; summit elev. 775 m
All times are local (unless otherwise noted)
Magma intrusion within W flank and explosive eruption on 7 July
The 27 June 2000 water discoloration ~1 km off the W shore of the island of Miyake-jima (BGVN 25:05) prompted considerable investigation. Remote Operation Vehicle (ROV) work and multi-beam side-scan sonar revealed fractures and what appeared to be three ocean-floor craters around the area of discoloration. Crustal deformation found in this region implies that cracks have opened under the W flank of the volcano. Magma intrusion was confirmed to have occurred in the W flank of the volcano around the time of the 27 June event. The absence of scoria or other eruptive products makes it likely that the event was thermal water released due to intrusion.
Magma intrusion is also thought to be the cause of a series of earthquakes that began on 26 June. Hypocenters migrated from a central position under the island in a curve to the W, NW, and N, reaching a position ~70 km NNW of the island by 21 July (figure 5).
Miyake-jima's mayor, Naoyuki Hirose, lifted the evacuation order for the SE district of Tsubota on 29 June, permitting hundreds of the almost 2,000 evacuees to return home. Approximately half of the island's population of 4,000 had been evacuated on 26 June.
At 0414 on 7 July, an eruption from the summit crater sent ash and rock into the sky; plumes dispersed ash over wide areas of the island. The eruption continued until 1110 and about 140 residents had to be evacuated from the N sector of the island to protect them from heavy ashfall. A second eruption at 1550 sent an ash column 1 km above the crater, ejected rocks, and produced loud booming noises. On 8 July there was a weak yellow-colored emission. Closer inspection of this last eruption revealed that very little material had been ejected, but a pit crater ~200 m in diameter and 100-200 m deep had formed. It is thought that the pit crater marked an empty cavity left when magma progressed from the summit area and intruded to the W.
The month-long crisis (figure 5) involved more than 17,500 earthquakes, including 5,480 strong enough to be felt by humans. The Miyake-jima earthquake swarm included a 7 July, M 5.2 event centered 25 km NW of Miyake-jima under the young volcanic islands of Nii-jima and Kozu-shima at 10 km depth, and a 1 July, M 6.4 event that killed one man on Kozu-shima by rockfall.
Geologic Background. The circular, 8-km-wide island of Miyakejima forms a low-angle stratovolcano that rises about 1,100 m from the sea floor in the northern Izu Islands about 200 km SSW of Tokyo. The basaltic volcano is truncated by small summit calderas, one of which, 3.5 km wide, was formed during a major eruption about 2,500 years ago. Numerous craters and vents, including maars near the coast and radially oriented fissure vents, are present on the flanks. Frequent eruptions have been recorded since 1085 CE at vents ranging from the summit to below sea level, causing much damage on this small populated island. After a three-century-long hiatus ending in 1469 CE, activity has been dominated by flank fissure eruptions sometimes accompanied by minor summit eruptions. A 1.6-km-wide summit crater was slowly formed by subsidence during an eruption in 2000.
Information Contacts: Geological Survey of Japan, Higashi 1-1-3, Tsukuba, Ibaraki 305 Japan; Japan Meteorological Agency, Tokyo, Japan; Associated Press; Reuters.
Momotombo (Nicaragua) — June 2000 Cite this Report
Momotombo
Nicaragua
12.423°N, 86.539°W; summit elev. 1270 m
All times are local (unless otherwise noted)
Increased seismic activity in June
Seismicity remained stable between November 1999 and April 2000. In May 2000 a seismic swarm began near the volcano, and in June there was heightened seismicity.
During 9-11 June the INETER seismic network registered over 500 earthquakes near Momotombo, 100 of which were located. Many of the earthquakes were between M 3.4 and 4.1 (figure 8), and occurred at depths less than 5 km. The small epicentral area was directly under a geothermal plant on the S slope of the volcano, between Momotombo's crater and the coast of Lake Managua. A similar area was the site of seismic swarms in past years, with the most recent occurrence in May 2000. Some of the earthquakes on 9 June were felt by the personnel of the geothermal plant 5 km SW of the crater and one was felt by several people in the town of Nagarote. INETER stated that an eruption could affect the geothermal plant's 96 employees, as well as residents of towns bordering the volcano. Continuous seismic tremor was also observed at the volcano, which was attributed to volcanic processes rather than movements at tectonic faults. The number of seismic events began to decrease on 11 June. From 12 to 13 June, 60 earthquakes occurred with seven epicenters located. In comparison, 150 earthquakes occurred from 9 to 10 June with 38 epicenters located. After 13 June the number of earthquakes gradually decreased to normal levels.
Julio Alvarez, Jorge Cross, Arming Saballos (all INETER/Vulcanología), and Eduardo Mayorga visited the volcano on 15 June to measure the temperature of fumaroles in the crater zone. Temperature measurements conducted at fumaroles in the volcano's dome yielded values between 255 and 933 °C (figure 9). The highest temperature was found near the N edge of the crater.
Geologic Background. Momotombo is a young stratovolcano that rises prominently above the NW shore of Lake Managua, forming one of Nicaragua's most familiar landmarks. Momotombo began growing about 4500 years ago at the SE end of the Marrabios Range and consists of a somma from an older edifice that is surmounted by a symmetrical younger cone with a 150 x 250 m wide summit crater. Young lava flows extend down the NW flank into the 4-km-wide Monte Galán caldera. The youthful cone of Momotombito forms an island offshore in Lake Managua. Momotombo has a long record of Strombolian eruptions, punctuated by occasional stronger explosive activity. The latest eruption, in 1905, produced a lava flow that traveled from the summit to the lower NE base. A small black plume was seen above the crater after a 10 April 1996 earthquake, but later observations noted no significant changes in the crater. A major geothermal field is located on the south flank.
Information Contacts: Wilfried Strauch and Virginia Tenorio, Dirección General de Geofísica, Instituto Nicaragüense de Estudios Territoriales (INETER), Apartado 1761, Managua, Nicaragua (URL: http://www.ineter.gob.ni/).
Santa Maria (Guatemala) — June 2000 Cite this Report
Santa Maria
Guatemala
14.757°N, 91.552°W; summit elev. 3745 m
All times are local (unless otherwise noted)
January 2000 lava flow goes 2.5 km down S flank
A blocky lava flow fed from the Caliente vent, active since July 1999 (see BGVN 24:12), had advanced nearly 2.5 km by the end of January 2000. The thermal anomaly related to this flow as measured on the 23 January Landsat 7 Enhanced Thematic Mapper (ETM+) is ~2,370 m long and 60-120 m wide. The flow extended S down the flank of the Santiaguito dome complex before being deflected SW by a low ridge and moving over the top of the 1986-89 flow (figure 29). A ~50 m-wide axial zone of the flow was very steep with a front slope of 60-70°. This ~30-m high axial zone advanced downward and collapsed into the sheer-sided ravine that forms the upper reaches of the Río Nimá II. The marginal flow front is ~18 m thick and its slope is smaller (~32°). As 2- to 5-m-wide sections of the flow front moved, minor collapses occurred at a rate of 1 to 2 per minute. Ash clouds generated by these collapses had temperatures of 185°C, and flow temperatures as high as 531°C were measured at a freshly exposed section of the axial zone. Temperatures for the blocky crust capping the flow front were lower, typically 34-76°C.
On 23 January, the Caliente vent was full. The 23 January ETM+ image shows this zone as an intense, thermal anomaly, 120-150 m in diameter. Small ash eruptions occurred at a rate of 1-2 events per hour producing ash plumes that extended kilometers above the vent. More powerful events generated small pyroclastic flows as well as rock falls. Both the dome and upper flow area collapse frequently produced audible rock falls that could be heard from a distance of ~1.5 km. Thirty-seven (37) rockfalls were heard on 23 January; 7 of which were incandescent as hot blocks from the dome and upper flow bounced down the flank of the dome.
Geologic Background. Symmetrical, forest-covered Santa María volcano is part of a chain of large stratovolcanoes that rise above the Pacific coastal plain of Guatemala. The sharp-topped, conical profile is cut on the SW flank by a 1.5-km-wide crater. The oval-shaped crater extends from just below the summit to the lower flank, and was formed during a catastrophic eruption in 1902. The renowned Plinian eruption of 1902 that devastated much of SW Guatemala followed a long repose period after construction of the large basaltic-andesite stratovolcano. The massive dacitic Santiaguito lava-dome complex has been growing at the base of the 1902 crater since 1922. Compound dome growth at Santiaguito has occurred episodically from four vents, with activity progressing E towards the most recent, Caliente. Dome growth has been accompanied by almost continuous minor explosions, with periodic lava extrusion, larger explosions, pyroclastic flows, and lahars.
Information Contacts: Eddie Sánchez and Otoniel Matías, Instituto Nacional de Sismología, Vulcanología, Meteorología e Hydrología (INSIVUMEH), Ministerio de Communicaciones, Transporte y Obras Publicas, 7A Avenida 14-57, Zona 13, Guatemala City, Guatemala; Andy Harris and Luke Flynn, IGP/SOEST, University of Hawai'i, 2525 Correa Road, Honolulu, HI 96822, USA; Bill Rose, Department of Geological Engineering and Sciences, Michigan Technological University, Houghton, MI 49931, USA; James Vallance, Department of Civil Engineering and Applied Mechanics, McGill University, Montreal, Quebec H3A 2K6, Canada; Edouard Gegout, c/o European Volcanological Society, C.P.1-1211 Geneva 17, Switzerland.
Sheveluch
Russia
56.653°N, 161.36°E; summit elev. 3283 m
All times are local (unless otherwise noted)
Short-lived explosive eruptions 30 June-3 July
During June-July 2000 seismicity was generally at background levels with occasional weak fumarolic activity; the hazard level was Green. However at 0447 on 30 June, visual reports indicated a short-lived explosive eruption and an ash-gas plume that rose to about 8 km altitude; in response, the hazard status was raised to Yellow. Similar reports indicated that a short-lived explosive eruption at 1644 on 1 July sent and an ash-gas plume to ~6 km altitude. The mushroom-shaped plume extended to the W and at 2034, satellite imagery showed the arched plume extending 70 km NW. At 1728 on 1 July seismic data indicated a less intensive short-lived explosion, and on 2 July several weak explosions occurred and a gas-steam plume rose 300-700 m extending 3-5 km to the W and E. On 3 July seismicity under the volcano returned to background levels and the hazard status was reduced to Green.
Geologic Background. The high, isolated massif of Sheveluch volcano (also spelled Shiveluch) rises above the lowlands NNE of the Kliuchevskaya volcano group. The 1,300 km3 andesitic volcano is one of Kamchatka's largest and most active volcanic structures, with at least 60 large eruptions during the Holocene. The summit of roughly 65,000-year-old Stary Shiveluch is truncated by a broad 9-km-wide late-Pleistocene caldera breached to the south. Many lava domes occur on its outer flanks. The Molodoy Shiveluch lava dome complex was constructed during the Holocene within the large open caldera; Holocene lava dome extrusion also took place on the flanks of Stary Shiveluch. Widespread tephra layers from these eruptions have provided valuable time markers for dating volcanic events in Kamchatka. Frequent collapses of dome complexes, most recently in 1964, have produced debris avalanches whose deposits cover much of the floor of the breached caldera.
Information Contacts: Olga Chubarova, Kamchatka Volcanic Eruptions Response Team (KVERT), Institute of Volcanic Geology and Geochemistry, Piip Ave. 9, Petropavlovsk-Kamchatsky, 683006, Russia; Tom Miller, Alaska Volcano Observatory (AVO), U.S. Geological Survey, 4200 University Drive, Anchorage, AK 99508, USA (URL: http://www.avo.alaska.edu/).
Soputan
Indonesia
1.112°N, 124.737°E; summit elev. 1785 m
All times are local (unless otherwise noted)
During May-July 2000, continued dome growth, lava flows, and several explosions
This report covers the period of 1 May to 3 July 2000. Tiltmeter readings from 1-3 May showed a decrease in both the x-axis (25 µrad) and y-axis (40 µrad on the SW side of the summit, indicating deformation due to magma rising towards the surface. Magma continued to rise, but there was no increase in earthquakes registered at the Soputan Post Observatory (SPO) in Maliku. Nevertheless, seismic data from both satellite-telemetered and SPO's instruments contained an increasing trend in cumulative energy that could have been the result of tectonic earthquakes. A 5 May MR 6.5 earthquake in Banggai, ~325 km SW of Soputan, is thought to have been a precursor to a 13 May eruption.
At 1250 on 13 May, an eruption began with the ejection of incandescent materials and the emission of a thick, black ash cloud that rose 1,000 m above the summit and drifted NE. There were reports of ashfall up to 2 cm thick in the towns of Malompar and Tombatu, ~9 km S of the summit.
In the weeks following this event, seismicity remained elevated, with tectonic earthquakes dominating activity. Sporadic emissions of thin, white ash-and-steam plumes rose up to 100 m, but no explosions were reported. By 22 June, scientists were reporting several small explosions and avalanches, as well as a significant increase in the number of volcanic tremors and avalanche earthquakes.
At 1200 on 1 July, continuous tremor earthquakes reached amplitudes of 20-50 mm. Later that day, at 2232, two loud booms were heard and at 2255, lava was seen flowing up to 200 m to the W of Soputan's summit, covering over 13-14 May lava flows. Lightning was also seen around the crater and the rising plume. At 0200 on 2 July, Strombolian lava fountains were seen spewing lava 10-50 m above the crater. Later in the day, a thick gray ash plume was seen as it reached ~1,000 m altitude and slowly changed color to a dark brown. The volcano continued to produce ash plumes and persistent booming that indicated explosions were taking place although they could not be seen. The number of earthquakes reached over 100 events per day, indicating that lava dome growth continued. Observations made at both SPO and the Lokon Post Observatory, ~30 km N in Tomohon, gave the government reason to have concern for inhabitants' safety and, on 3 July, the alert level was raised from 2 to 3 (on a scale of 4).
Geologic Background. The Soputan stratovolcano on the southern rim of the Quaternary Tondano caldera on the northern arm of Sulawesi Island is one of Sulawesi's most active volcanoes. The youthful, largely unvegetated volcano is the only active cone in the Sempu-Soputan volcanic complex, which includes the Soputan caldera, Rindengan, and Manimporok (3.5 km ESE). Kawah Masem maar was formed in the W part of the caldera and contains a crater lake; sulfur has been extracted from fumarolic areas in the maar since 1938. Recent eruptions have originated at both the summit crater and Aeseput, a prominent NE-flank vent that formed in 1906 and was the source of intermittent major lava flows until 1924.
Information Contacts: Dali Ahmad, Volcanological Survey of Indonesia (VSI), Jalan Diponegoro No. 57, Bandung 40122, Indonesia (URL: http://www.vsi.esdm.go.id/).
Soufriere Hills (United Kingdom) — June 2000 Cite this Report
Soufriere Hills
United Kingdom
16.72°N, 62.18°W; summit elev. 915 m
All times are local (unless otherwise noted)
Dome growth continues, reaches 950 m high during May-July 2000
This report covers activity from 26 May to 21 July 2000. During this interval, the lava dome continued to grow; however, between 26 May and 2 June, the direction of the dome's growth changed. Although it continued to grow vertically, the majority of growth appears to have redirected from the E and NE to the S and possibly the W.
Visual observations were severely limited due to clouds throughout the early part of this period. However, during the week of 23-30 June a "rough, spiny area" appeared high on the E face of the dome at the top of the Tar River Valley. The week of 9-16 June, the dome grew to about 914 m. By 25 June, the dome had surpassed the height attained prior to the 20 March 2000 collapse. During this event, instruments for measuring dome volume were damaged. Observations from 30 June through 7 July showed that the area of dome growth had changed to a more slab-like appearance. A new area of spiny growth was first seen on 10 July. This growth appeared on the NE flank at 940 m elevation, which was thought to be the highest point on the dome. On 17 July, a large area of new growth was reported on the S and W sectors of the dome, attaining a height of 950 m.
Pyroclastic flows were reported to the ENE in the Tar River, between 9 and 16 June. The following week, pyroclastic flows were reported in the Gages valley to the W. Additional pyroclastic flows during the week of 7 July went NE into the upper Tar valley; some, if not all, of the flow material originated from the remains of the 1995-98 dome. On 21 July at 0620, there was a small pyroclastic flow with an explosive start. During an observation flight later that day, evidence of pyroclastic flows was observed to the SW in the upper region of the White River valley.
Rockfalls occurred throughout the reporting period (table 34). However, the week of 23 to 30 June was characterized by nearly constant rockfalls and small pyroclastic flows. These rockfalls were concentrated on the E side of the dome and talus accumulated much more slowly to the S above the White River. Prior to this, during the week of 9 to 16 June, the rockfalls occurred almost exclusively in the Tar River valley. During 30 June to 14 July, rockfalls occurring to the E of the dome were infrequent despite the presence of large blocks at the top of the steep E slope. The majority of the rockfall events at this point were occurring to the S and to the W of the dome.
Table 34. Seismic data for Soufriere Hills during 26 May-21 July 2000. Courtesy of MVO.
| Week |
Rockfall signals |
Hybrid |
Volcano-tectonic |
Long-period |
Total |
| 26 May-02 Jun 2000 |
131 |
54 |
3 |
2 |
190 |
| 02 Jun-09 Jun 2000 |
243 |
172 |
1 |
78 |
494 |
| 09 Jun-16 Jun 2000 |
326 |
49 |
1 |
76 |
452 |
| 16 Jun-23 Jun 2000 |
147 |
11 |
1 |
77 |
236 |
| 23 Jun-30 Jun 2000 |
315 |
4 |
4 |
157 |
480 |
| 30 Jun-07 Jul 2000 |
264 |
47 |
1 |
114 |
426 |
| 07 Jul-14 Jul 2000 |
131 |
103 |
5 |
68 |
307 |
| 14 Jul-21 Jul 2000 |
189 |
24 |
4 |
15 |
232 |
Seismic records (table 1) revealed a sharp increase in the number of long-period (LP) earthquakes after 2 June. The frequency of LP events continued to increase until its peak during 23-30 June. This same week marked the low point in the number of hybrid earthquakes. The number of volcano-tectonic earthquakes increased towards the end of the reporting period.
A steady production of ash during the week of 9-16 June maintained a dilute ash plume that moved W towards Plymouth and off the coast. Neither this ash plume nor the smaller ash clouds produced by rockfalls during the preceding weeks affected the inhabited parts of the island. During the week of 30 June to 7 July, abundant steaming was observed on the W flanks of the dome. The following week, steaming occurred on the N side between the main masses of the old dome. During this same week, ash venting was also observed from the S side of the dome.
The sharp increase in the number of LP and hybrid earthquakes after 2 June was taken to indicate increasing pressure in the dome. In addition, the dome's filling in of the crater on all sides suggests that rockfalls and pyroclastic flows will increase in the future. These events are expected to affect not only the Tar River valley, but also several other surrounding valleys, particularly Tuitt's Ghaut, White River valley, and Gages valley. These observations also lead to increased concern over the possibility of a substantial dome collapse in the near future.
Geologic Background. The complex, dominantly andesitic Soufrière Hills volcano occupies the southern half of the island of Montserrat. The summit area consists primarily of a series of lava domes emplaced along an ESE-trending zone. The volcano is flanked by Pleistocene complexes to the north and south. English's Crater, a 1-km-wide crater breached widely to the east by edifice collapse, was formed about 2000 years ago as a result of the youngest of several collapse events producing submarine debris-avalanche deposits. Block-and-ash flow and surge deposits associated with dome growth predominate in flank deposits, including those from an eruption that likely preceded the 1632 CE settlement of the island, allowing cultivation on recently devegetated land to near the summit. Non-eruptive seismic swarms occurred at 30-year intervals in the 20th century, but no historical eruptions were recorded until 1995. Long-term small-to-moderate ash eruptions beginning in that year were later accompanied by lava-dome growth and pyroclastic flows that forced evacuation of the southern half of the island and ultimately destroyed the capital city of Plymouth, causing major social and economic disruption.
Information Contacts: Montserrat Volcano Observatory (MVO), Mongo Hill, Montserrat, West Indies (URL: http://www.mvomrat.com/).
Toya
Japan
42.544°N, 140.839°E; summit elev. 733 m
All times are local (unless otherwise noted)
Eruption decreasing in intensity; precursors to 31 March eruption
Usu's multi-vent NW-flank eruption that began on 31 March 2000 continued until at least 10 July (see previous report and map in BGVN 25:03). By 10 July the eruption had lost considerable vigor. The last noteworthy ash fall took place on 6 April; a small one occurred on 7 April. Several excellent reports were published rapidly by the Geological Survey of Hokkaido (GSH, 2000a, b). This article provides a summary of those Japanese-language reports as well as excerpts from a formal statement discussing Usu's behavior through 10 July. Satellite imagery also provided ashfall data. The active dome and associated vent group was incorrectly spelled "Konpira-yama" in previous Bulletin reports. According to formal rules of translation this name should be "Kompira-yama."
Prior to the eruption, geological mapping and bore holes had delineated portions of Usu's edifice and surrounding subsurface, enabling workers to draw a generalized cross section (figure 22). In addition to these background studies, as Usu entered an eruptive phase on 31 March a comprehensive suite of monitoring instruments were in place.
Four days prior to the eruption, groundwater levels in instrumented wells (the potentiometric surface) around the volcano began to change (figure 23). A day or two later, these perturbations escalated rapidly. Data from five wells (figure 23) show that at least four underwent roughly synchronous offsets that grew to reach the 2- to 10-m range. These dramatic offsets were inferred to have been driven by the influx of magma. Also, water temperatures increased at hot springs. The level of the groundwater surface in the instrumented wells peaked near the time the eruption started. For the wells with post-eruptive data on figure 23, the groundwater surface began a comparatively gradual steady decrease soon after the eruption started. Ancillary details on well locations and behavior appear in the cited reports.
Global Positioning System (GPS) data helped predict the 31 March eruption. GPS station KMK is near Hokkaido's N coast and ~7 km E of Usu's active vent groups. KMK was compared with three other stations near Usu beginning around 30 March (figure 24). The comparison revealed large vertical motions-tens of centimeters per day- including some beginning on 29 March (not shown). Figure 24 shows how the rates of vertical motion declined in early April at all three close-in stations. The reports also noted horizontal motions measuring tens of centimeters per day.
Clear precursory seismicity appeared at Usu (figure 25). The maxima, ~150 earthquakes in a 2-hour interval (i.e., ~75 earthquakes/hour), occurred ~1 day prior to the eruption. The eruptive pulses on 1 April took place during an interval with comparatively low seismicity.
Figure 26 provides a graphical summary of the episode's eight modest but identifiable ash falls. Most of the ash blew E, but an eruption on 1 April blew SE and one on 4 April blew N. GSH (2000a) features a time line for the two vent groups in eruption, graphically portraying 31 March-7 April plume observation. Figure 27 presents a sample of this larger time line: the portion for 1 April 2000. Figures such as this provide a particularly apt summary of complex phenomena.
Committee's announcement. The Usu eruption committee chaired byYoshiaki Ida made a formal announcement on 10 July. They noted that on this date Usu's phreatic eruption continued at the Kompira-yama and western Nishi-yama vent groups, but the supply of magma from depth had almost ceased. Accordingly, they anticipated a gradual decrease in volcanism.
The committee indicated that the current eruption occurred due to upward movement of magma from depths of ~10 km reaching a shallow reservoir around 4-5 km. Portions of the shallow reservoir traveled NW and then to the vents where magma escaped. The committee noted that on 10 July uplift still continued at western Nishi-yama (~5 cm/day) but that its areal extent and rate were decreasing. The committee noted that by 10 July small faults associated with the eruption ceased moving. They appeared as visible fault traces cutting across roads and other infrastructure (see photos in GSH, 2000a, b).
The committee also noted that the early phases of the eruption had ejected portions of juvenile material, whereas by 10 July the eruptions mainly discharged steam. Similarly, with time, cloud height and explosive vigor decreased. On 10 July Nishi-yama still gave off intermittent weak ash; Kompira-yama still emitted loud blasts with glowing volcanic rocks. But by this time such activities had decreased and ballistic bombs continued to fall several hundred meters from the Kompira-yama vent group. Earthquakes continued on the SW flank of Usu, but by 10 July they became increasingly scarce. The committee suggested a pyroclastic surge was unlikely in the near future .
Satellite imagery. A satellite image from 3 April shows Usu's ash blanketing parts of the largely snow-covered landscape (figure 28). The image caption states that the team planned to image Usu every 3-4 days. The images were captured on ASTER (The Advanced Spaceborne Thermal Emission and Reflection Radiometer), a Japanese-built instrument that obtains high-resolution (15-90 m2/pixel) images at 14 wavelengths from visible to thermal infrared. ASTER registers land surface temperature, emissivity, reflectance, and elevation; it flies on the Terra platform where it serves as a zoom lens for the other Terra instruments. ASTER has the ability to change viewing angles, enabling it to make stereoscopic images and detailed terrain height models. NASA terms the Terra satellite the flagship of the EOS mission. The latter is an effort to better understand planet Earth's atmosphere, land, and oceans, as well as their interactions with solar radiation and with one another.
References. Geological Survey of Hokkaido (GSH), 2000a, Observations of Usu's volcanic eruption, 2000, Preliminary Report (in Japanese), 53 p. (in color on the GSH website and available as a 47 M file.
Geological Survey of Hokkaido (GSH), 2000b, Usu eruption in 2000, GSH News, 2000, 5, vol. 16, (ISSN 1345-1138), (text and captions in Japanese), 4 p. (1 additional sheet with 8 color plates)
Geologic Background. Usuzan, one of Hokkaido's most well-known volcanoes, is a small stratovolcano located astride the southern topographic rim of the 110,000-year-old Toya caldera. The center of the 10-km-wide, lake-filled caldera contains Nakajima, a group of forested Pleistocene andesitic lava domes. The summit of the basaltic-to-andesitic edifice of Usu is cut by a somma formed about 20-30,000 years ago when collapse of the volcano produced a debris avalanche that reached the sea. Dacitic domes erupted along two NW-SE-trending lines fill and flank the summit caldera. Three of these domes, O-Usu, Ko-Usu and Showashinzan, along with seven crypto-domes, were erupted during historical time. The 1663 eruption of Usu was one of the largest in Hokkaido during historical time. The war-time growth of Showashinzan from 1943-45 was painstakingly documented by the local postmaster, who created the first detailed record of growth of a lava dome.
Information Contacts: Masahiro Yahata, Geological Survey of Hokkaido, Kita 19, Nishi 12, Kita-Ku, Sapporo, 060-0819, Japan; Yoshiaki Ida, University of Tokyo, Earthquake Research Institute, Yayoi 1-1-1 Bunkyo-Ku, Tokyo 113, Japan; NASA Terra Project, NASA Goddard SFC, MC 613, Greenbelt, MD 20771 USA (URL: https://terra.nasa.gov/); Yasushi Yamaguchi, Japan Outreach Center for ASTER, Nagoya University, Earth & Planetary Sci Dept/Faculty Sci, Furou-cho Chikusa-ku, Nagoya 464-01; Usu Volcano Observatory, Institute of Seismology and Volcanology, Graduate School of Science, Hokkaido University, Sohbetsu-cho, Usu-gun, Hokkaido, 052-0103, Japan (URL: http://www.sci.hokudai.ac.jp/isv/english/).