Recently Published Bulletin Reports
Manam (Papua New Guinea) Few ash plumes during November-December 2022
Krakatau (Indonesia) Strombolian activity and ash plumes during November 2022-April 2023
Stromboli (Italy) Strombolian explosions and lava flows continue during January-April 2023
Nishinoshima (Japan) Small ash plumes and fumarolic activity during November 2022 through April 2023
Karangetang (Indonesia) Lava flows, incandescent avalanches, and ash plumes during January-June 2023
Ahyi (United States) Intermittent hydroacoustic signals and discolored plumes during November 2022-June 2023
Kadovar (Papua New Guinea) An ash plume and weak thermal anomaly during May 2023
San Miguel (El Salvador) Small gas-and-ash explosions during March and May 2023
Semisopochnoi (United States) Occasional explosions, ash deposits, and gas-and-steam plumes during December 2022-May 2023
Ebeko (Russia) Continued explosions, ash plumes, and ashfall during October 2022-May 2023
Home Reef (Tonga) Discolored plumes continued during November 2022-April 2023
Ambae (Vanuatu) New lava flow, ash plumes, and sulfur dioxide plumes during February-May 2023
Manam (Papua New Guinea) — July 2023  Cite this Report
Manam
Papua New Guinea
4.08°S, 145.037°E; summit elev. 1807 m
All times are local (unless otherwise noted)
Few ash plumes during November-December 2022
Manam is a 10-km-wide island that consists of two active summit craters: the Main summit crater and the South summit crater and is located 13 km off the northern coast of mainland Papua New Guinea. Frequent mild-to-moderate eruptions have been recorded since 1616. The current eruption period began during June 2014 and has more recently been characterized by intermittent ash plumes and thermal activity (BGVN 47:11). This report updates activity that occurred from November 2022 through May 2023 based on information from the Darwin Volcanic Ash Advisory Center (VAAC) and various satellite data.
Ash plumes were reported during November and December 2022 by the Darwin VAAC. On 7 November an ash plume rose to 2.1 km altitude and drifted NE based on satellite images and weather models. On 14 November an ash plume rose to 2.1 km altitude and drifted W based on RVO webcam images. On 20 November ash plumes rose to 1.8 km altitude and drifted NW. On 26 December an ash plume rose to 3 km altitude and drifted S and SSE.
Intermittent sulfur dioxide plumes were detected using the TROPOMI instrument on the Sentinel-5P satellite, some of which exceeded at least two Dobson Units (DU) and drifted in different directions (figure 93). Occasional low-to-moderate power thermal anomalies were recorded by the MIROVA (Middle InfraRed Observation of Volcanic Activity) system; less than five anomalies were recorded each month during November 2022 through May 2023 (figure 94). Two thermal hotspots were detected by the MODVOLC thermal alerts system on 10 December 2022. On clear weather days, thermal activity was also captured in infrared satellite imagery in both the Main and South summit craters, accompanied by gas-and-steam emissions (figure 95).
Geologic Background. The 10-km-wide island of Manam, lying 13 km off the northern coast of mainland Papua New Guinea, is one of the country's most active volcanoes. Four large radial valleys extend from the unvegetated summit of the conical basaltic-andesitic stratovolcano to its lower flanks. These valleys channel lava flows and pyroclastic avalanches that have sometimes reached the coast. Five small satellitic centers are located near the island's shoreline on the northern, southern, and western sides. Two summit craters are present; both are active, although most observed eruptions have originated from the southern crater, concentrating eruptive products during much of the past century into the SE valley. Frequent eruptions, typically of mild-to-moderate scale, have been recorded since 1616. Occasional larger eruptions have produced pyroclastic flows and lava flows that reached flat-lying coastal areas and entered the sea, sometimes impacting populated areas.
Information Contacts: Rabaul Volcano Observatory (RVO), Geohazards Management Division, Department of Mineral Policy and Geohazards Management (DMPGM), PO Box 3386, Kokopo, East New Britain Province, Papua New Guinea; Darwin Volcanic Ash Advisory Centre (VAAC), Bureau of Meteorology, Northern Territory Regional Office, PO Box 40050, Casuarina, NT 0811, Australia (URL: http://www.bom.gov.au/info/vaac/); MIROVA (Middle InfraRed Observation of Volcanic Activity), a collaborative project between the Universities of Turin and Florence (Italy) supported by the Centre for Volcanic Risk of the Italian Civil Protection Department (URL: http://www.mirovaweb.it/); Hawai'i Institute of Geophysics and Planetology (HIGP) - MODVOLC Thermal Alerts System, School of Ocean and Earth Science and Technology (SOEST), Univ. of Hawai'i, 2525 Correa Road, Honolulu, HI 96822, USA (URL: http://modis.higp.hawaii.edu/); NASA Global Sulfur Dioxide Monitoring Page, Atmospheric Chemistry and Dynamics Laboratory, NASA Goddard Space Flight Center (NASA/GSFC), 8800 Greenbelt Road, Goddard, Maryland, USA (URL: https://so2.gsfc.nasa.gov/); Copernicus Browser, Copernicus Data Space Ecosystem, European Space Agency (URL: https://dataspace.copernicus.eu/browser/).
Krakatau (Indonesia) — July 2023 Cite this Report
Krakatau
Indonesia
6.1009°S, 105.4233°E; summit elev. 285 m
All times are local (unless otherwise noted)
Strombolian activity and ash plumes during November 2022-April 2023
Krakatau is located in the Sunda Strait between Java and Sumatra, Indonesia. Caldera collapse during the catastrophic 1883 eruption destroyed Danan and Perbuwatan cones and left only a remnant of Rakata. The post-collapse cone of Anak Krakatau (Child of Krakatau) was constructed within the 1883 caldera at a point between the former Danan and Perbuwatan cones; it has been the site of frequent eruptions since 1927. The current eruption period began in May 2021 and has recently consisted of explosions, ash plumes, and thermal activity (BGVN 47:11). This report covers activity during November 2022 through April 2023 based on information provided by the Indonesian Center for Volcanology and Geological Hazard Mitigation, referred to as Pusat Vulkanologi dan Mitigasi Bencana Geologi (PVMBG), MAGMA Indonesia, the Darwin Volcanic Ash Advisory Center (VAAC), and several sources of satellite data.
Activity was relatively low during November and December 2022. Daily white gas-and-steam plumes rose 25-100 m above the summit and drifted in different directions. Gray ash plumes rose 200 m above the summit and drifted NE at 1047 and at 2343 on 11 November. On 14 November at 0933 ash plumes rose 300 m above the summit and drifted E. An ash plume was reported at 0935 on 15 December that rose 100 m above the summit and drifted NE. An eruptive event at 1031 later that day generated an ash plume that rose 700 m above the summit and drifted NE. A gray ash plume at 1910 rose 100 m above the summit and drifted E. Incandescent material was ejected above the vent based on an image taken at 1936.
During January 2023 daily white gas-and-steam plumes rose 25-300 m above the summit and drifted in multiple directions. Gray-to-brown ash plumes were reported at 1638 on 3 January, at 1410 and 1509 on 4 January, and at 0013 on 5 January that rose 100-750 m above the summit and drifted NE and E; the gray-to-black ash plume at 1509 on 4 January rose as high as 3 km above the summit and drifted E. Gray ash plumes were recorded at 1754, 2241, and 2325 on 11 January and at 0046 on 12 January and rose 200-300 m above the summit and drifted NE. Toward the end of January, PVMBG reported that activity had intensified; Strombolian activity was visible in webcam images taken at 0041, 0043, and 0450 on 23 January. Multiple gray ash plumes throughout the day rose 200-500 m above the summit and drifted E and SE (figure 135). Webcam images showed progressively intensifying Strombolian activity at 1919, 1958, and 2113 on 24 January; a gray ash plume at 1957 rose 300 m above the summit and drifted E (figure 135). Eruptive events at 0231 and 2256 on 25 January and at 0003 on 26 January ejected incandescent material from the vent, based on webcam images. Gray ash plumes observed during 26-27 January rose 300-500 m above the summit and drifted NE, E, and SE.
Low levels of activity were reported during February and March. Daily white gas-and-steam plumes rose 25-300 m above the summit and drifted in different directions. The Darwin VAAC reported that continuous ash emissions rose to 1.5-1.8 km altitude and drifted W and NW during 1240-1300 on 10 March, based on satellite images, weather models, and PVMBG webcams. White-and-gray ash plumes rose 500 m and 300 m above the summit and drifted SW at 1446 and 1846 on 18 March, respectively. An eruptive event was recorded at 2143, though it was not visible due to darkness. Multiple ash plumes were reported during 27-29 March that rose as high as 2.5 km above the summit and drifted NE, W, and SW (figure 136). Webcam images captured incandescent ejecta above the vent at 0415 and around the summit area at 2003 on 28 March and at 0047 above the vent on 29 March.
Daily white gas-and-steam plumes rose 25-300 m above the summit and drifted in multiple directions during April and May. White-and-gray and black plumes rose 50-300 m above the summit on 2 and 9 April. On 11 May at 1241 a gray ash plume rose 1-3 km above the summit and drifted SW. On 12 May at 0920 a gray ash plume rose 2.5 km above the summit and drifted SW and at 2320 an ash plume rose 1.5 km above the summit and drifted SW. An accompanying webcam image showed incandescent ejecta. On 13 May at 0710 a gray ash plume rose 2 km above the summit and drifted SW (figure 137).
The MIROVA (Middle InfraRed Observation of Volcanic Activity) graph of MODIS thermal anomaly data showed intermittent low-to-moderate power thermal anomalies during November 2022 through April 2023 (figure 138). Some of this thermal activity was also visible in infrared satellite imagery at the crater, accompanied by gas-and-steam and ash plumes that drifted in different directions (figure 139).
Geologic Background. The renowned Krakatau (frequently mis-named as Krakatoa) volcano lies in the Sunda Strait between Java and Sumatra. Collapse of an older edifice, perhaps in 416 or 535 CE, formed a 7-km-wide caldera. Remnants of that volcano are preserved in Verlaten and Lang Islands; subsequently the Rakata, Danan, and Perbuwatan cones were formed, coalescing to create the pre-1883 Krakatau Island. Caldera collapse during the catastrophic 1883 eruption destroyed Danan and Perbuwatan, and left only a remnant of Rakata. This eruption caused more than 36,000 fatalities, most as a result of tsunamis that swept the adjacent coastlines of Sumatra and Java. Pyroclastic surges traveled 40 km across the Sunda Strait and reached the Sumatra coast. After a quiescence of less than a half century, the post-collapse cone of Anak Krakatau (Child of Krakatau) was constructed within the 1883 caldera at a point between the former Danan and Perbuwatan cones. Anak Krakatau has been the site of frequent eruptions since 1927.
Information Contacts: Pusat Vulkanologi dan Mitigasi Bencana Geologi (PVMBG, also known as Indonesian Center for Volcanology and Geological Hazard Mitigation, CVGHM), Jalan Diponegoro 57, Bandung 40122, Indonesia (URL: http://www.vsi.esdm.go.id/); MAGMA Indonesia, Kementerian Energi dan Sumber Daya Mineral (URL: https://magma.esdm.go.id/v1); Darwin Volcanic Ash Advisory Centre (VAAC), Bureau of Meteorology, Northern Territory Regional Office, PO Box 40050, Casuarina, NT 0811, Australia (URL: http://www.bom.gov.au/info/vaac/); MIROVA (Middle InfraRed Observation of Volcanic Activity), a collaborative project between the Universities of Turin and Florence (Italy) supported by the Centre for Volcanic Risk of the Italian Civil Protection Department (URL: http://www.mirovaweb.it/); Copernicus Browser, Copernicus Data Space Ecosystem, European Space Agency (URL: https://dataspace.copernicus.eu/browser/).
Stromboli
Italy
38.789°N, 15.213°E; summit elev. 924 m
All times are local (unless otherwise noted)
Strombolian explosions and lava flows continue during January-April 2023
Stromboli, located in Italy, has exhibited nearly constant lava fountains for the past 2,000 years; recorded eruptions date back to 350 BCE. Eruptive activity occurs at the summit from multiple vents, which include a north crater area (N area) and a central-southern crater (CS area) on a terrace known as the ‘terrazza craterica’ at the head of the Sciara del Fuoco, a large scarp that runs from the summit down the NW side of the volcano-island. Activity typically consists of Strombolian explosions, incandescent ejecta, lava flows, and pyroclastic flows. Thermal and visual monitoring cameras are located on the nearby Pizzo Sopra La Fossa, above the terrazza craterica, and at multiple flank locations. The current eruption period has been ongoing since 1934 and recent activity has consisted of frequent Strombolian explosions and lava flows (BGVN 48:02). This report updates activity during January through April 2023 primarily characterized by Strombolian explosions and lava flows based on reports from Italy's Istituto Nazionale di Geofisica e Vulcanologia (INGV) and various satellite data.
Frequent explosive activity continued throughout the reporting period, generally in the low-to-medium range, based on the number of hourly explosions in the summit crater (figure 253, table 16). Intermittent thermal activity was recorded by the MIROVA (Middle InfraRed Observation of Volcanic Activity) analysis of MODIS satellite data (figure 254). According to data collected by the MODVOLC thermal algorithm, a total of 9 thermal alerts were detected: one on 2 January 2023, one on 1 February, five on 24 March, and two on 26 March. The stronger pulses of thermal activity likely reflected lava flow events. Infrared satellite imagery captured relatively strong thermal hotspots at the two active summit craters on clear weather days, showing an especially strong event on 8 March (figure 255).
Table 16. Summary of type, frequency, and intensity of explosive activity at Stromboli by month during January-April 2023; information from webcam observations. Courtesy of INGV weekly reports.
| Month |
Explosive Activity |
| Jan 2023 |
Typical Strombolian activity with spattering and lava overflows in the N crater area. Explosions were reported from 4 vents in the N area and 1-2 vents in the CS area. The average hourly frequency of explosions was low-to-medium (1-12 events/hour). The intensity of the explosions varied from low (less than 80 m high) to medium (less than 150 m high) in the N crater area and up to high (greater than 150 m high) in the CS crater area. |
| Feb 2023 |
Typical Strombolian activity with spattering in the N crater area. Explosions were reported from 2-3 vents in the N area and 1-4 vents in the CS area. The average hourly frequency of explosions was low-to-medium (1-14 events/hour). The intensity of the explosions varied from low (less than 80 m high) to medium (less than 150 m high) in the N crater area and up to high (greater than 150 m high) in the CS crater area. |
| Mar 2023 |
Typical Strombolian activity with spattering and lava overflows in the N crater area. Explosions were reported from 2-3 vents in the N area and 2-4 vents in the CS area. The average hourly frequency of explosions was low-to-medium (1-18 events/hour). The intensity of the explosions varied from low (less than 80 m high) to medium (less than 150 m high) in the N crater area and up to high (greater than 150 m high) in the CS crater area. |
| Apr 2023 |
Typical Strombolian activity. Explosions were reported from 2 vents in the N area and 2-3 vents in the CS area. The average hourly frequency of explosions was low-to-high (1-16 events/hour). The intensity of the explosions varied from low (less than 80 m high) to medium (less than 150 m high) in both the N and CS crater areas. |
Activity during January-February 2023. Strombolian explosions were reported in the N crater area, as well as lava effusion. Explosive activity in the N crater area ejected coarse material (bombs and lapilli). Intense spattering was observed in both the N1 and N2 craters. In the CS crater area, explosions generally ejected fine material (ash), sometimes to heights greater than 250 m. The intensity of the explosions was characterized as low-to-medium in the N crater and medium-to-high in the CS crater. After intense spattering activity from the N crater area, a lava overflow began at 2136 on 2 January that flowed part way down the Sciara del Fuoco, possibly moving down the drainage that formed in October, out of view from webcams. The flow remained active for a couple of hours before stopping and beginning to cool. A second lava flow was reported at 0224 on 4 January that similarly remained active for a few hours before stopping and cooling. Intense spattering was observed on 11 and 13 January from the N1 crater. After intense spattering activity at the N2 crater at 1052 on 17 January another lava flow started to flow into the upper part of the Sciara del Fuoco (figure 256), dividing into two: one that traveled in the direction of the drainage formed in October, and the other one moving parallel to the point of emission. By the afternoon, the rate of the flow began to decrease, and at 1900 it started to cool. A lava flow was reported at 1519 on 24 January following intense spattering in the N2 area, which began to flow into the upper part of the Sciara del Fuoco. By the morning of 25 January, the lava flow had begun to cool. During 27 January the frequency of eruption in the CS crater area increased to 6-7 events/hour compared to the typical 1-7 events/hour; the following two days showed a decrease in frequency to less than 1 event/hour. Starting at 1007 on 30 January a high-energy explosive sequence was produced by vents in the CS crater area. The sequence began with an initial energetic pulse that lasted 45 seconds, ejecting predominantly coarse products 300 m above the crater that fell in an ESE direction. Subsequent and less intense explosions ejected material 100 m above the crater. The total duration of this event lasted approximately two minutes. During 31 January through 6, 13, and 24 February spattering activity was particularly intense for short periods in the N2 crater.
An explosive sequence was reported on 16 February that was characterized by a major explosion in the CS crater area (figure 257). The sequence began at 1817 near the S2 crater that ejected material radially. A few seconds later, lava fountains were observed in the central part of the crater. Three explosions of medium intensity (material was ejected less than 150 m high) were recorded at the S2 crater. The first part of this sequence lasted approximately one minute, according to INGV, and material rose 300 m above the crater and then was deposited along the Sciara del Fuoco. The second phase began at 1818 at the S1 crater; it lasted seven seconds and material was ejected 150 m above the crater. Another event 20 seconds later lasted 12 seconds, also ejecting material 150 m above the crater. The sequence ended with at least three explosions of mostly fine material from the S1 crater. The total duration of this sequence was about two minutes.
Short, intense spattering activity was noted above the N1 crater on 27 and 28 February. A lava overflow was first reported at 0657 from the N2 crater on 27 February that flowed into the October 2022 drainage. By 1900 the flow had stopped. A second lava overflow also in the N crater area occurred at 2149, which overlapped the first flow and then stopped by 0150 on 28 February. Material detached from both the lava overflows rolled down the Sciara del Fuoco, some of which was visible in webcam images.
Activity during March-April 2023. Strombolian activity continued with spattering activity and lava overflows in the N crater area during March. Explosive activity at the N crater area varied from low (less than 80 m high) to medium (less than 150 m high) and ejected coarse material, such as bombs and lapilli. Spattering was observed above the N1 crater, while explosive activity at the CS crater area varied from medium to high (greater than 150 m high) and ejected coarse material. Intense spattering activity was observed for short periods on 6 March above the N1 crater. At approximately 0610 a lava overflow was reported around the N2 crater on 8 March, which then flowed into the October 2022 drainage. By 1700 the flow started to cool. A second overflow began at 1712 on 9 March and overlapped the previous flow. It had stopped by 2100. Material from both flows was deposited along the Sciara del Fuoco, though much of the activity was not visible in webcam images. On 11 March a lava overflow was observed at 0215 that overlapped the two previous flows in the October 2022 drainage. By late afternoon on 12 March, it had stopped.
During a field excursion on 16 March, scientists noted that a vent in the central crater area was degassing. Another vent showed occasional Strombolian activity that emitted ash and lapilli. During 1200-1430 low-to-medium intense activity was reported; the N1 crater emitted ash emissions and the N2 crater emitted both ash and coarse material. Some explosions also occurred in the CS crater area that ejected coarse material. The C crater in the CS crater area occasionally showed gas jetting and low intensity explosions on 17 and 22 March; no activity was observed at the S1 crater. Intense, longer periods of spattering were reported in the N1 crater on 19, 24, and 25 March. Around 2242 on 23 March a lava overflow began from the N1 crater that, after about an hour, began moving down the October 2022 drainage and flow along the Sciara del Fuoco (figure 258). Between 0200 and 0400 on 26 March the flow rate increased, which generated avalanches of material from collapses at the advancing flow front. By early afternoon, the flow began to cool. On 25 March at 1548 an explosive sequence began from one of the vents at S2 in the CS crater area (figure 258). Fine ash mixed with coarse material was ejected 300 m above the crater rim and drifted SSE. Some modest explosions around Vent C were detected at 1549 on 25 March, which included an explosion at 1551 that ejected coarse material. The entire explosive sequence lasted approximately three minutes.
During April explosions persisted in both the N and CS crater areas. Fine material was ejected less than 80 m above the N crater rim until 6 April, followed by ejection of coarser material. Fine material was also ejected less than 80 m above the CS crater rim. The C and S2 crater did not show significant eruptive activity. On 7 April an explosive sequence was detected in the CS crater area at 1203 (figure 259). The first explosion lasted approximately 18 seconds and ejected material 400 m above the crater rim, depositing pyroclastic material in the upper part of the Sciara del Fuoco. At 1204 a second, less intense explosion lasted approximately four seconds and deposited pyroclastic products outside the crater area and near Pizzo Sopra La Fossa. A third explosion at 1205 was mainly composed of ash that rose about 150 m above the crater and lasted roughly 20 seconds. A fourth explosion occurred at 1205 about 28 seconds after the third explosion and ejected a mixture of coarse and fine material about 200 m above the crater; the explosion lasted roughly seven seconds. Overall, the entire explosive sequence lasted about two minutes and 20 seconds. After the explosive sequence on 7 April, explosions in both the N and CS crater areas ejected material as high as 150 m above the crater.
On 21 April research scientists from INGV made field observations in the summit area of Stromboli, and some lapilli samples were collected. In the N crater area near the N1 crater, a small cone was observed with at least two active vents, one of which was characterized by Strombolian explosions. The other vent produced explosions that ejected ash and chunks of cooled lava. At the N2 crater at least one vent was active and frequently emitted ash. In the CS crater area, a small cone contained 2-3 degassing vents and a smaller, possible fissure area also showed signs of degassing close to the Pizzo Sopra La Fossa. In the S part of the crater, three vents were active: a small hornito was characterized by modest and rare explosions, a vent that intermittently produced weak Strombolian explosions, and a vent at the end of the terrace that produced frequent ash emissions. Near the S1 crater there was a hornito that generally emitted weak gas-and-steam emissions, sometimes associated with “gas rings”. On 22 April another field inspection was carried out that reported two large sliding surfaces on the Sciara del Fuoco that showed where blocks frequently descended toward the sea. A thermal anomaly was detected at 0150 on 29 April.
Geologic Background. Spectacular incandescent nighttime explosions at Stromboli have long attracted visitors to the "Lighthouse of the Mediterranean" in the NE Aeolian Islands. This volcano has lent its name to the frequent mild explosive activity that has characterized its eruptions throughout much of historical time. The small island is the emergent summit of a volcano that grew in two main eruptive cycles, the last of which formed the western portion of the island. The Neostromboli eruptive period took place between about 13,000 and 5,000 years ago. The active summit vents are located at the head of the Sciara del Fuoco, a prominent scarp that formed about 5,000 years ago due to a series of slope failures which extends to below sea level. The modern volcano has been constructed within this scarp, which funnels pyroclastic ejecta and lava flows to the NW. Essentially continuous mild Strombolian explosions, sometimes accompanied by lava flows, have been recorded for more than a millennium.
Information Contacts: Istituto Nazionale di Geofisica e Vulcanologia (INGV), Sezione di Catania, Piazza Roma 2, 95123 Catania, Italy, (URL: http://www.ct.ingv.it/en/); MIROVA (Middle InfraRed Observation of Volcanic Activity), a collaborative project between the Universities of Turin and Florence (Italy) supported by the Centre for Volcanic Risk of the Italian Civil Protection Department (URL: http://www.mirovaweb.it/); Hawai'i Institute of Geophysics and Planetology (HIGP) - MODVOLC Thermal Alerts System, School of Ocean and Earth Science and Technology (SOEST), Univ. of Hawai'i, 2525 Correa Road, Honolulu, HI 96822, USA (URL: http://modis.higp.hawaii.edu/); Copernicus Browser, Copernicus Data Space Ecosystem, European Space Agency (URL: https://dataspace.copernicus.eu/browser/).
Nishinoshima (Japan) — July 2023 Cite this Report
Nishinoshima
Japan
27.247°N, 140.874°E; summit elev. 100 m
All times are local (unless otherwise noted)
Small ash plumes and fumarolic activity during November 2022 through April 2023
Nishinoshima is a small island located about 1,000 km S of Tokyo in the Ogasawara Arc in Japan. The island is the summit of a massive submarine volcano that has prominent peaks to the S, W, and NE. Eruptions date back to 1973; the most recent eruption period began in October 2022 and was characterized by ash plumes and fumarolic activity (BGVN 47:12). This report describes ash plumes and fumarolic activity during November 2022 through April 2023 based on monthly reports from the Japan Meteorological Agency (JMA) monthly reports and satellite data.
The most recent eruptive activity prior to the reporting internal occurred on 12 October 2022, when an ash plume rose 3.5 km above the crater rim. An aerial observation conducted by the Japan Coast Guard (JCG) on 25 November reported that white fumaroles rose approximately 200 m above the central crater of a pyroclastic cone (figure 119), and multiple plumes were observed on the ESE flank of the cone. Discolored water ranging from reddish-brown to brown and yellowish-green were visible around the perimeter of the island (figure 119). No significant activity was reported in December.
During an overflight conducted by JCG on 25 January 2023 intermittent activity and small, blackish-gray plumes rose 900 m above the central part of the crater were observed (figure 120). The fumarolic zone of the E flank and base of the cone had expanded and emissions had intensified. Dark brown discolored water was visible around the perimeter of the island.
No significant activity was reported during February through March. Ash plumes at 1050 and 1420 on 11 April rose 1.9 km above the crater rim and drifted NW and N. These were the first ash plumes observed since 12 October 2022. On 14 April JCG carried out an overflight and reported that no further eruptive activity was visible, although white gas-and-steam plumes were visible from the central crater and rose 900 m high (figure 121). Brownish and yellow-green discolored water surrounded the island.
Intermittent low-to-moderate power thermal anomalies were recorded in the MIROVA graph (Middle InfraRed Observation of Volcanic Activity) during November 2022 through April 2023 (figure 123). A cluster of six to eight anomalies were detected during November while a smaller number were detected during the following months: two to three during December, one during mid-January 2023, one during February, five during March, and two during April. Thermal activity was also reflected in infrared satellite data at the summit crater, accompanied by occasional gas-and-steam plumes (figure 124).
Geologic Background. The small island of Nishinoshima was enlarged when several new islands coalesced during an eruption in 1973-74. Multiple eruptions that began in 2013 completely covered the previous exposed surface and continued to enlarge the island. The island is the summit of a massive submarine volcano that has prominent peaks to the S, W, and NE. The summit of the southern cone rises to within 214 m of the ocean surface 9 km SSE.
Information Contacts: Japan Meteorological Agency (JMA), 1-3-4 Otemachi, Chiyoda-ku, Tokyo 100-8122, Japan (URL: http://www.jma.go.jp/jma/indexe.html); MIROVA (Middle InfraRed Observation of Volcanic Activity), a collaborative project between the Universities of Turin and Florence (Italy) supported by the Centre for Volcanic Risk of the Italian Civil Protection Department (URL: http://www.mirovaweb.it/); Copernicus Browser, Copernicus Data Space Ecosystem, European Space Agency (URL: https://dataspace.copernicus.eu/browser/).
Karangetang (Indonesia) — July 2023 Cite this Report
Karangetang
Indonesia
2.781°N, 125.407°E; summit elev. 1797 m
All times are local (unless otherwise noted)
Lava flows, incandescent avalanches, and ash plumes during January-June 2023
Karangetang (also known as Api Siau), at the northern end of the island of Siau, Indonesia, contains five summit craters along a N-S line. More than 40 eruptions have been recorded since 1675; recent eruptions have included frequent explosive activity, sometimes accompanied by pyroclastic flows and lahars. Lava dome growth has occurred in the summit craters and collapses of lava flow fronts have produced pyroclastic flows. The two active summit craters are Kawah Dua (the N crater) and Kawah Utama (the S crater, also referred to as the “Main Crater”). The most recent eruption began in late November 2018 and has more recently consisted of weak thermal activity and gas-and-steam emissions (BGVN 48:01). This report updates activity characterized by lava flows, incandescent avalanches, and ash plumes during January through June 2023 using reports from Pusat Vulkanologi dan Mitigasi Bencana Geologi (PVMBG, also known as CVGHM, or the Center of Volcanology and Geological Hazard Mitigation), MAGMA Indonesia, the Darwin VAAC (Volcano Ash Advisory Center), and satellite data.
Activity during January was relatively low and mainly consisted of white gas-and-steam emissions that rose 25-150 m above Main Crater (S crater) and drifted in different directions. Incandescence was visible from the lava dome in Kawah Dua (the N crater). Weather conditions often prevented clear views of the summit. On 18 January the number of seismic signals that indicated avalanches of material began to increase. In addition, there were a total of 71 earthquakes detected during the month.
Activity continued to increase during the first week of February. Material from Main Crater traveled as far as 800 m down the Batuawang (S) and Batang (W) drainages and as far as 1 km W down the Beha (W) drainage on 4 February. On 6 February 43 earthquake events were recorded, and on 7 February, 62 events were recorded. White gas-and-steam emissions rose 25-250 m above both summit craters throughout the month. PVMBG reported an eruption began during the evening of 8 February around 1700. Photos showed incandescent material at Main Crater. Incandescent material had also descended the flank in at least two unconfirmed directions as far as 2 km from Main Crater, accompanied by ash plumes (figure 60). As a result, PVMBG increased the Volcano Alert Level (VAL) to 3 (the second highest level on a 1-4 scale).
Occasional nighttime webcam images showed three main incandescent lava flows of differing lengths traveling down the S, SW, and W flanks (figure 61). Incandescent rocks were visible on the upper flanks, possibly from ejected or collapsed material from the crater, and incandescence was the most intense at the summit. Based on analyses of satellite imagery and weather models, the Darwin VAAC reported that daily ash plumes during 16-20 February rose to 2.1-3 km altitude and drifted NNE, E, and SE. BNPB reported on 16 February that as many as 77 people were evacuated and relocated to the East Siau Museum. A webcam image taken at 2156 on 17 February possibly showed incandescent material descending the SE flank. Ash plumes rose to 2.1 km altitude and drifted SE during 22-23 February, according to the Darwin VAAC.
Incandescent avalanches of material and summit incandescence at Main Crater continued during March. White gas-and-steam emissions during March generally rose 25-150 m above the summit crater; on 31 March gas-and-steam emissions rose 200-400 m high. An ash plume rose to 2.4 km altitude and drifted S at 1710 on 9 March and a large thermal anomaly was visible in images taken at 0550 and 0930 on 10 March. Incandescent material was visible at the summit and on the flanks based on webcam images taken at 0007 and 2345 on 16 March, at 1828 on 17 March, at 1940 on 18 March, at 2311 on 19 March, and at 2351 on 20 March. Incandescence was most intense on 18 and 20 March and webcam images showed possible Strombolian explosions (figure 62). An ash plume rose to 2.4 km altitude and drifted SW on 18 March, accompanied by a thermal anomaly.
Summit crater incandescence at Main Crater and on the flanks persisted during April. Incandescent material at the S crater and on the flanks was reported at 0016 on 1 April. The lava flows had stopped by 1 April according to PVMBG, although incandescence was still visible up to 10 m high. Seismic signals indicating effusion decreased and by 6 April they were no longer detected. Incandescence was visible from both summit craters. On 26 April the VAL was lowered to 2 (the second lowest level on a 1-4 scale). White gas-and-steam emissions rose 25-200 m above the summit crater.
During May white gas-and-steam emissions generally rose 50-250 m above the summit, though it was often cloudy, which prevented clear views; on 21 May gas-and-steam emissions rose 50-400 m high. Nighttime N summit crater incandescence rose 10-25 m above the lava dome, and less intense incandescence was noted above Main Crater, which reached about 10 m above the dome. Sounds of falling rocks at Main Crater were heard on 15 May and the seismic network recorded 32 rockfall events in the crater on 17 May. Avalanches traveled as far as 1.5 km down the SW and S flanks, accompanied by rumbling sounds on 18 May. Incandescent material descending the flanks was captured in a webcam image at 2025 on 19 May (figure 63) and on 29 May; summit crater incandescence was observed in webcam images at 2332 on 26 May and at 2304 on 29 May. On 19 May the VAL was again raised to 3.
Occasional Main Crater incandescence was reported during June, as well as incandescent material on the flanks. White gas-and-steam emissions rose 10-200 m above the summit crater. Ash plumes rose to 2.1 km altitude and drifted SE and E during 2-4 June, according to the Darwin VAAC. Material on the flanks of Main Crater were observed at 2225 on 7 June, at 2051 on 9 June, at 0007 on 17 June, and at 0440 on 18 June. Webcam images taken on 21, 25, and 27 June showed incandescence at Main Crater and from material on the flanks.
MIROVA (Middle InfraRed Observation of Volcanic Activity) analysis of MODIS satellite data showed strong thermal activity during mid-February through March and mid-May through June, which represented incandescent avalanches and lava flows (figure 64). During April through mid-May the power of the anomalies decreased but frequent anomalies were still detected. Brief gaps in activity occurred during late March through early April and during mid-June. Infrared satellite images showed strong lava flows mainly affecting the SW and S flanks, accompanied by gas-and-steam emissions (figure 65). According to data recorded by the MODVOLC thermal algorithm, there were a total of 79 thermal hotspots detected: 28 during February, 24 during March, one during April, five during May, and 21 during June.
Geologic Background. Karangetang (Api Siau) volcano lies at the northern end of the island of Siau, about 125 km NNE of the NE-most point of Sulawesi. The stratovolcano contains five summit craters along a N-S line. It is one of Indonesia's most active volcanoes, with more than 40 eruptions recorded since 1675 and many additional small eruptions that were not documented (Neumann van Padang, 1951). Twentieth-century eruptions have included frequent explosive activity sometimes accompanied by pyroclastic flows and lahars. Lava dome growth has occurred in the summit craters; collapse of lava flow fronts have produced pyroclastic flows.
Information Contacts: Pusat Vulkanologi dan Mitigasi Bencana Geologi (PVMBG, also known as Indonesian Center for Volcanology and Geological Hazard Mitigation, CVGHM), Jalan Diponegoro 57, Bandung 40122, Indonesia (URL: http://www.vsi.esdm.go.id/); MAGMA Indonesia, Kementerian Energi dan Sumber Daya Mineral (URL: https://magma.esdm.go.id/v1); Badan Nasional Penanggulangan Bencana (BNPB), National Disaster Management Agency, Graha BNPB - Jl. Scout Kav.38, East Jakarta 13120, Indonesia (URL: http://www.bnpb.go.id/); Darwin Volcanic Ash Advisory Centre (VAAC), Bureau of Meteorology, Northern Territory Regional Office, PO Box 40050, Casuarina, NT 0811, Australia (URL: http://www.bom.gov.au/info/vaac/); MIROVA (Middle InfraRed Observation of Volcanic Activity), a collaborative project between the Universities of Turin and Florence (Italy) supported by the Centre for Volcanic Risk of the Italian Civil Protection Department (URL: http://www.mirovaweb.it/); Hawai'i Institute of Geophysics and Planetology (HIGP) - MODVOLC Thermal Alerts System, School of Ocean and Earth Science and Technology (SOEST), Univ. of Hawai'i, 2525 Correa Road, Honolulu, HI 96822, USA (URL: http://modis.higp.hawaii.edu/); Copernicus Browser, Copernicus Data Space Ecosystem, European Space Agency (URL: https://dataspace.copernicus.eu/browser/); IDN Times, Jl. Jend. Gatot Subroto Kav. 27 3rd Floor Kuningan, Jakarta, Indonesia 12950, Status of Karangetang Volcano in Sitaro Islands Increases (URL: https://sulsel.idntimes.com/news/indonesia/savi/status-gunung-api-karangetang-di-kepulauan-sitaro-meningkat?page=all).
Ahyi (United States) — July 2023 Cite this Report
Ahyi
United States
20.42°N, 145.03°E; summit elev. -75 m
All times are local (unless otherwise noted)
Intermittent hydroacoustic signals and discolored plumes during November 2022-June 2023
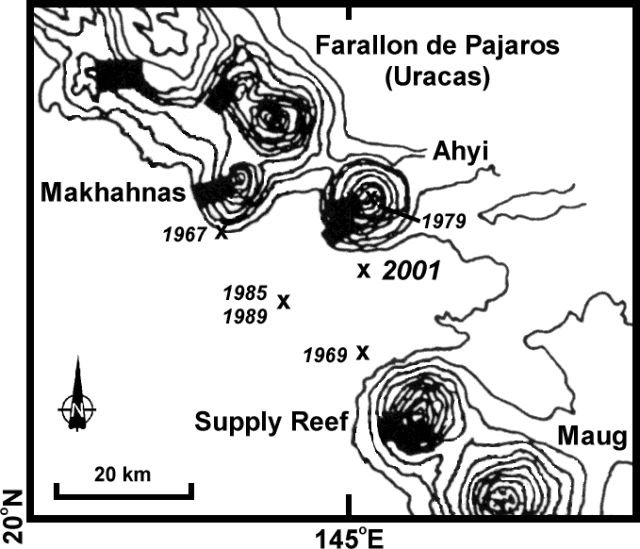
Ahyi seamount is a large, conical submarine volcano that rises to within 75 m of the ocean surface about 18 km SE of the island of Farallon de Pajaros in the Northern Marianas. The remote location of the seamount has made eruptions difficult to document, but seismic stations installed in the region confirmed an eruption in the vicinity in 2001. No new activity was detected until April-May 2014 when an eruption was detected by NOAA (National Oceanic and Atmospheric Administration) divers, hydroacoustic sensors, and seismic stations (BGVN 42:04). New activity was first detected on 15 November by hydroacoustic sensors that were consistent with submarine volcanic activity. This report covers activity during November 2022 through June 2023 based on daily and weekly reports from the US Geological Survey.
Starting in mid-October, hydroacoustic sensors at Wake Island (2.2 km E) recorded signals consistent with submarine volcanic activity, according to a report from the USGS issued on 15 November 2022. A combined analysis of the hydroacoustic signals and seismic stations located at Guam and Chichijima Island, Japan, suggested that the source of this activity was at or near the Ahyi seamount. After a re-analysis of a satellite image of the area that was captured on 6 November, USGS confirmed that there was no evidence of discoloration at the ocean surface. Few hydroacoustic and seismic signals continued through November, including on 18 November, which USGS suggested signified a decline or pause in unrest. A VONA (Volcano Observatory Notice for Aviation) reported that a discolored water plume was persistently visible in satellite data starting on 18 November (figure 6). Though clouds often obscured clear views of the volcano, another discolored water plume was captured in a satellite image on 26 November. The Aviation Color Code (ACC) was raised to Yellow (the second lowest level on a four-color scale) and the Volcano Alert Level (VAL) was raised to Advisory (the second lowest level on a four-level scale) on 29 November.
During December, occasional detections were recorded on the Wake Island hydrophone sensors and discolored water over the seamount remained visible. During 2-7, 10-12, and 16-31 December possible explosion signals were detected. A small area of discolored water was observed in high-resolution Sentinel-2 satellite images during 1-6 December (figure 7). High-resolution satellite images recorded discolored water plumes on 13 December that originated from the summit region; no observations indicated that activity breached the ocean surface. A possible underwater plume was visible in satellite images on 18 December, and during 19-20 December a definite but diffuse underwater plume located SSE from the main vent was reported. An underwater plume was visible in a satellite image taken on 26 December (figure 7).
Hydrophone sensors continued to detect signals consistent with possible explosions during 1-8 January 2023. USGS reported that the number of detections decreased during 4-5 January. The hydrophone sensors experienced a data outage that started at 0118 on 8 January and continued through 10 January, though according to USGS, possible explosions were recorded prior to the data outage and likely continued during the outage. A discolored water plume originating from the summit region was detected in a partly cloudy satellite image on 8 January. On 11-12 and 15-17 January possible explosion signals were recorded again. One small signal was detected during 22-23 January and several signals were recorded on 25 and 31 January. During 27-31 January a plume of discolored water was observed above the seamount in satellite imagery (figure 8).
Low levels of activity continued during February and March, based on data from pressure sensors on Wake Island. During 1 and 4-6 February activity was reported, and a submarine plume was observed on 4 February (figure 8). Possible explosion signals were detected during 7-8, 10, 13-14, and 24 February. During 1-2 and 3-5 March a plume of discolored water was observed in satellite imagery (figure 8). Almost continuous hydroacoustic signals were detected in remote pressure sensor data on Wake Island 2,270 km E from the volcano during 7-13 March. During 12-13 March water discoloration around the seamount was observed in satellite imagery, despite cloudy weather. By 14 March discolored water extended about 35 km, but no direction was noted. USGS reported that the continuous hydroacoustic signals detected during 13-14 March stopped abruptly on 14 March and no new detections were observed. Three 30 second hydroacoustic detections were reported during 17-19 March, but no activity was visible due to cloudy weather. A data outage was reported during 21-22 March, making pressure sensor data unavailable; a discolored water plume was, however, visible in satellite data. A possible underwater explosion signal was detected by pressure sensors at Wake Island on 26, 29, and 31 March, though the cause and origin of these events were unclear.
Similar low activity continued during April, May, and June. Several signals were detected during 1-3 April in pressure sensors at Wake Island. USGS suggested that these may be related to underwater explosions or earthquakes at the volcano, but no underwater plumes were visible in clear satellite images. The pressure sensors had data outages during 12-13 April and no data were recorded; no underwater plumes were visible in satellite images, although cloudy weather obscured most clear views. Eruptive activity was reported starting at 2210 on 21 May. On 22 May a discolored water plume that extended 4 km was visible in satellite images, though no direction was recorded. During 23-24 May some signals were detected by the underwater pressure sensors. Possible hydroacoustic signals were detected during 2-3 and 6-8 June. Multiple hydroacoustic signals were detected during 9-11 and 16-17 June, although no activity was visible in satellite images. One hydroacoustic signal was detected during 23-24 June, but there was some uncertainty about its association with volcanic activity. A single possible hydroacoustic signal was detected during 30 June to 1 July.
Geologic Background. Ahyi seamount is a large conical submarine volcano that rises to within 75 m of the ocean surface ~18 km SE of the island of Farallon de Pajaros in the northern Marianas. Water discoloration has been observed there, and in 1979 the crew of a fishing boat felt shocks over the summit area, followed by upwelling of sulfur-bearing water. On 24-25 April 2001 an explosive eruption was detected seismically by a station on Rangiroa Atoll, Tuamotu Archipelago. The event was well constrained (+/- 15 km) at a location near the southern base of Ahyi. An eruption in April-May 2014 was detected by NOAA divers, hydroacoustic sensors, and seismic stations.
Information Contacts: US Geological Survey, Volcano Hazards Program (USGS-VHP), 12201 Sunrise Valley Drive, Reston, VA, USA, https://volcanoes.usgs.gov/index.html; Copernicus Browser, Copernicus Data Space Ecosystem, European Space Agency (URL: https://dataspace.copernicus.eu/browser/).
Kadovar (Papua New Guinea) — June 2023 Cite this Report
Kadovar
Papua New Guinea
3.608°S, 144.588°E; summit elev. 365 m
All times are local (unless otherwise noted)
An ash plume and weak thermal anomaly during May 2023
Kadovar is a 2-km-wide island that is the emergent summit of a Bismarck Sea stratovolcano. It lies off the coast of New Guinea, about 25 km N of the mouth of the Sepik River. Prior to an eruption that began in 2018, a lava dome formed the high point of the volcano, filling an arcuate landslide scarp open to the S. Submarine debris-avalanche deposits occur to the S of the island. The current eruption began in January 2018 and has comprised lava effusion from vents at the summit and at the E coast; more recent activity has consisted of ash plumes, weak thermal activity, and gas-and-steam plumes (BGVN 48:02). This report covers activity during February through May 2023 using information from the Darwin Volcanic Ash Advisory Center (VAAC) and satellite data.
Activity during the reporting period was relatively low and mainly consisted of white gas-and-steam plumes that were visible in natural color satellite images on clear weather days (figure 67). According to a Darwin VAAC report, at 2040 on 6 May an ash plume rose to 4.6 km altitude and drifted W; by 2300 the plume had dissipated. MODIS satellite instruments using the MODVOLC thermal algorithm detected a single thermal hotspot on the SE side of the island on 7 May. Weak thermal activity was also detected in a satellite image on the E side of the island on 14 May, accompanied by a white gas-and-steam plume that drifted SE (figure 68).
Geologic Background. The 2-km-wide island of Kadovar is the emergent summit of a Bismarck Sea stratovolcano of Holocene age. It is part of the Schouten Islands, and lies off the coast of New Guinea, about 25 km N of the mouth of the Sepik River. Prior to an eruption that began in 2018, a lava dome formed the high point of the andesitic volcano, filling an arcuate landslide scarp open to the south; submarine debris-avalanche deposits occur in that direction. Thick lava flows with columnar jointing forms low cliffs along the coast. The youthful island lacks fringing or offshore reefs. A period of heightened thermal phenomena took place in 1976. An eruption began in January 2018 that included lava effusion from vents at the summit and at the E coast.
Information Contacts: Darwin Volcanic Ash Advisory Centre (VAAC), Bureau of Meteorology, Northern Territory Regional Office, PO Box 40050, Casuarina, NT 0811, Australia (URL: http://www.bom.gov.au/info/vaac/); Hawai'i Institute of Geophysics and Planetology (HIGP) - MODVOLC Thermal Alerts System, School of Ocean and Earth Science and Technology (SOEST), Univ. of Hawai'i, 2525 Correa Road, Honolulu, HI 96822, USA (URL: http://modis.higp.hawaii.edu/); Copernicus Browser, Copernicus Data Space Ecosystem, European Space Agency (URL: https://dataspace.copernicus.eu/browser/).
San Miguel (El Salvador) — June 2023 Cite this Report
San Miguel
El Salvador
13.434°N, 88.269°W; summit elev. 2130 m
All times are local (unless otherwise noted)
Small gas-and-ash explosions during March and May 2023
San Miguel in El Salvador is a broad, deep crater complex that has been frequently modified by eruptions recorded since the early 16th century and consists of the summit known locally as Chaparrastique. Flank eruptions have produced lava flows that extended to the N, NE, and SE during the 17-19th centuries. The most recent activity has consisted of minor ash eruptions from the summit crater. The current eruption period began in November 2022 and has been characterized by frequent phreatic explosions, gas-and-ash emissions, and sulfur dioxide plumes (BGVN 47:12). This report describes small gas-and-ash explosions during December 2022 through May 2023 based on special reports from the Ministero de Medio Ambiente y Recursos Naturales (MARN).
Activity has been relatively low since the last recorded explosions on 29 November 2022. Seismicity recorded by the San Miguel Volcano Station (VSM) located on the N flank at 1.7 km elevation had decreased by 7 December. Sulfur dioxide gas measurements taken with DOAS (Differential Optical Absorption Spectroscopy) mobile equipment were below typical previously recorded values: 300 tons per day (t/d). During December, small explosions were recorded by the seismic network and manifested as gas-and-steam emissions.
Gas-and-ash explosions in the crater occurred during January 2023, which were recorded by the seismic network. Sulfur dioxide values remained low, between 300-400 t/d through 10 March. At 0817 on 14 January a gas-and-ash emission was visible in webcam images, rising just above the crater rim. Some mornings during February, small gas-and-steam plumes were visible in the crater. On 7 March at 2252 MARN noted an increase in degassing from the central crater; gas emissions were constantly observed through the early morning hours on 8 March. During the early morning of 8 March through the afternoon on 9 March, 12 emissions were registered, some accompanied by ash. The last gas-and-ash emission was recorded at 1210 on 9 March; very fine ashfall was reported in El Tránsito (10 km S), La Morita (6 km W), and La Piedrita (3 km W). The smell of sulfur was reported in Piedra Azul (5 km SW). On 16 March MARN reported that gas-and-steam emissions decreased.
Low degassing and very low seismicity were reported during April; no explosions have been detected between 9 March and 27 May. The sulfur dioxide emissions remained between 350-400 t/d; during 13-20 April sulfur dioxide values fluctuated between 30-300 t/d. Activity remained low through most of May; on 23 May seismicity increased. An explosion was detected at 1647 on 27 May generated a gas-and-ash plume that rose 700 m high (figure 32); a decrease in seismicity and gas emissions followed. The DOAS station installed on the W flank recorded sulfur dioxide values that reached 400 t/d on 27 May; subsequent measurements showed a decrease to 268 t/d on 28 May and 100 t/d on 29 May.
Geologic Background. The symmetrical cone of San Miguel, one of the most active volcanoes in El Salvador, rises from near sea level to form one of the country's most prominent landmarks. A broad, deep, crater complex that has been frequently modified by eruptions recorded since the early 16th century caps the truncated unvegetated summit, also known locally as Chaparrastique. Flanks eruptions of the basaltic-andesitic volcano have produced many lava flows, including several during the 17th-19th centuries that extended to the N, NE, and SE. The SE-flank flows are the largest and form broad, sparsely vegetated lava fields crossed by highways and a railroad skirting the base of the volcano. Flank vent locations have migrated higher on the edifice during historical time, and the most recent activity has consisted of minor ash eruptions from the summit crater.
Information Contacts: Ministero de Medio Ambiente y Recursos Naturales (MARN), Km. 5½ Carretera a Nueva San Salvador, Avenida las Mercedes, San Salvador, El Salvador (URL: http://www.snet.gob.sv/ver/vulcanologia).
Semisopochnoi (United States) — June 2023 Cite this Report
Semisopochnoi
United States
51.93°N, 179.58°E; summit elev. 1221 m
All times are local (unless otherwise noted)
Occasional explosions, ash deposits, and gas-and-steam plumes during December 2022-May 2023
Semisopochnoi is located in the western Aleutians, is 20-km-wide at sea level, and contains an 8-km-wide caldera. The three-peaked Mount Young (formerly Cerberus) was constructed within the caldera during the Holocene. Each of these peaks contains a summit crater; the lava flows on the N flank appear younger than those on the S side. The current eruption period began in early February 2021 and has more recently consisted of intermittent explosions and ash emissions (BGVN 47:12). This report updates activity during December 2022 through May 2023 using daily, weekly, and special reports from the Alaska Volcano Observatory (AVO). AVO monitors the volcano using local seismic and infrasound sensors, satellite data, web cameras, and remote infrasound and lightning networks.
Activity during most of December 2022 was relatively quiet; according to AVO no eruptive or explosive activity was observed since 7 November 2022. Intermittent tremor and occasional small earthquakes were observed in geophysical data. Continuous gas-and-steam emissions were observed from the N crater of Mount Young in webcam images on clear weather days (figure 25). On 24 December, there was a slight increase in earthquake activity and several small possible explosion signals were detected in infrasound data. Eruptive activity resumed on 27 December at the N crater of Mount Young; AVO issued a Volcano Activity Notice (VAN) that reported minor ash deposits on the flanks of Mount Young that extended as far as 1 km from the vent, according to webcam images taken during 27-28 December (figure 26). No ash plumes were observed in webcam or satellite imagery, but a persistent gas-and-steam plume that might have contained some ash rose to 1.5 km altitude. As a result, AVO raised the Aviation Color Code (ACC) to Orange (the second highest level on a four-color scale) and the Volcano Alert Level (VAL) to Watch (the second highest level on a four-level scale). Possible explosions were detected during 21 December 2022 through 1 January 2023 and seismic tremor was recorded during 30-31 December.
During January 2023 eruptive activity continued at the active N crater of Mount Young. Minor ash deposits were observed on the flanks, extending about 2 km SSW, based on webcam images from 1 and 3 January. A possible explosion occurred during 1-2 January based on elevated seismicity recorded on local seismometers and an infrasound signal recorded minutes later by an array at Adak. Though no ash plumes were observed in webcam or satellite imagery, a persistent gas-and-steam plume rose to 1.5 km altitude that might have carried minor traces of ash. Ash deposits were accompanied by periods of elevated seismicity and infrasound signals from the local geophysical network, which AVO reported were likely due to weak explosive activity. Low-level explosive activity was also detected during 2-3 January, with minor gas-and-steam emissions and a new ash deposit that was visible in webcam images. Low-level explosive activity was detected in geophysical data during 4-5 January, with elevated seismicity and infrasound signals observed on local stations. Volcanic tremor was detected during 7-9 January and very weak explosive activity was detected in seismic and infrasound data on 9 January. Weak seismic and infrasound signals were recorded on 17 January, which indicated minor explosive activity, but no ash emissions were observed in clear webcam images; a gas-and-steam plume continued to rise to 1.5 km altitude. During 29-30 January, ash deposits near the summit were observed on fresh snow, according to webcam images.
The active N cone at Mount Young continued to produce a gas-and-steam plume during February, but no ash emissions or explosive events were detected. Seismicity remained elevated with faint tremor during early February. Gas-and-steam emissions from the N crater were observed in clear webcam images on 11-13 and 16 February; no explosive activity was detected in seismic, infrasound, or satellite data. Seismicity has also decreased, with no significant seismic tremor observed since 25 January. Therefore, the ACC was lowered to Yellow (the second lowest level on a four-color scale) and the VAL was lowered to Advisory (the second lowest level on a four-color scale) on 22 February.
Gas-and-steam emissions persisted during March from the N cone of Mount Young, based on clear webcam images. A few brief episodes of weak tremor were detected in seismic data, although seismicity decreased over the month. A gas-and-steam plume detected in satellite data extended 150 km on 18 March. Low-level ash emissions from the N cone at Mount Young were observed in several webcam images during 18-19 March, in addition to small explosions and volcanic tremor. The ACC was raised to Orange and the VAL increased to Watch on 19 March. A small explosion was detected in seismic and infrasound data on 21 March.
Low-level unrest continued during April, although cloudy weather often obscured views of the summit; periods of seismic tremor and local earthquakes were recorded. During 3-4 April a gas-and-steam plume was visible traveling more than 200 km overnight; no ash was evident in the plume, according to AVO. A gas-and-steam plume was observed during 4-6 April that extended 400 km but did not seem to contain ash. Small explosions were detected in seismic and infrasound data on 5 April. Occasional clear webcam images showed continuing gas-and-steam emissions rose from Mount Young, but no ash deposits were observed on the snow. On 19 April small explosions and tremor were detected in seismic and infrasound data. A period of seismic tremor was detected during 22-25 April, with possible weak explosions on 25 April. Ash deposits were visible near the crater rim, but it was unclear if these deposits were recent or due to older deposits.
Occasional small earthquakes were recorded during May, but there were no signs of explosive activity seen in geophysical data. Gas-and-steam emissions continued from the N crater of Mount Young, based on webcam images, and seismicity remained slightly elevated. A new, light ash deposit was visible during the morning of 5 May on fresh snow on the NW flank of Mount Young. During 10 May periods of volcanic tremor were observed. The ACC was lowered to Yellow and the VAL to Advisory on 17 May due to no additional evidence of activity.
Geologic Background. Semisopochnoi, the largest subaerial volcano of the western Aleutians, is 20 km wide at sea level and contains an 8-km-wide caldera. It formed as a result of collapse of a low-angle, dominantly basaltic volcano following the eruption of a large volume of dacitic pumice. The high point of the island is Anvil Peak, a double-peaked late-Pleistocene cone that forms much of the island's northern part. The three-peaked Mount Cerberus (renamed Mount Young in 2023) was constructed within the caldera during the Holocene. Each of the peaks contains a summit crater; lava flows on the N flank appear younger than those on the south side. Other post-caldera volcanoes include the symmetrical Sugarloaf Peak SSE of the caldera and Lakeshore Cone, a small cinder cone at the edge of Fenner Lake in the NE part of the caldera. Most documented eruptions have originated from Young, although Coats (1950) considered that both Sugarloaf and Lakeshore Cone could have been recently active.
Information Contacts: Alaska Volcano Observatory (AVO), a cooperative program of a) U.S. Geological Survey, 4200 University Drive, Anchorage, AK 99508-4667 USA (URL: https://avo.alaska.edu/), b) Geophysical Institute, University of Alaska, PO Box 757320, Fairbanks, AK 99775-7320, USA, and c) Alaska Division of Geological & Geophysical Surveys, 794 University Ave., Suite 200, Fairbanks, AK 99709, USA (URL: http://dggs.alaska.gov/).
Ebeko
Russia
50.686°N, 156.014°E; summit elev. 1103 m
All times are local (unless otherwise noted)
Continued explosions, ash plumes, and ashfall during October 2022-May 2023
Ebeko, located on the N end of Paramushir Island in the Kuril Islands, consists of three summit craters along a SSW-NNE line at the northern end of a complex of five volcanic cones. Eruptions date back to the late 18th century and have been characterized as small-to-moderate explosions from the summit crater, accompanied by intense fumarolic activity. The current eruption period began in June 2022 and has recently consisted of frequent explosions, ash plumes, and thermal activity (BGVN 47:10). This report covers similar activity during October 2022 through May 2023, based on information from the Kamchatka Volcanic Eruptions Response Team (KVERT) and satellite data.
Activity during October consisted of explosive activity, ash plumes, and occasional thermal anomalies. Visual data by volcanologists from Severo-Kurilsk showed explosions producing ash clouds up to 2.1-3 km altitude which drifted E, N, NE, and SE during 1-8, 10, 16, and 18 October. KVERT issued several Volcano Observatory Notices for Aviation (VONA) on 7, 13-15, and 27 October 2022, stating that explosions generated ash plumes that rose to 2.3-4 km altitude and drifted 5 km E, NE, and SE. Ashfall was reported in Severo-Kurilsk (Paramushir Island, about 7 km E) on 7 and 13 October. Satellite data showed a thermal anomaly over the volcano on 15-16 October. Visual data showed ash plumes rising to 2.5-3.6 km altitude on 22, 25-29, and 31 October and moving NE due to constant explosions.
Similar activity continued during November, with explosions, ash plumes, and ashfall occurring. KVERT issued VONAs on 1-2, 4, 6-7, 9, 13, and 16 November that reported explosions and resulting ash plumes that rose to 1.7-3.6 km altitude and drifted 3-5 km SE, ESE, E, and NE. On 1 November ash plumes extended as far as 110 km SE. On 5, 8, 12, and 24-25 November explosions and ash plumes rose to 2-3.1 km altitude and drifted N and E. Ashfall was observed in Severo-Kurilsk on 7 and 16 November. A thermal anomaly was visible during 1-4, 16, and 20 November. Explosions during 26 November rose as high as 2.7 km altitude and drifted NE (figure 45).
Explosions and ash plumes continued to occur in December. During 1-2 and 4 December volcanologists from Severo-Kurilsk observed explosions that sent ash to 1.9-2.5 km altitude and drifted NE and SE (figure 46). VONAs were issued on 5, 9, and 16 December reporting that explosions generated ash plumes rising to 1.9 km, 2.6 km, and 2.4 km altitude and drifted 5 km SE, E, and NE, respectively. A thermal anomaly was visible in satellite imagery on 16 December. On 18 and 27-28 December explosions produced ash plumes that rose to 2.5 km altitude and drifted NE and SE. On 31 December an ash plume rose to 2 km altitude and drifted NE.
Explosions continued during January 2023, based on visual observations by volcanologists from Severo-Kurilsk. During 1-7 January explosions generated ash plumes that rose to 4 km altitude and drifted NE, E, W, and SE. According to VONAs issued by KVERT on 2, 4, 10, and 23 January, explosions produced ash plumes that rose to 2-4 km altitude and drifted 5 km N, NE, E, and ENE; the ash plume that rose to 4 km altitude occurred on 10 January (figure 47). Satellite data showed a thermal anomaly during 3-4, 10, 13, 16, 21, 22, and 31 January. KVERT reported that an ash cloud on 4 January moved 12 km NE. On 6 and 9-11 January explosions sent ash plumes to 4.5 km altitude and drifted W and ESE. On 13 January an ash plume rose to 3 km altitude and drifted SE. During 20-24 January ash plumes from explosions rose to 3.7 km altitude and drifted SE, N, and NE. On 21 January the ash plume drifted as far as 40 km NE. During 28-29 and 31 January and 1 February ash plumes rose to 4 km altitude and drifted NE.
During February, explosions, ash plumes, and ashfall were reported. During 1, 4-5 and 7-8 February explosions generated ash plumes that rose to 4.5 km altitude and drifted E and NE; ashfall was observed on 5 and 8 February. On 6 February an explosion produced an ash plume that rose to 3 km altitude and drifted 7 km E, causing ashfall in Severo-Kurilsk. A thermal anomaly was visible in satellite data on 8, 9, 13, and 21 February. Explosions on 9 and 12-13 February produced ash plumes that rose to 4 km altitude and drifted E and NE; the ash cloud on 12 February extended as far as 45 km E. On 22 February explosions sent ash to 3 km altitude that drifted E. During 24 and 26-27 February ash plumes rose to 4 km altitude and drifted E. On 28 February an explosion sent ash to 2.5-3 km altitude and drifted 5 km E; ashfall was observed in Severo-Kurilsk.
Activity continued during March; visual observations showed that explosions generated ash plumes that rose to 3.6 km altitude on 3, 5-7, and 9-12 March and drifted E, NE, and NW. Thermal anomalies were visible on 10, 13, and 29-30 March in satellite imagery. On 18, 21-23, 26, and 29-30 March explosions produced ash plumes that rose to 2.8 km altitude and drifted NE and E; the ash plumes during 22-23 March extended up to 76 km E. A VONA issued on 21 March reported an explosion that produced an ash plume that rose to 2.8 km altitude and drifted 5 km E. Another VONA issued on 23 March reported that satellite data showed an ash plume rising to 3 km altitude and drifted 14 km E.
Explosions during April continued to generate ash plumes. On 1 and 4 April an ash plume rose to 2.8-3.5 km altitude and drifted SE and NE. A thermal anomaly was visible in satellite imagery during 1-6 April. Satellite data showed ash plumes and clouds rising to 2-3 km altitude and drifting up to 12 km SW and E on 3 and 6 April (figure 48). KVERT issued VONAs on 3, 5, 14, 16 April describing explosions that produced ash plumes rising to 3 km, 3.5 km, 3.5 km, and 3 km altitude and drifting 5 km S, 5 km NE and SE, 72 km NNE, and 5 km NE, respectively. According to satellite data, the resulting ash cloud from the explosion on 14 April was 25 x 7 km in size and drifted 72-104 km NNE during 14-15 April. According to visual data by volcanologists from Severo-Kurilsk explosions sent ash up to 3.5 km altitude that drifted NE and E during 15-16, 22, 25-26, and 29 April.
The explosive eruption continued during May. Explosions during 3-4, 6-7, and 9-10 May generated ash plumes that rose to 4 km altitude and drifted SW and E. Satellite data showed a thermal anomaly on 3, 9, 13-14, and 24 May. During 12-16, 23-25, and 27-28 May ash plumes rose to 3.5 km altitude and drifted in different directions due to explosions. Two VONA notices were issued on 16 and 25 May, describing explosions that generated ash plumes rising to 3 km and 3.5 km altitude, respectively and extending 5 km E. The ash cloud on 25 May drifted 75 km SE.
Thermal activity in the summit crater, occasionally accompanied by ash plumes and ash deposits on the SE and E flanks due to frequent explosions, were visible in infrared and true color satellite images (figure 49).
Geologic Background. The flat-topped summit of the central cone of Ebeko volcano, one of the most active in the Kuril Islands, occupies the northern end of Paramushir Island. Three summit craters located along a SSW-NNE line form Ebeko volcano proper, at the northern end of a complex of five volcanic cones. Blocky lava flows extend west from Ebeko and SE from the neighboring Nezametnyi cone. The eastern part of the southern crater contains strong solfataras and a large boiling spring. The central crater is filled by a lake about 20 m deep whose shores are lined with steaming solfataras; the northern crater lies across a narrow, low barrier from the central crater and contains a small, cold crescentic lake. Historical activity, recorded since the late-18th century, has been restricted to small-to-moderate explosive eruptions from the summit craters. Intense fumarolic activity occurs in the summit craters, on the outer flanks of the cone, and in lateral explosion craters.
Information Contacts: Kamchatka Volcanic Eruptions Response Team (KVERT), Far Eastern Branch, Russian Academy of Sciences, 9 Piip Blvd., Petropavlovsk-Kamchatsky, 683006, Russia (URL: http://www.kscnet.ru/ivs/kvert/); MIROVA (Middle InfraRed Observation of Volcanic Activity), a collaborative project between the Universities of Turin and Florence (Italy) supported by the Centre for Volcanic Risk of the Italian Civil Protection Department (URL: http://www.mirovaweb.it/); Copernicus Browser, Copernicus Data Space Ecosystem, European Space Agency (URL: https://dataspace.copernicus.eu/browser/).
Home Reef
Tonga
18.992°S, 174.775°W; summit elev. -10 m
All times are local (unless otherwise noted)
Discolored plumes continued during November 2022-April 2023
Home Reef is a submarine volcano located in the central Tonga islands between Lateiki (Metis Shoal) and Late Island. The first recorded eruption occurred in the mid-19th century, when an ephemeral island formed. An eruption in 1984 produced a 12-km-high eruption plume, a large volume of floating pumice, and an ephemeral island 500 x 1,500 m wide, with cliffs 30-50 m high that enclosed a water-filled crater. Another island-forming eruption in 2006 produced widespread pumice rafts that drifted as far as Australia; by 2008 the island had eroded below sea level. The previous eruption occurred during October 2022 and was characterized by a new island-forming eruption, lava effusion, ash plumes, discolored water, and gas-and-steam plumes (BGVN 47:11). This report covers discolored water plumes during November 2022 through April 2023 using satellite data.
Discolored plumes continued during the reporting period and were observed in true color satellite images on clear weather days. Satellite images show light green-yellow discolored water extending W on 8 and 28 November 2022 (figure 31), and SW on 18 November. Light green-yellow plumes extended W on 3 December, S on 13 December, SW on 18 December, and W and S on 23 December (figure 31). On 12 January 2023 discolored green-yellow plumes extended to the NE, E, SE, and N. The plume moved SE on 17 January and NW on 22 January. Faint discolored water in February was visible moving NE on 1 February. A discolored plume extended NW on 8 and 28 March and NW on 13 March (figure 31). During April, clear weather showed green-blue discolored plumes moving S on 2 April, W on 7 April, and NE and S on 12 April. A strong green-yellow discolored plume extended E and NE on 22 April for several kilometers (figure 31).
Geologic Background. Home Reef, a submarine volcano midway between Metis Shoal and Late Island in the central Tonga islands, was first reported active in the mid-19th century, when an ephemeral island formed. An eruption in 1984 produced a 12-km-high eruption plume, large amounts of floating pumice, and an ephemeral 500 x 1,500 m island, with cliffs 30-50 m high that enclosed a water-filled crater. In 2006 an island-forming eruption produced widespread dacitic pumice rafts that drifted as far as Australia. Another island was built during a September-October 2022 eruption.
Information Contacts: Copernicus Browser, Copernicus Data Space Ecosystem, European Space Agency (URL: https://dataspace.copernicus.eu/browser/).
Ambae
Vanuatu
15.389°S, 167.835°E; summit elev. 1496 m
All times are local (unless otherwise noted)
New lava flow, ash plumes, and sulfur dioxide plumes during February-May 2023
Ambae, also known as Aoba, is a large basaltic shield volcano in Vanuatu. A broad pyroclastic cone containing three crater lakes (Manaro Ngoru, Voui, and Manaro Lakua) is located at the summit within the youngest of at least two nested calderas. Periodic phreatic and pyroclastic explosions have been reported since the 16th century. A large eruption more than 400 years ago resulted in a volcanic cone within the summit crater that is now filled by Lake Voui; the similarly sized Lake Manaro fills the western third of the caldera. The previous eruption ended in August 2022 that was characterized by gas-and-steam and ash emissions and explosions of wet tephra (BGVN 47:10). This report covers a new eruption during February through May 2023 that consisted of a new lava flow, ash plumes, and sulfur dioxide emissions, using information from the Vanuatu Meteorology and Geo-Hazards Department (VMGD) and satellite data.
During the reporting period, the Alert Level remained at a 2 (on a scale of 0-5), which has been in place since December 2021. Activity during October 2022 through March 2023 remained relatively low and mostly consisted of gas-and-steam emissions in Lake Voui. VMGD reported that at 1300 on 15 November a satellite image captured a strong amount of sulfur dioxide rising above the volcano (figure 99), and that seismicity slightly increased. The southern and northern part of the island reported a strong sulfur dioxide smell and heard explosions. On 20 February 2023 a gas-and-ash plume rose 1.3 km above the summit and drifted SSW, according to a webcam image (figure 100). Gas-and-steam and possibly ash emissions continued on 23 February and volcanic earthquakes were recorded by the seismic network.
During April, volcanic earthquakes and gas-and-steam and ash emissions were reported from the cone in Lake Voui. VMGD reported that activity increased during 5-7 April; high gas-and-steam and ash plumes were visible, accompanied by nighttime incandescence. According to a Wellington VAAC report, a low-level ash plume rose as high as 2.5 km above the summit and drifted W and SW on 5 April, based on satellite imagery. Reports in Saratamata stated that a dark ash plume drifted to the WSW, but no loud explosion was heard. Webcam images from 2100 showed incandescence above the crater and reflected in the clouds. According to an aerial survey, field observations, and satellite data, water was no longer present in the lake. A lava flow was reported effusing from the vent and traveling N into the dry Lake Voui, which lasted three days. The next morning at 0745 on 6 April a gas-and-steam and ash plume rose 5.4 km above the summit and drifted ESE, based on information from VMGD (figure 101). The Wellington VAAC also reported that light ashfall was observed on the island. Intermittent gas-and-steam and ash emissions were visible on 7 April, some of which rose to an estimated 3 km above the summit and drifted E. Webcam images during 0107-0730 on 7 April showed continuing ash emissions. A gas-and-steam and ash plume rose 695 m above the summit crater at 0730 on 19 April and drifted ESE, based on a webcam image (figure 102).
According to visual and infrared satellite data, water was visible in Lake Voui as late as 24 March 2023 (figure 103). The vent in the caldera showed a gas-and-steam plume drifted SE. On 3 April thermal activity was first detected, accompanied by a gas-and-ash plume that drifted W (figure 103). The lava flow moved N within the dry lake and was shown cooling by 8 April. By 23 April much of the water in the lake had returned. Occasional sulfur dioxide plumes were detected by the TROPOMI instrument on the Sentinel-5P satellite that exceeded 2 Dobson Units (DU) and drifted in different directions (figure 104).
Geologic Background. The island of Ambae, also known as Aoba, is a massive 2,500 km3 basaltic shield that is the most voluminous volcano of the New Hebrides archipelago. A pronounced NE-SW-trending rift zone with numerous scoria cones gives the 16 x 38 km island an elongated form. A broad pyroclastic cone containing three crater lakes (Manaro Ngoru, Voui, and Manaro Lakua) is located at the summit within the youngest of at least two nested calderas, the largest of which is 6 km in diameter. That large central edifice is also called Manaro Voui or Lombenben volcano. Post-caldera explosive eruptions formed the summit craters about 360 years ago. A tuff cone was constructed within Lake Voui (or Vui) about 60 years later. The latest known flank eruption, about 300 years ago, destroyed the population of the Nduindui area near the western coast.
Information Contacts: Geo-Hazards Division, Vanuatu Meteorology and Geo-Hazards Department (VMGD), Ministry of Climate Change Adaptation, Meteorology, Geo-Hazards, Energy, Environment and Disaster Management, Private Mail Bag 9054, Lini Highway, Port Vila, Vanuatu (URL: http://www.vmgd.gov.vu/, https://www.facebook.com/VanuatuGeohazardsObservatory/); Wellington Volcanic Ash Advisory Centre (VAAC), Meteorological Service of New Zealand Ltd (MetService), PO Box 722, Wellington, New Zealand (URL: http://www.metservice.com/vaac/, http://www.ssd.noaa.gov/VAAC/OTH/NZ/messages.html); MIROVA (Middle InfraRed Observation of Volcanic Activity), a collaborative project between the Universities of Turin and Florence (Italy) supported by the Centre for Volcanic Risk of the Italian Civil Protection Department (URL: http://www.mirovaweb.it/); Global Sulfur Dioxide Monitoring Page, Atmospheric Chemistry and Dynamics Laboratory, NASA Goddard Space Flight Center (NASA/GSFC), 8800 Greenbelt Road, Goddard, Maryland, USA (URL: https://so2.gsfc.nasa.gov/); Copernicus Browser, Copernicus Data Space Ecosystem, European Space Agency (URL: https://dataspace.copernicus.eu/browser/).
Search Bulletin Archive by Publication Date
Select a month and year from the drop-downs and click "Show Issue" to have that issue displayed in this tab.
The default month and year is the latest issue available.
Bulletin of the Global Volcanism Network - Volume 26, Number 05 (May 2001)
Managing Editor: Richard Wunderman
Ahyi (United States)
Brief explosive activity on 24 April 2001 detected seismically
Atmospheric Effects (1995-2001) (Unknown)
Volcanic aerosol optical thicknesses derived from lunar eclipse observations
Colima (Mexico)
Surficial fractures preceded a light-colored dome emplaced aseismically
Deception Island (Antarctica)
Moderate seismicity; magnetic and geochemical studies gather new data
Etna (Italy)
Strombolian activity and lava flows during January-April 2001
Fournaise, Piton de la (France)
Eruptions during late March 2001 and on 11 June 2001
Galeras (Colombia)
Low-level seismicity and eruptive activity during April 2000-March 2001
Mayon (Philippines)
April 2000-May 2001 summary; dome growth beginning in January 2001
Niuafo'ou (Tonga)
New hot spring in caldera during May-June 1999
San Cristobal (Nicaragua)
Small gas-and-ash plumes during May and June 2001 cause ashfalls
Sturge Island (Antarctica)
Elongate cloud on 12 June possibly a result of volcanic emissions
Three Sisters (United States)
Radar interferometry suggests uplift during 1996-2000
Ulawun (Papua New Guinea)
Eruption on 30 April 2001 sends an ash cloud to a height of ~13.7 km
Ahyi
United States
20.42°N, 145.03°E; summit elev. -75 m
All times are local (unless otherwise noted)
Brief explosive activity on 24 April 2001 detected seismically
A short episode of explosive submarine volcanism was recorded 24 April 2001 by the Laboratoire de Géophysique's (LDG) Pomariorio (PMO) seismic station on Rangiroa Atoll, Tuamotu Archipelago. This episode began at 1110 UTC, and ended at 1900 UTC, with more than 40 explosive T-waves at a fairly uniform rate. The wave forms were similar to those of December 1989 (from a source NW of Supply Reef, SEAN 14:12), and suggested a source in the Mariana Islands. LDG scientists identified these explosive events on records from some other IRIS and Freesia stations, and computed a well-constrained location at 20.34°N, 145.02°E with an error of 15 km (figure 1).
The summit of Ahyi lies within this location uncertainty, approximately 10 km N. Ahyi seamount is a large conical submarine volcano that rises to within about 140 m of the sea surface about 18 km SE of Farallon de Pajaros. Water discoloration has been observed over the volcano, and in 1979 the crew of a fishing boat felt shocks over the summit area followed by upwelling of sulfur-bearing water (SEAN 04:11).
Regional volcanic activity. Most of the recent historical activity in this area is based on acoustic detection methods from great distances, making exact location determinations difficult. The following presents background information about other volcanoes close to the April 2001 event, with a description of recent volcanism.
The small 2-km-wide island of Farallon de Pajaros (also known as Uracas) is the northernmost and most active volcano of the Mariana Islands. Its relatively frequent historical eruptions dating back to the mid-19th century have caused it to be referred to as the "lighthouse of the western Pacific." Flank fissures have fed historical lava flows that form platforms along the coast. Summit vents have also been active during historical time, and eruptions have been observed from nearby submarine vents. Aerial observations of fuming were reported in July 1981 (with discolored water), August 1990, and May 1992. Makhahnas seamount, which rises to within 640 m of the sea surface, lies about 10 km SW. A possible eruption during March-April 1967 on the SW flank of this seamount was identified on the basis of T-phase recordings by Norris and Johnson (1969).
Supply Reef is a conical submarine volcano that rises to within 8 m of the sea surface. The seamount lies about 10 km NW of the Maug Islands, the emergent summit of a submarine volcano that is joined to Supply Reef by a low saddle at a depth of about 1,800 m. Several submarine eruptions have been detected by sonar signals originating from points very approximately located at distances of 15-25 km NW of Supply Reef. An event in March 1969 was detected using T-phase recordings and located by the crew of a fishing boat who heard explosion sounds and saw water discoloration (CSLP Cards 528 and 534). Activity in August-September 1985 (SEAN 10:09 and 10:11) and September and December 1989 (SEAN 14:10 and 14:12) were in the same approximate location, 30 km S of Farallon de Pajaros, about midway between Makhahnas and Supply Reef. Both of these events were identified and located using T-phase data, but discolored water was also observed during the 1985 event by an airline pilot.
References. Bloomer, S.H., Stern, R.J., and Smoot, N.C., 1989, Physical volcanology of the submarine Mariana and Volcano arcs: Bulletin of Volcanology, v. 51, p. 210-224.
Norris, R.A., and Johnson, R.H., 1969, Submarine volcanic eruptions recently located in the Pacific by Sofar hydrophones: Journal of Geophysical Research, v. 74, no. 2, p. 650-664.
Geologic Background. Ahyi seamount is a large conical submarine volcano that rises to within 75 m of the ocean surface ~18 km SE of the island of Farallon de Pajaros in the northern Marianas. Water discoloration has been observed there, and in 1979 the crew of a fishing boat felt shocks over the summit area, followed by upwelling of sulfur-bearing water. On 24-25 April 2001 an explosive eruption was detected seismically by a station on Rangiroa Atoll, Tuamotu Archipelago. The event was well constrained (+/- 15 km) at a location near the southern base of Ahyi. An eruption in April-May 2014 was detected by NOAA divers, hydroacoustic sensors, and seismic stations.
Information Contacts: Olivier Hyvernaud, Laboratoire de Géophysique, PO Box 640, Pamatai, Tahiti, French Polynesia.
Atmospheric Effects (1995-2001) (Unknown) — May 2001 Cite this Report
Atmospheric Effects (1995-2001)
Unknown
Unknown, Unknown; summit elev. m
All times are local (unless otherwise noted)
Volcanic aerosol optical thicknesses derived from lunar eclipse observations
The following report, discussing volcanic aerosol optical thicknesses since 1960 as derived from lunar eclipse observations, was provided by Richard Keen. About once per year, on average, the moon is eclipsed as it passes into the Earth's shadow; at these times the moon can be used as a remote sensor of the global average optical depth of stratospheric aerosols of volcanic origin. Volcanic aerosols and lunar eclipses can be linked because the moon is visible during total lunar eclipses due to sunlight refracted into the shadow (umbra) by the Earth's atmosphere (primarily by the stratosphere), stratospheric aerosols reduce the transmission of sunlight into the umbra, and the path length of sunlight through a stratospheric aerosol layer is about 40 times the vertical thickness of the layer. Therefore, the brightness of the eclipsed moon is extremely sensitive to the amount of aerosols in the stratosphere.
Methodology and data reduction. Aerosol optical thicknesses can be calculated for the date of an eclipse from the difference between the observed brightness of the eclipse and a modeled brightness computed for an aerosol-free standard atmosphere, modified by assumed distributions of ozone and cloud. Details of this technique, applied to observations during 1960 through 1982, appear in Keen (1983); updates following the eruption of Pinatubo appeared in February 1993 (Bulletin v. 18, no. 2) and November 1997 (Bulletin v. 22, no. 11). This report updates the time series through the lunar eclipse of 9 January 2001, the last total lunar eclipse until May 2003.
Figure 12 plots the global optical thicknesses derived from 38 total or near-total lunar eclipses during 1960-2001. Results from eight eclipses during 1880-1888 have been added to figure 12 to allow comparison with the effects of Krakatau in 1883. The plotted values are actual derived optical depths, modified as follows: Due to the higher concentration of aerosols from Agung and El Chichón in the Southern and Northern Hemispheres, respectively, a sampling bias due to the moon's passing though the southern or northern portion of the umbra was removed by using an empirical adjustment factor of 0.8 (thus, if the moon passed S of the Earth's shadow axis during an eclipse following an Agung eruption, the derived optical thickness was multiplied by 0.8, while the derived value was divided by 0.8 if the moon passed N of the axis). Furthermore, no lunar eclipses occurred until 18 months following the Pinatubo eruption in June 1991, while results from Agung and El Chichón indicate that peak optical depths occurred about 9 months after those eruptions. Therefore, for plotting purposes on figure 12, the time series of optical thicknesses following Pinatubo was extrapolated backwards to a date 9 months after the eruption using a composite decay curve (with a time constant of 1.92 years) derived from the Agung and El Chichón eclipse data. Finally, the global optical depths were set to zero on the dates of the eruptions of Krakatau, Agung, Fuego, and Pinatubo; observed values were near zero for eclipses close to the dates of the eruptions of Fernandina and El Chichón.
The time series. The volcanic eruptions probably responsible for the major peaks in the times series are identified, although the identification of Fernandina with the 1968 peak is highly uncertain. Comparative maximum global optical thicknesses are: Pinatubo (1991), 0.15; Krakatau (1883), 0.13; Agung (1963), 0.10; El Chichón (1982), 0.09; Fernandina (1968), 0.06; Fuego (1974), 0.04.
The results indicate that the volcanic aerosol veil from Pinatubo disappeared between the eclipses of November 1993, and April 1996, with optical depth probably reaching zero sometime in 1995. Since 1995, optical depths have stayed near zero ( ± 0.01), indicating no further major injections of volcanic aerosols into the stratosphere. However, slight increases to observed values slightly above 0.01 in 1979 and in late 1997 are close to the noise level due to the uncertainty in the brightness observations; if real, they could indicate aerosols from the eruptions of Soufriere St. Vincent (1979) and Soufriere Hills on Montserrat (1997).
Acknowledgments. Thanks are due to the following observers who supplied observations of the three eclipses in the 2000-2001 series: C. Drescher, F. Farrell, M. Matiazzo, A. Pearce, and D. Seargent (Australia), W. de Souza and J. Aguiar (Brazil), J. Finn (Canada), K. Hornoch (Czech Republic), A. Shahin (Dubai, United Arab Emirates), G. Glitscher (Germany), N. Abanda, S. Abdo, W. Abu Alia, E. Al-Ashi, H. Al-Dalee', A. Al-Niamat,K. Al-Tell, and M. Odeh (Jordan), R. Bouma (Netherlands), B. Granslo and O. Skilbrei (Norway), A. Pereira and C. Vitorino (Portugal), J. Atanackov and J. Kac (Slovenia), T. Cooper (South Africa), T. Karhula and P. Schlyter (Sweden), R. Eberst and A. Pickup (UK), R. Keen, T. Mallama, and J. Marcus (USA).
References. Keen, R., 1983, Volcanic aerosols and lunar eclipses: Science, v. 222, p. 1011-1013.
Geologic Background. The enormous aerosol cloud from the March-April 1982 eruption of Mexico''s El Chichón persisted for years in the stratosphere, and led to the Atmospheric Effects section becoming a regular feature of the Bulletin thorugh 1989. Lidar data and other atmospheric observations were again published intermittently between 1995 and 2001; those reports are included here.
Information Contacts: Richard A. Keen, Program for Atmospheric and Oceanic Sciences (PAOS) , 311 UCB, University of Colorado, Boulder, CO 80309 USA.
Colima
Mexico
19.514°N, 103.62°W; summit elev. 3850 m
All times are local (unless otherwise noted)
Surficial fractures preceded a light-colored dome emplaced aseismically
This report describes two visits to the rim of Colima's main crater (17 March and 26 May 2001) and summarizes collateral data collected around that time. On the earlier visit, observers found an enlarged main crater, they noted the disappearance of an older (1994) crater, and they photographed a recent crater with a sulfur-encrusted, warped, and fractured floor. By the time of the later visit, an unusual new dome had appeared, composed of more fragmentary and lighter color clasts than typical for Colima's lava domes. Effusive activity was previously seen during November 1998-February 1999.
Crater rim observations. On 17 March 2001, Nick Varley and Juan Carlos Gavilanes ascended to Colima's crater rim (figures 40 and 41). It was the first visit there since January 1999. Circumnavigating the main crater, they prepared a map of the current crater and environs (figure 40). The main crater was 230-260 m in diameter, 15-40 m deep, and ~1.4 x 10⁶ m3 in volume. Its diameter had grown two-fold larger than it was before the 1998-99 eruption, reaching its largest size since the early 1960s.
On their 17 March visit Varley and Gavilanes found a smaller crater located inside the main crater's N sector (figure 40). This inner crater was assumed to be formed by the 22 February 2001 explosion. The inner crater was then estimated to be 127 m in diameter, 15 m deep, and ~0.2 x 10⁶ m3 in volume. In the NE sector of the inner crater they observed an inflated, buckled, and fractured surface (figure 41). They inferred that this inflated surface stemmed from an intrusion initiated sometime after the 22 February explosion.
Figure 42 records the scene Varley and Gavilanes found when they ascended to the crater rim on 26 May 2001. Close to the inflated surface observed on 17 March they found a new lava dome. It stood ~115 m across its base, ~57 m across its top, ~30 m high, and was ~0.15 x 10⁶ m3 in volume. The two observers also noted that in comparison to conditions witnessed during the previous crater ascent, new and stronger fumarolic zones surrounded the new dome, mainly to its N, NE, and E (figure 40).
Collateral observations. Later review of seismic, deformation, and GOES radiation data (figure 43) showed that dome extrusion may have started on 8 May, a day with distinct increases in both thermal radiation and tilt. No increase in seismic activity was observed; the proposed explanation for this is that the lava was plastic enough to avoid the shear fracturing of surrounding structures. Assuming that the extrusion started on 8 May 2001, the resulting growth rate (for 8-26 May, 19 days) was ~0.1 m3 s-1. Fieldwork in the crater's vicinity took place over a 3-hour interval and included gas sampling. Only a small rockfall was heard.
The new dome appeared anomalous in certain ways. It was not composed of large dark-colored blocks (as observed for the effusive events that occurred during the last 40 years), but instead consisted mainly of smaller-sized blocks with a light-gray color. The new dome could be an example of endogenous dome growth, where no new molten material reaches the surface.
On 1 May 2001 the measured SO2 flux was 200 t/d, and on March 16 it was 145 t/d. These are only slightly higher than mean values recorded during the calm period of 1997, which were less than 100 t/d.
Geologic Background. The Colima complex is the most prominent volcanic center of the western Mexican Volcanic Belt. It consists of two southward-younging volcanoes, Nevado de Colima (the high point of the complex) on the north and the historically active Volcán de Colima at the south. A group of late-Pleistocene cinder cones is located on the floor of the Colima graben west and east of the complex. Volcán de Colima (also known as Volcán Fuego) is a youthful stratovolcano constructed within a 5-km-wide scarp, breached to the south, that has been the source of large debris avalanches. Major slope failures have occurred repeatedly from both the Nevado and Colima cones, producing thick debris-avalanche deposits on three sides of the complex. Frequent recorded eruptions date back to the 16th century. Occasional major explosive eruptions have destroyed the summit (most recently in 1913) and left a deep, steep-sided crater that was slowly refilled and then overtopped by lava dome growth.
Information Contacts: Observatorio Vulcanológico de la Universidad de Colima, Colima, Col., 28045, México; Facultad de Ciencias de la Universidad de Colima, Colima, Col., 28045, México (URL: http://www.ucol.mx/).
Deception Island (Antarctica) — May 2001 Cite this Report
Deception Island
Antarctica
62.9567°S, 60.6367°W; summit elev. 602 m
All times are local (unless otherwise noted)
Moderate seismicity; magnetic and geochemical studies gather new data
During the most recent austral summer, December 2000-March 2001, the Spanish Antarctic Programme (SAP) carried out its yearly survey of Deception Island. Researchers from Spain, Italy, and México took part in the seismological, magnetic, and geochemical study of the entire island.
The seismic network's stations were deployed in a variety of configurations (figure 15). The instruments used were as follows: two dense seismic antennas each with 16 short-period seismometers, two small antennas each with four seismometers, three short-period seismometers, two broadband seismic stations, and four autonomous three-component short-period seismic stations.
Seismicity is summarized in figure 16. Registered seismic events featured volcano-tectonic earthquakes (VT), a few episodes of volcanic tremor, long-period events (LP), and hybrid events (VT + LP). More than 75 VT, 500 LP, and 20 hybrid events were recorded; this constituted moderate activity compared to previous surveys. Hybrid events, which were difficult to detect in previous studies, peaked at the end of January 2001. Volcanic tremor episodes occurred with durations between hours and a few days; workers interpreted these events, together with the LP events, as a consequence of hydrothermal activity.
The magnetic field in the area was monitored using a proton magnetometer deployed near the Argentinean base, which is the position used in previous surveys (figure 17). The recorded values of the magnetic field are being processed and corrected according to external variations in order to observe whether volcano-magnetic effects produced variation in the local magnetic field.
Geochemical investigations consisted of recording gas composition and temperature of the fumaroles in Fumarole Bay and measuring CO2 flux at 26 points around the island (figure 16). The chemical analyses of the fumarolic samples are being processed. Fumarole temperatures averaged ~100°C, similar to values of previous years. The majority of points, including those bordering Fumarole Bay, had a very low flux of CO2. Two of them, however, Murature Point and Cerro Caliente hill (figure 17), had high fluxes. Future studies will conduct similar surveys in order to establish a CO2 flux map for the entire island.
Geologic Background. Ring-shaped Deception Island, at the SW end of the South Shetland Islands, NE of Graham Land Peninsula, was constructed along the axis of the Bransfield Rift spreading center. A narrow passageway named Neptunes Bellows provides an entrance to a natural harbor within the 8.5 x 10 km caldera that was utilized as an Antarctic whaling station. Numerous vents along ring fractures circling the low 14-km-wide island have been reported active for more than 200 years. Maars line the shores of 190-m-deep Port Foster caldera bay. Among the largest of these maars is 1-km-wide Whalers Bay, at the entrance to the harbor. Eruptions during the past 8,700 years have been dated from ash layers in lake sediments on the Antarctic Peninsula and neighboring islands.
Information Contacts: Alicia García and Ramón Ortiz, Dpto. Volcanología, Museo Nacional de Ciencias Naturales, CSIC, José Gutierrez Abascal 2, 28006, Madrid, Spain; Jesús M. Ibáñez, Enrique Carmona, José Benito Martín, and Carmen Martínez, Instituto Andaluz de Geofísica, Apartado 2145, University of Granada, 18071 Granada, Spain; José Luis Pérez-Cuadrado, Universidad de Cartagena, 30202 Murcia, Spain; Mauricio Bretón, Universidad de Colima, Colima, Col., 28045, México; Mario La Rocca, Osservatorio Vesuviano, Via Diocleziano 328, 80124 Napoli, Italy.
Etna
Italy
37.748°N, 14.999°E; summit elev. 3357 m
All times are local (unless otherwise noted)
Strombolian activity and lava flows during January-April 2001
As reported by Sistema Poseidon, activity at Etna (figure 85) during December 2000-8 April 2001 was characterized by episodic Strombolian blasts, steam and ash emissions, and lava flows.
Minor activity during December 2000 through mid-January 2001. Low-intensity gas emissions dominated activity during this period. Observations on 6 December revealed three distinct cavities in the interior of the Bocca Nuova (BN) vent. The two near the center of the crater trended NW, were deep and full of material, and were delineated by pit-craters. The smaller cavity to the SE was encircled by a high wall of scoria; it weakly emitted light brown ash, possibly due to internal collapse. White steam emissions from BN in early January were visible during the early morning hours, and became more evident as each day progressed due to increased humidity. Sporadic ash ejections also occurred.
At the end of December, adverse atmospheric conditions prevented detailed observations, but during rare periods of visibility observers saw snow covering the W flanks of the central crater and Southeast Crater (SEC). A weak intermittent fumarolic emission emerged from the base of the fracture that runs from the SEC to the lava cairn at its base. The SEC also produced weak fumarolic emissions in early January from the W edge of the crater's summit. On the evening of 14 January a weak, diffused illumination was observed at SEC, likely coming from the E edge of the crater, where during recent months there was visible night incandescence.
Increased activity during mid-late January 2001. The BN vent produced abundant steam during the middle of January. Brown ash was weakly emitted on 16 and 19 January; darker ash ejections occurred on the 18th and 21st. Ash fell on the E flank of the volcano for five hours during the morning of the 18th, and weak illumination was visible for 30 minutes that night coming from BN. Ash-and-gas emissions increased toward the end of January. Isolated night glow suggested weak explosive Strombolian activity confined to inside the central crater. Activity alternated between visible degassing and intense phases of ash emission; one particularly acute phase occurred on 31 January.
New activity initiated from SEC on the evening of 15 January. Low-energy Strombolian eruptions were seen at night by distant observers. Activity increased in frequency during 16-17 January, reaching a maximum on 18 January when explosions occurred every 3-4 minutes, interspersed with high-energy episodes that repeated at variable intervals of ~1-2 hours. Ejected material from these events reached ~50 m high on the edge of the SEC, falling back into the crater. Strombolian activity continued through 19 January. Lava began to flow from the radial fracture cutting the N flank of the SEC beginning during the day on 21 January and persisting discontinuously until the end of the month. Intermittent flows formed several finger-like fronts. The flow reached down to ~2,800 m elevation, and remained confined to the Valle del Leone.
Strombolian explosions at Bocca Nuova during February-April 2001. During the nights of 1 and 4 February, frequent illumination was observed in the BN vent. Strombolian activity continued from BN throughout February. As during January, strong degassing and dark gray ash emissions were sporadic. High ambient humidity during morning hours made gas plumes distinct, especially on 10 February; activity was particularly consistent during 20-22 February. The fixed Montagnola camera captured images of frequent flashes from the crater interior, but activity did not extend beyond the crater area.
The BN vent produced increased explosive activity during March from two vents (W and E) inside the depression. The W vent exhibited Strombolian explosions; during some periods these were continuous and sent incandescent material just above the crater rim. A small number of lava fragments fell outside of the crater and rolled down its flanks. Explosive activity at the E vent did not eject material above the crater rim. Alternating degassing and dark gray ash emission continued as in February. Fine-grained material blown by wind fell as far as 2 km from the summit. Activity was more intense on 6 and 28 March when BN emitted copious amounts of ash from the NW and SE sectors of the crater. The Montagnola camera detected almost continuous night illumination of the crater, suggesting Strombolian activity from multiple vents. Strombolian activity also occurred from Northeast Crater, although it was rarely visible.
Strombolian activity and ash emission from BN continued throughout April. On the evening of 4 April an intense phase at the S zone of the central crater included ejection of some incandescent material above the crater rim. During 7-8 April, a slight increase in the frequency of ash emissions was observed, while night-time incandescence was sporadic.
Lava flows from Southeast Crater during February-April 2001. Early in February lava emission from the N-flank of SEC diminished; it produced modest regular lava flows for the rest of the month. On 4 February observers saw intense flashes that indicated explosive lava ejection from the fracture. Flashes and illumination visible in camera footage evidenced erratic SEC effusive activity throughout February. One early February lava flow from a vent at 3,100 m continued for several days. Bubbles frequently burst from the lava, indicating high gas content within the magma. The lava flow was ~2 m wide near the source, grew to 5 m wide toward the base, and reached an elevation of 2,900 m. During mid-February a vent at 3,150 m elevation produced a flow down a 2-m-wide canal. The flow ran N initially, but ~100 m downslope it headed E and formed a lava tube about 20-25 m wide. The flow moved toward the Valle del Bove, in the direction of Monte Sinome; it continued through the end of the month and reached 2,600 m elevation.
Through mid-March lava continued to flow from the fracture at 3,080 m elevation on the SEC's N flank. Near the vent the flow was ~1 m wide and ~80 cm deep. After having flowed less than 2 m it divided into two forks that ran roughly parallel to each other. The principal flow retained a width of ~1 m and headed N for ~100 m before deviating toward the NE and reaching an elevation of ~2,800 m. The secondary flow was about half a meter in width; it traveled at ~4 m/s near the fork and ~2 m/hour near the flow front where it spread to ~5 m across at an elevation of about 2,970 m. Effusive activity appeared to diminish on 23 March. The vent observed three days before was no longer active. A single flow was fed by a new vent about 5 m below the previous vent. A steep slope at the vent's mouth produced flow velocities of ~6 m/minute. This flow reached down to an elevation of 2,950 m, where it traveled at 1 m/hour over the flows of three days before. The flow front measured 5 m wide and 1 m high. On 30 March conspicuous white vapor issued from the SEC.
A 4 April survey of the flows revealed a moderate flow from the N flank of SEC. The vent had built up a small cone ~6 m tall at 3,095 m elevation. Two flows, each ~1 m wide and 1-2 m deep, traveled away from the cone and joined together 20-25 m away, flowing E. The flows in the two channels moved at a speed of ~0.1 m/s and an estimated 0.2-0.4 m3 of molten material emerged each second. The maximum length of the overall flow was ~350 m. During the evening of 8 April strong, persistent illumination from the E base of SEC probably indicated a new lava flow. The incandescence was distinctly visible as it reflected off of a steam plume from the summit crater.
Geologic Background. Mount Etna, towering above Catania on the island of Sicily, has one of the world's longest documented records of volcanism, dating back to 1500 BCE. Historical lava flows of basaltic composition cover much of the surface of this massive volcano, whose edifice is the highest and most voluminous in Italy. The Mongibello stratovolcano, truncated by several small calderas, was constructed during the late Pleistocene and Holocene over an older shield volcano. The most prominent morphological feature of Etna is the Valle del Bove, a 5 x 10 km caldera open to the east. Two styles of eruptive activity typically occur, sometimes simultaneously. Persistent explosive eruptions, sometimes with minor lava emissions, take place from one or more summit craters. Flank vents, typically with higher effusion rates, are less frequently active and originate from fissures that open progressively downward from near the summit (usually accompanied by Strombolian eruptions at the upper end). Cinder cones are commonly constructed over the vents of lower-flank lava flows. Lava flows extend to the foot of the volcano on all sides and have reached the sea over a broad area on the SE flank.
Information Contacts: Sistema Poseidon, a cooperative project supported by both the Italian and the Sicilian regional governments, and operated by several scientific institutions (URL: http://www.ct.ingv.it/en/chi-siamo/la-sezione.html).
Piton de la Fournaise (France) — May 2001 Cite this Report
Piton de la Fournaise
France
21.244°S, 55.708°E; summit elev. 2632 m
All times are local (unless otherwise noted)
Eruptions during late March 2001 and on 11 June 2001
In 1998, after 5.5 years of calm, Piton de la Fournaise erupted twice. Two eruptions occurred in 1999, while in 2000, three eruptions took place (BGVN 25:12). Only 4.5 months after the last eruption in October 2000, Piton de la Fournaise erupted once more on 27 March 2001 at 1320. As described below, precursor extensometer and tiltmeter measurements, in conjunction with historical data, provided an accurate forecast of an eruption sometime near the end of March. The March eruption was followed by another at 1350 on 11 June.
Geodetic measurements. After 1 January 2001, the Château Fort extensometer showed a significant, regular increase (figure 61), and, beginning 21 January, the Magne extensometer showed the same tendency. Plots of the measurements from these two stations show remarkably constant slopes of 0.0038 mm/day at Château Fort and 0.005 mm/day at Magne. In 1999 and 2000, such variations were observed 2-3 months before the eruptions of 19 July 1999, 23 June 2000, and 23 October 2000 on the E and SE flanks of the volcano. Using these historical data and the fact that the maximal variation of spread for all these eruptions was 0.25 to 0.35 mm for the Château Fort station and 0.3 to 0.5 mm for the Magne station, extrapolations of the deformation were used to forecast a late March eruption.
Almost simultaneous with the extensometer-measured tilt increases, important variations were registered by the Dolomieu Sud and La Soufrière tiltmeters. The Dolomieu Sud radial tiltmeter measurements increased considerably after 6 January 2001 compared to those for the previous two years; similar variations were observed before the 12 October 2000 and 28 September 1999 eruptions (figure 62). The measured increase of ~110 µrad of radial tilt as observed at Dolomieu Sud between January and March 2001 could not be explained by temperature changes. Rather, it indicated a significant inflation of the summit prior to the eruption.
Seismicity. Intense seismicity on Piton de la Fournaise increased early in 2001. During 20 January-10 February, 133 tremors were registered (generally M < 0.5). Then, after 13 days of calm, a new series of tremors began on 25 February that included 315 events. These events were weak (M < 1.5), but increased in intensity with respect to the events earlier in the year. On 3 March, 40 summit tremors occurred within one hour, and a total of 126 tremors were observed that day. All of these tremors took place beneath the Dolomieu crater at ~0.5 km below sea level.
The number of tremors increased again starting on 12 March and continuing until the eruption on 27 March. Tremor hypocenters measured on 23 March occurred 1.5 km below sea level, but rose the next day to 0.5 km below sea level. Seismometers recorded 145 tremors on 25 March. Tremor intensity increased gradually during the period with numerous events of M 1.0-1.9. In addition, precursory seismicity and deformation measurements were correlated as shown in figure 63. Figure 63 indicates that, in January, summit inflation preceded the first period of seismicity by about 10 days, while the second increase in inflation, which began on 24 January, occurred simultaneously with the second period of strong seismicity. The latter continued essentially until the eruption. On 27 March, 120 tremors were detected, including one at 1255 of M 2.0. At 1320, an eruption began on the SE flank. Tremor that began with the eruption on 27 March diminished regularly until 2 April; after eight days of activity, the eruption ended on 4 April at about 0700.
Ground observations. Ground observations were undertaken several hours after the eruption began. Five major fissures were active; their exact positions were determined later using GPS measurements. The first fissure, ~250 m long, began 100 m below the edge of Dolomieu Sud while the last ended between Piton Morgabim and the Signal de L'Enclos. The general trend of the fissures was ESE.
Three significant aa flows were observed. The first was fed by the highest fissure and descended along the S flank ending at about 1,800 m elevation. A second flow, which began at a lower altitude, wound around the Piton Morgabim toward the S and along the path of the previous flows from the June and October 2000 eruptions. The most significant flow was fed by the lowest fissure, which went N along the path of the June and October 2000 flows and came down the Grandes Pentes. By 27 March at 1700, this flow reached an elevation of 700 m, descending to 500 m on 28 March and continuing down to 350 m elevation on 29 March. These fissures were active for only several hours, and on 28 March the eruption became concentrated on the last fissure where the cone Piton Tourkal formed during the next few days. The cone was located midway between the Signal de l'Enclos and the Piton Morgabim (figure 64).
Between 27 March and 3 April, a total of nine samples were gathered for chemical analysis. On 3 April, the lava temperature was measured to be 1,150°C. No significant variation in the rates of radon emission was measured during 27 March - 3 April.
Continuous extensometer and tiltmeter variations occurred, and increased seismic activity was recorded beginning in late May. A short seismic crisis with 126 recorded events started on 11 June at 1327 and, at 1350, extensometer variations indicated that a new eruption had started on the SE flank in the same area as the 27 March eruption. En echelon fissures formed on the S flank at ~2,500 m elevation, 200 m below the Dolomieu summit crater. More fissures were located between 2,000 and 1,800 m elevation on the E flank at the southern base of crater Signal de l'Enclos and N of the Ducrot crater. Several lava flows descended the Grand Brûlé but progressed very slowly; at 1700 the front of the lava flow reached an elevation of 1,450 m. On the morning of 12 June, only the lower fissure at 1,800 m elevation was still active. It measured ~200 m long, with several lava fountains that sent material 20-30 m high. The lava flow followed the N border of the 27 March lava flow and reached about 400 m elevation on the Grand Brûlé.
Geologic Background. Piton de la Fournaise is a massive basaltic shield volcano on the French island of Réunion in the western Indian Ocean. Much of its more than 530,000-year history overlapped with eruptions of the deeply dissected Piton des Neiges shield volcano to the NW. Three scarps formed at about 250,000, 65,000, and less than 5,000 years ago by progressive eastward slumping, leaving caldera-sized embayments open to the E and SE. Numerous pyroclastic cones are present on the floor of the scarps and their outer flanks. Most recorded eruptions have originated from the summit and flanks of Dolomieu, a 400-m-high lava shield that has grown within the youngest scarp, which is about 9 km wide and about 13 km from the western wall to the ocean on the E side. More than 150 eruptions, most of which have produced fluid basaltic lava flows, have occurred since the 17th century. Only six eruptions, in 1708, 1774, 1776, 1800, 1977, and 1986, have originated from fissures outside the scarps.
Information Contacts: Thomas Staudacher and Jean Louis Cheminée, Observatoire Volcanologique du Piton de la Fournaise, Institut de Physique du Globe de Paris, Institut National des Sciences de l'Univers, 14 RN3 - Km 27, 97418 La Plaine des Cafres, Réunion, France (URL: http://www.ipgp.fr/fr/ovpf/observatoire-volcanologique-piton-de-fournaise).
Galeras
Colombia
1.22°N, 77.37°W; summit elev. 4276 m
All times are local (unless otherwise noted)
Low-level seismicity and eruptive activity during April 2000-March 2001
According to reports by the Observatorio Vulcanológico y Sismológico de Pasto (OVSP), volcanic unrest at Galeras continued during 16 April 2000-March 2001. However, OVSP reports for November-December 2000 were not available when this report went to press.
Two small eruptive episodes occurred on 22 April and 18 May 2000. The associated seismic records included long-period (LP) events and spasmodic tremor similar to those registered during eruptive episodes on 21 March and 5 April 2000 (BGVN 25:03). Elevated seismicity continued with two volcano-tectonic (VT) events on 30 July and 17 September 2001. These events were focused ENE of the active cone; previous activity initiating within this source region was sporadic. During January-March 2001 activity continued at low levels. VT events occurred during mid- to late-January, and were followed by similar events during late March.
New crater formation during April 2000. Spasmodic tremor starting on 22 April at 1558 lasted for 175 seconds, followed by three smaller tremor episodes with durations of 90, 320, and 170 seconds, respectively. Five small LP events also occurred; the final LP event was recorded at 1634. Peak frequency for the main event was ~5.0 Hz (figure 91), but at the nearest station to the active crater other frequencies ranging from 1 to 13 Hz were observed.
Field inspections on 27 April revealed that within the Chavas fumarole area, on the WSW edge of the main crater, a new crater approximately 8 x 4 m in area and 1.5 m deep had formed. Several gas-emitting fissures were observed along the crater wall. Temperatures recorded at the border of the new crater on 27 April and 1 May were 408°C and 393°C, respectively, which are not anomalously higher than those observed previously.
During 16 April-30 June 2000, radon-222 emissions from soil monitored at several stations around Galeras showed values of 78-2,966 picocuries/liter (pCi/l). These levels are similar to those found in previous months. The highest value corresponded to the Sismo 2 station, located 5 km NE of the summit.
Activity during May-October 2000. An eruptive event at 1411 on 18 May was seismically characterized by an initial LP event with a dominant frequency of ~2.1 Hz figure 92), followed by five spasmodic tremor episodes and nine more LP events. The last LP event was recorded at 1806 later that day.
On 30 July at 0935 an earthquake swarm occurred 9 km ENE of the active cone, in the suburban area adjacent to the city of Pasto. The main event (M 4.5) was distinctly felt inside the city and in other neighboring communities. Aftershocks of lesser magnitude (M 2.3-3.4) continued through 4 August.
On 17 September 2000 at 2246 residents of Pasto and neighboring communities felt a M 3.9 event. Seismographs also detected aftershocks of M 2.6. Figure 93 shows a map view of volcano-tectonic earthquakes that occurred during July-October 2000. According to a report, movement of fluids within volcanic conduits remained at low levels.
During 1 July-30 October 2000, radon-222 emission from soil monitored around Galeras showed average values lower than 3,000 pCi/l. Peak values at the Zanjón station, located 16 km NW of the summit, reached 9,620 pCi/l on 8 September. The highest values at the San Antonio 2 station, 14 km W of the summit, occurred on 13 July and 1 September with recorded values of 15,119 pCi/l and 11,587 pCi/l, respectively.
Activity during January-March 2001. A VT earthquake swarm located near the active crater occurred during 15-17 January. The swarm was composed of 17 quakes with depths less than 3.5 and M < 1.3. A single event on 24 January and two more on 26 January (M 2.3-2.7, depths of 6-8 km) followed. Seismometers recorded three further events (M 2.5-2.7, depths of 8-9 km) on 20, 21, and 23 March. The majority of the January-March 2001 earthquakes occurred NE of the summit and were felt in the neighboring communities of Pasto and Puyito. During the first quarter of 2001, instruments detected 52 events located within the active cone area (figures 94 and 95).
The occurrence of four tornillo ("screw-type") events with dominant frequencies of 3.2, 8.7, 12.8, and 18.7 Hz suggested that flow of volcanic material within interior conduits continued at low levels. Tremor episodes of short duration were also recorded. Spectral analysis of the registered tremor showed dominant frequencies of 2.3-3.5 Hz.
Field workers at Galeras near the Chavas fumarole (W of the active crater) reported hearing a sound similar to the rushing current of a river, which correlated with increased rates of gas emission.
During 2000 the temperature of the Deformes fumarole (S of the active crater) measured an average of 111°C and showed a slight cooling over time. The fumarole temperature averaged 100°C during the first three months of 2001.
During 1 January-31 March 2001, radon-222 emission from soil measured up to 4,000 pCi/l at most stations. The San Juan 1 station (10 km NE of the active cone) and Sismo 5 station (7 km N of the active cone) detected higher values of 6,754 pCi/l and 5,455 pCi/l, res
Geologic Background. Galeras, a stratovolcano with a large breached caldera located immediately west of the city of Pasto, is one of Colombia's most frequently active volcanoes. The dominantly andesitic complex has been active for more than 1 million years, and two major caldera collapse eruptions took place during the late Pleistocene. Long-term extensive hydrothermal alteration has contributed to large-scale edifice collapse on at least three occasions, producing debris avalanches that swept to the west and left a large open caldera inside which the modern cone has been constructed. Major explosive eruptions since the mid-Holocene have produced widespread tephra deposits and pyroclastic flows that swept all but the southern flanks. A central cone slightly lower than the caldera rim has been the site of numerous small-to-moderate eruptions since the time of the Spanish conquistadors.
Information Contacts: Patricia Ponce, Observatorio Vulcanológico y Sismológico de Pasto (OVSP), INGEOMINAS, Carrera 31, 18-07 Parque Infantil, P.O. Box 1795, Pasto, Colombia (URL: https://www2.sgc.gov.co/volcanes/index.html).
Mayon
Philippines
13.257°N, 123.685°E; summit elev. 2462 m
All times are local (unless otherwise noted)
April 2000-May 2001 summary; dome growth beginning in January 2001
Since the last report (BGVN 25:04), activity was variable at Mayon. The following report covers activity during April 2000-May 2001, but does not include the event that began on 24 June 2001; details of that eruption will appear in a subsequent issue. This report was compiled from reports posted on the Philippine Institute of Volcanology and Seismology (PHIVOLCS) website.
April-June 2000. Mayon's hazard status remained at 2 (on a scale of 0-5) as of 2 April. At that time, no entry was allowed within the 6-km-radius Permanent Danger Zone (PDZ) and the 7-km-radius Extended Danger Zone (EDZ) in the SE sector. Low-frequency (LF) and high-frequency (HF) earthquakes, and short-duration HF tremors, were recorded. Around this time, SO2 flux increased from 3,600 metric tons/day (t/d) to 6,210 t/d. The summit crater emitted a weak to moderate steam plume which drifted WSW. Faint crater glow was observed during the evening. Similar activity continued through the end of April, although the SO2 emission rate had decreased to 4,061 t/d as of 26 April.
Seismicity during 2-3 May included seven LF earthquakes with relative amplitudes of 55-56 mm, but there was no other variation in activity. On May 3 PHIVOLCS raised the Alert Level from 2 to 3. The next Mayon volcano bulletin, issued on 1 June, noted that SO2 flux on 21 May was 680 t/d, slightly above the baseline of 500 t/d.
By 1 June the hazard status had been decreased to Alert Level 0. Seismicity had also decreased markedly; only two HF events and two short- duration HF tremors were reported on 1 June. Crater illumination resumed the same day. SO2 flux readings were not available for the month.
July 2000. On 16 July at 0629 a phreatic explosion occurred that was visible only from the E due to thick clouds on the other sides. The explosion produced a small volume of gray ash as well as steam clouds that rose ~1 km above the summit before drifting NNE. Mayon Volcano Observatory at Ligñon Hill (MVO) seismographs recorded an explosion-type seismic signal that lasted for 1.5 minutes. Tiltmeters at Buang and Mayon Resthouse stations did not, however, detect significant ground movement, which suggested that the explosion was caused by shallow activity.
On 30 July at 1315, Mayon produced a mild ash ejection. MVO reported a small ash plume that rose 1 km. Seismicity associated with the event lasted for about 1 minute. As with the 16 July event, other monitoring, including SO2 flux readings, did not indicate further activity. Mayon's Alert Level was undisclosed for the month.
August-December 2000. A mild ash ejection at 1432 on 31 August sent a small gray ash cloud ~1 km above the summit. An activity update on 1 September noted that small explosions similar to those in July had occurred in the previous weeks. PHIVOLCS suggested that these shallow explosions were probably due to rainwater seepage into the February-March 2000 lava deposits (BGVN 25:04). No further reports were issued in 2000.
January 2001. A resurgence of activity was observed as of [8] January. MVO reported an apparently growing lava dome which emitted voluminous gases from its summit. During the previous week there had been increases in both the number of earthquakes and in tilt, presumably due to magma ascent. [These] events led PHIVOLCS to set the Alert Level to 2.
On 10 January aerial observers noted that the dome appeared to have a spiny, blocky surface, which resulted from the crater floor being pushed upward by rising magma. Slight incandescence was also emanating from the crater. Correlation spectrometer (COSPEC) measurements detected an elevated SO2 emission rate of 2,300 t/d. Seismicity also remained elevated. Ground deformation measured on the N flank continued to indicate tilting. Over the next week, activity remained high. Crater glow, however, was weak, and only visible from a distance with a telescope.
Activity escalated further after 19 January. Sixty seismic events occurred on 20 January, and a high number of earthquakes continued to occur. SO2 flux spiked up to ~8,070 t/d. A brown steam puff rose from the lava dome at 0932 on 22 January. This brief emission of ash-laden steam coincided with a volcanic earthquake. A second ash emission occurred later the same day. Alert Level 3 became effective as of 25 January. Five ash emissions rose from Mayon's summit on 28 January followed by two more the next day. Plumes rose ~500 m and generally drifted WNW or NW. The earthquakes associated with these late January events were noticeably larger than those in previous weeks. Inflation of the edifice was also detected.
February-May 2001. The Alert Level remained at 3 for the entire period; high seismicity and moderate steaming prevailed. Inflationary trends were shown by tiltmeter readings through the end of March, when uplift tapered off slightly. On 24 February a small ash-and-steam plume rose 250 m and was blown ENE. SO2 flux decreased through February with a reading of 2,889 t/d on the 28th. Crater glow was observed rarely during February, and not at all during March.
On 2 April the SO2 flux rose to 7,205 t/d, but then dropped to 444 t/d two days later. SO2 emission rates ranged from ~2,000 to 4,000 t/d during the rest of April. Low-intensity crater glow was observed sporadically during the month. On 7 May more intense crater glow was observed. A small ash emission occurred at 1752 on 11 May and sent material 50 m above the summit.
On 12 May a series of explosions were detected by a seismometer S of the summit. Ash ejection occurred, and late in the day the SE portion of the dome partially collapsed, causing a small lava avalanche that reached ~300 m down into Bonga Gully. Following the avalanche, MVO workers noted incandescence at the dome and continuing rockfalls into the gully. Workers speculated that active magma transport upward toward the crater was increasing.
Rockfalls due to molten lava fragments rolling down from the dome dominated activity during 13-14 May. When conditions cleared briefly on 14 May observers saw that the partial dome collapse had produced a V-shaped gash; this breach was the source of the outpouring lava. Avalanches had reached 500 m downslope as of this date.
Rockfalls and lava emissions ceased on 15 May but resumed the following day. Fresh lava began to refill the previously formed gash. SO2 flux remained high, and tiltmeters detected consistent inflation through 31 May. Similar activity, accompanied by elevated seismicity that included rockfall-induced signals, continued through the month.
Geologic Background. Symmetrical Mayon, which rises above the Albay Gulf NW of Legazpi City, is the most active volcano of the Philippines. The steep upper slopes are capped by a small summit crater. Recorded eruptions since 1616 CE range from Strombolian to basaltic Plinian, with cyclical activity beginning with basaltic eruptions, followed by longer term andesitic lava flows. Eruptions occur predominately from the central conduit and have also produced lava flows that travel far down the flanks. Pyroclastic flows and mudflows have commonly swept down many of the approximately 40 ravines that radiate from the summit and have often damaged populated lowland areas. A violent eruption in 1814 killed more than 1,200 people and devastated several towns.
Information Contacts: Raymundo S. Punongbayan and Ernesto Corpuz, Philippine Institute of Volcanology and Seismology (PHIVOLCS), C.P. Garcia Avenue, U.P. Diliman, 1101 Quezon City, Philippines (URL: http://www.phivolcs.dost.gov.ph/).
Niuafo'ou
Tonga
15.6°S, 175.63°W; summit elev. 260 m
All times are local (unless otherwise noted)
New hot spring in caldera during May-June 1999
On 8 May 1999 a group of natives were traveling around the E shore of Vai Si'i, the smaller of the two lakes that occupy the caldera in the center of the island. The water level in the lake was reported to be noticeably higher (about 0.5 m) than usual. At a locality on the E shore of the lake, below the caldera wall (figure 3) a new hot spring had formed. At the time of this observation it was below the level of the lake. Bubbles were being produced from the site and the water was noticeably warmer than usual.
This report of the new hot spring was communicated to Paul Taylor, a volcanic geologist who was conducting a workshop on the island during the first week of June 1999. When Taylor visited the lake on 1 June the water level had returned to its normal level, but the hot spring was clearly present in a small embankment on the side of the track that followed the edge of the lake. A small amount of steam and a quantity of hot water were still being produced by the spring at that time. The temperature of the water was estimated to be about 70-80°C. A small stream of the warm water was flowing across the track and into Vai Si'i. A strong smell of sulfur was present in the immediate area of the spring. A large deposit of dark, sulfur-rich mud was present along the shore within Vai Si'i near the new hot spring. Vegetation had withered noticeably and a large number of dead fish were present along the shoreline. The new hot spring represents the first reported activity in the NE part of the central caldera, and the first activity reported on the island in more than a decade.
Geologic Background. Niuafo'ou ("Tin Can Island") is a low 8-km-wide island that forms the summit of a largely submerged basaltic shield volcano in the north central Lau Basin about 170 km W of the northern end of the Tofua volcanic arc. The circular island encloses a 5-km-wide caldera that is mostly filled by a lake whose bottom extends to below sea level. The inner walls of the caldera drop sharply to the lake, named Big Lake (or Vai Lahi), which contains several small islands and pyroclastic cones on its NE shore. Eruptions recorded since 1814, mostly from circumferential fissures on the west-to-south side of the island, have often damaged villages. A major eruption in 1946 forced evacuation of most of its 1,200 inhabitants.
Information Contacts: Paul W. Taylor, Australian Volcanological Investigations, PO Box 291, Pymble, NSW 2073, Australia.
San Cristobal (Nicaragua) — May 2001 Cite this Report
San Cristobal
Nicaragua
12.702°N, 87.004°W; summit elev. 1745 m
All times are local (unless otherwise noted)
Small gas-and-ash plumes during May and June 2001 cause ashfalls
Beginning on 11 May 2001 volcanic activity increased above normal levels, with small eruptions producing gas-and-ash clouds that deposited small amounts of ash on a neighboring town. The previous report of anomalous volcanic activity at San Cristóbal was in May 2000 when a series of lahars occurred as a result of the remobilization of ash that had been deposited on the volcano from the 20 November eruption (BGVN 25:02 and 25:05).
On 22 July 2000, ten months prior to the May 2001 eruption, Alain Creusot visited the summit of the volcano. He reported that seismic activity during 18-19 July caused two lakes to empty that were observed during a previous trip. He also found that active fissures inside the crater were partially sealed, which caused the intensity of degassing to decrease.
INETER reported that on 11 May 2001 tremor began to rise at a seismic station on San Cristóbal (figure 9). The tremor reached a maximum level at noon and then slightly diminished, but stayed at relatively high levels for several days. Seismic activity during this period exceeded the maximum level of seismicity throughout the entire December 1999-February 2000 eruption (BGVN 25:02). Beginning on 11 May INETER personnel stationed near the summit of the volcano occasionally observed small plumes of volcanic gas with small amounts of ash emanating from the volcano. In contrast, on 10 May very low levels of gas were emitted from the crater. On 14 May observers noted that gas emissions with small amounts of ash continued. On 17 May the level of seismic activity significantly increased, and pulses of gas and ash rose ~100 m above the crater rim. Small amounts of ash fell in the town of Santa Barbara, 14 km SW of the volcano.
INETER noted that rain could mix with ash deposited on the flanks of the volcano and generate dangerous lahars. This occurred after the 1999-early 2000 eruption when rainfall in May 2000 mixed with ash that accumulated on the flanks of the volcano. The lahars were especially strong in the S part of the volcano.
According to news reports, on 21 June an explosion at San Cristóbal sent an ash cloud to a maximum height of 800 m. The cloud extended approximately 25 km downwind of the crater, and ash fell in the town of Chinandega, ~15 km SW of the volcano.
Geologic Background. The San Cristóbal volcanic complex, consisting of five principal volcanic edifices, forms the NW end of the Marrabios Range. The symmetrical 1745-m-high youngest cone, named San Cristóbal (also known as El Viejo), is Nicaragua's highest volcano and is capped by a 500 x 600 m wide crater. El Chonco, with several flank lava domes, is located 4 km W of San Cristóbal; it and the eroded Moyotepe volcano, 4 km NE of San Cristóbal, are of Pleistocene age. Volcán Casita, containing an elongated summit crater, lies immediately east of San Cristóbal and was the site of a catastrophic landslide and lahar in 1998. The Plio-Pleistocene La Pelona caldera is located at the eastern end of the complex. Historical eruptions from San Cristóbal, consisting of small-to-moderate explosive activity, have been reported since the 16th century. Some other 16th-century eruptions attributed to Casita volcano are uncertain and may pertain to other Marrabios Range volcanoes.
Information Contacts: Wilfried Strauch and Virginia Tenorio, Department of Geophysics, Instituto Nicaragüense de Estudios Territoriales (INETER), P.O. Box 1761, Managua, Nicaragua (URL: http://www.ineter.gob.ni/); Alain Creusot, Instituto Nicaraguense de Energía, Managua, Nicaragua (URL: http://www.ine.gob.ni/); La Noticia (URL: http://www.lanoticia.com.ni/); El Nuevo Diario (URL: http://www.elnuevodiario.com.ni/); La Prensa (URL: http://www.laprensa.com.ni/).
Sturge Island (Antarctica) — May 2001 Cite this Report
Sturge Island
Antarctica
67.4°S, 164.83°E; summit elev. 1167 m
All times are local (unless otherwise noted)
Elongate cloud on 12 June possibly a result of volcanic emissions
An unusual cloud formation was spotted on 12 June satellite imagery from the Balleny Islands region by Petty Officer Eugenia Dowling, of the U.S. National Ice Center, while performing a weekly analysis of Ross Sea imagery. In addition to AVHRR (Advanced Very High Resolution Radiometer), the National Ice Center uses OLS (Optical Line Scan) Imagery from a Defense Meteorological Satellite (visible/IR, 0.55 km resolution). The cloud was seen in OLS imagery and brought to the attention of Paul Seymour, who then forwarded it for further evaluation to Ralph Meiggs, Applied Technology Branch Chief and part of the NOAA Operational Significant Event Imagery team. From there it came to the attention of the Washington Volcanic Ash Advisory Center (VAAC), who consulted with volcanologists and other international meteorologists familiar with identifying volcanic plumes from satellite data.
Preliminary interpretations based on satellite data were made by analysts in the United States (NOAA/Washington VAAC), Australia (Bureau of Meteorology/Darwin VAAC), and New Zealand (MetService NZ/Wellington VAAC). More detailed research and analysis was provided by Fred Prata of Australia's Commonwealth Scientific and Industrial Research Organisation (CSIRO), Atmospheric Research Division. Thoughtful comments were also provided by Steve Pendelbury and Neil Adams of the Australian Bureau of Meteorology.
The feature was first seen on AVHRR imagery from 1352 UTC on 12 June 2001. It appeared to be almost detached from the island on AVHRR images at 1631 and 1652, but was still visible emanating from the island on MODIS imagery at 2245.
Preliminary interpretations from Volcanic Ash Advisory Centers. Based on analysis of NOAA-14, -15, and -16 AVHRR imagery by the Washington VAAC, the plume reached a size of ~20 x 200 km and an altitude of ~1,300 m (later analysis, below, showed the plume to be much higher); temperatures were estimated to be about -53°C (220 K). Channel differencing revealed no ash content, which suggests that the cloud was mainly steam. A short video was created from satellite imagery showing the progression of the plume.
During a discussion with Andrew Tupper (Darwin VAAC), Lance Cowled, a senior meteorologist in the Tasmania/Antarctic office of the Australian Bureau of Meteorology, noted that at first sight it looked like a banner cloud shed by the island that developed with the onset of cirrus overcast thickening, but that it may have been caused by an interaction between the moisture field and any gas being emitted. The summit of Sturge Island has a lower elevation (1,167 m) than both nearby Young Island (1,340 m) and Buckle Island (1,239 m). With this in mind, Tupper stated that the chance of a banner cloud forming only on Sturge without some volcanic influence was less likely, but difficult to know without more topographical knowledge of the islands.
James Travers, Operations Manager for the Aviation Services Division of the MetService NZ and Wellington VAAC, stated that, based on his experience, the feature was more likely to be associated with volcanic activity rather than with an orographically induced cloud.
Analysis by Australian CSIRO Atmospheric Research. Fred Prata (CSIRO Atmospheric Research) obtained MODIS (Moderate Resolution Imaging Spectroradiometer), ATSR-2 (Along Track Scanning Radiometer), and AVHRR-2 LAC (Local Area Coverage) data for this mysterious plume seen on AVHRR GAC (Global Area Coverage) data. His analysis and interpretation follows. "My first impression was that it was volcanic in origin. However, the AVHRR LAC, MODIS and ATSR-2 data do not show an ash signature when processed using a technique that usually discriminates ash (figure 1). So, either there was no ash or it's not volcanic. The case for it being volcanic with no ash is sustainable as the MODIS 7.3 µm channel does give an indication of SO2, but this signal is weaker than normal (figure 2). It is also possible that the ash is there but the signal is concealed by ice coating the ash. We have seen a few instances of this in the past. The plume could also be mostly steam (and then ice or liquid water drops once in the atmosphere). The case for it not being volcanic relies on the observation that there were winds streaming over these islands which spawned a cloud (looking like a banner cloud) in the lee of Sturge Island. You can easily convince yourself that this is possible when looking at the NOAA animation. I have examined MODIS 250-m data (at different times of year) and found that when Sturge forms these clouds the other islands also form clouds (Buckle and Young) and more often the clouds are lee waves rather than banner clouds.
"Looking at AVHRR temperatures I find that the thickest part of the plume (near the island) is at around 213 K (12 µm) and the surrounding scene temperatures are 250 K or higher. This puts the cloud top at around 6 km assuming a lapse rate of 6.5 K per km and the cloud is opaque (which it isn't quite). The cloud also extends a long way downwind (I calculate that it is visible for 300 km from Sturge) and there is no such cloud coming off Young or Buckle. Finally, looking at the AVHRR LAC it is apparent that there are regions in the plume that are more opaque - as if there were discrete pulses, possibly from several eruptions (figure 3). So my conclusion is that it is more likely to be an eruption cloud than a banner cloud, but there is a degree of doubt."
Further comments by Australian Bureau of Meteorology. Steve Pendelbury, a Supervisory Meteorologist in the Bureau of Meteorology and his colleague Neil Adams (Senior Meteorologist) identified the plume as a banner cloud, and noted that the "pulses" seen in AVHRR imagery seemed like lee wave activity. The plume was similar to one recorded on AVHRR imagery over Heard Island where orographic banner was suspected. Orographic influence is also suggested because the upwind part of the plume mirrors the breadth of the island. A reason for the plume only being off this island is the differences in island height and perhaps variations in the static stability with height. They noted that the estimated height of the plume top (6 km by Fred Prata's estimation) would mean that ejected volcanic material, albeit even steam, would have had to rise approximately 5 km; this might be difficult in the intrinsically stable atmosphere of high southern latitude waters, but orographic clouds can form that high via vertically propagating waves. Another possibility, assuming that the moisture could have risen to 6 km, is that volcanic venting provided moisture needed to produce a cloud in otherwise invisible lee waves that may be present downwind of all three islands. They agreed that the data are inconclusive.
AVHRR band 4 mosaics from the Casey HRPT ground station, reduced to 4 km resolution, showed a good banner cloud along with a wake cloud evident off Young Island, the northern island in the Balleny Island chain, at 0830 UTC on 5 July image. Another image at 2130 UTC still has evidence of a wake cloud but the banner cloud is no longer visible.
Seismicity. No earthquakes recorded within 100 km of the Balleny Islands during 6-20 June 2001 were present in the USGS National Earthquake Information Center's database as of 20 June.
Summary of interpretations. Basic observations about this cloud/plume are as follows: It is unlikely that this plume contained ash, but there may have been some SO2 content. This plume clearly originated above Sturge Island, but not above the two other Balleny Islands with higher elevations. The cloud was not consistent throughout the period it was observed, exhibiting variable opacity. Explanations can be constructed to explain all of these features that are based on orographic influences, volcanic emissions, or some combination of the two. Local static stability might have assisted cloud formation above this lower-elevation island, but not above the nearby higher islands. Water vapor provided by volcanic emissions may also have resulted in cloud formation, either directly or orographically. Likewise, the variable opacity of the cloud could be caused by pulses of emissions or orographic lee waves. Without independent evidence of volcanism, the satellite imagery is not conclusive.
Background. A 160-km-long chain of volcanic islands forms the Balleny Islands just off the coast of Antarctica's Victoria Land. The islands are located at the southern end of a submarine ridge system that extends north to New Zealand, but is offset by the Indian-Antarctic ridge system. No detailed geologic studies have been conducted in the inaccessible Balleny Islands.
Sturge is the largest and southernmost of the Balleny Islands. The 44-km-long island is completely mantled by an icecap and has a prominent summit, Russel Peak, at the northern end. "Volcanic activity" was reported on a U.S. Navy chart, but no indications of present or past activity were noted in 1959 (Catalog of Active Volcanoes of the World).
Buckle Island is in the center of the Balleny Islands. The elongated, 21-km-long island is capped by a gently sloping icecap that descends steeply to the sea between rocky cliffs. Dark eruption columns were reported during 1839 and 1899.
Young Island is the northernmost and second largest of the Balleny Islands. Captain Balleny, the discoverer of the islands, reported "smoke" issuing from Freeman Peak on Young Island on 12 February 1839. The island has a broad plateau-like summit reaching 1,340 m and is almost completely mantled by ice.
Geologic Background. Sturge is the largest and southernmost of the Balleny Islands, which are located just off the coast of Antarctica's Victoria Land. The 44-km-long island is completely mantled by an icecap and has a prominent summit, Russel Peak, at the northern end. "Volcanic activity" was reported on a U.S. Navy chart, but no indications of present or past activity were noted in 1959 (Catalog of Active Volcanoes of the World). No detailed geologic studies have been conducted in the inaccessible Balleny Islands.
Information Contacts: Grace Swanson, Washington Volcanic Ash Advisory Center (VAAC), Satellite Analysis Branch, NOAA/NESDIS/E/SP23, NOAA Science Center Room 401, Camp Springs, MD 20746, USA (URL: http://www.ssd.noaa.gov/); Fred Prata, Senior Principal Research Scientist, CSIRO Atmospheric Research, PB 1 Aspendale, Victoria 3195, Australia (URL: https://www.cmar.csiro.au/); Steve Pendelbury and Lance Cowled, Weather Services, Bureau of Meteorology, GPO Box 727G, Hobart, Tasmania 7001, Australia; Neil Adams, Antarctic Co-operative Research Centre and Bureau of Meteorology, PO Box 421, Kent Town, SA 5071, Australia; Andrew Tupper, Darwin VAAC, Northern Territory Regional Office, Bureau of Meteorology, PO Box 40050, Casuarina, NT 0811, Australia (URL: http://www.bom.gov.au/info/vaac/); National Ice Center, Federal Building 4, 4251 Suitland Road, Washington, DC 20395 USA (URL: http://www.natice.noaa.gov/); National Earthquake Information Center (NEIC), US Geological Survey, Mail Stop 967, Federal Center Box 25046, Denver, CO 80225, USA (URL: http://earthquakes.usgs.gov/).
Three Sisters (United States) — May 2001 Cite this Report
Three Sisters
United States
44.133°N, 121.767°W; summit elev. 3159 m
All times are local (unless otherwise noted)
Radar interferometry suggests uplift during 1996-2000
United States Geological Survey (USGS) scientists detected a slight uplift of the ground surface over a broad region centered 5 km W of South Sister volcano in the Three Sisters region (figure 1). The area is located within the central Oregon Cascade range, 35 km W of Bend, and 100 km E of Eugene, Oregon. The measured uplift, which occurred during 1996-2000, covered an area ~15-20 km in diameter; the maximum amount of uplift at the region's center was ~10 cm. Several close aerial inspections of the area revealed no unusual surface features.
The uplift was detected by using satellite radar interferometry (InSAR), which uses satellite data to make radar images of the ground surface (figure 1). InSAR can detect even minor (down to a few centimeters) changes in ground elevation over time. Images from 1996 and 2000 were compared and revealed the rise in ground level. The exact timing of uplift between the two dates, or whether it will continue, is unknown, but is being studied further.
The specific cause of the uplift was also uncertain. Uplift in the Three Sisters region may reflect intrusion of a relatively small volume of magma at a possible depth of 7 km. If this is the result of intrusion, it indicates that the region remains active, but does not suggest eruptive activity without additional precursors. In the Three Sisters area, earthquake activity appeared to be at or near background levels and gas emissions were low as of May 2001. The USGS plans to enhance the existing monitoring network in the region to more accurately detect possible precursors and to better understand the uplift phenomenon. Installation of one or more additional seismometers, a global positioning system (GPS) receiver, a resurvey of existing benchmarks and installation of new ones, and periodic airborne and ground-based sampling of gases are all being considered.
References. Wicks, C., Jr., Dzurisin, D., Ingebritsen, S.E., Thatcher, W., and Lu, Z., 2001, Ground uplift near the Three Sisters volcanic center, central Oregon Cascade Range, detected by satellite radar interferometry: in prep.
Geologic Background. The north-south-trending Three Sisters volcano group dominates the landscape of the Central Oregon Cascades. All Three Sisters stratovolcanoes ceased activity during the late Pleistocene, but basaltic-to-rhyolitic flank vents erupted during the Holocene, producing both blocky lava flows north of North Sister and rhyolitic lava domes and flows south of South Sister volcano. Glaciers have deeply eroded the Pleistocene andesitic-dacitic North Sister stratovolcano, exposing the volcano's central plug. Construction of the main edifice ceased at about 55,000 yrs ago, but north-flank vents produced blocky lava flows in the McKenzie Pass area as recently as about 1600 years ago. Middle Sister volcano is located only 2 km to the SW and was active largely contemporaneously with South Sister until about 14,000 years ago. South Sister is the highest of the Three Sisters. It was constructed beginning about 50,000 years ago and was capped by a symmetrical summit cinder cone formed about 22,000 years ago. The late Pleistocene or early Holocene Cayuse Crater on the SW flank of Broken Top volcano and other flank vents such as Le Conte Crater on the SW flank of South Sister mark mafic vents that have erupted at considerable distances from South Sister itself, and a chain of dike-fed rhyolitic lava domes and flows at Rock Mesa and Devils Chain south of South Sister erupted about 2000 years ago.
Information Contacts: Cascades Volcano Observatory (CVO), U.S. Geological Survey (USGS), 5400 MacArthur Blvd., Vancouver, WA 98661 USA (URL: https://volcanoes.usgs.gov/observatories/cvo/); Volcano Hazards Team, USGS, 345 Middlefield Road, Menlo Park, CA 94025-3591 USA (URL: http://volcanoes.usgs.gov/); Pacific Northwest Seismograph Network, University of Washington Geophysics Program, Box 351650, Seattle, WA 98195-1650 USA (URL: http://www.geophys.washington.edu/SEIS/PNSN/); Oregon Department of Geology and Mineral Industries, 800 NE Oregon St., Suite 965, Portland, OR 97232 USA (URL: http://www.oregongeology.org/sub/default.htm).
Ulawun (Papua New Guinea) — May 2001 Cite this Report
Ulawun
Papua New Guinea
5.05°S, 151.33°E; summit elev. 2334 m
All times are local (unless otherwise noted)
Eruption on 30 April 2001 sends an ash cloud to a height of ~13.7 km
On 30 April 2001 a moderate-sized ash cloud from an eruption at Ulawun was visible on Geostationary Meteorological Satellite (GMS), U.S. National Oceanic and Atmospheric Administration (NOAA) weather satellite, and Total Ozone Mapping Spectrometer (TOMS) imagery. There had been no reports of anomalous volcanic activity at Ulawun since the 28 September-2 October 2000 eruption sent an ash cloud 12-15 km above the volcano (BGVN 25:11).
The Darwin VAAC received a pilot report that a "smoke" cloud had been emitted from Ulawun on 30 April at 0730. The Rabaul Volcano Observatory (RVO) confirmed the report. The cloud reached an altitude of ~9 km and drifted NW and SW, expanding to 80-113 km in radius. GMS and NOAA weather satellite imagery indicated that the cloud may have reached a maximum height of ~13.7 km and that the eruption ceased by approximately 1530. By 3 May volcanic activity had decreased, but, because further ash emissions could occur, RVO placed the volcano at Stage 2 Alert. RVO reported that limited evacuations occurred. Ash was not observed on satellite imagery after the 30 April eruption, although ash clouds may have been obscured by meteorological clouds near the volcano.
On 30 April around noon, a few hours after reports of an eruption at Ulawun, the Earth Probe TOMS detected a SO2 cloud over SW New Britain,. A gap between successive TOMS swaths over the volcano unfortunately precluded measurement of the full extent of this cloud. Elevated levels of SO2 were recorded in a region bounded approximately by longitudes 147°E and 150°E (swath edge) and by latitudes 5°S and 7°S, at a maximum distance of ~400 km WSW from Ulawun. The highest SO2 concentrations (38 milli atm cm) were recorded in a NNW-SSE trending region ~300 km WSW of the volcano. Preliminary analysis indicates that the portion of the cloud visible in TOMS imagery contained ~5 kilotons of SO2.
Geologic Background. The symmetrical basaltic-to-andesitic Ulawun stratovolcano is the highest volcano of the Bismarck arc, and one of Papua New Guinea's most frequently active. The volcano, also known as the Father, rises above the N coast of the island of New Britain across a low saddle NE of Bamus volcano, the South Son. The upper 1,000 m is unvegetated. A prominent E-W escarpment on the south may be the result of large-scale slumping. Satellitic cones occupy the NW and E flanks. A steep-walled valley cuts the NW side, and a flank lava-flow complex lies to the south of this valley. Historical eruptions date back to the beginning of the 18th century. Twentieth-century eruptions were mildly explosive until 1967, but after 1970 several larger eruptions produced lava flows and basaltic pyroclastic flows, greatly modifying the summit crater.
Information Contacts: Darwin VAAC, Regional Director, Bureau of Meteorology, Northern Territory Regional Office, PO Box 40050, Casuarina, Northern Territory 0811, Australia (URL: http://www.bom.gov.au/info/vaac/); Simon Carn, Joint Center for Earth System Technology (NASA/UMBC), University of Maryland Baltimore County, 1000 Hilltop Circle Baltimore, MD 21250.