Recently Published Bulletin Reports
Kadovar (Papua New Guinea) An ash plume and weak thermal anomaly during May 2023
San Miguel (El Salvador) Small gas-and-ash explosions during March and May 2023
Ebeko (Russia) Continued explosions, ash plumes, and ashfall during October 2022-May 2023
Home Reef (Tonga) Discolored plumes continued during November 2022-April 2023
Semisopochnoi (United States) Occasional explosions, ash deposits, and gas-and-steam plumes during December 2022-May 2023
Ambae (Vanuatu) New lava flow, ash plumes, and sulfur dioxide plumes during February-May 2023
Ibu (Indonesia) Daily ash explosions continue, along with thermal anomalies in the crater, October 2022-May 2023
Dukono (Indonesia) Continuing ash emissions, SO2 plumes, and thermal signals during October 2022-May 2023
Sabancaya (Peru) Explosions, gas-and-ash plumes, and thermal activity persist during November 2022-April 2023
Sheveluch (Russia) Significant explosions destroyed part of the lava-dome complex during April 2023
Bezymianny (Russia) Explosions, ash plumes, lava flows, and avalanches during November 2022-April 2023
Chikurachki (Russia) New explosive eruption during late January-early February 2023
Kadovar (Papua New Guinea) — June 2023  Cite this Report
Kadovar
Papua New Guinea
3.608°S, 144.588°E; summit elev. 365 m
All times are local (unless otherwise noted)
An ash plume and weak thermal anomaly during May 2023
Kadovar is a 2-km-wide island that is the emergent summit of a Bismarck Sea stratovolcano. It lies off the coast of New Guinea, about 25 km N of the mouth of the Sepik River. Prior to an eruption that began in 2018, a lava dome formed the high point of the volcano, filling an arcuate landslide scarp open to the S. Submarine debris-avalanche deposits occur to the S of the island. The current eruption began in January 2018 and has comprised lava effusion from vents at the summit and at the E coast; more recent activity has consisted of ash plumes, weak thermal activity, and gas-and-steam plumes (BGVN 48:02). This report covers activity during February through May 2023 using information from the Darwin Volcanic Ash Advisory Center (VAAC) and satellite data.
Activity during the reporting period was relatively low and mainly consisted of white gas-and-steam plumes that were visible in natural color satellite images on clear weather days (figure 67). According to a Darwin VAAC report, at 2040 on 6 May an ash plume rose to 4.6 km altitude and drifted W; by 2300 the plume had dissipated. MODIS satellite instruments using the MODVOLC thermal algorithm detected a single thermal hotspot on the SE side of the island on 7 May. Weak thermal activity was also detected in a satellite image on the E side of the island on 14 May, accompanied by a white gas-and-steam plume that drifted SE (figure 68).
Geologic Background. The 2-km-wide island of Kadovar is the emergent summit of a Bismarck Sea stratovolcano of Holocene age. It is part of the Schouten Islands, and lies off the coast of New Guinea, about 25 km N of the mouth of the Sepik River. Prior to an eruption that began in 2018, a lava dome formed the high point of the andesitic volcano, filling an arcuate landslide scarp open to the south; submarine debris-avalanche deposits occur in that direction. Thick lava flows with columnar jointing forms low cliffs along the coast. The youthful island lacks fringing or offshore reefs. A period of heightened thermal phenomena took place in 1976. An eruption began in January 2018 that included lava effusion from vents at the summit and at the E coast.
Information Contacts: Darwin Volcanic Ash Advisory Centre (VAAC), Bureau of Meteorology, Northern Territory Regional Office, PO Box 40050, Casuarina, NT 0811, Australia (URL: http://www.bom.gov.au/info/vaac/); Hawai'i Institute of Geophysics and Planetology (HIGP) - MODVOLC Thermal Alerts System, School of Ocean and Earth Science and Technology (SOEST), Univ. of Hawai'i, 2525 Correa Road, Honolulu, HI 96822, USA (URL: http://modis.higp.hawaii.edu/); Copernicus Browser, Copernicus Data Space Ecosystem, European Space Agency (URL: https://dataspace.copernicus.eu/browser/).
San Miguel (El Salvador) — June 2023 Cite this Report
San Miguel
El Salvador
13.434°N, 88.269°W; summit elev. 2130 m
All times are local (unless otherwise noted)
Small gas-and-ash explosions during March and May 2023
San Miguel in El Salvador is a broad, deep crater complex that has been frequently modified by eruptions recorded since the early 16th century and consists of the summit known locally as Chaparrastique. Flank eruptions have produced lava flows that extended to the N, NE, and SE during the 17-19th centuries. The most recent activity has consisted of minor ash eruptions from the summit crater. The current eruption period began in November 2022 and has been characterized by frequent phreatic explosions, gas-and-ash emissions, and sulfur dioxide plumes (BGVN 47:12). This report describes small gas-and-ash explosions during December 2022 through May 2023 based on special reports from the Ministero de Medio Ambiente y Recursos Naturales (MARN).
Activity has been relatively low since the last recorded explosions on 29 November 2022. Seismicity recorded by the San Miguel Volcano Station (VSM) located on the N flank at 1.7 km elevation had decreased by 7 December. Sulfur dioxide gas measurements taken with DOAS (Differential Optical Absorption Spectroscopy) mobile equipment were below typical previously recorded values: 300 tons per day (t/d). During December, small explosions were recorded by the seismic network and manifested as gas-and-steam emissions.
Gas-and-ash explosions in the crater occurred during January 2023, which were recorded by the seismic network. Sulfur dioxide values remained low, between 300-400 t/d through 10 March. At 0817 on 14 January a gas-and-ash emission was visible in webcam images, rising just above the crater rim. Some mornings during February, small gas-and-steam plumes were visible in the crater. On 7 March at 2252 MARN noted an increase in degassing from the central crater; gas emissions were constantly observed through the early morning hours on 8 March. During the early morning of 8 March through the afternoon on 9 March, 12 emissions were registered, some accompanied by ash. The last gas-and-ash emission was recorded at 1210 on 9 March; very fine ashfall was reported in El Tránsito (10 km S), La Morita (6 km W), and La Piedrita (3 km W). The smell of sulfur was reported in Piedra Azul (5 km SW). On 16 March MARN reported that gas-and-steam emissions decreased.
Low degassing and very low seismicity were reported during April; no explosions have been detected between 9 March and 27 May. The sulfur dioxide emissions remained between 350-400 t/d; during 13-20 April sulfur dioxide values fluctuated between 30-300 t/d. Activity remained low through most of May; on 23 May seismicity increased. An explosion was detected at 1647 on 27 May generated a gas-and-ash plume that rose 700 m high (figure 32); a decrease in seismicity and gas emissions followed. The DOAS station installed on the W flank recorded sulfur dioxide values that reached 400 t/d on 27 May; subsequent measurements showed a decrease to 268 t/d on 28 May and 100 t/d on 29 May.
Geologic Background. The symmetrical cone of San Miguel, one of the most active volcanoes in El Salvador, rises from near sea level to form one of the country's most prominent landmarks. A broad, deep, crater complex that has been frequently modified by eruptions recorded since the early 16th century caps the truncated unvegetated summit, also known locally as Chaparrastique. Flanks eruptions of the basaltic-andesitic volcano have produced many lava flows, including several during the 17th-19th centuries that extended to the N, NE, and SE. The SE-flank flows are the largest and form broad, sparsely vegetated lava fields crossed by highways and a railroad skirting the base of the volcano. Flank vent locations have migrated higher on the edifice during historical time, and the most recent activity has consisted of minor ash eruptions from the summit crater.
Information Contacts: Ministero de Medio Ambiente y Recursos Naturales (MARN), Km. 5½ Carretera a Nueva San Salvador, Avenida las Mercedes, San Salvador, El Salvador (URL: http://www.snet.gob.sv/ver/vulcanologia).
Ebeko
Russia
50.686°N, 156.014°E; summit elev. 1103 m
All times are local (unless otherwise noted)
Continued explosions, ash plumes, and ashfall during October 2022-May 2023
Ebeko, located on the N end of Paramushir Island in the Kuril Islands, consists of three summit craters along a SSW-NNE line at the northern end of a complex of five volcanic cones. Eruptions date back to the late 18th century and have been characterized as small-to-moderate explosions from the summit crater, accompanied by intense fumarolic activity. The current eruption period began in June 2022 and has recently consisted of frequent explosions, ash plumes, and thermal activity (BGVN 47:10). This report covers similar activity during October 2022 through May 2023, based on information from the Kamchatka Volcanic Eruptions Response Team (KVERT) and satellite data.
Activity during October consisted of explosive activity, ash plumes, and occasional thermal anomalies. Visual data by volcanologists from Severo-Kurilsk showed explosions producing ash clouds up to 2.1-3 km altitude which drifted E, N, NE, and SE during 1-8, 10, 16, and 18 October. KVERT issued several Volcano Observatory Notices for Aviation (VONA) on 7, 13-15, and 27 October 2022, stating that explosions generated ash plumes that rose to 2.3-4 km altitude and drifted 5 km E, NE, and SE. Ashfall was reported in Severo-Kurilsk (Paramushir Island, about 7 km E) on 7 and 13 October. Satellite data showed a thermal anomaly over the volcano on 15-16 October. Visual data showed ash plumes rising to 2.5-3.6 km altitude on 22, 25-29, and 31 October and moving NE due to constant explosions.
Similar activity continued during November, with explosions, ash plumes, and ashfall occurring. KVERT issued VONAs on 1-2, 4, 6-7, 9, 13, and 16 November that reported explosions and resulting ash plumes that rose to 1.7-3.6 km altitude and drifted 3-5 km SE, ESE, E, and NE. On 1 November ash plumes extended as far as 110 km SE. On 5, 8, 12, and 24-25 November explosions and ash plumes rose to 2-3.1 km altitude and drifted N and E. Ashfall was observed in Severo-Kurilsk on 7 and 16 November. A thermal anomaly was visible during 1-4, 16, and 20 November. Explosions during 26 November rose as high as 2.7 km altitude and drifted NE (figure 45).
Explosions and ash plumes continued to occur in December. During 1-2 and 4 December volcanologists from Severo-Kurilsk observed explosions that sent ash to 1.9-2.5 km altitude and drifted NE and SE (figure 46). VONAs were issued on 5, 9, and 16 December reporting that explosions generated ash plumes rising to 1.9 km, 2.6 km, and 2.4 km altitude and drifted 5 km SE, E, and NE, respectively. A thermal anomaly was visible in satellite imagery on 16 December. On 18 and 27-28 December explosions produced ash plumes that rose to 2.5 km altitude and drifted NE and SE. On 31 December an ash plume rose to 2 km altitude and drifted NE.
Explosions continued during January 2023, based on visual observations by volcanologists from Severo-Kurilsk. During 1-7 January explosions generated ash plumes that rose to 4 km altitude and drifted NE, E, W, and SE. According to VONAs issued by KVERT on 2, 4, 10, and 23 January, explosions produced ash plumes that rose to 2-4 km altitude and drifted 5 km N, NE, E, and ENE; the ash plume that rose to 4 km altitude occurred on 10 January (figure 47). Satellite data showed a thermal anomaly during 3-4, 10, 13, 16, 21, 22, and 31 January. KVERT reported that an ash cloud on 4 January moved 12 km NE. On 6 and 9-11 January explosions sent ash plumes to 4.5 km altitude and drifted W and ESE. On 13 January an ash plume rose to 3 km altitude and drifted SE. During 20-24 January ash plumes from explosions rose to 3.7 km altitude and drifted SE, N, and NE. On 21 January the ash plume drifted as far as 40 km NE. During 28-29 and 31 January and 1 February ash plumes rose to 4 km altitude and drifted NE.
During February, explosions, ash plumes, and ashfall were reported. During 1, 4-5 and 7-8 February explosions generated ash plumes that rose to 4.5 km altitude and drifted E and NE; ashfall was observed on 5 and 8 February. On 6 February an explosion produced an ash plume that rose to 3 km altitude and drifted 7 km E, causing ashfall in Severo-Kurilsk. A thermal anomaly was visible in satellite data on 8, 9, 13, and 21 February. Explosions on 9 and 12-13 February produced ash plumes that rose to 4 km altitude and drifted E and NE; the ash cloud on 12 February extended as far as 45 km E. On 22 February explosions sent ash to 3 km altitude that drifted E. During 24 and 26-27 February ash plumes rose to 4 km altitude and drifted E. On 28 February an explosion sent ash to 2.5-3 km altitude and drifted 5 km E; ashfall was observed in Severo-Kurilsk.
Activity continued during March; visual observations showed that explosions generated ash plumes that rose to 3.6 km altitude on 3, 5-7, and 9-12 March and drifted E, NE, and NW. Thermal anomalies were visible on 10, 13, and 29-30 March in satellite imagery. On 18, 21-23, 26, and 29-30 March explosions produced ash plumes that rose to 2.8 km altitude and drifted NE and E; the ash plumes during 22-23 March extended up to 76 km E. A VONA issued on 21 March reported an explosion that produced an ash plume that rose to 2.8 km altitude and drifted 5 km E. Another VONA issued on 23 March reported that satellite data showed an ash plume rising to 3 km altitude and drifted 14 km E.
Explosions during April continued to generate ash plumes. On 1 and 4 April an ash plume rose to 2.8-3.5 km altitude and drifted SE and NE. A thermal anomaly was visible in satellite imagery during 1-6 April. Satellite data showed ash plumes and clouds rising to 2-3 km altitude and drifting up to 12 km SW and E on 3 and 6 April (figure 48). KVERT issued VONAs on 3, 5, 14, 16 April describing explosions that produced ash plumes rising to 3 km, 3.5 km, 3.5 km, and 3 km altitude and drifting 5 km S, 5 km NE and SE, 72 km NNE, and 5 km NE, respectively. According to satellite data, the resulting ash cloud from the explosion on 14 April was 25 x 7 km in size and drifted 72-104 km NNE during 14-15 April. According to visual data by volcanologists from Severo-Kurilsk explosions sent ash up to 3.5 km altitude that drifted NE and E during 15-16, 22, 25-26, and 29 April.
The explosive eruption continued during May. Explosions during 3-4, 6-7, and 9-10 May generated ash plumes that rose to 4 km altitude and drifted SW and E. Satellite data showed a thermal anomaly on 3, 9, 13-14, and 24 May. During 12-16, 23-25, and 27-28 May ash plumes rose to 3.5 km altitude and drifted in different directions due to explosions. Two VONA notices were issued on 16 and 25 May, describing explosions that generated ash plumes rising to 3 km and 3.5 km altitude, respectively and extending 5 km E. The ash cloud on 25 May drifted 75 km SE.
Thermal activity in the summit crater, occasionally accompanied by ash plumes and ash deposits on the SE and E flanks due to frequent explosions, were visible in infrared and true color satellite images (figure 49).
Geologic Background. The flat-topped summit of the central cone of Ebeko volcano, one of the most active in the Kuril Islands, occupies the northern end of Paramushir Island. Three summit craters located along a SSW-NNE line form Ebeko volcano proper, at the northern end of a complex of five volcanic cones. Blocky lava flows extend west from Ebeko and SE from the neighboring Nezametnyi cone. The eastern part of the southern crater contains strong solfataras and a large boiling spring. The central crater is filled by a lake about 20 m deep whose shores are lined with steaming solfataras; the northern crater lies across a narrow, low barrier from the central crater and contains a small, cold crescentic lake. Historical activity, recorded since the late-18th century, has been restricted to small-to-moderate explosive eruptions from the summit craters. Intense fumarolic activity occurs in the summit craters, on the outer flanks of the cone, and in lateral explosion craters.
Information Contacts: Kamchatka Volcanic Eruptions Response Team (KVERT), Far Eastern Branch, Russian Academy of Sciences, 9 Piip Blvd., Petropavlovsk-Kamchatsky, 683006, Russia (URL: http://www.kscnet.ru/ivs/kvert/); MIROVA (Middle InfraRed Observation of Volcanic Activity), a collaborative project between the Universities of Turin and Florence (Italy) supported by the Centre for Volcanic Risk of the Italian Civil Protection Department (URL: http://www.mirovaweb.it/); Copernicus Browser, Copernicus Data Space Ecosystem, European Space Agency (URL: https://dataspace.copernicus.eu/browser/).
Home Reef
Tonga
18.992°S, 174.775°W; summit elev. -10 m
All times are local (unless otherwise noted)
Discolored plumes continued during November 2022-April 2023
Home Reef is a submarine volcano located in the central Tonga islands between Lateiki (Metis Shoal) and Late Island. The first recorded eruption occurred in the mid-19th century, when an ephemeral island formed. An eruption in 1984 produced a 12-km-high eruption plume, a large volume of floating pumice, and an ephemeral island 500 x 1,500 m wide, with cliffs 30-50 m high that enclosed a water-filled crater. Another island-forming eruption in 2006 produced widespread pumice rafts that drifted as far as Australia; by 2008 the island had eroded below sea level. The previous eruption occurred during October 2022 and was characterized by a new island-forming eruption, lava effusion, ash plumes, discolored water, and gas-and-steam plumes (BGVN 47:11). This report covers discolored water plumes during November 2022 through April 2023 using satellite data.
Discolored plumes continued during the reporting period and were observed in true color satellite images on clear weather days. Satellite images show light green-yellow discolored water extending W on 8 and 28 November 2022 (figure 31), and SW on 18 November. Light green-yellow plumes extended W on 3 December, S on 13 December, SW on 18 December, and W and S on 23 December (figure 31). On 12 January 2023 discolored green-yellow plumes extended to the NE, E, SE, and N. The plume moved SE on 17 January and NW on 22 January. Faint discolored water in February was visible moving NE on 1 February. A discolored plume extended NW on 8 and 28 March and NW on 13 March (figure 31). During April, clear weather showed green-blue discolored plumes moving S on 2 April, W on 7 April, and NE and S on 12 April. A strong green-yellow discolored plume extended E and NE on 22 April for several kilometers (figure 31).
Geologic Background. Home Reef, a submarine volcano midway between Metis Shoal and Late Island in the central Tonga islands, was first reported active in the mid-19th century, when an ephemeral island formed. An eruption in 1984 produced a 12-km-high eruption plume, large amounts of floating pumice, and an ephemeral 500 x 1,500 m island, with cliffs 30-50 m high that enclosed a water-filled crater. In 2006 an island-forming eruption produced widespread dacitic pumice rafts that drifted as far as Australia. Another island was built during a September-October 2022 eruption.
Information Contacts: Copernicus Browser, Copernicus Data Space Ecosystem, European Space Agency (URL: https://dataspace.copernicus.eu/browser/).
Semisopochnoi (United States) — June 2023 Cite this Report
Semisopochnoi
United States
51.93°N, 179.58°E; summit elev. 1221 m
All times are local (unless otherwise noted)
Occasional explosions, ash deposits, and gas-and-steam plumes during December 2022-May 2023
Semisopochnoi is located in the western Aleutians, is 20-km-wide at sea level, and contains an 8-km-wide caldera. The three-peaked Mount Young (formerly Cerberus) was constructed within the caldera during the Holocene. Each of these peaks contains a summit crater; the lava flows on the N flank appear younger than those on the S side. The current eruption period began in early February 2021 and has more recently consisted of intermittent explosions and ash emissions (BGVN 47:12). This report updates activity during December 2022 through May 2023 using daily, weekly, and special reports from the Alaska Volcano Observatory (AVO). AVO monitors the volcano using local seismic and infrasound sensors, satellite data, web cameras, and remote infrasound and lightning networks.
Activity during most of December 2022 was relatively quiet; according to AVO no eruptive or explosive activity was observed since 7 November 2022. Intermittent tremor and occasional small earthquakes were observed in geophysical data. Continuous gas-and-steam emissions were observed from the N crater of Mount Young in webcam images on clear weather days (figure 25). On 24 December, there was a slight increase in earthquake activity and several small possible explosion signals were detected in infrasound data. Eruptive activity resumed on 27 December at the N crater of Mount Young; AVO issued a Volcano Activity Notice (VAN) that reported minor ash deposits on the flanks of Mount Young that extended as far as 1 km from the vent, according to webcam images taken during 27-28 December (figure 26). No ash plumes were observed in webcam or satellite imagery, but a persistent gas-and-steam plume that might have contained some ash rose to 1.5 km altitude. As a result, AVO raised the Aviation Color Code (ACC) to Orange (the second highest level on a four-color scale) and the Volcano Alert Level (VAL) to Watch (the second highest level on a four-level scale). Possible explosions were detected during 21 December 2022 through 1 January 2023 and seismic tremor was recorded during 30-31 December.
During January 2023 eruptive activity continued at the active N crater of Mount Young. Minor ash deposits were observed on the flanks, extending about 2 km SSW, based on webcam images from 1 and 3 January. A possible explosion occurred during 1-2 January based on elevated seismicity recorded on local seismometers and an infrasound signal recorded minutes later by an array at Adak. Though no ash plumes were observed in webcam or satellite imagery, a persistent gas-and-steam plume rose to 1.5 km altitude that might have carried minor traces of ash. Ash deposits were accompanied by periods of elevated seismicity and infrasound signals from the local geophysical network, which AVO reported were likely due to weak explosive activity. Low-level explosive activity was also detected during 2-3 January, with minor gas-and-steam emissions and a new ash deposit that was visible in webcam images. Low-level explosive activity was detected in geophysical data during 4-5 January, with elevated seismicity and infrasound signals observed on local stations. Volcanic tremor was detected during 7-9 January and very weak explosive activity was detected in seismic and infrasound data on 9 January. Weak seismic and infrasound signals were recorded on 17 January, which indicated minor explosive activity, but no ash emissions were observed in clear webcam images; a gas-and-steam plume continued to rise to 1.5 km altitude. During 29-30 January, ash deposits near the summit were observed on fresh snow, according to webcam images.
The active N cone at Mount Young continued to produce a gas-and-steam plume during February, but no ash emissions or explosive events were detected. Seismicity remained elevated with faint tremor during early February. Gas-and-steam emissions from the N crater were observed in clear webcam images on 11-13 and 16 February; no explosive activity was detected in seismic, infrasound, or satellite data. Seismicity has also decreased, with no significant seismic tremor observed since 25 January. Therefore, the ACC was lowered to Yellow (the second lowest level on a four-color scale) and the VAL was lowered to Advisory (the second lowest level on a four-color scale) on 22 February.
Gas-and-steam emissions persisted during March from the N cone of Mount Young, based on clear webcam images. A few brief episodes of weak tremor were detected in seismic data, although seismicity decreased over the month. A gas-and-steam plume detected in satellite data extended 150 km on 18 March. Low-level ash emissions from the N cone at Mount Young were observed in several webcam images during 18-19 March, in addition to small explosions and volcanic tremor. The ACC was raised to Orange and the VAL increased to Watch on 19 March. A small explosion was detected in seismic and infrasound data on 21 March.
Low-level unrest continued during April, although cloudy weather often obscured views of the summit; periods of seismic tremor and local earthquakes were recorded. During 3-4 April a gas-and-steam plume was visible traveling more than 200 km overnight; no ash was evident in the plume, according to AVO. A gas-and-steam plume was observed during 4-6 April that extended 400 km but did not seem to contain ash. Small explosions were detected in seismic and infrasound data on 5 April. Occasional clear webcam images showed continuing gas-and-steam emissions rose from Mount Young, but no ash deposits were observed on the snow. On 19 April small explosions and tremor were detected in seismic and infrasound data. A period of seismic tremor was detected during 22-25 April, with possible weak explosions on 25 April. Ash deposits were visible near the crater rim, but it was unclear if these deposits were recent or due to older deposits.
Occasional small earthquakes were recorded during May, but there were no signs of explosive activity seen in geophysical data. Gas-and-steam emissions continued from the N crater of Mount Young, based on webcam images, and seismicity remained slightly elevated. A new, light ash deposit was visible during the morning of 5 May on fresh snow on the NW flank of Mount Young. During 10 May periods of volcanic tremor were observed. The ACC was lowered to Yellow and the VAL to Advisory on 17 May due to no additional evidence of activity.
Geologic Background. Semisopochnoi, the largest subaerial volcano of the western Aleutians, is 20 km wide at sea level and contains an 8-km-wide caldera. It formed as a result of collapse of a low-angle, dominantly basaltic volcano following the eruption of a large volume of dacitic pumice. The high point of the island is Anvil Peak, a double-peaked late-Pleistocene cone that forms much of the island's northern part. The three-peaked Mount Cerberus (renamed Mount Young in 2023) was constructed within the caldera during the Holocene. Each of the peaks contains a summit crater; lava flows on the N flank appear younger than those on the south side. Other post-caldera volcanoes include the symmetrical Sugarloaf Peak SSE of the caldera and Lakeshore Cone, a small cinder cone at the edge of Fenner Lake in the NE part of the caldera. Most documented eruptions have originated from Young, although Coats (1950) considered that both Sugarloaf and Lakeshore Cone could have been recently active.
Information Contacts: Alaska Volcano Observatory (AVO), a cooperative program of a) U.S. Geological Survey, 4200 University Drive, Anchorage, AK 99508-4667 USA (URL: https://avo.alaska.edu/), b) Geophysical Institute, University of Alaska, PO Box 757320, Fairbanks, AK 99775-7320, USA, and c) Alaska Division of Geological & Geophysical Surveys, 794 University Ave., Suite 200, Fairbanks, AK 99709, USA (URL: http://dggs.alaska.gov/).
Ambae
Vanuatu
15.389°S, 167.835°E; summit elev. 1496 m
All times are local (unless otherwise noted)
New lava flow, ash plumes, and sulfur dioxide plumes during February-May 2023
Ambae, also known as Aoba, is a large basaltic shield volcano in Vanuatu. A broad pyroclastic cone containing three crater lakes (Manaro Ngoru, Voui, and Manaro Lakua) is located at the summit within the youngest of at least two nested calderas. Periodic phreatic and pyroclastic explosions have been reported since the 16th century. A large eruption more than 400 years ago resulted in a volcanic cone within the summit crater that is now filled by Lake Voui; the similarly sized Lake Manaro fills the western third of the caldera. The previous eruption ended in August 2022 that was characterized by gas-and-steam and ash emissions and explosions of wet tephra (BGVN 47:10). This report covers a new eruption during February through May 2023 that consisted of a new lava flow, ash plumes, and sulfur dioxide emissions, using information from the Vanuatu Meteorology and Geo-Hazards Department (VMGD) and satellite data.
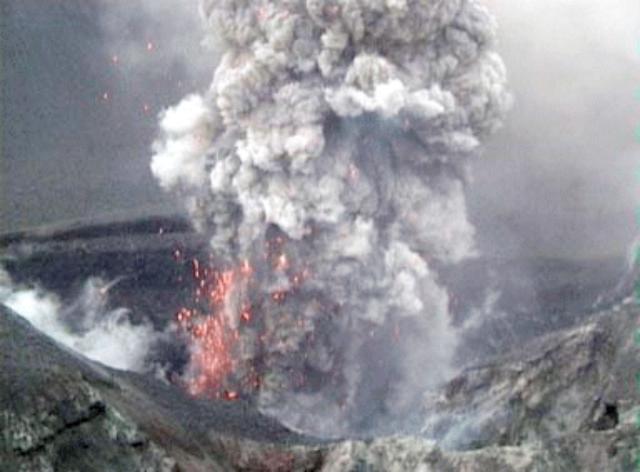
During the reporting period, the Alert Level remained at a 2 (on a scale of 0-5), which has been in place since December 2021. Activity during October 2022 through March 2023 remained relatively low and mostly consisted of gas-and-steam emissions in Lake Voui. VMGD reported that at 1300 on 15 November a satellite image captured a strong amount of sulfur dioxide rising above the volcano (figure 99), and that seismicity slightly increased. The southern and northern part of the island reported a strong sulfur dioxide smell and heard explosions. On 20 February 2023 a gas-and-ash plume rose 1.3 km above the summit and drifted SSW, according to a webcam image (figure 100). Gas-and-steam and possibly ash emissions continued on 23 February and volcanic earthquakes were recorded by the seismic network.
During April, volcanic earthquakes and gas-and-steam and ash emissions were reported from the cone in Lake Voui. VMGD reported that activity increased during 5-7 April; high gas-and-steam and ash plumes were visible, accompanied by nighttime incandescence. According to a Wellington VAAC report, a low-level ash plume rose as high as 2.5 km above the summit and drifted W and SW on 5 April, based on satellite imagery. Reports in Saratamata stated that a dark ash plume drifted to the WSW, but no loud explosion was heard. Webcam images from 2100 showed incandescence above the crater and reflected in the clouds. According to an aerial survey, field observations, and satellite data, water was no longer present in the lake. A lava flow was reported effusing from the vent and traveling N into the dry Lake Voui, which lasted three days. The next morning at 0745 on 6 April a gas-and-steam and ash plume rose 5.4 km above the summit and drifted ESE, based on information from VMGD (figure 101). The Wellington VAAC also reported that light ashfall was observed on the island. Intermittent gas-and-steam and ash emissions were visible on 7 April, some of which rose to an estimated 3 km above the summit and drifted E. Webcam images during 0107-0730 on 7 April showed continuing ash emissions. A gas-and-steam and ash plume rose 695 m above the summit crater at 0730 on 19 April and drifted ESE, based on a webcam image (figure 102).
According to visual and infrared satellite data, water was visible in Lake Voui as late as 24 March 2023 (figure 103). The vent in the caldera showed a gas-and-steam plume drifted SE. On 3 April thermal activity was first detected, accompanied by a gas-and-ash plume that drifted W (figure 103). The lava flow moved N within the dry lake and was shown cooling by 8 April. By 23 April much of the water in the lake had returned. Occasional sulfur dioxide plumes were detected by the TROPOMI instrument on the Sentinel-5P satellite that exceeded 2 Dobson Units (DU) and drifted in different directions (figure 104).
Geologic Background. The island of Ambae, also known as Aoba, is a massive 2,500 km3 basaltic shield that is the most voluminous volcano of the New Hebrides archipelago. A pronounced NE-SW-trending rift zone with numerous scoria cones gives the 16 x 38 km island an elongated form. A broad pyroclastic cone containing three crater lakes (Manaro Ngoru, Voui, and Manaro Lakua) is located at the summit within the youngest of at least two nested calderas, the largest of which is 6 km in diameter. That large central edifice is also called Manaro Voui or Lombenben volcano. Post-caldera explosive eruptions formed the summit craters about 360 years ago. A tuff cone was constructed within Lake Voui (or Vui) about 60 years later. The latest known flank eruption, about 300 years ago, destroyed the population of the Nduindui area near the western coast.
Information Contacts: Geo-Hazards Division, Vanuatu Meteorology and Geo-Hazards Department (VMGD), Ministry of Climate Change Adaptation, Meteorology, Geo-Hazards, Energy, Environment and Disaster Management, Private Mail Bag 9054, Lini Highway, Port Vila, Vanuatu (URL: http://www.vmgd.gov.vu/, https://www.facebook.com/VanuatuGeohazardsObservatory/); Wellington Volcanic Ash Advisory Centre (VAAC), Meteorological Service of New Zealand Ltd (MetService), PO Box 722, Wellington, New Zealand (URL: http://www.metservice.com/vaac/, http://www.ssd.noaa.gov/VAAC/OTH/NZ/messages.html); MIROVA (Middle InfraRed Observation of Volcanic Activity), a collaborative project between the Universities of Turin and Florence (Italy) supported by the Centre for Volcanic Risk of the Italian Civil Protection Department (URL: http://www.mirovaweb.it/); Global Sulfur Dioxide Monitoring Page, Atmospheric Chemistry and Dynamics Laboratory, NASA Goddard Space Flight Center (NASA/GSFC), 8800 Greenbelt Road, Goddard, Maryland, USA (URL: https://so2.gsfc.nasa.gov/); Copernicus Browser, Copernicus Data Space Ecosystem, European Space Agency (URL: https://dataspace.copernicus.eu/browser/).
Ibu
Indonesia
1.488°N, 127.63°E; summit elev. 1325 m
All times are local (unless otherwise noted)
Daily ash explosions continue, along with thermal anomalies in the crater, October 2022-May 2023
Persistent eruptive activity since April 2008 at Ibu, a stratovolcano on Indonesian’s Halmahera Island, has consisted of daily explosive ash emissions and plumes, along with observations of thermal anomalies (BGVN 47:04). The current eruption continued during October 2022-May 2023, described below, based on advisories issued by the Pusat Vulkanologi dan Mitigasi Bencana Geologi (PVMBG, also known as Indonesian Center for Volcanology and Geological Hazard Mitigation, CVGHM), daily reports by MAGMA Indonesia (a PVMBG platform), and the Darwin Volcanic Ash Advisory Centre (VAAC), and various satellite data. The Alert Level during the reporting period remained at 2 (on a scale of 1-4), except raised briefly to 3 on 27 May, and the public was warned to stay at least 2 km away from the active crater and 3.5 km away on the N side of the volcano.
According to MAGMA Indonesia, during October 2022-May 2023, daily gray-and-white ash plumes of variable densities rose 200-1,000 m above the summit and drifted in multiple directions. On 30 October and 11 November, plumes rose a maximum of 2 km and 1.5 km above the summit, respectively (figures 42 and 43). According to the Darwin VAAC, discrete ash emissions on 13 November rose to 2.1 km altitude, or 800 m above the summit, and drifted W, and multiple ash emissions on 15 November rose 1.4 km above the summit and drifted NE. Occasional larger ash explosions through May 2023 prompted PVMBG to issue Volcano Observatory Notice for Aviation (VONA) alerts (table 6); the Aviation Color Code remained at Orange throughout this period.
Table 6. Volcano Observatory Notice for Aviation (VONA) ash plume alerts for Ibu issued by PVMBG during October 2022-May 2023. Maximum height above the summit was estimated by a ground observer. VONAs in January-May 2023 all described the ash plumes as dense.
| Date |
Time (local) |
Max height above summit |
Direction |
| 17 Oct 2022 |
0858 |
800 m |
SW |
| 18 Oct 2022 |
1425 |
800 m |
S |
| 19 Oct 2022 |
2017 |
600 m |
SW |
| 21 Oct 2022 |
0916 |
800 m |
NW |
| 16 Jan 2023 |
1959 |
600 m |
NE |
| 22 Jan 2023 |
0942 |
1,000 m |
E |
| 29 Jan 2023 |
2138 |
1,000 m |
E |
| 10 May 2023 |
0940 |
800 m |
NW |
| 10 May 2023 |
2035 |
600 m |
E |
| 21 May 2023 |
2021 |
600 m |
W |
| 21 May 2023 |
2140 |
1,000 m |
W |
| 29 May 2023 |
1342 |
800 m |
N |
| 31 May 2023 |
1011 |
1,000 m |
SW |
Sentinel-2 L1C satellite images throughout the reporting period show two, sometimes three persistent thermal anomalies in the summit crater, with the most prominent hotspot from the top of a cone within the crater. Clear views were more common during March-April 2023, when a vent and lava flows on the NE flank of the intra-crater cone could be distinguished (figure 44). White-to-grayish emissions were also observed during brief periods when weather clouds allowed clear views.
The MIROVA space-based volcano hotspot detection system recorded almost daily thermal anomalies throughout the reporting period, though cloud cover often interfered with detections. Data from imaging spectroradiometers aboard NASA’s Aqua and Terra satellites and processed using the MODVOLC algorithm (MODIS-MODVOLC) recorded hotspots on one day during October 2022 and December 2022, two days in April 2023, three days in November 2022 and May 2023, and four days in March 2023.
Geologic Background. The truncated summit of Gunung Ibu stratovolcano along the NW coast of Halmahera Island has large nested summit craters. The inner crater, 1 km wide and 400 m deep, has contained several small crater lakes. The 1.2-km-wide outer crater is breached on the N, creating a steep-walled valley. A large cone grew ENE of the summit, and a smaller one to the WSW has fed a lava flow down the W flank. A group of maars is located below the N and W flanks. The first observed and recorded eruption was a small explosion from the summit crater in 1911. Eruptive activity began again in December 1998, producing a lava dome that eventually covered much of the floor of the inner summit crater along with ongoing explosive ash emissions.
Information Contacts: Pusat Vulkanologi dan Mitigasi Bencana Geologi (PVMBG, also known as Indonesian Center for Volcanology and Geological Hazard Mitigation, CVGHM), Jalan Diponegoro 57, Bandung 40122, Indonesia (URL: http://www.vsi.esdm.go.id/); MAGMA Indonesia (Multiplatform Application for Geohazard Mitigation and Assessment in Indonesia), Kementerian Energi dan Sumber Daya Mineral (URL: https://magma.esdm.go.id/v1); Copernicus Browser, Copernicus Data Space Ecosystem, European Space Agency (URL: https://dataspace.copernicus.eu/browser/); MIROVA (Middle InfraRed Observation of Volcanic Activity), a collaborative project between the Universities of Turin and Florence (Italy) supported by the Centre for Volcanic Risk of the Italian Civil Protection Department (URL: http://www.mirovaweb.it/); Hawai'i Institute of Geophysics and Planetology (HIGP) - MODVOLC Thermal Alerts System, School of Ocean and Earth Science and Technology (SOEST), Univ. of Hawai'i, 2525 Correa Road, Honolulu, HI 96822, USA (URL: http://modis.higp.hawaii.edu/).
Dukono
Indonesia
1.6992°N, 127.8783°E; summit elev. 1273 m
All times are local (unless otherwise noted)
Continuing ash emissions, SO2 plumes, and thermal signals during October 2022-May 2023
Dukono, a remote volcano on Indonesia’s Halmahera Island, has been erupting continuously since 1933, with frequent ash explosions and sulfur dioxide plumes (BGVN 46:11, 47:10). This activity continued during October 2022 through May 2023, based on reports from the Pusat Vulkanologi dan Mitigasi Bencana Geologi (PVMBG; also known as Indonesian Center for Volcanology and Geological Hazard Mitigation, CVGHM), the Darwin Volcanic Ash Advisory Centre (VAAC), and satellite data. During this period, the Alert Level remained at 2 (on a scale of 1-4) and the public was warned to remain outside of the 2-km exclusion zone. The highest reported plume of the period reached 9.4 km above the summit on 14 November 2022.
According to MAGMA Indonesia (a platform developed by PVMBG), white, gray, or dark plumes of variable densities were observed almost every day during the reporting period, except when fog obscured the volcano (figure 33). Plumes generally rose 25-450 m above the summit, but rose as high as 700-800 m on several days, somewhat lower than the maximum heights reached earlier in 2022 when plumes reached as high as 1 km. However, the Darwin VAAC reported that on 14 November 2022, a discrete ash plume rose 9.4 km above the summit (10.7 km altitude), accompanied by a strong hotspot and a sulfur dioxide signal observed in satellite imagery; a continuous ash plume that day and through the 15th rose to 2.1-2.4 km altitude and drifted NE.
Sentinel-2 images were obscured by weather clouds almost every viewing day during the reporting period. However, the few reasonably clear images showed a hotspot and white or gray emissions and plumes. Strong SO2 plumes from Dukono were present on many days during October 2022-May 2023, as detected using the TROPOMI instrument on the Sentinel-5P satellite (figure 34).
Geologic Background. Reports from this remote volcano in northernmost Halmahera are rare, but Dukono has been one of Indonesia's most active volcanoes. More-or-less continuous explosive eruptions, sometimes accompanied by lava flows, have occurred since 1933. During a major eruption in 1550 CE, a lava flow filled in the strait between Halmahera and the N-flank Gunung Mamuya cone. This complex volcano presents a broad, low profile with multiple summit peaks and overlapping craters. Malupang Wariang, 1 km SW of the summit crater complex, contains a 700 x 570 m crater that has also been active during historical time.
Information Contacts: Pusat Vulkanologi dan Mitigasi Bencana Geologi (PVMBG, also known as Indonesian Center for Volcanology and Geological Hazard Mitigation, CVGHM), Jalan Diponegoro 57, Bandung 40122, Indonesia (URL: http://www.vsi.esdm.go.id/); MAGMA Indonesia (Multiplatform Application for Geohazard Mitigation and Assessment in Indonesia), Kementerian Energi dan Sumber Daya Mineral (URL: https://magma.esdm.go.id/v1); Darwin Volcanic Ash Advisory Centre (VAAC), Bureau of Meteorology, Northern Territory Regional Office, PO Box 40050, Casuarina, NT 0811, Australia (URL: http://www.bom.gov.au/info/vaac/); NASA Global Sulfur Dioxide Monitoring Page, Atmospheric Chemistry and Dynamics Laboratory, NASA Goddard Space Flight Center (NASA/GSFC), 8800 Greenbelt Road, Goddard, Maryland, USA (URL: https://so2.gsfc.nasa.gov/); Sentinel Hub Playground (URL: https://www.sentinel-hub.com/explore/sentinel-playground).
Sabancaya
Peru
15.787°S, 71.857°W; summit elev. 5960 m
All times are local (unless otherwise noted)
Explosions, gas-and-ash plumes, and thermal activity persist during November 2022-April 2023
Sabancaya is located in Peru, NE of Ampato and SE of Hualca Hualca. Eruptions date back to 1750 and have been characterized by explosions, phreatic activity, ash plumes, and ashfall. The current eruption period began in November 2016 and has more recently consisted of daily explosions, gas-and-ash plumes, and thermal activity (BGVN 47:11). This report updates activity during November 2022 through April 2023 using information from Instituto Geophysico del Peru (IGP) that use weekly activity reports and various satellite data.
Intermittent low-to-moderate power thermal anomalies were reported by the MIROVA project during November 2022 through April 2023 (figure 119). There were few short gaps in thermal activity during mid-December 2022, late December-to-early January 2023, late January to mid-February, and late February. According to data recorded by the MODVOLC thermal algorithm, there were a total of eight thermal hotspots: three in November 2022, three in February 2023, one in March, and one in April. On clear weather days, some of this thermal anomaly was visible in infrared satellite imagery showing the active lava dome in the summit crater (figure 120). Almost daily moderate-to-strong sulfur dioxide plumes were recorded during the reporting period by the TROPOMI instrument on the Sentinel-5P satellite (figure 121). Many of these plumes exceeded 2 Dobson Units (DU) and drifted in multiple directions.
IGP reported that moderate activity during November and December 2022 continued; during November, an average number of explosions were reported each week: 30, 33, 36, and 35, and during December, it was 32, 40, 47, 52, and 67. Gas-and-ash plumes in November rose 3-3.5 km above the summit and drifted E, NE, SE, S, N, W, and SW. During December the gas-and-ash plumes rose 2-4 km above the summit and drifted in different directions. There were 1,259 volcanic earthquakes recorded during November and 1,693 during December. Seismicity also included volcano-tectonic-type events that indicate rock fracturing events. Slight inflation was observed in the N part of the volcano near Hualca Hualca (4 km N). Thermal activity was frequently reported in the crater at the active lava dome (figure 120).
Explosive activity continued during January and February 2023. The average number of explosions were reported each week during January (51, 50, 60, and 59) and February (43, 54, 51, and 50). Gas-and-ash plumes rose 1.6-2.9 km above the summit and drifted NW, SW, and W during January and rose 1.4-2.8 above the summit and drifted W, SW, E, SE, N, S, NW, and NE during February. IGP also detected 1,881 volcanic earthquakes during January and 1,661 during February. VT-type earthquakes were also reported. Minor inflation persisted near Hualca Hualca. Satellite imagery showed continuous thermal activity in the crater at the lava dome (figure 120).
During March, the average number of explosions each week was 46, 48, 31, 35, and 22 and during April, it was 29, 41, 31, and 27. Accompanying gas-and-ash plumes rose 1.7-2.6 km above the summit crater and drifted W, SW, NW, S, and SE during March. According to a Buenos Aires Volcano Ash Advisory Center (VAAC) notice, on 22 March at 1800 through 23 March an ash plume rose to 7 km altitude and drifted NW. By 0430 an ash plume rose to 7.6 km altitude and drifted W. On 24 and 26 March continuous ash emissions rose to 7.3 km altitude and drifted SW and on 28 March ash emissions rose to 7.6 km altitude. During April, gas-and-ash plumes rose 1.6-2.5 km above the summit and drifted W, SW, S, NW, NE, and E. Frequent volcanic earthquakes were recorded, with 1,828 in March and 1,077 in April, in addition to VT-type events. Thermal activity continued to be reported in the summit crater at the lava dome (figure 120).
Geologic Background. Sabancaya, located in the saddle NE of Ampato and SE of Hualca Hualca volcanoes, is the youngest of these volcanic centers and the only one to have erupted in historical time. The oldest of the three, Nevado Hualca Hualca, is of probable late-Pliocene to early Pleistocene age. The name Sabancaya (meaning "tongue of fire" in the Quechua language) first appeared in records in 1595 CE, suggesting activity prior to that date. Holocene activity has consisted of Plinian eruptions followed by emission of voluminous andesitic and dacitic lava flows, which form an extensive apron around the volcano on all sides but the south. Records of historical eruptions date back to 1750.
Information Contacts: Instituto Geofisico del Peru (IGP), Centro Vulcanológico Nacional (CENVUL), Calle Badajoz N° 169 Urb. Mayorazgo IV Etapa, Ate, Lima 15012, Perú (URL: https://www.igp.gob.pe/servicios/centro-vulcanologico-nacional/inicio); Buenos Aires Volcanic Ash Advisory Center (VAAC), Servicio Meteorológico Nacional-Fuerza Aérea Argentina, 25 de mayo 658, Buenos Aires, Argentina (URL: http://www.smn.gov.ar/vaac/buenosaires/inicio.php); MIROVA (Middle InfraRed Observation of Volcanic Activity), a collaborative project between the Universities of Turin and Florence (Italy) supported by the Centre for Volcanic Risk of the Italian Civil Protection Department (URL: http://www.mirovaweb.it/); Hawai'i Institute of Geophysics and Planetology (HIGP) - MODVOLC Thermal Alerts System, School of Ocean and Earth Science and Technology (SOEST), Univ. of Hawai'i, 2525 Correa Road, Honolulu, HI 96822, USA (URL: http://modis.higp.hawaii.edu/); NASA Global Sulfur Dioxide Monitoring Page, Atmospheric Chemistry and Dynamics Laboratory, NASA Goddard Space Flight Center (NASA/GSFC), 8800 Greenbelt Road, Goddard MD 20771, USA (URL: https://so2.gsfc.nasa.gov/); Copernicus Browser, Copernicus Data Space Ecosystem, European Space Agency (URL: https://dataspace.copernicus.eu/browser/).
Sheveluch
Russia
56.653°N, 161.36°E; summit elev. 3283 m
All times are local (unless otherwise noted)
Significant explosions destroyed part of the lava-dome complex during April 2023
Sheveluch (also spelled Shiveluch) in Kamchatka, has had at least 60 large eruptions during the last 10,000 years. The summit is truncated by a broad 9-km-wide caldera that is breached to the S, and many lava domes occur on the outer flanks. The lava dome complex was constructed within the large open caldera. Frequent collapses of the dome complex have produced debris avalanches; the resulting deposits cover much of the caldera floor. A major south-flank collapse during a 1964 Plinian explosion produced a scarp in which a “Young Sheveluch” dome began to form in 1980. Repeated episodes of dome formation and destruction since then have produced major and minor ash plumes, pyroclastic flows, block-and-ash flows, and “whaleback domes” of spine-like extrusions in 1993 and 2020 (BGVN 45:11). The current eruption period began in August 1999 and has more recently consisted of lava dome growth, explosions, ash plumes, and avalanches (BGVN 48:01). This report covers a significant explosive eruption during early-to-mid-April 2023 that generated a 20 km altitude ash plume, produced a strong sulfur dioxide plume, and destroyed part of the lava-dome complex; activity described during January through April 2023 use information primarily from the Kamchatka Volcanic Eruptions Response Team (KVERT) and various satellite data.
Satellite data. Activity during the majority of this reporting period was characterized by continued lava dome growth, strong fumarole activity, explosions, and hot avalanches. According to the MODVOLC Thermal Alerts System, 140 hotspots were detected through the reporting period, with 33 recorded in January 2023, 29 in February, 44 in March, and 34 in April. Frequent strong thermal activity was recorded during January 2023 through April, according to the MIROVA (Middle InfraRed Observation of Volcanic Activity) graph and resulted from the continuously growing lava dome (figure 94). A slightly stronger pulse in thermal activity was detected in early-to-mid-April, which represented the significant eruption that destroyed part of the lava-dome complex. Thermal anomalies were also visible in infrared satellite imagery at the summit crater (figure 95).
During January 2023 KVERT reported continued growth of the lava dome, accompanied by strong fumarolic activity, incandescence from the lava dome, explosions, ash plumes, and avalanches. Satellite data showed a daily thermal anomaly over the volcano. Video data showed ash plumes associated with collapses at the dome that generated avalanches that in turn produced ash plumes rising to 3.5 km altitude and drifting 40 km W on 4 January and rising to 7-7.5 km altitude and drifting 15 km SW on 5 January. A gas-and-steam plume containing some ash that was associated with avalanches rose to 5-6 km altitude and extended 52-92 km W on 7 January. Explosions that same day produced ash plumes that rose to 7-7.5 km altitude and drifted 10 km W. According to a Volcano Observatory Notice for Aviation (VONA) issued at 1344 on 19 January, explosions produced an ash cloud that was 15 x 25 km in size and rose to 9.6-10 km altitude, drifting 21-25 km W; as a result, the Aviation Color Code (ACC) was raised to Red (the highest level on a four-color scale). Another VONA issued at 1635 reported that no more ash plumes were observed, and the ACC was lowered to Orange (the second highest level on a four-color scale). On 22 January an ash plume from collapses and avalanches rose to 5 km altitude and drifted 25 km NE and SW; ash plumes associated with collapses extended 70 km NE on 27 and 31 January.
Lava dome growth, fumarolic activity, dome incandescence, and occasional explosions and avalanches continued during February and March. A daily thermal anomaly was visible in satellite data. Explosions on 1 February generated ash plumes that rose to 6.3-6.5 km altitude and extended 15 km NE. Video data showed an ash cloud from avalanches rising to 5.5 km altitude and drifting 5 km SE on 2 February. Satellite data showed gas-and-steam plumes containing some ash rose to 5-5.5 km altitude and drifted 68-110 km ENE and NE on 6 February, to 4.5-5 km altitude and drifted 35 km WNW on 22 February, and to 3.7-4 km altitude and drifted 47 km NE on 28 February. Scientists from the Kamchatka Volcanological Station (KVS) went on a field excursion on 25 February to document the growing lava dome, and although it was cloudy most of the day, nighttime incandescence was visible. Satellite data showed an ash plume extending up to 118 km E during 4-5 March. Video data from 1150 showed an ash cloud from avalanches rose to 3.7-5.5 km altitude and drifted 5-10 km ENE and E on 5 March. On 11 March an ash plume drifted 62 km E. On 27 March ash plumes rose to 3.5 km altitude and drifted 100 km E. Avalanches and constant incandescence at the lava dome was focused on the E and NE slopes on 28 March. A gas-and-steam plume containing some ash rose to 3.5 km altitude and moved 40 km E on 29 March. Ash plumes on 30 March rose to 3.5-3.7 km altitude and drifted 70 km NE.
Similar activity continued during April, with lava dome growth, strong fumarolic activity, incandescence in the dome, occasional explosions, and avalanches. A thermal anomaly persisted throughout the month. During 1-4 April weak ash plumes rose to 2.5-3 km altitude and extended 13-65 km SE and E.
Activity during 11 April 2023. The Institute of Volcanology and Seismology, Far Eastern Branch, Russian Academy of Sciences (IVS FEB RAS) reported a significant increase in seismicity around 0054 on 11 April, as reported by strong explosions detected on 11 April beginning at 0110 that sent ash plumes up to 7-10 km altitude and extended 100-435 km W, WNW, NNW, WSW, and SW. According to a Tokyo VAAC report the ash plume rose to 15.8 km altitude. By 0158 the plume extended over a 75 x 100 km area. According to an IVS FEB RAS report, the eruptive column was not vertical: the initial plume at 0120 on 11 April deviated to the NNE, at 0000 on 12 April, it drifted NW, and by 1900 it drifted SW. KVS reported that significant pulses of activity occurred at around 0200, 0320, and then a stronger phase around 0600. Levin Dmitry took a video from near Békés (3 km away) at around 0600 showing a rising plume; he also reported that a pyroclastic flow traveled across the road behind him as he left the area. According to IVS FEB RAS, the pyroclastic flow traveled several kilometers SSE, stopping a few hundred meters from a bridge on the road between Klyuchi and Petropavlovsk-Kamchatsky.
Ashfall was first observed in Klyuchi (45 km SW) at 0630, and a large, black ash plume blocked light by 0700. At 0729 KVERT issued a Volcano Observatory Notice for Aviation (VONA) raising the Aviation Color Code to Red (the highest level on a four-color scale). It also stated that a large ash plume had risen to 10 km altitude and drifted 100 km W. Near-constant lightning strikes were reported in the plume and sounds like thunderclaps were heard until about 1000. According to IVS FEB RAS the cloud was 200 km long and 76 km wide by 0830, and was spreading W at altitudes of 6-12 km. In the Klyuchi Village, the layer of both ash and snow reached 8.5 cm (figure 96); ashfall was also reported in Kozyrevsk (112 km SW) at 0930, Mayskoye, Anavgay, Atlasovo, Lazo, and Esso. Residents in Klyuchi reported continued darkness and ashfall at 1100. In some areas, ashfall was 6 cm deep and some residents reported dirty water coming from their plumbing. According to IVS FEB RAS, an ash cloud at 1150 rose to 5-20 km altitude and was 400 km long and 250 km wide, extending W. A VONA issued at 1155 reported that ash had risen to 10 km and drifted 340 km NNW and 240 km WSW. According to Simon Carn (Michigan Technological University), about 0.2 Tg of sulfur dioxide in the plume was measured in a satellite image from the TROPOMI instrument on the Sentinel-5P satellite acquired at 1343 that covered an area of about 189,000 km2 (figure 97). Satellite data at 1748 showed an ash plume that rose to 8 km altitude and drifted 430 km WSW and S, according to a VONA.
Activity during 12-15 April 2023. On 12 April at 0730 satellite images showed ash plumes rose to 7-8 km altitude and extended 600 km SW, 1,050 km ESE, and 1,300-3,000 km E. By 1710 that day, the explosions weakened. According to news sources, the ash-and-gas plumes drifted E toward the Aleutian Islands and reached the Gulf of Alaska by 13 April, causing flight disruptions. More than 100 flights involving Alaska airspace were cancelled due to the plume. Satellite data showed ash plumes rising to 4-5.5 km altitude and drifted 400-415 km SE and ESE on 13 April. KVS volcanologists observed the pyroclastic flow deposits and noted that steam rose from downed, smoldering trees. They also noted that the deposits were thin with very few large fragments, which differed from previous flows. The ash clouds traveled across the Pacific Ocean. Flight cancellations were also reported in NW Canada (British Columbia) during 13-14 April. During 14-15 April ash plumes rose to 6 km altitude and drifted 700 km NW.
Alaskan flight schedules were mostly back to normal by 15 April, with only minor delays and far less cancellations; a few cancellations continued to be reported in Canada. Clear weather on 15 April showed that most of the previous lava-dome complex was gone and a new crater roughly 1 km in diameter was observed (figure 98); gas-and-steam emissions were rising from this crater. Evidence suggested that there had been a directed blast to the SE, and pyroclastic flows traveled more than 20 km. An ash plume rose to 4.5-5.2 km altitude and drifted 93-870 km NW on 15 April.
Activity during 16-30 April 2023. Resuspended ash was lifted by the wind from the slopes and rose to 4 km altitude and drifted 224 km NW on 17 April. KVERT reported a plume of resuspended ash from the activity during 10-13 April on 19 April that rose to 3.5-4 km altitude and drifted 146-204 km WNW. During 21-22 April a plume stretched over the Scandinavian Peninsula. A gas-and-steam plume containing some ash rose to 3-3.5 km altitude and drifted 60 km SE on 30 April. A possible new lava dome was visible on the W slope of the volcano on 29-30 April (figure 99); satellite data showed two thermal anomalies, a bright one over the existing lava dome and a weaker one over the possible new one.
References. Girina, O., Loupian, E., Horvath, A., Melnikov, D., Manevich, A., Nuzhdaev, A., Bril, A., Ozerov, A., Kramareva, L., Sorokin, A., 2023, Analysis of the development of the paroxysmal eruption of Sheveluch volcano on April 10–13, 2023, based on data from various satellite systems, ??????????? ???????? ??? ?? ???????, 20(2).
Geologic Background. The high, isolated massif of Sheveluch volcano (also spelled Shiveluch) rises above the lowlands NNE of the Kliuchevskaya volcano group. The 1,300 km3 andesitic volcano is one of Kamchatka's largest and most active volcanic structures, with at least 60 large eruptions during the Holocene. The summit of roughly 65,000-year-old Stary Shiveluch is truncated by a broad 9-km-wide late-Pleistocene caldera breached to the south. Many lava domes occur on its outer flanks. The Molodoy Shiveluch lava dome complex was constructed during the Holocene within the large open caldera; Holocene lava dome extrusion also took place on the flanks of Stary Shiveluch. Widespread tephra layers from these eruptions have provided valuable time markers for dating volcanic events in Kamchatka. Frequent collapses of dome complexes, most recently in 1964, have produced debris avalanches whose deposits cover much of the floor of the breached caldera.
Information Contacts: Kamchatka Volcanic Eruptions Response Team (KVERT), Far Eastern Branch, Russian Academy of Sciences, 9 Piip Blvd., Petropavlovsk-Kamchatsky, 683006, Russia (URL: http://www.kscnet.ru/ivs/kvert/); Institute of Volcanology and Seismology, Far Eastern Branch, Russian Academy of Sciences (IVS FEB RAS), 9 Piip Blvd., Petropavlovsk-Kamchatsky 683006, Russia (URL: http://www.kscnet.ru/ivs/eng/); Kamchatka Volcanological Station, Kamchatka Branch of Geophysical Survey, (KB GS RAS), Klyuchi, Kamchatka Krai, Russia (URL: http://volkstat.ru/); Hawai'i Institute of Geophysics and Planetology (HIGP) - MODVOLC Thermal Alerts System, School of Ocean and Earth Science and Technology (SOEST), Univ. of Hawai'i, 2525 Correa Road, Honolulu, HI 96822, USA (URL: http://modis.higp.hawaii.edu/); MIROVA (Middle InfraRed Observation of Volcanic Activity), a collaborative project between the Universities of Turin and Florence (Italy) supported by the Centre for Volcanic Risk of the Italian Civil Protection Department (URL: http://www.mirovaweb.it/); Copernicus Browser, Copernicus Data Space Ecosystem, European Space Agency (URL: https://dataspace.copernicus.eu/browser/); Kam 24 News Agency, 683032, Kamchatka Territory, Petropavlovsk-Kamchatsky, Vysotnaya St., 2A (URL: https://kam24.ru/news/main/20230411/96657.html#.Cj5Jrky6.dpuf); Simon Carn, Geological and Mining Engineering and Sciences, Michigan Technological University, 1400 Townsend Drive, Houghton, MI 49931, USA (URL: http://www.volcarno.com/, Twitter: @simoncarn).
Bezymianny
Russia
55.972°N, 160.595°E; summit elev. 2882 m
All times are local (unless otherwise noted)
Explosions, ash plumes, lava flows, and avalanches during November 2022-April 2023
Bezymianny is located on the Kamchatka Peninsula of Russia as part of the Klyuchevskoy volcano group. Historic eruptions began in 1955 and have been characterized by dome growth, explosions, pyroclastic flows, ash plumes, and ashfall. During the 1955-56 eruption a large open crater was formed by collapse of the summit and an associated lateral blast. Subsequent episodic but ongoing lava-dome growth, accompanied by intermittent explosive activity and pyroclastic flows, has largely filled the 1956 crater. The current eruption period began in December 2016 and more recent activity has consisted of strong explosions, ash plumes, and thermal activity (BGVN 47:11). This report covers activity during November 2022 through April 2023, based on weekly and daily reports from the Kamchatka Volcano Eruptions Response Team (KVERT) and satellite data.
Activity during November and March 2023 was relatively low and mostly consisted of gas-and-steam emissions, occasional small collapses that generated avalanches along the lava dome slopes, and a persistent thermal anomaly over the volcano that was observed in satellite data on clear weather days. According to the Tokyo VAAC and KVERT, an explosion produced an ash plume that rose to 6 km altitude and drifted 25 km NE at 1825 on 29 March.
Gas-and-steam emissions, collapses generating avalanches, and thermal activity continued during April. According to two Volcano Observatory Notice for Aviation (VONA) issued on 2 and 6 April (local time) ash plumes rose to 3 km and 3.5-3.8 km altitude and drifted 35 km E and 140 km E, respectively. Satellite data from KVERT showed weak ash plumes extending up to 550 km E on 2 and 5-6 April.
A VONA issued at 0843 on 7 April described an ash plume that rose to 4.5-5 km altitude and drifted 250 km ESE. Later that day at 1326 satellite data showed an ash plume that rose to 5.5-6 km altitude and drifted 150 km ESE. A satellite image from 1600 showed an ash plume extending as far as 230 km ESE; KVERT noted that ash emissions were intensifying, likely due to avalanches from the growing lava dome. The Aviation Color Code (ACC) was raised to Red (the highest level on a four-color scale). At 1520 satellite data showed an ash plume rising to 5-5.5 km altitude and drifting 230 km ESE. That same day, Kamchatka Volcanological Station (KVS) volcanologists traveled to Ambon to collect ash; they reported that a notable eruption began at 1730, and within 20 minutes a large ash plume rose to 10 km altitude and drifted NW. KVERT reported that the strong explosive phase began at 1738. Video and satellite data taken at 1738 showed an ash plume that rose to 10-12 km altitude and drifted up to 2,800 km SE and E. Explosions were clearly audible 20 km away for 90 minutes, according to KVS. Significant amounts of ash fell at the Apakhonchich station, which turned the snow gray; ash continued to fall until the morning of 8 April. In a VONA issued at 0906 on 8 April, KVERT stated that the explosive eruption had ended; ash plumes had drifted 2,000 km E. The ACC was lowered to Orange (the third highest level on a four-color scale). The KVS team saw a lava flow on the active dome once the conditions were clear that same day (figure 53). On 20 April lava dome extrusion was reported; lava flows were noted on the flanks of the dome, and according to KVERT satellite data, a thermal anomaly was observed in the area. The ACC was lowered to Yellow (the second lowest on a four-color scale).
Satellite data showed an increase in thermal activity beginning in early April 2023. A total of 31 thermal hotspots were detected by the MODVOLC thermal algorithm on 4, 5, 7, and 12 April 2023. The elevated thermal activity resulted from an increase in explosive activity and the start of an active lava flow. The MIROVA (Middle InfraRed Observation of Volcanic Activity) volcano hotspot detection system based on the analysis of MODIS data also showed a pulse in thermal activity during the same time (figure 54). Infrared satellite imagery captured a continuous thermal anomaly at the summit crater, often accompanied by white gas-and-steam emissions (figure 55). On 4 April 2023 an active lava flow was observed descending the SE flank.
Geologic Background. The modern Bezymianny, much smaller than its massive neighbors Kamen and Kliuchevskoi on the Kamchatka Peninsula, was formed about 4,700 years ago over a late-Pleistocene lava-dome complex and an edifice built about 11,000-7,000 years ago. Three periods of intensified activity have occurred during the past 3,000 years. The latest period, which was preceded by a 1,000-year quiescence, began with the dramatic 1955-56 eruption. This eruption, similar to that of St. Helens in 1980, produced a large open crater that was formed by collapse of the summit and an associated lateral blast. Subsequent episodic but ongoing lava-dome growth, accompanied by intermittent explosive activity and pyroclastic flows, has largely filled the 1956 crater.
Information Contacts: Kamchatka Volcanic Eruptions Response Team (KVERT), Far Eastern Branch, Russian Academy of Sciences, 9 Piip Blvd., Petropavlovsk-Kamchatsky, 683006, Russia (URL: http://www.kscnet.ru/ivs/kvert/); Kamchatka Volcanological Station, Kamchatka Branch of Geophysical Survey, (KB GS RAS), Klyuchi, Kamchatka Krai, Russia (URL: http://volkstat.ru/); Hawai'i Institute of Geophysics and Planetology (HIGP) - MODVOLC Thermal Alerts System, School of Ocean and Earth Science and Technology (SOEST), Univ. of Hawai'i, 2525 Correa Road, Honolulu, HI 96822, USA (URL: http://modis.higp.hawaii.edu/); MIROVA (Middle InfraRed Observation of Volcanic Activity), a collaborative project between the Universities of Turin and Florence (Italy) supported by the Centre for Volcanic Risk of the Italian Civil Protection Department (URL: http://www.mirovaweb.it/); Copernicus Browser, Copernicus Data Space Ecosystem, European Space Agency (URL: https://dataspace.copernicus.eu/browser/).
Chikurachki
Russia
50.324°N, 155.461°E; summit elev. 1781 m
All times are local (unless otherwise noted)
New explosive eruption during late January-early February 2023
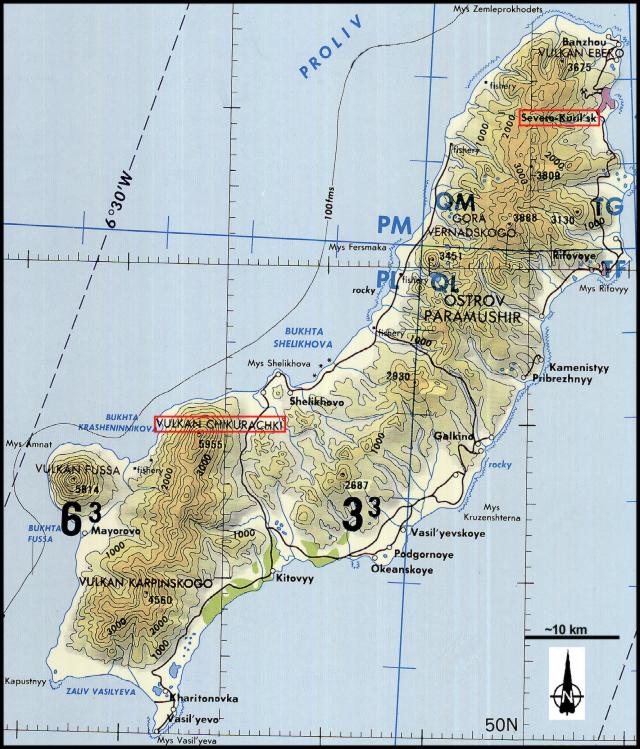
Chikurachki, located on Paramushir Island in the northern Kuriles, has had Plinian eruptions during the Holocene. Lava flows have reached the sea and formed capes on the NW coast; several young lava flows are also present on the E flank beneath a scoria deposit. Reported eruptions date back to 1690, with the most recent eruption period occurring during January through October 2022, characterized by occasional explosions, ash plumes, and thermal activity (BGVN 47:11). This report covers a new eruptive period during January through February 2023 that consisted of ash explosions and ash plumes, based on information from the Kamchatka Volcanic Eruptions Response Team (KVERT) and satellite data.
According to reports from KVERT, an explosive eruption began around 0630 on 29 January. Explosions generated ash plumes that rose to 3-3.5 km altitude and drifted 6-75 km SE and E, based on satellite data. As a result, the Aviation Color Code (ACC) was raised to Orange (the second highest level on a four-color scale). At 1406 and 1720 ash plumes were identified in satellite images that rose to 4.3 km altitude and extended 70 km E. By 2320 the ash plume had dissipated. A thermal anomaly was visible at the volcano on 31 January, according to a satellite image, and an ash plume was observed drifting 66 km NE.
Occasional explosions and ash plumes continued during early February. At 0850 on 1 February an ash plume rose to 3.5 km altitude and drifted 35 km NE. Satellite data showed an ash plume that rose to 3.2-3.5 km altitude and drifted 50 km NE at 1222 later that day (figure 22). A thermal anomaly was detected over the volcano during 5-6 February and ash plumes drifted as far as 125 km SE, E, and NE. Explosive events were reported at 0330 on 6 February that produced ash plumes rising to 4-4.5 km altitude and drifting 72-90 km N, NE, and ENE. KVERT noted that the last gas-and steam plume that contained some ash was observed on 8 February and drifted 55 km NE before the explosive eruption ended. The ACC was lowered to Yellow and then Green (the lowest level on a four-color scale) on 18 February.
Geologic Background. Chikurachki, the highest volcano on Paramushir Island in the northern Kuriles, is a relatively small cone constructed on a high Pleistocene edifice. Oxidized basaltic-to-andesitic scoria deposits covering the upper part of the young cone give it a distinctive red color. Frequent basaltic Plinian eruptions have occurred during the Holocene. Lava flows have reached the sea and formed capes on the NW coast; several young lava flows are also present on the E flank beneath a scoria deposit. The Tatarinov group of six volcanic centers is located immediately to the south, and the Lomonosov cinder cone group, the source of an early Holocene lava flow that reached the saddle between it and Fuss Peak to the west, lies at the southern end of the N-S-trending Chikurachki-Tatarinov complex. In contrast to the frequently active Chikurachki, the Tatarinov centers are extensively modified by erosion and have a more complex structure. Tephrochronology gives evidence of an eruption around 1690 CE from Tatarinov, although its southern cone contains a sulfur-encrusted crater with fumaroles that were active along the margin of a crater lake until 1959.
Information Contacts: Kamchatka Volcanic Eruptions Response Team (KVERT), Far East Division, Russian Academy of Sciences, 9 Piip Blvd., Petropavlovsk-Kamchatsky, 683006, Russia (URL: http://www.kscnet.ru/ivs/); Copernicus Browser, Copernicus Data Space Ecosystem, European Space Agency (URL: https://dataspace.copernicus.eu/browser/).
Search Bulletin Archive by Publication Date
Select a month and year from the drop-downs and click "Show Issue" to have that issue displayed in this tab.
The default month and year is the latest issue available.
Bulletin of the Global Volcanism Network - Volume 27, Number 01 (January 2002)
Managing Editor: Richard Wunderman
Chikurachki (Russia)
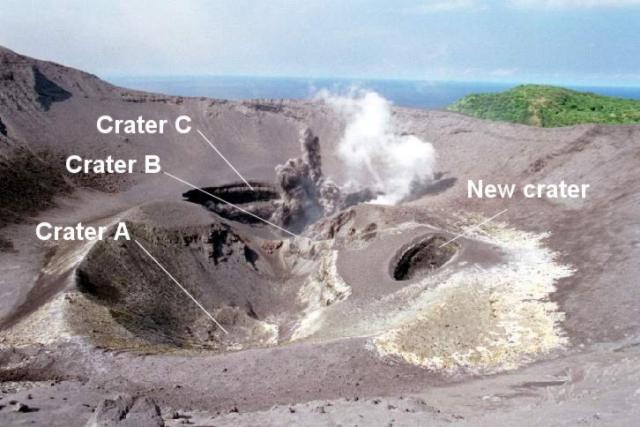
Several January-February ash clouds observed; small crater formed
Kanlaon (Philippines)
Increased seismicity during January 2002 may be precursor to eruption
Karangetang (Indonesia)
Lahars cause damage in January; explosions and lava flows in February
Marapi (Indonesia)
Explosions during 2001; April ash plume reaches 2.0 km above the summit
Soputan (Indonesia)
Avalanche earthquakes, white plumes to 100 m through mid-July 2001
Soufriere Hills (United Kingdom)
Small-scale dome collapses and pyroclastic flows through February 2002
Stromboli (Italy)
Fallout from 23 January explosion carpets popular tourist area
Tungurahua (Ecuador)
Powerful tremor, plumes, 600-m-high lava fountains, and lahars during 2001
Unnamed (Tonga)
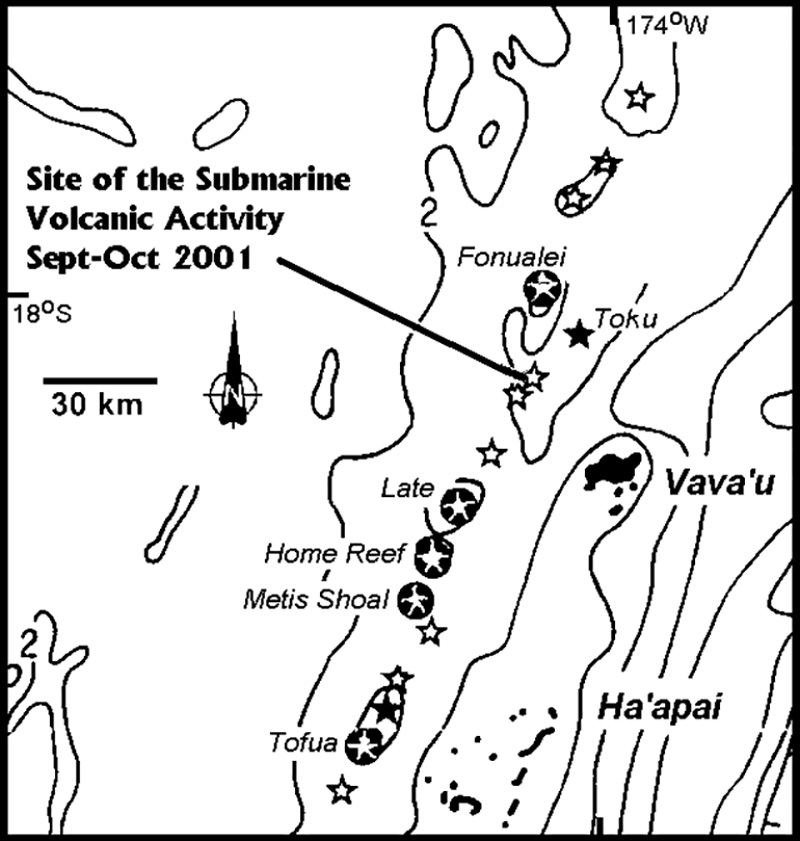
Submarine center identified S of Fonualei may be the source of T-waves and pumice
Yasur (Vanuatu)
Mild eruptive phase ends and leads to a vigorous phase in December 2001; seismic data
Chikurachki (Russia) — January 2002 Cite this Report
Chikurachki
Russia
50.324°N, 155.461°E; summit elev. 1781 m
All times are local (unless otherwise noted)
Several January-February ash clouds observed; small crater formed
The last report of volcanism at Chikurachki on Paramushir Island in the northern Kuriles (figure 3) was made by crews on fishing boats near the volcano on 19 November 1986; activity consisted of lava flows, ash clouds, and pyroclastic flows (SEAN 11:11, 11:12, and 12:01). Chikurachki is not seismically monitored, and therefore the Kamchatka Volcanic Eruptions Response Team (KVERT) does not use a Color Concern Code to label the level of activity. The volcano is not visible from the closest town from which KVERT receives ashfall reports from, Severo-Kurilsk (~55 km NE of the volcano). Information about volcanism comes from crews on vessels and pilots passing Paramushir Island.
An eruption began at Chikurachki on 25 January. The start time of the eruption is not known, but between 1200 and 1500 ash fell to the NE in Severo-Kurilsk. The ash mixed with snow and formed a layer ~1.5 mm thick; the thickness of the ash alone was probably ~10-30% less. On 2 February an eruption was seen by a helicopter pilot. At 1200 that day an ash column rose 300 m above the volcano's crater and drifted more than 70 km to the SE.
The next report of volcanism at Chikurachki was made by a hunter on 7 February. He heard thunder and saw a persistent ash column rising to ~2.5 km altitude. The upper portion of the ash cloud was obscured by low cloud cover, so the ash cloud's exact height and direction of movement were not known.
Reports of activity at Chikurachki also prompted news reports stating that Ebeko, ~60 km NE of Chikurachki, was erupting (figure 3). The reports were found to be false; Chikurachki was the only volcano on Paramushir Island to be active in January.
According to reports from Severo-Kurilsk, by mid-February volcanism at Chikurachki had decreased. Visual observations from a helicopter on 18 February revealed that a small new crater had formed on the SSE part of the volcano's summit crater. In addition, a gas-and-steam plume rose 150 m above the crater and extended to the ESE. A stripe of fresh ash was seen on the volcano's E slope. A satellite image, taken on 18 February at 1649, provided a relatively clear view of Chikurachki; no thermal anomaly or volcanic plume was visible. Although the level of volcanic activity decreased, KVERT stated that ash explosions could still occur. According to the Tokyo VAAC, possible eruptions on 21 February at 0325 and 24 February at 1232 may have produced ash clouds that rose to ~6 and 5.8 km, respectively.
Geologic Background. Chikurachki, the highest volcano on Paramushir Island in the northern Kuriles, is a relatively small cone constructed on a high Pleistocene edifice. Oxidized basaltic-to-andesitic scoria deposits covering the upper part of the young cone give it a distinctive red color. Frequent basaltic Plinian eruptions have occurred during the Holocene. Lava flows have reached the sea and formed capes on the NW coast; several young lava flows are also present on the E flank beneath a scoria deposit. The Tatarinov group of six volcanic centers is located immediately to the south, and the Lomonosov cinder cone group, the source of an early Holocene lava flow that reached the saddle between it and Fuss Peak to the west, lies at the southern end of the N-S-trending Chikurachki-Tatarinov complex. In contrast to the frequently active Chikurachki, the Tatarinov centers are extensively modified by erosion and have a more complex structure. Tephrochronology gives evidence of an eruption around 1690 CE from Tatarinov, although its southern cone contains a sulfur-encrusted crater with fumaroles that were active along the margin of a crater lake until 1959.
Information Contacts: Olga Chubarova, Kamchatka Volcanic Eruptions Response Team (KVERT); Thomas P. Miller, Alaska Volcano Observatory (AVO), 4200 University Drive, Anchorage, AK 99508, USA (URL: http://www.avo.alaska.edu/); Tokyo Volcanic Ash Advisory Center, Tokyo, Japan (URL: http://ds.data.jma.go.jp/svd/vaac/data/); National Oceanic and Air Administration (NOAA), 14th Street & Constitution Avenue, NW, Room 6013, Washington, DC 20230 (URL: http://www.noaa.gov).
Kanlaon (Philippines) — January 2002 Cite this Report
Kanlaon
Philippines
10.412°N, 123.132°E; summit elev. 2435 m
All times are local (unless otherwise noted)
Increased seismicity during January 2002 may be precursor to eruption
As of late May 2001, seismicity at Canlaon was low, and the Philippine Institute of Volcanology and Seismology (PHIVOLCS) relaxed its no-entry advisory into the crater (BGVN 26:10). No further reports were issued through 2001.
On 30 January 2002 PHIVOLCS reported that during the previous month, the seismic network around the volcano detected a higher number of earthquakes, observations that may indicate a reactivation of the volcano. Seismicity was dominated by high-frequency earthquakes located around the crater, from shallow depth to 8.5 km deep. These earthquakes may represent episodes of subsurface fracturing due to magma intrusion. During mid-January, PHIVOLCS further noted the occurrence of several low-frequency earthquakes, which supports the idea that some fluid migration, possibly magma ascent, was occurring. PHIVOLCS noted that if this idea was confirmed by forthcoming surveys, then the Alert Level may be raised.
Increased activity at Canlaon was recognized as early as January 2001 with occurrences of earthquake clusters. At the time PHIVOLCS issued a similar notice but activity quieted down. This year's reactivation seems more intense in terms of the number of earthquakes. They could foretell of impending phreatic eruptions. Several teams were sent to augment the Canlaon Volcano Observatory with additional seismometers and deployment of a GPS-based ground-deformation monitoring network. Because sudden phreatic or steam-driven explosions may occur at any time, PHIVOLCS urged the public to strictly observe the 4-km-radius Permanent Danger Zone (PDZ) around the volcano and recommended the suspension of all treks within this zone until further notice. As of 30 January, PHIVOLCS reported that volcanic activity did not require any kind of evacuation except for areas within the PDZ.
Geologic Background. Kanlaon volcano (also spelled Canlaon) forms the highest point on the island of Negros, Philippines. The massive andesitic stratovolcano is covered with fissure-controlled pyroclastic cones and craters, many of which are filled by lakes. The largest debris avalanche known in the Philippines traveled 33 km SW from Kanlaon. The summit contains a 2-km-wide, elongated northern caldera with a crater lake and a smaller but higher active vent, Lugud crater, to the south. Eruptions recorded since 1866 have typically consisted of phreatic explosions of small-to-moderate size that produce minor local ashfall.
Information Contacts: Philippine Institute of Volcanology and Seismology (PHIVOLCS), Department of Science and Technology, 5th & 6th Floors, Hizon Building, 29 Quezon Avenue, Quezon City, Philippines.
Karangetang (Indonesia) — January 2002 Cite this Report
Karangetang
Indonesia
2.781°N, 125.407°E; summit elev. 1797 m
All times are local (unless otherwise noted)
Lahars cause damage in January; explosions and lava flows in February
During 5 November 2001 through 24 February 2002, seismicity continued at Karangetang, and plumes were observed rising above the summit (table 3). The lava flows that began during late April and early May 2001 (see BGVN 26:10) stopped around 25 October. Multiphase earthquakes, associated with lava dome growth, had not been registered since September but began again during early November.
Table 3. Seismicity and plumes observed at Karangetang during 5 November through 24 February. The Alert Level remained at 2 throughout this period. Courtesy VSI.
| Date |
Deep volcanic (A-type) |
Shallow volcanic (B-type) |
Tectonic |
Multiphase |
Observation (plume heights are above summit) |
| 05 Nov-11 Nov 2001 |
7 |
-- |
51 |
11 |
White medium-thick plume rose 100 m above N crater, 50 m above crater II; incandescence to 20 m |
| 12 Nov-18 Nov 2001 |
14 |
4 |
49 |
-- |
White medium-thick plume rose 600 m; incandescence to 25-50 m |
| 19 Nov-25 Nov 2001 |
12 |
9 |
36 |
-- |
-- |
| 26 Nov-02 Dec 2001 |
14 |
2 |
66 |
5 |
White medium-thick plume rose 300 m above main crater, 150 m above crater II |
| 03 Dec-09 Dec 2001 |
13 |
9 |
45 |
11 |
White thin-medium plume rose 50-250 m above main crater, 100 m above crater II |
| 17 Dec-30 Dec 2001 |
17 |
16 |
60 |
12 |
White medium-thick plume rose 500 m above main (S) crater, 50 m above crater II |
| 30 Dec-06 Jan 2002 |
10 |
5 |
9 |
7 |
Lahars on 3 January |
| 07 Jan-13 Jan 2002 |
18 |
8 |
56 |
9 |
White medium-thick plume rose 400 m above summit, incandescence inside the plume to 50 m |
| 14 Jan-20 Jan 2002 |
4 |
7 |
44 |
1 |
-- |
| 21 Jan-27 Jan 2002 |
4 |
6 |
29 |
6 |
-- |
| 28 Jan-03 Feb 2002 |
8 |
1 |
36 |
12 |
White medium-thick plume rose 100 m above main (S) crater, 75 m above N crater; incandescence to 25 m |
| 04 Feb-10 Feb 2002 |
407 |
215 |
967 |
23 |
Incandescence to 25 m |
| 11 Feb-17 Feb 2002 |
281 |
73 |
102 |
3 |
Ash to WSW, lava flows, incandescence to 25 m |
| 18 Feb-24 Feb 2002 |
113 |
16 |
100 |
1 |
Incandescence to 25 m |
During the first days of 2002 heavy rains near the summit resulted in cold lahars along the Kahetang river on the E flank. On 3 January around 1200 a lahar traveled ~260 m and was ~10-125 cm thick near Terminal and Pelabuhan Ulu Siau. The volume of the lahar was estimated to reach 40,000 m3. In this area, a total of 52 houses were destroyed. Near Bebali village, a lahar traveled ~60 m and covered the road along Ulu Siau city to Ondong village to a thickness of ~75 cm. The volume of the lahar was estimated at 600 m3. In this area, 9 houses and a church were damaged.
Seismicity increased during early February, and a thundering sound was heard frequently coming from the main (S) crater, often accompanied by a sulfur smell. During a 3-day period in early February, 82 earthquakes occurred with magnitudes of 1-3. The earthquakes often caused sliding of the unstable 2001 lava. On 11 February, an explosion occurred that produced ash falls 0.5-1 mm thick to the WSW, reaching the Kanawong, Lehi, Mimi, Kinali, and Pehe villages. Incandescent lava flows traveled up to 1.5 km down the Beha river (W slope) and Kahetang river (E slope). Seismicity was still high but decreased after the 11 February explosion. Loud noises, sulfur smells, and incandescence were observed through at least 24 February.
Geologic Background. Karangetang (Api Siau) volcano lies at the northern end of the island of Siau, about 125 km NNE of the NE-most point of Sulawesi. The stratovolcano contains five summit craters along a N-S line. It is one of Indonesia's most active volcanoes, with more than 40 eruptions recorded since 1675 and many additional small eruptions that were not documented (Neumann van Padang, 1951). Twentieth-century eruptions have included frequent explosive activity sometimes accompanied by pyroclastic flows and lahars. Lava dome growth has occurred in the summit craters; collapse of lava flow fronts have produced pyroclastic flows.
Information Contacts: Dali Ahmad, Volcanological Survey of Indonesia (VSI), Jalan Diponegoro No. 57, Bandung 40122, Indonesia (URL: http://www.vsi.esdm.go.id/).
Marapi (Indonesia) — January 2002 Cite this Report
Marapi
Indonesia
0.38°S, 100.474°E; summit elev. 2885 m
All times are local (unless otherwise noted)
Explosions during 2001; April ash plume reaches 2.0 km above the summit
On 11 March 2000, an explosion at Marapi ejected thick black ash that rose 1.4 km above the summit (BGVN 25:11). Explosive activity occurred again in 2001, peaking during 13-18 April, when a total of 150 explosions occurred that sent ash plumes to 2 km above the summit.
From January to February 2001, monthly A-type earthquakes had decreased from 15 to 8, and B-type earthquakes had decreased from 24 to 14. Gas-and-steam emissions, however, had increased from 11 events during January to 41 times during February. B-type earthquakes were registered on 7 April and continuous volcanic tremor occurred on 9 April.
On 14 April at 1600 a thick dark ash plume was visible from Bukittinggi, 15 km NW of Marapi's summit. On 16 April at 0600 an explosion sent a thick black ash plume to 700 m above the summit. At 0814 the same day a loud explosion was heard 8 km from the volcano, and a black mushroom-shaped ash plume rose to 2 km above the summit. Ejected incandescent fragments were seen clearly from Bukittinggi and then fell back to the crater rim. Ash fell over the villages of Sungai Puah, Air Angeh, and Andala, and in District X Koto, District Batipuh, District V Koto, Tanah Datar Regency, and Padang Panjang City in the zone S and SW of the summit. Ash deposits 1-4 km from the summit were 2-3 cm thick.
The Marapi Volcano Observatory increased the Alert Level from 1 to 2 following the activity that began on 13 April and a recommendation was issued by the local government to prevent people from traveling to the summit area.
Volcanic activity at Marapi continued through at least June 2001 (table 1). On 8 May at 2240, an explosion was accompanied by a moderate booming sound heard from the Tandikat observatory. Ash from the explosion spread to the NW, to Kota Bary, Padangpanjang, Lo Koto, and around the Tandikat observatory.
Table 1. Earthquakes and plumes reported at Marapi during 23 April-10 June 2001. Courtesy of VSI.
| Date |
Deep volcanic (A-type) |
Shallow volcanic (B-type) |
Explosion |
Tectonic |
Observation (plume heights are above summit) |
| 23 Apr-29 Apr 2001 |
58 |
-- |
30 |
-- |
Gray-black plume to 3.0 km; volcanic materials fell 4.0 km from volcano. Five explosion earthquakes were accompanied by loud noise. |
| 30 Apr-06 May 2001 |
27 |
22 |
4 |
-- |
Gray plume to 1.2 km above summit. |
| 07 May-13 May 2001 |
16 |
46 |
14 |
1 |
Whitish-gray thick plume to 1.5 km above summit. |
| 04 Jun-10 Jun 2001 |
2 |
-- |
2 |
2 |
Explosion earthquakes had 33.6 mm maximum amplitudes. |
An explosion that began at 0445 on 5 June sent ash to the SSW. The ash was 0.5-2 mm thick in places. Merapi remained at Alert Level 2 through at least 10 June 2001.
Geologic Background. Gunung Marapi, not to be confused with the better-known Merapi volcano on Java, is Sumatra's most active volcano. This massive complex stratovolcano rises 2,000 m above the Bukittinggi Plain in the Padang Highlands. A broad summit contains multiple partially overlapping summit craters constructed within the small 1.4-km-wide Bancah caldera. The summit craters are located along an ENE-WSW line, with volcanism migrating to the west. More than 50 eruptions, typically consisting of small-to-moderate explosive activity, have been recorded since the end of the 18th century; no lava flows outside the summit craters have been reported in historical time.
Information Contacts: Dali Ahmad, Volcanological Survey of Indonesia (VSI) (URL: http://www.vsi.esdm.go.id/).
Soputan (Indonesia) — January 2002 Cite this Report
Soputan
Indonesia
1.112°N, 124.737°E; summit elev. 1785 m
All times are local (unless otherwise noted)
Avalanche earthquakes, white plumes to 100 m through mid-July 2001
During 13 February through 15 July 2001, seismicity at Soputan was dominated by avalanche earthquakes (see table 3). Discontinuous tremor (0.5- 4 mm amplitude) was reported through most of the report period. Plumes, generally white and thin, were visible reaching 50-100 m above the summit. The Alert Level remained at 2 through at least mid-July 2001. No further reports were issued through February 2002.
Table 3. Earthquakes registered at Soputan during 13 February through 15 July 2001. No reports were issued for missing weeks. Courtesy of VSI.
| Date |
Deep volcanic (A-type) |
Shallow volcanic (B-type) |
Avalanche |
Tectonic |
| 13 Feb-19 Feb 2001 |
7 |
-- |
57 |
8 |
| 20 Feb-26 Feb 2001 |
4 |
1 |
23 |
36 |
| 27 Feb-05 Mar 2001 |
-- |
1 |
7 |
-- |
| 06 Mar-12 Mar 2001 |
6 |
-- |
30 |
12 |
| 12 Mar-18 Mar 2001 |
4 |
-- |
30 |
15 |
| 19 Mar-23 Mar 2001 |
5 |
1 |
56 |
18 |
| 02 Apr-09 Apr 2001 |
4 |
1 |
73 |
51 |
| 09 Apr-15 Apr 2001 |
1 |
1 |
51 |
17 |
| 16 Apr-23 Apr 2001 |
9 |
-- |
37 |
30 |
| 23 Apr-29 Apr 2001 |
1 |
17 |
36 |
-- |
| 07 May-13 May 2001 |
-- |
1 |
148 |
29 |
| 14 May-20 May 2001 |
1 |
-- |
69 |
14 |
| 28 May-03 Jun 2001 |
6 |
-- |
85 |
27 |
| 04 Jun-10 Jun 2001 |
5 |
-- |
75 |
20 |
| 11 Jun-17 Jun 2001 |
0 |
0 |
86 |
18 |
| 18 Jun-24 Jun 2001 |
1 |
-- |
59 |
14 |
| 25 Jun-01 Jul 2001 |
3 |
-- |
146 |
18 |
| 02 Jul-08 Jul 2001 |
2 |
-- |
123 |
34 |
| 09 Jul-15 Jul 2001 |
3 |
-- |
201 |
48 |
Geologic Background. The Soputan stratovolcano on the southern rim of the Quaternary Tondano caldera on the northern arm of Sulawesi Island is one of Sulawesi's most active volcanoes. The youthful, largely unvegetated volcano is the only active cone in the Sempu-Soputan volcanic complex, which includes the Soputan caldera, Rindengan, and Manimporok (3.5 km ESE). Kawah Masem maar was formed in the W part of the caldera and contains a crater lake; sulfur has been extracted from fumarolic areas in the maar since 1938. Recent eruptions have originated at both the summit crater and Aeseput, a prominent NE-flank vent that formed in 1906 and was the source of intermittent major lava flows until 1924.
Information Contacts: Dali Ahmad, Volcanological Survey of Indonesia (VSI) (URL: http://www.vsi.esdm.go.id/).
Soufriere Hills (United Kingdom) — January 2002 Cite this Report
Soufriere Hills
United Kingdom
16.72°N, 62.18°W; summit elev. 915 m
All times are local (unless otherwise noted)
Small-scale dome collapses and pyroclastic flows through February 2002
The Montserrat Volcano Observatory (MVO) reported that during 17 August 2001 through at least 1 February 2002 at Soufriere Hills, a new lava dome continued to grow within the scar produced from the 29 July 2001 partial dome collapse (BGVN 26:07). Activity generally increased at Soufriere Hills during mid-September through November 2001, and remained at a high level through at least 1 February 2002 (table 38).
Table 38. Seismic and SO2-flux data from Soufriere Hills during 17 August 2001 to 1 February 2002. Courtesy of MVO.
| Date |
Rockfall |
Long-period / Rockfall |
Long-period |
Hybrid |
Volcano-tectonic |
SO2 flux (metric tons/day) |
| 17 Aug-24 Aug 2001 |
189 |
1 |
36 |
149 |
0 |
Not Reported |
| 24 Aug-31 Aug 2001 |
200 |
1 |
6 |
19 |
11 |
25 Aug: 68; 28 Aug: 151 |
| 31 Aug-07 Sep 2001 |
218 |
2 |
31 |
8 |
4 |
31 Aug: 242; 01 Sep: 86 |
| 07 Sep-14 Sep 2001 |
228 |
0 |
28 |
65 |
1 |
13 Sep: 543 |
| 14 Sep-21 Sep 2001 |
211 |
4 |
36 |
522 |
3 |
avg 200-2000 |
| 21 Sep-28 Sep 2001 |
297 |
7 |
16 |
326 |
12 |
100-600; avg 250 |
| 28 Sep-05 Oct 2001 |
202 |
2 |
26 |
451 |
0 |
01 Oct: 418 |
| 05 Oct-12 Oct 2001 |
285 |
7 |
34 |
20 |
1 |
10 Oct: 388 |
| 12 Oct-19 Oct 2001 |
207 |
2 |
6 |
9 |
1 |
18 Oct: 320 |
| 19 Oct-26 Oct 2001 |
208 |
2 |
3 |
46 |
0 |
22 Oct: 574; 23 Oct: 48424 Oct: 292; 25 Oct: 200 |
| 26 Oct-02 Nov 2001 |
284 |
-- |
8 |
46 |
2 |
77-385; avg 233; 26 Oct: 611 |
| 02 Nov-09 Nov 2001 |
314 |
8 |
5 |
174 |
4 |
05 Nov: 134 |
| 09 Nov-16 Nov 2001 |
149 |
4 |
20 |
116 |
2 |
13 Nov: 521; 15 Nov: 450 |
| 16 Nov-23 Nov 2001 |
251 |
45 |
115 |
413 |
-- |
19 Nov: 140; 20 Nov: 119 |
| 23 Nov-30 Nov 2001 |
435 |
82 |
145 |
193 |
-- |
<100 avg |
| 30 Nov-07 Dec 2001 |
363 |
37 |
58 |
128 |
-- |
Not Reported |
| 07 Dec-14 Dec 2001 |
551 |
97 |
95 |
80 |
-- |
11 Dec: 158 |
| 14 Dec-21 Dec 2001 |
858 |
42 |
57 |
25 |
-- |
19 Dec: 181 |
| 21 Dec-28 Dec 2001 |
1012 |
45 |
75 |
75 |
-- |
27 Dec: 851 |
| 28 Dec-04 Jan 2002 |
911 |
69 |
103 |
21 |
-- |
250-1000, avg 457 |
| 04 Jan-11 Jan 2002 |
939 |
81 |
87 |
24 |
-- |
08 Jan: 898; 10 Jan: 1122 |
| 11 Jan-18 Jan 2002 |
741 |
29 |
52 |
7 |
-- |
Not Reported |
| 18 Jan-25 Jan 2002 |
471 |
68 |
70 |
9 |
-- |
22 Jan: 700 |
| 25 Jan-01 Feb 2002 |
610 |
67 |
140 |
8 |
-- |
Not Reported |
Throughout the report period, the new dome produced pyroclastic flows and rockfalls that traveled E to the upper and middle reaches of the Tar River Valley. Small-scale lava dome collapses generated pyroclastic flows almost continuously, with flows entering the sea on 4, 5, and 14 October, 2 and 28 December 2001, and 5 and 12 January 2002. Dense ash plumes associated with sea entry and ash venting from the summit generally drifted W and reached up to 3.0 km altitude (table 39). During mid-October ash clouds drifted to the W and NW and occasionally deposited small amounts of ash on inhabited areas to the N of the island. A new event began on 28 December at 1330 that produced a large area of dense ash observed on satellite imagery below ~3 km a.s.l. Incandescence was observed at the dome on 3 September, during 2-9 and 16-23 November, and on the E and W sides of dome on 26 and 27 December. Mudflows occurred in the Belham Valley on several days during periods of torrential rainfall.
Table 39. Summary of ash emissions at Soufriere Hills seen on satellite imagery during 26 August 2001- 5 February 2002. Courtesy of Washington VAAC.
| Date |
Altitude (km) |
Direction |
Size |
| 26 Aug 2001 |
~2.1 |
SW |
28 km long, 9 km wide |
| 05 Sep 2001 |
~1 |
W |
160 km long, 28 km wide |
| 07 Sep 2001 |
~summit level |
S |
-- |
| 16 Sep 2001 |
~summit level |
-- |
-- |
| 21 Sep 2001 |
<1 |
WNW |
-- |
| 22 Sep 2001 |
<1.2 |
WNW |
115 km long |
| 24 Sep 2001 |
~1.5 |
W |
-- |
| 25 Sep 2001 |
~1.5 |
W |
-- |
| 26 Sep 2001 |
~1.5 |
WSW |
-- |
| 30 Sep 2001 |
<3.0 |
W |
-- |
| 03 Oct 2001 |
~summit level |
WSW |
-- |
| 04 Oct 2001 |
<1.5 |
W |
36 km long, 23 km wide |
| 04 Oct 2001 |
<2.4 |
WNW |
28 km wide |
| 05 Oct 2001 |
<1.5 |
-- |
-- |
| 06 Oct 2001 |
<1.8 |
W |
168 km long, 17 km wide |
| 07 Oct 2001 |
<1.8 |
-- |
-- |
| 10 Oct 2001 |
~1.8 |
vertically, possibly E |
-- |
| 11 Oct 2001 |
<1.8 |
W |
-- |
| 11 Oct 2001 |
>2.1 |
NW |
-- |
| 12 Oct 2001 |
<1.8 |
W |
-- |
| 14 Oct 2001 |
~1.8 |
-- |
-- |
| 26 Oct 2001 |
<2.1 |
W |
-- |
| 07 Nov 2001 |
<1.8 |
NW |
32 km long, 7 km wide |
| 07 Nov 2001 |
<6.0 |
ENE |
-- |
| 17 Nov 2001 |
<5.2 |
NE |
-- |
| 18 Nov 2001 |
<3.0 |
NE |
42 km long, 11 km wide |
| 03 Dec 2001 |
~2.4 |
W |
-- |
| 08 Dec 2001 |
~1.8 |
W |
139 km long |
| 13 Dec 2001 |
~4.0 |
WSW |
60 km long, 13 km wide |
| 14 Dec 2001 |
-- |
WSW |
-- |
| 21 Dec 2001 |
<2.4 |
W |
28 km long, 7 km wide |
| 27 Dec 2001 |
2.1-3.0 |
SSE |
22 km wide |
| 27 Dec 2001 |
<3.0 |
SW |
-- |
| 28 Dec 2001 |
<3.0 |
WNW |
47 km long, 11 km wide |
| 29 Dec 2001 |
~3.0 |
WNW |
70 km wide |
| 29 Dec 2001 |
<3.0 |
W |
129 km long, 16 km wide |
| 01 Jan 2002 |
<1.5 |
W |
133 km long, 10-24 km wide |
| 02 Jan 2002 |
<1.5 |
WNW |
125 km long, 10 km wide |
| 05 Jan 2002 |
<2.4 |
W |
-- |
| 08 Jan 2002 |
~1.5, bursts to 2.4 |
W |
140 km long |
| 11 Jan 2002 |
-- |
W |
41 km long, 9 km wide |
| 12 Jan 2002 |
<3.0 |
WNW |
-- |
| 13 Jan 2002 |
<2.4 |
W |
149 km long |
| 29 Jan 2002 |
~2.4 |
W |
-- |
| 05 Feb 2002 |
2.4-3.0 |
W |
-- |
| 05 Feb 2002 |
1.5 |
NW |
23 km wide |
| 05 Feb 2002 |
3.0 |
W |
17 km wide |
The daytime entry zone (DTEZ), closed after 4 July when two small pyroclastic flows passed down the W flank of the volcano in the Amersham area, reopened on 29 August. However, the Montserrat Volcano Observatory (MVO) warned that activity could still increase quite suddenly, with a dangerous situation developing very quickly. Ash masks were to be worn in ashy conditions, and the Belham Valley was to be avoided during and after heavy rainfall due to the possibility of mudflows. The DTEZ was closed again during 4-11 October due to increased activity.
Morphology of the new lava dome. Observations during August 2001 revealed that the new dome appeared to be growing rapidly and had steep sides and a rugged summit area. During mid-September, MVO reported that the volume of the dome was estimated to be approximately 12 x 106 m3, indicating an average growth rate of ~2.6 m3 per second since the partial dome collapse on 29 July.
On 31 October and 1 November observations revealed that the active lava dome had grown substantially and appeared to switch growth direction from the NE to the E, where a massive, near-vertical headwall had developed. Observations from a helicopter on 8 November revealed that a shallow, circular depression was located over the summit area of the dome, with ash vigorously venting from it. The lava dome's highest point during mid-November was measured on 9 November at 876 m elevation.
During mid-November, lava-dome growth shifted from the E to the W, and the summit area was crowned by spines with an average elevation of 940 m. An elevation of 968 meters was measured on one spine, although one other stood higher. By the end of November, MVO reported these elevations: the dome complex consisting of the stagnant E lobe (870 m), an inactive central lobe (930 m), and the active W lobe (960 m on 27 November). The W lobe had produced several small spines, which collapsed and were replaced by new spines.
Observations of the lava dome on 16 December revealed that although it had not increased noticeably in height, it had increased in volume since November. The top of the dome had developed a broadly rounded and blocky appearance. Most of the growth appeared to occur on the W side of the dome, but rockfalls and small pyroclastic flows also occurred on the E and S flanks.
Observations on 10 January revealed that the summit dome had increased in volume considerably during the previous several weeks and that it was broad with several spines projecting upward. The highest spine reached 1,015 m elevation on 12 January. A large lobe was again active on the upper E flank of the dome, just below the summit level. The W side of the dome appeared to have been inactive for some time, judging from the general weathered appearance and deposits of sulphur. Survey measurements also indicated that the saddle area between the NE and central buttresses lowered by about 20 m during the previous weeks due to rockfall and pyroclastic-flow activity.
On 21 January the dome was crowned by a large 40- to 50-m tall spine inclined steeply upwards towards the E. Although the number of rockfalls gradually decreased over the previous 3 weeks, their size and duration significantly increased during 18-25 January. Rockfalls during that interval yielded seismic signals whose total energy rates exceeded those seen during the previous few months.
Activity of the new lava dome. Lava-dome collapses consisting of 10-15% of the dome's volume occurred on the N side of the dome on 4 and 5 October. On 14 October, after a day of torrential rainfall, several million cubic meters of unconsolidated talus was destabilized on the SE flank of the pre-July 29 dome. Seismic data suggested that the event began at about 1715, peaked at 2245, and ended at about 2300. Ash from the event fell in residential areas on Montserrat to the NW.
On the morning of 16 October a collapse occurred on the S flank of the dome complex, producing numerous pyroclastic flows that traveled W down the White River and reached about two-thirds of the distance to the sea. This collapse involved a substantial amount of unconsolidated talus flanking the pre-July 29 dome; but the actual volume was unknown because clouds prevented observation of the summit region. Small pyroclastic flows also occurred on 2, 4, and 6 December in the upper reaches of White River, originating from the old dome material closest to Chances Peak.
On 31 October and 1 November several small pyroclastic flows were generated by material avalanching off the E flank of the dome. By mid-November, activity had shifted to be mainly concentrated on the W side of the active area. On 2 December pyroclastic flows again originated in several places along the E face of the new lava dome.
A large pyroclastic flow occurred on the night of 14 November; it traveled E and reached the lower parts of the Tar River Valley, stopping a few hundred meters short of the delta. During 1330-1500 on 28 December, several million cubic meters of volcanic material collapsed down the volcano's NE flank, generating a dense W-drifting ash plume that deposited up to a centimeter of ash in the vicinity of Plymouth (~4 km W of the summit).
Seismicity. Weak banded tremor, which indicates rapid magma ascent, began in the early hours of 14 August and continued to strengthen through 22 August. Bands of tremor continued at irregular intervals through mid-November, appearing with periodicities generally ranging between 10 and 27 hours. During these banded-tremor events, rockfall activity and ash venting increased. On 26 August, a particularly vigorous period of ash venting lasted for ~1 hour and sent W-drifting ash up to ~2 km above the volcano. A weak swarm of volcano-tectonic earthquakes (less than M 1) occurred during 29-31 August. During mid-September the bands of tremor occurred about every 13 hours and were slightly more intense when compared with those of the previous week. In addition, the number and strength of hybrid events associated with these tremor episodes increased, which is a pattern consistent with the moderate rate of dome-growth and periods of vigorous degassing.
Continuous low-amplitude tremor was accompanied by increased rockfall activity during 12-14 September. Ash clouds produced from rockfalls rose slightly above the summit and were visible in satellite imagery. Rockfall signals were intense on 9 and 10 November, but then declined significantly and remained low after 12 November. A swarm of hybrid and long-period earthquakes began on 14 November and reached a peak on 21 November, before declining slightly, although the swarm continued to be moderately energetic through the end of the month. An M 3.6 earthquake located just off the NW coast of Montserrat occurred on 29 November at 1248 and was felt throughout the island.
Rockfalls continued through December, and many were preceded by a few seconds of long-period earthquakes. Continuous, weak tremor recorded on 13 December was associated with ash venting, and produced columns that rose to at least 4 km. Periods of intense cyclical rockfalls occurred on 27 December and coincided with weak swarms of hybrid earthquakes. These hybrids were too small to trigger the seismic-event-detection system, and are therefore not included in the count of hybrid earthquakes given in table 39.
Geologic Background. The complex, dominantly andesitic Soufrière Hills volcano occupies the southern half of the island of Montserrat. The summit area consists primarily of a series of lava domes emplaced along an ESE-trending zone. The volcano is flanked by Pleistocene complexes to the north and south. English's Crater, a 1-km-wide crater breached widely to the east by edifice collapse, was formed about 2000 years ago as a result of the youngest of several collapse events producing submarine debris-avalanche deposits. Block-and-ash flow and surge deposits associated with dome growth predominate in flank deposits, including those from an eruption that likely preceded the 1632 CE settlement of the island, allowing cultivation on recently devegetated land to near the summit. Non-eruptive seismic swarms occurred at 30-year intervals in the 20th century, but no historical eruptions were recorded until 1995. Long-term small-to-moderate ash eruptions beginning in that year were later accompanied by lava-dome growth and pyroclastic flows that forced evacuation of the southern half of the island and ultimately destroyed the capital city of Plymouth, causing major social and economic disruption.
Information Contacts: Montserrat Volcano Observatory (MVO), Mongo Hill, Montserrat, West Indies (URL: http://www.mvo.ms/); Washington Volcanic Ash Advisory Center (VAAC), Satellite Analysis Branch (SAB), NOAA/NESDIS E/SP23, NOAA Science Center Room 401, 5200 Auth Road, Camp Springs, MD 20746, USA (URL: http://www.ospo.noaa.gov/Products/atmosphere/vaac/).
Stromboli (Italy) — January 2002 Cite this Report
Stromboli
Italy
38.789°N, 15.213°E; summit elev. 924 m
All times are local (unless otherwise noted)
Fallout from 23 January explosion carpets popular tourist area
On 23 January at 2054 a large explosion occurred at Stromboli. The explosion was accompanied by a loud noise that was heard at all of the villages on the island and ashfall that lasted for several minutes.
On 24 January, staff from Istituto Nazionale di Geofisica e Vulcanologia - Sezione di Catania (INGV-CT) visited the area SE of the summit craters near Il Pizzo Sopra la Fossa between the Bastimento and La Fossetta. They found the area covered with ash and blocks, mostly comprised of lithic material, with some clasts up to 60 cm in diameter, and with minor amounts of spatter up to 1.7 m long. No golden-colored pumice was found, which typically characterizes the most energetic events of Stromboli (Bertagnini and others, 1999). The greatest density of lithics on the ground was found in a ~200-m-wide belt between the craters and Il Pizzo. Spatter was more frequent NE of Il Pizzo. Fine-grained material covered the crater zone and the volcano's NE flank to the village of Stromboli, ~2 km to the NE. A continuous carpet of fallout material covered the zone of Il Pizzo, a spot where many tourists visit. The explosion would have posed a serious threat to tourists had it occurred during a visit. Fallout from the eruption also damaged equipment located near the summit.
During the 2.5 hours of the survey observers recorded only five weak explosions from Crater 1 and none from Craters 2 and 3. This activity was much weaker than that observed after the major explosion of 20 October 2001 (BGVN 26:10), when 15 explosions were recorded from Crater 1 and 8 from Crater 3 during a 1-hour period.
Thermal images on 24 January showed that Crater 2 had a higher temperature than the other active craters. Maximum temperatures recorded at this crater were 320°C averaged over a pixel area of 40 cm, much higher than the 200°C recorded on 20 October 2001. The high temperatures were due to spatter coating the crater's inner walls following the 23 January explosion. Measurements also revealed that the diameter of Crater 2 had grown from an estimated 10 m in October to ~26 m after the January explosion.
From the type and distribution of erupted products and the morphological changes observed at the craters, observers suggested that the eruptive event of 23 January could be related to the obstruction of the conduit of one of the craters. Gas pressure within the conduit probably built up until a major explosion occurred, ejecting mostly lithics. Conduit opening was followed by intense magmatic explosions and spatter fallout. During the present phase, observers were concerned by the lack of explosive activity at Crater 3. This may suggest an obstruction of this crater, which might be followed by a new violent episode similar to the one on 23 January.
Reference. Bertagnini A., Coltelli M., Landi P., Pompilio M., and Rosi M., 1999, Violent explosions yield new insights into dynamics of Stromboli volcano: EOS Transactions, AGU, v. 80, n. 52, p. 633-636.
Geologic Background. Spectacular incandescent nighttime explosions at Stromboli have long attracted visitors to the "Lighthouse of the Mediterranean" in the NE Aeolian Islands. This volcano has lent its name to the frequent mild explosive activity that has characterized its eruptions throughout much of historical time. The small island is the emergent summit of a volcano that grew in two main eruptive cycles, the last of which formed the western portion of the island. The Neostromboli eruptive period took place between about 13,000 and 5,000 years ago. The active summit vents are located at the head of the Sciara del Fuoco, a prominent scarp that formed about 5,000 years ago due to a series of slope failures which extends to below sea level. The modern volcano has been constructed within this scarp, which funnels pyroclastic ejecta and lava flows to the NW. Essentially continuous mild Strombolian explosions, sometimes accompanied by lava flows, have been recorded for more than a millennium.
Information Contacts: Sonia Calvari, Massimo Pompilio and Daniele Andronico, Istituto Nazionale di Geofisica e Vulcanologia - Sezione di Catania (INGV-CT) Piazza Roma 2, 95123 Catania, Italy.
Tungurahua (Ecuador) — January 2002 Cite this Report
Tungurahua
Ecuador
1.467°S, 78.442°W; summit elev. 5023 m
All times are local (unless otherwise noted)
Powerful tremor, plumes, 600-m-high lava fountains, and lahars during 2001
The first portion of this report discusses some geophysical and geochemical aspects of Tungurahua's behavior during 2001, including further descriptions through August 2001 (BGVN 26:07). The latter portion of this report contains a log of behavioral data for 24 August-30 December 2001 in tabular form, and finally includes field notes from a visitor who watched the summit crater for several weeks in the later months of the year.
Instituto Geofísico (IG) scientists estimated that 10-15 million metric tons of ash were deposited during the 4-26 August 2001 eruption. By the end of 2001 the current eruptive crisis had included 8 inferred intrusive episodes. Some eruptions, including those during 2001, displayed fountaining with jets of lava rising over 500 m. Since 5 September 2000 through at least January 2002, Alert Levels have been set at Yellow for the town of Baños and at Orange for the rest of the high-risk zone.
Seismicity and SO2 flux. Long-period (LP) earthquakes dominated the seismic record since December 1999 (figure 12). Except for the anomalous month of February 2001, this trend continued in 2001, with the number of LP earthquakes largely swamping other kinds. Specifically, at the scale of the histogram hybrid (H) earthquakes are only visible during February and August; volcano-tectonic (VT) earthquakes, only during January, August, September, and December; explosion (EXP) earthquakes, only during June, July, August, and September.
During 2001 both the seismicity and SO2 flux underwent intervals of relative quiet and intervals with elevated signals. The most dramatic quiet interval, from late 2000 into May 2001, appears on a plot of reduced displacements (RDs) from explosive events (figure 13). A comparative lull also appeared in overall seismicity (figure 12), provisionally in SO2 flux (figure 15), and to a lesser extent, in tremor energy (figure 14). Although the lull appears more equivocal on figure 14, the peaks in tremor energy during July and August, following the lull, were the largest recorded since the spike seen in January 2000. Elevated SO2 flux values appeared around about the same times as the peaks in tremor energy (figure 15).
During 2001, instruments recorded two pronounced seismic peaks (figures 6 and 7). These swarms of LP events had focal depths of 5-7 km and a wide range of dominant frequencies, 308-1066 Hz. The first peak in LP events took place during May-June and was accompanied by emissions at the summit.
The second peak in LP events took place during August-September and also corresponded to increases in the number of hybrid (HB) and volcano-tectonic (VT) earthquakes, and to summit explosions. This second peak differed from seismicity during September 1998 and October 1999 (see plot, BGVN 26:07). During those earlier times, instruments recorded higher numbers of HB and VT events. More recently, both HB and VT events had been decreasing: the former since July 2000, and the latter since October 2000.
Although during early December comparatively few earthquakes occurred, the type of events recorded, tornillos, merit special discussion (see below). Beginning on 20 December the number of LP events increased from an average of 20 events per day in the first days of the month, to an average of 200 events per day. The LPs maintained that level until 26 December.
The two prominent seismic peaks of 2001 were considered as related to intruding magma. Thus, the intrusion associated with the first peak can be divided into three pulses, the first occurring during 19-20 March, the second, 17-18 May, and the third, 6-7 June (and perhaps into July).
The second intrusion occurred in two pulses, the first during 4-20 August, and the second during 4-25 September. The events related to the second intrusion produced the largest RDs (figure 13). For comparison, in 1999-2000 LP events had larger RDs, 12-19 cm2 (figure 13).
In the first inferred intrusion, the discharge of SO2 amounted to 2,900-3,600 metric tons/day (t/d), decreasing to 677 t/d by the end of June. SO2 fluxes associated with the second inferred intrusion reached 3,585 t/d by mid-August, decreasing to 175 t/d by the end of August (figure 15). The peaks in SO2 flux closely corresponded to the increases in tremor energy (figure 14). Incandescence visible during the end of March and July, during early and mid-August, and during early September confirmed that magma then lay at or near the surface.
The pulses of activity of each intrusion preceded, and in some cases accompanied, the emission of vapor and ash during explosive Strombolian activity. For example, for the first intrusion, the second pulse of seismic activity preceded the explosion of 28 May. In that pulse there was ~1 explosion per day with RDs of 1-3 cm2. During the third pulse, aboutone explosion per day had RDs of 1-7 cm2.
For the second, more energetic intrusion, the first pulse of activity had 7 explosions per day with RDs of 1-13 cm2. The next (second) pulse had ~1 explosion per day with RDs of 1-9 cm2 (figure 13). The last intrusion, during mid-June through July, was preceded by "LP de Juive", events so-named because residents in Juive felt them. These signals could have been caused by clearing of nearby subsurface passages that transport magma.
At the beginning of December the previously mentioned tornillos appeared. Tornillos ("Screw-type" events) are monochromatic LP events characterized by a long, slowly decaying coda. On a seismogram they appear similar to a screw. They may arise from fluid resonance in a cavity. It is noteworthy that they showed up for the first time in December 2001, and arrived with considerable intensity. Where defined farther N in the Andes at Galeras, have been recognized as eruptive precursors.
Although relatively small in number, the tornillo events were considered important. During 3-9 December, 43 occurred, the largest number recognized in the history of monitoring at Tungurahua. During 4-12 December the duration of these event's increased. During 4-10 December they underwent a decrease in their dominant frequency. The latter could stem from increased gas in the fluid. The tornillo signals may thus disclose physical changes in the volcano during early December. For example, the tornillos could be related to shifts in internal pressure.
The LP events began to register on 20 December, suggesting magma ascent. A lack of significant ash emissions or SO2 flux suggested that the conduit was sealed. This could allow internal pressure to rise, resulting in a series of explosions.
Deformation. During 2001, inclinometer data from station RETU, located above the Refuge, showed a drift in the positive direction of 10-15 µrad. These values are not highly anomalous considering the large diurnal variations stemming from effects such as temperature and humidity changes in the air and ground surface. On the other hand, measurements of points on the W flank lacked significant distance changes.
EDM measurements from a fixed base (the El Salado base station) were conducted periodically. They aim at two distinct points on the NE flank (in a region above the Refuge). A gradual decrease in the distance between the base and the two points began during July 2000 and implies a slight inflation of the NE flank of the volcano.
During the course of field studies, new NE-flank fumaroles were sighted at ~4,400 m elevation along fractures. Topographic movements were suspected in this sector.
Chronological observations, August-December 2001. Table 5 summarizes seismicity, and visual and satellite observations of eruptions and explosions and their ash clouds.
Table 5. Summary of activity at Tungurahua during August through December 2001. These data mainly came from IG reports. Some of the higher plume heights came from the Washington VAAC and were based on satellite imagery and local aviation reports. Courtesy of IG.
| Date |
Long-period earthquakes |
Tremor signals |
Observations |
| 24 Aug 2001 |
-- |
-- |
An eruption at 1755 produced an ash cloud that rose ~6-8 km and drifted E to SE. |
| 29 Aug 2001 |
20 |
several |
A gas-and-ash eruption at 1530. |
| 03 Sep 2001 |
44 |
36 |
Ash cloud rose to ~ 5.8 km and drifted W. |
| 05 Sep 2001 |
77 |
46 |
Weak emissions with low ash content. |
| 08 Sep 2001 |
-- |
-- |
Ash cloud at 0828 rose ~10.5 km altitude and drifted SW. |
| 11 Sep 2001 |
-- |
-- |
Ashfall to N in Pondoa, Runtun, Banos; ashfall to S in Quero and Penipe; mudflows between Puela and Bilbao. |
| 12 Sep 2001 |
19 |
5 |
An explosion at 1632 produced an ash-bearing emission that reached 2 km above the summit and drifted W; an explosion at 1830 produced an emission that reached 0.5 km above the summit and drifted W. |
| 13 Sep 2001 |
63 |
11 |
A small explosion at 1106; continuous steam emission with ash reached 0.8-1 km above the summit and drifted W; ashfall to the W in Juive, Cotalo, and Bilbao. |
| 15 Sep 2001 |
-- |
-- |
Incandescent material observed along with ash emissions; ashfall to the SW in Riobamba and Penipe. |
| 16 Sep 2001 |
123 |
37 |
Small explosion at 1631; moderate explosion at 1750 (3-km-high column that drifted NW); 2 VT earthquakes. |
| 17 Sep 2001 |
56 |
12 |
-- |
| 20 Sep 2001 |
62 |
49 |
Moderate explosion at 1044 generated an ash column 2 km high that drifted W-SW; the explosion was preceded by three hours of tremor; ashfall in Pillate, Juive, and Runtun; columns of gas and ash drifted W. |
| 21 Sep 2001 |
-- |
-- |
Moderate explosion at 1625 (3-km-high ash column drifted NW); incandescence observed in the crater. |
| 22 Sep 2001 |
212 |
139 |
-- |
| 24 Sep 2001 |
104 |
159 |
Moderate explosion at 1500 (ash column drifted WSW); flank rockfalls heard in Juive, Runtun, Pillate, Pondoa. |
| 25 Sep 2001 |
108 |
41 |
An explosion at 1230 produced an ash column 5 km high that drifted NW; Strombolian activity, incandescence, and rockfalls observed on the W and NW flanks; ashfall in Cotalo; 2 VT earthquakes registered. |
| 26 Sep 2001 |
36 |
37 |
Some ashfall to the S in Quero. |
| 11 Oct 2001 |
30 |
-- |
-- |
| 14 Oct 2001 |
-- |
-- |
Ash visible ~1 km above the summit at 1736. |
| 20 Oct 2001 |
108 |
6 |
Fumarolic activity on the NE side of the crater with intermittent emissions of white clouds that reached 20-500 m. |
| 22 Oct 2001 |
7 |
7 |
Fumarolic activity produced clouds with low ash content that reached 0.5 km; at 1758 a gas-and-ash emission reached 0.7 km and drifted W. |
| 23 Oct 2001 |
7 |
1 |
Fumarolic activity on the N flank (near Vazcun); ash emissions reached 1 km above the summit. |
| 24 Oct 2001 |
42 |
13 |
-- |
| 26 Oct 2001 |
-- |
-- |
Hot spot visible at summit on thermal satellite imagery. |
| 29 Oct 2001 |
24 |
3 |
-- |
| 01 Nov 2001 |
42 |
3 |
Gas-and-ash emissions reached 1-2 km above the summit and drifted ENE. |
| 03 Nov 2001 |
38 |
1 |
-- |
| 06 Nov 2001 |
12 |
1 |
-- |
| 11 Nov 2001 |
34 |
22 |
Gas-and-ash emissions at 1050 and 1352 reached 1 and 3 km, respectively, both drifted W. |
| 14 Nov 2001 |
10 |
3 |
Incandescence and sporadic gas columns observed. |
| 15 Nov 2001 |
38 |
11 |
At 1420 a gas-and-ash emission reached 1 km high and drifted W. |
| 19 Nov 2001 |
73 |
15 |
Emissions followed by 10-30 minutes of tremor; ash columns rose to 2 km and drifted WNW. |
| 22 Nov 2001 |
30 |
-- |
New fumarole observed on the W flank; EDM measurements showed swelling of the N flank. |
| 24 Nov 2001 |
21 |
4 |
Gas-and-ash column rose to 100 m. |
| 26 Nov 2001 |
28 |
1 |
-- |
| 27 Nov 2001 |
18 |
-- |
-- |
| 01 Dec 2001 |
21 |
1 |
Constant gas-and-ash emission reached a few hundred meter's above the summit. |
| 02 Dec 2001 |
-- |
-- |
A small ash emission at 1140 remained near the summit level. |
| 03 Dec 2001 |
23 |
2 |
-- |
| 08 Dec 2001 |
42 |
-- |
-- |
| 10 Dec 2001 |
33 |
2 |
-- |
| 12 Dec 2001 |
4 |
-- |
-- |
| 14 Dec 2001 |
12 |
-- |
Lahars traveled down the flanks of the volcano. |
| 16 Dec 2001 |
17 |
-- |
Lahars traveled down the flanks of the volcano; 1 VT earthquake registered. |
| 18 Dec 2001 |
-- |
-- |
A gas-and-ash column reached 1 km above the summit. |
| 19 Dec 2001 |
16 |
-- |
-- |
| 20 Dec 2001 |
62 |
-- |
Gas-and-ash columns reached 100-200 m above the summit. |
| 26 Dec 2001 |
82 |
11 |
At 1500 a gas-and-ash column reached ~0.3 km above the summit; the continuous gas transmission was accompanied by sporadic pulses of gas and ash. |
| 27 Dec 2001 |
186 |
12 |
At 0900 and 1500 white gas-and-ash columns reached ~0.2 km above the summit. At 1006 and 1427 gray gas-and-ash columns reached 2 and 1 km, respectively; 1 VT earthquake registered. |
| 29 Dec 2001 |
-- |
-- |
A mudflow at 2342 in the Juive Grande gorge affected La Pampa and Los Pajaros. |
| 30 Dec 2001 |
202 |
-- |
An explosion at 0023; at 0027 ash from the explosion rose to ~15 km; until 1500 ashfall was reported in Guadalupe and Patate and other areas W of the volcano. |
IG scientists estimated that 10-15 million tons of ash fell during 4-26 August eruptions. During 6-14 August ash clouds reached the Pacific Ocean, and on 9 August falling ash affected towns 100 km W of the volcano. The Washington Volcanic Ash Advisory Center (VAAC) reported that nearly continuous ash emissions had occurred at Tungurahua beginning on 6 August, but extensive cloudiness prohibited ash-cloud detection in satellite imagery. Officials reported that over 23,000 people were affected by ashfall. The Civil Defense of Ecuador reported that the ashfall reached ~5 cm deep in places. Volcanism also increased during mid-September. Ashfall was reported in adjacent communities during 11-13 September.
The IG reported that on 14 December heavy rain on the upper flanks of Tungurahua resulted in dangerous lahars (table 7). The rain lasted for ~3 hours and the road into Baños was blocked for more than 12 hours in the zone of La Pampa (NW lowermost flank), where the lahars are usually deposited. An emergency bridge was necessary so that traffic could continue to pass. A few cars were almost buried under the flows. Local authorities were alerted within several minutes prior to the event because of an acoustic flow-monitor instrument in the zone.
The minimum total volume of the lahar was ~55,000 m3, making it the seventh-largest recorded by the acoustic flow-monitor since April 2000. The deposit was mainly composed of coarse ash and small pebbles, but it removed blocks up to 2 m in diameter. Similar lahars were reported elsewhere, mostly on the western flank. On 16 December another short rain on the lower flanks removed part of the previous day's lahar in La Pampa, and formed another small flow that again blocked the road for awhile.
Watching the crater during parts of September-December. Jean-Luc Le Pennec of the Institut de Recherche pour le Développement and a collaborator at the IG visited Tungurahua during 10-18 September, 15-22 October, and 26 November-3 December. He made the following observations.
The volcano remained extremely quite, without visible gas escaping the crater, during the day on 10 September. Without clear premonitory signal, at 1915 a powerful lava fountain began. The first pulses of the fountain reached 700 m and progressively declined to 300 m above the crater, before stopping abruptly about 6 minutes after starting. The summit crater then resumed complete quiescence.
In a second episode at 2147, fountaining reached ~600 m above crater and decreased rapidly to ~300 m during the next 5-6 minutes. The crater returned to quiescence and was later obscured by clouds. A seismic swarm of LP events took place during the following hours. During 11-16 September activity was characterized by fluctuating but almost continuous gas-and-ash emissions. Plume height varied between 0.6 to 2 km, depending on gas pressure and wind speed above the crater. The plume usually drifted W (SW to NW). Ashfalls were reported in Guaranda (morning of 11 September), Riobamba (16 September), Pelileo (12 September), and in other localities closer to the volcano. In addition, short-lived explosions occurred at a rate of 0-2 per day, producing ballistic fallouts on the terminal cone, and ash columns reaching ~2-4 km above the crater. They were sometimes accompanied with cannon-like sounds heard 15 km away.
The ejected lava's brightness was particularly intense during the night of 16 September, and a few glowing blocks fell outside of the crater. Periods of rumbling noises were frequently heard all week long, but their intensity increased on 16-17 September. During the night of 17 September lava projections reached 100-300 m above the crater rim. This activity took place around 0300 and started declining very slowly 90 minutes later. The activity continued to decline during the day on 18 September, ending at about 1400 when no sounds were audible as close as 2.5 km from the crater. On 25 September, the volcano produced 1 explosion and Strombolian activity.
During 15-22 October, good weather conditions allowed for frequent observations of the crater. Extremely low activity prevailed, with almost no degassing from the summit crater (except for the permanently active fumaroles of the N crater rim and of the N flank at 4,400 m elevation). Light degassing was observed during the morning of 19 October, after 2 days of increased seismic activity (from ~10 to ~100 events/day). The same day, at 1327, a short-lived outburst sent an ash cloud to ~1 km above the crater. The cloud drifted rapidly to the NNE. Interestingly, the outburst occurred when seismic waves from a regional earthquake arrived at the volcano. Two small ash emissions also occurred, reaching 500-600 m above the crater. In the latter case, a lapse time of 42 seconds was measured between the onset of the seismic signal and the appearance of the ash cloud at the crater level. Light vapor venting was occasionally seen on 20 October. Four ash emissions were witnessed during 2000-2200, with ash columns reaching 0.5-1.0 km above the crater. Few other emissions occurred during the night of 21 October.
During 26 November-3 December activity was low. A fairly continuous pulsating gas plume was emitted from the summit crater. During a 70-minute period on 2 December, five small ash emissions occurred. They rose 0.5-1 km and drifted N. For the third emission, the delay between the onset of the seismic agitation and the appearance of the ash cloud at the crater was 25 seconds, perhaps indicating the release of magma relatively deep in the system.
Geologic Background. Tungurahua, a steep-sided andesitic-dacitic stratovolcano that towers more than 3 km above its northern base, is one of Ecuador's most active volcanoes. Three major edifices have been sequentially constructed since the mid-Pleistocene over a basement of metamorphic rocks. Tungurahua II was built within the past 14,000 years following the collapse of the initial edifice. Tungurahua II collapsed about 3,000 years ago and produced a large debris-avalanche deposit to the west. The modern glacier-capped stratovolcano (Tungurahua III) was constructed within the landslide scarp. Historical eruptions have all originated from the summit crater, accompanied by strong explosions and sometimes by pyroclastic flows and lava flows that reached populated areas at the volcano's base. Prior to a long-term eruption beginning in 1999 that caused the temporary evacuation of the city of Baños at the foot of the volcano, the last major eruption had occurred from 1916 to 1918, although minor activity continued until 1925.
Information Contacts: Patty Mothes and Daniel Andrade, Geophysical Institute (Instituto Geofísico, IG), Escuela Politécnica Nacional, Apartado 17-01-2759, Quito, Ecuador; Jean-Luc Le Pennec, "Volcanic processes and hazards" research unit, Institut de Recherche pour le Développement (IRD), Whymper 442 y Coruña, A.P. 17-12-857 Quito, Ecuador (URL: http:/www.ird.fr); Washington VAAC, Satellite Analysis Branch (SAB), NOAA/NESDIS E/SP23, NOAA Science Center Room 401, 5200 Auth Road, Camp Springs, MD 20746, USA (URL: http://www.ssd.noaa.gov/); United Nations Office for the Coordination of Humanitarian Affairs (OCHA), United Nations, New York, NY 10017 (URL: https://reliefweb.int/); Associated Press.
Unnamed
Tonga
18.325°S, 174.365°W; summit elev. -40 m
All times are local (unless otherwise noted)
Submarine center identified S of Fonualei may be the source of T-waves and pumice
The following was largely condensed from a report by Paul Taylor submitted to the Tongan government (Taylor, 2002). Our previous report on the topic appeared under the heading "Fonualei" (BGVN 26:11). The bulk of that report described T-wave signals on 28-29 September 2001 traced to near Fonualei and fresh pumice found along beaches in Fiji (hundreds of kilometers W of Tonga) during 9-25 November 2001. The T-wave signals and pumice sightings both relate to the activity discussed here.
During September through early November 2001, submarine volcanic activity was observed ~33 km S of Fonualei (figure 3). This same spot lies ~30 km NW of the Vava'u Group of the Tongan islands. This volcanic center lacked prior historical activity, although Taylor and Ewart (1997) indicated that a number of submarine structures were present between Late and Fonualei islands.
Form, structure, and depth. Although no details are available concerning the form and structure of this eruptive site, it is likely to be the summit of a submarine stratovolcano that rises from a NNE-SSW trending topographic high. A shoal has not been reported at the site during historical times. No surveys of this area have been conducted; however, its bathymetry suggests that several submarine structures rise from a depth of about 1 km to probably within 200-300 m of the surface. No shoal or island was observed when the site was visited by the Tonga Defense Services during early and mid-October 2001.
Volcanic activity. The activity appears to have been submarine and explosive in character. Known reports relating to this eruption are given in table 1. A plot of the seismic activity from stations in the Cook Islands and French Polynesia during 28-29 September 2001 were provided in Figure 1 of BGVN 26:11.
Table 1. A summary of observations relating to an unnamed submarine volcano (NW of Vava'u, Tonga). Latitudes and longitudes appear in degrees and decimal degrees; the original used degrees-minutes-seconds. Other significant revisions and substitutions to the original appear as text in brackets. Courtesy of Paul Taylor.
| Date |
Activity |
| 27-28 Sep 2001 |
T-phase seismic waves from a probable volcanic source recorded in French Polynesia. Approximate coordinates of 18.39°S; 174.6°W, are located near the Vava'u Group. |
| 27 Sep 2001 |
1800 - Reports of submarine activity were received from near Vava'u. A local fisherman experienced "an abnormal disturbance from the deep ocean." Shortly after an ash-rich eruption column rose from the sea at 18.325°S, 174.365°W. |
| 28 Sep 2001 |
1300 - An "island" was reported to have formed during the explosive activity with an ash-rich eruption column still being produced. The "island" was estimated to be about 2 miles [~ 3 km] long. The sea was "highly disturbed and silky" at this time. |
| 01 Oct 2001 |
0930 - Royal Tongan Airlines flights 801 and 802 reported that activity above the surface had ceased. A huge underwater bank, about 1.5 miles [2.4 km] across, was observed at 18.358°S, 174.346°W, [3.8 km SW] of the initial location. The water was reported as "boiling bubbles of seawater oozing out from the area to the sea surface". |
| 03 Oct 2001 |
A Tonga Defense Services patrol boat visited the area, but due to heavy seas observations were restricted. The surface of the sea in the region was discolored a "dark whitish color". The discolored area was estimated to be 3 miles [~ 5 km] long (N-S direction) and 1.5-2 miles[2.4-3 km] wide. Near the reported location, the sea appeared to contain a mixture of whitish and yellow-brownish substances although no pumice was observed floating on the surface. A local Notice to Mariners (NTM 15/01) was issued, warning shipping to stay away from the area. |
| 09 Oct 2001 |
1600 - A Tonga Defense Services aircraft flew over the site and reported that an area of discolored water was present. No eruption column or pumice was observed and the island reported earlier was not present. |
| 26 Oct 2001 |
A Tonga Defense Services patrol boat visited the site and observed an area of discolored water 300 m long (NE-SW direction) centered on a position of 18.303°S, 174.377°W, [a spot 2.7 km NE of the initial position]. The discoloration was light-brownish in the center and light greenish toward the outside. The charted depth of the shoal at this location was 298 meters. No depth was recorded by the boat's echo sounder and no attempt was made to take a sounding over the discolored water. |
| early Nov 2001 |
Pumice strandings were reported along the coast of Kadavu and on the S coast of Viti Levu, Fiji. Rafts reported to be over 100 m in diameter with pumice fragments ranging in size from under 1 cm to ~20 cm. |
Comments. As noted above, the charted depth prior to the eruption was ~200-300 m and the syn-eruptive depth was not determined. Further, Taylor learned that post-eruptive depths had not been taken at the site. He goes on to state, "The initial activity was the result of submarine explosions, producing what was reported as 'an island' and an eruption column." In his report, Taylor concluded that the island was essentially a floating pumice raft and ". . . was more likely the effect of gases and pyroclastic material produced by the explosions breaking the surface, which appeared land-like. An eruption column of predominantly volcanic gas, steam, and pyroclastic material was then ejected above the surface."
Taylor (2002) goes on to discuss relevant volcanic hazards. Regarding approaching the volcano, he recommended that access be prohibited within 2 km, access restricted within the interval 2 to 4 km, and extreme care be taken when approaching or within the interval 4 to 5 km.
References. Taylor, P.W., 2002, Volcanic hazards assessment following the September-October 2001 eruption of a previously unrecognized submarine volcano W of Vava'u, kingdom of Tonga: Australian Volcanological Investigations, AVI Occasional Report No. 02/01
Taylor, P.W., 1999, A volcanic hazards assessment following the January 1999 eruption of Submarine Volcano III Tofua Volcanic Arc, Kingdom of Tonga: Australian Volcanological Investigations, AVI Occasional Report No. 99/01.
Taylor, P.W., and Ewart, A., 1997, The Tofua Volcanic Arc, Tonga, SW Pacific: A review of historic volcanic activity: Australian Volcanological Investigations, AVI Occasional Report No. 97/01.
Geologic Background. A submarine volcano along the Tofua volcanic arc ~45 km NW of Vava'u Island was first observed in September 2001, ~35 km S of Fonualei and 60 km NE of Late volcano. The site of the eruption is at an approximate bathymetric depth of 300 m. T-phase waves were recorded on 27-28 September 2001, and on the 27th local fishermen observed an ash-rich eruption column that rose above the ocean surface. No eruptive activity was reported after the 28th, but water discoloration was documented the following month. In early November rafts and strandings of dacitic pumice were reported along the coasts of Kadavu and Viti Levu in Fiji. The depth of the summit of the submarine cone following the eruption was determined to be 40 m during a 2007 survey; the crater of the 2001 eruption was open to the E.
Information Contacts: Paul Taylor, Australian Volcanological Investigations, PO Box 291, Pymble NSW 2073, Australia; Olivier Hyvernaud, Laboratoire de Geophysique, Papeete Tahiti, French Polynesia; Dan Shackelford, 3124 E. Yorba Linda Blvd., Apt. H-33, Fullerton, CA 92831-2324, USA.
Yasur
Vanuatu
19.532°S, 169.447°E; summit elev. 361 m
All times are local (unless otherwise noted)
Mild eruptive phase ends and leads to a vigorous phase in December 2001; seismic data
Following 22 months of mild eruptive activity (BGVN 26:11), at the end of October 2001 on-site volcanologists observed the beginning of a more vigorous eruptive phase. The phase's progressive onset was also monitored seismically, which revealed an initial cycle of substantial activity that developed during the first half of December (figure 27). This was followed by a calmer interval, 14-25 December, after which a new burst of activity took place.
The seismic counts at Yasur (figure 27) can be explained as follows. A geophone is connected to an amplifier that generates signals in response to rapid vertical ground-movements. When the system's output signal (1-20 Hz) crosses a predefined threshold 8 times, the contents of the memory of the counter keyed to that particular threshold are increased by one. For a new count to begin, there has to be an interruption of the signal of at least 2 seconds. The permanent apparatus installed at Yasur for measurement of seismic variation is set to measure across 5 such thresholds, corresponding to an amplitude of just a few micrometers (level 1) to over 300 µm (level 5). The first four thresholds (levels) variously reflect Yasur's state of Strombolian activity.
At levels 1 and 2, one can observe hundreds, sometimes thousands, of seismic counts per day. During periods of high activity, paradoxically, one notes a lessening of the number of these counts, either because the counters are saturated, or because the background noise remains above the set threshold. In contrast, level 3, gives a representative idea of the volcano's daily activity: A count in the two-digit range indicates low activity; a daily count in the hundreds indicates high or even very high activity. For level 4, a few counts per day indicates high activity (a status of type 2 on the local hazard map), and when in excess of 10 counts per day, very high activity.
Regarding level 5-from the time since recording began in October 1993 to date-only major regional earthquakes have generated such high-amplitude signals. The counts for large earthquakes do not fully represent the assigned momement-magnitudes. That is the case here, for the main shock of the large tectonic earthquake on 2 January (M 7.2) attained fewer counts than the aftershock (M 6.6, figure 27).
A visit to the crater area on 31 December revealed that the majority of ash emission and ballistic projectiles were limited to area C (see map in BGVN 26:11) and that a vent of 20-30 m diameter, dormant at the time of earlier visits, had formed in area A (figure 28).
Observers witnessed Strombolian eruptions on 29, 30, and 31 December 2001 (figure 29). This activity was accompanied by considerable ash falling in a narrow band over the NE coastal area of the island. Close to a thousand residents suffered the effects of the ashfall, which also negatively impacted subsistence agriculture and the local collection of rainfall as a source of fresh water.
High-magnitude earthquakes. On 2 and 3 January 2002 large tectonic earthquakes struck over 200 km N of Tanna Island (Mw 7.2 and 6.6 respectively). They were felt by the population of Tanna, and recorded by the seismic monitoring station at level 5 (figure 27). Subsequent records showed a considerable weakening of volcanic activity a few days following the earthquake, similar to the pattern observed after the (1-14 December 2001 cycle). It is common for high-magnitude earthquakes (M > 6) near the center of the Vanuatu island group to be felt in Tanna, over 200 km away. To date, after 8 years of continuous monitoring (BGVN 26:11), no connection has been observed between such earthquakes and shifts towards more hazardous behavior at Yasur.
Geologic Background. Yasur has exhibited essentially continuous Strombolian and Vulcanian activity at least since Captain Cook observed ash eruptions in 1774. This style of activity may have continued for the past 800 years. Located at the SE tip of Tanna Island in Vanuatu, this pyroclastic cone has a nearly circular, 400-m-wide summit crater. The active cone is largely contained within the small Yenkahe caldera, and is the youngest of a group of Holocene volcanic centers constructed over the down-dropped NE flank of the Pleistocene Tukosmeru volcano. The Yenkahe horst is located within the Siwi ring fracture, a 4-km-wide open feature associated with eruption of the andesitic Siwi pyroclastic sequence. Active tectonism along the Yenkahe horst accompanying eruptions has raised Port Resolution harbor more than 20 m during the past century.
Information Contacts: Janette Tabbagh, Université Paris VI, UMR 7619, Coordination des Rechershes Volcanologiques (CRV), 4 Place Jussieu, 75252 Paris Cedex 05, France; Michel Lardy, Institut de Recherche pour le Développement (IRD), CRV, BP A 5 Nouméa, Nouvelle Calédonie; Sandrine Wallez and Douglas Charley, Department of Geology, Mines and Water Resources, PMB 01, Port-Vila, Vanuatu.