Recently Published Bulletin Reports
Kadovar (Papua New Guinea) An ash plume and weak thermal anomaly during May 2023
San Miguel (El Salvador) Small gas-and-ash explosions during March and May 2023
Ebeko (Russia) Continued explosions, ash plumes, and ashfall during October 2022-May 2023
Home Reef (Tonga) Discolored plumes continued during November 2022-April 2023
Semisopochnoi (United States) Occasional explosions, ash deposits, and gas-and-steam plumes during December 2022-May 2023
Ambae (Vanuatu) New lava flow, ash plumes, and sulfur dioxide plumes during February-May 2023
Ibu (Indonesia) Daily ash explosions continue, along with thermal anomalies in the crater, October 2022-May 2023
Dukono (Indonesia) Continuing ash emissions, SO2 plumes, and thermal signals during October 2022-May 2023
Sabancaya (Peru) Explosions, gas-and-ash plumes, and thermal activity persist during November 2022-April 2023
Sheveluch (Russia) Significant explosions destroyed part of the lava-dome complex during April 2023
Bezymianny (Russia) Explosions, ash plumes, lava flows, and avalanches during November 2022-April 2023
Chikurachki (Russia) New explosive eruption during late January-early February 2023
Kadovar (Papua New Guinea) — June 2023  Cite this Report
Kadovar
Papua New Guinea
3.608°S, 144.588°E; summit elev. 365 m
All times are local (unless otherwise noted)
An ash plume and weak thermal anomaly during May 2023
Kadovar is a 2-km-wide island that is the emergent summit of a Bismarck Sea stratovolcano. It lies off the coast of New Guinea, about 25 km N of the mouth of the Sepik River. Prior to an eruption that began in 2018, a lava dome formed the high point of the volcano, filling an arcuate landslide scarp open to the S. Submarine debris-avalanche deposits occur to the S of the island. The current eruption began in January 2018 and has comprised lava effusion from vents at the summit and at the E coast; more recent activity has consisted of ash plumes, weak thermal activity, and gas-and-steam plumes (BGVN 48:02). This report covers activity during February through May 2023 using information from the Darwin Volcanic Ash Advisory Center (VAAC) and satellite data.
Activity during the reporting period was relatively low and mainly consisted of white gas-and-steam plumes that were visible in natural color satellite images on clear weather days (figure 67). According to a Darwin VAAC report, at 2040 on 6 May an ash plume rose to 4.6 km altitude and drifted W; by 2300 the plume had dissipated. MODIS satellite instruments using the MODVOLC thermal algorithm detected a single thermal hotspot on the SE side of the island on 7 May. Weak thermal activity was also detected in a satellite image on the E side of the island on 14 May, accompanied by a white gas-and-steam plume that drifted SE (figure 68).
Geologic Background. The 2-km-wide island of Kadovar is the emergent summit of a Bismarck Sea stratovolcano of Holocene age. It is part of the Schouten Islands, and lies off the coast of New Guinea, about 25 km N of the mouth of the Sepik River. Prior to an eruption that began in 2018, a lava dome formed the high point of the andesitic volcano, filling an arcuate landslide scarp open to the south; submarine debris-avalanche deposits occur in that direction. Thick lava flows with columnar jointing forms low cliffs along the coast. The youthful island lacks fringing or offshore reefs. A period of heightened thermal phenomena took place in 1976. An eruption began in January 2018 that included lava effusion from vents at the summit and at the E coast.
Information Contacts: Darwin Volcanic Ash Advisory Centre (VAAC), Bureau of Meteorology, Northern Territory Regional Office, PO Box 40050, Casuarina, NT 0811, Australia (URL: http://www.bom.gov.au/info/vaac/); Hawai'i Institute of Geophysics and Planetology (HIGP) - MODVOLC Thermal Alerts System, School of Ocean and Earth Science and Technology (SOEST), Univ. of Hawai'i, 2525 Correa Road, Honolulu, HI 96822, USA (URL: http://modis.higp.hawaii.edu/); Copernicus Browser, Copernicus Data Space Ecosystem, European Space Agency (URL: https://dataspace.copernicus.eu/browser/).
San Miguel (El Salvador) — June 2023 Cite this Report
San Miguel
El Salvador
13.434°N, 88.269°W; summit elev. 2130 m
All times are local (unless otherwise noted)
Small gas-and-ash explosions during March and May 2023
San Miguel in El Salvador is a broad, deep crater complex that has been frequently modified by eruptions recorded since the early 16th century and consists of the summit known locally as Chaparrastique. Flank eruptions have produced lava flows that extended to the N, NE, and SE during the 17-19th centuries. The most recent activity has consisted of minor ash eruptions from the summit crater. The current eruption period began in November 2022 and has been characterized by frequent phreatic explosions, gas-and-ash emissions, and sulfur dioxide plumes (BGVN 47:12). This report describes small gas-and-ash explosions during December 2022 through May 2023 based on special reports from the Ministero de Medio Ambiente y Recursos Naturales (MARN).
Activity has been relatively low since the last recorded explosions on 29 November 2022. Seismicity recorded by the San Miguel Volcano Station (VSM) located on the N flank at 1.7 km elevation had decreased by 7 December. Sulfur dioxide gas measurements taken with DOAS (Differential Optical Absorption Spectroscopy) mobile equipment were below typical previously recorded values: 300 tons per day (t/d). During December, small explosions were recorded by the seismic network and manifested as gas-and-steam emissions.
Gas-and-ash explosions in the crater occurred during January 2023, which were recorded by the seismic network. Sulfur dioxide values remained low, between 300-400 t/d through 10 March. At 0817 on 14 January a gas-and-ash emission was visible in webcam images, rising just above the crater rim. Some mornings during February, small gas-and-steam plumes were visible in the crater. On 7 March at 2252 MARN noted an increase in degassing from the central crater; gas emissions were constantly observed through the early morning hours on 8 March. During the early morning of 8 March through the afternoon on 9 March, 12 emissions were registered, some accompanied by ash. The last gas-and-ash emission was recorded at 1210 on 9 March; very fine ashfall was reported in El Tránsito (10 km S), La Morita (6 km W), and La Piedrita (3 km W). The smell of sulfur was reported in Piedra Azul (5 km SW). On 16 March MARN reported that gas-and-steam emissions decreased.
Low degassing and very low seismicity were reported during April; no explosions have been detected between 9 March and 27 May. The sulfur dioxide emissions remained between 350-400 t/d; during 13-20 April sulfur dioxide values fluctuated between 30-300 t/d. Activity remained low through most of May; on 23 May seismicity increased. An explosion was detected at 1647 on 27 May generated a gas-and-ash plume that rose 700 m high (figure 32); a decrease in seismicity and gas emissions followed. The DOAS station installed on the W flank recorded sulfur dioxide values that reached 400 t/d on 27 May; subsequent measurements showed a decrease to 268 t/d on 28 May and 100 t/d on 29 May.
Geologic Background. The symmetrical cone of San Miguel, one of the most active volcanoes in El Salvador, rises from near sea level to form one of the country's most prominent landmarks. A broad, deep, crater complex that has been frequently modified by eruptions recorded since the early 16th century caps the truncated unvegetated summit, also known locally as Chaparrastique. Flanks eruptions of the basaltic-andesitic volcano have produced many lava flows, including several during the 17th-19th centuries that extended to the N, NE, and SE. The SE-flank flows are the largest and form broad, sparsely vegetated lava fields crossed by highways and a railroad skirting the base of the volcano. Flank vent locations have migrated higher on the edifice during historical time, and the most recent activity has consisted of minor ash eruptions from the summit crater.
Information Contacts: Ministero de Medio Ambiente y Recursos Naturales (MARN), Km. 5½ Carretera a Nueva San Salvador, Avenida las Mercedes, San Salvador, El Salvador (URL: http://www.snet.gob.sv/ver/vulcanologia).
Ebeko
Russia
50.686°N, 156.014°E; summit elev. 1103 m
All times are local (unless otherwise noted)
Continued explosions, ash plumes, and ashfall during October 2022-May 2023
Ebeko, located on the N end of Paramushir Island in the Kuril Islands, consists of three summit craters along a SSW-NNE line at the northern end of a complex of five volcanic cones. Eruptions date back to the late 18th century and have been characterized as small-to-moderate explosions from the summit crater, accompanied by intense fumarolic activity. The current eruption period began in June 2022 and has recently consisted of frequent explosions, ash plumes, and thermal activity (BGVN 47:10). This report covers similar activity during October 2022 through May 2023, based on information from the Kamchatka Volcanic Eruptions Response Team (KVERT) and satellite data.
Activity during October consisted of explosive activity, ash plumes, and occasional thermal anomalies. Visual data by volcanologists from Severo-Kurilsk showed explosions producing ash clouds up to 2.1-3 km altitude which drifted E, N, NE, and SE during 1-8, 10, 16, and 18 October. KVERT issued several Volcano Observatory Notices for Aviation (VONA) on 7, 13-15, and 27 October 2022, stating that explosions generated ash plumes that rose to 2.3-4 km altitude and drifted 5 km E, NE, and SE. Ashfall was reported in Severo-Kurilsk (Paramushir Island, about 7 km E) on 7 and 13 October. Satellite data showed a thermal anomaly over the volcano on 15-16 October. Visual data showed ash plumes rising to 2.5-3.6 km altitude on 22, 25-29, and 31 October and moving NE due to constant explosions.
Similar activity continued during November, with explosions, ash plumes, and ashfall occurring. KVERT issued VONAs on 1-2, 4, 6-7, 9, 13, and 16 November that reported explosions and resulting ash plumes that rose to 1.7-3.6 km altitude and drifted 3-5 km SE, ESE, E, and NE. On 1 November ash plumes extended as far as 110 km SE. On 5, 8, 12, and 24-25 November explosions and ash plumes rose to 2-3.1 km altitude and drifted N and E. Ashfall was observed in Severo-Kurilsk on 7 and 16 November. A thermal anomaly was visible during 1-4, 16, and 20 November. Explosions during 26 November rose as high as 2.7 km altitude and drifted NE (figure 45).
Explosions and ash plumes continued to occur in December. During 1-2 and 4 December volcanologists from Severo-Kurilsk observed explosions that sent ash to 1.9-2.5 km altitude and drifted NE and SE (figure 46). VONAs were issued on 5, 9, and 16 December reporting that explosions generated ash plumes rising to 1.9 km, 2.6 km, and 2.4 km altitude and drifted 5 km SE, E, and NE, respectively. A thermal anomaly was visible in satellite imagery on 16 December. On 18 and 27-28 December explosions produced ash plumes that rose to 2.5 km altitude and drifted NE and SE. On 31 December an ash plume rose to 2 km altitude and drifted NE.
Explosions continued during January 2023, based on visual observations by volcanologists from Severo-Kurilsk. During 1-7 January explosions generated ash plumes that rose to 4 km altitude and drifted NE, E, W, and SE. According to VONAs issued by KVERT on 2, 4, 10, and 23 January, explosions produced ash plumes that rose to 2-4 km altitude and drifted 5 km N, NE, E, and ENE; the ash plume that rose to 4 km altitude occurred on 10 January (figure 47). Satellite data showed a thermal anomaly during 3-4, 10, 13, 16, 21, 22, and 31 January. KVERT reported that an ash cloud on 4 January moved 12 km NE. On 6 and 9-11 January explosions sent ash plumes to 4.5 km altitude and drifted W and ESE. On 13 January an ash plume rose to 3 km altitude and drifted SE. During 20-24 January ash plumes from explosions rose to 3.7 km altitude and drifted SE, N, and NE. On 21 January the ash plume drifted as far as 40 km NE. During 28-29 and 31 January and 1 February ash plumes rose to 4 km altitude and drifted NE.
During February, explosions, ash plumes, and ashfall were reported. During 1, 4-5 and 7-8 February explosions generated ash plumes that rose to 4.5 km altitude and drifted E and NE; ashfall was observed on 5 and 8 February. On 6 February an explosion produced an ash plume that rose to 3 km altitude and drifted 7 km E, causing ashfall in Severo-Kurilsk. A thermal anomaly was visible in satellite data on 8, 9, 13, and 21 February. Explosions on 9 and 12-13 February produced ash plumes that rose to 4 km altitude and drifted E and NE; the ash cloud on 12 February extended as far as 45 km E. On 22 February explosions sent ash to 3 km altitude that drifted E. During 24 and 26-27 February ash plumes rose to 4 km altitude and drifted E. On 28 February an explosion sent ash to 2.5-3 km altitude and drifted 5 km E; ashfall was observed in Severo-Kurilsk.
Activity continued during March; visual observations showed that explosions generated ash plumes that rose to 3.6 km altitude on 3, 5-7, and 9-12 March and drifted E, NE, and NW. Thermal anomalies were visible on 10, 13, and 29-30 March in satellite imagery. On 18, 21-23, 26, and 29-30 March explosions produced ash plumes that rose to 2.8 km altitude and drifted NE and E; the ash plumes during 22-23 March extended up to 76 km E. A VONA issued on 21 March reported an explosion that produced an ash plume that rose to 2.8 km altitude and drifted 5 km E. Another VONA issued on 23 March reported that satellite data showed an ash plume rising to 3 km altitude and drifted 14 km E.
Explosions during April continued to generate ash plumes. On 1 and 4 April an ash plume rose to 2.8-3.5 km altitude and drifted SE and NE. A thermal anomaly was visible in satellite imagery during 1-6 April. Satellite data showed ash plumes and clouds rising to 2-3 km altitude and drifting up to 12 km SW and E on 3 and 6 April (figure 48). KVERT issued VONAs on 3, 5, 14, 16 April describing explosions that produced ash plumes rising to 3 km, 3.5 km, 3.5 km, and 3 km altitude and drifting 5 km S, 5 km NE and SE, 72 km NNE, and 5 km NE, respectively. According to satellite data, the resulting ash cloud from the explosion on 14 April was 25 x 7 km in size and drifted 72-104 km NNE during 14-15 April. According to visual data by volcanologists from Severo-Kurilsk explosions sent ash up to 3.5 km altitude that drifted NE and E during 15-16, 22, 25-26, and 29 April.
The explosive eruption continued during May. Explosions during 3-4, 6-7, and 9-10 May generated ash plumes that rose to 4 km altitude and drifted SW and E. Satellite data showed a thermal anomaly on 3, 9, 13-14, and 24 May. During 12-16, 23-25, and 27-28 May ash plumes rose to 3.5 km altitude and drifted in different directions due to explosions. Two VONA notices were issued on 16 and 25 May, describing explosions that generated ash plumes rising to 3 km and 3.5 km altitude, respectively and extending 5 km E. The ash cloud on 25 May drifted 75 km SE.
Thermal activity in the summit crater, occasionally accompanied by ash plumes and ash deposits on the SE and E flanks due to frequent explosions, were visible in infrared and true color satellite images (figure 49).
Geologic Background. The flat-topped summit of the central cone of Ebeko volcano, one of the most active in the Kuril Islands, occupies the northern end of Paramushir Island. Three summit craters located along a SSW-NNE line form Ebeko volcano proper, at the northern end of a complex of five volcanic cones. Blocky lava flows extend west from Ebeko and SE from the neighboring Nezametnyi cone. The eastern part of the southern crater contains strong solfataras and a large boiling spring. The central crater is filled by a lake about 20 m deep whose shores are lined with steaming solfataras; the northern crater lies across a narrow, low barrier from the central crater and contains a small, cold crescentic lake. Historical activity, recorded since the late-18th century, has been restricted to small-to-moderate explosive eruptions from the summit craters. Intense fumarolic activity occurs in the summit craters, on the outer flanks of the cone, and in lateral explosion craters.
Information Contacts: Kamchatka Volcanic Eruptions Response Team (KVERT), Far Eastern Branch, Russian Academy of Sciences, 9 Piip Blvd., Petropavlovsk-Kamchatsky, 683006, Russia (URL: http://www.kscnet.ru/ivs/kvert/); MIROVA (Middle InfraRed Observation of Volcanic Activity), a collaborative project between the Universities of Turin and Florence (Italy) supported by the Centre for Volcanic Risk of the Italian Civil Protection Department (URL: http://www.mirovaweb.it/); Copernicus Browser, Copernicus Data Space Ecosystem, European Space Agency (URL: https://dataspace.copernicus.eu/browser/).
Home Reef
Tonga
18.992°S, 174.775°W; summit elev. -10 m
All times are local (unless otherwise noted)
Discolored plumes continued during November 2022-April 2023
Home Reef is a submarine volcano located in the central Tonga islands between Lateiki (Metis Shoal) and Late Island. The first recorded eruption occurred in the mid-19th century, when an ephemeral island formed. An eruption in 1984 produced a 12-km-high eruption plume, a large volume of floating pumice, and an ephemeral island 500 x 1,500 m wide, with cliffs 30-50 m high that enclosed a water-filled crater. Another island-forming eruption in 2006 produced widespread pumice rafts that drifted as far as Australia; by 2008 the island had eroded below sea level. The previous eruption occurred during October 2022 and was characterized by a new island-forming eruption, lava effusion, ash plumes, discolored water, and gas-and-steam plumes (BGVN 47:11). This report covers discolored water plumes during November 2022 through April 2023 using satellite data.
Discolored plumes continued during the reporting period and were observed in true color satellite images on clear weather days. Satellite images show light green-yellow discolored water extending W on 8 and 28 November 2022 (figure 31), and SW on 18 November. Light green-yellow plumes extended W on 3 December, S on 13 December, SW on 18 December, and W and S on 23 December (figure 31). On 12 January 2023 discolored green-yellow plumes extended to the NE, E, SE, and N. The plume moved SE on 17 January and NW on 22 January. Faint discolored water in February was visible moving NE on 1 February. A discolored plume extended NW on 8 and 28 March and NW on 13 March (figure 31). During April, clear weather showed green-blue discolored plumes moving S on 2 April, W on 7 April, and NE and S on 12 April. A strong green-yellow discolored plume extended E and NE on 22 April for several kilometers (figure 31).
Geologic Background. Home Reef, a submarine volcano midway between Metis Shoal and Late Island in the central Tonga islands, was first reported active in the mid-19th century, when an ephemeral island formed. An eruption in 1984 produced a 12-km-high eruption plume, large amounts of floating pumice, and an ephemeral 500 x 1,500 m island, with cliffs 30-50 m high that enclosed a water-filled crater. In 2006 an island-forming eruption produced widespread dacitic pumice rafts that drifted as far as Australia. Another island was built during a September-October 2022 eruption.
Information Contacts: Copernicus Browser, Copernicus Data Space Ecosystem, European Space Agency (URL: https://dataspace.copernicus.eu/browser/).
Semisopochnoi (United States) — June 2023 Cite this Report
Semisopochnoi
United States
51.93°N, 179.58°E; summit elev. 1221 m
All times are local (unless otherwise noted)
Occasional explosions, ash deposits, and gas-and-steam plumes during December 2022-May 2023
Semisopochnoi is located in the western Aleutians, is 20-km-wide at sea level, and contains an 8-km-wide caldera. The three-peaked Mount Young (formerly Cerberus) was constructed within the caldera during the Holocene. Each of these peaks contains a summit crater; the lava flows on the N flank appear younger than those on the S side. The current eruption period began in early February 2021 and has more recently consisted of intermittent explosions and ash emissions (BGVN 47:12). This report updates activity during December 2022 through May 2023 using daily, weekly, and special reports from the Alaska Volcano Observatory (AVO). AVO monitors the volcano using local seismic and infrasound sensors, satellite data, web cameras, and remote infrasound and lightning networks.
Activity during most of December 2022 was relatively quiet; according to AVO no eruptive or explosive activity was observed since 7 November 2022. Intermittent tremor and occasional small earthquakes were observed in geophysical data. Continuous gas-and-steam emissions were observed from the N crater of Mount Young in webcam images on clear weather days (figure 25). On 24 December, there was a slight increase in earthquake activity and several small possible explosion signals were detected in infrasound data. Eruptive activity resumed on 27 December at the N crater of Mount Young; AVO issued a Volcano Activity Notice (VAN) that reported minor ash deposits on the flanks of Mount Young that extended as far as 1 km from the vent, according to webcam images taken during 27-28 December (figure 26). No ash plumes were observed in webcam or satellite imagery, but a persistent gas-and-steam plume that might have contained some ash rose to 1.5 km altitude. As a result, AVO raised the Aviation Color Code (ACC) to Orange (the second highest level on a four-color scale) and the Volcano Alert Level (VAL) to Watch (the second highest level on a four-level scale). Possible explosions were detected during 21 December 2022 through 1 January 2023 and seismic tremor was recorded during 30-31 December.
During January 2023 eruptive activity continued at the active N crater of Mount Young. Minor ash deposits were observed on the flanks, extending about 2 km SSW, based on webcam images from 1 and 3 January. A possible explosion occurred during 1-2 January based on elevated seismicity recorded on local seismometers and an infrasound signal recorded minutes later by an array at Adak. Though no ash plumes were observed in webcam or satellite imagery, a persistent gas-and-steam plume rose to 1.5 km altitude that might have carried minor traces of ash. Ash deposits were accompanied by periods of elevated seismicity and infrasound signals from the local geophysical network, which AVO reported were likely due to weak explosive activity. Low-level explosive activity was also detected during 2-3 January, with minor gas-and-steam emissions and a new ash deposit that was visible in webcam images. Low-level explosive activity was detected in geophysical data during 4-5 January, with elevated seismicity and infrasound signals observed on local stations. Volcanic tremor was detected during 7-9 January and very weak explosive activity was detected in seismic and infrasound data on 9 January. Weak seismic and infrasound signals were recorded on 17 January, which indicated minor explosive activity, but no ash emissions were observed in clear webcam images; a gas-and-steam plume continued to rise to 1.5 km altitude. During 29-30 January, ash deposits near the summit were observed on fresh snow, according to webcam images.
The active N cone at Mount Young continued to produce a gas-and-steam plume during February, but no ash emissions or explosive events were detected. Seismicity remained elevated with faint tremor during early February. Gas-and-steam emissions from the N crater were observed in clear webcam images on 11-13 and 16 February; no explosive activity was detected in seismic, infrasound, or satellite data. Seismicity has also decreased, with no significant seismic tremor observed since 25 January. Therefore, the ACC was lowered to Yellow (the second lowest level on a four-color scale) and the VAL was lowered to Advisory (the second lowest level on a four-color scale) on 22 February.
Gas-and-steam emissions persisted during March from the N cone of Mount Young, based on clear webcam images. A few brief episodes of weak tremor were detected in seismic data, although seismicity decreased over the month. A gas-and-steam plume detected in satellite data extended 150 km on 18 March. Low-level ash emissions from the N cone at Mount Young were observed in several webcam images during 18-19 March, in addition to small explosions and volcanic tremor. The ACC was raised to Orange and the VAL increased to Watch on 19 March. A small explosion was detected in seismic and infrasound data on 21 March.
Low-level unrest continued during April, although cloudy weather often obscured views of the summit; periods of seismic tremor and local earthquakes were recorded. During 3-4 April a gas-and-steam plume was visible traveling more than 200 km overnight; no ash was evident in the plume, according to AVO. A gas-and-steam plume was observed during 4-6 April that extended 400 km but did not seem to contain ash. Small explosions were detected in seismic and infrasound data on 5 April. Occasional clear webcam images showed continuing gas-and-steam emissions rose from Mount Young, but no ash deposits were observed on the snow. On 19 April small explosions and tremor were detected in seismic and infrasound data. A period of seismic tremor was detected during 22-25 April, with possible weak explosions on 25 April. Ash deposits were visible near the crater rim, but it was unclear if these deposits were recent or due to older deposits.
Occasional small earthquakes were recorded during May, but there were no signs of explosive activity seen in geophysical data. Gas-and-steam emissions continued from the N crater of Mount Young, based on webcam images, and seismicity remained slightly elevated. A new, light ash deposit was visible during the morning of 5 May on fresh snow on the NW flank of Mount Young. During 10 May periods of volcanic tremor were observed. The ACC was lowered to Yellow and the VAL to Advisory on 17 May due to no additional evidence of activity.
Geologic Background. Semisopochnoi, the largest subaerial volcano of the western Aleutians, is 20 km wide at sea level and contains an 8-km-wide caldera. It formed as a result of collapse of a low-angle, dominantly basaltic volcano following the eruption of a large volume of dacitic pumice. The high point of the island is Anvil Peak, a double-peaked late-Pleistocene cone that forms much of the island's northern part. The three-peaked Mount Cerberus (renamed Mount Young in 2023) was constructed within the caldera during the Holocene. Each of the peaks contains a summit crater; lava flows on the N flank appear younger than those on the south side. Other post-caldera volcanoes include the symmetrical Sugarloaf Peak SSE of the caldera and Lakeshore Cone, a small cinder cone at the edge of Fenner Lake in the NE part of the caldera. Most documented eruptions have originated from Young, although Coats (1950) considered that both Sugarloaf and Lakeshore Cone could have been recently active.
Information Contacts: Alaska Volcano Observatory (AVO), a cooperative program of a) U.S. Geological Survey, 4200 University Drive, Anchorage, AK 99508-4667 USA (URL: https://avo.alaska.edu/), b) Geophysical Institute, University of Alaska, PO Box 757320, Fairbanks, AK 99775-7320, USA, and c) Alaska Division of Geological & Geophysical Surveys, 794 University Ave., Suite 200, Fairbanks, AK 99709, USA (URL: http://dggs.alaska.gov/).
Ambae
Vanuatu
15.389°S, 167.835°E; summit elev. 1496 m
All times are local (unless otherwise noted)
New lava flow, ash plumes, and sulfur dioxide plumes during February-May 2023
Ambae, also known as Aoba, is a large basaltic shield volcano in Vanuatu. A broad pyroclastic cone containing three crater lakes (Manaro Ngoru, Voui, and Manaro Lakua) is located at the summit within the youngest of at least two nested calderas. Periodic phreatic and pyroclastic explosions have been reported since the 16th century. A large eruption more than 400 years ago resulted in a volcanic cone within the summit crater that is now filled by Lake Voui; the similarly sized Lake Manaro fills the western third of the caldera. The previous eruption ended in August 2022 that was characterized by gas-and-steam and ash emissions and explosions of wet tephra (BGVN 47:10). This report covers a new eruption during February through May 2023 that consisted of a new lava flow, ash plumes, and sulfur dioxide emissions, using information from the Vanuatu Meteorology and Geo-Hazards Department (VMGD) and satellite data.
During the reporting period, the Alert Level remained at a 2 (on a scale of 0-5), which has been in place since December 2021. Activity during October 2022 through March 2023 remained relatively low and mostly consisted of gas-and-steam emissions in Lake Voui. VMGD reported that at 1300 on 15 November a satellite image captured a strong amount of sulfur dioxide rising above the volcano (figure 99), and that seismicity slightly increased. The southern and northern part of the island reported a strong sulfur dioxide smell and heard explosions. On 20 February 2023 a gas-and-ash plume rose 1.3 km above the summit and drifted SSW, according to a webcam image (figure 100). Gas-and-steam and possibly ash emissions continued on 23 February and volcanic earthquakes were recorded by the seismic network.
During April, volcanic earthquakes and gas-and-steam and ash emissions were reported from the cone in Lake Voui. VMGD reported that activity increased during 5-7 April; high gas-and-steam and ash plumes were visible, accompanied by nighttime incandescence. According to a Wellington VAAC report, a low-level ash plume rose as high as 2.5 km above the summit and drifted W and SW on 5 April, based on satellite imagery. Reports in Saratamata stated that a dark ash plume drifted to the WSW, but no loud explosion was heard. Webcam images from 2100 showed incandescence above the crater and reflected in the clouds. According to an aerial survey, field observations, and satellite data, water was no longer present in the lake. A lava flow was reported effusing from the vent and traveling N into the dry Lake Voui, which lasted three days. The next morning at 0745 on 6 April a gas-and-steam and ash plume rose 5.4 km above the summit and drifted ESE, based on information from VMGD (figure 101). The Wellington VAAC also reported that light ashfall was observed on the island. Intermittent gas-and-steam and ash emissions were visible on 7 April, some of which rose to an estimated 3 km above the summit and drifted E. Webcam images during 0107-0730 on 7 April showed continuing ash emissions. A gas-and-steam and ash plume rose 695 m above the summit crater at 0730 on 19 April and drifted ESE, based on a webcam image (figure 102).
According to visual and infrared satellite data, water was visible in Lake Voui as late as 24 March 2023 (figure 103). The vent in the caldera showed a gas-and-steam plume drifted SE. On 3 April thermal activity was first detected, accompanied by a gas-and-ash plume that drifted W (figure 103). The lava flow moved N within the dry lake and was shown cooling by 8 April. By 23 April much of the water in the lake had returned. Occasional sulfur dioxide plumes were detected by the TROPOMI instrument on the Sentinel-5P satellite that exceeded 2 Dobson Units (DU) and drifted in different directions (figure 104).
Geologic Background. The island of Ambae, also known as Aoba, is a massive 2,500 km3 basaltic shield that is the most voluminous volcano of the New Hebrides archipelago. A pronounced NE-SW-trending rift zone with numerous scoria cones gives the 16 x 38 km island an elongated form. A broad pyroclastic cone containing three crater lakes (Manaro Ngoru, Voui, and Manaro Lakua) is located at the summit within the youngest of at least two nested calderas, the largest of which is 6 km in diameter. That large central edifice is also called Manaro Voui or Lombenben volcano. Post-caldera explosive eruptions formed the summit craters about 360 years ago. A tuff cone was constructed within Lake Voui (or Vui) about 60 years later. The latest known flank eruption, about 300 years ago, destroyed the population of the Nduindui area near the western coast.
Information Contacts: Geo-Hazards Division, Vanuatu Meteorology and Geo-Hazards Department (VMGD), Ministry of Climate Change Adaptation, Meteorology, Geo-Hazards, Energy, Environment and Disaster Management, Private Mail Bag 9054, Lini Highway, Port Vila, Vanuatu (URL: http://www.vmgd.gov.vu/, https://www.facebook.com/VanuatuGeohazardsObservatory/); Wellington Volcanic Ash Advisory Centre (VAAC), Meteorological Service of New Zealand Ltd (MetService), PO Box 722, Wellington, New Zealand (URL: http://www.metservice.com/vaac/, http://www.ssd.noaa.gov/VAAC/OTH/NZ/messages.html); MIROVA (Middle InfraRed Observation of Volcanic Activity), a collaborative project between the Universities of Turin and Florence (Italy) supported by the Centre for Volcanic Risk of the Italian Civil Protection Department (URL: http://www.mirovaweb.it/); Global Sulfur Dioxide Monitoring Page, Atmospheric Chemistry and Dynamics Laboratory, NASA Goddard Space Flight Center (NASA/GSFC), 8800 Greenbelt Road, Goddard, Maryland, USA (URL: https://so2.gsfc.nasa.gov/); Copernicus Browser, Copernicus Data Space Ecosystem, European Space Agency (URL: https://dataspace.copernicus.eu/browser/).
Ibu
Indonesia
1.488°N, 127.63°E; summit elev. 1325 m
All times are local (unless otherwise noted)
Daily ash explosions continue, along with thermal anomalies in the crater, October 2022-May 2023
Persistent eruptive activity since April 2008 at Ibu, a stratovolcano on Indonesian’s Halmahera Island, has consisted of daily explosive ash emissions and plumes, along with observations of thermal anomalies (BGVN 47:04). The current eruption continued during October 2022-May 2023, described below, based on advisories issued by the Pusat Vulkanologi dan Mitigasi Bencana Geologi (PVMBG, also known as Indonesian Center for Volcanology and Geological Hazard Mitigation, CVGHM), daily reports by MAGMA Indonesia (a PVMBG platform), and the Darwin Volcanic Ash Advisory Centre (VAAC), and various satellite data. The Alert Level during the reporting period remained at 2 (on a scale of 1-4), except raised briefly to 3 on 27 May, and the public was warned to stay at least 2 km away from the active crater and 3.5 km away on the N side of the volcano.
According to MAGMA Indonesia, during October 2022-May 2023, daily gray-and-white ash plumes of variable densities rose 200-1,000 m above the summit and drifted in multiple directions. On 30 October and 11 November, plumes rose a maximum of 2 km and 1.5 km above the summit, respectively (figures 42 and 43). According to the Darwin VAAC, discrete ash emissions on 13 November rose to 2.1 km altitude, or 800 m above the summit, and drifted W, and multiple ash emissions on 15 November rose 1.4 km above the summit and drifted NE. Occasional larger ash explosions through May 2023 prompted PVMBG to issue Volcano Observatory Notice for Aviation (VONA) alerts (table 6); the Aviation Color Code remained at Orange throughout this period.
Table 6. Volcano Observatory Notice for Aviation (VONA) ash plume alerts for Ibu issued by PVMBG during October 2022-May 2023. Maximum height above the summit was estimated by a ground observer. VONAs in January-May 2023 all described the ash plumes as dense.
| Date |
Time (local) |
Max height above summit |
Direction |
| 17 Oct 2022 |
0858 |
800 m |
SW |
| 18 Oct 2022 |
1425 |
800 m |
S |
| 19 Oct 2022 |
2017 |
600 m |
SW |
| 21 Oct 2022 |
0916 |
800 m |
NW |
| 16 Jan 2023 |
1959 |
600 m |
NE |
| 22 Jan 2023 |
0942 |
1,000 m |
E |
| 29 Jan 2023 |
2138 |
1,000 m |
E |
| 10 May 2023 |
0940 |
800 m |
NW |
| 10 May 2023 |
2035 |
600 m |
E |
| 21 May 2023 |
2021 |
600 m |
W |
| 21 May 2023 |
2140 |
1,000 m |
W |
| 29 May 2023 |
1342 |
800 m |
N |
| 31 May 2023 |
1011 |
1,000 m |
SW |
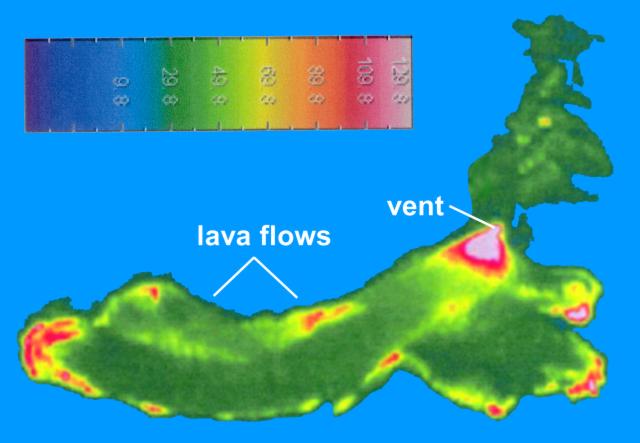
Sentinel-2 L1C satellite images throughout the reporting period show two, sometimes three persistent thermal anomalies in the summit crater, with the most prominent hotspot from the top of a cone within the crater. Clear views were more common during March-April 2023, when a vent and lava flows on the NE flank of the intra-crater cone could be distinguished (figure 44). White-to-grayish emissions were also observed during brief periods when weather clouds allowed clear views.
The MIROVA space-based volcano hotspot detection system recorded almost daily thermal anomalies throughout the reporting period, though cloud cover often interfered with detections. Data from imaging spectroradiometers aboard NASA’s Aqua and Terra satellites and processed using the MODVOLC algorithm (MODIS-MODVOLC) recorded hotspots on one day during October 2022 and December 2022, two days in April 2023, three days in November 2022 and May 2023, and four days in March 2023.
Geologic Background. The truncated summit of Gunung Ibu stratovolcano along the NW coast of Halmahera Island has large nested summit craters. The inner crater, 1 km wide and 400 m deep, has contained several small crater lakes. The 1.2-km-wide outer crater is breached on the N, creating a steep-walled valley. A large cone grew ENE of the summit, and a smaller one to the WSW has fed a lava flow down the W flank. A group of maars is located below the N and W flanks. The first observed and recorded eruption was a small explosion from the summit crater in 1911. Eruptive activity began again in December 1998, producing a lava dome that eventually covered much of the floor of the inner summit crater along with ongoing explosive ash emissions.
Information Contacts: Pusat Vulkanologi dan Mitigasi Bencana Geologi (PVMBG, also known as Indonesian Center for Volcanology and Geological Hazard Mitigation, CVGHM), Jalan Diponegoro 57, Bandung 40122, Indonesia (URL: http://www.vsi.esdm.go.id/); MAGMA Indonesia (Multiplatform Application for Geohazard Mitigation and Assessment in Indonesia), Kementerian Energi dan Sumber Daya Mineral (URL: https://magma.esdm.go.id/v1); Copernicus Browser, Copernicus Data Space Ecosystem, European Space Agency (URL: https://dataspace.copernicus.eu/browser/); MIROVA (Middle InfraRed Observation of Volcanic Activity), a collaborative project between the Universities of Turin and Florence (Italy) supported by the Centre for Volcanic Risk of the Italian Civil Protection Department (URL: http://www.mirovaweb.it/); Hawai'i Institute of Geophysics and Planetology (HIGP) - MODVOLC Thermal Alerts System, School of Ocean and Earth Science and Technology (SOEST), Univ. of Hawai'i, 2525 Correa Road, Honolulu, HI 96822, USA (URL: http://modis.higp.hawaii.edu/).
Dukono
Indonesia
1.6992°N, 127.8783°E; summit elev. 1273 m
All times are local (unless otherwise noted)
Continuing ash emissions, SO2 plumes, and thermal signals during October 2022-May 2023
Dukono, a remote volcano on Indonesia’s Halmahera Island, has been erupting continuously since 1933, with frequent ash explosions and sulfur dioxide plumes (BGVN 46:11, 47:10). This activity continued during October 2022 through May 2023, based on reports from the Pusat Vulkanologi dan Mitigasi Bencana Geologi (PVMBG; also known as Indonesian Center for Volcanology and Geological Hazard Mitigation, CVGHM), the Darwin Volcanic Ash Advisory Centre (VAAC), and satellite data. During this period, the Alert Level remained at 2 (on a scale of 1-4) and the public was warned to remain outside of the 2-km exclusion zone. The highest reported plume of the period reached 9.4 km above the summit on 14 November 2022.
According to MAGMA Indonesia (a platform developed by PVMBG), white, gray, or dark plumes of variable densities were observed almost every day during the reporting period, except when fog obscured the volcano (figure 33). Plumes generally rose 25-450 m above the summit, but rose as high as 700-800 m on several days, somewhat lower than the maximum heights reached earlier in 2022 when plumes reached as high as 1 km. However, the Darwin VAAC reported that on 14 November 2022, a discrete ash plume rose 9.4 km above the summit (10.7 km altitude), accompanied by a strong hotspot and a sulfur dioxide signal observed in satellite imagery; a continuous ash plume that day and through the 15th rose to 2.1-2.4 km altitude and drifted NE.
Sentinel-2 images were obscured by weather clouds almost every viewing day during the reporting period. However, the few reasonably clear images showed a hotspot and white or gray emissions and plumes. Strong SO2 plumes from Dukono were present on many days during October 2022-May 2023, as detected using the TROPOMI instrument on the Sentinel-5P satellite (figure 34).
Geologic Background. Reports from this remote volcano in northernmost Halmahera are rare, but Dukono has been one of Indonesia's most active volcanoes. More-or-less continuous explosive eruptions, sometimes accompanied by lava flows, have occurred since 1933. During a major eruption in 1550 CE, a lava flow filled in the strait between Halmahera and the N-flank Gunung Mamuya cone. This complex volcano presents a broad, low profile with multiple summit peaks and overlapping craters. Malupang Wariang, 1 km SW of the summit crater complex, contains a 700 x 570 m crater that has also been active during historical time.
Information Contacts: Pusat Vulkanologi dan Mitigasi Bencana Geologi (PVMBG, also known as Indonesian Center for Volcanology and Geological Hazard Mitigation, CVGHM), Jalan Diponegoro 57, Bandung 40122, Indonesia (URL: http://www.vsi.esdm.go.id/); MAGMA Indonesia (Multiplatform Application for Geohazard Mitigation and Assessment in Indonesia), Kementerian Energi dan Sumber Daya Mineral (URL: https://magma.esdm.go.id/v1); Darwin Volcanic Ash Advisory Centre (VAAC), Bureau of Meteorology, Northern Territory Regional Office, PO Box 40050, Casuarina, NT 0811, Australia (URL: http://www.bom.gov.au/info/vaac/); NASA Global Sulfur Dioxide Monitoring Page, Atmospheric Chemistry and Dynamics Laboratory, NASA Goddard Space Flight Center (NASA/GSFC), 8800 Greenbelt Road, Goddard, Maryland, USA (URL: https://so2.gsfc.nasa.gov/); Sentinel Hub Playground (URL: https://www.sentinel-hub.com/explore/sentinel-playground).
Sabancaya
Peru
15.787°S, 71.857°W; summit elev. 5960 m
All times are local (unless otherwise noted)
Explosions, gas-and-ash plumes, and thermal activity persist during November 2022-April 2023
Sabancaya is located in Peru, NE of Ampato and SE of Hualca Hualca. Eruptions date back to 1750 and have been characterized by explosions, phreatic activity, ash plumes, and ashfall. The current eruption period began in November 2016 and has more recently consisted of daily explosions, gas-and-ash plumes, and thermal activity (BGVN 47:11). This report updates activity during November 2022 through April 2023 using information from Instituto Geophysico del Peru (IGP) that use weekly activity reports and various satellite data.
Intermittent low-to-moderate power thermal anomalies were reported by the MIROVA project during November 2022 through April 2023 (figure 119). There were few short gaps in thermal activity during mid-December 2022, late December-to-early January 2023, late January to mid-February, and late February. According to data recorded by the MODVOLC thermal algorithm, there were a total of eight thermal hotspots: three in November 2022, three in February 2023, one in March, and one in April. On clear weather days, some of this thermal anomaly was visible in infrared satellite imagery showing the active lava dome in the summit crater (figure 120). Almost daily moderate-to-strong sulfur dioxide plumes were recorded during the reporting period by the TROPOMI instrument on the Sentinel-5P satellite (figure 121). Many of these plumes exceeded 2 Dobson Units (DU) and drifted in multiple directions.
IGP reported that moderate activity during November and December 2022 continued; during November, an average number of explosions were reported each week: 30, 33, 36, and 35, and during December, it was 32, 40, 47, 52, and 67. Gas-and-ash plumes in November rose 3-3.5 km above the summit and drifted E, NE, SE, S, N, W, and SW. During December the gas-and-ash plumes rose 2-4 km above the summit and drifted in different directions. There were 1,259 volcanic earthquakes recorded during November and 1,693 during December. Seismicity also included volcano-tectonic-type events that indicate rock fracturing events. Slight inflation was observed in the N part of the volcano near Hualca Hualca (4 km N). Thermal activity was frequently reported in the crater at the active lava dome (figure 120).
Explosive activity continued during January and February 2023. The average number of explosions were reported each week during January (51, 50, 60, and 59) and February (43, 54, 51, and 50). Gas-and-ash plumes rose 1.6-2.9 km above the summit and drifted NW, SW, and W during January and rose 1.4-2.8 above the summit and drifted W, SW, E, SE, N, S, NW, and NE during February. IGP also detected 1,881 volcanic earthquakes during January and 1,661 during February. VT-type earthquakes were also reported. Minor inflation persisted near Hualca Hualca. Satellite imagery showed continuous thermal activity in the crater at the lava dome (figure 120).
During March, the average number of explosions each week was 46, 48, 31, 35, and 22 and during April, it was 29, 41, 31, and 27. Accompanying gas-and-ash plumes rose 1.7-2.6 km above the summit crater and drifted W, SW, NW, S, and SE during March. According to a Buenos Aires Volcano Ash Advisory Center (VAAC) notice, on 22 March at 1800 through 23 March an ash plume rose to 7 km altitude and drifted NW. By 0430 an ash plume rose to 7.6 km altitude and drifted W. On 24 and 26 March continuous ash emissions rose to 7.3 km altitude and drifted SW and on 28 March ash emissions rose to 7.6 km altitude. During April, gas-and-ash plumes rose 1.6-2.5 km above the summit and drifted W, SW, S, NW, NE, and E. Frequent volcanic earthquakes were recorded, with 1,828 in March and 1,077 in April, in addition to VT-type events. Thermal activity continued to be reported in the summit crater at the lava dome (figure 120).
Geologic Background. Sabancaya, located in the saddle NE of Ampato and SE of Hualca Hualca volcanoes, is the youngest of these volcanic centers and the only one to have erupted in historical time. The oldest of the three, Nevado Hualca Hualca, is of probable late-Pliocene to early Pleistocene age. The name Sabancaya (meaning "tongue of fire" in the Quechua language) first appeared in records in 1595 CE, suggesting activity prior to that date. Holocene activity has consisted of Plinian eruptions followed by emission of voluminous andesitic and dacitic lava flows, which form an extensive apron around the volcano on all sides but the south. Records of historical eruptions date back to 1750.
Information Contacts: Instituto Geofisico del Peru (IGP), Centro Vulcanológico Nacional (CENVUL), Calle Badajoz N° 169 Urb. Mayorazgo IV Etapa, Ate, Lima 15012, Perú (URL: https://www.igp.gob.pe/servicios/centro-vulcanologico-nacional/inicio); Buenos Aires Volcanic Ash Advisory Center (VAAC), Servicio Meteorológico Nacional-Fuerza Aérea Argentina, 25 de mayo 658, Buenos Aires, Argentina (URL: http://www.smn.gov.ar/vaac/buenosaires/inicio.php); MIROVA (Middle InfraRed Observation of Volcanic Activity), a collaborative project between the Universities of Turin and Florence (Italy) supported by the Centre for Volcanic Risk of the Italian Civil Protection Department (URL: http://www.mirovaweb.it/); Hawai'i Institute of Geophysics and Planetology (HIGP) - MODVOLC Thermal Alerts System, School of Ocean and Earth Science and Technology (SOEST), Univ. of Hawai'i, 2525 Correa Road, Honolulu, HI 96822, USA (URL: http://modis.higp.hawaii.edu/); NASA Global Sulfur Dioxide Monitoring Page, Atmospheric Chemistry and Dynamics Laboratory, NASA Goddard Space Flight Center (NASA/GSFC), 8800 Greenbelt Road, Goddard MD 20771, USA (URL: https://so2.gsfc.nasa.gov/); Copernicus Browser, Copernicus Data Space Ecosystem, European Space Agency (URL: https://dataspace.copernicus.eu/browser/).
Sheveluch
Russia
56.653°N, 161.36°E; summit elev. 3283 m
All times are local (unless otherwise noted)
Significant explosions destroyed part of the lava-dome complex during April 2023
Sheveluch (also spelled Shiveluch) in Kamchatka, has had at least 60 large eruptions during the last 10,000 years. The summit is truncated by a broad 9-km-wide caldera that is breached to the S, and many lava domes occur on the outer flanks. The lava dome complex was constructed within the large open caldera. Frequent collapses of the dome complex have produced debris avalanches; the resulting deposits cover much of the caldera floor. A major south-flank collapse during a 1964 Plinian explosion produced a scarp in which a “Young Sheveluch” dome began to form in 1980. Repeated episodes of dome formation and destruction since then have produced major and minor ash plumes, pyroclastic flows, block-and-ash flows, and “whaleback domes” of spine-like extrusions in 1993 and 2020 (BGVN 45:11). The current eruption period began in August 1999 and has more recently consisted of lava dome growth, explosions, ash plumes, and avalanches (BGVN 48:01). This report covers a significant explosive eruption during early-to-mid-April 2023 that generated a 20 km altitude ash plume, produced a strong sulfur dioxide plume, and destroyed part of the lava-dome complex; activity described during January through April 2023 use information primarily from the Kamchatka Volcanic Eruptions Response Team (KVERT) and various satellite data.
Satellite data. Activity during the majority of this reporting period was characterized by continued lava dome growth, strong fumarole activity, explosions, and hot avalanches. According to the MODVOLC Thermal Alerts System, 140 hotspots were detected through the reporting period, with 33 recorded in January 2023, 29 in February, 44 in March, and 34 in April. Frequent strong thermal activity was recorded during January 2023 through April, according to the MIROVA (Middle InfraRed Observation of Volcanic Activity) graph and resulted from the continuously growing lava dome (figure 94). A slightly stronger pulse in thermal activity was detected in early-to-mid-April, which represented the significant eruption that destroyed part of the lava-dome complex. Thermal anomalies were also visible in infrared satellite imagery at the summit crater (figure 95).
During January 2023 KVERT reported continued growth of the lava dome, accompanied by strong fumarolic activity, incandescence from the lava dome, explosions, ash plumes, and avalanches. Satellite data showed a daily thermal anomaly over the volcano. Video data showed ash plumes associated with collapses at the dome that generated avalanches that in turn produced ash plumes rising to 3.5 km altitude and drifting 40 km W on 4 January and rising to 7-7.5 km altitude and drifting 15 km SW on 5 January. A gas-and-steam plume containing some ash that was associated with avalanches rose to 5-6 km altitude and extended 52-92 km W on 7 January. Explosions that same day produced ash plumes that rose to 7-7.5 km altitude and drifted 10 km W. According to a Volcano Observatory Notice for Aviation (VONA) issued at 1344 on 19 January, explosions produced an ash cloud that was 15 x 25 km in size and rose to 9.6-10 km altitude, drifting 21-25 km W; as a result, the Aviation Color Code (ACC) was raised to Red (the highest level on a four-color scale). Another VONA issued at 1635 reported that no more ash plumes were observed, and the ACC was lowered to Orange (the second highest level on a four-color scale). On 22 January an ash plume from collapses and avalanches rose to 5 km altitude and drifted 25 km NE and SW; ash plumes associated with collapses extended 70 km NE on 27 and 31 January.
Lava dome growth, fumarolic activity, dome incandescence, and occasional explosions and avalanches continued during February and March. A daily thermal anomaly was visible in satellite data. Explosions on 1 February generated ash plumes that rose to 6.3-6.5 km altitude and extended 15 km NE. Video data showed an ash cloud from avalanches rising to 5.5 km altitude and drifting 5 km SE on 2 February. Satellite data showed gas-and-steam plumes containing some ash rose to 5-5.5 km altitude and drifted 68-110 km ENE and NE on 6 February, to 4.5-5 km altitude and drifted 35 km WNW on 22 February, and to 3.7-4 km altitude and drifted 47 km NE on 28 February. Scientists from the Kamchatka Volcanological Station (KVS) went on a field excursion on 25 February to document the growing lava dome, and although it was cloudy most of the day, nighttime incandescence was visible. Satellite data showed an ash plume extending up to 118 km E during 4-5 March. Video data from 1150 showed an ash cloud from avalanches rose to 3.7-5.5 km altitude and drifted 5-10 km ENE and E on 5 March. On 11 March an ash plume drifted 62 km E. On 27 March ash plumes rose to 3.5 km altitude and drifted 100 km E. Avalanches and constant incandescence at the lava dome was focused on the E and NE slopes on 28 March. A gas-and-steam plume containing some ash rose to 3.5 km altitude and moved 40 km E on 29 March. Ash plumes on 30 March rose to 3.5-3.7 km altitude and drifted 70 km NE.
Similar activity continued during April, with lava dome growth, strong fumarolic activity, incandescence in the dome, occasional explosions, and avalanches. A thermal anomaly persisted throughout the month. During 1-4 April weak ash plumes rose to 2.5-3 km altitude and extended 13-65 km SE and E.
Activity during 11 April 2023. The Institute of Volcanology and Seismology, Far Eastern Branch, Russian Academy of Sciences (IVS FEB RAS) reported a significant increase in seismicity around 0054 on 11 April, as reported by strong explosions detected on 11 April beginning at 0110 that sent ash plumes up to 7-10 km altitude and extended 100-435 km W, WNW, NNW, WSW, and SW. According to a Tokyo VAAC report the ash plume rose to 15.8 km altitude. By 0158 the plume extended over a 75 x 100 km area. According to an IVS FEB RAS report, the eruptive column was not vertical: the initial plume at 0120 on 11 April deviated to the NNE, at 0000 on 12 April, it drifted NW, and by 1900 it drifted SW. KVS reported that significant pulses of activity occurred at around 0200, 0320, and then a stronger phase around 0600. Levin Dmitry took a video from near Békés (3 km away) at around 0600 showing a rising plume; he also reported that a pyroclastic flow traveled across the road behind him as he left the area. According to IVS FEB RAS, the pyroclastic flow traveled several kilometers SSE, stopping a few hundred meters from a bridge on the road between Klyuchi and Petropavlovsk-Kamchatsky.
Ashfall was first observed in Klyuchi (45 km SW) at 0630, and a large, black ash plume blocked light by 0700. At 0729 KVERT issued a Volcano Observatory Notice for Aviation (VONA) raising the Aviation Color Code to Red (the highest level on a four-color scale). It also stated that a large ash plume had risen to 10 km altitude and drifted 100 km W. Near-constant lightning strikes were reported in the plume and sounds like thunderclaps were heard until about 1000. According to IVS FEB RAS the cloud was 200 km long and 76 km wide by 0830, and was spreading W at altitudes of 6-12 km. In the Klyuchi Village, the layer of both ash and snow reached 8.5 cm (figure 96); ashfall was also reported in Kozyrevsk (112 km SW) at 0930, Mayskoye, Anavgay, Atlasovo, Lazo, and Esso. Residents in Klyuchi reported continued darkness and ashfall at 1100. In some areas, ashfall was 6 cm deep and some residents reported dirty water coming from their plumbing. According to IVS FEB RAS, an ash cloud at 1150 rose to 5-20 km altitude and was 400 km long and 250 km wide, extending W. A VONA issued at 1155 reported that ash had risen to 10 km and drifted 340 km NNW and 240 km WSW. According to Simon Carn (Michigan Technological University), about 0.2 Tg of sulfur dioxide in the plume was measured in a satellite image from the TROPOMI instrument on the Sentinel-5P satellite acquired at 1343 that covered an area of about 189,000 km2 (figure 97). Satellite data at 1748 showed an ash plume that rose to 8 km altitude and drifted 430 km WSW and S, according to a VONA.
Activity during 12-15 April 2023. On 12 April at 0730 satellite images showed ash plumes rose to 7-8 km altitude and extended 600 km SW, 1,050 km ESE, and 1,300-3,000 km E. By 1710 that day, the explosions weakened. According to news sources, the ash-and-gas plumes drifted E toward the Aleutian Islands and reached the Gulf of Alaska by 13 April, causing flight disruptions. More than 100 flights involving Alaska airspace were cancelled due to the plume. Satellite data showed ash plumes rising to 4-5.5 km altitude and drifted 400-415 km SE and ESE on 13 April. KVS volcanologists observed the pyroclastic flow deposits and noted that steam rose from downed, smoldering trees. They also noted that the deposits were thin with very few large fragments, which differed from previous flows. The ash clouds traveled across the Pacific Ocean. Flight cancellations were also reported in NW Canada (British Columbia) during 13-14 April. During 14-15 April ash plumes rose to 6 km altitude and drifted 700 km NW.
Alaskan flight schedules were mostly back to normal by 15 April, with only minor delays and far less cancellations; a few cancellations continued to be reported in Canada. Clear weather on 15 April showed that most of the previous lava-dome complex was gone and a new crater roughly 1 km in diameter was observed (figure 98); gas-and-steam emissions were rising from this crater. Evidence suggested that there had been a directed blast to the SE, and pyroclastic flows traveled more than 20 km. An ash plume rose to 4.5-5.2 km altitude and drifted 93-870 km NW on 15 April.
Activity during 16-30 April 2023. Resuspended ash was lifted by the wind from the slopes and rose to 4 km altitude and drifted 224 km NW on 17 April. KVERT reported a plume of resuspended ash from the activity during 10-13 April on 19 April that rose to 3.5-4 km altitude and drifted 146-204 km WNW. During 21-22 April a plume stretched over the Scandinavian Peninsula. A gas-and-steam plume containing some ash rose to 3-3.5 km altitude and drifted 60 km SE on 30 April. A possible new lava dome was visible on the W slope of the volcano on 29-30 April (figure 99); satellite data showed two thermal anomalies, a bright one over the existing lava dome and a weaker one over the possible new one.
References. Girina, O., Loupian, E., Horvath, A., Melnikov, D., Manevich, A., Nuzhdaev, A., Bril, A., Ozerov, A., Kramareva, L., Sorokin, A., 2023, Analysis of the development of the paroxysmal eruption of Sheveluch volcano on April 10–13, 2023, based on data from various satellite systems, ??????????? ???????? ??? ?? ???????, 20(2).
Geologic Background. The high, isolated massif of Sheveluch volcano (also spelled Shiveluch) rises above the lowlands NNE of the Kliuchevskaya volcano group. The 1,300 km3 andesitic volcano is one of Kamchatka's largest and most active volcanic structures, with at least 60 large eruptions during the Holocene. The summit of roughly 65,000-year-old Stary Shiveluch is truncated by a broad 9-km-wide late-Pleistocene caldera breached to the south. Many lava domes occur on its outer flanks. The Molodoy Shiveluch lava dome complex was constructed during the Holocene within the large open caldera; Holocene lava dome extrusion also took place on the flanks of Stary Shiveluch. Widespread tephra layers from these eruptions have provided valuable time markers for dating volcanic events in Kamchatka. Frequent collapses of dome complexes, most recently in 1964, have produced debris avalanches whose deposits cover much of the floor of the breached caldera.
Information Contacts: Kamchatka Volcanic Eruptions Response Team (KVERT), Far Eastern Branch, Russian Academy of Sciences, 9 Piip Blvd., Petropavlovsk-Kamchatsky, 683006, Russia (URL: http://www.kscnet.ru/ivs/kvert/); Institute of Volcanology and Seismology, Far Eastern Branch, Russian Academy of Sciences (IVS FEB RAS), 9 Piip Blvd., Petropavlovsk-Kamchatsky 683006, Russia (URL: http://www.kscnet.ru/ivs/eng/); Kamchatka Volcanological Station, Kamchatka Branch of Geophysical Survey, (KB GS RAS), Klyuchi, Kamchatka Krai, Russia (URL: http://volkstat.ru/); Hawai'i Institute of Geophysics and Planetology (HIGP) - MODVOLC Thermal Alerts System, School of Ocean and Earth Science and Technology (SOEST), Univ. of Hawai'i, 2525 Correa Road, Honolulu, HI 96822, USA (URL: http://modis.higp.hawaii.edu/); MIROVA (Middle InfraRed Observation of Volcanic Activity), a collaborative project between the Universities of Turin and Florence (Italy) supported by the Centre for Volcanic Risk of the Italian Civil Protection Department (URL: http://www.mirovaweb.it/); Copernicus Browser, Copernicus Data Space Ecosystem, European Space Agency (URL: https://dataspace.copernicus.eu/browser/); Kam 24 News Agency, 683032, Kamchatka Territory, Petropavlovsk-Kamchatsky, Vysotnaya St., 2A (URL: https://kam24.ru/news/main/20230411/96657.html#.Cj5Jrky6.dpuf); Simon Carn, Geological and Mining Engineering and Sciences, Michigan Technological University, 1400 Townsend Drive, Houghton, MI 49931, USA (URL: http://www.volcarno.com/, Twitter: @simoncarn).
Bezymianny
Russia
55.972°N, 160.595°E; summit elev. 2882 m
All times are local (unless otherwise noted)
Explosions, ash plumes, lava flows, and avalanches during November 2022-April 2023
Bezymianny is located on the Kamchatka Peninsula of Russia as part of the Klyuchevskoy volcano group. Historic eruptions began in 1955 and have been characterized by dome growth, explosions, pyroclastic flows, ash plumes, and ashfall. During the 1955-56 eruption a large open crater was formed by collapse of the summit and an associated lateral blast. Subsequent episodic but ongoing lava-dome growth, accompanied by intermittent explosive activity and pyroclastic flows, has largely filled the 1956 crater. The current eruption period began in December 2016 and more recent activity has consisted of strong explosions, ash plumes, and thermal activity (BGVN 47:11). This report covers activity during November 2022 through April 2023, based on weekly and daily reports from the Kamchatka Volcano Eruptions Response Team (KVERT) and satellite data.
Activity during November and March 2023 was relatively low and mostly consisted of gas-and-steam emissions, occasional small collapses that generated avalanches along the lava dome slopes, and a persistent thermal anomaly over the volcano that was observed in satellite data on clear weather days. According to the Tokyo VAAC and KVERT, an explosion produced an ash plume that rose to 6 km altitude and drifted 25 km NE at 1825 on 29 March.
Gas-and-steam emissions, collapses generating avalanches, and thermal activity continued during April. According to two Volcano Observatory Notice for Aviation (VONA) issued on 2 and 6 April (local time) ash plumes rose to 3 km and 3.5-3.8 km altitude and drifted 35 km E and 140 km E, respectively. Satellite data from KVERT showed weak ash plumes extending up to 550 km E on 2 and 5-6 April.
A VONA issued at 0843 on 7 April described an ash plume that rose to 4.5-5 km altitude and drifted 250 km ESE. Later that day at 1326 satellite data showed an ash plume that rose to 5.5-6 km altitude and drifted 150 km ESE. A satellite image from 1600 showed an ash plume extending as far as 230 km ESE; KVERT noted that ash emissions were intensifying, likely due to avalanches from the growing lava dome. The Aviation Color Code (ACC) was raised to Red (the highest level on a four-color scale). At 1520 satellite data showed an ash plume rising to 5-5.5 km altitude and drifting 230 km ESE. That same day, Kamchatka Volcanological Station (KVS) volcanologists traveled to Ambon to collect ash; they reported that a notable eruption began at 1730, and within 20 minutes a large ash plume rose to 10 km altitude and drifted NW. KVERT reported that the strong explosive phase began at 1738. Video and satellite data taken at 1738 showed an ash plume that rose to 10-12 km altitude and drifted up to 2,800 km SE and E. Explosions were clearly audible 20 km away for 90 minutes, according to KVS. Significant amounts of ash fell at the Apakhonchich station, which turned the snow gray; ash continued to fall until the morning of 8 April. In a VONA issued at 0906 on 8 April, KVERT stated that the explosive eruption had ended; ash plumes had drifted 2,000 km E. The ACC was lowered to Orange (the third highest level on a four-color scale). The KVS team saw a lava flow on the active dome once the conditions were clear that same day (figure 53). On 20 April lava dome extrusion was reported; lava flows were noted on the flanks of the dome, and according to KVERT satellite data, a thermal anomaly was observed in the area. The ACC was lowered to Yellow (the second lowest on a four-color scale).
Satellite data showed an increase in thermal activity beginning in early April 2023. A total of 31 thermal hotspots were detected by the MODVOLC thermal algorithm on 4, 5, 7, and 12 April 2023. The elevated thermal activity resulted from an increase in explosive activity and the start of an active lava flow. The MIROVA (Middle InfraRed Observation of Volcanic Activity) volcano hotspot detection system based on the analysis of MODIS data also showed a pulse in thermal activity during the same time (figure 54). Infrared satellite imagery captured a continuous thermal anomaly at the summit crater, often accompanied by white gas-and-steam emissions (figure 55). On 4 April 2023 an active lava flow was observed descending the SE flank.
Geologic Background. The modern Bezymianny, much smaller than its massive neighbors Kamen and Kliuchevskoi on the Kamchatka Peninsula, was formed about 4,700 years ago over a late-Pleistocene lava-dome complex and an edifice built about 11,000-7,000 years ago. Three periods of intensified activity have occurred during the past 3,000 years. The latest period, which was preceded by a 1,000-year quiescence, began with the dramatic 1955-56 eruption. This eruption, similar to that of St. Helens in 1980, produced a large open crater that was formed by collapse of the summit and an associated lateral blast. Subsequent episodic but ongoing lava-dome growth, accompanied by intermittent explosive activity and pyroclastic flows, has largely filled the 1956 crater.
Information Contacts: Kamchatka Volcanic Eruptions Response Team (KVERT), Far Eastern Branch, Russian Academy of Sciences, 9 Piip Blvd., Petropavlovsk-Kamchatsky, 683006, Russia (URL: http://www.kscnet.ru/ivs/kvert/); Kamchatka Volcanological Station, Kamchatka Branch of Geophysical Survey, (KB GS RAS), Klyuchi, Kamchatka Krai, Russia (URL: http://volkstat.ru/); Hawai'i Institute of Geophysics and Planetology (HIGP) - MODVOLC Thermal Alerts System, School of Ocean and Earth Science and Technology (SOEST), Univ. of Hawai'i, 2525 Correa Road, Honolulu, HI 96822, USA (URL: http://modis.higp.hawaii.edu/); MIROVA (Middle InfraRed Observation of Volcanic Activity), a collaborative project between the Universities of Turin and Florence (Italy) supported by the Centre for Volcanic Risk of the Italian Civil Protection Department (URL: http://www.mirovaweb.it/); Copernicus Browser, Copernicus Data Space Ecosystem, European Space Agency (URL: https://dataspace.copernicus.eu/browser/).
Chikurachki
Russia
50.324°N, 155.461°E; summit elev. 1781 m
All times are local (unless otherwise noted)
New explosive eruption during late January-early February 2023
Chikurachki, located on Paramushir Island in the northern Kuriles, has had Plinian eruptions during the Holocene. Lava flows have reached the sea and formed capes on the NW coast; several young lava flows are also present on the E flank beneath a scoria deposit. Reported eruptions date back to 1690, with the most recent eruption period occurring during January through October 2022, characterized by occasional explosions, ash plumes, and thermal activity (BGVN 47:11). This report covers a new eruptive period during January through February 2023 that consisted of ash explosions and ash plumes, based on information from the Kamchatka Volcanic Eruptions Response Team (KVERT) and satellite data.
According to reports from KVERT, an explosive eruption began around 0630 on 29 January. Explosions generated ash plumes that rose to 3-3.5 km altitude and drifted 6-75 km SE and E, based on satellite data. As a result, the Aviation Color Code (ACC) was raised to Orange (the second highest level on a four-color scale). At 1406 and 1720 ash plumes were identified in satellite images that rose to 4.3 km altitude and extended 70 km E. By 2320 the ash plume had dissipated. A thermal anomaly was visible at the volcano on 31 January, according to a satellite image, and an ash plume was observed drifting 66 km NE.
Occasional explosions and ash plumes continued during early February. At 0850 on 1 February an ash plume rose to 3.5 km altitude and drifted 35 km NE. Satellite data showed an ash plume that rose to 3.2-3.5 km altitude and drifted 50 km NE at 1222 later that day (figure 22). A thermal anomaly was detected over the volcano during 5-6 February and ash plumes drifted as far as 125 km SE, E, and NE. Explosive events were reported at 0330 on 6 February that produced ash plumes rising to 4-4.5 km altitude and drifting 72-90 km N, NE, and ENE. KVERT noted that the last gas-and steam plume that contained some ash was observed on 8 February and drifted 55 km NE before the explosive eruption ended. The ACC was lowered to Yellow and then Green (the lowest level on a four-color scale) on 18 February.
Geologic Background. Chikurachki, the highest volcano on Paramushir Island in the northern Kuriles, is a relatively small cone constructed on a high Pleistocene edifice. Oxidized basaltic-to-andesitic scoria deposits covering the upper part of the young cone give it a distinctive red color. Frequent basaltic Plinian eruptions have occurred during the Holocene. Lava flows have reached the sea and formed capes on the NW coast; several young lava flows are also present on the E flank beneath a scoria deposit. The Tatarinov group of six volcanic centers is located immediately to the south, and the Lomonosov cinder cone group, the source of an early Holocene lava flow that reached the saddle between it and Fuss Peak to the west, lies at the southern end of the N-S-trending Chikurachki-Tatarinov complex. In contrast to the frequently active Chikurachki, the Tatarinov centers are extensively modified by erosion and have a more complex structure. Tephrochronology gives evidence of an eruption around 1690 CE from Tatarinov, although its southern cone contains a sulfur-encrusted crater with fumaroles that were active along the margin of a crater lake until 1959.
Information Contacts: Kamchatka Volcanic Eruptions Response Team (KVERT), Far East Division, Russian Academy of Sciences, 9 Piip Blvd., Petropavlovsk-Kamchatsky, 683006, Russia (URL: http://www.kscnet.ru/ivs/); Copernicus Browser, Copernicus Data Space Ecosystem, European Space Agency (URL: https://dataspace.copernicus.eu/browser/).
Search Bulletin Archive by Publication Date
Select a month and year from the drop-downs and click "Show Issue" to have that issue displayed in this tab.
The default month and year is the latest issue available.
Bulletin of the Global Volcanism Network - Volume 27, Number 09 (September 2002)
Managing Editor: Richard Wunderman
Karymsky (Russia)
3-km-high plumes, seismicity, and three new lava flows through September 2002
Krakatau (Indonesia)
Seismic activity increases during mid-August 2002; Alert Level remains at 2
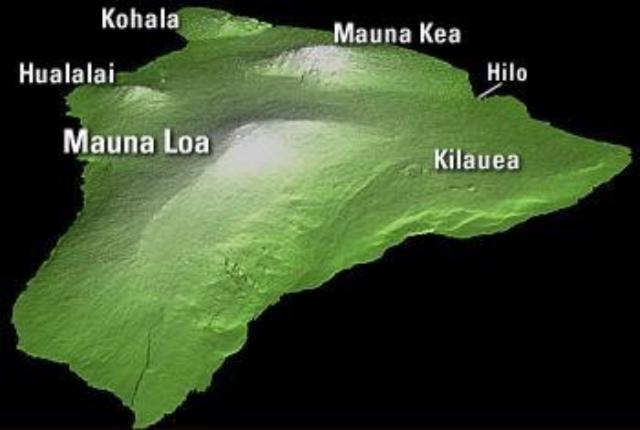
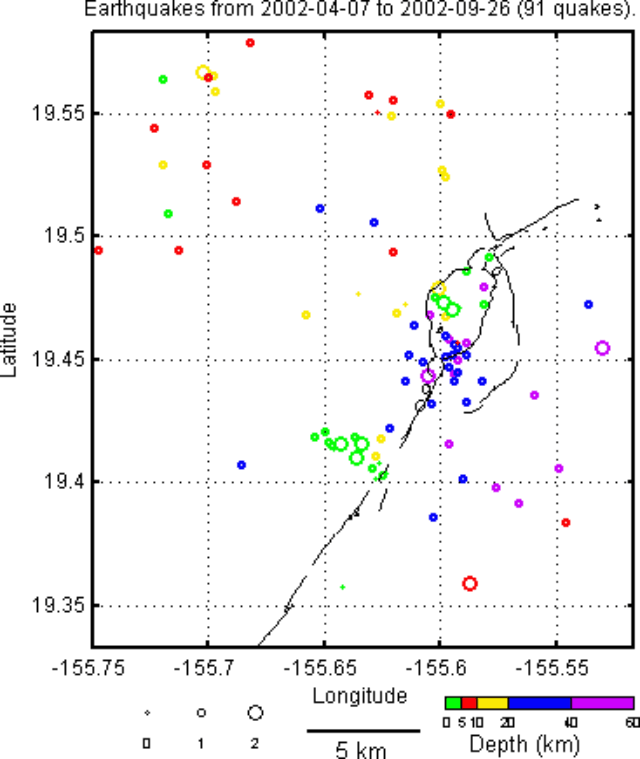
Mauna Loa (United States)
Following 9 years of slow deflation, quicker inflation since mid-May 2002
Merapi (Indonesia)
Frequent lava avalanches; plumes up to 550 m above summit
Semeru (Indonesia)
Higher-than-normal seismic and explosive activity during June-September 2002
Sheveluch (Russia)
Growing lava dome, seismicity, and plumes up to 7 km high
Soufriere Hills (United Kingdom)
Mid-to-late 2002 dome growth and the start of NE-traveling pyroclastic flows
Talang (Indonesia)
Plume reached up to 100 m above the crater during July 2002
Tangkuban Parahu (Indonesia)
First elevated seismicity since 1992
Witori (Papua New Guinea)
Continued lava flows and deformation; monitoring network installed
Karymsky (Russia) — September 2002 Cite this Report
Karymsky
Russia
54.049°N, 159.443°E; summit elev. 1513 m
All times are local (unless otherwise noted)
3-km-high plumes, seismicity, and three new lava flows through September 2002
Frequent plumes (including 15 April and 9 July ash clouds to 3.0 km above the volcano), a new intracrater cone, and a 1.3-km-long lava flow were seen during 1 January-9 July 2002 (BGVN 27:03 and 27:06). This report first highlights events described in 10 July-September 2002 updates. During this interval Karymsky produced 3-km-tall plumes, restless seismicity, and three new lava flows. Next, a separate section of this report presents photos of Karymsky and adjacent Akademia Nauk caldera taken in September 2000 and in May 2002. This report also cites a fundamental reference volume on the topic of the 1996 eruption, Fedotov (1998), which includes a preface and ten papers.
Activity during 10 July-September 2002. Seismicity during this interval generally stood well above background levels, very often at a value of ~10 earthquakes per hour. During nearly every week of the reporting interval, geophysicists suggested that the character of the seismicity might indicate weak ash-and-gas explosions and avalanches. Weak thermal anomalies were often observed on AVHRR satellite imagery and, in the majority of cases, no ash was detected. In contrast, satellite imagery on 25 July indicated a possible, small, SW-directed ash plume. On 26 July, a thermal anomaly reached 2 pixels in size.
During 27 July-2 August, local, shallow seismic events decreased, dropping from 250 to 150 events per day. During 30 August-6 September and 13-24 September there were 200-300 local shallow earthquakes occurring per day (compared to 150-250 per day in August). In early September estimates suggested that explosions rose ~1 km above the summit.
Observations on 8 September revealed three new small lava flows on the volcano's S and SE slopes. On satellite imagery a thermal anomaly was visible but ash was not. The character of the seismicity indicated ash-and-gas explosions rising ~1 km above the volcano and gas blow-outs. On 16 September at 1217 a short-lived explosion created an ash-and-gas plume; observers on an aircraft aloft estimated the plume top's height at ~3 km altitude.
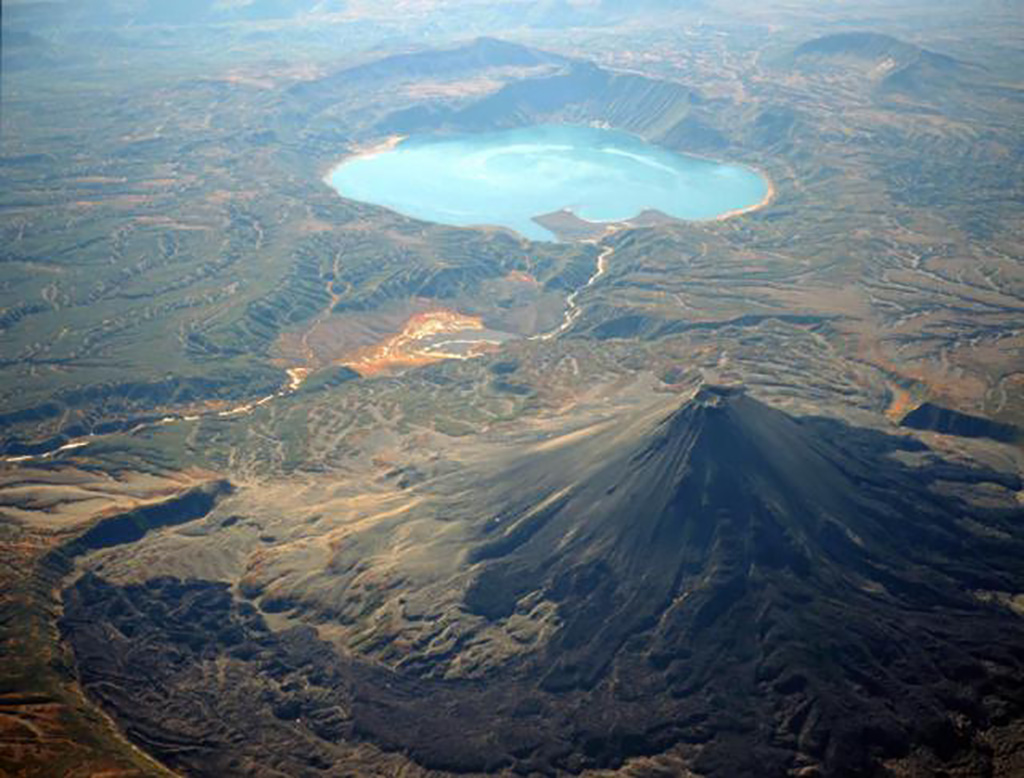
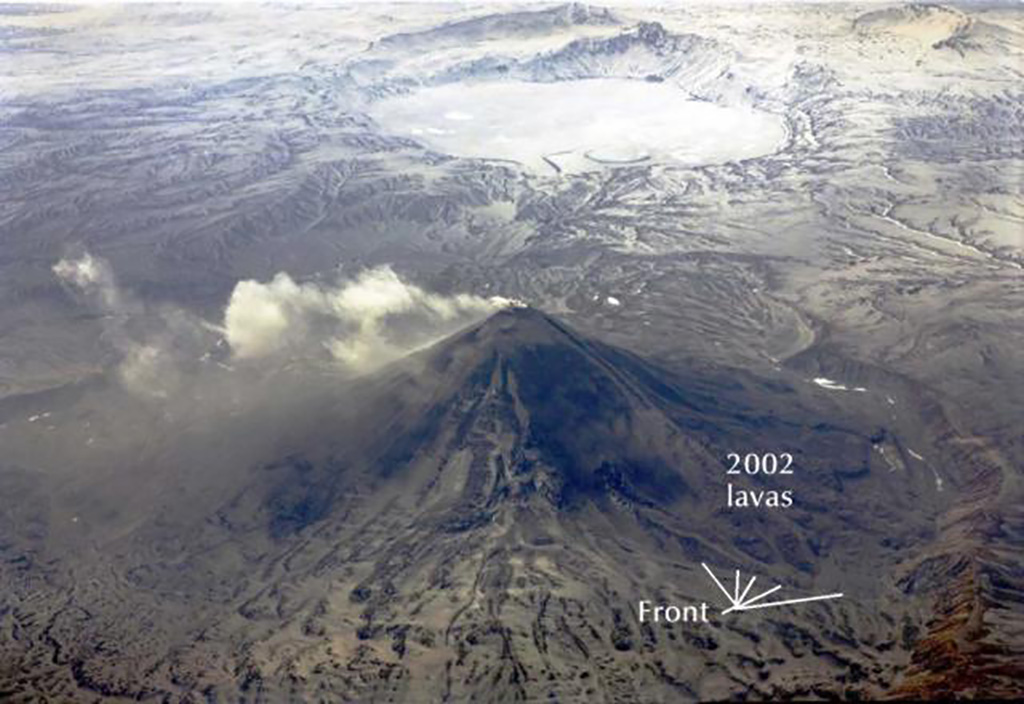
Photographs and brief retrospective on the 1996 eruption. Figures 10 and 11 provide overviews of the Karymsky stratovolcano (also written as Pra-Karymsky) and adjacent areas to the S on 26 September 2000 and 10 May 2002 respectively. Both these aerial photos were provided by Victor Ivanov (Russian Academy of Sciences). The former was taken ~4 years after the complex 1996 eruption (see BGVN 21:01-21:03 and 21:05; and Fedotov, 1998).
In overview, that eruption consisted of a 1 January 1996 earthquake swarm (with events to M 6.9) followed a day later with simultaneous eruptions from two vents 6 km apart, one at the stratovolcano's summit, the other at Akademia Nauk caldera in the N end of Karymsky lake. The latter consisted of a submarine phreatomagmatic eruption that deposited a low conical ring composed of pyroclastics. The subaerial portion of those deposits encircled the vent forming a ~600-m-wide crater in the cone's center. The cone also extended to the lake shore, thus forming a peninsula. The eruptive event included or was associated with base surges, tsunamis, surface ruptures, and secondary eruptions on the new peninsula. The eruption also left the lake with pH of 3.2 and its outlet into the Karymsky river obstructed by the new deposits. Several months later the new deposits eroded, resulting in massive mudflows down the Karymsky river. At the submarine vent eruptive products were predominantly basaltic; some fine ash was andesitic; late-stage rhyolites occasionally formed inclusions within basalts and bombs with basaltic jackets.
The photos were taken from perspectives on the volcano's N side. Several months after the dam-breaking event, the partly eroded pyroclastic deposits took the form of a squat U-shaped peninsula with two arms extending hundreds of meters into the lake. The circular segment along the middle of the peninsula's shoreline is part of the original cone's arcuate rim. Towards the left of the peninsula lies a conspicuous bay that leads to the outflow channel and the Karymsky river (the latter is most apparent on figure 10). Figure 11 shows that two years later the pyroclastic deposits in the lake more closely resemble lines rather than broad zones due to the partial cover of ice and snow.
The 1996 eruption at Karymsky and the Akademia Nauk caldera may have been a response to the injection of fresh basaltic magma from a deeper magmatic source. Later stages of the eruption at Karymsky have continued more than 6 years through this reporting interval.
During the underwater eruption in 1996 all of the lake's ice was broken and melted. Along the lake shore many new hot springs appeared. After the underwater eruption on the bottom of the lake many sources of heat and degassing appeared. The eruption triggered an ecological catastrophe during which all fish in the lake died.
During the winter 1996-1997 the water of the lake remained warm and devoid of ice. Usually ice completely disappears only in June or July. Lake ice returned in subsequent winters. Figure 10 (26 September 2000) shows light-colored patterns on the lake's surface that signify the presence of local ice accumulating there with the approach of winter. Figure 11 documents the dominance of ice on Karymsky lake's surface, still intact from the previous winter when photographed. The May 2002 lake surface also contained some ice-free zones. Their presence suggested the continued existence of post-eruptive heat sources on the lake bottom. These areas were possibly rich in algae and micro-organisms.
Reference. S. A. Fedotov, S.A., 1998, The 1996 eruption in the Karymsky volcanic center and related events: Special issue of Volcanology and Seismology, v. 19, no. 5, p. 521-767 (L.N. Rykunov, Ed. in Chief; Preface and 10 papers; English translation), Gordon & Breach Science Publishers (ISBN 0742-0463).
Geologic Background. Karymsky, the most active volcano of Kamchatka's eastern volcanic zone, is a symmetrical stratovolcano constructed within a 5-km-wide caldera that formed during the early Holocene. The caldera cuts the south side of the Pleistocene Dvor volcano and is located outside the north margin of the large mid-Pleistocene Polovinka caldera, which contains the smaller Akademia Nauk and Odnoboky calderas. Most seismicity preceding Karymsky eruptions originated beneath Akademia Nauk caldera, located immediately south. The caldera enclosing Karymsky formed about 7600-7700 radiocarbon years ago; construction of the stratovolcano began about 2000 years later. The latest eruptive period began about 500 years ago, following a 2300-year quiescence. Much of the cone is mantled by lava flows less than 200 years old. Historical eruptions have been vulcanian or vulcanian-strombolian with moderate explosive activity and occasional lava flows from the summit crater.
Information Contacts: Olga Chubarova, Kamchatka Volcanic Eruptions Response Team (KVERT), Institute of Volcanic Geology and Geochemistry, Piip Ave. 9, Petropavlovsk-Kamchatsky, 683006, Russia; Victor Ivanov, Institute of Volcanology Far East Division, Russian Academy of Sciences, Petropavlovsk-Kamchatsky, 683006, Russia.
Krakatau (Indonesia) — September 2002 Cite this Report
Krakatau
Indonesia
6.1009°S, 105.4233°E; summit elev. 285 m
All times are local (unless otherwise noted)
Seismic activity increases during mid-August 2002; Alert Level remains at 2
A thick white plume reached 25 m above the summit several times during October through December 2001. During 27 August 2001 through 16 September 2001 at Krakatau, available seismic data were dominated by explosions and shallow volcanic earthquakes (table 1). The seismograph broke on 16 September 2001 but was repaired by 26 August 2002, when it showed a slight increase over the previous interval when data were available. No surface activity accompanied the increased seismicity. Volcanic events decreased during early September. The volcano remained at Alert Level 2 through at least 8 September.
Table 1. Earthquakes registered at Krakatau during 27 August 2001 through 8 September 2002. The seismic system was down during 16 September 2001-25 August 2002. Courtesy of VSI.
| Date |
Deep volcanic (A-type) |
Shallow volcanic (B-type) |
Explosion |
Small Explosion |
Tectonic |
Infrasonic |
| 27 Aug-02 Sep 2001 |
0 |
93 |
79 |
1051 |
0 |
0 |
| 03 Sep-09 Sep 2001 |
17 |
155 |
2040 |
269 |
1 |
1507 |
| 10 Sep-13 Sep 2001 |
26 |
159 |
23 |
347 |
0 |
22 |
| 26 Aug-01 Sep 2002 |
30 |
162 |
0 |
0 |
2 |
0 |
| 02 Sep-08 Sep 2002 |
2 |
4 |
0 |
0 |
3 |
0 |
Geologic Background. The renowned Krakatau (frequently mis-named as Krakatoa) volcano lies in the Sunda Strait between Java and Sumatra. Collapse of an older edifice, perhaps in 416 or 535 CE, formed a 7-km-wide caldera. Remnants of that volcano are preserved in Verlaten and Lang Islands; subsequently the Rakata, Danan, and Perbuwatan cones were formed, coalescing to create the pre-1883 Krakatau Island. Caldera collapse during the catastrophic 1883 eruption destroyed Danan and Perbuwatan, and left only a remnant of Rakata. This eruption caused more than 36,000 fatalities, most as a result of tsunamis that swept the adjacent coastlines of Sumatra and Java. Pyroclastic surges traveled 40 km across the Sunda Strait and reached the Sumatra coast. After a quiescence of less than a half century, the post-collapse cone of Anak Krakatau (Child of Krakatau) was constructed within the 1883 caldera at a point between the former Danan and Perbuwatan cones. Anak Krakatau has been the site of frequent eruptions since 1927.
Information Contacts: Volcanological Survey of Indonesia (VSI), Jalan Diponegoro No. 57, Bandung 40122, Indonesia (URL: http://www.vsi.esdm.go.id/).
Mauna Loa (United States) — September 2002 Cite this Report
Mauna Loa
United States
19.475°N, 155.608°W; summit elev. 4170 m
All times are local (unless otherwise noted)
Following 9 years of slow deflation, quicker inflation since mid-May 2002
Mauna Loa is the southern-most volcano on the island of Hawaii. Following the last eruption of Mauna Loa, during March-April 1984 (SEAN 09:03), there have been several periods of inflation and deflation at the volcano's summit caldera, Moku`aweoweo. As of September 2002, Mauna Loa has remained non-eruptive (figure 14) for 18.5 years. The pattern of deformation at Moku`aweoweo abruptly changed in mid-May 2002 from deflation to inflation, lasting until at least September 2002. An archive of deformation and seismic data from Mauna Loa dating back to the 1970s provides an example of the volcano's pre-eruptive and precursory behavior.
After the last Bulletin report about Mauna Loa in July 1991(BGVN 16:07) the volcano's summit continued to gradually inflate as it had since the 1984 eruption. This trend reversed in 1993-1994 when distances across the caldera shortened by as much as 7 cm, and leveling surveys in 1996 and 2000 measured more than 7 cm of subsidence SE of the caldera.
Beginning on 24 April 2002 at 0645 a notable cluster of deep earthquakes (darkest circles in figure 15) occurred in a 52-hour period. The earthquakes ended on 26 April at 1045. Many of the epicenters plotted within or close to the caldera's SW margin. The earthquakes ranged in depth from 26 to 43 km and in magnitude from 1.1 to 1.7. Several shallow earthquakes preceded this cluster; the largest, a magnitude 2.5 event on 21 April at 1931, was located ~3 km beneath the SW rift zone. After the cluster, several deep long-period events were recorded beneath the SW rift zone. At that time data from the continuous tiltmeter, dilatometer, and nearly continuous global positioning system (GPS) stations failed to suggest significant deformation of Moku`aweoweo caldera, upper-rift zones, or outer flanks.
Inflation. HVO maintains several continuously recording GPS stations installed in 1999 (figure 16). Beginning in late April or early May 2002, deformation data began to show signs of renewed activity.
Figure 17 shows the change in distance between MOKP and MLSP GPS stations, located on opposite sides of Moku`aweoweo. The increased distance between the two stations was interpreted to represent inflation of the summit magma reservoir, centered ~5 km below the caldera. The small amount of extension marks a noticeable change from the pattern of deflation during the preceding 9 years. GPS measurements also revealed that the summit area had inflated about 2 cm, consistent with swelling.
The switch from slow deflation to more rapid inflation occurred around 12 May. GPS data indicated lengthening at a rate of 5-6 cm per year. Therefore, as of 26 September the caldera had widened about 2 cm since 12 May. Measurements at GPS stations farther out on the flanks showed that swelling occurred at more than the summit, in particular, the upper part of the SE flank was moving outward.
In order to test the precision of the GPS measurements, HVO compared the GPS data against dry-tilt method data at the summit, an independent means to measure ground deformation using land-surveying instruments, deployed at regularly visited stations. These confirmed the GPS results, though with less precision.
Electronic-tiltmeter data obtained at the Moku'aweoweo tiltmeter were also analyzed for changes in tilt direction. No significant volcanic tilt was recorded that deviated from the diurnal signal corresponding to daily temperature fluctuations, or an annual signal corresponding to seasonal temperature changes.
During the inflationary period, seismicity at Mauna Loa was at a somewhat elevated level following the 24-26 April earthquake cluster. But, it remained far lower than it was the months prior to the 1975 and 1984 eruptions.
May-September 2002 unrest in comparison to activity since 1974. For Mauna Loa these data sets are available: electric distance meter (EDM) measurements since about 1975, GPS observations since 1999, dry-tilt observations since 1975, and seismicity since 1974. The capability to detect unrest at Mauna Loa has increased in the past few years with the installation of many new, continuously recording electronic tiltmeters, GPS receivers, and strainmeters (figure 18).
Figure 19 shows the distance measured across Moku`aweoweo caldera between MOKP and MSLP benchmarks by EDM during 1975 to September 2002, and by GPS beginning in 1999. Abrupt extensions associated with the 1975 and 1984 eruptions were caused by the rise of magma from the summit reservoir to the surface. During the 1984 eruption, the summit area subsided rapidly as lava erupted. When the eruption stopped, the summit reservoir again began to inflate in response to the influx of magma, as indicated by the increasing distance between the two benchmarks until about1993. Inflation did not occur again until early May 2002 when the slow contraction across the summit changed abruptly to extension. This extension rate is the highest since immediately after the 1984 eruption.
GPS measurements have only been made at Mauna Loa since 1999, but in that relatively short time an abrupt change in ground movement has been recorded (figure 20). Measurements made during January 1999-May 2002 show small velocities of ground displacement towards the SW. In contrast, during May-September 2002 the direction of ground motion changed from a fairly uniform, southeastward movement to a predominately radial pattern. In addition, the rate of ground motion increased by 5 to 10 times.
Ground tilt away from the caldera occurs when magma accumulates beneath the surface. Although electronic measurements provide much more precise readings, the dry-tilt method remains in use at HVO after 35 years for several reasons. First, the measurements can be made nearly anywhere at any time. Second, they are not subject to long-term instrument drift. Lastly, they provide an independent corroboration of measurements made by more sophisticated modern instruments. Dry-tilt measurements revealed the following: inflation between the 1975 and 1984 eruptions (figure 21a), inflation after the 1984 eruption, continuing until 1993 (figure 21b), and deflation from 1993 through March (probably May) 2002 (figure 21c). After March (probably May), the tilt returned to an inflationary pattern (figure 21d). The most recent pattern of inflation is based on only two sets of measurements, and the tilt varies, with some smaller arrows pointing inward, so it is much less certain than the past patterns. Still, the radial pattern strongly suggests that inflation is occurring.
HVO's telemetered seismographic network recorded significant changes in seismicity before the Mauna Loa eruptions in 1975 and 1984 (figure 22). The short-term forecasts of these eruptions were based in large part on precursory activity. Both eruptions were preceded by an increase in earthquakes at intermediate depths NE of Moku`aweoweo, and then by an increase in shallower earthquakes beneath Mauna Loa's summit. From the 1984 eruption until late April 2002, approximately 30 earthquakes were located per year beneath Mauna Loa's summit and upper flanks. Rates of seismicity moderately increased beginning in late April 2002, particularly at depths greater than 15 km (figure 22d). As of 29 September 2002, 100 earthquakes were recorded in 2002 below the summit and upper flanks of the volcano, 83 of which occurred after mid-April. This rate is markedly higher than those of previous years, but it is still well below the rates seen prior to the last two eruptions. Before an eruption becomes imminent, HVO scientists expect that rates of shallow seismicity will elevate to levels much higher than those observed in late September 2002.
References. Moore J G, Clague D A, Holcomb R T, Lipman P W, Normark W R, Torresan M E, 1989. Prodigous submarine landslides on the Hawaiian Ridge. J Geophys Res, 94: 17,465-17,484; Lockwood J P, Lipman P W, 1987. Holocene eruptive history of Mauna Loa volcano. U S Geol Surv Prof Pap, 1350: 509-535.
Geologic Background. Massive Mauna Loa is a basaltic shield volcano that rises almost 9 km from the ocean floor to form the world's largest Holocene volcano. Flank eruptions typically occur from the lengthy NE and SW rift zones, and from the Moku'aweoweo summit is caldera, which is within an older and larger 6 x 8 km caldera. Two of the youngest large debris avalanches documented in Hawaii traveled nearly 100 km from Mauna Loa; the second of the Alika avalanches was emplaced about 105,000 years ago (Moore et al., 1989). Almost 90% of the surface of the volcano is covered by lavas less than 4,000 years old (Lockwood and Lipman, 1987). Beginning about 1,500 years ago, a series of voluminous overflows from a summit lava lake covered about 25% of the volcano's surface. Over the last 750 years, from shortly after the formation of Moku'aweoweo caldera until the present, an additional 25% of the volcano has been covered with lava flows, mainly from summit and NW rift zone vents.
Information Contacts: Hawaiian
Volcano Observatory (HVO), U.S. Geological Survey, PO Box 51, Hawaii National Park, HI 96718, USA (URL: https://volcanoes.usgs.gov/observatories/hvo/).
Merapi (Indonesia) — September 2002 Cite this Report
Merapi
Indonesia
7.54°S, 110.446°E; summit elev. 2910 m
All times are local (unless otherwise noted)
Frequent lava avalanches; plumes up to 550 m above summit
During 17 July-1 September, seismicity at Merapi was dominated by avalanche earthquakes. SO2 emissions varied, and generally white, thin, low-pressure plumes rose up to 550 m above the summit. Glowing avalanches traveled 2.6 km, moving towards headwaters of the Sat, Lamat, Senowo, and Bebeng rivers (table 16). On 2 July two pyroclastic flows traveled 0.5 km toward the upstream of the Sat river. One low-frequency earthquake occurred during late August. The temperature of Gendol crater was 734-755°C, and the Woro crater was 418-435°C. Merapi remained at Alert Level 2.
Table 16. Seismicity, SO2 emissions, plume and lava-avalanche observations at Merapi during 17 June-1 September 2002. Courtesy VSI.
| Date |
Avalanche |
Multiphase |
Tectonic |
SO2* |
MI |
Plumes (heights are above the summit) and lava avalanches |
| 17 Jun-23 Jun 2002 |
247 |
6 |
7 |
107, 56-197, 174 |
+0.76 |
White, thin, low-pressure plume rose 400 m; 65 glowing lava avalanches traveled 2.5 km to the Sat, Lamat and Senowo rivers. |
| 24 Jun-30 Jun 2002 |
318 |
3 |
16 |
87, 56-172, 134 |
-- |
White, thin, low-pressure plume rose 500 m; 68 glowing lava avalanches traveled 2.5 km to the Sat, Lamat and Senowo rivers. |
| 01 Jul-07 Jul 2002 |
226 |
4 |
6 |
113, 73-167, 134 on 6 July |
+0.59 |
White, thin, low-pressure plume rose 550 m; 60 glowing lava avalanches traveled 2.6 km to the Sat, Lamat, Senowo, and Bebeng rivers. |
| 08 Jul-14 Jul 2002 |
180 |
-- |
12 |
85, 65-118, 86 on 11 July |
+2.56 |
White, thin, low-pressure plume rose 550 m; glowing lava avalanches traveled 2.6 km to the Sat, Lamat, Senowo, and Bebeng rivers. |
| 15 Jul-21 Jul 2002 |
201 |
2 |
4 |
117, 76-143, 122 on 16 July |
-1.15 |
White, thick low-pressure plume rose 390 m; glowing lava avalanches traveled 2.5 km to the Sat, Lamat, Senowo, and Bebeng rivers. |
| 22 Jul-28 Jul 2002 |
220 |
-- |
10 |
80, 46-167, 135 on 28 July |
-1.69 |
White, thick low-pressure plume rose 350 m; 92 glowing lava avalanches traveled 2.5 km to the Sat, Lamat, Senowo, and Bebeng rivers. |
| 29 Jul-04 Aug 2002 |
237 |
3 |
7 |
145, 62-210, 162 on 4 August |
+1.68 |
White, thin medium-pressure plume rose 394 m; 42 glowing lava avalanches traveled 2.6 km to the Sat, Lamat, Senowo, and Bebeng rivers. |
| 05 Aug-11 Aug 2002 |
184 |
1 |
4 |
106, 56-123, 155 on 5 August |
-1.89 |
White, thick, low-pressure plume rose 525 m; 53 glowing lava avalanches traveled 2.5 km to the Sat, Lamat, Senowo, and Bebeng rivers. |
| 12 Aug-18 Aug 2002 |
191 |
-- |
6 |
87, 61-115, 93 on 14 August |
+0.13 |
White, thin, low-pressure plume rose 300 m; 40 glowing lava avalanches traveled 2.5 km to the Sat, Lamat, and Senowo rivers. |
| 19 Aug-25 Aug 2002 |
187 |
15 |
11 |
129, 92-154, 137 on 24 August |
+0.13 |
White, thin, low-pressure plume rose 350 m; 16 glowing lava avalanches traveled 2.5 km to the Sat, Lamat, and Senowo rivers. |
| 26 Aug-01 Sep 2002 |
311 |
4 |
3 |
127, 85-190, 157 on 26 August |
-0.22 |
White, thin, low-pressure plume rose 400 m; glowing lava avalanches traveled 2.5 km to the Sat, Lamat, and Senowo rivers. |
Geologic Background. Merapi, one of Indonesia's most active volcanoes, lies in one of the world's most densely populated areas and dominates the landscape immediately north of the major city of Yogyakarta. It is the youngest and southernmost of a volcanic chain extending NNW to Ungaran volcano. Growth of Old Merapi during the Pleistocene ended with major edifice collapse perhaps about 2,000 years ago, leaving a large arcuate scarp cutting the eroded older Batulawang volcano. Subsequent growth of the steep-sided Young Merapi edifice, its upper part unvegetated due to frequent activity, began SW of the earlier collapse scarp. Pyroclastic flows and lahars accompanying growth and collapse of the steep-sided active summit lava dome have devastated cultivated lands on the western-to-southern flanks and caused many fatalities.
Information Contacts: Volcanological Survey of Indonesia (VSI), Jalan Diponegoro No. 57, Bandung 40122, Indonesia (URL: http://www.vsi.esdm.go.id/).
Semeru (Indonesia) — September 2002 Cite this Report
Semeru
Indonesia
8.108°S, 112.922°E; summit elev. 3657 m
All times are local (unless otherwise noted)
Higher-than-normal seismic and explosive activity during June-September 2002
During 17 June-8 September, activity at Semeru was higher than normal. Seismicity was dominated by explosion and avalanche earthquakes. Volcanic and tectonic earthquakes also occurred, along with occasional tremor episodes (table 9). During June and July, and on 6 August, when fog did not obscure the view, observers reported that lava avalanches traveled toward Besuk Kembar river at distances of ~750 m from the crater rim. At times during July explosions produced white ash plumes that reached 300-500 m above the crater. During mid-August to early September, a white-gray ash plume rose 400-500 m above the crater. On 8 September at 1947 an ash explosion ejected glowing material ~150 m toward the upper stream of Besuk Kembar river. Semeru remained at Alert Level 2.
Table 9. Earthquakes and tremor registered at Semeru during 17 June-8 September 2002. Courtesy VSI.
| Date |
Volcanic |
Explosion |
Avalanche |
Tremor (max. amp.) |
| 17 Jun-23 Jun 2002 |
-- |
670 |
75 |
-- |
| 24 Jun-30 Jun 2002 |
-- |
782 |
83 |
1 |
| 01 Jul-07 Jul 2002 |
-- |
714 |
76 |
1 |
| 08 Jul-14 Jul 2002 |
-- |
898 |
77 |
-- |
| 15 Jul-21 Jul 2002 |
-- |
670 |
83 |
-- |
| 22 Jul-28 Jul 2002 |
4 B-type |
696 |
88 |
3 (1-4 mm) |
| 29 Jul-04 Aug 2002 |
-- |
744 |
92 |
(1-4 mm) |
| 05 Aug-11 Aug 2002 |
1 B-type |
668 |
106 |
-- |
| 12 Aug-18 Aug 2002 |
-- |
696 |
67 |
-- |
| 19 Aug-25 Aug 2002 |
2 A-type |
734 |
108 |
-- |
| 26 Aug-01 Sep 2002 |
1 B-type |
845 |
115 |
-- |
| 02 Sep-08 Sep 2002 |
1 A-type |
640 |
57 |
-- |
Geologic Background. Semeru, the highest volcano on Java, and one of its most active, lies at the southern end of a volcanic massif extending north to the Tengger caldera. The steep-sided volcano, also referred to as Mahameru (Great Mountain), rises above coastal plains to the south. Gunung Semeru was constructed south of the overlapping Ajek-ajek and Jambangan calderas. A line of lake-filled maars was constructed along a N-S trend cutting through the summit, and cinder cones and lava domes occupy the eastern and NE flanks. Summit topography is complicated by the shifting of craters from NW to SE. Frequent 19th and 20th century eruptions were dominated by small-to-moderate explosions from the summit crater, with occasional lava flows and larger explosive eruptions accompanied by pyroclastic flows that have reached the lower flanks of the volcano.
Information Contacts: Volcanological Survey of Indonesia (VSI), Jalan Diponegoro No. 57, Bandung 40122, Indonesia (URL: http://www.vsi.esdm.go.id/).
Sheveluch (Russia) — September 2002 Cite this Report
Sheveluch
Russia
56.653°N, 161.36°E; summit elev. 3283 m
All times are local (unless otherwise noted)
Growing lava dome, seismicity, and plumes up to 7 km high
Last discussed through May 2002 (BGVN 27:05), Shiveluch went on to display mostly mild eruptive activity, punctuated by occasional larger outbursts, during the interval from mid-June through early October 2002. During this reporting period, a lava dome continued to grow in the active crater, both ash-bearing and dominantly gas emissions occurred, and seismicity remained above background levels. Plumes reached up to 7 km above the lava dome (table 3). Earthquakes reached up to M 2.7 at depths of 0-10 km. Other local shallow seismic signals occurred that indicated possible weak gas-and-ash explosions and avalanches. Episodes of weak spasmodic tremor were registered. Thermal anomalies were visible on AVHRR satellite imagery throughout the report period (table 4) but no ash was detected in any image.
Table 3. Plumes reported at Shiveluch during 14 June-11 October 2002. All visual observations and recordings were made from Klyuchi town. Cloudy weather prevented observations on some days. Courtesy KVERT.
| Date |
Plume type |
Height above dome |
Comment |
| 15 Jun 2002 |
Ash and gas |
~1000 m |
Shallow seismic events registered; no strong explosions |
| 16 Jun 2002 |
Gas and steam |
300 m |
-- |
| 19 Jun 2002 |
Ash and gas |
~1500 m |
Shallow seismic events registered; no strong explosions |
| 20 Jun 2002 |
Gas and steam |
100 m |
-- |
| 20 Jun 2002 |
Gas and steam |
900 m |
Extended 10 km to the SW |
| 22-24, 26-27 Jun 2002 |
Gas and steam |
1000-3000 m |
Extended 10 km to the SW on 22-23, 26-27 June |
| 30 Jun-02 Jul 2002 |
Gas and steam |
800-2000 m |
Extended 10 km to the E |
| 06, 08-10 Jul 2002 |
Ash and gas |
~1000-1500 m |
One to three explosions per day accompanied by rock avalanches/pyroclastic flows (recorded on video) |
| 06-10 Jul 2002 |
Gas and steam |
200-1500 m |
Extended 10 km to the E on 7-9 July |
| 12-13, 16 Jul 2002 |
Gas and steam |
1500-2000 m |
-- |
| 13 Jul 2002 |
Ash-poor |
~1000 m |
Short-lived explosions (recorded on video) |
| 19 Jul 2002 |
Gas and steam |
50 m |
-- |
| 19-20 Jul 2002 |
Gas and steam |
400-500 m |
-- |
| 22 Jul 2002 |
Likely ash-rich |
~7 km |
Small, circular (~10 km in diameter), appeared to be centered over summit; no strong explosive event identified; no ash reported |
| 23-25 Jul 2002 |
Steam/aerosol |
-- |
Possibly a little fine ash; observed in satellite images |
| 24-25 and early 26 Jul 2002 |
Gas and steam |
1500 m |
Extended 10 km to the SSE, SSW, and SW; visual observation revealed no ash plumes |
| 30 Jul 2002 |
-- |
~3000 m |
Visual observation; accompanied by short-lived explosion; possible small amount of ash |
| 26-27 Jul 2002 |
Gas and steam |
1500 m |
Extended 10 km to the SE on 28 July |
| 27 Jul 2002 |
Ash and gas |
1500 m |
Short-lived explosive eruption |
| 28 Jul 2002 |
Gas and steam |
200 m |
-- |
| 29 Jul 2002 |
Ash and gas |
~3000 m |
Short-lived explosive eruption; possible small amount of ash observed above low clouds |
| 06-07 Aug 2002 |
Ash and steam |
1500-3000 m |
Four short-lived explosive eruptions sent ash-poor plumes to 1500-3000 m above dome (recorded on video) |
| 14 Aug 2002 |
Gas and steam |
1500 m |
-- |
| 15 Aug 2002 |
Ash and gas |
~2000 m |
-- |
| 16-17 Aug 2002 |
Gas and steam |
300-400 m |
-- |
| 17 Aug 2002 |
Ash and gas |
~1000 m |
Short-lived explosion observed |
| 18, 22 Aug 2002 |
Gas and steam |
1200-4000 m |
Extended 10 km to the W and SW on 17-18, 22 August |
| 23, 28 Aug 2002 |
Gas and steam |
1000-1500 m |
-- |
| 25 Aug 2002 |
Gas and steam |
200 m |
-- |
| 25 Aug 2002 |
Ash and gas |
~1500 m |
Short-lived explosion |
| 31 Aug 2002 |
Gas and steam |
100 m |
-- |
| 03 Sep 2002 |
Gas and steam |
400 m |
-- |
| 05 Sep 2002 |
Ash and gas |
~2000 m |
Short-lived explosion |
| 08 Sep 2002 |
Ash and gas |
~1500-~2000 m |
Short-lived explosions; plumes extended to the E |
| 08-09 Sep 2002 |
Gas and steam |
300-1500 m |
-- |
| 09 Sep 2002 |
Ash and gas |
~1000-~3500 m |
Short lived explosions |
| 11 Sep 2002 |
Ash and gas |
~1500 m |
Short-lived explosions |
| 15 Sep 2002 |
Ash and gas |
~1000 m |
Short-lived explosions |
| 16-17 Sep 2002 |
Gas and steam |
100 m |
-- |
| 17 Sep 2002 |
Ash and gas |
~3000 m |
Short-lived explosion |
| 17-18 Sep 2002 |
Ash and gas |
~2000 m |
-- |
| 24 Sep 2002 |
Gas and steam |
~5000 m |
Short-lived explosions |
| 26 Sep 2002 |
Ash and gas |
100-700 m |
-- |
| 06 Oct 2002 |
Ash and gas |
~1000 m |
At 2100 a glow from hot lava was observed at the dome area (recorded on video) |
Table 4. Thermal anomalies recognized in AVHRR satellite imagery at Shiveluch during 14 June-11 October 2002. On some days, clouds obscured the view or there were no passes over the volcano. Unless noted, all images came from the AVHRR satellite. Courtesy KVERT.
| Date |
Number of pixels |
Max band-3 temp. (°C) |
Background (°C) |
Comment |
| 15 Jun 2002 |
4 |
-- |
-- |
Faint plumes to SE for 53-130 km observed 15-16 June; no ash detected |
| 16 Jun 2002 |
4 |
49.5 |
0 |
Most intense 15-20 June; no ash detected |
| 20 Jun 2002 |
4 |
-- |
-- |
-- |
| 22-26 Jun 2002 |
2-5 |
38-43 |
0 to 17 |
Steam plumes trailed 40-75 km observed 22, 25, 27 June (no direction given); no ash detected |
| 29 Jun; 01, 04 Jul 2002 |
1-4 |
1-2 pixels at 49 |
-5 to 26 |
No ash detected |
| 06-11 Jul 2002 |
1-4 |
2 pixels at 49 |
1 to 10 |
Plumes extended 30-200 km to the E observed 8-9 July; no ash detected |
| 13, 16 Jul 2002 |
5-7 |
36.9-45 |
5 to 10 |
No ash detected |
| 19-20, 24-early 26 Jul 2002 |
1-7 |
18.5-49.5 |
-5 to 22 |
No ash detected |
| 26, 28 Jul; 01 Aug 2002 |
1-4 |
38-49 |
5 to 10 |
On 28 July and 1 August small steam plumes extended to the sincerely and 35 km to the NW, respectively |
| 06-07 Aug 2002 |
5 |
20-21 |
0 to 4 |
Small steam plumes extended 30 km to the SW and 55 km to the NW (observed in satellite images); no ash detected |
| 10, 12-13, 15 Aug 2002 |
1-4 |
~30 |
-- |
No ash or steam-and-gas plumes detected |
| 16-17, 19, 22 Aug 2002 |
Two 6 |
46-49 |
-- |
On 22 August at 0718 a steam-and-gas plume extended 35 km to the SW |
| 23-24, 28 Aug 2002 |
2-4 |
20-44 |
-- |
-- |
| 29 Aug 2002 |
5 |
2 pixels at 49.44 |
~15 |
Steam-and-gas plume extended ~68 km to the SW; no ash detected |
| 30-31 Aug 2002 |
1-5 |
37-39 |
~3 morning |
No ash detected |
| 02-04 Sep 2002 |
-- |
-- |
~15 afternoon |
-- |
| 08, 09, 12, 13 Sep 2002 |
2-5 |
2.8-36.5 |
~-18 to 0 |
No ash detected |
| 14-17 Sep 2002 |
2-6 |
39.64-49.5 |
~-3 to 20 |
On 16 September a small plume extended ~34 km to the SE; on 17 September a plume extended ~127 km to the ESE; no ash detected |
| 21, 24, 25 Sep 2002 |
3-4 |
-- |
-- |
No ash detected (NOAA12 and NOAA16 satellite images) |
| 24 Sep 2002 |
1-4 |
18-44.8 |
~-10 |
No ash detected |
| 27, 30 Sep; 01-03 Oct 2002 |
2-4 |
-- |
-- |
On 2 October a steam-and-gas plume extended 80 km to the SE (NOAA12 and NOAA16 satellite images) |
| 02 Oct 2002 |
2-3 |
40.46 to 45-48 |
~-10 to -3 |
Faint plume extended 15 km to the SE; no ash detected |
| 05-07 Oct 2002 |
2-8 |
36.81-49.35 |
?14 to 0 |
On 6 October a plume extended 111 km to the SE; no ash detected |
The Level of Concern Code was Yellow ("volcano is restless") throughout the reporting period, except for a few days starting 30 July and again early in August when Code Orange ("volcano is in eruption or eruption may occur at any time") was declared.
Summary of recent activity. Except when the summit was obscured by clouds, ash-and-gas or gas-and-steam plumes were seen visually almost daily (table 3). These plumes, frequently accompanied by short-lived explosions and avalanches, typically rose 1-3 km above the summit with occasional plumes rising as high as 7-10 km.
Similarly, satellite imagery (principally AVHRR) reported significant thermal anomalies on an almost daily basis with an extent of several (1-6) pixels, reaching maximum, band-3 temperatures of 20-49°C and frequently associated with steam or aerosol plumes, some extending over 100 km from the volcano.
From mid-June to late-July, numerous earthquakes were recorded, typically M 1.7 to 2.4 and several reaching M 2.7. At 2000 on 29 July, four earthquakes (M 2.1-2.3) occurred and the intensity of volcanic tremor increased noticeably in comparison with the previous days. The following day (30 July), the Level of Concern was raised from Yellow to Orange, but it returned to Yellow when the tremor amplitude decreased over the following two days. However, the activity level increased again during subsequent days and the level was raised again to Orange.
During 12-16 August, about 10 earthquakes of magnitude 1.7-2.4 occurred. Along with smaller earthquakes and many other local seismic signals, these probably indicated ash and gas explosions (at a rate of 1-3 a day, to heights of 1500-2500 m above the dome). However, the Level of Concern was returned to Yellow by the end of the week.
Through the remainder of the period, many earthquakes up to M 2.7 occurred, frequent gas-and-steam plumes rose as high as 5 km above the dome, and thermal anomalies of 6-8 pixels were observed as were gas/steam plumes that extended 80-120 km. On 25 September, continuous spasmodic tremor prevailed for 27 minutes.
Geologic Background. The high, isolated massif of Sheveluch volcano (also spelled Shiveluch) rises above the lowlands NNE of the Kliuchevskaya volcano group. The 1,300 km3 andesitic volcano is one of Kamchatka's largest and most active volcanic structures, with at least 60 large eruptions during the Holocene. The summit of roughly 65,000-year-old Stary Shiveluch is truncated by a broad 9-km-wide late-Pleistocene caldera breached to the south. Many lava domes occur on its outer flanks. The Molodoy Shiveluch lava dome complex was constructed during the Holocene within the large open caldera; Holocene lava dome extrusion also took place on the flanks of Stary Shiveluch. Widespread tephra layers from these eruptions have provided valuable time markers for dating volcanic events in Kamchatka. Frequent collapses of dome complexes, most recently in 1964, have produced debris avalanches whose deposits cover much of the floor of the breached caldera.
Information Contacts: Olga Chubarova, Kamchatka Volcanic Eruptions Response Team (KVERT), Institute of Volcanic Geology and Geochemistry, Piip Ave. 9, Petropavlovsk-Kamchatsky, 683006, Russia; Tom Miller and Dave Schneider, Alaska Volcano Observatory (AVO), a cooperative program of a) U.S. Geological Survey, 4200 University Drive, Anchorage, AK 99508-4667, USA, b) Geophysical Institute, University of Alaska, PO Box 757320, Fairbanks, AK 99775-7320, USA, and c) Alaska Division of Geological & Geophysical Surveys, 794 University Ave., Suite 200, Fairbanks, AK 99709, USA (URL: http://www.avo.alaska.edu/).
Soufriere Hills (United Kingdom) — September 2002 Cite this Report
Soufriere Hills
United Kingdom
16.72°N, 62.18°W; summit elev. 915 m
All times are local (unless otherwise noted)
Mid-to-late 2002 dome growth and the start of NE-traveling pyroclastic flows
The Montserrat Volcano Observatory (MVO) reported that during mid-May through mid-September 2002, seismicity at Soufrière Hills was dominated by rockfall signals. Four volcano-tectonic (VT) earthquakes were reported during the first week of June and nine during the week of 9-16 August. SO2 emission rates were measured using Differential Optical Absorption Spectrometers (DOAS). SO2 fluxes generally remained at moderate levels. High fluxes occurred at times, such as during rockfall activity on 12 August (up to 690 t/day). On 6 September SO2 emissions were low at 42-170 t/day, although levels increased to 170-518 t/day through 13 September (table 41).
Table 41. Seismicity at Soufrière Hills during 10 May-13 September 2002. "--" indicates that the information was not reported. Courtesy MVO.
| Date |
Rockfall |
Long-period |
Long-period / Rockfall |
Hybrid |
SO2 flux (metric tons/day) |
| 10 May-17 May 2002 |
553 |
127 |
99 |
5 |
-- |
| 17 May-24 May 2002 |
532 |
77 |
111 |
1 |
-- |
| 24 May-31 May 2002 |
497 |
57 |
93 |
6 |
-- |
| 31 May-07 Jun 2002 |
129 |
20 |
4 |
6 |
-- |
| 07 Jun-14 Jun 2002 |
135 |
20 |
3 |
12 |
247-955 |
| 14 Jun-21 Jun 2002 |
226 |
14 |
10 |
17 |
14-15 Jun: ~170-520; 16-17 Jun: ~90-350; 19 Jun: ~600-690; 20-21 Jun: ~90-350 |
| 21 Jun-28 Jun 2002 |
102 |
6 |
2 |
19 |
22-23 Jun: ~170-520; 24 Jun: ~90-260; 25-26 Jun: ~170-350; 26-28 Jun: ~90-170 |
| 28 Jun-05 Jul 2002 |
42 |
6 |
5 |
11 |
-- |
| 05 Jul-12 Jul 2002 |
108 |
6 |
2 |
17 |
10-12 Jul: ~90-260 |
| 12 Jul-19 Jul 2002 |
151 |
3 |
4 |
8 |
13-14 Jul: 90; 15-19 Jul: ~130-220 |
| 19 Jul-26 Jul 2002 |
250 |
92 |
28 |
15 |
22-26 Jul: 175-250 |
| 26 Jul-02 Aug 2002 |
260 |
118 |
32 |
3 |
~90-270 |
| 02 Aug-09 Aug 2002 |
313 |
138 |
52 |
23 |
Max: 690; avg: 380 |
| 09 Aug-16 Aug 2002 |
209 |
87 |
8 |
5 |
86-430; 12 Aug: ~690 during rockfall activity |
| 16 Aug-23 Aug 2002 |
231 |
44 |
5 |
1 |
16-18 Aug: 170-340; 19-23 Aug: 170-600 |
| 23 Aug-30 Aug 2002 |
287 |
31 |
9 |
0 |
170-340 |
| 30 Aug-06 Sep 2002 |
453 |
63 |
9 |
1 |
170-432 |
| 06 Sep-13 Sep 2002 |
308 |
63 |
2 |
0 |
6 Sep: 42-170; 7-13 Sep: 170-518 |
During mid-May, growth of the summit lava dome continued to be concentrated on the E flank, giving rise to numerous rockfalls and small pyroclastic flows in the upper reached of the Tar River Valley. Pyroclastic flows were observed moving NE in the uppermost part of Tuitt's Ghaut during an observation flight on the morning of May 13. This was the first indication that pyroclastic flows generated on the NE flank of the active dome were able to flow into this drainage system. This new direction of flow was possible after the 29 July collapse scar had become largely buried on this side of the dome. The summit region of the active dome was visible briefly on several occasions during late May. It had a broad blocky appearance, and growth seemed to have become concentrated on the SE, giving rise to rockfalls and small pyroclastic flows on the SE flank of the dome. There was little activity on the NE flank of the dome during the last week of May.
Very clear conditions during 31 May-3 June provided the first good views of the summit region for several months, revealing that since early April a large lobe had been extruded on the dome's upper SE side. The lobe was ~150 m across and reached 1,023 m altitude. The upper surface of the lobe had a spiny though slab-like appearance. Since the dome was last seen, it had developed a small lobe-like protrusion on the summit's W side. Minor June rockfalls occurred on the dome's E and W sectors.
During mid-June, although the dome was mostly covered by clouds, photos of the summit area were captured on many days by the remote digital camera at White's Yard. Despite the low level of rockfall and seismic activity, the massive extrusion lobe on the SE side of the dome continued to grow steadily. Most of the upper surface of the active lobe had the smooth form of a whale's back; it also contained a low-angle spine directed upwards towards the SE. The free face at the front of the lobe on the SE side was steep and blocky in appearance. A theodolite survey of the dome taken during a brief period of clear weather on 11 June measured these altitudes: the general summit area of the active lobe stood at 1,025-1,030 m, and the top of the spine, at 1,048 m.
Rockfall activity increased abruptly on the night of 14 June and remained moderately high until the 18th, when it declined once more. Rockfalls and small pyroclastic flows were produced by material collapsing off the E face of the dome. Several small pyroclastic flows were also produced on the NE flank and were observed flowing into the upper part of Tuitt's Ghaut. By late June, growth of the extrusion lobe on the SE side of the dome appeared to have stagnated. Rockfall activity decreased abruptly on the afternoon of 22 June and declined to very low levels during 25-28 June.
No change in dome morphology occurred during early to mid-July. Rockfall activity on the dome increased slightly on the morning of 3 July, and a small, low ash cloud drifted over Plymouth around 1000. This followed several hours of heavy rain during the night, which was associated with substantial mudflows in the center of Plymouth. Rockfalls increased slightly during 6-8 July, before decreasing to very low levels through 12 July.
Observations of the dome on 15 July suggested that dome growth was continuing at a very low rate. Growth was concentrated on the SE part of the dome, at the lobe that was active during mid- to late June. The level of rockfall activity from this active lobe increased slightly on 15 July, with a small pyroclastic flow at 0800 directed down the Tar River Valley.
A swarm of low-amplitude long-period (LP) earthquakes began on 19 July and increased in strength during the following four days. The swarm continued at an elevated level until it began to decrease slightly during 31 July-2 August.
Observations of the dome on 21 July indicated that significant growth had recommenced, with the extrusion of a new lobe on the NE side of the summit region. Growth of the new extrusion lobe gave rise to rockfalls and small pyroclastic flows off the NE flank of the dome. On the morning of 23 July a minor collapse produced small but continuous pyroclastic flows for about an hour. These mainly flowed into the upper parts of Tuitt's Ghaut and down White's Ghaut for about half the distance to the coast. A few also flowed into the upper part of the Tar River Valley. A similar event, lasting for ~20 minutes, occurred in the early hours on the morning of 26 July.
On the morning of 1 August observations revealed that the new extrusion lobe on the N side of the summit had a broad whaleback form. Growth of this lobe was directed N and, around 2-4 August, the lobe crumbled repeatedly, producing rockfalls and small pyroclastic flows in Tuitt's Ghaut. Limited activity occurred on the NW part of the dome, although one small pyroclastic flow descended the notch between the central and NW buttresses. Individual rocks also reached upper Tyre's Ghaut (behind Gage's Mountain). During 6-9 August, rockfall activity declined substantially due to the lobe becoming more coherent and not collapsing. By mid-August, talus had accumulated in the upper reaches of Tuitt's Ghaut and small pyroclastic flows occurred in both Tuitt's and White's Ghauts. The active lobe also shed more talus into the notch in the NW sector of the old dome, which leads towards Tyre's Ghaut.
Rockfall talus continued to accumulate in the upper reaches of Tuitt's Ghaut during 16-23 August, and there were overspills of talus from the N side of the Tar River Valley into the two tributaries of White's Ghaut. The NE buttress, a remnant of the old dome complex from mid-1997, was now completely buried. Erosion of the E edge of the central buttress continued. Talus continued to slowly accumulate in the notch in the NW sector of the old dome, which leads towards Tyre's Ghaut. During intense rainfall early on 21 August, a small collapse occurred in the Tar River Valley of the talus that had accumulated on the SE sector of the dome during April-May 2002.
During late August, small pyroclastic flows were mainly concentrated on the NE flank where they had been channeled into the upper reaches of Tuitt's Ghaut; although some had spilled eastwards along the N side of the Tar River Valley. Talus also continued to accumulate in the notch in the NW sector of the old dome, which leads towards Tyre's Ghaut. Torrential rainfall produced mudflows in the Belham Valley in the early hours of 28 August.
During early September, growth continued to be focused on the N side of the dome complex although it had become more centralized and the summit height now exceeded 1,050 m. Otherwise the focus of activity remained concentrated on the NE flank, with frequent rockfalls and small pyroclastic flows. Most of these were channeled into the upper reaches of Tuitt's Ghaut; although some had spilled eastwards along the N side of the Tar River Valley.
During mid-September, dome growth remained centralized, and the summit height exceeded 1,050 m. Otherwise the focus of activity remained concentrated on the E flank, with frequent rockfalls and small pyroclastic flows. Around 6-8 September most of these spilled eastwards along the N side of the Tar River Valley, although by 12-13 September activity appears to have refocused northwards onto Tuitt's Ghaut, with subordinate amounts continuing to spill eastwards into the Tar River Valley.
During the reporting interval, the daytime entry zone (DTEZ) remained open, weather permitting. MVO warned that activity could increase suddenly, with dangerous situations developing quickly. Protective masks were to be worn in ashy conditions and the Belham Valley was to be avoided during and after heavy rainfall due to the possibility of mudflows. Access was prohibited to Plymouth, Bramble airport, and points closer to the volcano; including a marine exclusion zone around the southern part of the island ~3 km beyond the coastline, extending from Trant's Bay in the E to Garibaldi Hill on the W.
Geologic Background. The complex, dominantly andesitic Soufrière Hills volcano occupies the southern half of the island of Montserrat. The summit area consists primarily of a series of lava domes emplaced along an ESE-trending zone. The volcano is flanked by Pleistocene complexes to the north and south. English's Crater, a 1-km-wide crater breached widely to the east by edifice collapse, was formed about 2000 years ago as a result of the youngest of several collapse events producing submarine debris-avalanche deposits. Block-and-ash flow and surge deposits associated with dome growth predominate in flank deposits, including those from an eruption that likely preceded the 1632 CE settlement of the island, allowing cultivation on recently devegetated land to near the summit. Non-eruptive seismic swarms occurred at 30-year intervals in the 20th century, but no historical eruptions were recorded until 1995. Long-term small-to-moderate ash eruptions beginning in that year were later accompanied by lava-dome growth and pyroclastic flows that forced evacuation of the southern half of the island and ultimately destroyed the capital city of Plymouth, causing major social and economic disruption.
Information Contacts: Montserrat Volcano Observatory (MVO), Mongo Hill, Montserrat, West Indies (URL: http://www.mvo.ms/); Washington Volcanic Ash Advisory Center (VAAC), Satellite Analysis Branch (SAB), NOAA/NESDIS E/SP23, NOAA Science Center Room 401, 5200 Auth Road, Camp Springs, MD 20746, USA (URL: http://www.ssd.noaa.gov/).
Talang (Indonesia) — September 2002 Cite this Report
Talang
Indonesia
0.979°S, 100.681°E; summit elev. 2575 m
All times are local (unless otherwise noted)
Plume reached up to 100 m above the crater during July 2002
During 17 June-28 July 2002 at Talang a generally white, thin plume rose 25-100 m above the crater and drifted E. [Throughout July the activity was described as a "white-thin ash plume."] Hot spring temperatures ranged from 43 to 64°C. No seismic data were available because of a broken seismograph. Talang remained at Alert Level 2.
Geologic Background. Talang, which forms a twin volcano with the extinct Pasar Arbaa volcano, lies ESE of the major city of Padang and rises NW of Dibawah Lake. Talang has two crater lakes on its flanks; the largest of these is 1 x 2 km wide Danau Talang. The summit exhibits fumarolic activity, but which lacks a crater. Historical eruptions have mostly involved small-to-moderate explosive activity first documented in the 19th century that originated from a series of small craters in a valley on the upper NE flank.
Information Contacts: Volcanological Survey of Indonesia (VSI), Jalan Diponegoro No. 57, Bandung 40122, Indonesia (URL: http://www.vsi.esdm.go.id/).
Tangkuban Parahu (Indonesia) — September 2002 Cite this Report
Tangkuban Parahu
Indonesia
6.77°S, 107.6°E; summit elev. 2084 m
All times are local (unless otherwise noted)
First elevated seismicity since 1992
The Volcanological Survey of Indonesia (VSI) reported that Tangkubanparahu reactivated during late August 2002. On 2 September the Alert Level was raised to 2, following an elevated number of earthquakes that were registered during the previous two weeks. The temperatures of Domas and Ratu craters increased ~2-4°C; Domas crater was at 74-93°C and Ratu crater at 95-100°C. No visual changes accompanied the temperature increase inside the craters, but several animals were found dead in Ratu crater. Seismicity totals for the week of 26 August-1 September were three deep-volcanic (A-type), 172 shallow-volcanic (B-type), and 12 tectonic earthquakes. During 2-8 September, four A-type, 224 B-type, and two tectonic earthquakes were registered.
Geologic Background. Gunung Tangkuban Parahu is a broad stratovolcano overlooking Indonesia's former capital city of Bandung. The volcano was constructed within the 6 x 8 km Pleistocene Sunda caldera, which formed about 190,000 years ago. The volcano's low profile is the subject of legends referring to the mountain of the "upturned boat." The Sunda caldera rim forms a prominent ridge on the western side; elsewhere the rim is largely buried by deposits of the current volcano. The dominantly small phreatic eruptions recorded since the 19th century have originated from several nested craters within an elliptical 1 x 1.5 km summit depression.
Information Contacts: Volcanological Survey of Indonesia (VSI), Jalan Diponegoro No. 57, Bandung 40122, Indonesia (URL: http://www.vsi.esdm.go.id/).
Witori (Papua New Guinea) — September 2002 Cite this Report
Witori
Papua New Guinea
5.5745°S, 150.5161°E; summit elev. 724 m
All times are local (unless otherwise noted)
Continued lava flows and deformation; monitoring network installed
The eruption that began at Pago on 3 August with significant ash plumes (BGVN 27:07) had produced lava flows from multiple vents NW of the main crater by early September (BGVN 27:08). This report provides additional details of fieldwork by the Japanese Disaster Relief Team noted in the last issue. Varied information from a United Nations report on 27 September has been distributed into appropriate sections below.
Observations of recent activity. The United Nations reported on 27 September that the volcano continued to emit steam and a thin vapor plume from vents near the summit and that the plume drifted to the NW over the Hoskins Peninsula. Lava continued to flow into the wider Witori Caldera basin, but was contained by its wall. Low-level seismicity and slow ground deformation along the W part of the caldera floor also continued. Monitoring about 3 km SW of the summit has shown a slight uplift.
While enroute from Kavieng to Port Moresby, Dave Innes (acting First Officer of an Air Niugini Fokker F-28, Captain Alex Porter in command) photographed Pago around 1230 on 14 September from an altitude of about 8.5 km (28,000 feet) while the volcano was quiet (figure 5). Later in the month Innes noted that the volcano had been putting out little more than "smoke," but on the 30th he and Captain Seymour (another Air Niugini F-28 commander) put in an "ash-sighting chit" when they saw that it was fairly active. He reports that the "smoke" stayed over the whole center section of the N coast of New Britain through to the following day (1 October).
The "ash-sighting chit" noted by Innes is an internal Air Niugini Volcanic Volcanic Activity Report. This is a company variation of the ICAO VAR (section one) which is separate from the formal reporting process. Crews transitting known hot-spots fill out the form, rip off the white copy (which looks like a receipt or "chit" ), and put it in a box at crewing in Port Moresby. Pilots arriving to commence flights can then see what their colleagues had seen the last time someone passed that way.
Volcano monitoring. As noted in the UN report, the assistance of technical teams from Japan and the United States was achieved through the efforts of the Rabaul Volcanological Observatory from East New Britain, which is overseeing scientific efforts. The government of Papua New Guinea (PNG) has set up a Kimbe Volcanological Observatory to coordinate the scientific work on Pago, and ultimately to monitor and evaluate the threat posed by West New Britain's three other active volcanoes.
Installing a volcanic monitoring system on Pago had been long-planned as part of a cooperative program between the U.S. Geological Survey's Volcano Disaster Assistance Program (VDAP), with funding from the Office of Foreign Disaster Assistance, and Geoscience Australia to provide assistance to PNG. However, the current eruption accelerated those plans. On 5 September, at the invitation of the PNG government a 3-person team from VDAP departed the United States with equipment for a telemetered monitoring network consisting of five seismometers (one 3-component instrument) and three real-time GPS stations. The network was installed with the assistance of personnel from the Rabaul Volcano Observatory, and the VDAP team returned on 13 October after the network was operational and sending telemetered data to the observatory in Kimbe.
Civil Defence. The following information is from a situation report issued by the United Nations Office for the Coordination of Humanitarian Affairs (OCHA) on 27 September. This report was based on information provided by OCHA's Regional Disaster Response Adviser in Kimbe, working alongside the PNG National Disaster Management Office (NDMO) and the AusAID team that is supporting the West New Britain Provincial Disaster Committee.
Of the 15,000 inhabitants of the affected part of the Hoskins Peninsula, the region close to the crater and in the arc to the NW, ~13,000 have been evacuated since early August; the remainder are still living in their villages, looking after property, and engaged in limited cultivation.
Although only a few millimeters of ash has fallen even in the worst affected areas, it is a fine volcanic ash with high silica content, which poses a serious hazard to aviation. Hoskins Airport has therefore been closed since early August, shutting off the direct link to Port Moresby and the flow of tourists that helps support the provincial economy. It is only possible to reach Kimbe by sea, or by light aircraft to Bialla and then three hours drive along the rough coast road, only passable in the dry season.
Current understanding of the risk is based on incomplete scientific evidence, and it will be at least 3 months before sufficient data can be gathered and analyzed to enable a decent hazard assessment. Consequently the Provincial Disaster Committee (PDC) has not permitted the permanent return of the evacuees to their villages. The lack of cheap transport also restricts such activities and would complicate and delay any larger scale evacuation if this became necessary. The seasonal shift in the prevailing winds during October will place another 8,000-9,000 people at risk in any future ash ejection.
National and provincial disaster managers are preparing contingency plans for three possible scenarios. The first scenario is that eruptive activity continues as at present through the wet season, with ashfall affecting a further 8,000 people; the second is that it becomes more explosive with pyroclastic flows impacting an area up to 15 km from the volcano; the worst case scenario is a caldera-forming eruption, potentially affecting up to 30,000 people within a 30 km radius.
Observations during 25 August-3 September made by the Japanese Team. The Japanese Disaster Relief Team, including two seismologists from the Japan Meteorological Agency (JMA) and a geologist from the Earthquake Research Institute, University of Tokyo, was dispatched to Pago during 25 August through 3 September 2002. Observations were carried out with support from the Rabaul Volcano Observatory (RVO) and governmental agencies of both Japan and Papua New Guinea, including the Japan International Cooperation Agency (JICA). A brief report of their observations is provided below. The Team extends their thanks to Chris Mckee, Hassan El-kherbotly, Isolde Macatol, and Ima Itikarai of RVO for their great assistance with the research activities.
On 27 August aerial inspections were made from a helicopter and a survey of air-fall tephra was done. Work the next day included the installation of a seismograph, infrared surveys from a helicopter, and field surveys of air-fall deposits. New lava was sampled on the 29th. Additional aerial inspections were accomplished on the 30th, and the seismograph was picked up. Fieldwork on 31 August consisted of sampling older lava.
During this work, the following observations were noted. 1) Two craters and four lava vents are aligned NW-SE from the middle slope NW of the Pago Central Cone to the Witori caldera. 2) New lava descending from each of the four vents forms complex lobes. The largest amount of lava erupted from the lowest vent, changing its flow direction to the NE and SW due to the caldera wall. 3) No eruption column was seen, though bluish white-colored fumarolic gas was being emitted. Sulfur was deposited on the crater rim. 4) A fault perpendicular to the crater line could be seen in the middle and W of the crater line. 5) The thickness of air-fall deposit is ~2 mm at a spot 10.5 km N of the craters (Rikau), and
A distinct thermal anomaly was observed in an infrared image at the lowest crater (figure 6), with a maximum temperature of about 350°C, indicating vigorous upwelling of lava. The lowermost part of the lava, the flow front, was also a high-temperature zone.
Seismicity was stable, but without doubt exceeds its background level, although only about 40 hours of data were recorded. Approximately 20-30 small seismic events, mainly high-frequency B-type earthquakes (BL events, predominant frequency of ~3-4 Hz), were detected per hour. The S-P time of about 1.6s and polarity of first motions suggest that the seismic waves came from the direction of the lava, possibly from near the vents. Besides these BL events, there were seismic events with more complex waveforms. They might be a succession of BL events or caused by rockfalls at the edge of the lava flows. No notable swarm-type activity occurred during the observation period.
Geologic Background. The active Pago cone has grown within the Witori caldera (5.5 x 7.5 km) on the northern coast of central New Britain contains the active Pago cone. The gently sloping outer caldera flanks consist primarily of dacitic pyroclastic-flow and airfall deposits produced during a series of five major explosive eruptions from about 5,600 to 1,200 years ago, many of which may have been associated with caldera formation. Pago cone may have formed less than 350 years ago; it has grown to a height above the caldera rim, and a series of ten dacitic lava flows from it covers much of the caldera floor. The youngest of these was erupted during 2002-2003 from vents extending from the summit nearly to the NW caldera wall. The Buru caldera cuts the SW flank.
Information Contacts: Ima Itikarai, Rabaul Volcano Observatory (RVO), PO Box 386, Rabaul, E.N.B.P., Papua New Guinea; Japanese Disaster Relief Team: Kohichi Uhira, Volcanological Division, Seismological and Volcanological Department, Japan Meteorological Agency, 1-3-4 Ote-machi, Chiyoda-ku, Tokyo 100-8122, Japan; Akimitsu Takagi, Meteorological Research Institute of Japan Meteorological Agency, 1-1 Nagamine, Tsukuba, Ibaraki 305-0052, Japan; Mitsuhiro Yoshimoto, Volcano Research Center (VRC), Earthquake Research Institute (ERI), University of Tokyo, 1130032 111, Yayoi, Bunkyoku, Tokyo (URL: http://www.eri.u-tokyo.ac.jp/VRC/index_E.html); United Nations Office for the Coordination of Humanitarian Affairs (OCHA), United Nations, New York, NY 10017 USA (URL: https://reliefweb.int/); C. Dan Miller, Volcano Disaster Assistance Program, US Geological Survey, Cascades Volcano Observatory, 1300 Southeast Cardinal Court, Building 10, Suite 100, Vancouver, Washington 98683, USA (URL: http://volcanoes.usgs.gov/); David Innes, Air Niugini, PO Box 7186, Boroko, Port Moresby, National Capital District, Papua New Guinea (URL: http://www.airniugini.com.pg/).