Recently Published Bulletin Reports
Kadovar (Papua New Guinea) An ash plume and weak thermal anomaly during May 2023
San Miguel (El Salvador) Small gas-and-ash explosions during March and May 2023
Ebeko (Russia) Continued explosions, ash plumes, and ashfall during October 2022-May 2023
Home Reef (Tonga) Discolored plumes continued during November 2022-April 2023
Semisopochnoi (United States) Occasional explosions, ash deposits, and gas-and-steam plumes during December 2022-May 2023
Ambae (Vanuatu) New lava flow, ash plumes, and sulfur dioxide plumes during February-May 2023
Ibu (Indonesia) Daily ash explosions continue, along with thermal anomalies in the crater, October 2022-May 2023
Dukono (Indonesia) Continuing ash emissions, SO2 plumes, and thermal signals during October 2022-May 2023
Sabancaya (Peru) Explosions, gas-and-ash plumes, and thermal activity persist during November 2022-April 2023
Sheveluch (Russia) Significant explosions destroyed part of the lava-dome complex during April 2023
Bezymianny (Russia) Explosions, ash plumes, lava flows, and avalanches during November 2022-April 2023
Chikurachki (Russia) New explosive eruption during late January-early February 2023
Kadovar (Papua New Guinea) — June 2023  Cite this Report
Kadovar
Papua New Guinea
3.608°S, 144.588°E; summit elev. 365 m
All times are local (unless otherwise noted)
An ash plume and weak thermal anomaly during May 2023
Kadovar is a 2-km-wide island that is the emergent summit of a Bismarck Sea stratovolcano. It lies off the coast of New Guinea, about 25 km N of the mouth of the Sepik River. Prior to an eruption that began in 2018, a lava dome formed the high point of the volcano, filling an arcuate landslide scarp open to the S. Submarine debris-avalanche deposits occur to the S of the island. The current eruption began in January 2018 and has comprised lava effusion from vents at the summit and at the E coast; more recent activity has consisted of ash plumes, weak thermal activity, and gas-and-steam plumes (BGVN 48:02). This report covers activity during February through May 2023 using information from the Darwin Volcanic Ash Advisory Center (VAAC) and satellite data.
Activity during the reporting period was relatively low and mainly consisted of white gas-and-steam plumes that were visible in natural color satellite images on clear weather days (figure 67). According to a Darwin VAAC report, at 2040 on 6 May an ash plume rose to 4.6 km altitude and drifted W; by 2300 the plume had dissipated. MODIS satellite instruments using the MODVOLC thermal algorithm detected a single thermal hotspot on the SE side of the island on 7 May. Weak thermal activity was also detected in a satellite image on the E side of the island on 14 May, accompanied by a white gas-and-steam plume that drifted SE (figure 68).
Geologic Background. The 2-km-wide island of Kadovar is the emergent summit of a Bismarck Sea stratovolcano of Holocene age. It is part of the Schouten Islands, and lies off the coast of New Guinea, about 25 km N of the mouth of the Sepik River. Prior to an eruption that began in 2018, a lava dome formed the high point of the andesitic volcano, filling an arcuate landslide scarp open to the south; submarine debris-avalanche deposits occur in that direction. Thick lava flows with columnar jointing forms low cliffs along the coast. The youthful island lacks fringing or offshore reefs. A period of heightened thermal phenomena took place in 1976. An eruption began in January 2018 that included lava effusion from vents at the summit and at the E coast.
Information Contacts: Darwin Volcanic Ash Advisory Centre (VAAC), Bureau of Meteorology, Northern Territory Regional Office, PO Box 40050, Casuarina, NT 0811, Australia (URL: http://www.bom.gov.au/info/vaac/); Hawai'i Institute of Geophysics and Planetology (HIGP) - MODVOLC Thermal Alerts System, School of Ocean and Earth Science and Technology (SOEST), Univ. of Hawai'i, 2525 Correa Road, Honolulu, HI 96822, USA (URL: http://modis.higp.hawaii.edu/); Copernicus Browser, Copernicus Data Space Ecosystem, European Space Agency (URL: https://dataspace.copernicus.eu/browser/).
San Miguel (El Salvador) — June 2023 Cite this Report
San Miguel
El Salvador
13.434°N, 88.269°W; summit elev. 2130 m
All times are local (unless otherwise noted)
Small gas-and-ash explosions during March and May 2023
San Miguel in El Salvador is a broad, deep crater complex that has been frequently modified by eruptions recorded since the early 16th century and consists of the summit known locally as Chaparrastique. Flank eruptions have produced lava flows that extended to the N, NE, and SE during the 17-19th centuries. The most recent activity has consisted of minor ash eruptions from the summit crater. The current eruption period began in November 2022 and has been characterized by frequent phreatic explosions, gas-and-ash emissions, and sulfur dioxide plumes (BGVN 47:12). This report describes small gas-and-ash explosions during December 2022 through May 2023 based on special reports from the Ministero de Medio Ambiente y Recursos Naturales (MARN).
Activity has been relatively low since the last recorded explosions on 29 November 2022. Seismicity recorded by the San Miguel Volcano Station (VSM) located on the N flank at 1.7 km elevation had decreased by 7 December. Sulfur dioxide gas measurements taken with DOAS (Differential Optical Absorption Spectroscopy) mobile equipment were below typical previously recorded values: 300 tons per day (t/d). During December, small explosions were recorded by the seismic network and manifested as gas-and-steam emissions.
Gas-and-ash explosions in the crater occurred during January 2023, which were recorded by the seismic network. Sulfur dioxide values remained low, between 300-400 t/d through 10 March. At 0817 on 14 January a gas-and-ash emission was visible in webcam images, rising just above the crater rim. Some mornings during February, small gas-and-steam plumes were visible in the crater. On 7 March at 2252 MARN noted an increase in degassing from the central crater; gas emissions were constantly observed through the early morning hours on 8 March. During the early morning of 8 March through the afternoon on 9 March, 12 emissions were registered, some accompanied by ash. The last gas-and-ash emission was recorded at 1210 on 9 March; very fine ashfall was reported in El Tránsito (10 km S), La Morita (6 km W), and La Piedrita (3 km W). The smell of sulfur was reported in Piedra Azul (5 km SW). On 16 March MARN reported that gas-and-steam emissions decreased.
Low degassing and very low seismicity were reported during April; no explosions have been detected between 9 March and 27 May. The sulfur dioxide emissions remained between 350-400 t/d; during 13-20 April sulfur dioxide values fluctuated between 30-300 t/d. Activity remained low through most of May; on 23 May seismicity increased. An explosion was detected at 1647 on 27 May generated a gas-and-ash plume that rose 700 m high (figure 32); a decrease in seismicity and gas emissions followed. The DOAS station installed on the W flank recorded sulfur dioxide values that reached 400 t/d on 27 May; subsequent measurements showed a decrease to 268 t/d on 28 May and 100 t/d on 29 May.
Geologic Background. The symmetrical cone of San Miguel, one of the most active volcanoes in El Salvador, rises from near sea level to form one of the country's most prominent landmarks. A broad, deep, crater complex that has been frequently modified by eruptions recorded since the early 16th century caps the truncated unvegetated summit, also known locally as Chaparrastique. Flanks eruptions of the basaltic-andesitic volcano have produced many lava flows, including several during the 17th-19th centuries that extended to the N, NE, and SE. The SE-flank flows are the largest and form broad, sparsely vegetated lava fields crossed by highways and a railroad skirting the base of the volcano. Flank vent locations have migrated higher on the edifice during historical time, and the most recent activity has consisted of minor ash eruptions from the summit crater.
Information Contacts: Ministero de Medio Ambiente y Recursos Naturales (MARN), Km. 5½ Carretera a Nueva San Salvador, Avenida las Mercedes, San Salvador, El Salvador (URL: http://www.snet.gob.sv/ver/vulcanologia).
Ebeko
Russia
50.686°N, 156.014°E; summit elev. 1103 m
All times are local (unless otherwise noted)
Continued explosions, ash plumes, and ashfall during October 2022-May 2023
Ebeko, located on the N end of Paramushir Island in the Kuril Islands, consists of three summit craters along a SSW-NNE line at the northern end of a complex of five volcanic cones. Eruptions date back to the late 18th century and have been characterized as small-to-moderate explosions from the summit crater, accompanied by intense fumarolic activity. The current eruption period began in June 2022 and has recently consisted of frequent explosions, ash plumes, and thermal activity (BGVN 47:10). This report covers similar activity during October 2022 through May 2023, based on information from the Kamchatka Volcanic Eruptions Response Team (KVERT) and satellite data.
Activity during October consisted of explosive activity, ash plumes, and occasional thermal anomalies. Visual data by volcanologists from Severo-Kurilsk showed explosions producing ash clouds up to 2.1-3 km altitude which drifted E, N, NE, and SE during 1-8, 10, 16, and 18 October. KVERT issued several Volcano Observatory Notices for Aviation (VONA) on 7, 13-15, and 27 October 2022, stating that explosions generated ash plumes that rose to 2.3-4 km altitude and drifted 5 km E, NE, and SE. Ashfall was reported in Severo-Kurilsk (Paramushir Island, about 7 km E) on 7 and 13 October. Satellite data showed a thermal anomaly over the volcano on 15-16 October. Visual data showed ash plumes rising to 2.5-3.6 km altitude on 22, 25-29, and 31 October and moving NE due to constant explosions.
Similar activity continued during November, with explosions, ash plumes, and ashfall occurring. KVERT issued VONAs on 1-2, 4, 6-7, 9, 13, and 16 November that reported explosions and resulting ash plumes that rose to 1.7-3.6 km altitude and drifted 3-5 km SE, ESE, E, and NE. On 1 November ash plumes extended as far as 110 km SE. On 5, 8, 12, and 24-25 November explosions and ash plumes rose to 2-3.1 km altitude and drifted N and E. Ashfall was observed in Severo-Kurilsk on 7 and 16 November. A thermal anomaly was visible during 1-4, 16, and 20 November. Explosions during 26 November rose as high as 2.7 km altitude and drifted NE (figure 45).
Explosions and ash plumes continued to occur in December. During 1-2 and 4 December volcanologists from Severo-Kurilsk observed explosions that sent ash to 1.9-2.5 km altitude and drifted NE and SE (figure 46). VONAs were issued on 5, 9, and 16 December reporting that explosions generated ash plumes rising to 1.9 km, 2.6 km, and 2.4 km altitude and drifted 5 km SE, E, and NE, respectively. A thermal anomaly was visible in satellite imagery on 16 December. On 18 and 27-28 December explosions produced ash plumes that rose to 2.5 km altitude and drifted NE and SE. On 31 December an ash plume rose to 2 km altitude and drifted NE.
Explosions continued during January 2023, based on visual observations by volcanologists from Severo-Kurilsk. During 1-7 January explosions generated ash plumes that rose to 4 km altitude and drifted NE, E, W, and SE. According to VONAs issued by KVERT on 2, 4, 10, and 23 January, explosions produced ash plumes that rose to 2-4 km altitude and drifted 5 km N, NE, E, and ENE; the ash plume that rose to 4 km altitude occurred on 10 January (figure 47). Satellite data showed a thermal anomaly during 3-4, 10, 13, 16, 21, 22, and 31 January. KVERT reported that an ash cloud on 4 January moved 12 km NE. On 6 and 9-11 January explosions sent ash plumes to 4.5 km altitude and drifted W and ESE. On 13 January an ash plume rose to 3 km altitude and drifted SE. During 20-24 January ash plumes from explosions rose to 3.7 km altitude and drifted SE, N, and NE. On 21 January the ash plume drifted as far as 40 km NE. During 28-29 and 31 January and 1 February ash plumes rose to 4 km altitude and drifted NE.
During February, explosions, ash plumes, and ashfall were reported. During 1, 4-5 and 7-8 February explosions generated ash plumes that rose to 4.5 km altitude and drifted E and NE; ashfall was observed on 5 and 8 February. On 6 February an explosion produced an ash plume that rose to 3 km altitude and drifted 7 km E, causing ashfall in Severo-Kurilsk. A thermal anomaly was visible in satellite data on 8, 9, 13, and 21 February. Explosions on 9 and 12-13 February produced ash plumes that rose to 4 km altitude and drifted E and NE; the ash cloud on 12 February extended as far as 45 km E. On 22 February explosions sent ash to 3 km altitude that drifted E. During 24 and 26-27 February ash plumes rose to 4 km altitude and drifted E. On 28 February an explosion sent ash to 2.5-3 km altitude and drifted 5 km E; ashfall was observed in Severo-Kurilsk.
Activity continued during March; visual observations showed that explosions generated ash plumes that rose to 3.6 km altitude on 3, 5-7, and 9-12 March and drifted E, NE, and NW. Thermal anomalies were visible on 10, 13, and 29-30 March in satellite imagery. On 18, 21-23, 26, and 29-30 March explosions produced ash plumes that rose to 2.8 km altitude and drifted NE and E; the ash plumes during 22-23 March extended up to 76 km E. A VONA issued on 21 March reported an explosion that produced an ash plume that rose to 2.8 km altitude and drifted 5 km E. Another VONA issued on 23 March reported that satellite data showed an ash plume rising to 3 km altitude and drifted 14 km E.
Explosions during April continued to generate ash plumes. On 1 and 4 April an ash plume rose to 2.8-3.5 km altitude and drifted SE and NE. A thermal anomaly was visible in satellite imagery during 1-6 April. Satellite data showed ash plumes and clouds rising to 2-3 km altitude and drifting up to 12 km SW and E on 3 and 6 April (figure 48). KVERT issued VONAs on 3, 5, 14, 16 April describing explosions that produced ash plumes rising to 3 km, 3.5 km, 3.5 km, and 3 km altitude and drifting 5 km S, 5 km NE and SE, 72 km NNE, and 5 km NE, respectively. According to satellite data, the resulting ash cloud from the explosion on 14 April was 25 x 7 km in size and drifted 72-104 km NNE during 14-15 April. According to visual data by volcanologists from Severo-Kurilsk explosions sent ash up to 3.5 km altitude that drifted NE and E during 15-16, 22, 25-26, and 29 April.
The explosive eruption continued during May. Explosions during 3-4, 6-7, and 9-10 May generated ash plumes that rose to 4 km altitude and drifted SW and E. Satellite data showed a thermal anomaly on 3, 9, 13-14, and 24 May. During 12-16, 23-25, and 27-28 May ash plumes rose to 3.5 km altitude and drifted in different directions due to explosions. Two VONA notices were issued on 16 and 25 May, describing explosions that generated ash plumes rising to 3 km and 3.5 km altitude, respectively and extending 5 km E. The ash cloud on 25 May drifted 75 km SE.
Thermal activity in the summit crater, occasionally accompanied by ash plumes and ash deposits on the SE and E flanks due to frequent explosions, were visible in infrared and true color satellite images (figure 49).
Geologic Background. The flat-topped summit of the central cone of Ebeko volcano, one of the most active in the Kuril Islands, occupies the northern end of Paramushir Island. Three summit craters located along a SSW-NNE line form Ebeko volcano proper, at the northern end of a complex of five volcanic cones. Blocky lava flows extend west from Ebeko and SE from the neighboring Nezametnyi cone. The eastern part of the southern crater contains strong solfataras and a large boiling spring. The central crater is filled by a lake about 20 m deep whose shores are lined with steaming solfataras; the northern crater lies across a narrow, low barrier from the central crater and contains a small, cold crescentic lake. Historical activity, recorded since the late-18th century, has been restricted to small-to-moderate explosive eruptions from the summit craters. Intense fumarolic activity occurs in the summit craters, on the outer flanks of the cone, and in lateral explosion craters.
Information Contacts: Kamchatka Volcanic Eruptions Response Team (KVERT), Far Eastern Branch, Russian Academy of Sciences, 9 Piip Blvd., Petropavlovsk-Kamchatsky, 683006, Russia (URL: http://www.kscnet.ru/ivs/kvert/); MIROVA (Middle InfraRed Observation of Volcanic Activity), a collaborative project between the Universities of Turin and Florence (Italy) supported by the Centre for Volcanic Risk of the Italian Civil Protection Department (URL: http://www.mirovaweb.it/); Copernicus Browser, Copernicus Data Space Ecosystem, European Space Agency (URL: https://dataspace.copernicus.eu/browser/).
Home Reef
Tonga
18.992°S, 174.775°W; summit elev. -10 m
All times are local (unless otherwise noted)
Discolored plumes continued during November 2022-April 2023
Home Reef is a submarine volcano located in the central Tonga islands between Lateiki (Metis Shoal) and Late Island. The first recorded eruption occurred in the mid-19th century, when an ephemeral island formed. An eruption in 1984 produced a 12-km-high eruption plume, a large volume of floating pumice, and an ephemeral island 500 x 1,500 m wide, with cliffs 30-50 m high that enclosed a water-filled crater. Another island-forming eruption in 2006 produced widespread pumice rafts that drifted as far as Australia; by 2008 the island had eroded below sea level. The previous eruption occurred during October 2022 and was characterized by a new island-forming eruption, lava effusion, ash plumes, discolored water, and gas-and-steam plumes (BGVN 47:11). This report covers discolored water plumes during November 2022 through April 2023 using satellite data.
Discolored plumes continued during the reporting period and were observed in true color satellite images on clear weather days. Satellite images show light green-yellow discolored water extending W on 8 and 28 November 2022 (figure 31), and SW on 18 November. Light green-yellow plumes extended W on 3 December, S on 13 December, SW on 18 December, and W and S on 23 December (figure 31). On 12 January 2023 discolored green-yellow plumes extended to the NE, E, SE, and N. The plume moved SE on 17 January and NW on 22 January. Faint discolored water in February was visible moving NE on 1 February. A discolored plume extended NW on 8 and 28 March and NW on 13 March (figure 31). During April, clear weather showed green-blue discolored plumes moving S on 2 April, W on 7 April, and NE and S on 12 April. A strong green-yellow discolored plume extended E and NE on 22 April for several kilometers (figure 31).
Geologic Background. Home Reef, a submarine volcano midway between Metis Shoal and Late Island in the central Tonga islands, was first reported active in the mid-19th century, when an ephemeral island formed. An eruption in 1984 produced a 12-km-high eruption plume, large amounts of floating pumice, and an ephemeral 500 x 1,500 m island, with cliffs 30-50 m high that enclosed a water-filled crater. In 2006 an island-forming eruption produced widespread dacitic pumice rafts that drifted as far as Australia. Another island was built during a September-October 2022 eruption.
Information Contacts: Copernicus Browser, Copernicus Data Space Ecosystem, European Space Agency (URL: https://dataspace.copernicus.eu/browser/).
Semisopochnoi (United States) — June 2023 Cite this Report
Semisopochnoi
United States
51.93°N, 179.58°E; summit elev. 1221 m
All times are local (unless otherwise noted)
Occasional explosions, ash deposits, and gas-and-steam plumes during December 2022-May 2023
Semisopochnoi is located in the western Aleutians, is 20-km-wide at sea level, and contains an 8-km-wide caldera. The three-peaked Mount Young (formerly Cerberus) was constructed within the caldera during the Holocene. Each of these peaks contains a summit crater; the lava flows on the N flank appear younger than those on the S side. The current eruption period began in early February 2021 and has more recently consisted of intermittent explosions and ash emissions (BGVN 47:12). This report updates activity during December 2022 through May 2023 using daily, weekly, and special reports from the Alaska Volcano Observatory (AVO). AVO monitors the volcano using local seismic and infrasound sensors, satellite data, web cameras, and remote infrasound and lightning networks.
Activity during most of December 2022 was relatively quiet; according to AVO no eruptive or explosive activity was observed since 7 November 2022. Intermittent tremor and occasional small earthquakes were observed in geophysical data. Continuous gas-and-steam emissions were observed from the N crater of Mount Young in webcam images on clear weather days (figure 25). On 24 December, there was a slight increase in earthquake activity and several small possible explosion signals were detected in infrasound data. Eruptive activity resumed on 27 December at the N crater of Mount Young; AVO issued a Volcano Activity Notice (VAN) that reported minor ash deposits on the flanks of Mount Young that extended as far as 1 km from the vent, according to webcam images taken during 27-28 December (figure 26). No ash plumes were observed in webcam or satellite imagery, but a persistent gas-and-steam plume that might have contained some ash rose to 1.5 km altitude. As a result, AVO raised the Aviation Color Code (ACC) to Orange (the second highest level on a four-color scale) and the Volcano Alert Level (VAL) to Watch (the second highest level on a four-level scale). Possible explosions were detected during 21 December 2022 through 1 January 2023 and seismic tremor was recorded during 30-31 December.
During January 2023 eruptive activity continued at the active N crater of Mount Young. Minor ash deposits were observed on the flanks, extending about 2 km SSW, based on webcam images from 1 and 3 January. A possible explosion occurred during 1-2 January based on elevated seismicity recorded on local seismometers and an infrasound signal recorded minutes later by an array at Adak. Though no ash plumes were observed in webcam or satellite imagery, a persistent gas-and-steam plume rose to 1.5 km altitude that might have carried minor traces of ash. Ash deposits were accompanied by periods of elevated seismicity and infrasound signals from the local geophysical network, which AVO reported were likely due to weak explosive activity. Low-level explosive activity was also detected during 2-3 January, with minor gas-and-steam emissions and a new ash deposit that was visible in webcam images. Low-level explosive activity was detected in geophysical data during 4-5 January, with elevated seismicity and infrasound signals observed on local stations. Volcanic tremor was detected during 7-9 January and very weak explosive activity was detected in seismic and infrasound data on 9 January. Weak seismic and infrasound signals were recorded on 17 January, which indicated minor explosive activity, but no ash emissions were observed in clear webcam images; a gas-and-steam plume continued to rise to 1.5 km altitude. During 29-30 January, ash deposits near the summit were observed on fresh snow, according to webcam images.
The active N cone at Mount Young continued to produce a gas-and-steam plume during February, but no ash emissions or explosive events were detected. Seismicity remained elevated with faint tremor during early February. Gas-and-steam emissions from the N crater were observed in clear webcam images on 11-13 and 16 February; no explosive activity was detected in seismic, infrasound, or satellite data. Seismicity has also decreased, with no significant seismic tremor observed since 25 January. Therefore, the ACC was lowered to Yellow (the second lowest level on a four-color scale) and the VAL was lowered to Advisory (the second lowest level on a four-color scale) on 22 February.
Gas-and-steam emissions persisted during March from the N cone of Mount Young, based on clear webcam images. A few brief episodes of weak tremor were detected in seismic data, although seismicity decreased over the month. A gas-and-steam plume detected in satellite data extended 150 km on 18 March. Low-level ash emissions from the N cone at Mount Young were observed in several webcam images during 18-19 March, in addition to small explosions and volcanic tremor. The ACC was raised to Orange and the VAL increased to Watch on 19 March. A small explosion was detected in seismic and infrasound data on 21 March.
Low-level unrest continued during April, although cloudy weather often obscured views of the summit; periods of seismic tremor and local earthquakes were recorded. During 3-4 April a gas-and-steam plume was visible traveling more than 200 km overnight; no ash was evident in the plume, according to AVO. A gas-and-steam plume was observed during 4-6 April that extended 400 km but did not seem to contain ash. Small explosions were detected in seismic and infrasound data on 5 April. Occasional clear webcam images showed continuing gas-and-steam emissions rose from Mount Young, but no ash deposits were observed on the snow. On 19 April small explosions and tremor were detected in seismic and infrasound data. A period of seismic tremor was detected during 22-25 April, with possible weak explosions on 25 April. Ash deposits were visible near the crater rim, but it was unclear if these deposits were recent or due to older deposits.
Occasional small earthquakes were recorded during May, but there were no signs of explosive activity seen in geophysical data. Gas-and-steam emissions continued from the N crater of Mount Young, based on webcam images, and seismicity remained slightly elevated. A new, light ash deposit was visible during the morning of 5 May on fresh snow on the NW flank of Mount Young. During 10 May periods of volcanic tremor were observed. The ACC was lowered to Yellow and the VAL to Advisory on 17 May due to no additional evidence of activity.
Geologic Background. Semisopochnoi, the largest subaerial volcano of the western Aleutians, is 20 km wide at sea level and contains an 8-km-wide caldera. It formed as a result of collapse of a low-angle, dominantly basaltic volcano following the eruption of a large volume of dacitic pumice. The high point of the island is Anvil Peak, a double-peaked late-Pleistocene cone that forms much of the island's northern part. The three-peaked Mount Cerberus (renamed Mount Young in 2023) was constructed within the caldera during the Holocene. Each of the peaks contains a summit crater; lava flows on the N flank appear younger than those on the south side. Other post-caldera volcanoes include the symmetrical Sugarloaf Peak SSE of the caldera and Lakeshore Cone, a small cinder cone at the edge of Fenner Lake in the NE part of the caldera. Most documented eruptions have originated from Young, although Coats (1950) considered that both Sugarloaf and Lakeshore Cone could have been recently active.
Information Contacts: Alaska Volcano Observatory (AVO), a cooperative program of a) U.S. Geological Survey, 4200 University Drive, Anchorage, AK 99508-4667 USA (URL: https://avo.alaska.edu/), b) Geophysical Institute, University of Alaska, PO Box 757320, Fairbanks, AK 99775-7320, USA, and c) Alaska Division of Geological & Geophysical Surveys, 794 University Ave., Suite 200, Fairbanks, AK 99709, USA (URL: http://dggs.alaska.gov/).
Ambae
Vanuatu
15.389°S, 167.835°E; summit elev. 1496 m
All times are local (unless otherwise noted)
New lava flow, ash plumes, and sulfur dioxide plumes during February-May 2023
Ambae, also known as Aoba, is a large basaltic shield volcano in Vanuatu. A broad pyroclastic cone containing three crater lakes (Manaro Ngoru, Voui, and Manaro Lakua) is located at the summit within the youngest of at least two nested calderas. Periodic phreatic and pyroclastic explosions have been reported since the 16th century. A large eruption more than 400 years ago resulted in a volcanic cone within the summit crater that is now filled by Lake Voui; the similarly sized Lake Manaro fills the western third of the caldera. The previous eruption ended in August 2022 that was characterized by gas-and-steam and ash emissions and explosions of wet tephra (BGVN 47:10). This report covers a new eruption during February through May 2023 that consisted of a new lava flow, ash plumes, and sulfur dioxide emissions, using information from the Vanuatu Meteorology and Geo-Hazards Department (VMGD) and satellite data.
During the reporting period, the Alert Level remained at a 2 (on a scale of 0-5), which has been in place since December 2021. Activity during October 2022 through March 2023 remained relatively low and mostly consisted of gas-and-steam emissions in Lake Voui. VMGD reported that at 1300 on 15 November a satellite image captured a strong amount of sulfur dioxide rising above the volcano (figure 99), and that seismicity slightly increased. The southern and northern part of the island reported a strong sulfur dioxide smell and heard explosions. On 20 February 2023 a gas-and-ash plume rose 1.3 km above the summit and drifted SSW, according to a webcam image (figure 100). Gas-and-steam and possibly ash emissions continued on 23 February and volcanic earthquakes were recorded by the seismic network.
During April, volcanic earthquakes and gas-and-steam and ash emissions were reported from the cone in Lake Voui. VMGD reported that activity increased during 5-7 April; high gas-and-steam and ash plumes were visible, accompanied by nighttime incandescence. According to a Wellington VAAC report, a low-level ash plume rose as high as 2.5 km above the summit and drifted W and SW on 5 April, based on satellite imagery. Reports in Saratamata stated that a dark ash plume drifted to the WSW, but no loud explosion was heard. Webcam images from 2100 showed incandescence above the crater and reflected in the clouds. According to an aerial survey, field observations, and satellite data, water was no longer present in the lake. A lava flow was reported effusing from the vent and traveling N into the dry Lake Voui, which lasted three days. The next morning at 0745 on 6 April a gas-and-steam and ash plume rose 5.4 km above the summit and drifted ESE, based on information from VMGD (figure 101). The Wellington VAAC also reported that light ashfall was observed on the island. Intermittent gas-and-steam and ash emissions were visible on 7 April, some of which rose to an estimated 3 km above the summit and drifted E. Webcam images during 0107-0730 on 7 April showed continuing ash emissions. A gas-and-steam and ash plume rose 695 m above the summit crater at 0730 on 19 April and drifted ESE, based on a webcam image (figure 102).
According to visual and infrared satellite data, water was visible in Lake Voui as late as 24 March 2023 (figure 103). The vent in the caldera showed a gas-and-steam plume drifted SE. On 3 April thermal activity was first detected, accompanied by a gas-and-ash plume that drifted W (figure 103). The lava flow moved N within the dry lake and was shown cooling by 8 April. By 23 April much of the water in the lake had returned. Occasional sulfur dioxide plumes were detected by the TROPOMI instrument on the Sentinel-5P satellite that exceeded 2 Dobson Units (DU) and drifted in different directions (figure 104).
Geologic Background. The island of Ambae, also known as Aoba, is a massive 2,500 km3 basaltic shield that is the most voluminous volcano of the New Hebrides archipelago. A pronounced NE-SW-trending rift zone with numerous scoria cones gives the 16 x 38 km island an elongated form. A broad pyroclastic cone containing three crater lakes (Manaro Ngoru, Voui, and Manaro Lakua) is located at the summit within the youngest of at least two nested calderas, the largest of which is 6 km in diameter. That large central edifice is also called Manaro Voui or Lombenben volcano. Post-caldera explosive eruptions formed the summit craters about 360 years ago. A tuff cone was constructed within Lake Voui (or Vui) about 60 years later. The latest known flank eruption, about 300 years ago, destroyed the population of the Nduindui area near the western coast.
Information Contacts: Geo-Hazards Division, Vanuatu Meteorology and Geo-Hazards Department (VMGD), Ministry of Climate Change Adaptation, Meteorology, Geo-Hazards, Energy, Environment and Disaster Management, Private Mail Bag 9054, Lini Highway, Port Vila, Vanuatu (URL: http://www.vmgd.gov.vu/, https://www.facebook.com/VanuatuGeohazardsObservatory/); Wellington Volcanic Ash Advisory Centre (VAAC), Meteorological Service of New Zealand Ltd (MetService), PO Box 722, Wellington, New Zealand (URL: http://www.metservice.com/vaac/, http://www.ssd.noaa.gov/VAAC/OTH/NZ/messages.html); MIROVA (Middle InfraRed Observation of Volcanic Activity), a collaborative project between the Universities of Turin and Florence (Italy) supported by the Centre for Volcanic Risk of the Italian Civil Protection Department (URL: http://www.mirovaweb.it/); Global Sulfur Dioxide Monitoring Page, Atmospheric Chemistry and Dynamics Laboratory, NASA Goddard Space Flight Center (NASA/GSFC), 8800 Greenbelt Road, Goddard, Maryland, USA (URL: https://so2.gsfc.nasa.gov/); Copernicus Browser, Copernicus Data Space Ecosystem, European Space Agency (URL: https://dataspace.copernicus.eu/browser/).
Ibu
Indonesia
1.488°N, 127.63°E; summit elev. 1325 m
All times are local (unless otherwise noted)
Daily ash explosions continue, along with thermal anomalies in the crater, October 2022-May 2023
Persistent eruptive activity since April 2008 at Ibu, a stratovolcano on Indonesian’s Halmahera Island, has consisted of daily explosive ash emissions and plumes, along with observations of thermal anomalies (BGVN 47:04). The current eruption continued during October 2022-May 2023, described below, based on advisories issued by the Pusat Vulkanologi dan Mitigasi Bencana Geologi (PVMBG, also known as Indonesian Center for Volcanology and Geological Hazard Mitigation, CVGHM), daily reports by MAGMA Indonesia (a PVMBG platform), and the Darwin Volcanic Ash Advisory Centre (VAAC), and various satellite data. The Alert Level during the reporting period remained at 2 (on a scale of 1-4), except raised briefly to 3 on 27 May, and the public was warned to stay at least 2 km away from the active crater and 3.5 km away on the N side of the volcano.
According to MAGMA Indonesia, during October 2022-May 2023, daily gray-and-white ash plumes of variable densities rose 200-1,000 m above the summit and drifted in multiple directions. On 30 October and 11 November, plumes rose a maximum of 2 km and 1.5 km above the summit, respectively (figures 42 and 43). According to the Darwin VAAC, discrete ash emissions on 13 November rose to 2.1 km altitude, or 800 m above the summit, and drifted W, and multiple ash emissions on 15 November rose 1.4 km above the summit and drifted NE. Occasional larger ash explosions through May 2023 prompted PVMBG to issue Volcano Observatory Notice for Aviation (VONA) alerts (table 6); the Aviation Color Code remained at Orange throughout this period.
Table 6. Volcano Observatory Notice for Aviation (VONA) ash plume alerts for Ibu issued by PVMBG during October 2022-May 2023. Maximum height above the summit was estimated by a ground observer. VONAs in January-May 2023 all described the ash plumes as dense.
| Date |
Time (local) |
Max height above summit |
Direction |
| 17 Oct 2022 |
0858 |
800 m |
SW |
| 18 Oct 2022 |
1425 |
800 m |
S |
| 19 Oct 2022 |
2017 |
600 m |
SW |
| 21 Oct 2022 |
0916 |
800 m |
NW |
| 16 Jan 2023 |
1959 |
600 m |
NE |
| 22 Jan 2023 |
0942 |
1,000 m |
E |
| 29 Jan 2023 |
2138 |
1,000 m |
E |
| 10 May 2023 |
0940 |
800 m |
NW |
| 10 May 2023 |
2035 |
600 m |
E |
| 21 May 2023 |
2021 |
600 m |
W |
| 21 May 2023 |
2140 |
1,000 m |
W |
| 29 May 2023 |
1342 |
800 m |
N |
| 31 May 2023 |
1011 |
1,000 m |
SW |
Sentinel-2 L1C satellite images throughout the reporting period show two, sometimes three persistent thermal anomalies in the summit crater, with the most prominent hotspot from the top of a cone within the crater. Clear views were more common during March-April 2023, when a vent and lava flows on the NE flank of the intra-crater cone could be distinguished (figure 44). White-to-grayish emissions were also observed during brief periods when weather clouds allowed clear views.
The MIROVA space-based volcano hotspot detection system recorded almost daily thermal anomalies throughout the reporting period, though cloud cover often interfered with detections. Data from imaging spectroradiometers aboard NASA’s Aqua and Terra satellites and processed using the MODVOLC algorithm (MODIS-MODVOLC) recorded hotspots on one day during October 2022 and December 2022, two days in April 2023, three days in November 2022 and May 2023, and four days in March 2023.
Geologic Background. The truncated summit of Gunung Ibu stratovolcano along the NW coast of Halmahera Island has large nested summit craters. The inner crater, 1 km wide and 400 m deep, has contained several small crater lakes. The 1.2-km-wide outer crater is breached on the N, creating a steep-walled valley. A large cone grew ENE of the summit, and a smaller one to the WSW has fed a lava flow down the W flank. A group of maars is located below the N and W flanks. The first observed and recorded eruption was a small explosion from the summit crater in 1911. Eruptive activity began again in December 1998, producing a lava dome that eventually covered much of the floor of the inner summit crater along with ongoing explosive ash emissions.
Information Contacts: Pusat Vulkanologi dan Mitigasi Bencana Geologi (PVMBG, also known as Indonesian Center for Volcanology and Geological Hazard Mitigation, CVGHM), Jalan Diponegoro 57, Bandung 40122, Indonesia (URL: http://www.vsi.esdm.go.id/); MAGMA Indonesia (Multiplatform Application for Geohazard Mitigation and Assessment in Indonesia), Kementerian Energi dan Sumber Daya Mineral (URL: https://magma.esdm.go.id/v1); Copernicus Browser, Copernicus Data Space Ecosystem, European Space Agency (URL: https://dataspace.copernicus.eu/browser/); MIROVA (Middle InfraRed Observation of Volcanic Activity), a collaborative project between the Universities of Turin and Florence (Italy) supported by the Centre for Volcanic Risk of the Italian Civil Protection Department (URL: http://www.mirovaweb.it/); Hawai'i Institute of Geophysics and Planetology (HIGP) - MODVOLC Thermal Alerts System, School of Ocean and Earth Science and Technology (SOEST), Univ. of Hawai'i, 2525 Correa Road, Honolulu, HI 96822, USA (URL: http://modis.higp.hawaii.edu/).
Dukono
Indonesia
1.6992°N, 127.8783°E; summit elev. 1273 m
All times are local (unless otherwise noted)
Continuing ash emissions, SO2 plumes, and thermal signals during October 2022-May 2023
Dukono, a remote volcano on Indonesia’s Halmahera Island, has been erupting continuously since 1933, with frequent ash explosions and sulfur dioxide plumes (BGVN 46:11, 47:10). This activity continued during October 2022 through May 2023, based on reports from the Pusat Vulkanologi dan Mitigasi Bencana Geologi (PVMBG; also known as Indonesian Center for Volcanology and Geological Hazard Mitigation, CVGHM), the Darwin Volcanic Ash Advisory Centre (VAAC), and satellite data. During this period, the Alert Level remained at 2 (on a scale of 1-4) and the public was warned to remain outside of the 2-km exclusion zone. The highest reported plume of the period reached 9.4 km above the summit on 14 November 2022.
According to MAGMA Indonesia (a platform developed by PVMBG), white, gray, or dark plumes of variable densities were observed almost every day during the reporting period, except when fog obscured the volcano (figure 33). Plumes generally rose 25-450 m above the summit, but rose as high as 700-800 m on several days, somewhat lower than the maximum heights reached earlier in 2022 when plumes reached as high as 1 km. However, the Darwin VAAC reported that on 14 November 2022, a discrete ash plume rose 9.4 km above the summit (10.7 km altitude), accompanied by a strong hotspot and a sulfur dioxide signal observed in satellite imagery; a continuous ash plume that day and through the 15th rose to 2.1-2.4 km altitude and drifted NE.
Sentinel-2 images were obscured by weather clouds almost every viewing day during the reporting period. However, the few reasonably clear images showed a hotspot and white or gray emissions and plumes. Strong SO2 plumes from Dukono were present on many days during October 2022-May 2023, as detected using the TROPOMI instrument on the Sentinel-5P satellite (figure 34).
Geologic Background. Reports from this remote volcano in northernmost Halmahera are rare, but Dukono has been one of Indonesia's most active volcanoes. More-or-less continuous explosive eruptions, sometimes accompanied by lava flows, have occurred since 1933. During a major eruption in 1550 CE, a lava flow filled in the strait between Halmahera and the N-flank Gunung Mamuya cone. This complex volcano presents a broad, low profile with multiple summit peaks and overlapping craters. Malupang Wariang, 1 km SW of the summit crater complex, contains a 700 x 570 m crater that has also been active during historical time.
Information Contacts: Pusat Vulkanologi dan Mitigasi Bencana Geologi (PVMBG, also known as Indonesian Center for Volcanology and Geological Hazard Mitigation, CVGHM), Jalan Diponegoro 57, Bandung 40122, Indonesia (URL: http://www.vsi.esdm.go.id/); MAGMA Indonesia (Multiplatform Application for Geohazard Mitigation and Assessment in Indonesia), Kementerian Energi dan Sumber Daya Mineral (URL: https://magma.esdm.go.id/v1); Darwin Volcanic Ash Advisory Centre (VAAC), Bureau of Meteorology, Northern Territory Regional Office, PO Box 40050, Casuarina, NT 0811, Australia (URL: http://www.bom.gov.au/info/vaac/); NASA Global Sulfur Dioxide Monitoring Page, Atmospheric Chemistry and Dynamics Laboratory, NASA Goddard Space Flight Center (NASA/GSFC), 8800 Greenbelt Road, Goddard, Maryland, USA (URL: https://so2.gsfc.nasa.gov/); Sentinel Hub Playground (URL: https://www.sentinel-hub.com/explore/sentinel-playground).
Sabancaya
Peru
15.787°S, 71.857°W; summit elev. 5960 m
All times are local (unless otherwise noted)
Explosions, gas-and-ash plumes, and thermal activity persist during November 2022-April 2023
Sabancaya is located in Peru, NE of Ampato and SE of Hualca Hualca. Eruptions date back to 1750 and have been characterized by explosions, phreatic activity, ash plumes, and ashfall. The current eruption period began in November 2016 and has more recently consisted of daily explosions, gas-and-ash plumes, and thermal activity (BGVN 47:11). This report updates activity during November 2022 through April 2023 using information from Instituto Geophysico del Peru (IGP) that use weekly activity reports and various satellite data.
Intermittent low-to-moderate power thermal anomalies were reported by the MIROVA project during November 2022 through April 2023 (figure 119). There were few short gaps in thermal activity during mid-December 2022, late December-to-early January 2023, late January to mid-February, and late February. According to data recorded by the MODVOLC thermal algorithm, there were a total of eight thermal hotspots: three in November 2022, three in February 2023, one in March, and one in April. On clear weather days, some of this thermal anomaly was visible in infrared satellite imagery showing the active lava dome in the summit crater (figure 120). Almost daily moderate-to-strong sulfur dioxide plumes were recorded during the reporting period by the TROPOMI instrument on the Sentinel-5P satellite (figure 121). Many of these plumes exceeded 2 Dobson Units (DU) and drifted in multiple directions.
IGP reported that moderate activity during November and December 2022 continued; during November, an average number of explosions were reported each week: 30, 33, 36, and 35, and during December, it was 32, 40, 47, 52, and 67. Gas-and-ash plumes in November rose 3-3.5 km above the summit and drifted E, NE, SE, S, N, W, and SW. During December the gas-and-ash plumes rose 2-4 km above the summit and drifted in different directions. There were 1,259 volcanic earthquakes recorded during November and 1,693 during December. Seismicity also included volcano-tectonic-type events that indicate rock fracturing events. Slight inflation was observed in the N part of the volcano near Hualca Hualca (4 km N). Thermal activity was frequently reported in the crater at the active lava dome (figure 120).
Explosive activity continued during January and February 2023. The average number of explosions were reported each week during January (51, 50, 60, and 59) and February (43, 54, 51, and 50). Gas-and-ash plumes rose 1.6-2.9 km above the summit and drifted NW, SW, and W during January and rose 1.4-2.8 above the summit and drifted W, SW, E, SE, N, S, NW, and NE during February. IGP also detected 1,881 volcanic earthquakes during January and 1,661 during February. VT-type earthquakes were also reported. Minor inflation persisted near Hualca Hualca. Satellite imagery showed continuous thermal activity in the crater at the lava dome (figure 120).
During March, the average number of explosions each week was 46, 48, 31, 35, and 22 and during April, it was 29, 41, 31, and 27. Accompanying gas-and-ash plumes rose 1.7-2.6 km above the summit crater and drifted W, SW, NW, S, and SE during March. According to a Buenos Aires Volcano Ash Advisory Center (VAAC) notice, on 22 March at 1800 through 23 March an ash plume rose to 7 km altitude and drifted NW. By 0430 an ash plume rose to 7.6 km altitude and drifted W. On 24 and 26 March continuous ash emissions rose to 7.3 km altitude and drifted SW and on 28 March ash emissions rose to 7.6 km altitude. During April, gas-and-ash plumes rose 1.6-2.5 km above the summit and drifted W, SW, S, NW, NE, and E. Frequent volcanic earthquakes were recorded, with 1,828 in March and 1,077 in April, in addition to VT-type events. Thermal activity continued to be reported in the summit crater at the lava dome (figure 120).
Geologic Background. Sabancaya, located in the saddle NE of Ampato and SE of Hualca Hualca volcanoes, is the youngest of these volcanic centers and the only one to have erupted in historical time. The oldest of the three, Nevado Hualca Hualca, is of probable late-Pliocene to early Pleistocene age. The name Sabancaya (meaning "tongue of fire" in the Quechua language) first appeared in records in 1595 CE, suggesting activity prior to that date. Holocene activity has consisted of Plinian eruptions followed by emission of voluminous andesitic and dacitic lava flows, which form an extensive apron around the volcano on all sides but the south. Records of historical eruptions date back to 1750.
Information Contacts: Instituto Geofisico del Peru (IGP), Centro Vulcanológico Nacional (CENVUL), Calle Badajoz N° 169 Urb. Mayorazgo IV Etapa, Ate, Lima 15012, Perú (URL: https://www.igp.gob.pe/servicios/centro-vulcanologico-nacional/inicio); Buenos Aires Volcanic Ash Advisory Center (VAAC), Servicio Meteorológico Nacional-Fuerza Aérea Argentina, 25 de mayo 658, Buenos Aires, Argentina (URL: http://www.smn.gov.ar/vaac/buenosaires/inicio.php); MIROVA (Middle InfraRed Observation of Volcanic Activity), a collaborative project between the Universities of Turin and Florence (Italy) supported by the Centre for Volcanic Risk of the Italian Civil Protection Department (URL: http://www.mirovaweb.it/); Hawai'i Institute of Geophysics and Planetology (HIGP) - MODVOLC Thermal Alerts System, School of Ocean and Earth Science and Technology (SOEST), Univ. of Hawai'i, 2525 Correa Road, Honolulu, HI 96822, USA (URL: http://modis.higp.hawaii.edu/); NASA Global Sulfur Dioxide Monitoring Page, Atmospheric Chemistry and Dynamics Laboratory, NASA Goddard Space Flight Center (NASA/GSFC), 8800 Greenbelt Road, Goddard MD 20771, USA (URL: https://so2.gsfc.nasa.gov/); Copernicus Browser, Copernicus Data Space Ecosystem, European Space Agency (URL: https://dataspace.copernicus.eu/browser/).
Sheveluch
Russia
56.653°N, 161.36°E; summit elev. 3283 m
All times are local (unless otherwise noted)
Significant explosions destroyed part of the lava-dome complex during April 2023
Sheveluch (also spelled Shiveluch) in Kamchatka, has had at least 60 large eruptions during the last 10,000 years. The summit is truncated by a broad 9-km-wide caldera that is breached to the S, and many lava domes occur on the outer flanks. The lava dome complex was constructed within the large open caldera. Frequent collapses of the dome complex have produced debris avalanches; the resulting deposits cover much of the caldera floor. A major south-flank collapse during a 1964 Plinian explosion produced a scarp in which a “Young Sheveluch” dome began to form in 1980. Repeated episodes of dome formation and destruction since then have produced major and minor ash plumes, pyroclastic flows, block-and-ash flows, and “whaleback domes” of spine-like extrusions in 1993 and 2020 (BGVN 45:11). The current eruption period began in August 1999 and has more recently consisted of lava dome growth, explosions, ash plumes, and avalanches (BGVN 48:01). This report covers a significant explosive eruption during early-to-mid-April 2023 that generated a 20 km altitude ash plume, produced a strong sulfur dioxide plume, and destroyed part of the lava-dome complex; activity described during January through April 2023 use information primarily from the Kamchatka Volcanic Eruptions Response Team (KVERT) and various satellite data.
Satellite data. Activity during the majority of this reporting period was characterized by continued lava dome growth, strong fumarole activity, explosions, and hot avalanches. According to the MODVOLC Thermal Alerts System, 140 hotspots were detected through the reporting period, with 33 recorded in January 2023, 29 in February, 44 in March, and 34 in April. Frequent strong thermal activity was recorded during January 2023 through April, according to the MIROVA (Middle InfraRed Observation of Volcanic Activity) graph and resulted from the continuously growing lava dome (figure 94). A slightly stronger pulse in thermal activity was detected in early-to-mid-April, which represented the significant eruption that destroyed part of the lava-dome complex. Thermal anomalies were also visible in infrared satellite imagery at the summit crater (figure 95).
During January 2023 KVERT reported continued growth of the lava dome, accompanied by strong fumarolic activity, incandescence from the lava dome, explosions, ash plumes, and avalanches. Satellite data showed a daily thermal anomaly over the volcano. Video data showed ash plumes associated with collapses at the dome that generated avalanches that in turn produced ash plumes rising to 3.5 km altitude and drifting 40 km W on 4 January and rising to 7-7.5 km altitude and drifting 15 km SW on 5 January. A gas-and-steam plume containing some ash that was associated with avalanches rose to 5-6 km altitude and extended 52-92 km W on 7 January. Explosions that same day produced ash plumes that rose to 7-7.5 km altitude and drifted 10 km W. According to a Volcano Observatory Notice for Aviation (VONA) issued at 1344 on 19 January, explosions produced an ash cloud that was 15 x 25 km in size and rose to 9.6-10 km altitude, drifting 21-25 km W; as a result, the Aviation Color Code (ACC) was raised to Red (the highest level on a four-color scale). Another VONA issued at 1635 reported that no more ash plumes were observed, and the ACC was lowered to Orange (the second highest level on a four-color scale). On 22 January an ash plume from collapses and avalanches rose to 5 km altitude and drifted 25 km NE and SW; ash plumes associated with collapses extended 70 km NE on 27 and 31 January.
Lava dome growth, fumarolic activity, dome incandescence, and occasional explosions and avalanches continued during February and March. A daily thermal anomaly was visible in satellite data. Explosions on 1 February generated ash plumes that rose to 6.3-6.5 km altitude and extended 15 km NE. Video data showed an ash cloud from avalanches rising to 5.5 km altitude and drifting 5 km SE on 2 February. Satellite data showed gas-and-steam plumes containing some ash rose to 5-5.5 km altitude and drifted 68-110 km ENE and NE on 6 February, to 4.5-5 km altitude and drifted 35 km WNW on 22 February, and to 3.7-4 km altitude and drifted 47 km NE on 28 February. Scientists from the Kamchatka Volcanological Station (KVS) went on a field excursion on 25 February to document the growing lava dome, and although it was cloudy most of the day, nighttime incandescence was visible. Satellite data showed an ash plume extending up to 118 km E during 4-5 March. Video data from 1150 showed an ash cloud from avalanches rose to 3.7-5.5 km altitude and drifted 5-10 km ENE and E on 5 March. On 11 March an ash plume drifted 62 km E. On 27 March ash plumes rose to 3.5 km altitude and drifted 100 km E. Avalanches and constant incandescence at the lava dome was focused on the E and NE slopes on 28 March. A gas-and-steam plume containing some ash rose to 3.5 km altitude and moved 40 km E on 29 March. Ash plumes on 30 March rose to 3.5-3.7 km altitude and drifted 70 km NE.
Similar activity continued during April, with lava dome growth, strong fumarolic activity, incandescence in the dome, occasional explosions, and avalanches. A thermal anomaly persisted throughout the month. During 1-4 April weak ash plumes rose to 2.5-3 km altitude and extended 13-65 km SE and E.
Activity during 11 April 2023. The Institute of Volcanology and Seismology, Far Eastern Branch, Russian Academy of Sciences (IVS FEB RAS) reported a significant increase in seismicity around 0054 on 11 April, as reported by strong explosions detected on 11 April beginning at 0110 that sent ash plumes up to 7-10 km altitude and extended 100-435 km W, WNW, NNW, WSW, and SW. According to a Tokyo VAAC report the ash plume rose to 15.8 km altitude. By 0158 the plume extended over a 75 x 100 km area. According to an IVS FEB RAS report, the eruptive column was not vertical: the initial plume at 0120 on 11 April deviated to the NNE, at 0000 on 12 April, it drifted NW, and by 1900 it drifted SW. KVS reported that significant pulses of activity occurred at around 0200, 0320, and then a stronger phase around 0600. Levin Dmitry took a video from near Békés (3 km away) at around 0600 showing a rising plume; he also reported that a pyroclastic flow traveled across the road behind him as he left the area. According to IVS FEB RAS, the pyroclastic flow traveled several kilometers SSE, stopping a few hundred meters from a bridge on the road between Klyuchi and Petropavlovsk-Kamchatsky.
Ashfall was first observed in Klyuchi (45 km SW) at 0630, and a large, black ash plume blocked light by 0700. At 0729 KVERT issued a Volcano Observatory Notice for Aviation (VONA) raising the Aviation Color Code to Red (the highest level on a four-color scale). It also stated that a large ash plume had risen to 10 km altitude and drifted 100 km W. Near-constant lightning strikes were reported in the plume and sounds like thunderclaps were heard until about 1000. According to IVS FEB RAS the cloud was 200 km long and 76 km wide by 0830, and was spreading W at altitudes of 6-12 km. In the Klyuchi Village, the layer of both ash and snow reached 8.5 cm (figure 96); ashfall was also reported in Kozyrevsk (112 km SW) at 0930, Mayskoye, Anavgay, Atlasovo, Lazo, and Esso. Residents in Klyuchi reported continued darkness and ashfall at 1100. In some areas, ashfall was 6 cm deep and some residents reported dirty water coming from their plumbing. According to IVS FEB RAS, an ash cloud at 1150 rose to 5-20 km altitude and was 400 km long and 250 km wide, extending W. A VONA issued at 1155 reported that ash had risen to 10 km and drifted 340 km NNW and 240 km WSW. According to Simon Carn (Michigan Technological University), about 0.2 Tg of sulfur dioxide in the plume was measured in a satellite image from the TROPOMI instrument on the Sentinel-5P satellite acquired at 1343 that covered an area of about 189,000 km2 (figure 97). Satellite data at 1748 showed an ash plume that rose to 8 km altitude and drifted 430 km WSW and S, according to a VONA.
Activity during 12-15 April 2023. On 12 April at 0730 satellite images showed ash plumes rose to 7-8 km altitude and extended 600 km SW, 1,050 km ESE, and 1,300-3,000 km E. By 1710 that day, the explosions weakened. According to news sources, the ash-and-gas plumes drifted E toward the Aleutian Islands and reached the Gulf of Alaska by 13 April, causing flight disruptions. More than 100 flights involving Alaska airspace were cancelled due to the plume. Satellite data showed ash plumes rising to 4-5.5 km altitude and drifted 400-415 km SE and ESE on 13 April. KVS volcanologists observed the pyroclastic flow deposits and noted that steam rose from downed, smoldering trees. They also noted that the deposits were thin with very few large fragments, which differed from previous flows. The ash clouds traveled across the Pacific Ocean. Flight cancellations were also reported in NW Canada (British Columbia) during 13-14 April. During 14-15 April ash plumes rose to 6 km altitude and drifted 700 km NW.
Alaskan flight schedules were mostly back to normal by 15 April, with only minor delays and far less cancellations; a few cancellations continued to be reported in Canada. Clear weather on 15 April showed that most of the previous lava-dome complex was gone and a new crater roughly 1 km in diameter was observed (figure 98); gas-and-steam emissions were rising from this crater. Evidence suggested that there had been a directed blast to the SE, and pyroclastic flows traveled more than 20 km. An ash plume rose to 4.5-5.2 km altitude and drifted 93-870 km NW on 15 April.
Activity during 16-30 April 2023. Resuspended ash was lifted by the wind from the slopes and rose to 4 km altitude and drifted 224 km NW on 17 April. KVERT reported a plume of resuspended ash from the activity during 10-13 April on 19 April that rose to 3.5-4 km altitude and drifted 146-204 km WNW. During 21-22 April a plume stretched over the Scandinavian Peninsula. A gas-and-steam plume containing some ash rose to 3-3.5 km altitude and drifted 60 km SE on 30 April. A possible new lava dome was visible on the W slope of the volcano on 29-30 April (figure 99); satellite data showed two thermal anomalies, a bright one over the existing lava dome and a weaker one over the possible new one.
References. Girina, O., Loupian, E., Horvath, A., Melnikov, D., Manevich, A., Nuzhdaev, A., Bril, A., Ozerov, A., Kramareva, L., Sorokin, A., 2023, Analysis of the development of the paroxysmal eruption of Sheveluch volcano on April 10–13, 2023, based on data from various satellite systems, ??????????? ???????? ??? ?? ???????, 20(2).
Geologic Background. The high, isolated massif of Sheveluch volcano (also spelled Shiveluch) rises above the lowlands NNE of the Kliuchevskaya volcano group. The 1,300 km3 andesitic volcano is one of Kamchatka's largest and most active volcanic structures, with at least 60 large eruptions during the Holocene. The summit of roughly 65,000-year-old Stary Shiveluch is truncated by a broad 9-km-wide late-Pleistocene caldera breached to the south. Many lava domes occur on its outer flanks. The Molodoy Shiveluch lava dome complex was constructed during the Holocene within the large open caldera; Holocene lava dome extrusion also took place on the flanks of Stary Shiveluch. Widespread tephra layers from these eruptions have provided valuable time markers for dating volcanic events in Kamchatka. Frequent collapses of dome complexes, most recently in 1964, have produced debris avalanches whose deposits cover much of the floor of the breached caldera.
Information Contacts: Kamchatka Volcanic Eruptions Response Team (KVERT), Far Eastern Branch, Russian Academy of Sciences, 9 Piip Blvd., Petropavlovsk-Kamchatsky, 683006, Russia (URL: http://www.kscnet.ru/ivs/kvert/); Institute of Volcanology and Seismology, Far Eastern Branch, Russian Academy of Sciences (IVS FEB RAS), 9 Piip Blvd., Petropavlovsk-Kamchatsky 683006, Russia (URL: http://www.kscnet.ru/ivs/eng/); Kamchatka Volcanological Station, Kamchatka Branch of Geophysical Survey, (KB GS RAS), Klyuchi, Kamchatka Krai, Russia (URL: http://volkstat.ru/); Hawai'i Institute of Geophysics and Planetology (HIGP) - MODVOLC Thermal Alerts System, School of Ocean and Earth Science and Technology (SOEST), Univ. of Hawai'i, 2525 Correa Road, Honolulu, HI 96822, USA (URL: http://modis.higp.hawaii.edu/); MIROVA (Middle InfraRed Observation of Volcanic Activity), a collaborative project between the Universities of Turin and Florence (Italy) supported by the Centre for Volcanic Risk of the Italian Civil Protection Department (URL: http://www.mirovaweb.it/); Copernicus Browser, Copernicus Data Space Ecosystem, European Space Agency (URL: https://dataspace.copernicus.eu/browser/); Kam 24 News Agency, 683032, Kamchatka Territory, Petropavlovsk-Kamchatsky, Vysotnaya St., 2A (URL: https://kam24.ru/news/main/20230411/96657.html#.Cj5Jrky6.dpuf); Simon Carn, Geological and Mining Engineering and Sciences, Michigan Technological University, 1400 Townsend Drive, Houghton, MI 49931, USA (URL: http://www.volcarno.com/, Twitter: @simoncarn).
Bezymianny
Russia
55.972°N, 160.595°E; summit elev. 2882 m
All times are local (unless otherwise noted)
Explosions, ash plumes, lava flows, and avalanches during November 2022-April 2023
Bezymianny is located on the Kamchatka Peninsula of Russia as part of the Klyuchevskoy volcano group. Historic eruptions began in 1955 and have been characterized by dome growth, explosions, pyroclastic flows, ash plumes, and ashfall. During the 1955-56 eruption a large open crater was formed by collapse of the summit and an associated lateral blast. Subsequent episodic but ongoing lava-dome growth, accompanied by intermittent explosive activity and pyroclastic flows, has largely filled the 1956 crater. The current eruption period began in December 2016 and more recent activity has consisted of strong explosions, ash plumes, and thermal activity (BGVN 47:11). This report covers activity during November 2022 through April 2023, based on weekly and daily reports from the Kamchatka Volcano Eruptions Response Team (KVERT) and satellite data.
Activity during November and March 2023 was relatively low and mostly consisted of gas-and-steam emissions, occasional small collapses that generated avalanches along the lava dome slopes, and a persistent thermal anomaly over the volcano that was observed in satellite data on clear weather days. According to the Tokyo VAAC and KVERT, an explosion produced an ash plume that rose to 6 km altitude and drifted 25 km NE at 1825 on 29 March.
Gas-and-steam emissions, collapses generating avalanches, and thermal activity continued during April. According to two Volcano Observatory Notice for Aviation (VONA) issued on 2 and 6 April (local time) ash plumes rose to 3 km and 3.5-3.8 km altitude and drifted 35 km E and 140 km E, respectively. Satellite data from KVERT showed weak ash plumes extending up to 550 km E on 2 and 5-6 April.
A VONA issued at 0843 on 7 April described an ash plume that rose to 4.5-5 km altitude and drifted 250 km ESE. Later that day at 1326 satellite data showed an ash plume that rose to 5.5-6 km altitude and drifted 150 km ESE. A satellite image from 1600 showed an ash plume extending as far as 230 km ESE; KVERT noted that ash emissions were intensifying, likely due to avalanches from the growing lava dome. The Aviation Color Code (ACC) was raised to Red (the highest level on a four-color scale). At 1520 satellite data showed an ash plume rising to 5-5.5 km altitude and drifting 230 km ESE. That same day, Kamchatka Volcanological Station (KVS) volcanologists traveled to Ambon to collect ash; they reported that a notable eruption began at 1730, and within 20 minutes a large ash plume rose to 10 km altitude and drifted NW. KVERT reported that the strong explosive phase began at 1738. Video and satellite data taken at 1738 showed an ash plume that rose to 10-12 km altitude and drifted up to 2,800 km SE and E. Explosions were clearly audible 20 km away for 90 minutes, according to KVS. Significant amounts of ash fell at the Apakhonchich station, which turned the snow gray; ash continued to fall until the morning of 8 April. In a VONA issued at 0906 on 8 April, KVERT stated that the explosive eruption had ended; ash plumes had drifted 2,000 km E. The ACC was lowered to Orange (the third highest level on a four-color scale). The KVS team saw a lava flow on the active dome once the conditions were clear that same day (figure 53). On 20 April lava dome extrusion was reported; lava flows were noted on the flanks of the dome, and according to KVERT satellite data, a thermal anomaly was observed in the area. The ACC was lowered to Yellow (the second lowest on a four-color scale).
Satellite data showed an increase in thermal activity beginning in early April 2023. A total of 31 thermal hotspots were detected by the MODVOLC thermal algorithm on 4, 5, 7, and 12 April 2023. The elevated thermal activity resulted from an increase in explosive activity and the start of an active lava flow. The MIROVA (Middle InfraRed Observation of Volcanic Activity) volcano hotspot detection system based on the analysis of MODIS data also showed a pulse in thermal activity during the same time (figure 54). Infrared satellite imagery captured a continuous thermal anomaly at the summit crater, often accompanied by white gas-and-steam emissions (figure 55). On 4 April 2023 an active lava flow was observed descending the SE flank.
Geologic Background. The modern Bezymianny, much smaller than its massive neighbors Kamen and Kliuchevskoi on the Kamchatka Peninsula, was formed about 4,700 years ago over a late-Pleistocene lava-dome complex and an edifice built about 11,000-7,000 years ago. Three periods of intensified activity have occurred during the past 3,000 years. The latest period, which was preceded by a 1,000-year quiescence, began with the dramatic 1955-56 eruption. This eruption, similar to that of St. Helens in 1980, produced a large open crater that was formed by collapse of the summit and an associated lateral blast. Subsequent episodic but ongoing lava-dome growth, accompanied by intermittent explosive activity and pyroclastic flows, has largely filled the 1956 crater.
Information Contacts: Kamchatka Volcanic Eruptions Response Team (KVERT), Far Eastern Branch, Russian Academy of Sciences, 9 Piip Blvd., Petropavlovsk-Kamchatsky, 683006, Russia (URL: http://www.kscnet.ru/ivs/kvert/); Kamchatka Volcanological Station, Kamchatka Branch of Geophysical Survey, (KB GS RAS), Klyuchi, Kamchatka Krai, Russia (URL: http://volkstat.ru/); Hawai'i Institute of Geophysics and Planetology (HIGP) - MODVOLC Thermal Alerts System, School of Ocean and Earth Science and Technology (SOEST), Univ. of Hawai'i, 2525 Correa Road, Honolulu, HI 96822, USA (URL: http://modis.higp.hawaii.edu/); MIROVA (Middle InfraRed Observation of Volcanic Activity), a collaborative project between the Universities of Turin and Florence (Italy) supported by the Centre for Volcanic Risk of the Italian Civil Protection Department (URL: http://www.mirovaweb.it/); Copernicus Browser, Copernicus Data Space Ecosystem, European Space Agency (URL: https://dataspace.copernicus.eu/browser/).
Chikurachki
Russia
50.324°N, 155.461°E; summit elev. 1781 m
All times are local (unless otherwise noted)
New explosive eruption during late January-early February 2023
Chikurachki, located on Paramushir Island in the northern Kuriles, has had Plinian eruptions during the Holocene. Lava flows have reached the sea and formed capes on the NW coast; several young lava flows are also present on the E flank beneath a scoria deposit. Reported eruptions date back to 1690, with the most recent eruption period occurring during January through October 2022, characterized by occasional explosions, ash plumes, and thermal activity (BGVN 47:11). This report covers a new eruptive period during January through February 2023 that consisted of ash explosions and ash plumes, based on information from the Kamchatka Volcanic Eruptions Response Team (KVERT) and satellite data.
According to reports from KVERT, an explosive eruption began around 0630 on 29 January. Explosions generated ash plumes that rose to 3-3.5 km altitude and drifted 6-75 km SE and E, based on satellite data. As a result, the Aviation Color Code (ACC) was raised to Orange (the second highest level on a four-color scale). At 1406 and 1720 ash plumes were identified in satellite images that rose to 4.3 km altitude and extended 70 km E. By 2320 the ash plume had dissipated. A thermal anomaly was visible at the volcano on 31 January, according to a satellite image, and an ash plume was observed drifting 66 km NE.
Occasional explosions and ash plumes continued during early February. At 0850 on 1 February an ash plume rose to 3.5 km altitude and drifted 35 km NE. Satellite data showed an ash plume that rose to 3.2-3.5 km altitude and drifted 50 km NE at 1222 later that day (figure 22). A thermal anomaly was detected over the volcano during 5-6 February and ash plumes drifted as far as 125 km SE, E, and NE. Explosive events were reported at 0330 on 6 February that produced ash plumes rising to 4-4.5 km altitude and drifting 72-90 km N, NE, and ENE. KVERT noted that the last gas-and steam plume that contained some ash was observed on 8 February and drifted 55 km NE before the explosive eruption ended. The ACC was lowered to Yellow and then Green (the lowest level on a four-color scale) on 18 February.
Geologic Background. Chikurachki, the highest volcano on Paramushir Island in the northern Kuriles, is a relatively small cone constructed on a high Pleistocene edifice. Oxidized basaltic-to-andesitic scoria deposits covering the upper part of the young cone give it a distinctive red color. Frequent basaltic Plinian eruptions have occurred during the Holocene. Lava flows have reached the sea and formed capes on the NW coast; several young lava flows are also present on the E flank beneath a scoria deposit. The Tatarinov group of six volcanic centers is located immediately to the south, and the Lomonosov cinder cone group, the source of an early Holocene lava flow that reached the saddle between it and Fuss Peak to the west, lies at the southern end of the N-S-trending Chikurachki-Tatarinov complex. In contrast to the frequently active Chikurachki, the Tatarinov centers are extensively modified by erosion and have a more complex structure. Tephrochronology gives evidence of an eruption around 1690 CE from Tatarinov, although its southern cone contains a sulfur-encrusted crater with fumaroles that were active along the margin of a crater lake until 1959.
Information Contacts: Kamchatka Volcanic Eruptions Response Team (KVERT), Far East Division, Russian Academy of Sciences, 9 Piip Blvd., Petropavlovsk-Kamchatsky, 683006, Russia (URL: http://www.kscnet.ru/ivs/); Copernicus Browser, Copernicus Data Space Ecosystem, European Space Agency (URL: https://dataspace.copernicus.eu/browser/).
Search Bulletin Archive by Publication Date
Select a month and year from the drop-downs and click "Show Issue" to have that issue displayed in this tab.
The default month and year is the latest issue available.
Bulletin of the Global Volcanism Network - Volume 29, Number 04 (April 2004)
Managing Editor: Edward Venzke
Anatahan (United States)
Lava dome(s) emitted in April-May 2004
Dukono (Indonesia)
Continuously erupting volcano with occassional MODIS satellite thermal alerts
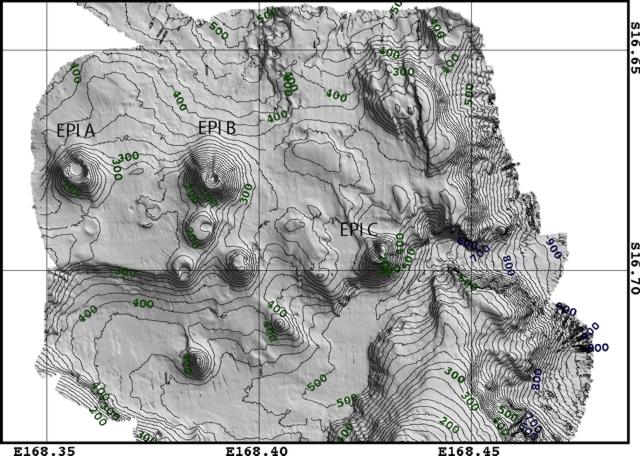
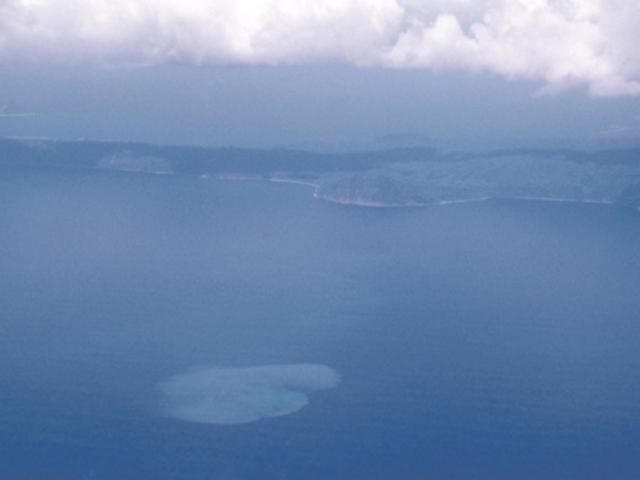
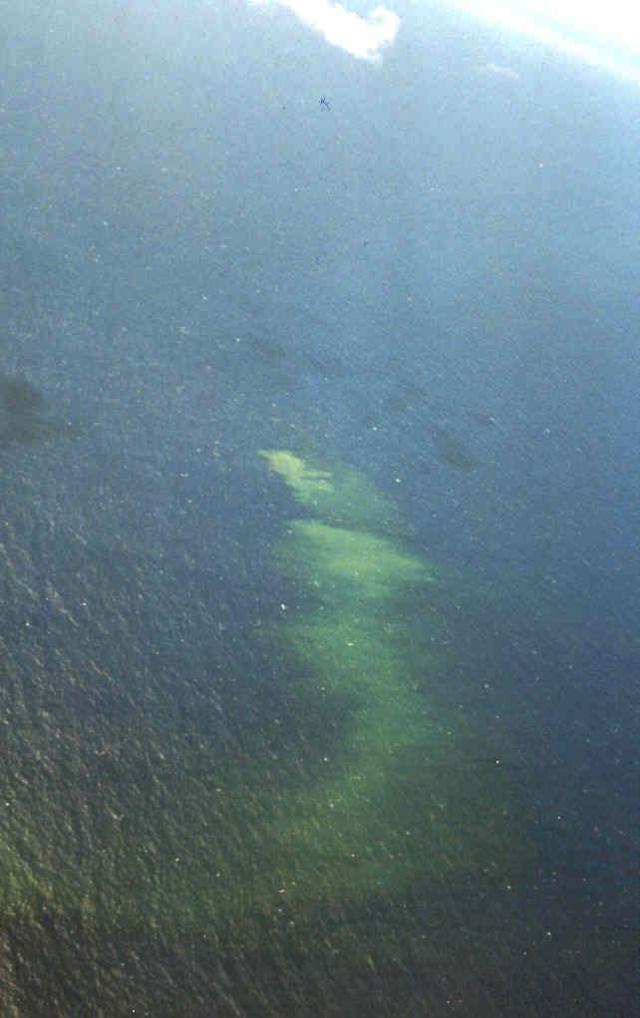
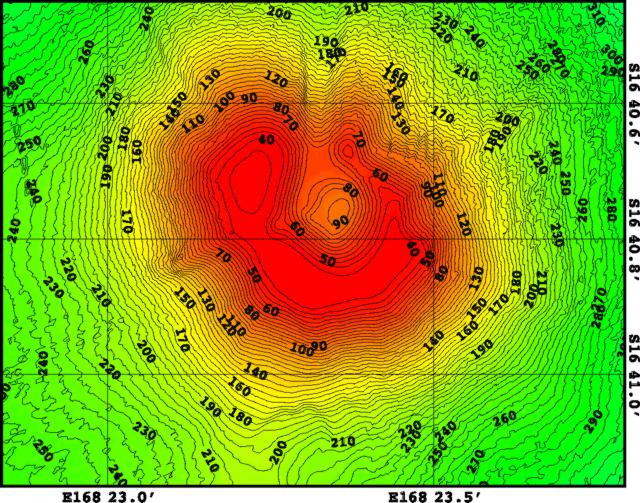
East Epi (Vanuatu)
Seamount with repeated eruptions and uncertain history, but stable summit elevation
Ebeko (Russia)
Weak fuming and notes on Tatarinov, Chikurachki, and Fuss Peak
Karymsky (Russia)
Intermittent gas-ash explosions and elevated seismicity continue
Klyuchevskoy (Russia)
Background seismicity March-April 2004; ash plumes on 8 April
Manam (Papua New Guinea)
Suggestions of mild activity; February and April ash discharges
Nyamulagira (DR Congo)
New eruption on 8 May spawns cones, lava lake, fountains, and lava flows
Rabaul (Papua New Guinea)
Tavurvur cone's eruptions pause or cease, starting 17 February; MODIS data
Ulawun (Papua New Guinea)
Quiet during early 2004; thin ash plumes 12-14 April
Witori (Papua New Guinea)
Recharacterization of reported 24 February eruptive activity
Anatahan (United States) — April 2004 Cite this Report
Anatahan
United States
16.35°N, 145.67°E; summit elev. 790 m
All times are local (unless otherwise noted)
Lava dome(s) emitted in April-May 2004
The first recorded historical eruption at Anatahan began on 10 May 2003. Activity through early October 2003 was [previously] reported [(BGVN 28:04, 28:05, 28:06, and 28:09)]. This report, in large part contributed by scientists of the Commonwealth of the Northern Mariana Islands Emergency Management Office (CNMI/EMO) discusses Anatahan during October 2003 to early May 2004. During October-February, Anatahan's tremor and volcanic seismicity were consistently low, with no apparent eruption signals or precursory events. Later, in March, April, and May clear emissions began, and in April-May 2004 small dome extrusions occurred. There were several peaks in seismicity, such as 2-8 February and shorter episodes on 13-14 February. Much larger peaks in seismicity, the largest in 2004, took place in late April. Many details on the dome extrusions remain undisclosed; however, near the end of this report there are a variety of data from several contributors, including one clear Modis alert (28 April) and a VAAC reports based on satellite observations of a thin plume (24 April).
During overflights in early October 2003 observers saw no ash emissions. The crater vents continued to emit steam and SO2, and the floor of the crater was in great flux. During periods of rain, the crater floor was covered by sediment-laden water and (or) debris flows. The E crater continued to have an active geothermal system that consisted of mud pots, mini-geysers, and steam jets from the crater walls. In general, emissions continued at a low level.
During early November 2003, regional seismicity was low. For the week of 9-15 December, numerous tiny long-period earthquakes (LPs) were recorded only on the station near the crater, at a rate of ~ 1 every 10 sec. All of these LP events were much smaller than M 0.5, with dominant frequencies of 4-5 Hz. After several months of only very low magnitude LP events, on 1 February 2004 larger ones again began to occur. After increasing slowly in size, they reached M ~ 2, and they took place several times per hour.
Anatahan's seismicity peaked just before 1600 local time on 7 February 2004, with a swarm consisting of up to 15 events occurring per hour. The seismicity then decreased dramatically but remained well above levels of the previous few months. By 1000 on 8 February the maximum magnitude of volcanic earthquakes had diminished greatly from their peak magnitude two days before, but the earthquakes were occurring more often, sometimes as frequently as 1 per minute. The amplitude of low-frequency tremor had also increased considerably. The combined effect was that the level of seismic energy release around 7-8 February, averaged over hours, remained nearly constant at its peak.
By 9 February the magnitude of the volcanic earthquakes decreased significantly and were no longer visible on the records. The amplitude of low-frequency tremor remained high but decreased some from its peak on 8 February. The total daily seismic energy release decreased somewhat from its peak during the previous few days. From 10 February to 29 March 2004, Anatahan volcanic seismicity, tremor, and energy release were all very low, with no apparent eruption signals.
Volcanic seismicity occurred again 13 February during a 6-hour period, the first such seismicity since the episode of 2-7 February. Short tremor episodes began at 0543 and occurred every 8-12 minutes until 1130 on 14 February, the largest being approximately equivalent to a magnitude M 2 earthquake. From 15 February through 30 March 2004, Anatahan tremor and volcanic seismicity stood at low background levels, with no apparent eruption signals or precursory events.
A seismic swarm began beneath Anatahan Island on 31 March, the third such swarm since the eruption of May-June 2003. The largest earthquakes in the swarm were all smaller than those that occurred during the previous swarm in early February 2004. During 2-3 April the swarm intensified significantly. Most earthquakes were followed by long, tremor-like signals that CNMI scientists believed indicated small emissions of steam, possibly bearing ash and thought to rise to altitudes much less than 1,000 m, though they had no visual confirmation of such emissions at the time.
On 6-7 April, Anatahan volcanic seismicity was the highest since the eruption of May-June 2003, with events as large as M ~ 2.5 usually followed by tremor-like signals. That swarm's level of seismic activity remained high through 23 April.
With regard to the rise in seismicity during early 2004, Scientists of the Commonwealth of the Northern Mariana Islands Emergency Management Office (CNMI/EMO) opined that these events were likely the result of magma degassing and/or moving beneath the recently active crater. The Office of the Governor, CNMI, placed Anatahan Island off-limits and concluded that, although the volcano was not currently dangerous to aircraft, pilots should exercise due caution in Anatahan's vicinity.
Dome, ejecta, and lavas. On 12 April, the presence of a new, rather flat lava dome within a crescent-shaped crater lake was confirmed, as was the occurrence of fresh ejecta within the lowest reaches of the crater. The Hawaii Institute of Geophysics and Planetology (HIGP) web site for MODIS hot-spot satellite imagery showed a thermal anomaly for the volcano on 12 April at 1545 UTC. High seismicity through 23 April suggested continuing effusion of relatively small volumes of new lava onto the crater floor.
At 1052 on 24 April, Anatahan's seismic activity increased abruptly, rising to levels unseen since summer 2003 (3 to 4 times as high as those observed in April 2004). About that time a low-level eruption began producing steam and ash to ~ 600 m and an overflight reported incandescent cracks in a fresh lava flow or dome within the inner crater. The presence of a "cow-pie-shaped" dome within the inner crater was verified later.
The seismicity level increased slowly and fairly constantly on 24-25 April to a level similar to that of the eruption of mid-June 2003. During an overflight on 26 April between 1030 and 1100, Juan Camacho (CNMI/EMO) and Erik Hauri (Carnegie, Margins group) observed regular puffs of yellow-brown steam and ash every 1-2 min, a rate almost identical to that of seismic events recorded during that time. The maximum height of the steam and ash plume was estimated at ~ 600 m.
According to the Washington Volcanic Ash Advisory Center (VAAC), at 0725 UTC on 24 April 2004 a thin plume from Anatahan was visible on satellite imagery ~ 1 km above the volcano and extending ~ 460 km NW; this plume was not observable on satellite images taken at 1502 UTC, later in the same day. The HIGP web site for Modis hot-spot satellite imagery showed a thermal anomaly for the volcano on 28 April at 1545 UTC. On 28 April the seismicity level increased still further, a level ~ 25% more energetic than the previous high of 25 April 2004.
In accord with the elevated seismicity, the dome increased in size, and explosions also apparently increased in size and rate. The seismicity then slowly decreased ~ 25% over the next 5 days until 3 May, when it dropped off suddenly but smoothly by another 40%. Subsequently, over several days, the seismicity recovered somewhat to ~ 50% of the highest level of 28 April. On 5 May 2004 small explosions continued to occur every minute or two, and steam and ash still rose hundreds of meters.
Geologic Background. The elongate, 9-km-long island of Anatahan in the central Mariana Islands consists of a large stratovolcano with a 2.3 x 5 km compound summit caldera. The larger western portion of the caldera is 2.3 x 3 km wide, and its western rim forms the island's high point. Ponded lava flows overlain by pyroclastic deposits fill the floor of the western caldera, whose SW side is cut by a fresh-looking smaller crater. The 2-km-wide eastern portion of the caldera contained a steep-walled inner crater whose floor prior to the 2003 eruption was only 68 m above sea level. A submarine cone, named NE Anatahan, rises to within 460 m of the sea surface on the NE flank, and numerous other submarine vents are found on the NE-to-SE flanks. Sparseness of vegetation on the most recent lava flows had indicated that they were of Holocene age, but the first historical eruption did not occur until May 2003, when a large explosive eruption took place forming a new crater inside the eastern caldera.
Information Contacts: Hawaii Volcano Observatory (HVO), U.S. Geological Survey (USGS), Hawaii National Park, HI 96718, USA (URL: https://volcanoes.usgs.gov/nmi/activity/)update.html); Juan Takai Camacho and Ramon Chong, Commonwealth of the Northern Mariana Islands Emergency Management Office (CNMI/EMO), Saipan, MP 96950 USA (URL: http://www.cnmihsem.gov.mp/); Frank Trusdell, U.S. Geological Survey, Hawaiian Volcano Observatory (HVO), PO Box 51, Hawaii National Park, HI 96718, USA (URL: https://volcanoes.usgs.gov/nmi/activity/); Washington Volcanic Ash Advisory Center, Satellite Analysis Branch (SAB), NOAA/NESDIS E/SP23, NOAA Science Center Room 401, 5200 Auth Road, Camp Springs, MD 20746, USA (URL: http://www.ssd.noaa.gov/); MODIS Thermal Alerts team, Hawaii Institute of Geophysics and Planetology (HIGP), School of Ocean and Earth Science and Technology, University of Hawaii at Manoa (URL: http://modis.hgip.hawaii.edu/); Erik Hauri, Carnegie Institution of Washington, 5241 Broad Branch Road, NW, Washington, DC 20015-1305, USA (URL: http://dtm.carnegiescience.edu/).
Dukono
Indonesia
1.6992°N, 127.8783°E; summit elev. 1273 m
All times are local (unless otherwise noted)
Continuously erupting volcano with occassional MODIS satellite thermal alerts
Dukono, one of Indonesia's most active volcanoes, erupts nearly continually. Unfortunately, satellite-based thermal alerts from MODVOLC processing and NASA's Terra satellite have thus far only occasionally disclosed Dukono activity. MODVOLC data appear on a dedicated website maintained by the University of Hawaii HIGP MODIS Thermal Alerts team. Coppola and Rothery previously reported a significant thermal event on Dukono during 26 August-7 September 2002 (BGVN 28:03). This was the first sign of Dukono activity indicated by MODVOLC data since the remote-sensing system began data collection in May 2000. Reports from the Volcanological Survey of Indonesia and the Darwin VAAC (BGVN 28:06, 28:09, 28:11, and 28:12) documented ash eruptions during February and June 2003, with activity continuing to at least January 2004.
An updated analysis of MODVOLC data for the observational period August 2000-April 2004 included thermal alerts from NASA's Aqua satellite. Alerts were triggerd for 26 August and 6 and 7 September 2002. They confirmed the August-September 2002 event, but found very little sign of subsequent activity through the end of April 2004. After September 2002 the only thermal alerts were single pixel events only slightly above the MODVOLC detection threshold. They took place on 1 March and 10 November 2003. Inspection of raw MODIS data revealed an additional anomaly on 17 November 2003, but the alert ratio was slightly below the MODVOLC detection threshold.
For an explanation of MODVOLC anomalies see BGVN 28:01 or the MODVOLC website. The scarcity of thermal alerts at Dukono, despite the recurrent ash eruptions, indicates the general invisibility (or small size) of any hot feature(s) there. Small to moderate sized ash columns would be unlikely to trigger an alert since they occur in a narrow time window.
Geologic Background. Reports from this remote volcano in northernmost Halmahera are rare, but Dukono has been one of Indonesia's most active volcanoes. More-or-less continuous explosive eruptions, sometimes accompanied by lava flows, have occurred since 1933. During a major eruption in 1550 CE, a lava flow filled in the strait between Halmahera and the N-flank Gunung Mamuya cone. This complex volcano presents a broad, low profile with multiple summit peaks and overlapping craters. Malupang Wariang, 1 km SW of the summit crater complex, contains a 700 x 570 m crater that has also been active during historical time.
Information Contacts: MODIS Thermal Alerts team, Hawaii Institute of Geophysics and Planetology (HIGP), School of Ocean and Earth Science and Technology, University of Hawaii at Manoa (URL: http://modis.hgip.hawaii.edu/); David A . Rothery and Charlotte Saunders, Department of Earth Sciences, The Open University, Milton Keynes, MK7 6AA, United Kingdom.
East Epi
Vanuatu
16.6797°S, 168.3893°E; summit elev. 833 m
All times are local (unless otherwise noted)
Seamount with repeated eruptions and uncertain history, but stable summit elevation
[The East Epi volcanic complex includes] a group of volcanic centers most conspicuously active at a shallow seamount informally known as Epi B. What follows is a brief summary of the geography and the historical eruptions plausibly or clearly attributed to Epi B (Eissen and others, 1991), leading into a synopsis of recent research and activity. The records of the last century and recent observations suggest that Epi B represents a potential hazard for the inhabitants of the coastal villages of eastern Epi Island (roughly 2,000 people). The island of Epi lies along the Vanuatu island chain between the neighboring islands that include Malekula, Ambrym, and Lopevi to the N, and Efate and Shepherd to the S. The island contains two adjacent Quaternary stratovolcanoes and a smaller cone, as well as the margin of an inferred submarine caldera. The submarine cones Epi A, B, and C lie offshore, 10-16 km NNE from the summit of the island (16.73°S, 168.28°E). The top of Epi B is 13 km NNE of the summit (figure 1).
Violent activity between the islands of Lopevi and Epi was reported in 1920 (William and Warden, 1964). In 1953 a major eruption ejected volcanic material to about 100 m above the sea surface and produced rafts of floating pumice over an area of about 1,000 km2. A cone may have formed above water, but it would have been quickly destroyed (Warden, 1967). In 1958 discolored seawater was observed in this area (figure 2; Priam, 1958). Another major eruption was observed in July 1960. Until early 2004, the only recorded evidence of activity following the 1960 eruption was discolored water. Activity at Epi B was also confirmed by the British hydrographic vessel HMS Hydra in 1974, the French research vessel Machias in 1981, the SOPAC cruise of the S.P. Lee in 1984, the Russian vessel Akademik Alexander Nesmayanov in 1990, the French CALIS project using research vessel N.O. Alis in 1991, aerial observations in 1997 (figure 3), and the Australian VAVE project using the research vessel Franklin in 2001. Their collective observations showed that the depth of the cone's summit area remained stationary at -34 m until early 2004 when Epi Island residents observed explosions and surface disturbances (figure 3).
While adjacent to Lopevi, the crew of the fishing vessel Azurreported and photographed an explosion rising above the sea surface on 19 February 2004 (figure 4), prompting Vanuatu's Department of Geology, Mines, and Water Resources (DGMWR) to gather eyewitness accounts from the inhabitants of Epi's very isolated E coast about activity. Eyewitnesses told of explosions heard in early 1999(?), further explosions and the appearance of floating pumice rafts in March 2002, and an eruption between 16 and 24 February 2004. The latter Epi B eruption was confirmed by the infrasonic recordings of the CEA/DASE (Département d'Analyse et de Surveillance de l'Environnement) geophysics station, located in New Caledonia, more than 600 km away.
In March 2004 the Institut de Recherche pour le Développement (IRD) undertook a cruise (called VATATERM) aboard their research vessel N.O. Alis.Using the ship's Simrad EM1002 multi-beam sounder, the project produced the first detailed bathymetric map of the area E of Epi Island (figure 1). The Epi A, B, and C cones (Exon and Cronan, 1983; Crawford and others, 1988) have been interpreted by Crawford and others (1988) as being aligned along the N rim of a vast caldera E of Epi. The new map clearly revealed those distinct cones, and a number of smaller cones and craters between them and Epi island's NE coast.
The 2004 bathymetric data revealed that Epi B is a ~ 300-m-tall cone with a diameter of ~1.8 km at the base (figure 5). The highest point is on the NW rim of the summit crater, at a depth of -34 m, with a broad rim area around 35-40 m depth extending from the NW around the S to the SE side of the crater. The crater is about 150 m in diameter, the crater floor lying at a depth of 90 m. This crater is breached to the N by a ~60 m wide gap.
Data recorded in 1974 and 1984 indicated that the Epi B crater was open to the S (Exon and Cronan, 1983) or to the SSE (Crawford and others, 1988). The map resulting from a 2001 hydrographic cruise did not show evidence of a summit crater (McConachy and others, 2001). It is not known if these observations represent real modifications to the crater, because the quality of the earlier measurements, using traditional echo-sounders, is questionable.
Observations during September 2001. Scientists on the Vanuatu Australia Vents Expedition (VAVE) aboard the RV Franklin (McConachy and others, 2001) investigated the area immediately SE of the Epi B seamount during September 2001. On 18 September a limited echosounding survey was done, along with a single dip CTD/hydrocast followed by a grab. The latter sample returned an 8-cm-thick layer of pumice (dacite-rhyodacite, 69-72% SiO2, in composition) on top of 3 cm of brown mud. The hydrocast found high concentrations of methane gas, 68-93 nl/l, in three samples between 250 and 337 m deep. A weak but definite light transmission anomaly was also seen at the lowest point of the cast.
Two days later, on 20 September, a more extensive echosounding survey was made in the area noted on nautical maps as having a shoal at 38 m and discolored water. The survey showed a peak at 34 m depth and two smaller structures to the S around 220 m depth. Comparison of this 2001 bathymetric map with the map created by the 2004 VATATERM cruise (figure 1) shows a correlation of this 34-m peak with the summit of Epi B; the deeper peaks correspond to the smaller cones at about 16.70°S. The team "... obtained a reduction in light transmission at the surface (corresponding to the discoloured water) of around 6% associated with low salinity and higher temperature, another near bottom (below 210 m) of up to 1%, and a narrow upper plume signal at 100 m, with a transmission anomaly of approximately 0.2%." Bottles fired and sampled for geochemical studies revealed a large methane anomaly of up to 80 nl/l near the bottom.
References.
Ballu, V., Calmant, S., and others, 2004, Campagne VATATERM du N.O. Alis au Vanuatu, mars 2004.
Crawford, A.J., Greene, H.G., and Exon, N.F., 1988, Geology, Petrology and Geochemistry of submarine volcanoes Around EPI Island, New Hebrides Arc, inGreene, H.G., and Wong, F.L., eds., Geology and Offshore Resources of Pacific Island Arcs -Vanuatu Region: Circum Pacific Council for Energy and Mineral Resources Earth Science Series, v. 8, Houston, Texas, Circum-Pacific Council for Energy and Mineral Resources, p. 301-327.
Eissen, J.P., Blot, C., and Louat, R., 1991, Chronologie de l'activité volcanique historique de l'arc insulaire des Nouvelles-Hébrides de 1595 à 1991: Nouméa, ORSTOM, Rapports Scientifiques et Techniques, Science de la Terre, Géologie-Géophysique, 69 p.
Exon, N.F., and Cronan, D.S., 1983, Hydrothermal iron deposits and associated sediments from submarine volcanoes off Vanuatu, Southwest Pacific: Marine Geology, 52, M43-M52.
Garae, E., Todman, S., and Charley, D., 2004, Rapport de l'éruption du 16-24 février 2004 du volcan sous marin "East Epi": Department of Geology, Mines and Water Resources, Section of Volcanology and Geo-Hazards Management, 14 p.
MacFarlane, A., 1976, Annual report of the geological survey for the year 1974: New Hebrides Condominium, 40 p.
Marine et Aéronautique Navale de Nouvelle-Calédonie, 1958, Observations d'un phénomène sous-marin le 7 octobre 1958 à 10 heures locales et le 18 novembre vers 06 heures locales.
McConachy, T.F., Yeats, C.J., Arculus, R.J., Binns, R.A., Barriga, F.J.A.S., Beattie, R., McInnes, B.I.A., Madsen, E., Rakau, B., Sestak, S., Sharpe, R., and Tevi, T., 2001, VAVE-2001: Vanuatu Australia Vents Expedition Aboard the RV Franklin, 5-25 September 2001, edited by C.J. Yeats, CSIRO Exploration and Mining Report 881F, Final Cruise Report FR08-2001, 318 p.
Obzhirov, A.I., 1992, Dissolved gases of the near-bottom water layer in the area of Epi Island, Vanuatu: Geo-Marine Letters, v. 12, p. 232-235.
Priam, Roland, 1958, November 7 and 13, and December 16, 1958, between 06:30 et 07:00 : reports and slides.
R/V AKADEMIK ALEXANDER NESMEYANOV, 1990, Scientific Report, April 4-7, 1990: Institute of Marine Biology, Academy of Science of the USSR, Vladivostok , USSR, 66 p.
Warden, A.J., 1967, The Geology of the Central Islands: New Hebrides Geological Survey Report No. 5, 108 p.
William, C.E.F., and Warden, A.J., 1964, Progress report of the Geological Survey for 1959-1962: New Hebrides Condominium Geological Survey, 75 p.
Geologic Background. The submarine East Epi group of basaltic and dacitic cones are located within a possible 10-km-diameter caldera off the NE coast of southern Epi Island in Vanuatu. Three cones (1-1.5 basal diameter), known as Epi A, Epi B (or Cioan), and Epi C, are located along the northern rim of the inferred caldera, though Beier et al. (2018) suggest an alternate to the post-caldera formation model. A few smaller cones are south of Epi B. Ephemeral islands were formed during eruptions at Epi B in 1920 and 1953. Explosive activity was reported in 1958 and 1960, discolored water was often seen during 1971-1974 and 1988, a new vent was detected in 1979, and explosive activity occurred in 1999, 2002, 2004, and 2023. The summit was at 34 m below sea level at the time of a 2001 survey, and a research cruise in 2013 (R/V Sonne SO-229; Haase et al, 2013) sampled six cones, including "very fresh pumice and lava bombs" from Epi B and "relatively old-looking" material from the others. The SO-229 cruise also recovered rhyodacitic pumice with mafic streaks, similar to that sampled by previous cruises, and described Epi B as "covered by massive blocks of pumice."
Information Contacts: Bernard Pelletier, Michel Lardy, and Philipson Bani, IRD, BP A5, Noumea, New Caledonia (URL: http://www.suds-en-ligne.ird.fr/fr/volcan/vanuatu/epi1.htm); Stéphane Calmant, IRD-LEGOS Toulouse, France; Valérie Ballu, IPG Paris, France; Esline Garaebiti, Sylvain Todman, Douglas Charley, Department of Geology, Mines and Water Resources, Port Vila, Vanuatu; Timothy F. McConachy, CSIRO Division of Exploration and Mining, P.O. Box 136, North Ryde, NSW 1670, Australia.
Ebeko
Russia
50.686°N, 156.014°E; summit elev. 1103 m
All times are local (unless otherwise noted)
Weak fuming and notes on Tatarinov, Chikurachki, and Fuss Peak
The last recorded eruption of Ebeko volcano was in 1991. Table 2 summarizes activity on Ebeko from February-April 2004 as reported by observers Leonid and Tatiana Kotenko (observations made on days when clouds did not obscure the volcano).
Table 2. A summary showing Ebeko activity for February-April 2004. Courtesy of Leonid and Tatiana Kotenko.
| Date |
Activity level |
Wind direction |
Gas-steam plume
(meters above crater) |
Comment |
| 08 Feb 2004 |
Quiet |
-- |
-- |
-- |
| 12 Feb 2004 |
Quiet |
-- |
-- |
-- |
| 23 Feb 2004 |
-- |
NW |
-- |
Strong smell of H2S |
| 03 Mar-04 Mar 2004 |
-- |
Weak to N |
-- |
| 12 Mar 2004 |
-- |
-- |
-- |
| 16 Mar-17 Mar 2004 |
-- |
-- |
-- |
| 26 Mar 2004 |
-- |
Strong to S |
-- |
-- |
| 29 Mar 2004 |
Quiet |
-- |
-- |
-- |
| 31 Mar 2004 |
-- |
N |
-- |
| 02 Apr 2004 |
Quiet |
-- |
-- |
-- |
| 12 Apr 2004 |
-- |
Strong to NE |
-- |
-- |
| 15 Apr 2004 |
-- |
N |
-- |
| 19 Apr 2004 |
-- |
-- |
-- |
| 28 Apr 2004 |
-- |
-- |
-- |
| 29 Apr 2004 |
-- |
Strong to N |
-- |
-- |
On 14 April 2004 a fishing craft reported a white gas plume emerging from Tatarinov volcano. That volcano lies near the opposite (southern) end of Paramushir Island. The plume came from Tatarinov's fumarolic field and remained at low altitude following the Tukharka river. Also in the southern part of Paramushir island, the volcanoes Chikurachki (last active 17-18 April 2003, SEAN 28:07) and Fuss Peak (SEAN 12:04) were both reported quiet.
Geologic Background. The flat-topped summit of the central cone of Ebeko volcano, one of the most active in the Kuril Islands, occupies the northern end of Paramushir Island. Three summit craters located along a SSW-NNE line form Ebeko volcano proper, at the northern end of a complex of five volcanic cones. Blocky lava flows extend west from Ebeko and SE from the neighboring Nezametnyi cone. The eastern part of the southern crater contains strong solfataras and a large boiling spring. The central crater is filled by a lake about 20 m deep whose shores are lined with steaming solfataras; the northern crater lies across a narrow, low barrier from the central crater and contains a small, cold crescentic lake. Historical activity, recorded since the late-18th century, has been restricted to small-to-moderate explosive eruptions from the summit craters. Intense fumarolic activity occurs in the summit craters, on the outer flanks of the cone, and in lateral explosion craters.
Information Contacts: Leonid and Tatiana Kotenko, Severo-Kurilsk, Paramushir Island; Olga A. Girina, Kamchatka Volcanic Eruptions Response Team (KVERT), a cooperative program of the Institute of Volcanic Geology and Geochemistry, Far East Division, Russian Academy of Sciences, Piip Ave. 9, Petropavlovsk-Kamchatsky, 683006, Russia, the Kamchatka Experimental and Methodical Seismological Department (KEMSD), GS RAS (Russia), and the Alaska Volcano Observatory (USA); Alaska Volcano Observatory (AVO), a cooperative program of the U.S. Geological Survey, 4200 University Drive, Anchorage, AK 99508-4667, USA (URL: http://www.avo.alaska.edu/), the Geophysical Institute, University of Alaska, PO Box 757320, Fairbanks, AK 99775-7320, USA, and the Alaska Division of Geological and Geophysical Surveys, 794 University Ave., Suite 200, Fairbanks, AK 99709, USA.
Karymsky
Russia
54.049°N, 159.443°E; summit elev. 1513 m
All times are local (unless otherwise noted)
Intermittent gas-ash explosions and elevated seismicity continue
Intermittent explosions and seismicity above background levels, as also reported in BGVN28:11, continued from 1 January to mid-April 2004, a time interval when the Level of Concern remained at Orange. Occasional explosions occurred without warning, sending ash as high as ~ 7000 m altitude and yielding ashfall locally and beyond the volcano. Ash deposits were detected extending in essentially all directions on various days during the report period. Clouds frequently obscured visual observation of the volcano.
During January 2004 the daily number of local shallow earthquakes varied from lows of 40-80 to highs of 200-300. Similarly, in February, shallow events varied from lows of 30-40 to highs of 160-200. However, in March, particularly after the early part of the month, the highest daily numbers rose to 240-380. The highest daily numbers reached still higher during April, to as high as 300-470.
Up to five ash-gas explosions occurred on specific days during each month. These explosions sent plumes to altitudes of ~ 3-5 km during January (although pilot reports sometimes estimated higher plumes, to 5.5 to 7 km altitude). Plumes rose to ~ 2.5-6.5 km during February and March, and dropping to ~ 2.5-3.5 km during April. Thus, although more daily earthquakes occurred during April, the plume heights then appeared lower than in January-March.
During the week ending 16 January, an ash plume observed by pilots of a local airline rose to 7 km altitude and extended to the S-SW. Pilots also reported ash plumes rising up to 5.5 km altitude on 9 and12 February. On 11 February, an ash cloud rose to 10 km altitude and drifted 60 km from the volcano. Reports describing 20 February noted ash deposits extending about 35 km S.
According to satellite data from the USA and Russia, thermal anomalies of 1-4 pixels were observed during January and 1-6 pixels during February and March. However, the number of pixels increased from 1 to 10 during early April, the same period when the number of shallow earthquakes was increasing.
Geologic Background. Karymsky, the most active volcano of Kamchatka's eastern volcanic zone, is a symmetrical stratovolcano constructed within a 5-km-wide caldera that formed during the early Holocene. The caldera cuts the south side of the Pleistocene Dvor volcano and is located outside the north margin of the large mid-Pleistocene Polovinka caldera, which contains the smaller Akademia Nauk and Odnoboky calderas. Most seismicity preceding Karymsky eruptions originated beneath Akademia Nauk caldera, located immediately south. The caldera enclosing Karymsky formed about 7600-7700 radiocarbon years ago; construction of the stratovolcano began about 2000 years later. The latest eruptive period began about 500 years ago, following a 2300-year quiescence. Much of the cone is mantled by lava flows less than 200 years old. Historical eruptions have been vulcanian or vulcanian-strombolian with moderate explosive activity and occasional lava flows from the summit crater.
Information Contacts: Olga A. Girina, Kamchatka Volcanic Eruptions Response Team (KVERT), a cooperative program of the Institute of Volcanic Geology and Geochemistry, Far East Division, Russian Academy of Sciences, Piip Ave. 9, Petropavlovsk-Kamchatsky, 683006, Russia, the Kamchatka Experimental and Methodical Seismological Department (KEMSD), GS RAS (Russia), and the Alaska Volcano Observatory (USA); Alaska Volcano Observatory (AVO), a cooperative program of the U.S. Geological Survey, 4200 University Drive, Anchorage, AK 99508-4667, USA (URL: http://www.avo.alaska.edu/), the Geophysical Institute, University of Alaska, PO Box 757320, Fairbanks, AK 99775-7320, USA, and the Alaska Division of Geological and Geophysical Surveys, 794 University Ave., Suite 200, Fairbanks, AK 99709, USA.
Klyuchevskoy (Russia) — April 2004 Cite this Report
Klyuchevskoy
Russia
56.056°N, 160.642°E; summit elev. 4754 m
All times are local (unless otherwise noted)
Background seismicity March-April 2004; ash plumes on 8 April
Unrest at Kliuchevskoi continued, with occasional and repeated explosions containing ash, gas, and steam that rose as high as 7.8 km altitude during January-April 2004. The alert level remained at orange.
Strombolian activity was reported in the central crater on 11-12 January and may have occurred again during 22-26 January. Gas-steam plumes extended up to 15 km in various directions during the report period; although one containing small amounts of ash, extended 75 km to the SW on 25 January.
Table 12 presents seismicity reported by KVERT including the number of large shallow earthquakes, their local magnitudes (Ml), and the range of tremor velocity. Many weak, shallow earthquakes also occurred each week. In overview, seismicity stood above background until about March, when it dropped to background, remaining there through 29 April. After February, instrumental measure of tremor (tremor velocity, table 2) declined. The details on the number and magnitude of large shallow earthquakes (which on the week ending 6 February had risen to ~ 430 Ml 1.2-2.0) ceased being a reported topic after February, although these earthquakes continued to be mentioned as occurring. Beginning in late February, earthquakes at depths up to 30 km were reported in moderate number ("deeper earthquakes"; table 2).
Table 12. Weekly seismic activity at Kliuchevskoi recorded 9 January to 29 April 2004. Some changes in reporting practices shifted around the week ending 27 February. The depth cutoffs for the two earthquake categories (shallow vs. deeper) were not disclosed; -- means not reported; ML refers to local magnitude, and ML? signifies an unstated magnitude. Courtesy of KVERT.
| Period ending |
Seismicity level |
Shallow earthquakes (number/local magnitude) |
Deeper earthquakes (daily number/magnitude/depth in km) |
Tremor velocity (µm/s) |
| 09 Jan 2004 |
above bkgd |
~115 / 1.9-2.3 |
-- |
4-8 |
| 16 Jan 2004 |
above bkgd |
~175 / 1.9-2.5 |
-- |
7-8 (11-13 Jan); 15-20 (12-15 Jan) |
| 23 Jan 2004 |
above bkgd |
~130 / 1.9-2.3 |
-- |
6-13 |
| 30 Jan 2004 |
above bkgd |
~130 / 1.9-2.3 |
-- |
3-16 |
| 06 Feb 2004 |
above bkgd |
~430 / 1.2-2.0 |
1-5 / ML = 1.2-2.0 / 3-6 |
1-2 |
| 13 Feb 2004 |
above bkgd |
~225 / 1.25-2.0 |
1-5 /ML less than 2.25 / 3-6 |
0.5-1 |
| 20 Feb 2004 |
above bkgd |
~135 / 1.25-1.7 |
1-6 / ML = 1.25-1.85 / 3-6 |
0.4-0.9 |
| 27 Feb 2004 |
above bkgd |
~160 / 1.25-1.75 |
~2 / ML = 1.25-2.25 / 3-7; 22-25 Feb: ~7 / ML? / 30 |
0.4-0.6 |
| 06 Mar 2004 |
slightly above bkgd |
-- |
26-7 Feb: 6 / ML = 1.25-2.2 / 3-7; 26 Feb-1 Mar: ~2 / ML? / 30 |
0.2-0.5 |
| 12 Mar 2004 |
at bkgd |
-- |
38 / ML = 1.25-1.6 / 30 |
0.2 |
| 19 Mar 2004 |
at bkgd |
-- |
~7 / ML = 1.2-1.7 / 30; 11-14 Mar: 1 / ML = 1.5-2.0 / 3-7 |
0.2-0.3 |
| 26 Mar 2004 |
at bkgd |
-- |
~2 / ML = 1.25-1.6 / 30; 25, 26, 30 Mar: 1 / ML = 1.2-2.1 / 3-12 |
0.2-0.4 |
| 02 Apr 2004 |
at bkgd |
-- |
26, 28, 30 Mar: 1 / ML = 1.2-2.1 / 3-12; 25, 26, 30 Mar: ~2 / ML = 1.25-1.6 / 30 |
0.2-0.4 |
| 09 Apr 2004 |
at bkgd |
-- |
~3 / ML = 1.25-1.85 / 30 |
0.2-0.4 |
| 16 Apr 2004 |
at bkgd |
-- |
~10 / ML = 1.25-1.8 / 30 |
0.2-0.4 |
| 22 Apr 2004 |
at bkgd |
-- |
~8 / ML = 1.25-1.7 / 30 |
0.2-0.4 |
| 29 Apr 2004 |
at bkgd |
-- |
~5 / ML = 1.25-1.75 / 30 |
0.21-0.25 |
Gas plumes frequently rose as high as 5.8 km altitude each week, with gas plumes rising 5.8-7.8 km altitude during 24-25 January. Seismic activity continued to be above background level throughout January and February (as it was in December 2003, BGVN 28:12), but in mid-March, seismic activity returned to background levels and remained there through April. Ash explosions and plumes rising to 4.9-5.8 km altitude occurred during January but none were reported subsequently, although satellite data indicated an ash plume extending N-NE on 8 April. US and Russian satellites reported weak thermal anomalies (1-7 pixels) during January and February, but no anomalies were reported subsequent to 20 February. Weak fumarolic activity was reported weekly after mid-March.
Geologic Background. Klyuchevskoy (also spelled Kliuchevskoi) is Kamchatka's highest and most active volcano. Since its origin about 6000 years ago, the beautifully symmetrical, 4835-m-high basaltic stratovolcano has produced frequent moderate-volume explosive and effusive eruptions without major periods of inactivity. It rises above a saddle NE of sharp-peaked Kamen volcano and lies SE of the broad Ushkovsky massif. More than 100 flank eruptions have occurred during the past roughly 3000 years, with most lateral craters and cones occurring along radial fissures between the unconfined NE-to-SE flanks of the conical volcano between 500 m and 3600 m elevation. The morphology of the 700-m-wide summit crater has been frequently modified by historical eruptions, which have been recorded since the late-17th century. Historical eruptions have originated primarily from the summit crater, but have also included numerous major explosive and effusive eruptions from flank craters.
Information Contacts: Olga A. Girina, Kamchatka Volcanic Eruptions Response Team (KVERT), a cooperative program of the Institute of Volcanic Geology and Geochemistry, Far East Division, Russian Academy of Sciences, Piip Ave. 9, Petropavlovsk-Kamchatsky, 683006, Russia, the Kamchatka Experimental and Methodical Seismological Department (KEMSD), GS RAS (Russia), and the Alaska Volcano Observatory (USA); Alaska Volcano Observatory (AVO), a cooperative program of the U.S. Geological Survey, 4200 University Drive, Anchorage, AK 99508-4667, USA (URL: http://www.avo.alaska.edu/), the Geophysical Institute, University of Alaska, PO Box 757320, Fairbanks, AK 99775-7320, USA, and the Alaska Division of Geological and Geophysical Surveys, 794 University Ave., Suite 200, Fairbanks, AK 99709, USA.
Manam (Papua New Guinea) — April 2004 Cite this Report
Manam
Papua New Guinea
4.08°S, 145.037°E; summit elev. 1807 m
All times are local (unless otherwise noted)
Suggestions of mild activity; February and April ash discharges
The Rabaul Volcano Observatory reported that activity at Manam's two main summit craters remained low to mild during February-April 2004. No HIGP-MODIS thermal alerts were recorded at Manam over the year to 11 May 2004. While RVO noted that the summit was covered in cloud for most of February, when it was clear the craters were releasing white vapor at weak to moderate rates. They reported that February's single explosion occurred at the Southern Crater on the 14th; it was accompanied by a thick gray ash cloud and weak roaring noises. The ash cloud rose several hundred meters above the summit and drifted NW producing fine ashfall. There was no night-time glow observed during the month.
Mild eruptive activity occurred at the Southern Crater over the period 15 March-1 April, with emissions of brown ash on 17, 18, 27, and 28 March. The ash clouds rose ~ 100-300 m above the summit and drifted SE, depositing small amounts of ash in the villages of Boakure and Warisi. Vapor was also emitted from Main Crater. Small low-frequency earthquakes occurred over the report period, with a slight increase in the amplitude of volcanic earthquakes on 24 March. Overall the level of seismicity remained low. RVO continued to advise people to stay away from the four main valleys near the volcano.
Geologic Background. The 10-km-wide island of Manam, lying 13 km off the northern coast of mainland Papua New Guinea, is one of the country's most active volcanoes. Four large radial valleys extend from the unvegetated summit of the conical basaltic-andesitic stratovolcano to its lower flanks. These valleys channel lava flows and pyroclastic avalanches that have sometimes reached the coast. Five small satellitic centers are located near the island's shoreline on the northern, southern, and western sides. Two summit craters are present; both are active, although most observed eruptions have originated from the southern crater, concentrating eruptive products during much of the past century into the SE valley. Frequent eruptions, typically of mild-to-moderate scale, have been recorded since 1616. Occasional larger eruptions have produced pyroclastic flows and lava flows that reached flat-lying coastal areas and entered the sea, sometimes impacting populated areas.
Information Contacts: Ima Itikarai and Herman Patia, Rabaul Volcano Observatory, Papua New Guinea.
Nyamulagira (DR Congo) — April 2004 Cite this Report
Nyamulagira
DR Congo
1.408°S, 29.2°E; summit elev. 3058 m
All times are local (unless otherwise noted)
New eruption on 8 May spawns cones, lava lake, fountains, and lava flows
The Observatoire Volcanologique de Goma (Goma Volcano Observatory, GVO) reported that a new eruption at Nyamuragira began at 0548 on 8 May 2004. Activity started in the summit caldera and later propagated to the N flank. Since July 2003 Nyamuragira had shown abnormal behavior, having an average of 3 distinct seismic swarms per month (see Bulletin, v. 28, no. 9, 10, and 12). The last of these swarms occurred during 4-6 May 2004. The eruption was also preceded by an important high frequency (HF) earthquake felt in the Virunga area at 0144 on 8 May, localized below the N part of Lake Kivu. This event was followed at 0315 on 8 May by a high-amplitude long-period earthquake located N of Virunga. Unusual and significant fumarolic activity from the Nyamuragira caldera was seen from Goma (~ 40 km S) on 2 May 2004.
On its overpass of Nyamuragira at 1056 on 8 May 2004, the Earth Probe Total Ozone Mapping Spectrometer (EP TOMS) detected large SO2 clouds released by the current eruption of Nyamuragira. However, the situation was complicated by the fact that EP TOMS has recorded SO2 emissions from Nyiragongo (~ 15 km SSE of Nyamuragira) since October 2002, and therefore some SO2 from Nyiragongo was also likely to be present. Daily SO2 amounts observed at Nyiragongo over the past month have been in the range of ~ 5-30 kilotons (kt). An SO2 cloud was detected extending in several directions from Nyamuragira, containing ~ 30 kt of SO2. A data gap over eastern Democratic Republic of Congo (DRC) prevented measurements on 9 May, although there was evidence for some SO2 drifting over northern Tanzania, ~ 720 km from Nyamuragira.
On 10 May at 1055 a broad SO2 cloud extended up to ~ 180 km W, ~ 360 km S, and ~ 260 km ESE of the volcano, completely covering Rwanda and Burundi, with the highest SO2 concentrations detected in a zone directed SSE across Rwanda. This cloud contained ~ 190 kt of SO2. Another data gap on 11 May prevented measurements directly over eastern DRC, but a large SO2 mass (~ 116 kt) was present W of the data gap, ~ 560 km S of Nyamuragira at its maximum extent. No ash was detected in the volcanic clouds by EP TOMS as of 12 May, and the maximum altitude reached by the SO2 was unclear. A number of anomalous pixels indicating a hot spot just N of Nyamuragira were observed at 1030 on 9 May from the MODIS (Moderate Resolution Imaging Spectroradiometer) thermal satellite imagery (URL: http://modis.higp.hawaii.edu/).
Overflights attempted by GVO on 8 May failed because of the rainy season's bad weather, but the quick glimpse suggested a significant lava flow descending the N slope. On 9 and 12 May GVO plane overflights and a field mission in the area located to the volcano's N revealed that one active lava lake appeared an unstated distance NNE of the Nyamuragira caldera. This lake, ~ 300 m in diameter, was located in a pit ~ 15 m deep and fed by 4 strong lava fountains. Activity was much reduced by 12 May. The surface was a solid crust with three vents open through it. All vents displayed Strombolian activity with spatter splashing and short lava overflows; accumulation of spatter tends to build low cones.
An eruptive fracture, ~ 2 km long, was found on the N-NW flank of the volcano. Several lava fountains were very active all along the fracture and 4 main cones were building up to heights estimated as 30-50 m. Lava poured from many vents and turned into a main flow directed towards the N-NW, always within the Virunga National Park boundaries. Flows made an intricate delta below the lower cone, turning onto a very wide lava flow that covered an area with a total length estimated to be ~ 12 km. Although this flow continued to move, it failed to threaten any populated areas. Ashfalls were observed in several villages on the W and N sides of the volcano. The activity remained quite strong and apparently stable in comparison with other documented Nyamuragira eruptions.
Geologic Background. Africa's most active volcano, Nyamulagira (also known as Nyamuragira), is a massive high-potassium basaltic shield about 25 km N of Lake Kivu and 13 km NNW of the steep-sided Nyiragongo volcano. The summit is truncated by a small 2 x 2.3 km caldera that has walls up to about 100 m high. Documented eruptions have occurred within the summit caldera, as well as from the numerous flank fissures and cinder cones. A lava lake in the summit crater, active since at least 1921, drained in 1938, at the time of a major flank eruption. Recent lava flows extend down the flanks more than 30 km from the summit as far as Lake Kivu; extensive lava flows from this volcano have covered 1,500 km2 of the western branch of the East African Rift.
Information Contacts: Kasereka Mahinda and Jacques Durieux, Observatoire Volcanologique de Goma (Goma Volcano Observatory), Department de Geophysique, Centre de Recherche en Sciences Naturelles, Lwiro, D.S. Bukavu, DR Congo; Simon Carn, TOMS Volcanic Emissions Group, University of Maryland, 1000 Hilltop Circle, Baltimore, MD 21250, USA (URL: https://so2.gsfc.nasa.gov/).
Rabaul (Papua New Guinea) — April 2004 Cite this Report
Rabaul
Papua New Guinea
4.2459°S, 152.1937°E; summit elev. 688 m
All times are local (unless otherwise noted)
Tavurvur cone's eruptions pause or cease, starting 17 February; MODIS data
The Rabaul Volcano Observatory has reported that eruptive activity from the Tavurvur crater at Rabaul, which began in early October 2002, ceased on 17 February 2004. Activity during 1-17 February was characterized by emissions of light pale ash clouds with occasional moderate explosions producing thick ash plumes. The plumes rose 1-2 above the summit, resulting in ashfall to the E and NE, including in Duke of York. A slight change in wind direction on 6 and 13-15 February resulted in fine ashfall to the NW over Rabaul city and villages downwind. Occasional weak roaring noises were heard with some of the explosions on 5 and 11 February.
Seismic activity was consistent with the ash emissions, with one high frequency event NE of the caldera on 5 February. The real-time GPS and electronic tilt site on Matupit Island, in the center of the caldera, showed a deflationary trend since the middle of the month, a reversal of the long-term trend of slow gradual uplift reported earlier (BGVN 28:03, 28:09, and 28:11). During 18-29 February Tavurvur released weak white, and occasional blue, vapor.
A review of MODIS data for the year to 11 May 2004 showed thermal alerts recorded at Tavurvur cone, Rabaul, on 12, 21, and 29 October; 1, 8, 15, and 24 November; 1 and 26 December 2003; and 9 and 25 January 2004.
Geologic Background. The low-lying Rabaul caldera on the tip of the Gazelle Peninsula at the NE end of New Britain forms a broad sheltered harbor utilized by what was the island's largest city prior to a major eruption in 1994. The outer flanks of the asymmetrical shield volcano are formed by thick pyroclastic-flow deposits. The 8 x 14 km caldera is widely breached on the east, where its floor is flooded by Blanche Bay and was formed about 1,400 years ago. An earlier caldera-forming eruption about 7,100 years ago is thought to have originated from Tavui caldera, offshore to the north. Three small stratovolcanoes lie outside the N and NE caldera rims. Post-caldera eruptions built basaltic-to-dacitic pyroclastic cones on the caldera floor near the NE and W caldera walls. Several of these, including Vulcan cone, which was formed during a large eruption in 1878, have produced major explosive activity during historical time. A powerful explosive eruption in 1994 occurred simultaneously from Vulcan and Tavurvur volcanoes and forced the temporary abandonment of Rabaul city.
Information Contacts: Ima Itikarai and Herman Patia, Rabaul Volcano Observatory (RVO), P.O. Box 386, Rabaul, Papua New Guinea; Rob Wright, Luke Flynn, and Eric Pilger; MODIS Thermal Alert System, Hawaii Institute of Geophysics and Planetology (HIGP), School of Ocean and Earth Science and Technology, University of Hawaii at Manoa (URL: http://modis.hgip.hawaii.edu/).
Ulawun (Papua New Guinea) — April 2004 Cite this Report
Ulawun
Papua New Guinea
5.05°S, 151.33°E; summit elev. 2334 m
All times are local (unless otherwise noted)
Quiet during early 2004; thin ash plumes 12-14 April
The Rabaul Volcano Observatory (RVO) reported that activity at Ulawun remained quiet during February 2004. The main vent emitted white vapor at weak to moderate rates. No emissions were reported from the two north valley vents. No noise or night time glow was reported, and seismicity was at a low level. RVO reported in similar terms for the period 15 March-1 April, noting also that tiltmeter measurements recorded a long-term inflationary trend. According to Darwin VAAC, on 12 and 13 April thin ash plumes from Ulawun were visible on satellite imagery at a height of -~ 700 m above the volcano extending ~ 75 E and NE. On 14 April the ash plume rose ~ 3 km altitude and extended ~ 37 km NE. No HIGP-MODIS thermal alerts were recorded at Ulawun over the year to 11 May 2004.
Note that a 16 January 2001 VAAC report of Ulawun emitting a cloud, ashes, and 'flames' ~ 10.6 km altitude, which was not confirmed by satellite imagery or RVO, has not previously been mentioned in the Bulletin.
Geologic Background. The symmetrical basaltic-to-andesitic Ulawun stratovolcano is the highest volcano of the Bismarck arc, and one of Papua New Guinea's most frequently active. The volcano, also known as the Father, rises above the N coast of the island of New Britain across a low saddle NE of Bamus volcano, the South Son. The upper 1,000 m is unvegetated. A prominent E-W escarpment on the south may be the result of large-scale slumping. Satellitic cones occupy the NW and E flanks. A steep-walled valley cuts the NW side, and a flank lava-flow complex lies to the south of this valley. Historical eruptions date back to the beginning of the 18th century. Twentieth-century eruptions were mildly explosive until 1967, but after 1970 several larger eruptions produced lava flows and basaltic pyroclastic flows, greatly modifying the summit crater.
Information Contacts: Ima Itikarai and Herman Patia, Rabaul Volcano Observatory, Papua New Guinea; Darwin Volcanic Ash Advisory Centre (VAAC), Commonwealth Bureau of Meteorology, Northern Territory Regional Office, PO Box 40050, Casuarina, NT, 0811, Australia (URL: http://www.bom.gov.au/info/vacc/).
Witori (Papua New Guinea) — April 2004 Cite this Report
Witori
Papua New Guinea
5.5745°S, 150.5161°E; summit elev. 724 m
All times are local (unless otherwise noted)
Recharacterization of reported 24 February eruptive activity
A message in mid-April from Rabaul Volcano Observatory's assistant director, Ima Itikarai, to Dan Shackelford indicated that their previous Pago report (BGVN 29:02), which noted two eruptions on 24 February 2004, was no longer believed to be true. Described activity, especially felt tremors, contradicted instrumental data. After discussions with local observers Itikarai concluded that "the reported activity may not be true." Although no explanation was given for the reports of ashfall or glow, the message noted that the "jet-like noises" may have been low-frequency sounds from local thunderstorms.
RVO reports for 15 March-1 April noted that Pago's volcanic and seismic activity remained at low levels. All vents gently released small volumes of 'thin white vapor,' with small amounts of 'blue vapor' from the lower vents on some days. A dull glow was observed on 17 March.
Geologic Background. The active Pago cone has grown within the Witori caldera (5.5 x 7.5 km) on the northern coast of central New Britain contains the active Pago cone. The gently sloping outer caldera flanks consist primarily of dacitic pyroclastic-flow and airfall deposits produced during a series of five major explosive eruptions from about 5,600 to 1,200 years ago, many of which may have been associated with caldera formation. Pago cone may have formed less than 350 years ago; it has grown to a height above the caldera rim, and a series of ten dacitic lava flows from it covers much of the caldera floor. The youngest of these was erupted during 2002-2003 from vents extending from the summit nearly to the NW caldera wall. The Buru caldera cuts the SW flank.
Information Contacts: Ima Itikarai and Herman Patia, Rabaul Volcano Observatory, Papua New Guinea.