Recently Published Bulletin Reports
Manam (Papua New Guinea) Few ash plumes during November-December 2022
Krakatau (Indonesia) Strombolian activity and ash plumes during November 2022-April 2023
Stromboli (Italy) Strombolian explosions and lava flows continue during January-April 2023
Nishinoshima (Japan) Small ash plumes and fumarolic activity during November 2022 through April 2023
Karangetang (Indonesia) Lava flows, incandescent avalanches, and ash plumes during January-June 2023
Ahyi (United States) Intermittent hydroacoustic signals and discolored plumes during November 2022-June 2023
Kadovar (Papua New Guinea) An ash plume and weak thermal anomaly during May 2023
San Miguel (El Salvador) Small gas-and-ash explosions during March and May 2023
Semisopochnoi (United States) Occasional explosions, ash deposits, and gas-and-steam plumes during December 2022-May 2023
Ebeko (Russia) Continued explosions, ash plumes, and ashfall during October 2022-May 2023
Home Reef (Tonga) Discolored plumes continued during November 2022-April 2023
Ambae (Vanuatu) New lava flow, ash plumes, and sulfur dioxide plumes during February-May 2023
Manam (Papua New Guinea) — July 2023  Cite this Report
Manam
Papua New Guinea
4.08°S, 145.037°E; summit elev. 1807 m
All times are local (unless otherwise noted)
Few ash plumes during November-December 2022
Manam is a 10-km-wide island that consists of two active summit craters: the Main summit crater and the South summit crater and is located 13 km off the northern coast of mainland Papua New Guinea. Frequent mild-to-moderate eruptions have been recorded since 1616. The current eruption period began during June 2014 and has more recently been characterized by intermittent ash plumes and thermal activity (BGVN 47:11). This report updates activity that occurred from November 2022 through May 2023 based on information from the Darwin Volcanic Ash Advisory Center (VAAC) and various satellite data.
Ash plumes were reported during November and December 2022 by the Darwin VAAC. On 7 November an ash plume rose to 2.1 km altitude and drifted NE based on satellite images and weather models. On 14 November an ash plume rose to 2.1 km altitude and drifted W based on RVO webcam images. On 20 November ash plumes rose to 1.8 km altitude and drifted NW. On 26 December an ash plume rose to 3 km altitude and drifted S and SSE.
Intermittent sulfur dioxide plumes were detected using the TROPOMI instrument on the Sentinel-5P satellite, some of which exceeded at least two Dobson Units (DU) and drifted in different directions (figure 93). Occasional low-to-moderate power thermal anomalies were recorded by the MIROVA (Middle InfraRed Observation of Volcanic Activity) system; less than five anomalies were recorded each month during November 2022 through May 2023 (figure 94). Two thermal hotspots were detected by the MODVOLC thermal alerts system on 10 December 2022. On clear weather days, thermal activity was also captured in infrared satellite imagery in both the Main and South summit craters, accompanied by gas-and-steam emissions (figure 95).
Geologic Background. The 10-km-wide island of Manam, lying 13 km off the northern coast of mainland Papua New Guinea, is one of the country's most active volcanoes. Four large radial valleys extend from the unvegetated summit of the conical basaltic-andesitic stratovolcano to its lower flanks. These valleys channel lava flows and pyroclastic avalanches that have sometimes reached the coast. Five small satellitic centers are located near the island's shoreline on the northern, southern, and western sides. Two summit craters are present; both are active, although most observed eruptions have originated from the southern crater, concentrating eruptive products during much of the past century into the SE valley. Frequent eruptions, typically of mild-to-moderate scale, have been recorded since 1616. Occasional larger eruptions have produced pyroclastic flows and lava flows that reached flat-lying coastal areas and entered the sea, sometimes impacting populated areas.
Information Contacts: Rabaul Volcano Observatory (RVO), Geohazards Management Division, Department of Mineral Policy and Geohazards Management (DMPGM), PO Box 3386, Kokopo, East New Britain Province, Papua New Guinea; Darwin Volcanic Ash Advisory Centre (VAAC), Bureau of Meteorology, Northern Territory Regional Office, PO Box 40050, Casuarina, NT 0811, Australia (URL: http://www.bom.gov.au/info/vaac/); MIROVA (Middle InfraRed Observation of Volcanic Activity), a collaborative project between the Universities of Turin and Florence (Italy) supported by the Centre for Volcanic Risk of the Italian Civil Protection Department (URL: http://www.mirovaweb.it/); Hawai'i Institute of Geophysics and Planetology (HIGP) - MODVOLC Thermal Alerts System, School of Ocean and Earth Science and Technology (SOEST), Univ. of Hawai'i, 2525 Correa Road, Honolulu, HI 96822, USA (URL: http://modis.higp.hawaii.edu/); NASA Global Sulfur Dioxide Monitoring Page, Atmospheric Chemistry and Dynamics Laboratory, NASA Goddard Space Flight Center (NASA/GSFC), 8800 Greenbelt Road, Goddard, Maryland, USA (URL: https://so2.gsfc.nasa.gov/); Copernicus Browser, Copernicus Data Space Ecosystem, European Space Agency (URL: https://dataspace.copernicus.eu/browser/).
Krakatau (Indonesia) — July 2023 Cite this Report
Krakatau
Indonesia
6.1009°S, 105.4233°E; summit elev. 285 m
All times are local (unless otherwise noted)
Strombolian activity and ash plumes during November 2022-April 2023
Krakatau is located in the Sunda Strait between Java and Sumatra, Indonesia. Caldera collapse during the catastrophic 1883 eruption destroyed Danan and Perbuwatan cones and left only a remnant of Rakata. The post-collapse cone of Anak Krakatau (Child of Krakatau) was constructed within the 1883 caldera at a point between the former Danan and Perbuwatan cones; it has been the site of frequent eruptions since 1927. The current eruption period began in May 2021 and has recently consisted of explosions, ash plumes, and thermal activity (BGVN 47:11). This report covers activity during November 2022 through April 2023 based on information provided by the Indonesian Center for Volcanology and Geological Hazard Mitigation, referred to as Pusat Vulkanologi dan Mitigasi Bencana Geologi (PVMBG), MAGMA Indonesia, the Darwin Volcanic Ash Advisory Center (VAAC), and several sources of satellite data.
Activity was relatively low during November and December 2022. Daily white gas-and-steam plumes rose 25-100 m above the summit and drifted in different directions. Gray ash plumes rose 200 m above the summit and drifted NE at 1047 and at 2343 on 11 November. On 14 November at 0933 ash plumes rose 300 m above the summit and drifted E. An ash plume was reported at 0935 on 15 December that rose 100 m above the summit and drifted NE. An eruptive event at 1031 later that day generated an ash plume that rose 700 m above the summit and drifted NE. A gray ash plume at 1910 rose 100 m above the summit and drifted E. Incandescent material was ejected above the vent based on an image taken at 1936.
During January 2023 daily white gas-and-steam plumes rose 25-300 m above the summit and drifted in multiple directions. Gray-to-brown ash plumes were reported at 1638 on 3 January, at 1410 and 1509 on 4 January, and at 0013 on 5 January that rose 100-750 m above the summit and drifted NE and E; the gray-to-black ash plume at 1509 on 4 January rose as high as 3 km above the summit and drifted E. Gray ash plumes were recorded at 1754, 2241, and 2325 on 11 January and at 0046 on 12 January and rose 200-300 m above the summit and drifted NE. Toward the end of January, PVMBG reported that activity had intensified; Strombolian activity was visible in webcam images taken at 0041, 0043, and 0450 on 23 January. Multiple gray ash plumes throughout the day rose 200-500 m above the summit and drifted E and SE (figure 135). Webcam images showed progressively intensifying Strombolian activity at 1919, 1958, and 2113 on 24 January; a gray ash plume at 1957 rose 300 m above the summit and drifted E (figure 135). Eruptive events at 0231 and 2256 on 25 January and at 0003 on 26 January ejected incandescent material from the vent, based on webcam images. Gray ash plumes observed during 26-27 January rose 300-500 m above the summit and drifted NE, E, and SE.
Low levels of activity were reported during February and March. Daily white gas-and-steam plumes rose 25-300 m above the summit and drifted in different directions. The Darwin VAAC reported that continuous ash emissions rose to 1.5-1.8 km altitude and drifted W and NW during 1240-1300 on 10 March, based on satellite images, weather models, and PVMBG webcams. White-and-gray ash plumes rose 500 m and 300 m above the summit and drifted SW at 1446 and 1846 on 18 March, respectively. An eruptive event was recorded at 2143, though it was not visible due to darkness. Multiple ash plumes were reported during 27-29 March that rose as high as 2.5 km above the summit and drifted NE, W, and SW (figure 136). Webcam images captured incandescent ejecta above the vent at 0415 and around the summit area at 2003 on 28 March and at 0047 above the vent on 29 March.
Daily white gas-and-steam plumes rose 25-300 m above the summit and drifted in multiple directions during April and May. White-and-gray and black plumes rose 50-300 m above the summit on 2 and 9 April. On 11 May at 1241 a gray ash plume rose 1-3 km above the summit and drifted SW. On 12 May at 0920 a gray ash plume rose 2.5 km above the summit and drifted SW and at 2320 an ash plume rose 1.5 km above the summit and drifted SW. An accompanying webcam image showed incandescent ejecta. On 13 May at 0710 a gray ash plume rose 2 km above the summit and drifted SW (figure 137).
The MIROVA (Middle InfraRed Observation of Volcanic Activity) graph of MODIS thermal anomaly data showed intermittent low-to-moderate power thermal anomalies during November 2022 through April 2023 (figure 138). Some of this thermal activity was also visible in infrared satellite imagery at the crater, accompanied by gas-and-steam and ash plumes that drifted in different directions (figure 139).
Geologic Background. The renowned Krakatau (frequently mis-named as Krakatoa) volcano lies in the Sunda Strait between Java and Sumatra. Collapse of an older edifice, perhaps in 416 or 535 CE, formed a 7-km-wide caldera. Remnants of that volcano are preserved in Verlaten and Lang Islands; subsequently the Rakata, Danan, and Perbuwatan cones were formed, coalescing to create the pre-1883 Krakatau Island. Caldera collapse during the catastrophic 1883 eruption destroyed Danan and Perbuwatan, and left only a remnant of Rakata. This eruption caused more than 36,000 fatalities, most as a result of tsunamis that swept the adjacent coastlines of Sumatra and Java. Pyroclastic surges traveled 40 km across the Sunda Strait and reached the Sumatra coast. After a quiescence of less than a half century, the post-collapse cone of Anak Krakatau (Child of Krakatau) was constructed within the 1883 caldera at a point between the former Danan and Perbuwatan cones. Anak Krakatau has been the site of frequent eruptions since 1927.
Information Contacts: Pusat Vulkanologi dan Mitigasi Bencana Geologi (PVMBG, also known as Indonesian Center for Volcanology and Geological Hazard Mitigation, CVGHM), Jalan Diponegoro 57, Bandung 40122, Indonesia (URL: http://www.vsi.esdm.go.id/); MAGMA Indonesia, Kementerian Energi dan Sumber Daya Mineral (URL: https://magma.esdm.go.id/v1); Darwin Volcanic Ash Advisory Centre (VAAC), Bureau of Meteorology, Northern Territory Regional Office, PO Box 40050, Casuarina, NT 0811, Australia (URL: http://www.bom.gov.au/info/vaac/); MIROVA (Middle InfraRed Observation of Volcanic Activity), a collaborative project between the Universities of Turin and Florence (Italy) supported by the Centre for Volcanic Risk of the Italian Civil Protection Department (URL: http://www.mirovaweb.it/); Copernicus Browser, Copernicus Data Space Ecosystem, European Space Agency (URL: https://dataspace.copernicus.eu/browser/).
Stromboli
Italy
38.789°N, 15.213°E; summit elev. 924 m
All times are local (unless otherwise noted)
Strombolian explosions and lava flows continue during January-April 2023
Stromboli, located in Italy, has exhibited nearly constant lava fountains for the past 2,000 years; recorded eruptions date back to 350 BCE. Eruptive activity occurs at the summit from multiple vents, which include a north crater area (N area) and a central-southern crater (CS area) on a terrace known as the ‘terrazza craterica’ at the head of the Sciara del Fuoco, a large scarp that runs from the summit down the NW side of the volcano-island. Activity typically consists of Strombolian explosions, incandescent ejecta, lava flows, and pyroclastic flows. Thermal and visual monitoring cameras are located on the nearby Pizzo Sopra La Fossa, above the terrazza craterica, and at multiple flank locations. The current eruption period has been ongoing since 1934 and recent activity has consisted of frequent Strombolian explosions and lava flows (BGVN 48:02). This report updates activity during January through April 2023 primarily characterized by Strombolian explosions and lava flows based on reports from Italy's Istituto Nazionale di Geofisica e Vulcanologia (INGV) and various satellite data.
Frequent explosive activity continued throughout the reporting period, generally in the low-to-medium range, based on the number of hourly explosions in the summit crater (figure 253, table 16). Intermittent thermal activity was recorded by the MIROVA (Middle InfraRed Observation of Volcanic Activity) analysis of MODIS satellite data (figure 254). According to data collected by the MODVOLC thermal algorithm, a total of 9 thermal alerts were detected: one on 2 January 2023, one on 1 February, five on 24 March, and two on 26 March. The stronger pulses of thermal activity likely reflected lava flow events. Infrared satellite imagery captured relatively strong thermal hotspots at the two active summit craters on clear weather days, showing an especially strong event on 8 March (figure 255).
Table 16. Summary of type, frequency, and intensity of explosive activity at Stromboli by month during January-April 2023; information from webcam observations. Courtesy of INGV weekly reports.
| Month |
Explosive Activity |
| Jan 2023 |
Typical Strombolian activity with spattering and lava overflows in the N crater area. Explosions were reported from 4 vents in the N area and 1-2 vents in the CS area. The average hourly frequency of explosions was low-to-medium (1-12 events/hour). The intensity of the explosions varied from low (less than 80 m high) to medium (less than 150 m high) in the N crater area and up to high (greater than 150 m high) in the CS crater area. |
| Feb 2023 |
Typical Strombolian activity with spattering in the N crater area. Explosions were reported from 2-3 vents in the N area and 1-4 vents in the CS area. The average hourly frequency of explosions was low-to-medium (1-14 events/hour). The intensity of the explosions varied from low (less than 80 m high) to medium (less than 150 m high) in the N crater area and up to high (greater than 150 m high) in the CS crater area. |
| Mar 2023 |
Typical Strombolian activity with spattering and lava overflows in the N crater area. Explosions were reported from 2-3 vents in the N area and 2-4 vents in the CS area. The average hourly frequency of explosions was low-to-medium (1-18 events/hour). The intensity of the explosions varied from low (less than 80 m high) to medium (less than 150 m high) in the N crater area and up to high (greater than 150 m high) in the CS crater area. |
| Apr 2023 |
Typical Strombolian activity. Explosions were reported from 2 vents in the N area and 2-3 vents in the CS area. The average hourly frequency of explosions was low-to-high (1-16 events/hour). The intensity of the explosions varied from low (less than 80 m high) to medium (less than 150 m high) in both the N and CS crater areas. |
Activity during January-February 2023. Strombolian explosions were reported in the N crater area, as well as lava effusion. Explosive activity in the N crater area ejected coarse material (bombs and lapilli). Intense spattering was observed in both the N1 and N2 craters. In the CS crater area, explosions generally ejected fine material (ash), sometimes to heights greater than 250 m. The intensity of the explosions was characterized as low-to-medium in the N crater and medium-to-high in the CS crater. After intense spattering activity from the N crater area, a lava overflow began at 2136 on 2 January that flowed part way down the Sciara del Fuoco, possibly moving down the drainage that formed in October, out of view from webcams. The flow remained active for a couple of hours before stopping and beginning to cool. A second lava flow was reported at 0224 on 4 January that similarly remained active for a few hours before stopping and cooling. Intense spattering was observed on 11 and 13 January from the N1 crater. After intense spattering activity at the N2 crater at 1052 on 17 January another lava flow started to flow into the upper part of the Sciara del Fuoco (figure 256), dividing into two: one that traveled in the direction of the drainage formed in October, and the other one moving parallel to the point of emission. By the afternoon, the rate of the flow began to decrease, and at 1900 it started to cool. A lava flow was reported at 1519 on 24 January following intense spattering in the N2 area, which began to flow into the upper part of the Sciara del Fuoco. By the morning of 25 January, the lava flow had begun to cool. During 27 January the frequency of eruption in the CS crater area increased to 6-7 events/hour compared to the typical 1-7 events/hour; the following two days showed a decrease in frequency to less than 1 event/hour. Starting at 1007 on 30 January a high-energy explosive sequence was produced by vents in the CS crater area. The sequence began with an initial energetic pulse that lasted 45 seconds, ejecting predominantly coarse products 300 m above the crater that fell in an ESE direction. Subsequent and less intense explosions ejected material 100 m above the crater. The total duration of this event lasted approximately two minutes. During 31 January through 6, 13, and 24 February spattering activity was particularly intense for short periods in the N2 crater.
An explosive sequence was reported on 16 February that was characterized by a major explosion in the CS crater area (figure 257). The sequence began at 1817 near the S2 crater that ejected material radially. A few seconds later, lava fountains were observed in the central part of the crater. Three explosions of medium intensity (material was ejected less than 150 m high) were recorded at the S2 crater. The first part of this sequence lasted approximately one minute, according to INGV, and material rose 300 m above the crater and then was deposited along the Sciara del Fuoco. The second phase began at 1818 at the S1 crater; it lasted seven seconds and material was ejected 150 m above the crater. Another event 20 seconds later lasted 12 seconds, also ejecting material 150 m above the crater. The sequence ended with at least three explosions of mostly fine material from the S1 crater. The total duration of this sequence was about two minutes.
Short, intense spattering activity was noted above the N1 crater on 27 and 28 February. A lava overflow was first reported at 0657 from the N2 crater on 27 February that flowed into the October 2022 drainage. By 1900 the flow had stopped. A second lava overflow also in the N crater area occurred at 2149, which overlapped the first flow and then stopped by 0150 on 28 February. Material detached from both the lava overflows rolled down the Sciara del Fuoco, some of which was visible in webcam images.
Activity during March-April 2023. Strombolian activity continued with spattering activity and lava overflows in the N crater area during March. Explosive activity at the N crater area varied from low (less than 80 m high) to medium (less than 150 m high) and ejected coarse material, such as bombs and lapilli. Spattering was observed above the N1 crater, while explosive activity at the CS crater area varied from medium to high (greater than 150 m high) and ejected coarse material. Intense spattering activity was observed for short periods on 6 March above the N1 crater. At approximately 0610 a lava overflow was reported around the N2 crater on 8 March, which then flowed into the October 2022 drainage. By 1700 the flow started to cool. A second overflow began at 1712 on 9 March and overlapped the previous flow. It had stopped by 2100. Material from both flows was deposited along the Sciara del Fuoco, though much of the activity was not visible in webcam images. On 11 March a lava overflow was observed at 0215 that overlapped the two previous flows in the October 2022 drainage. By late afternoon on 12 March, it had stopped.
During a field excursion on 16 March, scientists noted that a vent in the central crater area was degassing. Another vent showed occasional Strombolian activity that emitted ash and lapilli. During 1200-1430 low-to-medium intense activity was reported; the N1 crater emitted ash emissions and the N2 crater emitted both ash and coarse material. Some explosions also occurred in the CS crater area that ejected coarse material. The C crater in the CS crater area occasionally showed gas jetting and low intensity explosions on 17 and 22 March; no activity was observed at the S1 crater. Intense, longer periods of spattering were reported in the N1 crater on 19, 24, and 25 March. Around 2242 on 23 March a lava overflow began from the N1 crater that, after about an hour, began moving down the October 2022 drainage and flow along the Sciara del Fuoco (figure 258). Between 0200 and 0400 on 26 March the flow rate increased, which generated avalanches of material from collapses at the advancing flow front. By early afternoon, the flow began to cool. On 25 March at 1548 an explosive sequence began from one of the vents at S2 in the CS crater area (figure 258). Fine ash mixed with coarse material was ejected 300 m above the crater rim and drifted SSE. Some modest explosions around Vent C were detected at 1549 on 25 March, which included an explosion at 1551 that ejected coarse material. The entire explosive sequence lasted approximately three minutes.
During April explosions persisted in both the N and CS crater areas. Fine material was ejected less than 80 m above the N crater rim until 6 April, followed by ejection of coarser material. Fine material was also ejected less than 80 m above the CS crater rim. The C and S2 crater did not show significant eruptive activity. On 7 April an explosive sequence was detected in the CS crater area at 1203 (figure 259). The first explosion lasted approximately 18 seconds and ejected material 400 m above the crater rim, depositing pyroclastic material in the upper part of the Sciara del Fuoco. At 1204 a second, less intense explosion lasted approximately four seconds and deposited pyroclastic products outside the crater area and near Pizzo Sopra La Fossa. A third explosion at 1205 was mainly composed of ash that rose about 150 m above the crater and lasted roughly 20 seconds. A fourth explosion occurred at 1205 about 28 seconds after the third explosion and ejected a mixture of coarse and fine material about 200 m above the crater; the explosion lasted roughly seven seconds. Overall, the entire explosive sequence lasted about two minutes and 20 seconds. After the explosive sequence on 7 April, explosions in both the N and CS crater areas ejected material as high as 150 m above the crater.
On 21 April research scientists from INGV made field observations in the summit area of Stromboli, and some lapilli samples were collected. In the N crater area near the N1 crater, a small cone was observed with at least two active vents, one of which was characterized by Strombolian explosions. The other vent produced explosions that ejected ash and chunks of cooled lava. At the N2 crater at least one vent was active and frequently emitted ash. In the CS crater area, a small cone contained 2-3 degassing vents and a smaller, possible fissure area also showed signs of degassing close to the Pizzo Sopra La Fossa. In the S part of the crater, three vents were active: a small hornito was characterized by modest and rare explosions, a vent that intermittently produced weak Strombolian explosions, and a vent at the end of the terrace that produced frequent ash emissions. Near the S1 crater there was a hornito that generally emitted weak gas-and-steam emissions, sometimes associated with “gas rings”. On 22 April another field inspection was carried out that reported two large sliding surfaces on the Sciara del Fuoco that showed where blocks frequently descended toward the sea. A thermal anomaly was detected at 0150 on 29 April.
Geologic Background. Spectacular incandescent nighttime explosions at Stromboli have long attracted visitors to the "Lighthouse of the Mediterranean" in the NE Aeolian Islands. This volcano has lent its name to the frequent mild explosive activity that has characterized its eruptions throughout much of historical time. The small island is the emergent summit of a volcano that grew in two main eruptive cycles, the last of which formed the western portion of the island. The Neostromboli eruptive period took place between about 13,000 and 5,000 years ago. The active summit vents are located at the head of the Sciara del Fuoco, a prominent scarp that formed about 5,000 years ago due to a series of slope failures which extends to below sea level. The modern volcano has been constructed within this scarp, which funnels pyroclastic ejecta and lava flows to the NW. Essentially continuous mild Strombolian explosions, sometimes accompanied by lava flows, have been recorded for more than a millennium.
Information Contacts: Istituto Nazionale di Geofisica e Vulcanologia (INGV), Sezione di Catania, Piazza Roma 2, 95123 Catania, Italy, (URL: http://www.ct.ingv.it/en/); MIROVA (Middle InfraRed Observation of Volcanic Activity), a collaborative project between the Universities of Turin and Florence (Italy) supported by the Centre for Volcanic Risk of the Italian Civil Protection Department (URL: http://www.mirovaweb.it/); Hawai'i Institute of Geophysics and Planetology (HIGP) - MODVOLC Thermal Alerts System, School of Ocean and Earth Science and Technology (SOEST), Univ. of Hawai'i, 2525 Correa Road, Honolulu, HI 96822, USA (URL: http://modis.higp.hawaii.edu/); Copernicus Browser, Copernicus Data Space Ecosystem, European Space Agency (URL: https://dataspace.copernicus.eu/browser/).
Nishinoshima (Japan) — July 2023 Cite this Report
Nishinoshima
Japan
27.247°N, 140.874°E; summit elev. 100 m
All times are local (unless otherwise noted)
Small ash plumes and fumarolic activity during November 2022 through April 2023
Nishinoshima is a small island located about 1,000 km S of Tokyo in the Ogasawara Arc in Japan. The island is the summit of a massive submarine volcano that has prominent peaks to the S, W, and NE. Eruptions date back to 1973; the most recent eruption period began in October 2022 and was characterized by ash plumes and fumarolic activity (BGVN 47:12). This report describes ash plumes and fumarolic activity during November 2022 through April 2023 based on monthly reports from the Japan Meteorological Agency (JMA) monthly reports and satellite data.
The most recent eruptive activity prior to the reporting internal occurred on 12 October 2022, when an ash plume rose 3.5 km above the crater rim. An aerial observation conducted by the Japan Coast Guard (JCG) on 25 November reported that white fumaroles rose approximately 200 m above the central crater of a pyroclastic cone (figure 119), and multiple plumes were observed on the ESE flank of the cone. Discolored water ranging from reddish-brown to brown and yellowish-green were visible around the perimeter of the island (figure 119). No significant activity was reported in December.
During an overflight conducted by JCG on 25 January 2023 intermittent activity and small, blackish-gray plumes rose 900 m above the central part of the crater were observed (figure 120). The fumarolic zone of the E flank and base of the cone had expanded and emissions had intensified. Dark brown discolored water was visible around the perimeter of the island.
No significant activity was reported during February through March. Ash plumes at 1050 and 1420 on 11 April rose 1.9 km above the crater rim and drifted NW and N. These were the first ash plumes observed since 12 October 2022. On 14 April JCG carried out an overflight and reported that no further eruptive activity was visible, although white gas-and-steam plumes were visible from the central crater and rose 900 m high (figure 121). Brownish and yellow-green discolored water surrounded the island.
Intermittent low-to-moderate power thermal anomalies were recorded in the MIROVA graph (Middle InfraRed Observation of Volcanic Activity) during November 2022 through April 2023 (figure 123). A cluster of six to eight anomalies were detected during November while a smaller number were detected during the following months: two to three during December, one during mid-January 2023, one during February, five during March, and two during April. Thermal activity was also reflected in infrared satellite data at the summit crater, accompanied by occasional gas-and-steam plumes (figure 124).
Geologic Background. The small island of Nishinoshima was enlarged when several new islands coalesced during an eruption in 1973-74. Multiple eruptions that began in 2013 completely covered the previous exposed surface and continued to enlarge the island. The island is the summit of a massive submarine volcano that has prominent peaks to the S, W, and NE. The summit of the southern cone rises to within 214 m of the ocean surface 9 km SSE.
Information Contacts: Japan Meteorological Agency (JMA), 1-3-4 Otemachi, Chiyoda-ku, Tokyo 100-8122, Japan (URL: http://www.jma.go.jp/jma/indexe.html); MIROVA (Middle InfraRed Observation of Volcanic Activity), a collaborative project between the Universities of Turin and Florence (Italy) supported by the Centre for Volcanic Risk of the Italian Civil Protection Department (URL: http://www.mirovaweb.it/); Copernicus Browser, Copernicus Data Space Ecosystem, European Space Agency (URL: https://dataspace.copernicus.eu/browser/).
Karangetang (Indonesia) — July 2023 Cite this Report
Karangetang
Indonesia
2.781°N, 125.407°E; summit elev. 1797 m
All times are local (unless otherwise noted)
Lava flows, incandescent avalanches, and ash plumes during January-June 2023
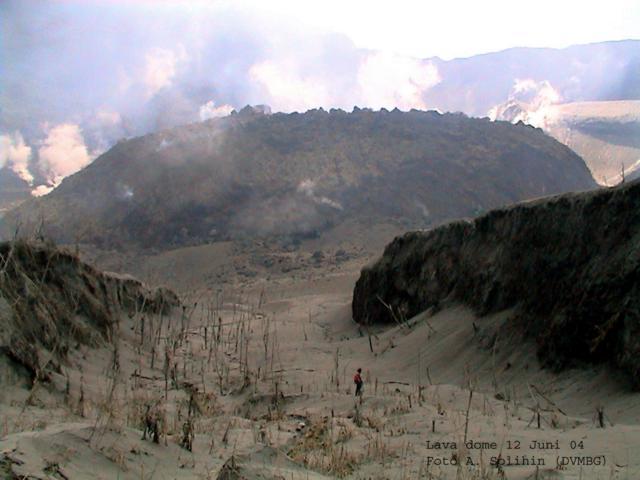
Karangetang (also known as Api Siau), at the northern end of the island of Siau, Indonesia, contains five summit craters along a N-S line. More than 40 eruptions have been recorded since 1675; recent eruptions have included frequent explosive activity, sometimes accompanied by pyroclastic flows and lahars. Lava dome growth has occurred in the summit craters and collapses of lava flow fronts have produced pyroclastic flows. The two active summit craters are Kawah Dua (the N crater) and Kawah Utama (the S crater, also referred to as the “Main Crater”). The most recent eruption began in late November 2018 and has more recently consisted of weak thermal activity and gas-and-steam emissions (BGVN 48:01). This report updates activity characterized by lava flows, incandescent avalanches, and ash plumes during January through June 2023 using reports from Pusat Vulkanologi dan Mitigasi Bencana Geologi (PVMBG, also known as CVGHM, or the Center of Volcanology and Geological Hazard Mitigation), MAGMA Indonesia, the Darwin VAAC (Volcano Ash Advisory Center), and satellite data.
Activity during January was relatively low and mainly consisted of white gas-and-steam emissions that rose 25-150 m above Main Crater (S crater) and drifted in different directions. Incandescence was visible from the lava dome in Kawah Dua (the N crater). Weather conditions often prevented clear views of the summit. On 18 January the number of seismic signals that indicated avalanches of material began to increase. In addition, there were a total of 71 earthquakes detected during the month.
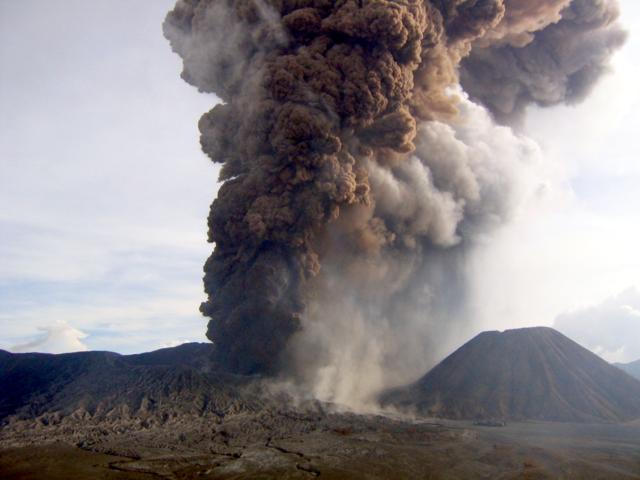
Activity continued to increase during the first week of February. Material from Main Crater traveled as far as 800 m down the Batuawang (S) and Batang (W) drainages and as far as 1 km W down the Beha (W) drainage on 4 February. On 6 February 43 earthquake events were recorded, and on 7 February, 62 events were recorded. White gas-and-steam emissions rose 25-250 m above both summit craters throughout the month. PVMBG reported an eruption began during the evening of 8 February around 1700. Photos showed incandescent material at Main Crater. Incandescent material had also descended the flank in at least two unconfirmed directions as far as 2 km from Main Crater, accompanied by ash plumes (figure 60). As a result, PVMBG increased the Volcano Alert Level (VAL) to 3 (the second highest level on a 1-4 scale).
Occasional nighttime webcam images showed three main incandescent lava flows of differing lengths traveling down the S, SW, and W flanks (figure 61). Incandescent rocks were visible on the upper flanks, possibly from ejected or collapsed material from the crater, and incandescence was the most intense at the summit. Based on analyses of satellite imagery and weather models, the Darwin VAAC reported that daily ash plumes during 16-20 February rose to 2.1-3 km altitude and drifted NNE, E, and SE. BNPB reported on 16 February that as many as 77 people were evacuated and relocated to the East Siau Museum. A webcam image taken at 2156 on 17 February possibly showed incandescent material descending the SE flank. Ash plumes rose to 2.1 km altitude and drifted SE during 22-23 February, according to the Darwin VAAC.
Incandescent avalanches of material and summit incandescence at Main Crater continued during March. White gas-and-steam emissions during March generally rose 25-150 m above the summit crater; on 31 March gas-and-steam emissions rose 200-400 m high. An ash plume rose to 2.4 km altitude and drifted S at 1710 on 9 March and a large thermal anomaly was visible in images taken at 0550 and 0930 on 10 March. Incandescent material was visible at the summit and on the flanks based on webcam images taken at 0007 and 2345 on 16 March, at 1828 on 17 March, at 1940 on 18 March, at 2311 on 19 March, and at 2351 on 20 March. Incandescence was most intense on 18 and 20 March and webcam images showed possible Strombolian explosions (figure 62). An ash plume rose to 2.4 km altitude and drifted SW on 18 March, accompanied by a thermal anomaly.
Summit crater incandescence at Main Crater and on the flanks persisted during April. Incandescent material at the S crater and on the flanks was reported at 0016 on 1 April. The lava flows had stopped by 1 April according to PVMBG, although incandescence was still visible up to 10 m high. Seismic signals indicating effusion decreased and by 6 April they were no longer detected. Incandescence was visible from both summit craters. On 26 April the VAL was lowered to 2 (the second lowest level on a 1-4 scale). White gas-and-steam emissions rose 25-200 m above the summit crater.
During May white gas-and-steam emissions generally rose 50-250 m above the summit, though it was often cloudy, which prevented clear views; on 21 May gas-and-steam emissions rose 50-400 m high. Nighttime N summit crater incandescence rose 10-25 m above the lava dome, and less intense incandescence was noted above Main Crater, which reached about 10 m above the dome. Sounds of falling rocks at Main Crater were heard on 15 May and the seismic network recorded 32 rockfall events in the crater on 17 May. Avalanches traveled as far as 1.5 km down the SW and S flanks, accompanied by rumbling sounds on 18 May. Incandescent material descending the flanks was captured in a webcam image at 2025 on 19 May (figure 63) and on 29 May; summit crater incandescence was observed in webcam images at 2332 on 26 May and at 2304 on 29 May. On 19 May the VAL was again raised to 3.
Occasional Main Crater incandescence was reported during June, as well as incandescent material on the flanks. White gas-and-steam emissions rose 10-200 m above the summit crater. Ash plumes rose to 2.1 km altitude and drifted SE and E during 2-4 June, according to the Darwin VAAC. Material on the flanks of Main Crater were observed at 2225 on 7 June, at 2051 on 9 June, at 0007 on 17 June, and at 0440 on 18 June. Webcam images taken on 21, 25, and 27 June showed incandescence at Main Crater and from material on the flanks.
MIROVA (Middle InfraRed Observation of Volcanic Activity) analysis of MODIS satellite data showed strong thermal activity during mid-February through March and mid-May through June, which represented incandescent avalanches and lava flows (figure 64). During April through mid-May the power of the anomalies decreased but frequent anomalies were still detected. Brief gaps in activity occurred during late March through early April and during mid-June. Infrared satellite images showed strong lava flows mainly affecting the SW and S flanks, accompanied by gas-and-steam emissions (figure 65). According to data recorded by the MODVOLC thermal algorithm, there were a total of 79 thermal hotspots detected: 28 during February, 24 during March, one during April, five during May, and 21 during June.
Geologic Background. Karangetang (Api Siau) volcano lies at the northern end of the island of Siau, about 125 km NNE of the NE-most point of Sulawesi. The stratovolcano contains five summit craters along a N-S line. It is one of Indonesia's most active volcanoes, with more than 40 eruptions recorded since 1675 and many additional small eruptions that were not documented (Neumann van Padang, 1951). Twentieth-century eruptions have included frequent explosive activity sometimes accompanied by pyroclastic flows and lahars. Lava dome growth has occurred in the summit craters; collapse of lava flow fronts have produced pyroclastic flows.
Information Contacts: Pusat Vulkanologi dan Mitigasi Bencana Geologi (PVMBG, also known as Indonesian Center for Volcanology and Geological Hazard Mitigation, CVGHM), Jalan Diponegoro 57, Bandung 40122, Indonesia (URL: http://www.vsi.esdm.go.id/); MAGMA Indonesia, Kementerian Energi dan Sumber Daya Mineral (URL: https://magma.esdm.go.id/v1); Badan Nasional Penanggulangan Bencana (BNPB), National Disaster Management Agency, Graha BNPB - Jl. Scout Kav.38, East Jakarta 13120, Indonesia (URL: http://www.bnpb.go.id/); Darwin Volcanic Ash Advisory Centre (VAAC), Bureau of Meteorology, Northern Territory Regional Office, PO Box 40050, Casuarina, NT 0811, Australia (URL: http://www.bom.gov.au/info/vaac/); MIROVA (Middle InfraRed Observation of Volcanic Activity), a collaborative project between the Universities of Turin and Florence (Italy) supported by the Centre for Volcanic Risk of the Italian Civil Protection Department (URL: http://www.mirovaweb.it/); Hawai'i Institute of Geophysics and Planetology (HIGP) - MODVOLC Thermal Alerts System, School of Ocean and Earth Science and Technology (SOEST), Univ. of Hawai'i, 2525 Correa Road, Honolulu, HI 96822, USA (URL: http://modis.higp.hawaii.edu/); Copernicus Browser, Copernicus Data Space Ecosystem, European Space Agency (URL: https://dataspace.copernicus.eu/browser/); IDN Times, Jl. Jend. Gatot Subroto Kav. 27 3rd Floor Kuningan, Jakarta, Indonesia 12950, Status of Karangetang Volcano in Sitaro Islands Increases (URL: https://sulsel.idntimes.com/news/indonesia/savi/status-gunung-api-karangetang-di-kepulauan-sitaro-meningkat?page=all).
Ahyi (United States) — July 2023 Cite this Report
Ahyi
United States
20.42°N, 145.03°E; summit elev. -75 m
All times are local (unless otherwise noted)
Intermittent hydroacoustic signals and discolored plumes during November 2022-June 2023
Ahyi seamount is a large, conical submarine volcano that rises to within 75 m of the ocean surface about 18 km SE of the island of Farallon de Pajaros in the Northern Marianas. The remote location of the seamount has made eruptions difficult to document, but seismic stations installed in the region confirmed an eruption in the vicinity in 2001. No new activity was detected until April-May 2014 when an eruption was detected by NOAA (National Oceanic and Atmospheric Administration) divers, hydroacoustic sensors, and seismic stations (BGVN 42:04). New activity was first detected on 15 November by hydroacoustic sensors that were consistent with submarine volcanic activity. This report covers activity during November 2022 through June 2023 based on daily and weekly reports from the US Geological Survey.
Starting in mid-October, hydroacoustic sensors at Wake Island (2.2 km E) recorded signals consistent with submarine volcanic activity, according to a report from the USGS issued on 15 November 2022. A combined analysis of the hydroacoustic signals and seismic stations located at Guam and Chichijima Island, Japan, suggested that the source of this activity was at or near the Ahyi seamount. After a re-analysis of a satellite image of the area that was captured on 6 November, USGS confirmed that there was no evidence of discoloration at the ocean surface. Few hydroacoustic and seismic signals continued through November, including on 18 November, which USGS suggested signified a decline or pause in unrest. A VONA (Volcano Observatory Notice for Aviation) reported that a discolored water plume was persistently visible in satellite data starting on 18 November (figure 6). Though clouds often obscured clear views of the volcano, another discolored water plume was captured in a satellite image on 26 November. The Aviation Color Code (ACC) was raised to Yellow (the second lowest level on a four-color scale) and the Volcano Alert Level (VAL) was raised to Advisory (the second lowest level on a four-level scale) on 29 November.
During December, occasional detections were recorded on the Wake Island hydrophone sensors and discolored water over the seamount remained visible. During 2-7, 10-12, and 16-31 December possible explosion signals were detected. A small area of discolored water was observed in high-resolution Sentinel-2 satellite images during 1-6 December (figure 7). High-resolution satellite images recorded discolored water plumes on 13 December that originated from the summit region; no observations indicated that activity breached the ocean surface. A possible underwater plume was visible in satellite images on 18 December, and during 19-20 December a definite but diffuse underwater plume located SSE from the main vent was reported. An underwater plume was visible in a satellite image taken on 26 December (figure 7).
Hydrophone sensors continued to detect signals consistent with possible explosions during 1-8 January 2023. USGS reported that the number of detections decreased during 4-5 January. The hydrophone sensors experienced a data outage that started at 0118 on 8 January and continued through 10 January, though according to USGS, possible explosions were recorded prior to the data outage and likely continued during the outage. A discolored water plume originating from the summit region was detected in a partly cloudy satellite image on 8 January. On 11-12 and 15-17 January possible explosion signals were recorded again. One small signal was detected during 22-23 January and several signals were recorded on 25 and 31 January. During 27-31 January a plume of discolored water was observed above the seamount in satellite imagery (figure 8).
Low levels of activity continued during February and March, based on data from pressure sensors on Wake Island. During 1 and 4-6 February activity was reported, and a submarine plume was observed on 4 February (figure 8). Possible explosion signals were detected during 7-8, 10, 13-14, and 24 February. During 1-2 and 3-5 March a plume of discolored water was observed in satellite imagery (figure 8). Almost continuous hydroacoustic signals were detected in remote pressure sensor data on Wake Island 2,270 km E from the volcano during 7-13 March. During 12-13 March water discoloration around the seamount was observed in satellite imagery, despite cloudy weather. By 14 March discolored water extended about 35 km, but no direction was noted. USGS reported that the continuous hydroacoustic signals detected during 13-14 March stopped abruptly on 14 March and no new detections were observed. Three 30 second hydroacoustic detections were reported during 17-19 March, but no activity was visible due to cloudy weather. A data outage was reported during 21-22 March, making pressure sensor data unavailable; a discolored water plume was, however, visible in satellite data. A possible underwater explosion signal was detected by pressure sensors at Wake Island on 26, 29, and 31 March, though the cause and origin of these events were unclear.
Similar low activity continued during April, May, and June. Several signals were detected during 1-3 April in pressure sensors at Wake Island. USGS suggested that these may be related to underwater explosions or earthquakes at the volcano, but no underwater plumes were visible in clear satellite images. The pressure sensors had data outages during 12-13 April and no data were recorded; no underwater plumes were visible in satellite images, although cloudy weather obscured most clear views. Eruptive activity was reported starting at 2210 on 21 May. On 22 May a discolored water plume that extended 4 km was visible in satellite images, though no direction was recorded. During 23-24 May some signals were detected by the underwater pressure sensors. Possible hydroacoustic signals were detected during 2-3 and 6-8 June. Multiple hydroacoustic signals were detected during 9-11 and 16-17 June, although no activity was visible in satellite images. One hydroacoustic signal was detected during 23-24 June, but there was some uncertainty about its association with volcanic activity. A single possible hydroacoustic signal was detected during 30 June to 1 July.
Geologic Background. Ahyi seamount is a large conical submarine volcano that rises to within 75 m of the ocean surface ~18 km SE of the island of Farallon de Pajaros in the northern Marianas. Water discoloration has been observed there, and in 1979 the crew of a fishing boat felt shocks over the summit area, followed by upwelling of sulfur-bearing water. On 24-25 April 2001 an explosive eruption was detected seismically by a station on Rangiroa Atoll, Tuamotu Archipelago. The event was well constrained (+/- 15 km) at a location near the southern base of Ahyi. An eruption in April-May 2014 was detected by NOAA divers, hydroacoustic sensors, and seismic stations.
Information Contacts: US Geological Survey, Volcano Hazards Program (USGS-VHP), 12201 Sunrise Valley Drive, Reston, VA, USA, https://volcanoes.usgs.gov/index.html; Copernicus Browser, Copernicus Data Space Ecosystem, European Space Agency (URL: https://dataspace.copernicus.eu/browser/).
Kadovar (Papua New Guinea) — June 2023 Cite this Report
Kadovar
Papua New Guinea
3.608°S, 144.588°E; summit elev. 365 m
All times are local (unless otherwise noted)
An ash plume and weak thermal anomaly during May 2023
Kadovar is a 2-km-wide island that is the emergent summit of a Bismarck Sea stratovolcano. It lies off the coast of New Guinea, about 25 km N of the mouth of the Sepik River. Prior to an eruption that began in 2018, a lava dome formed the high point of the volcano, filling an arcuate landslide scarp open to the S. Submarine debris-avalanche deposits occur to the S of the island. The current eruption began in January 2018 and has comprised lava effusion from vents at the summit and at the E coast; more recent activity has consisted of ash plumes, weak thermal activity, and gas-and-steam plumes (BGVN 48:02). This report covers activity during February through May 2023 using information from the Darwin Volcanic Ash Advisory Center (VAAC) and satellite data.
Activity during the reporting period was relatively low and mainly consisted of white gas-and-steam plumes that were visible in natural color satellite images on clear weather days (figure 67). According to a Darwin VAAC report, at 2040 on 6 May an ash plume rose to 4.6 km altitude and drifted W; by 2300 the plume had dissipated. MODIS satellite instruments using the MODVOLC thermal algorithm detected a single thermal hotspot on the SE side of the island on 7 May. Weak thermal activity was also detected in a satellite image on the E side of the island on 14 May, accompanied by a white gas-and-steam plume that drifted SE (figure 68).
Geologic Background. The 2-km-wide island of Kadovar is the emergent summit of a Bismarck Sea stratovolcano of Holocene age. It is part of the Schouten Islands, and lies off the coast of New Guinea, about 25 km N of the mouth of the Sepik River. Prior to an eruption that began in 2018, a lava dome formed the high point of the andesitic volcano, filling an arcuate landslide scarp open to the south; submarine debris-avalanche deposits occur in that direction. Thick lava flows with columnar jointing forms low cliffs along the coast. The youthful island lacks fringing or offshore reefs. A period of heightened thermal phenomena took place in 1976. An eruption began in January 2018 that included lava effusion from vents at the summit and at the E coast.
Information Contacts: Darwin Volcanic Ash Advisory Centre (VAAC), Bureau of Meteorology, Northern Territory Regional Office, PO Box 40050, Casuarina, NT 0811, Australia (URL: http://www.bom.gov.au/info/vaac/); Hawai'i Institute of Geophysics and Planetology (HIGP) - MODVOLC Thermal Alerts System, School of Ocean and Earth Science and Technology (SOEST), Univ. of Hawai'i, 2525 Correa Road, Honolulu, HI 96822, USA (URL: http://modis.higp.hawaii.edu/); Copernicus Browser, Copernicus Data Space Ecosystem, European Space Agency (URL: https://dataspace.copernicus.eu/browser/).
San Miguel (El Salvador) — June 2023 Cite this Report
San Miguel
El Salvador
13.434°N, 88.269°W; summit elev. 2130 m
All times are local (unless otherwise noted)
Small gas-and-ash explosions during March and May 2023
San Miguel in El Salvador is a broad, deep crater complex that has been frequently modified by eruptions recorded since the early 16th century and consists of the summit known locally as Chaparrastique. Flank eruptions have produced lava flows that extended to the N, NE, and SE during the 17-19th centuries. The most recent activity has consisted of minor ash eruptions from the summit crater. The current eruption period began in November 2022 and has been characterized by frequent phreatic explosions, gas-and-ash emissions, and sulfur dioxide plumes (BGVN 47:12). This report describes small gas-and-ash explosions during December 2022 through May 2023 based on special reports from the Ministero de Medio Ambiente y Recursos Naturales (MARN).
Activity has been relatively low since the last recorded explosions on 29 November 2022. Seismicity recorded by the San Miguel Volcano Station (VSM) located on the N flank at 1.7 km elevation had decreased by 7 December. Sulfur dioxide gas measurements taken with DOAS (Differential Optical Absorption Spectroscopy) mobile equipment were below typical previously recorded values: 300 tons per day (t/d). During December, small explosions were recorded by the seismic network and manifested as gas-and-steam emissions.
Gas-and-ash explosions in the crater occurred during January 2023, which were recorded by the seismic network. Sulfur dioxide values remained low, between 300-400 t/d through 10 March. At 0817 on 14 January a gas-and-ash emission was visible in webcam images, rising just above the crater rim. Some mornings during February, small gas-and-steam plumes were visible in the crater. On 7 March at 2252 MARN noted an increase in degassing from the central crater; gas emissions were constantly observed through the early morning hours on 8 March. During the early morning of 8 March through the afternoon on 9 March, 12 emissions were registered, some accompanied by ash. The last gas-and-ash emission was recorded at 1210 on 9 March; very fine ashfall was reported in El Tránsito (10 km S), La Morita (6 km W), and La Piedrita (3 km W). The smell of sulfur was reported in Piedra Azul (5 km SW). On 16 March MARN reported that gas-and-steam emissions decreased.
Low degassing and very low seismicity were reported during April; no explosions have been detected between 9 March and 27 May. The sulfur dioxide emissions remained between 350-400 t/d; during 13-20 April sulfur dioxide values fluctuated between 30-300 t/d. Activity remained low through most of May; on 23 May seismicity increased. An explosion was detected at 1647 on 27 May generated a gas-and-ash plume that rose 700 m high (figure 32); a decrease in seismicity and gas emissions followed. The DOAS station installed on the W flank recorded sulfur dioxide values that reached 400 t/d on 27 May; subsequent measurements showed a decrease to 268 t/d on 28 May and 100 t/d on 29 May.
Geologic Background. The symmetrical cone of San Miguel, one of the most active volcanoes in El Salvador, rises from near sea level to form one of the country's most prominent landmarks. A broad, deep, crater complex that has been frequently modified by eruptions recorded since the early 16th century caps the truncated unvegetated summit, also known locally as Chaparrastique. Flanks eruptions of the basaltic-andesitic volcano have produced many lava flows, including several during the 17th-19th centuries that extended to the N, NE, and SE. The SE-flank flows are the largest and form broad, sparsely vegetated lava fields crossed by highways and a railroad skirting the base of the volcano. Flank vent locations have migrated higher on the edifice during historical time, and the most recent activity has consisted of minor ash eruptions from the summit crater.
Information Contacts: Ministero de Medio Ambiente y Recursos Naturales (MARN), Km. 5½ Carretera a Nueva San Salvador, Avenida las Mercedes, San Salvador, El Salvador (URL: http://www.snet.gob.sv/ver/vulcanologia).
Semisopochnoi (United States) — June 2023 Cite this Report
Semisopochnoi
United States
51.93°N, 179.58°E; summit elev. 1221 m
All times are local (unless otherwise noted)
Occasional explosions, ash deposits, and gas-and-steam plumes during December 2022-May 2023
Semisopochnoi is located in the western Aleutians, is 20-km-wide at sea level, and contains an 8-km-wide caldera. The three-peaked Mount Young (formerly Cerberus) was constructed within the caldera during the Holocene. Each of these peaks contains a summit crater; the lava flows on the N flank appear younger than those on the S side. The current eruption period began in early February 2021 and has more recently consisted of intermittent explosions and ash emissions (BGVN 47:12). This report updates activity during December 2022 through May 2023 using daily, weekly, and special reports from the Alaska Volcano Observatory (AVO). AVO monitors the volcano using local seismic and infrasound sensors, satellite data, web cameras, and remote infrasound and lightning networks.
Activity during most of December 2022 was relatively quiet; according to AVO no eruptive or explosive activity was observed since 7 November 2022. Intermittent tremor and occasional small earthquakes were observed in geophysical data. Continuous gas-and-steam emissions were observed from the N crater of Mount Young in webcam images on clear weather days (figure 25). On 24 December, there was a slight increase in earthquake activity and several small possible explosion signals were detected in infrasound data. Eruptive activity resumed on 27 December at the N crater of Mount Young; AVO issued a Volcano Activity Notice (VAN) that reported minor ash deposits on the flanks of Mount Young that extended as far as 1 km from the vent, according to webcam images taken during 27-28 December (figure 26). No ash plumes were observed in webcam or satellite imagery, but a persistent gas-and-steam plume that might have contained some ash rose to 1.5 km altitude. As a result, AVO raised the Aviation Color Code (ACC) to Orange (the second highest level on a four-color scale) and the Volcano Alert Level (VAL) to Watch (the second highest level on a four-level scale). Possible explosions were detected during 21 December 2022 through 1 January 2023 and seismic tremor was recorded during 30-31 December.
During January 2023 eruptive activity continued at the active N crater of Mount Young. Minor ash deposits were observed on the flanks, extending about 2 km SSW, based on webcam images from 1 and 3 January. A possible explosion occurred during 1-2 January based on elevated seismicity recorded on local seismometers and an infrasound signal recorded minutes later by an array at Adak. Though no ash plumes were observed in webcam or satellite imagery, a persistent gas-and-steam plume rose to 1.5 km altitude that might have carried minor traces of ash. Ash deposits were accompanied by periods of elevated seismicity and infrasound signals from the local geophysical network, which AVO reported were likely due to weak explosive activity. Low-level explosive activity was also detected during 2-3 January, with minor gas-and-steam emissions and a new ash deposit that was visible in webcam images. Low-level explosive activity was detected in geophysical data during 4-5 January, with elevated seismicity and infrasound signals observed on local stations. Volcanic tremor was detected during 7-9 January and very weak explosive activity was detected in seismic and infrasound data on 9 January. Weak seismic and infrasound signals were recorded on 17 January, which indicated minor explosive activity, but no ash emissions were observed in clear webcam images; a gas-and-steam plume continued to rise to 1.5 km altitude. During 29-30 January, ash deposits near the summit were observed on fresh snow, according to webcam images.
The active N cone at Mount Young continued to produce a gas-and-steam plume during February, but no ash emissions or explosive events were detected. Seismicity remained elevated with faint tremor during early February. Gas-and-steam emissions from the N crater were observed in clear webcam images on 11-13 and 16 February; no explosive activity was detected in seismic, infrasound, or satellite data. Seismicity has also decreased, with no significant seismic tremor observed since 25 January. Therefore, the ACC was lowered to Yellow (the second lowest level on a four-color scale) and the VAL was lowered to Advisory (the second lowest level on a four-color scale) on 22 February.
Gas-and-steam emissions persisted during March from the N cone of Mount Young, based on clear webcam images. A few brief episodes of weak tremor were detected in seismic data, although seismicity decreased over the month. A gas-and-steam plume detected in satellite data extended 150 km on 18 March. Low-level ash emissions from the N cone at Mount Young were observed in several webcam images during 18-19 March, in addition to small explosions and volcanic tremor. The ACC was raised to Orange and the VAL increased to Watch on 19 March. A small explosion was detected in seismic and infrasound data on 21 March.
Low-level unrest continued during April, although cloudy weather often obscured views of the summit; periods of seismic tremor and local earthquakes were recorded. During 3-4 April a gas-and-steam plume was visible traveling more than 200 km overnight; no ash was evident in the plume, according to AVO. A gas-and-steam plume was observed during 4-6 April that extended 400 km but did not seem to contain ash. Small explosions were detected in seismic and infrasound data on 5 April. Occasional clear webcam images showed continuing gas-and-steam emissions rose from Mount Young, but no ash deposits were observed on the snow. On 19 April small explosions and tremor were detected in seismic and infrasound data. A period of seismic tremor was detected during 22-25 April, with possible weak explosions on 25 April. Ash deposits were visible near the crater rim, but it was unclear if these deposits were recent or due to older deposits.
Occasional small earthquakes were recorded during May, but there were no signs of explosive activity seen in geophysical data. Gas-and-steam emissions continued from the N crater of Mount Young, based on webcam images, and seismicity remained slightly elevated. A new, light ash deposit was visible during the morning of 5 May on fresh snow on the NW flank of Mount Young. During 10 May periods of volcanic tremor were observed. The ACC was lowered to Yellow and the VAL to Advisory on 17 May due to no additional evidence of activity.
Geologic Background. Semisopochnoi, the largest subaerial volcano of the western Aleutians, is 20 km wide at sea level and contains an 8-km-wide caldera. It formed as a result of collapse of a low-angle, dominantly basaltic volcano following the eruption of a large volume of dacitic pumice. The high point of the island is Anvil Peak, a double-peaked late-Pleistocene cone that forms much of the island's northern part. The three-peaked Mount Cerberus (renamed Mount Young in 2023) was constructed within the caldera during the Holocene. Each of the peaks contains a summit crater; lava flows on the N flank appear younger than those on the south side. Other post-caldera volcanoes include the symmetrical Sugarloaf Peak SSE of the caldera and Lakeshore Cone, a small cinder cone at the edge of Fenner Lake in the NE part of the caldera. Most documented eruptions have originated from Young, although Coats (1950) considered that both Sugarloaf and Lakeshore Cone could have been recently active.
Information Contacts: Alaska Volcano Observatory (AVO), a cooperative program of a) U.S. Geological Survey, 4200 University Drive, Anchorage, AK 99508-4667 USA (URL: https://avo.alaska.edu/), b) Geophysical Institute, University of Alaska, PO Box 757320, Fairbanks, AK 99775-7320, USA, and c) Alaska Division of Geological & Geophysical Surveys, 794 University Ave., Suite 200, Fairbanks, AK 99709, USA (URL: http://dggs.alaska.gov/).
Ebeko
Russia
50.686°N, 156.014°E; summit elev. 1103 m
All times are local (unless otherwise noted)
Continued explosions, ash plumes, and ashfall during October 2022-May 2023
Ebeko, located on the N end of Paramushir Island in the Kuril Islands, consists of three summit craters along a SSW-NNE line at the northern end of a complex of five volcanic cones. Eruptions date back to the late 18th century and have been characterized as small-to-moderate explosions from the summit crater, accompanied by intense fumarolic activity. The current eruption period began in June 2022 and has recently consisted of frequent explosions, ash plumes, and thermal activity (BGVN 47:10). This report covers similar activity during October 2022 through May 2023, based on information from the Kamchatka Volcanic Eruptions Response Team (KVERT) and satellite data.
Activity during October consisted of explosive activity, ash plumes, and occasional thermal anomalies. Visual data by volcanologists from Severo-Kurilsk showed explosions producing ash clouds up to 2.1-3 km altitude which drifted E, N, NE, and SE during 1-8, 10, 16, and 18 October. KVERT issued several Volcano Observatory Notices for Aviation (VONA) on 7, 13-15, and 27 October 2022, stating that explosions generated ash plumes that rose to 2.3-4 km altitude and drifted 5 km E, NE, and SE. Ashfall was reported in Severo-Kurilsk (Paramushir Island, about 7 km E) on 7 and 13 October. Satellite data showed a thermal anomaly over the volcano on 15-16 October. Visual data showed ash plumes rising to 2.5-3.6 km altitude on 22, 25-29, and 31 October and moving NE due to constant explosions.
Similar activity continued during November, with explosions, ash plumes, and ashfall occurring. KVERT issued VONAs on 1-2, 4, 6-7, 9, 13, and 16 November that reported explosions and resulting ash plumes that rose to 1.7-3.6 km altitude and drifted 3-5 km SE, ESE, E, and NE. On 1 November ash plumes extended as far as 110 km SE. On 5, 8, 12, and 24-25 November explosions and ash plumes rose to 2-3.1 km altitude and drifted N and E. Ashfall was observed in Severo-Kurilsk on 7 and 16 November. A thermal anomaly was visible during 1-4, 16, and 20 November. Explosions during 26 November rose as high as 2.7 km altitude and drifted NE (figure 45).
Explosions and ash plumes continued to occur in December. During 1-2 and 4 December volcanologists from Severo-Kurilsk observed explosions that sent ash to 1.9-2.5 km altitude and drifted NE and SE (figure 46). VONAs were issued on 5, 9, and 16 December reporting that explosions generated ash plumes rising to 1.9 km, 2.6 km, and 2.4 km altitude and drifted 5 km SE, E, and NE, respectively. A thermal anomaly was visible in satellite imagery on 16 December. On 18 and 27-28 December explosions produced ash plumes that rose to 2.5 km altitude and drifted NE and SE. On 31 December an ash plume rose to 2 km altitude and drifted NE.
Explosions continued during January 2023, based on visual observations by volcanologists from Severo-Kurilsk. During 1-7 January explosions generated ash plumes that rose to 4 km altitude and drifted NE, E, W, and SE. According to VONAs issued by KVERT on 2, 4, 10, and 23 January, explosions produced ash plumes that rose to 2-4 km altitude and drifted 5 km N, NE, E, and ENE; the ash plume that rose to 4 km altitude occurred on 10 January (figure 47). Satellite data showed a thermal anomaly during 3-4, 10, 13, 16, 21, 22, and 31 January. KVERT reported that an ash cloud on 4 January moved 12 km NE. On 6 and 9-11 January explosions sent ash plumes to 4.5 km altitude and drifted W and ESE. On 13 January an ash plume rose to 3 km altitude and drifted SE. During 20-24 January ash plumes from explosions rose to 3.7 km altitude and drifted SE, N, and NE. On 21 January the ash plume drifted as far as 40 km NE. During 28-29 and 31 January and 1 February ash plumes rose to 4 km altitude and drifted NE.
During February, explosions, ash plumes, and ashfall were reported. During 1, 4-5 and 7-8 February explosions generated ash plumes that rose to 4.5 km altitude and drifted E and NE; ashfall was observed on 5 and 8 February. On 6 February an explosion produced an ash plume that rose to 3 km altitude and drifted 7 km E, causing ashfall in Severo-Kurilsk. A thermal anomaly was visible in satellite data on 8, 9, 13, and 21 February. Explosions on 9 and 12-13 February produced ash plumes that rose to 4 km altitude and drifted E and NE; the ash cloud on 12 February extended as far as 45 km E. On 22 February explosions sent ash to 3 km altitude that drifted E. During 24 and 26-27 February ash plumes rose to 4 km altitude and drifted E. On 28 February an explosion sent ash to 2.5-3 km altitude and drifted 5 km E; ashfall was observed in Severo-Kurilsk.
Activity continued during March; visual observations showed that explosions generated ash plumes that rose to 3.6 km altitude on 3, 5-7, and 9-12 March and drifted E, NE, and NW. Thermal anomalies were visible on 10, 13, and 29-30 March in satellite imagery. On 18, 21-23, 26, and 29-30 March explosions produced ash plumes that rose to 2.8 km altitude and drifted NE and E; the ash plumes during 22-23 March extended up to 76 km E. A VONA issued on 21 March reported an explosion that produced an ash plume that rose to 2.8 km altitude and drifted 5 km E. Another VONA issued on 23 March reported that satellite data showed an ash plume rising to 3 km altitude and drifted 14 km E.
Explosions during April continued to generate ash plumes. On 1 and 4 April an ash plume rose to 2.8-3.5 km altitude and drifted SE and NE. A thermal anomaly was visible in satellite imagery during 1-6 April. Satellite data showed ash plumes and clouds rising to 2-3 km altitude and drifting up to 12 km SW and E on 3 and 6 April (figure 48). KVERT issued VONAs on 3, 5, 14, 16 April describing explosions that produced ash plumes rising to 3 km, 3.5 km, 3.5 km, and 3 km altitude and drifting 5 km S, 5 km NE and SE, 72 km NNE, and 5 km NE, respectively. According to satellite data, the resulting ash cloud from the explosion on 14 April was 25 x 7 km in size and drifted 72-104 km NNE during 14-15 April. According to visual data by volcanologists from Severo-Kurilsk explosions sent ash up to 3.5 km altitude that drifted NE and E during 15-16, 22, 25-26, and 29 April.
The explosive eruption continued during May. Explosions during 3-4, 6-7, and 9-10 May generated ash plumes that rose to 4 km altitude and drifted SW and E. Satellite data showed a thermal anomaly on 3, 9, 13-14, and 24 May. During 12-16, 23-25, and 27-28 May ash plumes rose to 3.5 km altitude and drifted in different directions due to explosions. Two VONA notices were issued on 16 and 25 May, describing explosions that generated ash plumes rising to 3 km and 3.5 km altitude, respectively and extending 5 km E. The ash cloud on 25 May drifted 75 km SE.
Thermal activity in the summit crater, occasionally accompanied by ash plumes and ash deposits on the SE and E flanks due to frequent explosions, were visible in infrared and true color satellite images (figure 49).
Geologic Background. The flat-topped summit of the central cone of Ebeko volcano, one of the most active in the Kuril Islands, occupies the northern end of Paramushir Island. Three summit craters located along a SSW-NNE line form Ebeko volcano proper, at the northern end of a complex of five volcanic cones. Blocky lava flows extend west from Ebeko and SE from the neighboring Nezametnyi cone. The eastern part of the southern crater contains strong solfataras and a large boiling spring. The central crater is filled by a lake about 20 m deep whose shores are lined with steaming solfataras; the northern crater lies across a narrow, low barrier from the central crater and contains a small, cold crescentic lake. Historical activity, recorded since the late-18th century, has been restricted to small-to-moderate explosive eruptions from the summit craters. Intense fumarolic activity occurs in the summit craters, on the outer flanks of the cone, and in lateral explosion craters.
Information Contacts: Kamchatka Volcanic Eruptions Response Team (KVERT), Far Eastern Branch, Russian Academy of Sciences, 9 Piip Blvd., Petropavlovsk-Kamchatsky, 683006, Russia (URL: http://www.kscnet.ru/ivs/kvert/); MIROVA (Middle InfraRed Observation of Volcanic Activity), a collaborative project between the Universities of Turin and Florence (Italy) supported by the Centre for Volcanic Risk of the Italian Civil Protection Department (URL: http://www.mirovaweb.it/); Copernicus Browser, Copernicus Data Space Ecosystem, European Space Agency (URL: https://dataspace.copernicus.eu/browser/).
Home Reef
Tonga
18.992°S, 174.775°W; summit elev. -10 m
All times are local (unless otherwise noted)
Discolored plumes continued during November 2022-April 2023
Home Reef is a submarine volcano located in the central Tonga islands between Lateiki (Metis Shoal) and Late Island. The first recorded eruption occurred in the mid-19th century, when an ephemeral island formed. An eruption in 1984 produced a 12-km-high eruption plume, a large volume of floating pumice, and an ephemeral island 500 x 1,500 m wide, with cliffs 30-50 m high that enclosed a water-filled crater. Another island-forming eruption in 2006 produced widespread pumice rafts that drifted as far as Australia; by 2008 the island had eroded below sea level. The previous eruption occurred during October 2022 and was characterized by a new island-forming eruption, lava effusion, ash plumes, discolored water, and gas-and-steam plumes (BGVN 47:11). This report covers discolored water plumes during November 2022 through April 2023 using satellite data.
Discolored plumes continued during the reporting period and were observed in true color satellite images on clear weather days. Satellite images show light green-yellow discolored water extending W on 8 and 28 November 2022 (figure 31), and SW on 18 November. Light green-yellow plumes extended W on 3 December, S on 13 December, SW on 18 December, and W and S on 23 December (figure 31). On 12 January 2023 discolored green-yellow plumes extended to the NE, E, SE, and N. The plume moved SE on 17 January and NW on 22 January. Faint discolored water in February was visible moving NE on 1 February. A discolored plume extended NW on 8 and 28 March and NW on 13 March (figure 31). During April, clear weather showed green-blue discolored plumes moving S on 2 April, W on 7 April, and NE and S on 12 April. A strong green-yellow discolored plume extended E and NE on 22 April for several kilometers (figure 31).
Geologic Background. Home Reef, a submarine volcano midway between Metis Shoal and Late Island in the central Tonga islands, was first reported active in the mid-19th century, when an ephemeral island formed. An eruption in 1984 produced a 12-km-high eruption plume, large amounts of floating pumice, and an ephemeral 500 x 1,500 m island, with cliffs 30-50 m high that enclosed a water-filled crater. In 2006 an island-forming eruption produced widespread dacitic pumice rafts that drifted as far as Australia. Another island was built during a September-October 2022 eruption.
Information Contacts: Copernicus Browser, Copernicus Data Space Ecosystem, European Space Agency (URL: https://dataspace.copernicus.eu/browser/).
Ambae
Vanuatu
15.389°S, 167.835°E; summit elev. 1496 m
All times are local (unless otherwise noted)
New lava flow, ash plumes, and sulfur dioxide plumes during February-May 2023
Ambae, also known as Aoba, is a large basaltic shield volcano in Vanuatu. A broad pyroclastic cone containing three crater lakes (Manaro Ngoru, Voui, and Manaro Lakua) is located at the summit within the youngest of at least two nested calderas. Periodic phreatic and pyroclastic explosions have been reported since the 16th century. A large eruption more than 400 years ago resulted in a volcanic cone within the summit crater that is now filled by Lake Voui; the similarly sized Lake Manaro fills the western third of the caldera. The previous eruption ended in August 2022 that was characterized by gas-and-steam and ash emissions and explosions of wet tephra (BGVN 47:10). This report covers a new eruption during February through May 2023 that consisted of a new lava flow, ash plumes, and sulfur dioxide emissions, using information from the Vanuatu Meteorology and Geo-Hazards Department (VMGD) and satellite data.
During the reporting period, the Alert Level remained at a 2 (on a scale of 0-5), which has been in place since December 2021. Activity during October 2022 through March 2023 remained relatively low and mostly consisted of gas-and-steam emissions in Lake Voui. VMGD reported that at 1300 on 15 November a satellite image captured a strong amount of sulfur dioxide rising above the volcano (figure 99), and that seismicity slightly increased. The southern and northern part of the island reported a strong sulfur dioxide smell and heard explosions. On 20 February 2023 a gas-and-ash plume rose 1.3 km above the summit and drifted SSW, according to a webcam image (figure 100). Gas-and-steam and possibly ash emissions continued on 23 February and volcanic earthquakes were recorded by the seismic network.
During April, volcanic earthquakes and gas-and-steam and ash emissions were reported from the cone in Lake Voui. VMGD reported that activity increased during 5-7 April; high gas-and-steam and ash plumes were visible, accompanied by nighttime incandescence. According to a Wellington VAAC report, a low-level ash plume rose as high as 2.5 km above the summit and drifted W and SW on 5 April, based on satellite imagery. Reports in Saratamata stated that a dark ash plume drifted to the WSW, but no loud explosion was heard. Webcam images from 2100 showed incandescence above the crater and reflected in the clouds. According to an aerial survey, field observations, and satellite data, water was no longer present in the lake. A lava flow was reported effusing from the vent and traveling N into the dry Lake Voui, which lasted three days. The next morning at 0745 on 6 April a gas-and-steam and ash plume rose 5.4 km above the summit and drifted ESE, based on information from VMGD (figure 101). The Wellington VAAC also reported that light ashfall was observed on the island. Intermittent gas-and-steam and ash emissions were visible on 7 April, some of which rose to an estimated 3 km above the summit and drifted E. Webcam images during 0107-0730 on 7 April showed continuing ash emissions. A gas-and-steam and ash plume rose 695 m above the summit crater at 0730 on 19 April and drifted ESE, based on a webcam image (figure 102).
According to visual and infrared satellite data, water was visible in Lake Voui as late as 24 March 2023 (figure 103). The vent in the caldera showed a gas-and-steam plume drifted SE. On 3 April thermal activity was first detected, accompanied by a gas-and-ash plume that drifted W (figure 103). The lava flow moved N within the dry lake and was shown cooling by 8 April. By 23 April much of the water in the lake had returned. Occasional sulfur dioxide plumes were detected by the TROPOMI instrument on the Sentinel-5P satellite that exceeded 2 Dobson Units (DU) and drifted in different directions (figure 104).
Geologic Background. The island of Ambae, also known as Aoba, is a massive 2,500 km3 basaltic shield that is the most voluminous volcano of the New Hebrides archipelago. A pronounced NE-SW-trending rift zone with numerous scoria cones gives the 16 x 38 km island an elongated form. A broad pyroclastic cone containing three crater lakes (Manaro Ngoru, Voui, and Manaro Lakua) is located at the summit within the youngest of at least two nested calderas, the largest of which is 6 km in diameter. That large central edifice is also called Manaro Voui or Lombenben volcano. Post-caldera explosive eruptions formed the summit craters about 360 years ago. A tuff cone was constructed within Lake Voui (or Vui) about 60 years later. The latest known flank eruption, about 300 years ago, destroyed the population of the Nduindui area near the western coast.
Information Contacts: Geo-Hazards Division, Vanuatu Meteorology and Geo-Hazards Department (VMGD), Ministry of Climate Change Adaptation, Meteorology, Geo-Hazards, Energy, Environment and Disaster Management, Private Mail Bag 9054, Lini Highway, Port Vila, Vanuatu (URL: http://www.vmgd.gov.vu/, https://www.facebook.com/VanuatuGeohazardsObservatory/); Wellington Volcanic Ash Advisory Centre (VAAC), Meteorological Service of New Zealand Ltd (MetService), PO Box 722, Wellington, New Zealand (URL: http://www.metservice.com/vaac/, http://www.ssd.noaa.gov/VAAC/OTH/NZ/messages.html); MIROVA (Middle InfraRed Observation of Volcanic Activity), a collaborative project between the Universities of Turin and Florence (Italy) supported by the Centre for Volcanic Risk of the Italian Civil Protection Department (URL: http://www.mirovaweb.it/); Global Sulfur Dioxide Monitoring Page, Atmospheric Chemistry and Dynamics Laboratory, NASA Goddard Space Flight Center (NASA/GSFC), 8800 Greenbelt Road, Goddard, Maryland, USA (URL: https://so2.gsfc.nasa.gov/); Copernicus Browser, Copernicus Data Space Ecosystem, European Space Agency (URL: https://dataspace.copernicus.eu/browser/).
Search Bulletin Archive by Publication Date
Select a month and year from the drop-downs and click "Show Issue" to have that issue displayed in this tab.
The default month and year is the latest issue available.
Bulletin of the Global Volcanism Network - Volume 29, Number 05 (May 2004)
Managing Editor: Richard Wunderman
Aira (Japan)
Frequent eruptions and ash plumes; 15 May plume noted by news media
Ambrym (Vanuatu)
Lava lake active; ash plume in MODIS images
Anatahan (United States)
Seismicity, fresh lava in crater, satellite image of ash plume
Awu (Indonesia)
Great Sangihe Island stratovolcano erupts dome in June; ~27,000 evacuated
Bagana (Papua New Guinea)
Block-lava flows descend flanks and raise concern for settlers
Bezymianny (Russia)
19 June 2004 eruption emits large ash plumes and viscous lava flows
Chichon, El (Mexico)
Photos of crater lake and volcanic morphology
Colima (Mexico)
Small explosions reamed out the former dome but left surrounding center intact
Fournaise, Piton de la (France)
Elevated April seismicity followed by eruptive fissures and lava flows
Long Valley (United States)
Summary of report noting nearly 5 years of relative quiescence
Nyamulagira (DR Congo)
During 26 May-1 June observers noted weak eruptions and local ashfall
Sheveluch (Russia)
Continued elevated seismicity with strong explosions in mid-May
Soufriere Hills (United Kingdom)
Seismicity generally low except for one dome-disrupting explosion
Tengger Caldera (Indonesia)
Mount Bromo's 8 June eruption killed two and ejected a 3-km-high ash plume
Aira
Japan
31.5772°N, 130.6589°E; summit elev. 1117 m
All times are local (unless otherwise noted)
Frequent eruptions and ash plumes; 15 May plume noted by news media
Based on information from the Japanese Meteorological Agency (JMA), the Tokyo Volcanic Ash Advisory Center (VAAC) reported that on 3 December 2003 at 2025 ash was emitted from Sakura-jima, rose to ~2.5 km a.s.l., and extended to the S. An eruption on 12 January 2004 at ~1430 produced an ash cloud that rose higher than 2 km altitude. On 19 and 20 February, explosions produced ash clouds that rose to unknown heights. No ash was visible on satellite imagery. Based on JMA information, the Tokyo VAAC reported that explosions on 26 March at 1715 and 27 March at 0607 produced plumes that extended S and rose to ~2.5 km and ~2 km altitude, respectively.
An eruption on 17 April produced a gas-and-ash plume that rose to ~3 km altitude and extended W. Another eruption on 25 April produced an ash plume that rose to ~2.4 km altitude. and extended N. The Tokyo VAAC reported, based on information from the JMA, that an eruption occurred on 28 April at 1820. It produced a plume that rose to ~2.4 km altitude and drifted SE. No ash was visible on satellite imagery.
According to the Har-Tass news agency, JMA reported a powerful ash-bearing discharge on 15 May at 1107. Specialists stated that the activity was the most intensive in four years. There were no reports of damage or injuries. The explosion registered as 'large' on the JMA's scale for both the sound and the strength of the tremor it caused, according to a quoted official at the local agency office in Kagoshima.
The Tokyo VAAC said the ash plume rose to more than 1.8 km altitude. An explosion occurred on 17 May at 1946, sending an ash plume to a height of 2.1 km altitude. On 18 May a pilot reported ash at a height of ~1.2 km altitude and ~23 km S of the Amori region. During 19-24 May, several explosions produced ash clouds. The highest reported ash cloud reached ~2.4 km altitude on 24 May. An explosion on 20 June at 1523 produced an ash cloud that rose to an unknown height.
Geologic Background. The Aira caldera in the northern half of Kagoshima Bay contains the post-caldera Sakurajima volcano, one of Japan's most active. Eruption of the voluminous Ito pyroclastic flow accompanied formation of the 17 x 23 km caldera about 22,000 years ago. The smaller Wakamiko caldera was formed during the early Holocene in the NE corner of the caldera, along with several post-caldera cones. The construction of Sakurajima began about 13,000 years ago on the southern rim and built an island that was joined to the Osumi Peninsula during the major explosive and effusive eruption of 1914. Activity at the Kitadake summit cone ended about 4,850 years ago, after which eruptions took place at Minamidake. Frequent eruptions since the 8th century have deposited ash on the city of Kagoshima, located across Kagoshima Bay only 8 km from the summit. The largest recorded eruption took place during 1471-76.
Information Contacts: Naokuni Uchida, Japan Meteorological Agency (JMA), Fukuoka, Japan (URL: http://www.jma.go.jp/); Tokyo Volcanic Ash Advisory Center (VAAC) (URL: https://ds.data.jma.go.jp/svd/vaac/data/).
Ambrym
Vanuatu
16.25°S, 168.12°E; summit elev. 1334 m
All times are local (unless otherwise noted)
Lava lake active; ash plume in MODIS images
Ambrym (last reported in BGVN 29:03) exhibited high levels of activity in March and April 2004. During March, an active lava lake was present in Mbwelesu crater, one of the active summit craters. As of 27 March, there were reports that the people of Craig Cove in West Ambrym were suffering from the effects of the ongoing volcanic eruption on the island. Gas and acidic rainfall from the active vents on the volcano were threatening to destroy the local food gardens. The island was still recovering from the effects of Cyclone Ivy, which caused widespread damage two weeks earlier; the added affects of the eruption prompted Vanuatu's leaders to request emergency relief assistance from national and local authorities.
As of 3 April, reports confirmed by the Darwin VAAC and J. Seach described continuing lava lake activity at Ambrym. On 27 April, a large ash plume was recorded drifting 150 km NW of the volcano, passing the northern tip of Malekula Island and almost reaching Malo Island. Eruptions were still continuing up to 2 May.
NASA's Earth Observatory posted two images of Ambrym and its plume as they appeared on 27 April 2004 (figure 11). The pair of images came from the Moderate Resolution Imaging Spectroradiometer (MODIS) on the Terra satellite. A large plume of volcanic ash blew westward from the volcano, which appears at the center right edge of figure 11 (top). The plume was mixing with clouds, and was more apparent as a bright, reddish orange color in the false-color image (below). Figure 11 (bottom) shows a wider area at the same spatial resolution.
Geologic Background. Ambrym, a large basaltic volcano with a 12-km-wide caldera, is one of the most active volcanoes of the New Hebrides Arc. A thick, almost exclusively pyroclastic sequence, initially dacitic then basaltic, overlies lava flows of a pre-caldera shield volcano. The caldera was formed during a major Plinian eruption with dacitic pyroclastic flows about 1,900 years ago. Post-caldera eruptions, primarily from Marum and Benbow cones, have partially filled the caldera floor and produced lava flows that ponded on the floor or overflowed through gaps in the caldera rim. Post-caldera eruptions have also formed a series of scoria cones and maars along a fissure system oriented ENE-WSW. Eruptions have apparently occurred almost yearly during historical time from cones within the caldera or from flank vents. However, from 1850 to 1950, reporting was mostly limited to extra-caldera eruptions that would have affected local populations.
Information Contacts: John Seach, PO Box 4025, Port Vila, Vanuatu (URL: http://www.volcanolive.com/); Darwin VAAC (URL: http://www.bom.gov.au/info/vaac/); Jeff Schmaltz, MODIS Rapid Response Team, NASA-GSFC; Holli Riebeek, NASA Earth Observatory (URL: https://earthobservatory.nasa.gov/).
Anatahan (United States) — May 2004 Cite this Report
Anatahan
United States
16.35°N, 145.67°E; summit elev. 790 m
All times are local (unless otherwise noted)
Seismicity, fresh lava in crater, satellite image of ash plume
The first recorded historical eruption at Anatahan Island began on 10 May 2003 (BGVN 28:04-28:06 and 28:09). More volcanism accompanied increased seismicity beginning 30 March 2004 (BGVN 29:04). Lava was noted in the crater on 15 April. During an overflight on 24 April scientists reported fresh lava within the inner crater. Seismic activity increased abruptly at 1052 on 24 April, escalating to levels higher than recorded since summer 2003, and a moderate eruption initially produced a light ash cloud that rose to altitudes below 2 km. The cloud persisted for only a day or so.
The seismicity level increased further on 24 and 25 April. On 26 April, a flat-shaped dome was observed within the inner crater. On the evening of April 28, the seismicity level peaked, then decreased slowly to about 40% of its peak value by 29 May. That seismicity resulted from strombolian bursts every minute or so that ejected material some hundreds of meters out of the crater, and steam and ash to several hundred meters. After a two-day-long decrease, the seismicity surged on 30-31 May to double the value of the previous few days, resulting from more frequent small explosions (occurring every few tens of seconds) as well as increased tremor.
On 7 and 8 June a 100-km-long, light-colored plume of steam and ash blew W. This was reported by the U.S. Air Force Weather Agency based on Defense Meteorological Satellite Program (DMSP) satellite images (figure 12).
Juan Camacho of the Commonwealth of the Northern Mariana Islands Emergency Management Office (CNMI/EMO) visited the island on 10 June and reported an active spatter cone, from which continuous strombolian explosions threw material as high as 100 m every 10 seconds to one minute. By 15 June, the amplitude and number of discrete events appeared to have decreased slightly.
Geologic Background. The elongate, 9-km-long island of Anatahan in the central Mariana Islands consists of a large stratovolcano with a 2.3 x 5 km compound summit caldera. The larger western portion of the caldera is 2.3 x 3 km wide, and its western rim forms the island's high point. Ponded lava flows overlain by pyroclastic deposits fill the floor of the western caldera, whose SW side is cut by a fresh-looking smaller crater. The 2-km-wide eastern portion of the caldera contained a steep-walled inner crater whose floor prior to the 2003 eruption was only 68 m above sea level. A submarine cone, named NE Anatahan, rises to within 460 m of the sea surface on the NE flank, and numerous other submarine vents are found on the NE-to-SE flanks. Sparseness of vegetation on the most recent lava flows had indicated that they were of Holocene age, but the first historical eruption did not occur until May 2003, when a large explosive eruption took place forming a new crater inside the eastern caldera.
Information Contacts: Juan Takai Camacho and Ramon Chong, Commonwealth of the Northern Mariana Islands Emergency Management Office (CNMI/EMO), Saipan, MP 96950 USA (URL: http://www.cnmihsem.gov.mp/); Frank Trusdell, U.S. Geological Survey, Hawaiian Volcano Observatory (HVO), PO Box 51, Hawaii National Park, HI 96718, USA (URL: https://volcanoes.usgs.gov/nmi/activity/); Hawaii Volcano Observatory (HVO), U.S. Geological Survey (USGS), Hawaii National Park, HI 96718, USA (URL: https://volcanoes.usgs.gov/nmi/activity/)update.html); Charles R. Holliday, Air Force Weather Agency, Offutt Air Force Base, Nebraska 68113 USA.
Awu
Indonesia
3.689°N, 125.447°E; summit elev. 1318 m
All times are local (unless otherwise noted)
Great Sangihe Island stratovolcano erupts dome in June; ~27,000 evacuated
A dome-extruding eruption occurred in the previouly lake-bearing summit crater of Mount (Gunung) Awu, a stratovolcano in Northern Indonesia off the N end of the island of Sulawesi (Celebes). Details of the eruption are still emerging, but an early dome had clearly extruded by 2 June 2004 (figure 1).
Prior to the eruption the crater contained a green lake. Before 1992, water volume was 35,000 x 103 m 3, but it decreased continuously, and in 2003, only 50 x 103 m 3 remained. Research carried out in 1993-1995 attributed the water loss to active faulting beneath the crater. Water inside the crater was of great concern because of its potential to produce lahars that could threaten settlements around Awu. Prior to the eruption, thick vegetation covered the crater's inner and outer rims.
Awu's previous eruption took place 12 August 1966. It took 39 lives, injured more than 1,000, and forced ~11,000 evacuations.
Signs of Awu threatening to erupt became clear mid-May 2004. They included a 15 May (felt, I MMI) tectonic earthquake, followed by two volcanic earthquakes. On 16 May, there were 12 volcanic earthquakes recorded, events interpeted as a signs of fluid moving up, and supported by the appearence of tremor with peak-to-peak amplitude of 8 mm. A gas plume rose 75 m above the crater's rim. On 17 May there were 4 volcanic earthquakes; peak-to-peak tremor amplitudes had dropped to 5 mm. This pattern continued through 18 May, with the number of volcanic earthquakes typically standing at ~6 and tremor amplitudes at 5 mm. The S minus P (S - P) times dropped from 2.0-1.75 sec to 0.5 sec, suggesting a shallower earthquake source, a possible indication of stress moving towards the surface.
In addition to the above observations, VSI scientists regarded the shortest historical repose time at Awu volcano as 25 years, an interval that had passed since the last eruption, and this became an additional reason for raising the alert level on 18 May.
Figure 1, a photo from the VSI website shows a close-up of a dome on 2 June 2004 with intense steam escaping, indicating that at least portions of a dome had emerged by that time. In figure 1, the dome and surrounding tephra predominanly appear as gray, darker-colored spines and angular blocks and fragments, but occasional clasts of large white fragments, presumably pumice, lie sprinkled across the surface.
Seismicity increased on 4-5 June during 2330-0130 when more than 30 shallow volcanic (Type A) earthquakes occurred. In contrast, typical May seismicity only included one earthquake per day. On 5 June during 1000-1300, instruments recorded 85 earthquakes. On 6 June during 0200-0430, they recorded 50; and during 0900-1010, they recorded 2-3 earthquakes per minute. Tremor followed, with maximum peak-to-peak amplitude of 24 mm. The hazards status quickly increased to its highest level ('IV,' WITA).
At 1230 on 6 June, explosion earthquakes of small size occurred, followed by a rain of thin ash, which fell to the N. Visible white ash reached 500-750 m above the summit. An explosion sent ash 1 km above the crater rim, and the ash fell around the summit. Tremor prevailed until 2000, with maximum amplitude of 5 mm. At this point, 20,000 residents had already been evacuated.
Seismicity increased on 7 June; during the period 0000 to 0800 hours seismometers recorded 165 deep volcanic earthquakes, 18 shallow volcanic earthquakes, and continuous volcanic tremor-amplitude maxima exceeded 46 mm.
At 1117 on 7 June, an eruption began at 1800 hours, with ash plumes rising 1 km above the summit. After the eruption on 7 June, seismic signals similar to tremor occured (at 1807), with continuous, peak-to-peak amplitudes of about 12-45 mm (maximum).
During 7-8 June from 2000 to 0600, visual observers noted that 500- to 700-m-high ash clouds still hung over the summit. For the interval 0600-0600 8-9 June, VSI reported, "All day long there were many explosions." In additon, five major explosions were noted, at 1510, 1630, and 1730 on 8 June, and at 0606 and 0910 on 9 June. Presumably due to each of those larger outbursts, dark gray ash plumes rose up 1-2 km above the summit.
Ash thickness at Tahuna was about 0.5-1.5 mm. Beginning on 8 June 2004 at 0800, Tahuna airport was closed. VSI noted that the ash rain could have reached Tabukan Utara and part of Kendahe, caused by the wind to the SW.
At 0529 on 10 June, Awu began a sustained eruption, described as the climax, lasting 34 minutes (figure 2). That event sent a column of gray to black ash to 3 km above the summit. The outburst was accompanied by low rumbling sounds and tephra.
By 11 June, explosions and seismicity decreased drastically, with tremor amplitudes of only 2-3 mm. Until 13 June VSI recorded no deep volcanic earthquakes. At 0600 on 13 June authorities reduced the hazard status and some W- and ESE-flank residents returned home.
Figure 3 documents fresh deposits, the presumably new dome, and denuded vegetation. Ash generally fell to the ESE. During the first eruption, ash fell on Tahuna city and its vicinity with a thickness of 0.5-1 mm. Surrounding villages received ash deposits as follows: Lenganeng, 2 mm; Naha, 2 mm; Bahang, 1.5 mm; Kalakuhe, 1.5 mm; and Mala, 1.5 mm.
Inspection of the crater at an undisclosed time revealed a lava dome 300 x 250 m in plan view and 40 m in height. It is uncertain whether these values represent an early dome (figure 1) or larger, later dome (figure 3).
On 14 June, observers saw a thin white plume rising 50-100 m above the crater. Beginning 17 June, the hazard status dropped to level II (Waspada). Following 18 June, seismicity declined, and instruments no longer recorded tremor. The latest Awu report, which discussed the interval 28 June-4 July, noted level II hazard status, plumes 50-200 m tall, and the observation of incandescent material, suggesting continued dome growth.
UN Reports. According to an 8 June report from the UN Office for the Coordination of Humanitarian Affairs, the evacuation process triggered by Awu's eruption started on the evening of 6 June and continued through at least 8 June. The total number of people expected to be evacuated was ~27,000 (12,065 from Tahuna, 5,690 from Kendahe, and 9,248 from Tabukan Utara). As of 8 June, 17,326 people had been evacuated. These displaced people were accommodated in government buildings, schools, and houses of prayer. The Directorate of Vulcanology strongly advised the temporary halting of flights from Manado (at the N end of Sulawesi Island) to Sangihe Island.
Geologic Background. The massive Gunung Awu stratovolcano occupies the northern end of Great Sangihe Island, the largest of the Sangihe arc. Deep valleys that form passageways for lahars dissect the flanks of the volcano, which was constructed within a 4.5-km-wide caldera. Powerful explosive eruptions in 1711, 1812, 1856, 1892, and 1966 produced devastating pyroclastic flows and lahars that caused more than 8000 cumulative fatalities. Awu contained a summit crater lake that was 1 km wide and 172 m deep in 1922, but was largely ejected during the 1966 eruption.
Information Contacts: Dali Ahmad, Volcanological Survey of Indonesia (VSI), Directorate of Volcanology and Geological Hazard Mitigation, Jalan Diponegoro 57, Bandung 40122, Indonesia (URL: http://www.vsi.esdm.go.id/); Office for the Coordination of Humanitarian Affairs (OCHA), United Nations, New York, NY 10017 USA.
Bagana (Papua New Guinea) — May 2004 Cite this Report
Bagana
Papua New Guinea
6.137°S, 155.196°E; summit elev. 1855 m
All times are local (unless otherwise noted)
Block-lava flows descend flanks and raise concern for settlers
The Rabaul Volcano Observatory (RVO) received a report on 28 April from a pilot of the Hevi Lift helicopter company stating that new lava had come from Bagana volcano the day before. RVO has had no monitoring equipment at Bagana since 1989. Although they hope to again install monitoring instruments in the future, they could not confirm the visual observations instrumentally.
Bagana has been in long-term eruption since 1972, although reports ceased in 1995 because of political and economic unrest. MODIS satellite observations began in 2000, and almost monthly thermal alerts have been recorded since September 2000.
According to a news article, on 2 May local volcanologists and a team of provincial disaster delegates conducted an aerial inspection of the area around Bagana. At that time, the team concluded that the lava flows were not an immediate threat to the safety of villagers near the volcano. According to news reports a spokesperson for Papua New Guinea's national Disaster Center said the aerial inspection team noted a continual effusion of lava flowing in a southwesterly direction, but there was a great deal of vegetation in the area which acted as a buffer.
A later news article also noted that in the long term the lava flows could expose local hamlets to danger. The hamlets were constructed in the 1990s by people displaced by civil unrest.
RVO staff sent a series of photos and brief notes regarding their visit. Ima Itikarai commented that during his trip clouds affected the quality of the photos. Figure 3 shows a hamlet, which sits 3 km from the active block-lava flow front and 6.5 km from the summit, well within reach of pyroclastic flows similar to those in 1952, 1960, and 1966.
At about the same time but in clearer weather, another photographer, Peter Mildner, took the photo in figure 4. It shows Bagana's summit and the active block-lava flow at a point where the levees had become 'bank full.' Figure 5 shows the lava flow pouring over the levees at various points. The lava flow's toe was also being overridden.
Geologic Background. Bagana volcano, in a remote portion of central Bougainville Island, is frequently active. This massive symmetrical cone was largely constructed by an accumulation of viscous andesitic lava flows. The entire edifice could have been constructed in about 300 years at its present rate of lava production. Eruptive activity is characterized by non-explosive effusion of viscous lava that maintains a small lava dome in the summit crater, although occasional explosive activity produces pyroclastic flows. Lava flows with tongue-shaped lobes up to 50 m thick and prominent levees descend the flanks on all sides.
Information Contacts: Ima Itikarai and Herman Patia, Rabaul Volcano Observatory (RVO), P.O. Box 386, Rabaul, Papua New Guinea; Papua New Guinea Post-Courier; The National; The Australian.
Bezymianny
Russia
55.972°N, 160.595°E; summit elev. 2882 m
All times are local (unless otherwise noted)
19 June 2004 eruption emits large ash plumes and viscous lava flows
Eruptions associated with extrusion of viscous lavas continued at Bezymianny into June 2004. Since observers last reported on Bezymianny (BGVN 29:03) they noted substantial ash plumes occurring in June 2004 (table 2). The summary below chiefly comes from weekly reports made by Kamchatka Volcanic Eruptions Response Team (KVERT) and disseminated through the Alaska Volcano Observatory (AVO).
Table 2. A synopsis of some recent eruptions distinguished at Bezymianny (the first three were previously discussed, BGVN 28:10 and 29:03). Taken from KVERT reports.
| Date |
Time |
Characteristics of Eruption |
| 26-27 Dec 2002 |
0715 |
Ash cloud to 5 km altitude, depositing ash 55 km NW of volcano. |
| 26 Jul 2003 |
2057 |
Ash plume to 8-11 km altitude, extending 192 km, 217 km and ~250-300 km W of the vent. |
| 14 Jan 2004 |
1053 |
Ash plume to 6-8 km altitude, extending ~190 km; pyroclastic flow. |
| 19 Jun 2004 |
0840 |
Ash plume to ~8-10 km altitude (estimated from seismic signature); plume ultimately sighted over 1,000 km from source. |
This report concerns the most recent eruption of Bezymianny which occurred on 19 June 2004. Increased activity on the volcano began during 11 to 14 June, when seismicity rose above background level and 2-3 shallow earthquakes occurred daily.
By 16 June, KVERT elevated Bezymianny's hazard status, raising the Concern Color Code from Yellow to Orange (table 3), signifying that an eruption could occur at any time. On 19 June, the Code was raised to Red, the highest level.
Table 3. The significance of various hazard status categories on the KVERT Concern Color Code Key. This key is regularly posted with their reports.
| Color |
Status |
| Green |
Volcano is dormant; normal seismicity and fumarolic activity. |
| Yellow |
Volcano is restless; eruption may occur. |
| Orange |
Volcano is in eruption or eruption may occur at any time. |
| Red |
Significant eruption is occurring or explosive eruption expected at any time. |
Explosive activity began at 0840 on 19 June, and according to seismic data, it produced an ash plume that rose ~8-10 km altitude. Satellite imagery revealed that by 1319, the plume had extended ~200 km. The more concentrated portion of the plume was in the zone of ~ 167-189 km from the volcano. At 1439, a large local ash cloud moved to the NNE towards Bering Island. Later in the day, the seismicity level decreased, and KVERT reduced the Concern Color Code to Orange. During 18 to 19 June, an ash cloud extended over 1,000 km E and SE of the volcano, and "possible ash deposits" were inferred 190 km SE of the lava dome. The last time an ash cloud was noted near Korovin Island was on 20 June.
Around this time KVERT noted viscous lava flows at the lava dome. They documented weak, 1- to 4-pixel thermal anomalies over the dome. In the wake of the eruption KVERT reported gas-steam plumes extending ~3.5 km S, NE, and ESE. Following that, they reported no other activity as recently as 25 June.
Geologic Background. The modern Bezymianny, much smaller than its massive neighbors Kamen and Kliuchevskoi on the Kamchatka Peninsula, was formed about 4,700 years ago over a late-Pleistocene lava-dome complex and an edifice built about 11,000-7,000 years ago. Three periods of intensified activity have occurred during the past 3,000 years. The latest period, which was preceded by a 1,000-year quiescence, began with the dramatic 1955-56 eruption. This eruption, similar to that of St. Helens in 1980, produced a large open crater that was formed by collapse of the summit and an associated lateral blast. Subsequent episodic but ongoing lava-dome growth, accompanied by intermittent explosive activity and pyroclastic flows, has largely filled the 1956 crater.
Information Contacts: Olga A. Girina, Kamchatka Volcanic Eruptions Response Team (KVERT), a cooperative program of the Institute of Volcanic Geology and Geochemistry, Far East Division, Russian Academy of Sciences, Piip Ave. 9, Petropavlovsk-Kamchatsky, 683006, Russia, the Kamchatka Experimental and Methodical Seismological Department (KEMSD), GS RAS (Russia), and the Alaska Volcano Observatory (USA); Alaska Volcano Observatory (AVO), a cooperative program of the U.S. Geological Survey, 4200 University Drive, Anchorage, AK 99508-4667, USA (URL: http://www.avo.alaska.edu/), the Geophysical Institute, University of Alaska, PO Box 757320, Fairbanks, AK 99775-7320, USA, and the Alaska Division of Geological and Geophysical Surveys, 794 University Ave., Suite 200, Fairbanks, AK 99709, USA.
El Chichon
Mexico
17.3602°N, 93.2297°W; summit elev. 1150 m
All times are local (unless otherwise noted)
Photos of crater lake and volcanic morphology
The Bulletin staff received numerous photographs of currently non-eruptive El Chichón from amateur photographer King Freeland; a few are included below. Some of Freeland's photos are wide-angle montages compiled from multiple photos using image-processing software. The photograph in figure 5 was taken in April 2004 and shows the warm, bright green, acidic crater lake. Figure 6 illustrates the central crater as it looked in May 2004 from the SE side of the volcano looking towards the WSW.
Figure 7 depicts a sequence of what resemble stair steps developed on the pyroclastic deposits. Yuri Taran estimated the approximate height of these "steps" as 0.5-1 m, but the photographer Freeland suggested a height of up to 3 m. Taran and Freeland both offered that the features may result from the work of water, and Taran also suggested wind as a possibility.
Taran lamented the lack of people studying these features, even though they appeared quite spectacular, stating "We need a team of geographers to study this type of erosion, soil formation..." Many of Freeland's other photos in our archives also depict fumarolic and hydrothermal features.
Yuri Taran from the Institute of Geophysics, Universidad Nacional Autonoma de Mexico (UNAM), has been studying El Chichón volcano and its hydrothermal activity for almost 10 years (see Capaccioni and others, 2004). Taran noted that three groups of hot springs exist on the slopes of the volcano: Agua Caliente, S of the volcano with a maximum temperature of 74°C; Agua Salada, at the base of the dome, SSW from the crater, with a maximum temperature of 55°C; and Agua Tibia, NW of the crater with an estimated maximum temperature of ~ 51°C. The crater lake has variable shape and size, depending on the flow rate of a boiling spring in the crater that feeds the lake. When this spring sometimes disappears, the lake becomes smaller until an equilibrium develops between precipitation, evaporation, and seepage through the lake bottom. This 'equilibrium' lake size is quite small. Taran noted that during the period of his study the lake was smallest in November 1998 (at the end of the rainy season), and it was very shallow, ~1.3 m deep.
References. Capaccioni, B., Taran, Y., Tassi, F., Vaselli, O., Mangani, G., and Macias, J.L., 2004, Source conditions and degradation processes of light hydrocarbons in volcanic gases: an example from El Chichón volcano (Chiapas State, Mexico), Chemical Geology, v. 206, nop. 1-2, p.81-96.
Geologic Background. El Chichón is a small trachyandesitic tuff cone and lava dome complex in an isolated part of the Chiapas region in SE México. Prior to 1982, this relatively unknown volcano was heavily forested and of no greater height than adjacent non-volcanic peaks. The largest dome, the former summit of the volcano, was constructed within a 1.6 x 2 km summit crater created about 220,000 years ago. Two other large craters are located on the SW and SE flanks; a lava dome fills the SW crater, and an older dome is located on the NW flank. More than ten large explosive eruptions have occurred since the mid-Holocene. The powerful 1982 explosive eruptions of high-sulfur, anhydrite-bearing magma destroyed the summit lava dome and were accompanied by pyroclastic flows and surges that devastated an area extending about 8 km around the volcano. The eruptions created a new 1-km-wide, 300-m-deep crater that now contains an acidic crater lake.
Information Contacts: King Freeland, Distrito Reynosa 157, Fracc. Pages Llergo, Villahermose, Tabasco, CP86125, México; Yuri Taran, Instituto de Geofisica, Universidad Nacional Autonoma de México (UNAM), Ciudad Universitaria, Coyaocan 04510, México D.F., México (URL: http://www.geofisica.unam.mx/).
Colima
Mexico
19.514°N, 103.62°W; summit elev. 3850 m
All times are local (unless otherwise noted)
Small explosions reamed out the former dome but left surrounding center intact
A March 2004 observatory report noted that one year of explosive activity had passed, an interval that began in February 2003 after the termination of lava emission (BGVN 28:06). During March-May 2003 there was an increase in the number of small explosions. During the year, seismometers recorded ~ 1,500 small explosions (figure 68). After that, the frequency of explosions became stable, with 3-5 daily explosions (figures 69 and 70). Four relatively significant explosions occurred during 2003 on 17 July, on 2 and 28 August (BGVN 28:08), and on 15 November, although there was no change in the daily number of events.
The sequence of explosions destroyed the former lava dome. Although the depth of the crater floor increased slightly as a result, the crater's dimensions changed little (figure 71).
A later observatory report also noted that a significant explosion took place at 1228 on 12 June 2004. During preceding days, the volcano continued to show low-intensity activity, with an average of under three ash explosions per day. The heights of the columns did not exceed 2,000 m above the crater; they blew mainly to the W.
The exclusionary zone for both States adjoining Colima volcano remained 6.5 km from the summit. Also, the alert radius covered distances of up to 11.5 km from the summit, in order to include residents of Causentla, Cofradia de Tonila, Atenguillo, El Saucillo, El Fresnal, and El Embudo. Warnings to avoid lingering were also applied to the valleys of La Lumbre, El Cordobán, San Antonio and Monte Grande, El Muerto, La Tuna, Santa Ana, El Cafecito, La Arena, and Beltrán-Duranzno.
The Washington Volcanic Ash Advisory Center (VAAC) for aviation safety issued many reports ("Volcanic Ash Advisories") for Colima during 2003 and 2004, including over 30 during 2004. The bulk of the 2004 reports came out in February, March, April, and as recently as 14 May; no reports were issued since then to the late June date of this Bulletin. A sampling of the 2004 VAAC reports and associated graphics indicated several plumes to over 6 km altitude had been seen via satellite.
Geologic Background. The Colima complex is the most prominent volcanic center of the western Mexican Volcanic Belt. It consists of two southward-younging volcanoes, Nevado de Colima (the high point of the complex) on the north and the historically active Volcán de Colima at the south. A group of late-Pleistocene cinder cones is located on the floor of the Colima graben west and east of the complex. Volcán de Colima (also known as Volcán Fuego) is a youthful stratovolcano constructed within a 5-km-wide scarp, breached to the south, that has been the source of large debris avalanches. Major slope failures have occurred repeatedly from both the Nevado and Colima cones, producing thick debris-avalanche deposits on three sides of the complex. Frequent recorded eruptions date back to the 16th century. Occasional major explosive eruptions have destroyed the summit (most recently in 1913) and left a deep, steep-sided crater that was slowly refilled and then overtopped by lava dome growth.
Information Contacts: Observatorio Vulcanológico de la Universidad de Colima, Colima, Col., 28045, México; Washington Volcanic Ash Advisory Center (VAAC), NOAA-NESDES, Satellite Analysis Branch, 5200 Auth Road, Camp Springs, Maryland 20746 USA.
Piton de la Fournaise (France) — May 2004 Cite this Report
Piton de la Fournaise
France
21.244°S, 55.708°E; summit elev. 2632 m
All times are local (unless otherwise noted)
Elevated April seismicity followed by eruptive fissures and lava flows
After the eruption of December 2003 (BGVN 29:03), Piton de la Fournaise underwent a month of high seismic activity in April 2004. The activity consisted of 10-30 earthquakes per day with two minor seismic crises, and was accompanied by continuous inflation of the summit. On 2 May a new seismic crisis started at 1903. At 1936 eruption tremor appeared. The high intensity of tremor near the Bory crater (2,632 m) indicated that eruption had most likely started within or very close to the crater.
No activity was visible in the crater on 3 May. An overflight planned by the Observatoire Volcanologique du Piton de la Fournaise (OVPF) with the help of local police militia was unable to take place due to bad weather and rain on the volcano. The initial assessments of the observatory indicated the opening of eruptive cracks in the higher of the two craters. A long crack on the SW side extended from 2,500 m to at least 2,300 m elevation. During an observational visit by OVPF volcanologists on 4 May, a fissure was observed to have opened between 2,800 m and 2,200 m elevation. The fissure was inactive at the time of observation but much lava ejecta covered the surrounding area. A second fissure, opened during the night between Sunday and Monday, was active. As of 4 May, activity continued from three eruptive vents located between Chateau-Fort crater and Piton Bert. Tremor remained stable. During the night of 11-12 May, the single remaining active fissure projected lava ejecta onto the slopes of the cone in the SW area of the crater. The eruption continued on 15 May but moved from the summit of the volcano toward its lower slopes. Flows accumulated within the crater, and a large flow with an estimated length of 300 m was seen coming from a ~ 2.5 km-long tunnel, originating at the floor of the Enclos Fouqué caldera and issuing at the surface near the Nez du Tremblet and in the Grandes Pentes area. Further downslope, burning vegetation was observed, indicating the presence of lava flows far from the point of emission. The larger flow reached an elevation of 1,150 m, putting it 4 km from National Route (NR) 2. At 1200, the lava flow was 2.5 km from NR 2. Scientists at the observatory expected the flow's advance to slow due to the shallowing of the slope starting at 900 m elevation, and because the eruptive tremor, though it had increased slightly the day before, remained at a moderate level.
On 16 May, the lava flow stopped 1.8 km from NR 2 at 460 m elevation. A second fissure produced a second lava flow parallel to the first. Tremor increased in the crater, indicating a renewal of activity, and lava ejecta were erupted from the two cones. The OVPF reported on 17 May that the eruption was still continuing. Lava fountains from the main eruptive cone rose several tens of meters above the vent. That evening, lava flows were visible on the upper part of the Grandes Pentes. Pélé's hair had fallen in the town of St. Rose. Seismicity remained on a moderate level. At about 1500 on 18 May, the OVPF's network recorded a progressive increase in the tremor over a twenty-minute period; then at 1552, the tremor decreased dramatically. By 1615, any trace of tremor had disappeared from the recordings. On 21 May at 1500, a lava front was observed flowing at 1150 m elevation, within ~4 km of National Route 2. Volcanic tremor increased slightly, but remained at a moderate level.
Geologic Background. Piton de la Fournaise is a massive basaltic shield volcano on the French island of Réunion in the western Indian Ocean. Much of its more than 530,000-year history overlapped with eruptions of the deeply dissected Piton des Neiges shield volcano to the NW. Three scarps formed at about 250,000, 65,000, and less than 5,000 years ago by progressive eastward slumping, leaving caldera-sized embayments open to the E and SE. Numerous pyroclastic cones are present on the floor of the scarps and their outer flanks. Most recorded eruptions have originated from the summit and flanks of Dolomieu, a 400-m-high lava shield that has grown within the youngest scarp, which is about 9 km wide and about 13 km from the western wall to the ocean on the E side. More than 150 eruptions, most of which have produced fluid basaltic lava flows, have occurred since the 17th century. Only six eruptions, in 1708, 1774, 1776, 1800, 1977, and 1986, have originated from fissures outside the scarps.
Information Contacts: Thomas Staudacher, Observatoire Volcanologique du Piton de la Fournaise Institut de Physique du Globe de Paris, 97418 La Plaine des Cafres, La Réunion, France (URL: http://www.ipgp.fr/fr/ovpf/observatoire-volcanologique-piton-de-fournaise).
Long Valley (United States) — May 2004 Cite this Report
Long Valley
United States
37.7°N, 118.87°W; summit elev. 3390 m
All times are local (unless otherwise noted)
Summary of report noting nearly 5 years of relative quiescence
The following is a summary of Hill (2004) and Sorey, Hill, and McConnell (2000), reports that collectively concluded that with the close of 2003, Long Valley Caldera had sustained nearly five years of relative quiescence. This marked the longest such interval since the onset of unrest in 1978. A summary of 2001-2002 activity was published in March 2003 (BGVN 28:03).
The slow inflation of the resurgent dome at a rate of ~ 1 cm/year that persisted through most of 2002 leveled off in early 2003 with essentially no change through the end of the year. At the end of 2003, the center of the resurgent dome stood only about 0.5 cm higher than in early 1999. It remained roughly 80 cm higher than in the late 1970s.
Seismic activity within the caldera remained low through 2003 as it has for the previous four years, averaging fewer than five earthquakes per day large enough to be located by the realtime computer system (M 0.5 and above). As in the past, most of these earthquakes were confined to the S moat and the S margin of the resurgent dome. The largest intra-caldera earthquake during the year was a M 2.4 event on 19 September 2003 at 0751, associated with a cluster of smaller events in the S moat beneath the E margin of Mammoth Lakes. An earthquake sequence of comparable intensity was centered beneath the SE margin of the resurgent dome on 8 November. This sequence included three M > 2 earthquakes, the largest of which was a M 2.2 earthquake at 2102.
Most of the earthquake activity in the Sierra Nevada block S of the caldera continued to be concentrated in the N-NE lineation of epicenters that represents the aftershock zone of the three M > 5 earthquakes of June and July 1998 and May 1999 (figure 29). A notable exception was the M 4.0 earthquake of 8 March (0735) that was located 1 km S of Laurel Mountain (~5 km S of the caldera boundary and 11 km ESE of Mammoth Lakes). This earthquake was felt in the Mammoth Lakes area and was accompanied by over 50 smaller earthquakes, the largest of which was a M 3.2 event. The Grinnell Lake area near the S end of the seismicity lineation in the Sierra Nevada was one of the more persistently active areas through the year. It produced M 3.2 earthquakes on 15 June and 18 August as well as a host of smaller earthquakes.
Occasional M 3 earthquakes elsewhere in the region included: a M 3.2 earthquake on 23 January 3 km E of Red Slate Mountain (midway along the seismicity lineation in figure 29), a M 3.0 earthquake on 18 March located beneath the Volcanic Tableland 10 km E of Crowley Lake, a M 3.1 earthquake on 31 August located 2 km E of Lake Dorothy in the Sierra Nevada, a M 3.0 earthquake on 26 October located 20 km W of Bishop, and a M 3.5 earthquake on November 10 in Round Valley. Altogether, ten earthquakes of M 3 or greater occurred in the area during 2003, the largest being the M 4.0 event on 8 March near Laurel Mountain. The mid-crustal (10- to 25-km-deep) long period (LP) volcanic earthquakes, which began during the 1989 Mammoth Mountain earthquake swarm, continued beneath the SW margin of Mammoth Mountain but at a much-reduced rate with respect to the activity levels during the first half of 1997. LP activity for 2003 was limited to the first and last quarters of the year with no LP earthquakes detected from April through September.
The carbon dioxide (CO2) emissions from the tree-kill areas around the flanks of Mammoth Mountain remained similar over the last several years. In particular, data from the CO2 sensors at Horseshoe Lake were relatively flat and uneventful for 2003 except for the normal winter excursions due to snow accumulation. A soil CO2 efflux survey of Horseshoe Lake in August gave an emission rate of 135 tons/day, which is slightly higher than the rate for 2002. However, the emission rate trend from 1995 through 2003 based on linear regression was relatively flat at ~100 tons/day, suggesting continued CO2 emissions. The Horseshoe Lake tree-kill area produces roughly one third of the total CO2 flux from the flanks of Mammoth Mountain.
Intra-caldera sites contained dead vegetation, elevated soil temperatures, and CO2 concentrations consistent with ongoing geothermal activity. The areas that produced the greatest CO2 emissions were in the vicinity of the geothermal plant and have been known for some time. Initially the formation of these areas likely occurred as a result of superficial changes linked to increases in geothermal fluid production in the late 1980s and early 1990s. Some recently identified sites displayed elevated soil temperatures on the resurgent dome above Fumarole Canyon; these may reflect a delayed response to the 1997 earthquake swarm activity in the area. Total CO2 emissions at these sites are marginally above background levels.
Hydrologic monitoring data show that declining fluid pressures in key monitoring wells over the past several years continued through 2003. Fluid pressures in four of five key monitoring wells during 2003 were at the lowest values since 1995 and for three of these wells the pressures were the lowest since the late 1980s. The data also show a sharp decline in thermal-water discharge from springs in Hot Creek Gorge, an event that began in August 2003 and persisted to the end of 2003. The decline in discharge was ~18% of the long-term mean discharge.
The decline in thermal-water discharge from Hot Creek Gorge springs was consistent with the low fluid pressures recorded in wells CW3 and CH10B, both of which tapped the S-moat hydrothermal system. The reason for this decline was unclear. Geothermal production from the Casa Diablo power plant has not changed significantly over the past year and the caldera has shown no significant unrest.
New instrumentation and an interdisciplinary workshop. During the week of 2 August 2003, a team of scientists and drilling experts from the oil industry successfully installed a 30-m-long geophysical instrument string at a depth ~2.4 km in the Long Valley Exploratory Well (LVEW). The instrument string includes two three-component seismometers (4 Hz natural frequency, one at 2592 m and the other at 2264 m depths), a dilatometer (at 2254 m depth), a 48-m-long vertical-axis optical-fiber strainmeter (centered at 2150 m depth), and pass-through tubes designed to track pore pressure in the open hole beneath the instrument package. As signals from the remaining components of the LVEW deep borehole observatory come on line over the next few months, they will greatly enhance the power of the LVO network as both a monitoring and research tool.
Instrumentation of LVEW as a deep-borehole observatory represents the final stage of a major drilling project that began in the mid-1980s with multi-agency support (Sorey and others, 2000).
A four-day workshop was held 8-12 October 2003. The title was "Understanding a Large Silicic Volcanic System: An Interdisciplinary Workshop on Volcanic Process in Long Valley Caldera-Mono Craters."
References.Hill, D.P., 2003, Long Valley Observatory quarterly report October-December 2003 and annual summary for 2003: Long Valley Observatory, U.S. Geological Survey, Menlo Park, CA (URL: http://lvo.wr.usgs.gov/Quarterly/qrt_rpt_4-03.htm).
Sorey, M.L., Hill, D.P., and McConnell, V.S., 2000, Scientific drilling in Long Valley Caldera, California—an update, in California Geology, California Geological Survey, v. 53, pp. 4-11, URL: http://www.consrv.ca.gov/cgs/information/publications/california_geology_magazine.htm.
Geologic Background. The large 17 x 32 km Long Valley caldera east of the central Sierra Nevada Range formed as a result of the voluminous Bishop Tuff eruption about 760,000 years ago. Resurgent doming in the central part of the caldera occurred shortly afterwards, followed by rhyolitic eruptions from the caldera moat and the eruption of rhyodacite from outer ring fracture vents, ending about 50,000 years ago. During early resurgent doming the caldera was filled with a large lake that left strandlines on the caldera walls and the resurgent dome island; the lake eventually drained through the Owens River Gorge. The caldera remains thermally active, with many hot springs and fumaroles, and has had significant deformation, seismicity, and other unrest in recent years. The late-Pleistocene to Holocene Inyo Craters cut the NW topographic rim of the caldera, and along with Mammoth Mountain on the SW topographic rim, are west of the structural caldera and are chemically and tectonically distinct from the Long Valley magmatic system.
Information Contacts: David Hill, Long Valley Observatory, Volcano Hazards Program, U.S. Geological Survey, 345 Middlefield Rd., MS 977, Menlo Park, CA 94025, USA (URL: https://volcanoes.usgs.gov/observatories/calvo/); Deborah Bergfeld, Jim Howle, Chris Farrar, and William Evans, U. S. Geological Survey, Menlo Park, and Carnelian Bay, CA.
Nyamulagira (DR Congo) — May 2004 Cite this Report
Nyamulagira
DR Congo
1.408°S, 29.2°E; summit elev. 3058 m
All times are local (unless otherwise noted)
During 26 May-1 June observers noted weak eruptions and local ashfall
When last reported (BGVN 29:04), Nyamuragira was in the midst of an eruption that had begun on 8 May 2004 and continued through 12 May. The Toulouse Volcanic Ash Advisory Center (VAAC) reported that satellite imagery showed a weak ash eruption on 25 May and that from 26 May to 1 June there were weak but steady emissions from Nyamuragira and neighboring Nyiragongo (~13 km SE of Nyamuragira). The Goma volcano observatory confirmed that ash fell within a radius of 60 km of both volcanoes. VAAC reports on 1 June said that satellite imagery indicated the eruptions at Nyamuragira had ceased.
Geologic Background. Africa's most active volcano, Nyamulagira (also known as Nyamuragira), is a massive high-potassium basaltic shield about 25 km N of Lake Kivu and 13 km NNW of the steep-sided Nyiragongo volcano. The summit is truncated by a small 2 x 2.3 km caldera that has walls up to about 100 m high. Documented eruptions have occurred within the summit caldera, as well as from the numerous flank fissures and cinder cones. A lava lake in the summit crater, active since at least 1921, drained in 1938, at the time of a major flank eruption. Recent lava flows extend down the flanks more than 30 km from the summit as far as Lake Kivu; extensive lava flows from this volcano have covered 1,500 km2 of the western branch of the East African Rift.
Information Contacts: Baluku Bajope and Kasereka Mahinda, Observatoire Volcanologique de Goma, Departement de Geophysique, Centre de Recherche en Sciences Naturelles, Lwiro, D.S. Bukavu, DR Congo; Toulouse Volcanic Ash Advisory Center (VAAC), Météo-France, 42 Avenue Gaspard Coriolis, F-31057 Toulouse cedex, France (URL: http://www.meteo.fr/vaac/); TOMS Volcanic Emissions Group (URL: https://so2.gsfc.nasa.gov/).
Sheveluch
Russia
56.653°N, 161.36°E; summit elev. 3283 m
All times are local (unless otherwise noted)
Continued elevated seismicity with strong explosions in mid-May
With the exception of strong ash explosions and related seismic activity on 9-10 May (described below), unrest at Shiveluch during 9 April-27 May 2004 was similar to that described in our last report (BGVN 29:03).
In effect, observers noted above-background seismicity, lava dome growth, and associated pyroclastic flows. Steam plumes rising as high as 3.5 km altitude, and ash plumes rising 4-7 km altitude, were seen frequently. Earthquakes occurred at depths of 0-5 km and had local magnitudes (Ml) of 1.25 - 2.25 while spasmodic tremor varied between 0.1-0.9 µm/sec.
During the period, U.S. and Russian satellites repeatedly detected 1- to 9-pixel thermal anomalies. Accordng to ground-based observers, the volcano was obscured by clouds throughout much of the report period.
Less than ten strong earthquakes were recorded each week in April. However, activity increased during the week ending 6 May when 35 strong earthquakes were recorded. According to seismic data, from 0210 to 0730 on 10 May, a series of strong ash explosions occurred at the lava dome. Continuous tremor at 14.8 µm/sec occurred during that time, decreasing to 0.3 µm/sec by 0940. Seismic activity increased again during 2150-2325, and tremor was 5-6 µm/sec. According to video and visual observation, explosions sent ash to altitudes of 8-11 km. American and Russian satellite data recorded a 9-pixel thermal anomaly over the lava dome at 2336 on 9 May and a 6-pixel anomaly at 0642 on 10 May. Around this time, authorities temporarily raised the level of concern from orange to red.
From 0725 through 1502 on 10 May an ash plume extended over 450 km to the SE and ash deposits were observed on 11 May over a wide sector to the SE at distances over 100 km. At 0914, pyroclastic- and mud-flow deposits were observed on the SE slopes of the volcano extending to distances of ~7-8 km.
At Ust-Kamchatsk (coastal settlements ~100 km ENE of Bezymianny), the thickness of orange-brown ash deposits on 10-11 May was ~1-2 mm. On 10 May, the airport at Ust-Kamchatsk was closed and the road and the dam in the area of the Bekesh River were destroyed by mud flows.
On 10 May seismic activity continued with 27 and 21 strong earthquakes recorded, respectively, during the subsequent two weeks. The number of thermal anomalies reported from satellite observations also increased to as many as 36 during the week ending 13 May.
By 27 May, activity had returned to levels typical of April (and earlier). On 21 May, the lava dome and pyroclastic-flow deposits were observed from a helicopter and from the ground. A part of the dome had been destroyed. Deposits were gas-rich, high-temperature juvenile pyroclastic flows in the central sector of the S slope of the volcano. The temperature of the main flow was ~ 300°C at a depth of 15 cm. According to satellite data, 1-20 pixel thermal anomalies were observed over the lava dome during the week.
Geologic Background. The high, isolated massif of Sheveluch volcano (also spelled Shiveluch) rises above the lowlands NNE of the Kliuchevskaya volcano group. The 1,300 km3 andesitic volcano is one of Kamchatka's largest and most active volcanic structures, with at least 60 large eruptions during the Holocene. The summit of roughly 65,000-year-old Stary Shiveluch is truncated by a broad 9-km-wide late-Pleistocene caldera breached to the south. Many lava domes occur on its outer flanks. The Molodoy Shiveluch lava dome complex was constructed during the Holocene within the large open caldera; Holocene lava dome extrusion also took place on the flanks of Stary Shiveluch. Widespread tephra layers from these eruptions have provided valuable time markers for dating volcanic events in Kamchatka. Frequent collapses of dome complexes, most recently in 1964, have produced debris avalanches whose deposits cover much of the floor of the breached caldera.
Information Contacts: Olga A. Girina, Kamchatka Volcanic Eruptions Response Team (KVERT), a cooperative program of the Institute of Volcanic Geology and Geochemistry, Far East Division, Russian Academy of Sciences, Piip Ave. 9, Petropavlovsk-Kamchatsky, 683006, Russia, the Kamchatka Experimental and Methodical Seismological Department (KEMSD), GS RAS (Russia), and the Alaska Volcano Observatory (USA); Alaska Volcano Observatory (AVO), a cooperative program of the U.S. Geological Survey, 4200 University Drive, Anchorage, AK 99508-4667, USA (URL: http://www.avo.alaska.edu/), the Geophysical Institute, University of Alaska, PO Box 757320, Fairbanks, AK 99775-7320, USA, and the Alaska Division of Geological and Geophysical Surveys, 794 University Ave., Suite 200, Fairbanks, AK 99709, USA.
Soufriere Hills (United Kingdom) — May 2004 Cite this Report
Soufriere Hills
United Kingdom
16.72°N, 62.18°W; summit elev. 915 m
All times are local (unless otherwise noted)
Seismicity generally low except for one dome-disrupting explosion
Although seismicity and volcanism were generally low during this reporting interval, mid-January to early June 2004, several episodes of elevated activity occurred. Weekly summaries for the early part of 2004 are presented in tables 54 and 55. The tables include a summary of seismicity, SO2 emissions, and forward-looking infrared (FLIR) measurements of the HCl/SO2 ratio.
Table 54. Summary of seismicity recorded at Soufrière Hills, 16 January to 4 June 2004. Courtesy of Montserrat Volcano Observatory.
| Date |
Activity Level |
Rockfall |
Long-period |
Hybrid |
Volcano-tectonic |
| 16 Jan-23 Jan 2004 |
Low |
1 |
38 |
9 |
1 |
| 23 Jan-30 Jan 2004 |
Very low |
8 |
1 |
10 |
1 |
| 30 Jan-06 Feb 2004 |
Low |
15 |
7 |
9 |
1 |
| 06 Feb-13 Feb 2004 |
Low |
-- |
-- |
3 |
1 |
| 13 Feb-20 Feb 2004 |
Low |
1 |
-- |
3 |
-- |
| 20 Feb-27 Feb 2004 |
Low |
3 |
2 |
5 |
-- |
| 27 Feb-05 Mar 2004 |
Increased |
4 |
1 |
38 |
-- |
| 05 Mar-12 Mar 2004 |
Low |
-- |
1 |
15 |
-- |
| 12 Mar-19 Mar 2004 |
Increased |
1 |
4 |
6 |
6 |
| 19 Mar-26 Mar 2004 |
Elevated |
-- |
4 |
7 |
-- |
| 26 Mar-02 Apr 2004 |
Moderate |
1 |
1 |
1 |
-- |
| 02 Apr-09 Apr 2004 |
Low to moderate |
5 |
1 |
-- |
-- |
| 09 Apr-16 Apr 2004 |
Low |
1 |
1 |
-- |
-- |
| 16 Apr-23 Apr 2004 |
Low |
-- |
5 |
14 |
-- |
| 23 Apr-30 Apr 2004 |
Low |
-- |
3 |
5 |
-- |
| 30 Apr-07 May 2004 |
Low |
-- |
-- |
1 |
-- |
| 07 May-14 May 2004 |
Low |
-- |
-- |
1 |
-- |
| 14 May-21 May 2004 |
Low |
-- |
-- |
1 |
-- |
| 21 May-28 May 2004 |
Low |
-- |
-- |
7 (and 44 'mixed') |
-- |
| 28 May-04 Jun 2004 |
Low |
-- |
-- |
4 (and 16 'mixed') |
-- |
On 18 January a low-amplitude swarm of long-period (LP) earthquakes comprised of 1000 separate events began and continued for ~36 hours. A similar swarm occurred on 30 January, lasting for ~30 hours. On 21 February a period of low-level tremor, including many small LP earthquakes, began at ~0600 and continued for ~36 hours.
A period of low-level tremor began on 2 March and continued until 1444 on 3 March when seismic activity increased significantly and an explosion and collapse event occurred. According to the Washington Volcanic Ash Advisory Center (VAAC), the ash clouds associated with the explosion reached an altitude of ~7 km. During 1445-1500 pyroclastic flows were observed in the Tar River, reaching the sea at the Tar River fan on at least two occasions. Seismicity returned to near background levels by 1525, but vigorous ash venting continued until ~0700 on 4 March. Visual observations reported that the explosion removed the small dome that had grown in the collapse scar in late July 2003, as well as a portion of the NW remnant of the 1995-1998 dome.
[A small amount of ash venting from the volcano's summit occurred on 2 May around 1815.] Episodes of tremor . . . continued until 7 May. During this period, tremor amplitude varied from low to moderate, and tremor duration varied from several days (continuous background) to a few seconds. Tremor peak frequencies were in the 1-10 Hz range. Subsequently, the activity level was low (table 54). The SO2 flux level dropped to 146 metric tons/day on 13 May (table 55), the lowest value recorded since before the collapse event of 12-15 July 2003. For the remainder of the report period, activity remained at a low level. The seismic network recorded several hybrid earthquakes but also a number of 'mixed' events, characterized by emergent onsets and relatively short durations (~30 seconds) with broad frequency spectra (1-10 Hz), peaking at ~10 Hz.
Table 55. Summary of SO2 emissions and the HCl/SO2 ratio recorded at SoufriPre Hills, 16 January to 4 June 2004. Courtesy of Montserrat Volcano Observatory.
| Date |
SO2 (metric tons/day) |
HCI / SO2 ratio |
| 16 Jan-23 Jan 2004 |
440 |
0.36-0.41 |
| 23 Jan-30 Jan 2004 |
500-700 |
0.33-0.37 |
| 30 Jan-06 Feb 2004 |
439-726 |
-- |
| 06 Feb-13 Feb 2004 |
350-450 |
0.32 |
| 13 Feb-20 Feb 2004 |
-- |
-- |
| 20 Feb-27 Feb 2004 |
496-920 |
-- |
| 27 Feb-05 Mar 2004 |
480-820 |
-- |
| 05 Mar-12 Mar 2004 |
330-1250 |
0.47 |
| 12 Mar-19 Mar 2004 |
470-755 |
-- |
| 19 Mar-26 Mar 2004 |
370-550 |
0.53-0.66 |
| 26 Mar-02 Apr 2004 |
440-480 |
-- |
| 02 Apr-09 Apr 2004 |
150-720 |
-- |
| 09 Apr-16 Apr 2004 |
540-870 |
-- |
| 16 Apr-23 Apr 2004 |
1030 |
-- |
| 23 Apr-30 Apr 2004 |
155-290 |
0.49 |
| 30 Apr-07 May 2004 |
200-672 |
0.30 |
| 07 May-14 May 2004 |
146-695 |
-- |
| 14 May-21 May 2004 |
182-428 |
-- |
| 21 May-28 May 2004 |
255-922 |
0.60 |
| 28 May-04 Jun 2004 |
179-496 |
-- |
Geologic Background. The complex, dominantly andesitic Soufrière Hills volcano occupies the southern half of the island of Montserrat. The summit area consists primarily of a series of lava domes emplaced along an ESE-trending zone. The volcano is flanked by Pleistocene complexes to the north and south. English's Crater, a 1-km-wide crater breached widely to the east by edifice collapse, was formed about 2000 years ago as a result of the youngest of several collapse events producing submarine debris-avalanche deposits. Block-and-ash flow and surge deposits associated with dome growth predominate in flank deposits, including those from an eruption that likely preceded the 1632 CE settlement of the island, allowing cultivation on recently devegetated land to near the summit. Non-eruptive seismic swarms occurred at 30-year intervals in the 20th century, but no historical eruptions were recorded until 1995. Long-term small-to-moderate ash eruptions beginning in that year were later accompanied by lava-dome growth and pyroclastic flows that forced evacuation of the southern half of the island and ultimately destroyed the capital city of Plymouth, causing major social and economic disruption.
Information Contacts: Gill Norton, Montserrat Volcano Observatory (MVO), Mongo Hill, Montserrat, West Indies (URL: http://www.mvo.ms/).
Tengger Caldera (Indonesia) — May 2004 Cite this Report
Tengger Caldera
Indonesia
7.942°S, 112.95°E; summit elev. 2329 m
All times are local (unless otherwise noted)
Mount Bromo's 8 June eruption killed two and ejected a 3-km-high ash plume
Reports of the Volcanological Survey of Indonesia (VSI) stated that Mount Bromo produced a phreatic eruption at 1526 on 8 June 2004. The eruption killed two people and injured several others. The Bromo cone is the youngest and most active volcano within the larger Tengger caldera complex. Bromo also resides within an inner caldera (Sandsea caldera).
The eruption, which vented at the crater, had a duration of ~20 minutes. Ash rose up to 3 km above the crater rim (figure 6) and was blown to the WNW and detected at the Mount (Gunung) Kelud observatory (~ 75 km away). Lapilli and ash spread out over a radius of ~ 300 m from the crater's center.
Bromo was closed to the public until further notice. Its hazard status was set to the elevated state of 'Alert Level III' (on a scale with a maximum of IV). Search and rescue teams were advised to stay away from the volcano until declaration of safe approach.
John Seach reported that many buildings in the nearby towns of Malang and Probolinggo were covered by a light coating of ash 2 hours after the eruption. The neighboring towns of Lumajang and Pasuruan were also affected by the eruption.
From 0600 on 9 June to 0600 on 10 June, visual observations disclosed a thin white and slightly red cloud about 25-50 m above the crater, moving W. Seismic records were dominated by tremor with peak-to-peak amplitudes ranging from ~ 1-4 mm. Seismometers also registered 123 emission earthquakes and 15 type-A volcanic earthquakes.
During 1800 on 10 June through 0600 on 11 June, the activity of Bromo was dominated by 'smoke emissions' of low-to-medium intensity reaching heights of ~ 25-100 m. Shallow volcanic earthquakes increased, and continuous tremor occurred with a peak-to-peak amplitude of 6.0 mm. Four volcanic earthquakes were detected within about 8-15 minutes, followed by tremor for 18 minutes, after which came 8 volcanic earthquakes. Despite all of the tremor and earthquakes, however, no explosion followed. When the weather was clear, VSI scientists could see white, thick 'smoke' emissions and smelled sulfur.
At 0819 on 14 June 2004, there was an ash explosion, accompanied by a plume that rose to 100 m. Pre-explosion spectrometer measurements suggested SO2 fluxes of 200 tons/day. During 13-14 June the seismic record contained emission and tectonic earthquakes, as well as a half hour of continuous tremor with a peak-to-peak amplitude of 6.0 mm. Deformation measurement using electronic distance meters (EDM) and global positioning systems (GPS) implied deflations of about 2-6 mm and 2-15 mm, respectively.
By 0630 on 15 June 2004, activity at Bromo had generally decreased, and the Alert Level was reduced to Level II. During that day emissions of white thin smoke rose ~ 25-150 m above the summit and the seismograph recorded 24 emission earthquakes and 1 tectonic earthquake. Deformation measured by EDM and GPS implied respective deflations of 1.0-5.0 mm and 0.2-6.2 mm.
Geologic Background. The 16-km-wide Tengger caldera is located at the northern end of a volcanic massif extending from Semeru volcano. The massive volcanic complex dates back to about 820,000 years ago and consists of five overlapping stratovolcanoes, each truncated by a caldera. Lava domes, pyroclastic cones, and a maar occupy the flanks of the massif. The Ngadisari caldera at the NE end of the complex formed about 150,000 years ago and is now drained through the Sapikerep valley. The most recent of the calderas is the 9 x 10 km wide Sandsea caldera at the SW end of the complex, which formed incrementally during the late Pleistocene and early Holocene. An overlapping cluster of post-caldera cones was constructed on the floor of the Sandsea caldera within the past several thousand years. The youngest of these is Bromo, one of Java's most active and most frequently visited volcanoes.
Information Contacts: Dali Ahmad, Volcanological Survey of Indonesia (VSI), Directorate of Volcanology and Geological Hazard Mitigation, Jalan Diponegoro No. 57, Bandung 40122, Indonesia (URL: http://www.vsi.esdm.go.id/); Heri Retnowate, Reuters; Derwin Pereira, The Straits Times; John Seach, P.O. Box 842, Southport BC 4215, Queensland, Australia (URL: http://www.volcanolive.com); Darwin Volcanic Ash Advisory Centre (VAAC), Bureau of Meteorology, Northern Territory Regional Office, PO Box 40050, Casuarina, NT 0811, Australia (URL: http://www.bom.gov.au/info/vaac/).