Recently Published Bulletin Reports
Kadovar (Papua New Guinea) An ash plume and weak thermal anomaly during May 2023
San Miguel (El Salvador) Small gas-and-ash explosions during March and May 2023
Ebeko (Russia) Continued explosions, ash plumes, and ashfall during October 2022-May 2023
Home Reef (Tonga) Discolored plumes continued during November 2022-April 2023
Semisopochnoi (United States) Occasional explosions, ash deposits, and gas-and-steam plumes during December 2022-May 2023
Ambae (Vanuatu) New lava flow, ash plumes, and sulfur dioxide plumes during February-May 2023
Ibu (Indonesia) Daily ash explosions continue, along with thermal anomalies in the crater, October 2022-May 2023
Dukono (Indonesia) Continuing ash emissions, SO2 plumes, and thermal signals during October 2022-May 2023
Sabancaya (Peru) Explosions, gas-and-ash plumes, and thermal activity persist during November 2022-April 2023
Sheveluch (Russia) Significant explosions destroyed part of the lava-dome complex during April 2023
Bezymianny (Russia) Explosions, ash plumes, lava flows, and avalanches during November 2022-April 2023
Chikurachki (Russia) New explosive eruption during late January-early February 2023
Kadovar (Papua New Guinea) — June 2023  Cite this Report
Kadovar
Papua New Guinea
3.608°S, 144.588°E; summit elev. 365 m
All times are local (unless otherwise noted)
An ash plume and weak thermal anomaly during May 2023
Kadovar is a 2-km-wide island that is the emergent summit of a Bismarck Sea stratovolcano. It lies off the coast of New Guinea, about 25 km N of the mouth of the Sepik River. Prior to an eruption that began in 2018, a lava dome formed the high point of the volcano, filling an arcuate landslide scarp open to the S. Submarine debris-avalanche deposits occur to the S of the island. The current eruption began in January 2018 and has comprised lava effusion from vents at the summit and at the E coast; more recent activity has consisted of ash plumes, weak thermal activity, and gas-and-steam plumes (BGVN 48:02). This report covers activity during February through May 2023 using information from the Darwin Volcanic Ash Advisory Center (VAAC) and satellite data.
Activity during the reporting period was relatively low and mainly consisted of white gas-and-steam plumes that were visible in natural color satellite images on clear weather days (figure 67). According to a Darwin VAAC report, at 2040 on 6 May an ash plume rose to 4.6 km altitude and drifted W; by 2300 the plume had dissipated. MODIS satellite instruments using the MODVOLC thermal algorithm detected a single thermal hotspot on the SE side of the island on 7 May. Weak thermal activity was also detected in a satellite image on the E side of the island on 14 May, accompanied by a white gas-and-steam plume that drifted SE (figure 68).
Geologic Background. The 2-km-wide island of Kadovar is the emergent summit of a Bismarck Sea stratovolcano of Holocene age. It is part of the Schouten Islands, and lies off the coast of New Guinea, about 25 km N of the mouth of the Sepik River. Prior to an eruption that began in 2018, a lava dome formed the high point of the andesitic volcano, filling an arcuate landslide scarp open to the south; submarine debris-avalanche deposits occur in that direction. Thick lava flows with columnar jointing forms low cliffs along the coast. The youthful island lacks fringing or offshore reefs. A period of heightened thermal phenomena took place in 1976. An eruption began in January 2018 that included lava effusion from vents at the summit and at the E coast.
Information Contacts: Darwin Volcanic Ash Advisory Centre (VAAC), Bureau of Meteorology, Northern Territory Regional Office, PO Box 40050, Casuarina, NT 0811, Australia (URL: http://www.bom.gov.au/info/vaac/); Hawai'i Institute of Geophysics and Planetology (HIGP) - MODVOLC Thermal Alerts System, School of Ocean and Earth Science and Technology (SOEST), Univ. of Hawai'i, 2525 Correa Road, Honolulu, HI 96822, USA (URL: http://modis.higp.hawaii.edu/); Copernicus Browser, Copernicus Data Space Ecosystem, European Space Agency (URL: https://dataspace.copernicus.eu/browser/).
San Miguel (El Salvador) — June 2023 Cite this Report
San Miguel
El Salvador
13.434°N, 88.269°W; summit elev. 2130 m
All times are local (unless otherwise noted)
Small gas-and-ash explosions during March and May 2023
San Miguel in El Salvador is a broad, deep crater complex that has been frequently modified by eruptions recorded since the early 16th century and consists of the summit known locally as Chaparrastique. Flank eruptions have produced lava flows that extended to the N, NE, and SE during the 17-19th centuries. The most recent activity has consisted of minor ash eruptions from the summit crater. The current eruption period began in November 2022 and has been characterized by frequent phreatic explosions, gas-and-ash emissions, and sulfur dioxide plumes (BGVN 47:12). This report describes small gas-and-ash explosions during December 2022 through May 2023 based on special reports from the Ministero de Medio Ambiente y Recursos Naturales (MARN).
Activity has been relatively low since the last recorded explosions on 29 November 2022. Seismicity recorded by the San Miguel Volcano Station (VSM) located on the N flank at 1.7 km elevation had decreased by 7 December. Sulfur dioxide gas measurements taken with DOAS (Differential Optical Absorption Spectroscopy) mobile equipment were below typical previously recorded values: 300 tons per day (t/d). During December, small explosions were recorded by the seismic network and manifested as gas-and-steam emissions.
Gas-and-ash explosions in the crater occurred during January 2023, which were recorded by the seismic network. Sulfur dioxide values remained low, between 300-400 t/d through 10 March. At 0817 on 14 January a gas-and-ash emission was visible in webcam images, rising just above the crater rim. Some mornings during February, small gas-and-steam plumes were visible in the crater. On 7 March at 2252 MARN noted an increase in degassing from the central crater; gas emissions were constantly observed through the early morning hours on 8 March. During the early morning of 8 March through the afternoon on 9 March, 12 emissions were registered, some accompanied by ash. The last gas-and-ash emission was recorded at 1210 on 9 March; very fine ashfall was reported in El Tránsito (10 km S), La Morita (6 km W), and La Piedrita (3 km W). The smell of sulfur was reported in Piedra Azul (5 km SW). On 16 March MARN reported that gas-and-steam emissions decreased.
Low degassing and very low seismicity were reported during April; no explosions have been detected between 9 March and 27 May. The sulfur dioxide emissions remained between 350-400 t/d; during 13-20 April sulfur dioxide values fluctuated between 30-300 t/d. Activity remained low through most of May; on 23 May seismicity increased. An explosion was detected at 1647 on 27 May generated a gas-and-ash plume that rose 700 m high (figure 32); a decrease in seismicity and gas emissions followed. The DOAS station installed on the W flank recorded sulfur dioxide values that reached 400 t/d on 27 May; subsequent measurements showed a decrease to 268 t/d on 28 May and 100 t/d on 29 May.
Geologic Background. The symmetrical cone of San Miguel, one of the most active volcanoes in El Salvador, rises from near sea level to form one of the country's most prominent landmarks. A broad, deep, crater complex that has been frequently modified by eruptions recorded since the early 16th century caps the truncated unvegetated summit, also known locally as Chaparrastique. Flanks eruptions of the basaltic-andesitic volcano have produced many lava flows, including several during the 17th-19th centuries that extended to the N, NE, and SE. The SE-flank flows are the largest and form broad, sparsely vegetated lava fields crossed by highways and a railroad skirting the base of the volcano. Flank vent locations have migrated higher on the edifice during historical time, and the most recent activity has consisted of minor ash eruptions from the summit crater.
Information Contacts: Ministero de Medio Ambiente y Recursos Naturales (MARN), Km. 5½ Carretera a Nueva San Salvador, Avenida las Mercedes, San Salvador, El Salvador (URL: http://www.snet.gob.sv/ver/vulcanologia).
Ebeko
Russia
50.686°N, 156.014°E; summit elev. 1103 m
All times are local (unless otherwise noted)
Continued explosions, ash plumes, and ashfall during October 2022-May 2023
Ebeko, located on the N end of Paramushir Island in the Kuril Islands, consists of three summit craters along a SSW-NNE line at the northern end of a complex of five volcanic cones. Eruptions date back to the late 18th century and have been characterized as small-to-moderate explosions from the summit crater, accompanied by intense fumarolic activity. The current eruption period began in June 2022 and has recently consisted of frequent explosions, ash plumes, and thermal activity (BGVN 47:10). This report covers similar activity during October 2022 through May 2023, based on information from the Kamchatka Volcanic Eruptions Response Team (KVERT) and satellite data.
Activity during October consisted of explosive activity, ash plumes, and occasional thermal anomalies. Visual data by volcanologists from Severo-Kurilsk showed explosions producing ash clouds up to 2.1-3 km altitude which drifted E, N, NE, and SE during 1-8, 10, 16, and 18 October. KVERT issued several Volcano Observatory Notices for Aviation (VONA) on 7, 13-15, and 27 October 2022, stating that explosions generated ash plumes that rose to 2.3-4 km altitude and drifted 5 km E, NE, and SE. Ashfall was reported in Severo-Kurilsk (Paramushir Island, about 7 km E) on 7 and 13 October. Satellite data showed a thermal anomaly over the volcano on 15-16 October. Visual data showed ash plumes rising to 2.5-3.6 km altitude on 22, 25-29, and 31 October and moving NE due to constant explosions.
Similar activity continued during November, with explosions, ash plumes, and ashfall occurring. KVERT issued VONAs on 1-2, 4, 6-7, 9, 13, and 16 November that reported explosions and resulting ash plumes that rose to 1.7-3.6 km altitude and drifted 3-5 km SE, ESE, E, and NE. On 1 November ash plumes extended as far as 110 km SE. On 5, 8, 12, and 24-25 November explosions and ash plumes rose to 2-3.1 km altitude and drifted N and E. Ashfall was observed in Severo-Kurilsk on 7 and 16 November. A thermal anomaly was visible during 1-4, 16, and 20 November. Explosions during 26 November rose as high as 2.7 km altitude and drifted NE (figure 45).
Explosions and ash plumes continued to occur in December. During 1-2 and 4 December volcanologists from Severo-Kurilsk observed explosions that sent ash to 1.9-2.5 km altitude and drifted NE and SE (figure 46). VONAs were issued on 5, 9, and 16 December reporting that explosions generated ash plumes rising to 1.9 km, 2.6 km, and 2.4 km altitude and drifted 5 km SE, E, and NE, respectively. A thermal anomaly was visible in satellite imagery on 16 December. On 18 and 27-28 December explosions produced ash plumes that rose to 2.5 km altitude and drifted NE and SE. On 31 December an ash plume rose to 2 km altitude and drifted NE.
Explosions continued during January 2023, based on visual observations by volcanologists from Severo-Kurilsk. During 1-7 January explosions generated ash plumes that rose to 4 km altitude and drifted NE, E, W, and SE. According to VONAs issued by KVERT on 2, 4, 10, and 23 January, explosions produced ash plumes that rose to 2-4 km altitude and drifted 5 km N, NE, E, and ENE; the ash plume that rose to 4 km altitude occurred on 10 January (figure 47). Satellite data showed a thermal anomaly during 3-4, 10, 13, 16, 21, 22, and 31 January. KVERT reported that an ash cloud on 4 January moved 12 km NE. On 6 and 9-11 January explosions sent ash plumes to 4.5 km altitude and drifted W and ESE. On 13 January an ash plume rose to 3 km altitude and drifted SE. During 20-24 January ash plumes from explosions rose to 3.7 km altitude and drifted SE, N, and NE. On 21 January the ash plume drifted as far as 40 km NE. During 28-29 and 31 January and 1 February ash plumes rose to 4 km altitude and drifted NE.
During February, explosions, ash plumes, and ashfall were reported. During 1, 4-5 and 7-8 February explosions generated ash plumes that rose to 4.5 km altitude and drifted E and NE; ashfall was observed on 5 and 8 February. On 6 February an explosion produced an ash plume that rose to 3 km altitude and drifted 7 km E, causing ashfall in Severo-Kurilsk. A thermal anomaly was visible in satellite data on 8, 9, 13, and 21 February. Explosions on 9 and 12-13 February produced ash plumes that rose to 4 km altitude and drifted E and NE; the ash cloud on 12 February extended as far as 45 km E. On 22 February explosions sent ash to 3 km altitude that drifted E. During 24 and 26-27 February ash plumes rose to 4 km altitude and drifted E. On 28 February an explosion sent ash to 2.5-3 km altitude and drifted 5 km E; ashfall was observed in Severo-Kurilsk.
Activity continued during March; visual observations showed that explosions generated ash plumes that rose to 3.6 km altitude on 3, 5-7, and 9-12 March and drifted E, NE, and NW. Thermal anomalies were visible on 10, 13, and 29-30 March in satellite imagery. On 18, 21-23, 26, and 29-30 March explosions produced ash plumes that rose to 2.8 km altitude and drifted NE and E; the ash plumes during 22-23 March extended up to 76 km E. A VONA issued on 21 March reported an explosion that produced an ash plume that rose to 2.8 km altitude and drifted 5 km E. Another VONA issued on 23 March reported that satellite data showed an ash plume rising to 3 km altitude and drifted 14 km E.
Explosions during April continued to generate ash plumes. On 1 and 4 April an ash plume rose to 2.8-3.5 km altitude and drifted SE and NE. A thermal anomaly was visible in satellite imagery during 1-6 April. Satellite data showed ash plumes and clouds rising to 2-3 km altitude and drifting up to 12 km SW and E on 3 and 6 April (figure 48). KVERT issued VONAs on 3, 5, 14, 16 April describing explosions that produced ash plumes rising to 3 km, 3.5 km, 3.5 km, and 3 km altitude and drifting 5 km S, 5 km NE and SE, 72 km NNE, and 5 km NE, respectively. According to satellite data, the resulting ash cloud from the explosion on 14 April was 25 x 7 km in size and drifted 72-104 km NNE during 14-15 April. According to visual data by volcanologists from Severo-Kurilsk explosions sent ash up to 3.5 km altitude that drifted NE and E during 15-16, 22, 25-26, and 29 April.
The explosive eruption continued during May. Explosions during 3-4, 6-7, and 9-10 May generated ash plumes that rose to 4 km altitude and drifted SW and E. Satellite data showed a thermal anomaly on 3, 9, 13-14, and 24 May. During 12-16, 23-25, and 27-28 May ash plumes rose to 3.5 km altitude and drifted in different directions due to explosions. Two VONA notices were issued on 16 and 25 May, describing explosions that generated ash plumes rising to 3 km and 3.5 km altitude, respectively and extending 5 km E. The ash cloud on 25 May drifted 75 km SE.
Thermal activity in the summit crater, occasionally accompanied by ash plumes and ash deposits on the SE and E flanks due to frequent explosions, were visible in infrared and true color satellite images (figure 49).
Geologic Background. The flat-topped summit of the central cone of Ebeko volcano, one of the most active in the Kuril Islands, occupies the northern end of Paramushir Island. Three summit craters located along a SSW-NNE line form Ebeko volcano proper, at the northern end of a complex of five volcanic cones. Blocky lava flows extend west from Ebeko and SE from the neighboring Nezametnyi cone. The eastern part of the southern crater contains strong solfataras and a large boiling spring. The central crater is filled by a lake about 20 m deep whose shores are lined with steaming solfataras; the northern crater lies across a narrow, low barrier from the central crater and contains a small, cold crescentic lake. Historical activity, recorded since the late-18th century, has been restricted to small-to-moderate explosive eruptions from the summit craters. Intense fumarolic activity occurs in the summit craters, on the outer flanks of the cone, and in lateral explosion craters.
Information Contacts: Kamchatka Volcanic Eruptions Response Team (KVERT), Far Eastern Branch, Russian Academy of Sciences, 9 Piip Blvd., Petropavlovsk-Kamchatsky, 683006, Russia (URL: http://www.kscnet.ru/ivs/kvert/); MIROVA (Middle InfraRed Observation of Volcanic Activity), a collaborative project between the Universities of Turin and Florence (Italy) supported by the Centre for Volcanic Risk of the Italian Civil Protection Department (URL: http://www.mirovaweb.it/); Copernicus Browser, Copernicus Data Space Ecosystem, European Space Agency (URL: https://dataspace.copernicus.eu/browser/).
Home Reef
Tonga
18.992°S, 174.775°W; summit elev. -10 m
All times are local (unless otherwise noted)
Discolored plumes continued during November 2022-April 2023
Home Reef is a submarine volcano located in the central Tonga islands between Lateiki (Metis Shoal) and Late Island. The first recorded eruption occurred in the mid-19th century, when an ephemeral island formed. An eruption in 1984 produced a 12-km-high eruption plume, a large volume of floating pumice, and an ephemeral island 500 x 1,500 m wide, with cliffs 30-50 m high that enclosed a water-filled crater. Another island-forming eruption in 2006 produced widespread pumice rafts that drifted as far as Australia; by 2008 the island had eroded below sea level. The previous eruption occurred during October 2022 and was characterized by a new island-forming eruption, lava effusion, ash plumes, discolored water, and gas-and-steam plumes (BGVN 47:11). This report covers discolored water plumes during November 2022 through April 2023 using satellite data.
Discolored plumes continued during the reporting period and were observed in true color satellite images on clear weather days. Satellite images show light green-yellow discolored water extending W on 8 and 28 November 2022 (figure 31), and SW on 18 November. Light green-yellow plumes extended W on 3 December, S on 13 December, SW on 18 December, and W and S on 23 December (figure 31). On 12 January 2023 discolored green-yellow plumes extended to the NE, E, SE, and N. The plume moved SE on 17 January and NW on 22 January. Faint discolored water in February was visible moving NE on 1 February. A discolored plume extended NW on 8 and 28 March and NW on 13 March (figure 31). During April, clear weather showed green-blue discolored plumes moving S on 2 April, W on 7 April, and NE and S on 12 April. A strong green-yellow discolored plume extended E and NE on 22 April for several kilometers (figure 31).
Geologic Background. Home Reef, a submarine volcano midway between Metis Shoal and Late Island in the central Tonga islands, was first reported active in the mid-19th century, when an ephemeral island formed. An eruption in 1984 produced a 12-km-high eruption plume, large amounts of floating pumice, and an ephemeral 500 x 1,500 m island, with cliffs 30-50 m high that enclosed a water-filled crater. In 2006 an island-forming eruption produced widespread dacitic pumice rafts that drifted as far as Australia. Another island was built during a September-October 2022 eruption.
Information Contacts: Copernicus Browser, Copernicus Data Space Ecosystem, European Space Agency (URL: https://dataspace.copernicus.eu/browser/).
Semisopochnoi (United States) — June 2023 Cite this Report
Semisopochnoi
United States
51.93°N, 179.58°E; summit elev. 1221 m
All times are local (unless otherwise noted)
Occasional explosions, ash deposits, and gas-and-steam plumes during December 2022-May 2023
Semisopochnoi is located in the western Aleutians, is 20-km-wide at sea level, and contains an 8-km-wide caldera. The three-peaked Mount Young (formerly Cerberus) was constructed within the caldera during the Holocene. Each of these peaks contains a summit crater; the lava flows on the N flank appear younger than those on the S side. The current eruption period began in early February 2021 and has more recently consisted of intermittent explosions and ash emissions (BGVN 47:12). This report updates activity during December 2022 through May 2023 using daily, weekly, and special reports from the Alaska Volcano Observatory (AVO). AVO monitors the volcano using local seismic and infrasound sensors, satellite data, web cameras, and remote infrasound and lightning networks.
Activity during most of December 2022 was relatively quiet; according to AVO no eruptive or explosive activity was observed since 7 November 2022. Intermittent tremor and occasional small earthquakes were observed in geophysical data. Continuous gas-and-steam emissions were observed from the N crater of Mount Young in webcam images on clear weather days (figure 25). On 24 December, there was a slight increase in earthquake activity and several small possible explosion signals were detected in infrasound data. Eruptive activity resumed on 27 December at the N crater of Mount Young; AVO issued a Volcano Activity Notice (VAN) that reported minor ash deposits on the flanks of Mount Young that extended as far as 1 km from the vent, according to webcam images taken during 27-28 December (figure 26). No ash plumes were observed in webcam or satellite imagery, but a persistent gas-and-steam plume that might have contained some ash rose to 1.5 km altitude. As a result, AVO raised the Aviation Color Code (ACC) to Orange (the second highest level on a four-color scale) and the Volcano Alert Level (VAL) to Watch (the second highest level on a four-level scale). Possible explosions were detected during 21 December 2022 through 1 January 2023 and seismic tremor was recorded during 30-31 December.
During January 2023 eruptive activity continued at the active N crater of Mount Young. Minor ash deposits were observed on the flanks, extending about 2 km SSW, based on webcam images from 1 and 3 January. A possible explosion occurred during 1-2 January based on elevated seismicity recorded on local seismometers and an infrasound signal recorded minutes later by an array at Adak. Though no ash plumes were observed in webcam or satellite imagery, a persistent gas-and-steam plume rose to 1.5 km altitude that might have carried minor traces of ash. Ash deposits were accompanied by periods of elevated seismicity and infrasound signals from the local geophysical network, which AVO reported were likely due to weak explosive activity. Low-level explosive activity was also detected during 2-3 January, with minor gas-and-steam emissions and a new ash deposit that was visible in webcam images. Low-level explosive activity was detected in geophysical data during 4-5 January, with elevated seismicity and infrasound signals observed on local stations. Volcanic tremor was detected during 7-9 January and very weak explosive activity was detected in seismic and infrasound data on 9 January. Weak seismic and infrasound signals were recorded on 17 January, which indicated minor explosive activity, but no ash emissions were observed in clear webcam images; a gas-and-steam plume continued to rise to 1.5 km altitude. During 29-30 January, ash deposits near the summit were observed on fresh snow, according to webcam images.
The active N cone at Mount Young continued to produce a gas-and-steam plume during February, but no ash emissions or explosive events were detected. Seismicity remained elevated with faint tremor during early February. Gas-and-steam emissions from the N crater were observed in clear webcam images on 11-13 and 16 February; no explosive activity was detected in seismic, infrasound, or satellite data. Seismicity has also decreased, with no significant seismic tremor observed since 25 January. Therefore, the ACC was lowered to Yellow (the second lowest level on a four-color scale) and the VAL was lowered to Advisory (the second lowest level on a four-color scale) on 22 February.
Gas-and-steam emissions persisted during March from the N cone of Mount Young, based on clear webcam images. A few brief episodes of weak tremor were detected in seismic data, although seismicity decreased over the month. A gas-and-steam plume detected in satellite data extended 150 km on 18 March. Low-level ash emissions from the N cone at Mount Young were observed in several webcam images during 18-19 March, in addition to small explosions and volcanic tremor. The ACC was raised to Orange and the VAL increased to Watch on 19 March. A small explosion was detected in seismic and infrasound data on 21 March.
Low-level unrest continued during April, although cloudy weather often obscured views of the summit; periods of seismic tremor and local earthquakes were recorded. During 3-4 April a gas-and-steam plume was visible traveling more than 200 km overnight; no ash was evident in the plume, according to AVO. A gas-and-steam plume was observed during 4-6 April that extended 400 km but did not seem to contain ash. Small explosions were detected in seismic and infrasound data on 5 April. Occasional clear webcam images showed continuing gas-and-steam emissions rose from Mount Young, but no ash deposits were observed on the snow. On 19 April small explosions and tremor were detected in seismic and infrasound data. A period of seismic tremor was detected during 22-25 April, with possible weak explosions on 25 April. Ash deposits were visible near the crater rim, but it was unclear if these deposits were recent or due to older deposits.
Occasional small earthquakes were recorded during May, but there were no signs of explosive activity seen in geophysical data. Gas-and-steam emissions continued from the N crater of Mount Young, based on webcam images, and seismicity remained slightly elevated. A new, light ash deposit was visible during the morning of 5 May on fresh snow on the NW flank of Mount Young. During 10 May periods of volcanic tremor were observed. The ACC was lowered to Yellow and the VAL to Advisory on 17 May due to no additional evidence of activity.
Geologic Background. Semisopochnoi, the largest subaerial volcano of the western Aleutians, is 20 km wide at sea level and contains an 8-km-wide caldera. It formed as a result of collapse of a low-angle, dominantly basaltic volcano following the eruption of a large volume of dacitic pumice. The high point of the island is Anvil Peak, a double-peaked late-Pleistocene cone that forms much of the island's northern part. The three-peaked Mount Cerberus (renamed Mount Young in 2023) was constructed within the caldera during the Holocene. Each of the peaks contains a summit crater; lava flows on the N flank appear younger than those on the south side. Other post-caldera volcanoes include the symmetrical Sugarloaf Peak SSE of the caldera and Lakeshore Cone, a small cinder cone at the edge of Fenner Lake in the NE part of the caldera. Most documented eruptions have originated from Young, although Coats (1950) considered that both Sugarloaf and Lakeshore Cone could have been recently active.
Information Contacts: Alaska Volcano Observatory (AVO), a cooperative program of a) U.S. Geological Survey, 4200 University Drive, Anchorage, AK 99508-4667 USA (URL: https://avo.alaska.edu/), b) Geophysical Institute, University of Alaska, PO Box 757320, Fairbanks, AK 99775-7320, USA, and c) Alaska Division of Geological & Geophysical Surveys, 794 University Ave., Suite 200, Fairbanks, AK 99709, USA (URL: http://dggs.alaska.gov/).
Ambae
Vanuatu
15.389°S, 167.835°E; summit elev. 1496 m
All times are local (unless otherwise noted)
New lava flow, ash plumes, and sulfur dioxide plumes during February-May 2023
Ambae, also known as Aoba, is a large basaltic shield volcano in Vanuatu. A broad pyroclastic cone containing three crater lakes (Manaro Ngoru, Voui, and Manaro Lakua) is located at the summit within the youngest of at least two nested calderas. Periodic phreatic and pyroclastic explosions have been reported since the 16th century. A large eruption more than 400 years ago resulted in a volcanic cone within the summit crater that is now filled by Lake Voui; the similarly sized Lake Manaro fills the western third of the caldera. The previous eruption ended in August 2022 that was characterized by gas-and-steam and ash emissions and explosions of wet tephra (BGVN 47:10). This report covers a new eruption during February through May 2023 that consisted of a new lava flow, ash plumes, and sulfur dioxide emissions, using information from the Vanuatu Meteorology and Geo-Hazards Department (VMGD) and satellite data.
During the reporting period, the Alert Level remained at a 2 (on a scale of 0-5), which has been in place since December 2021. Activity during October 2022 through March 2023 remained relatively low and mostly consisted of gas-and-steam emissions in Lake Voui. VMGD reported that at 1300 on 15 November a satellite image captured a strong amount of sulfur dioxide rising above the volcano (figure 99), and that seismicity slightly increased. The southern and northern part of the island reported a strong sulfur dioxide smell and heard explosions. On 20 February 2023 a gas-and-ash plume rose 1.3 km above the summit and drifted SSW, according to a webcam image (figure 100). Gas-and-steam and possibly ash emissions continued on 23 February and volcanic earthquakes were recorded by the seismic network.
During April, volcanic earthquakes and gas-and-steam and ash emissions were reported from the cone in Lake Voui. VMGD reported that activity increased during 5-7 April; high gas-and-steam and ash plumes were visible, accompanied by nighttime incandescence. According to a Wellington VAAC report, a low-level ash plume rose as high as 2.5 km above the summit and drifted W and SW on 5 April, based on satellite imagery. Reports in Saratamata stated that a dark ash plume drifted to the WSW, but no loud explosion was heard. Webcam images from 2100 showed incandescence above the crater and reflected in the clouds. According to an aerial survey, field observations, and satellite data, water was no longer present in the lake. A lava flow was reported effusing from the vent and traveling N into the dry Lake Voui, which lasted three days. The next morning at 0745 on 6 April a gas-and-steam and ash plume rose 5.4 km above the summit and drifted ESE, based on information from VMGD (figure 101). The Wellington VAAC also reported that light ashfall was observed on the island. Intermittent gas-and-steam and ash emissions were visible on 7 April, some of which rose to an estimated 3 km above the summit and drifted E. Webcam images during 0107-0730 on 7 April showed continuing ash emissions. A gas-and-steam and ash plume rose 695 m above the summit crater at 0730 on 19 April and drifted ESE, based on a webcam image (figure 102).
According to visual and infrared satellite data, water was visible in Lake Voui as late as 24 March 2023 (figure 103). The vent in the caldera showed a gas-and-steam plume drifted SE. On 3 April thermal activity was first detected, accompanied by a gas-and-ash plume that drifted W (figure 103). The lava flow moved N within the dry lake and was shown cooling by 8 April. By 23 April much of the water in the lake had returned. Occasional sulfur dioxide plumes were detected by the TROPOMI instrument on the Sentinel-5P satellite that exceeded 2 Dobson Units (DU) and drifted in different directions (figure 104).
Geologic Background. The island of Ambae, also known as Aoba, is a massive 2,500 km3 basaltic shield that is the most voluminous volcano of the New Hebrides archipelago. A pronounced NE-SW-trending rift zone with numerous scoria cones gives the 16 x 38 km island an elongated form. A broad pyroclastic cone containing three crater lakes (Manaro Ngoru, Voui, and Manaro Lakua) is located at the summit within the youngest of at least two nested calderas, the largest of which is 6 km in diameter. That large central edifice is also called Manaro Voui or Lombenben volcano. Post-caldera explosive eruptions formed the summit craters about 360 years ago. A tuff cone was constructed within Lake Voui (or Vui) about 60 years later. The latest known flank eruption, about 300 years ago, destroyed the population of the Nduindui area near the western coast.
Information Contacts: Geo-Hazards Division, Vanuatu Meteorology and Geo-Hazards Department (VMGD), Ministry of Climate Change Adaptation, Meteorology, Geo-Hazards, Energy, Environment and Disaster Management, Private Mail Bag 9054, Lini Highway, Port Vila, Vanuatu (URL: http://www.vmgd.gov.vu/, https://www.facebook.com/VanuatuGeohazardsObservatory/); Wellington Volcanic Ash Advisory Centre (VAAC), Meteorological Service of New Zealand Ltd (MetService), PO Box 722, Wellington, New Zealand (URL: http://www.metservice.com/vaac/, http://www.ssd.noaa.gov/VAAC/OTH/NZ/messages.html); MIROVA (Middle InfraRed Observation of Volcanic Activity), a collaborative project between the Universities of Turin and Florence (Italy) supported by the Centre for Volcanic Risk of the Italian Civil Protection Department (URL: http://www.mirovaweb.it/); Global Sulfur Dioxide Monitoring Page, Atmospheric Chemistry and Dynamics Laboratory, NASA Goddard Space Flight Center (NASA/GSFC), 8800 Greenbelt Road, Goddard, Maryland, USA (URL: https://so2.gsfc.nasa.gov/); Copernicus Browser, Copernicus Data Space Ecosystem, European Space Agency (URL: https://dataspace.copernicus.eu/browser/).
Ibu
Indonesia
1.488°N, 127.63°E; summit elev. 1325 m
All times are local (unless otherwise noted)
Daily ash explosions continue, along with thermal anomalies in the crater, October 2022-May 2023
Persistent eruptive activity since April 2008 at Ibu, a stratovolcano on Indonesian’s Halmahera Island, has consisted of daily explosive ash emissions and plumes, along with observations of thermal anomalies (BGVN 47:04). The current eruption continued during October 2022-May 2023, described below, based on advisories issued by the Pusat Vulkanologi dan Mitigasi Bencana Geologi (PVMBG, also known as Indonesian Center for Volcanology and Geological Hazard Mitigation, CVGHM), daily reports by MAGMA Indonesia (a PVMBG platform), and the Darwin Volcanic Ash Advisory Centre (VAAC), and various satellite data. The Alert Level during the reporting period remained at 2 (on a scale of 1-4), except raised briefly to 3 on 27 May, and the public was warned to stay at least 2 km away from the active crater and 3.5 km away on the N side of the volcano.
According to MAGMA Indonesia, during October 2022-May 2023, daily gray-and-white ash plumes of variable densities rose 200-1,000 m above the summit and drifted in multiple directions. On 30 October and 11 November, plumes rose a maximum of 2 km and 1.5 km above the summit, respectively (figures 42 and 43). According to the Darwin VAAC, discrete ash emissions on 13 November rose to 2.1 km altitude, or 800 m above the summit, and drifted W, and multiple ash emissions on 15 November rose 1.4 km above the summit and drifted NE. Occasional larger ash explosions through May 2023 prompted PVMBG to issue Volcano Observatory Notice for Aviation (VONA) alerts (table 6); the Aviation Color Code remained at Orange throughout this period.
Table 6. Volcano Observatory Notice for Aviation (VONA) ash plume alerts for Ibu issued by PVMBG during October 2022-May 2023. Maximum height above the summit was estimated by a ground observer. VONAs in January-May 2023 all described the ash plumes as dense.
| Date |
Time (local) |
Max height above summit |
Direction |
| 17 Oct 2022 |
0858 |
800 m |
SW |
| 18 Oct 2022 |
1425 |
800 m |
S |
| 19 Oct 2022 |
2017 |
600 m |
SW |
| 21 Oct 2022 |
0916 |
800 m |
NW |
| 16 Jan 2023 |
1959 |
600 m |
NE |
| 22 Jan 2023 |
0942 |
1,000 m |
E |
| 29 Jan 2023 |
2138 |
1,000 m |
E |
| 10 May 2023 |
0940 |
800 m |
NW |
| 10 May 2023 |
2035 |
600 m |
E |
| 21 May 2023 |
2021 |
600 m |
W |
| 21 May 2023 |
2140 |
1,000 m |
W |
| 29 May 2023 |
1342 |
800 m |
N |
| 31 May 2023 |
1011 |
1,000 m |
SW |
Sentinel-2 L1C satellite images throughout the reporting period show two, sometimes three persistent thermal anomalies in the summit crater, with the most prominent hotspot from the top of a cone within the crater. Clear views were more common during March-April 2023, when a vent and lava flows on the NE flank of the intra-crater cone could be distinguished (figure 44). White-to-grayish emissions were also observed during brief periods when weather clouds allowed clear views.
The MIROVA space-based volcano hotspot detection system recorded almost daily thermal anomalies throughout the reporting period, though cloud cover often interfered with detections. Data from imaging spectroradiometers aboard NASA’s Aqua and Terra satellites and processed using the MODVOLC algorithm (MODIS-MODVOLC) recorded hotspots on one day during October 2022 and December 2022, two days in April 2023, three days in November 2022 and May 2023, and four days in March 2023.
Geologic Background. The truncated summit of Gunung Ibu stratovolcano along the NW coast of Halmahera Island has large nested summit craters. The inner crater, 1 km wide and 400 m deep, has contained several small crater lakes. The 1.2-km-wide outer crater is breached on the N, creating a steep-walled valley. A large cone grew ENE of the summit, and a smaller one to the WSW has fed a lava flow down the W flank. A group of maars is located below the N and W flanks. The first observed and recorded eruption was a small explosion from the summit crater in 1911. Eruptive activity began again in December 1998, producing a lava dome that eventually covered much of the floor of the inner summit crater along with ongoing explosive ash emissions.
Information Contacts: Pusat Vulkanologi dan Mitigasi Bencana Geologi (PVMBG, also known as Indonesian Center for Volcanology and Geological Hazard Mitigation, CVGHM), Jalan Diponegoro 57, Bandung 40122, Indonesia (URL: http://www.vsi.esdm.go.id/); MAGMA Indonesia (Multiplatform Application for Geohazard Mitigation and Assessment in Indonesia), Kementerian Energi dan Sumber Daya Mineral (URL: https://magma.esdm.go.id/v1); Copernicus Browser, Copernicus Data Space Ecosystem, European Space Agency (URL: https://dataspace.copernicus.eu/browser/); MIROVA (Middle InfraRed Observation of Volcanic Activity), a collaborative project between the Universities of Turin and Florence (Italy) supported by the Centre for Volcanic Risk of the Italian Civil Protection Department (URL: http://www.mirovaweb.it/); Hawai'i Institute of Geophysics and Planetology (HIGP) - MODVOLC Thermal Alerts System, School of Ocean and Earth Science and Technology (SOEST), Univ. of Hawai'i, 2525 Correa Road, Honolulu, HI 96822, USA (URL: http://modis.higp.hawaii.edu/).
Dukono
Indonesia
1.6992°N, 127.8783°E; summit elev. 1273 m
All times are local (unless otherwise noted)
Continuing ash emissions, SO2 plumes, and thermal signals during October 2022-May 2023
Dukono, a remote volcano on Indonesia’s Halmahera Island, has been erupting continuously since 1933, with frequent ash explosions and sulfur dioxide plumes (BGVN 46:11, 47:10). This activity continued during October 2022 through May 2023, based on reports from the Pusat Vulkanologi dan Mitigasi Bencana Geologi (PVMBG; also known as Indonesian Center for Volcanology and Geological Hazard Mitigation, CVGHM), the Darwin Volcanic Ash Advisory Centre (VAAC), and satellite data. During this period, the Alert Level remained at 2 (on a scale of 1-4) and the public was warned to remain outside of the 2-km exclusion zone. The highest reported plume of the period reached 9.4 km above the summit on 14 November 2022.
According to MAGMA Indonesia (a platform developed by PVMBG), white, gray, or dark plumes of variable densities were observed almost every day during the reporting period, except when fog obscured the volcano (figure 33). Plumes generally rose 25-450 m above the summit, but rose as high as 700-800 m on several days, somewhat lower than the maximum heights reached earlier in 2022 when plumes reached as high as 1 km. However, the Darwin VAAC reported that on 14 November 2022, a discrete ash plume rose 9.4 km above the summit (10.7 km altitude), accompanied by a strong hotspot and a sulfur dioxide signal observed in satellite imagery; a continuous ash plume that day and through the 15th rose to 2.1-2.4 km altitude and drifted NE.
Sentinel-2 images were obscured by weather clouds almost every viewing day during the reporting period. However, the few reasonably clear images showed a hotspot and white or gray emissions and plumes. Strong SO2 plumes from Dukono were present on many days during October 2022-May 2023, as detected using the TROPOMI instrument on the Sentinel-5P satellite (figure 34).
Geologic Background. Reports from this remote volcano in northernmost Halmahera are rare, but Dukono has been one of Indonesia's most active volcanoes. More-or-less continuous explosive eruptions, sometimes accompanied by lava flows, have occurred since 1933. During a major eruption in 1550 CE, a lava flow filled in the strait between Halmahera and the N-flank Gunung Mamuya cone. This complex volcano presents a broad, low profile with multiple summit peaks and overlapping craters. Malupang Wariang, 1 km SW of the summit crater complex, contains a 700 x 570 m crater that has also been active during historical time.
Information Contacts: Pusat Vulkanologi dan Mitigasi Bencana Geologi (PVMBG, also known as Indonesian Center for Volcanology and Geological Hazard Mitigation, CVGHM), Jalan Diponegoro 57, Bandung 40122, Indonesia (URL: http://www.vsi.esdm.go.id/); MAGMA Indonesia (Multiplatform Application for Geohazard Mitigation and Assessment in Indonesia), Kementerian Energi dan Sumber Daya Mineral (URL: https://magma.esdm.go.id/v1); Darwin Volcanic Ash Advisory Centre (VAAC), Bureau of Meteorology, Northern Territory Regional Office, PO Box 40050, Casuarina, NT 0811, Australia (URL: http://www.bom.gov.au/info/vaac/); NASA Global Sulfur Dioxide Monitoring Page, Atmospheric Chemistry and Dynamics Laboratory, NASA Goddard Space Flight Center (NASA/GSFC), 8800 Greenbelt Road, Goddard, Maryland, USA (URL: https://so2.gsfc.nasa.gov/); Sentinel Hub Playground (URL: https://www.sentinel-hub.com/explore/sentinel-playground).
Sabancaya
Peru
15.787°S, 71.857°W; summit elev. 5960 m
All times are local (unless otherwise noted)
Explosions, gas-and-ash plumes, and thermal activity persist during November 2022-April 2023
Sabancaya is located in Peru, NE of Ampato and SE of Hualca Hualca. Eruptions date back to 1750 and have been characterized by explosions, phreatic activity, ash plumes, and ashfall. The current eruption period began in November 2016 and has more recently consisted of daily explosions, gas-and-ash plumes, and thermal activity (BGVN 47:11). This report updates activity during November 2022 through April 2023 using information from Instituto Geophysico del Peru (IGP) that use weekly activity reports and various satellite data.
Intermittent low-to-moderate power thermal anomalies were reported by the MIROVA project during November 2022 through April 2023 (figure 119). There were few short gaps in thermal activity during mid-December 2022, late December-to-early January 2023, late January to mid-February, and late February. According to data recorded by the MODVOLC thermal algorithm, there were a total of eight thermal hotspots: three in November 2022, three in February 2023, one in March, and one in April. On clear weather days, some of this thermal anomaly was visible in infrared satellite imagery showing the active lava dome in the summit crater (figure 120). Almost daily moderate-to-strong sulfur dioxide plumes were recorded during the reporting period by the TROPOMI instrument on the Sentinel-5P satellite (figure 121). Many of these plumes exceeded 2 Dobson Units (DU) and drifted in multiple directions.
IGP reported that moderate activity during November and December 2022 continued; during November, an average number of explosions were reported each week: 30, 33, 36, and 35, and during December, it was 32, 40, 47, 52, and 67. Gas-and-ash plumes in November rose 3-3.5 km above the summit and drifted E, NE, SE, S, N, W, and SW. During December the gas-and-ash plumes rose 2-4 km above the summit and drifted in different directions. There were 1,259 volcanic earthquakes recorded during November and 1,693 during December. Seismicity also included volcano-tectonic-type events that indicate rock fracturing events. Slight inflation was observed in the N part of the volcano near Hualca Hualca (4 km N). Thermal activity was frequently reported in the crater at the active lava dome (figure 120).
Explosive activity continued during January and February 2023. The average number of explosions were reported each week during January (51, 50, 60, and 59) and February (43, 54, 51, and 50). Gas-and-ash plumes rose 1.6-2.9 km above the summit and drifted NW, SW, and W during January and rose 1.4-2.8 above the summit and drifted W, SW, E, SE, N, S, NW, and NE during February. IGP also detected 1,881 volcanic earthquakes during January and 1,661 during February. VT-type earthquakes were also reported. Minor inflation persisted near Hualca Hualca. Satellite imagery showed continuous thermal activity in the crater at the lava dome (figure 120).
During March, the average number of explosions each week was 46, 48, 31, 35, and 22 and during April, it was 29, 41, 31, and 27. Accompanying gas-and-ash plumes rose 1.7-2.6 km above the summit crater and drifted W, SW, NW, S, and SE during March. According to a Buenos Aires Volcano Ash Advisory Center (VAAC) notice, on 22 March at 1800 through 23 March an ash plume rose to 7 km altitude and drifted NW. By 0430 an ash plume rose to 7.6 km altitude and drifted W. On 24 and 26 March continuous ash emissions rose to 7.3 km altitude and drifted SW and on 28 March ash emissions rose to 7.6 km altitude. During April, gas-and-ash plumes rose 1.6-2.5 km above the summit and drifted W, SW, S, NW, NE, and E. Frequent volcanic earthquakes were recorded, with 1,828 in March and 1,077 in April, in addition to VT-type events. Thermal activity continued to be reported in the summit crater at the lava dome (figure 120).
Geologic Background. Sabancaya, located in the saddle NE of Ampato and SE of Hualca Hualca volcanoes, is the youngest of these volcanic centers and the only one to have erupted in historical time. The oldest of the three, Nevado Hualca Hualca, is of probable late-Pliocene to early Pleistocene age. The name Sabancaya (meaning "tongue of fire" in the Quechua language) first appeared in records in 1595 CE, suggesting activity prior to that date. Holocene activity has consisted of Plinian eruptions followed by emission of voluminous andesitic and dacitic lava flows, which form an extensive apron around the volcano on all sides but the south. Records of historical eruptions date back to 1750.
Information Contacts: Instituto Geofisico del Peru (IGP), Centro Vulcanológico Nacional (CENVUL), Calle Badajoz N° 169 Urb. Mayorazgo IV Etapa, Ate, Lima 15012, Perú (URL: https://www.igp.gob.pe/servicios/centro-vulcanologico-nacional/inicio); Buenos Aires Volcanic Ash Advisory Center (VAAC), Servicio Meteorológico Nacional-Fuerza Aérea Argentina, 25 de mayo 658, Buenos Aires, Argentina (URL: http://www.smn.gov.ar/vaac/buenosaires/inicio.php); MIROVA (Middle InfraRed Observation of Volcanic Activity), a collaborative project between the Universities of Turin and Florence (Italy) supported by the Centre for Volcanic Risk of the Italian Civil Protection Department (URL: http://www.mirovaweb.it/); Hawai'i Institute of Geophysics and Planetology (HIGP) - MODVOLC Thermal Alerts System, School of Ocean and Earth Science and Technology (SOEST), Univ. of Hawai'i, 2525 Correa Road, Honolulu, HI 96822, USA (URL: http://modis.higp.hawaii.edu/); NASA Global Sulfur Dioxide Monitoring Page, Atmospheric Chemistry and Dynamics Laboratory, NASA Goddard Space Flight Center (NASA/GSFC), 8800 Greenbelt Road, Goddard MD 20771, USA (URL: https://so2.gsfc.nasa.gov/); Copernicus Browser, Copernicus Data Space Ecosystem, European Space Agency (URL: https://dataspace.copernicus.eu/browser/).
Sheveluch
Russia
56.653°N, 161.36°E; summit elev. 3283 m
All times are local (unless otherwise noted)
Significant explosions destroyed part of the lava-dome complex during April 2023
Sheveluch (also spelled Shiveluch) in Kamchatka, has had at least 60 large eruptions during the last 10,000 years. The summit is truncated by a broad 9-km-wide caldera that is breached to the S, and many lava domes occur on the outer flanks. The lava dome complex was constructed within the large open caldera. Frequent collapses of the dome complex have produced debris avalanches; the resulting deposits cover much of the caldera floor. A major south-flank collapse during a 1964 Plinian explosion produced a scarp in which a “Young Sheveluch” dome began to form in 1980. Repeated episodes of dome formation and destruction since then have produced major and minor ash plumes, pyroclastic flows, block-and-ash flows, and “whaleback domes” of spine-like extrusions in 1993 and 2020 (BGVN 45:11). The current eruption period began in August 1999 and has more recently consisted of lava dome growth, explosions, ash plumes, and avalanches (BGVN 48:01). This report covers a significant explosive eruption during early-to-mid-April 2023 that generated a 20 km altitude ash plume, produced a strong sulfur dioxide plume, and destroyed part of the lava-dome complex; activity described during January through April 2023 use information primarily from the Kamchatka Volcanic Eruptions Response Team (KVERT) and various satellite data.
Satellite data. Activity during the majority of this reporting period was characterized by continued lava dome growth, strong fumarole activity, explosions, and hot avalanches. According to the MODVOLC Thermal Alerts System, 140 hotspots were detected through the reporting period, with 33 recorded in January 2023, 29 in February, 44 in March, and 34 in April. Frequent strong thermal activity was recorded during January 2023 through April, according to the MIROVA (Middle InfraRed Observation of Volcanic Activity) graph and resulted from the continuously growing lava dome (figure 94). A slightly stronger pulse in thermal activity was detected in early-to-mid-April, which represented the significant eruption that destroyed part of the lava-dome complex. Thermal anomalies were also visible in infrared satellite imagery at the summit crater (figure 95).
During January 2023 KVERT reported continued growth of the lava dome, accompanied by strong fumarolic activity, incandescence from the lava dome, explosions, ash plumes, and avalanches. Satellite data showed a daily thermal anomaly over the volcano. Video data showed ash plumes associated with collapses at the dome that generated avalanches that in turn produced ash plumes rising to 3.5 km altitude and drifting 40 km W on 4 January and rising to 7-7.5 km altitude and drifting 15 km SW on 5 January. A gas-and-steam plume containing some ash that was associated with avalanches rose to 5-6 km altitude and extended 52-92 km W on 7 January. Explosions that same day produced ash plumes that rose to 7-7.5 km altitude and drifted 10 km W. According to a Volcano Observatory Notice for Aviation (VONA) issued at 1344 on 19 January, explosions produced an ash cloud that was 15 x 25 km in size and rose to 9.6-10 km altitude, drifting 21-25 km W; as a result, the Aviation Color Code (ACC) was raised to Red (the highest level on a four-color scale). Another VONA issued at 1635 reported that no more ash plumes were observed, and the ACC was lowered to Orange (the second highest level on a four-color scale). On 22 January an ash plume from collapses and avalanches rose to 5 km altitude and drifted 25 km NE and SW; ash plumes associated with collapses extended 70 km NE on 27 and 31 January.
Lava dome growth, fumarolic activity, dome incandescence, and occasional explosions and avalanches continued during February and March. A daily thermal anomaly was visible in satellite data. Explosions on 1 February generated ash plumes that rose to 6.3-6.5 km altitude and extended 15 km NE. Video data showed an ash cloud from avalanches rising to 5.5 km altitude and drifting 5 km SE on 2 February. Satellite data showed gas-and-steam plumes containing some ash rose to 5-5.5 km altitude and drifted 68-110 km ENE and NE on 6 February, to 4.5-5 km altitude and drifted 35 km WNW on 22 February, and to 3.7-4 km altitude and drifted 47 km NE on 28 February. Scientists from the Kamchatka Volcanological Station (KVS) went on a field excursion on 25 February to document the growing lava dome, and although it was cloudy most of the day, nighttime incandescence was visible. Satellite data showed an ash plume extending up to 118 km E during 4-5 March. Video data from 1150 showed an ash cloud from avalanches rose to 3.7-5.5 km altitude and drifted 5-10 km ENE and E on 5 March. On 11 March an ash plume drifted 62 km E. On 27 March ash plumes rose to 3.5 km altitude and drifted 100 km E. Avalanches and constant incandescence at the lava dome was focused on the E and NE slopes on 28 March. A gas-and-steam plume containing some ash rose to 3.5 km altitude and moved 40 km E on 29 March. Ash plumes on 30 March rose to 3.5-3.7 km altitude and drifted 70 km NE.
Similar activity continued during April, with lava dome growth, strong fumarolic activity, incandescence in the dome, occasional explosions, and avalanches. A thermal anomaly persisted throughout the month. During 1-4 April weak ash plumes rose to 2.5-3 km altitude and extended 13-65 km SE and E.
Activity during 11 April 2023. The Institute of Volcanology and Seismology, Far Eastern Branch, Russian Academy of Sciences (IVS FEB RAS) reported a significant increase in seismicity around 0054 on 11 April, as reported by strong explosions detected on 11 April beginning at 0110 that sent ash plumes up to 7-10 km altitude and extended 100-435 km W, WNW, NNW, WSW, and SW. According to a Tokyo VAAC report the ash plume rose to 15.8 km altitude. By 0158 the plume extended over a 75 x 100 km area. According to an IVS FEB RAS report, the eruptive column was not vertical: the initial plume at 0120 on 11 April deviated to the NNE, at 0000 on 12 April, it drifted NW, and by 1900 it drifted SW. KVS reported that significant pulses of activity occurred at around 0200, 0320, and then a stronger phase around 0600. Levin Dmitry took a video from near Békés (3 km away) at around 0600 showing a rising plume; he also reported that a pyroclastic flow traveled across the road behind him as he left the area. According to IVS FEB RAS, the pyroclastic flow traveled several kilometers SSE, stopping a few hundred meters from a bridge on the road between Klyuchi and Petropavlovsk-Kamchatsky.
Ashfall was first observed in Klyuchi (45 km SW) at 0630, and a large, black ash plume blocked light by 0700. At 0729 KVERT issued a Volcano Observatory Notice for Aviation (VONA) raising the Aviation Color Code to Red (the highest level on a four-color scale). It also stated that a large ash plume had risen to 10 km altitude and drifted 100 km W. Near-constant lightning strikes were reported in the plume and sounds like thunderclaps were heard until about 1000. According to IVS FEB RAS the cloud was 200 km long and 76 km wide by 0830, and was spreading W at altitudes of 6-12 km. In the Klyuchi Village, the layer of both ash and snow reached 8.5 cm (figure 96); ashfall was also reported in Kozyrevsk (112 km SW) at 0930, Mayskoye, Anavgay, Atlasovo, Lazo, and Esso. Residents in Klyuchi reported continued darkness and ashfall at 1100. In some areas, ashfall was 6 cm deep and some residents reported dirty water coming from their plumbing. According to IVS FEB RAS, an ash cloud at 1150 rose to 5-20 km altitude and was 400 km long and 250 km wide, extending W. A VONA issued at 1155 reported that ash had risen to 10 km and drifted 340 km NNW and 240 km WSW. According to Simon Carn (Michigan Technological University), about 0.2 Tg of sulfur dioxide in the plume was measured in a satellite image from the TROPOMI instrument on the Sentinel-5P satellite acquired at 1343 that covered an area of about 189,000 km2 (figure 97). Satellite data at 1748 showed an ash plume that rose to 8 km altitude and drifted 430 km WSW and S, according to a VONA.
Activity during 12-15 April 2023. On 12 April at 0730 satellite images showed ash plumes rose to 7-8 km altitude and extended 600 km SW, 1,050 km ESE, and 1,300-3,000 km E. By 1710 that day, the explosions weakened. According to news sources, the ash-and-gas plumes drifted E toward the Aleutian Islands and reached the Gulf of Alaska by 13 April, causing flight disruptions. More than 100 flights involving Alaska airspace were cancelled due to the plume. Satellite data showed ash plumes rising to 4-5.5 km altitude and drifted 400-415 km SE and ESE on 13 April. KVS volcanologists observed the pyroclastic flow deposits and noted that steam rose from downed, smoldering trees. They also noted that the deposits were thin with very few large fragments, which differed from previous flows. The ash clouds traveled across the Pacific Ocean. Flight cancellations were also reported in NW Canada (British Columbia) during 13-14 April. During 14-15 April ash plumes rose to 6 km altitude and drifted 700 km NW.
Alaskan flight schedules were mostly back to normal by 15 April, with only minor delays and far less cancellations; a few cancellations continued to be reported in Canada. Clear weather on 15 April showed that most of the previous lava-dome complex was gone and a new crater roughly 1 km in diameter was observed (figure 98); gas-and-steam emissions were rising from this crater. Evidence suggested that there had been a directed blast to the SE, and pyroclastic flows traveled more than 20 km. An ash plume rose to 4.5-5.2 km altitude and drifted 93-870 km NW on 15 April.
Activity during 16-30 April 2023. Resuspended ash was lifted by the wind from the slopes and rose to 4 km altitude and drifted 224 km NW on 17 April. KVERT reported a plume of resuspended ash from the activity during 10-13 April on 19 April that rose to 3.5-4 km altitude and drifted 146-204 km WNW. During 21-22 April a plume stretched over the Scandinavian Peninsula. A gas-and-steam plume containing some ash rose to 3-3.5 km altitude and drifted 60 km SE on 30 April. A possible new lava dome was visible on the W slope of the volcano on 29-30 April (figure 99); satellite data showed two thermal anomalies, a bright one over the existing lava dome and a weaker one over the possible new one.
References. Girina, O., Loupian, E., Horvath, A., Melnikov, D., Manevich, A., Nuzhdaev, A., Bril, A., Ozerov, A., Kramareva, L., Sorokin, A., 2023, Analysis of the development of the paroxysmal eruption of Sheveluch volcano on April 10–13, 2023, based on data from various satellite systems, ??????????? ???????? ??? ?? ???????, 20(2).
Geologic Background. The high, isolated massif of Sheveluch volcano (also spelled Shiveluch) rises above the lowlands NNE of the Kliuchevskaya volcano group. The 1,300 km3 andesitic volcano is one of Kamchatka's largest and most active volcanic structures, with at least 60 large eruptions during the Holocene. The summit of roughly 65,000-year-old Stary Shiveluch is truncated by a broad 9-km-wide late-Pleistocene caldera breached to the south. Many lava domes occur on its outer flanks. The Molodoy Shiveluch lava dome complex was constructed during the Holocene within the large open caldera; Holocene lava dome extrusion also took place on the flanks of Stary Shiveluch. Widespread tephra layers from these eruptions have provided valuable time markers for dating volcanic events in Kamchatka. Frequent collapses of dome complexes, most recently in 1964, have produced debris avalanches whose deposits cover much of the floor of the breached caldera.
Information Contacts: Kamchatka Volcanic Eruptions Response Team (KVERT), Far Eastern Branch, Russian Academy of Sciences, 9 Piip Blvd., Petropavlovsk-Kamchatsky, 683006, Russia (URL: http://www.kscnet.ru/ivs/kvert/); Institute of Volcanology and Seismology, Far Eastern Branch, Russian Academy of Sciences (IVS FEB RAS), 9 Piip Blvd., Petropavlovsk-Kamchatsky 683006, Russia (URL: http://www.kscnet.ru/ivs/eng/); Kamchatka Volcanological Station, Kamchatka Branch of Geophysical Survey, (KB GS RAS), Klyuchi, Kamchatka Krai, Russia (URL: http://volkstat.ru/); Hawai'i Institute of Geophysics and Planetology (HIGP) - MODVOLC Thermal Alerts System, School of Ocean and Earth Science and Technology (SOEST), Univ. of Hawai'i, 2525 Correa Road, Honolulu, HI 96822, USA (URL: http://modis.higp.hawaii.edu/); MIROVA (Middle InfraRed Observation of Volcanic Activity), a collaborative project between the Universities of Turin and Florence (Italy) supported by the Centre for Volcanic Risk of the Italian Civil Protection Department (URL: http://www.mirovaweb.it/); Copernicus Browser, Copernicus Data Space Ecosystem, European Space Agency (URL: https://dataspace.copernicus.eu/browser/); Kam 24 News Agency, 683032, Kamchatka Territory, Petropavlovsk-Kamchatsky, Vysotnaya St., 2A (URL: https://kam24.ru/news/main/20230411/96657.html#.Cj5Jrky6.dpuf); Simon Carn, Geological and Mining Engineering and Sciences, Michigan Technological University, 1400 Townsend Drive, Houghton, MI 49931, USA (URL: http://www.volcarno.com/, Twitter: @simoncarn).
Bezymianny
Russia
55.972°N, 160.595°E; summit elev. 2882 m
All times are local (unless otherwise noted)
Explosions, ash plumes, lava flows, and avalanches during November 2022-April 2023
Bezymianny is located on the Kamchatka Peninsula of Russia as part of the Klyuchevskoy volcano group. Historic eruptions began in 1955 and have been characterized by dome growth, explosions, pyroclastic flows, ash plumes, and ashfall. During the 1955-56 eruption a large open crater was formed by collapse of the summit and an associated lateral blast. Subsequent episodic but ongoing lava-dome growth, accompanied by intermittent explosive activity and pyroclastic flows, has largely filled the 1956 crater. The current eruption period began in December 2016 and more recent activity has consisted of strong explosions, ash plumes, and thermal activity (BGVN 47:11). This report covers activity during November 2022 through April 2023, based on weekly and daily reports from the Kamchatka Volcano Eruptions Response Team (KVERT) and satellite data.
Activity during November and March 2023 was relatively low and mostly consisted of gas-and-steam emissions, occasional small collapses that generated avalanches along the lava dome slopes, and a persistent thermal anomaly over the volcano that was observed in satellite data on clear weather days. According to the Tokyo VAAC and KVERT, an explosion produced an ash plume that rose to 6 km altitude and drifted 25 km NE at 1825 on 29 March.
Gas-and-steam emissions, collapses generating avalanches, and thermal activity continued during April. According to two Volcano Observatory Notice for Aviation (VONA) issued on 2 and 6 April (local time) ash plumes rose to 3 km and 3.5-3.8 km altitude and drifted 35 km E and 140 km E, respectively. Satellite data from KVERT showed weak ash plumes extending up to 550 km E on 2 and 5-6 April.
A VONA issued at 0843 on 7 April described an ash plume that rose to 4.5-5 km altitude and drifted 250 km ESE. Later that day at 1326 satellite data showed an ash plume that rose to 5.5-6 km altitude and drifted 150 km ESE. A satellite image from 1600 showed an ash plume extending as far as 230 km ESE; KVERT noted that ash emissions were intensifying, likely due to avalanches from the growing lava dome. The Aviation Color Code (ACC) was raised to Red (the highest level on a four-color scale). At 1520 satellite data showed an ash plume rising to 5-5.5 km altitude and drifting 230 km ESE. That same day, Kamchatka Volcanological Station (KVS) volcanologists traveled to Ambon to collect ash; they reported that a notable eruption began at 1730, and within 20 minutes a large ash plume rose to 10 km altitude and drifted NW. KVERT reported that the strong explosive phase began at 1738. Video and satellite data taken at 1738 showed an ash plume that rose to 10-12 km altitude and drifted up to 2,800 km SE and E. Explosions were clearly audible 20 km away for 90 minutes, according to KVS. Significant amounts of ash fell at the Apakhonchich station, which turned the snow gray; ash continued to fall until the morning of 8 April. In a VONA issued at 0906 on 8 April, KVERT stated that the explosive eruption had ended; ash plumes had drifted 2,000 km E. The ACC was lowered to Orange (the third highest level on a four-color scale). The KVS team saw a lava flow on the active dome once the conditions were clear that same day (figure 53). On 20 April lava dome extrusion was reported; lava flows were noted on the flanks of the dome, and according to KVERT satellite data, a thermal anomaly was observed in the area. The ACC was lowered to Yellow (the second lowest on a four-color scale).
Satellite data showed an increase in thermal activity beginning in early April 2023. A total of 31 thermal hotspots were detected by the MODVOLC thermal algorithm on 4, 5, 7, and 12 April 2023. The elevated thermal activity resulted from an increase in explosive activity and the start of an active lava flow. The MIROVA (Middle InfraRed Observation of Volcanic Activity) volcano hotspot detection system based on the analysis of MODIS data also showed a pulse in thermal activity during the same time (figure 54). Infrared satellite imagery captured a continuous thermal anomaly at the summit crater, often accompanied by white gas-and-steam emissions (figure 55). On 4 April 2023 an active lava flow was observed descending the SE flank.
Geologic Background. The modern Bezymianny, much smaller than its massive neighbors Kamen and Kliuchevskoi on the Kamchatka Peninsula, was formed about 4,700 years ago over a late-Pleistocene lava-dome complex and an edifice built about 11,000-7,000 years ago. Three periods of intensified activity have occurred during the past 3,000 years. The latest period, which was preceded by a 1,000-year quiescence, began with the dramatic 1955-56 eruption. This eruption, similar to that of St. Helens in 1980, produced a large open crater that was formed by collapse of the summit and an associated lateral blast. Subsequent episodic but ongoing lava-dome growth, accompanied by intermittent explosive activity and pyroclastic flows, has largely filled the 1956 crater.
Information Contacts: Kamchatka Volcanic Eruptions Response Team (KVERT), Far Eastern Branch, Russian Academy of Sciences, 9 Piip Blvd., Petropavlovsk-Kamchatsky, 683006, Russia (URL: http://www.kscnet.ru/ivs/kvert/); Kamchatka Volcanological Station, Kamchatka Branch of Geophysical Survey, (KB GS RAS), Klyuchi, Kamchatka Krai, Russia (URL: http://volkstat.ru/); Hawai'i Institute of Geophysics and Planetology (HIGP) - MODVOLC Thermal Alerts System, School of Ocean and Earth Science and Technology (SOEST), Univ. of Hawai'i, 2525 Correa Road, Honolulu, HI 96822, USA (URL: http://modis.higp.hawaii.edu/); MIROVA (Middle InfraRed Observation of Volcanic Activity), a collaborative project between the Universities of Turin and Florence (Italy) supported by the Centre for Volcanic Risk of the Italian Civil Protection Department (URL: http://www.mirovaweb.it/); Copernicus Browser, Copernicus Data Space Ecosystem, European Space Agency (URL: https://dataspace.copernicus.eu/browser/).
Chikurachki
Russia
50.324°N, 155.461°E; summit elev. 1781 m
All times are local (unless otherwise noted)
New explosive eruption during late January-early February 2023
Chikurachki, located on Paramushir Island in the northern Kuriles, has had Plinian eruptions during the Holocene. Lava flows have reached the sea and formed capes on the NW coast; several young lava flows are also present on the E flank beneath a scoria deposit. Reported eruptions date back to 1690, with the most recent eruption period occurring during January through October 2022, characterized by occasional explosions, ash plumes, and thermal activity (BGVN 47:11). This report covers a new eruptive period during January through February 2023 that consisted of ash explosions and ash plumes, based on information from the Kamchatka Volcanic Eruptions Response Team (KVERT) and satellite data.
According to reports from KVERT, an explosive eruption began around 0630 on 29 January. Explosions generated ash plumes that rose to 3-3.5 km altitude and drifted 6-75 km SE and E, based on satellite data. As a result, the Aviation Color Code (ACC) was raised to Orange (the second highest level on a four-color scale). At 1406 and 1720 ash plumes were identified in satellite images that rose to 4.3 km altitude and extended 70 km E. By 2320 the ash plume had dissipated. A thermal anomaly was visible at the volcano on 31 January, according to a satellite image, and an ash plume was observed drifting 66 km NE.
Occasional explosions and ash plumes continued during early February. At 0850 on 1 February an ash plume rose to 3.5 km altitude and drifted 35 km NE. Satellite data showed an ash plume that rose to 3.2-3.5 km altitude and drifted 50 km NE at 1222 later that day (figure 22). A thermal anomaly was detected over the volcano during 5-6 February and ash plumes drifted as far as 125 km SE, E, and NE. Explosive events were reported at 0330 on 6 February that produced ash plumes rising to 4-4.5 km altitude and drifting 72-90 km N, NE, and ENE. KVERT noted that the last gas-and steam plume that contained some ash was observed on 8 February and drifted 55 km NE before the explosive eruption ended. The ACC was lowered to Yellow and then Green (the lowest level on a four-color scale) on 18 February.
Geologic Background. Chikurachki, the highest volcano on Paramushir Island in the northern Kuriles, is a relatively small cone constructed on a high Pleistocene edifice. Oxidized basaltic-to-andesitic scoria deposits covering the upper part of the young cone give it a distinctive red color. Frequent basaltic Plinian eruptions have occurred during the Holocene. Lava flows have reached the sea and formed capes on the NW coast; several young lava flows are also present on the E flank beneath a scoria deposit. The Tatarinov group of six volcanic centers is located immediately to the south, and the Lomonosov cinder cone group, the source of an early Holocene lava flow that reached the saddle between it and Fuss Peak to the west, lies at the southern end of the N-S-trending Chikurachki-Tatarinov complex. In contrast to the frequently active Chikurachki, the Tatarinov centers are extensively modified by erosion and have a more complex structure. Tephrochronology gives evidence of an eruption around 1690 CE from Tatarinov, although its southern cone contains a sulfur-encrusted crater with fumaroles that were active along the margin of a crater lake until 1959.
Information Contacts: Kamchatka Volcanic Eruptions Response Team (KVERT), Far East Division, Russian Academy of Sciences, 9 Piip Blvd., Petropavlovsk-Kamchatsky, 683006, Russia (URL: http://www.kscnet.ru/ivs/); Copernicus Browser, Copernicus Data Space Ecosystem, European Space Agency (URL: https://dataspace.copernicus.eu/browser/).
Search Bulletin Archive by Publication Date
Select a month and year from the drop-downs and click "Show Issue" to have that issue displayed in this tab.
The default month and year is the latest issue available.
Bulletin of the Global Volcanism Network - Volume 29, Number 10 (October 2004)
Managing Editor: Richard Wunderman
Asamayama (Japan)
Pumice and lithic samples from September eruption chemically similar to older lavas
Awu (Indonesia)
Volcanic seismicity ends in early August; weak plumes
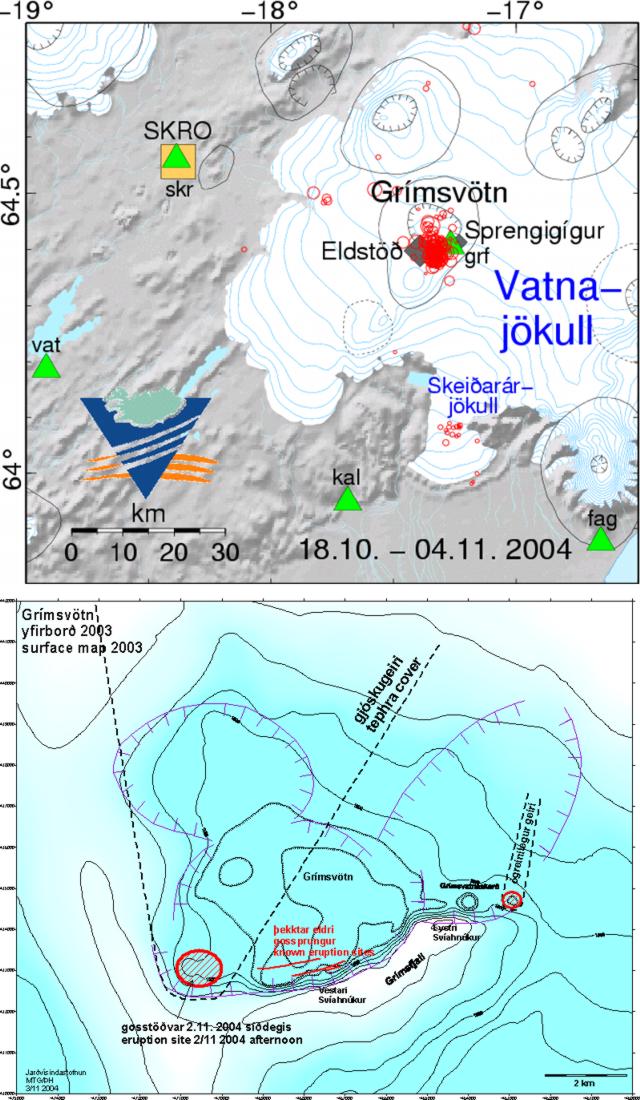
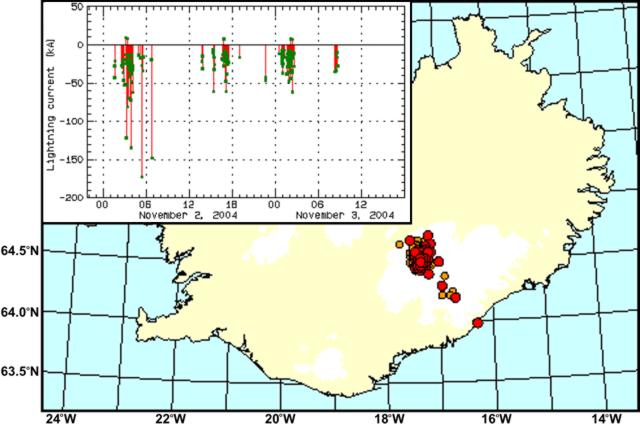
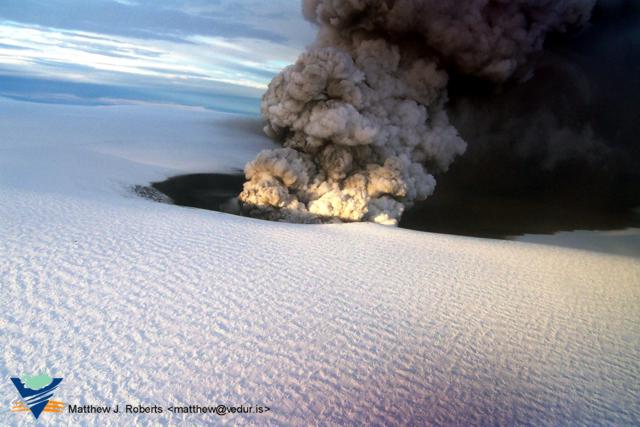
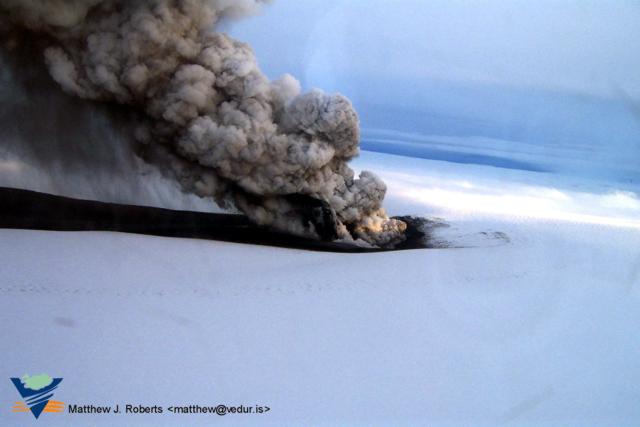
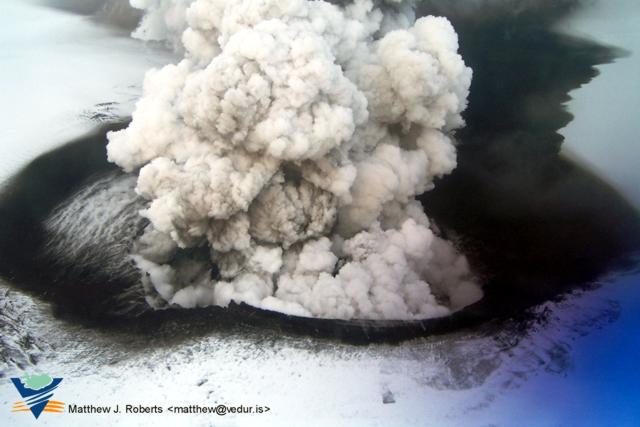
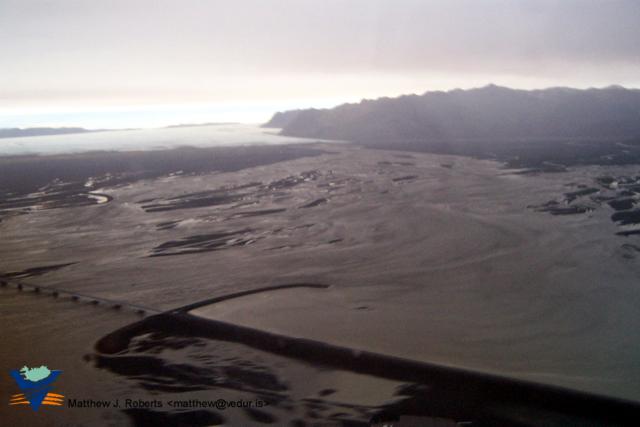
Grimsvotn (Iceland)
Subglacial eruption penetrates ice cover and sends ash far as Finland
Manam (Papua New Guinea)
Eruption from Southern Crater on 24 October; pyroclastic flows and ashfall
Montagu Island (United Kingdom)
Higher-resolution image shows abundant ash, not lava, on the N-flank
Soufriere Hills (United Kingdom)
Heavy rains cause frequent mudflows and increased seismicity
Spurr (United States)
Elevated seismicity, increased carbon dioxide emissions, and melting of the ice cap
St. Helens (United States)
Swelling dome rises ~250 m; minor plumes and few earthquakes
Taftan (Iran)
October 2003 visit found passive degassing; petrography of andesite lava sample
Asamayama (Japan) — October 2004 Cite this Report
Asamayama
Japan
36.406°N, 138.523°E; summit elev. 2568 m
All times are local (unless otherwise noted)
Pumice and lithic samples from September eruption chemically similar to older lavas
An explosive eruption occurred from the summit crater of Asama at 2002 on 1 September 2004 (BGVN 29:08). Most of the initial reporting was in Japanese, although many of those reports had segments in English. Setsuya Nakada and Yukio Hayakawa provided links to initially available reports. In initial assessments of the eruption, investigators identified several distinct suites of ejecta, including darker- and lighter-colored groups. The ERI report also discussed a breadcrust bomb sampled at Kromamegawara 3.5 km NE of Asama's crater, which contained a vitric outer film and vesicular interior. ERI compiled some initial major element compositions on the of products of the 1 September eruption, including those taken on both fresh pumices (bombs) and lithics. Both types of materials were chemically close to lavas erupted in the years 1783, 1973, and 1108.
Geologic Background. Asamayama, Honshu's most active volcano, overlooks the resort town of Karuizawa, 140 km NW of Tokyo. The volcano is located at the junction of the Izu-Marianas and NE Japan volcanic arcs. The modern Maekake cone forms the summit and is situated east of the remnant of an older andesitic volcano, Kurofuyama, which was destroyed by a late-Pleistocene landslide about 20,000 years before present (BP). Growth of a dacitic shield volcano was accompanied by pumiceous pyroclastic flows, the largest of which occurred about 14,000-11,000 BP, and by growth of the Ko-Asamayama lava dome on the east flank. Maekake, capped by the Kamayama pyroclastic cone that forms the present summit, is probably only a few thousand years old and has observed activity dating back at least to the 11th century CE. Maekake has had several major Plinian eruptions, the last two of which occurred in 1108 (Asamayama's largest Holocene eruption) and 1783 CE.
Information Contacts: Geological Survey of Japan, National Institute of Advanced Industrial Science and Technology (GSJ AIST) (URL: http://www.aist.go.jp/); Yukio Hayakawa, Faculty of Education, Gunma University, Aramaki 4-2, Maebashi Gunma 371-8510, Japan (URL: http://www.hayakawayukio.jp/English.html); Setsuya Nakada, Volcano Research Center, Earthquake Research Institute (ERI), University of Tokyo, Yayoi 1-1-1, Bunkyo-ku, Tokyo 113, Japan (URL: http://www.eri.u-tokyo.ac.jp/VRC/index_E.html).
Awu
Indonesia
3.689°N, 125.447°E; summit elev. 1318 m
All times are local (unless otherwise noted)
Volcanic seismicity ends in early August; weak plumes
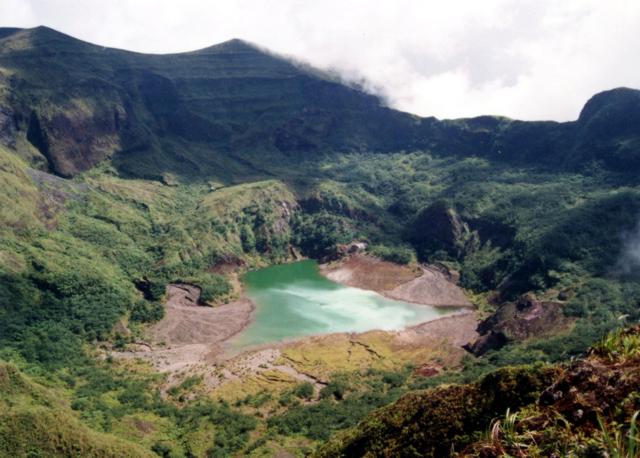
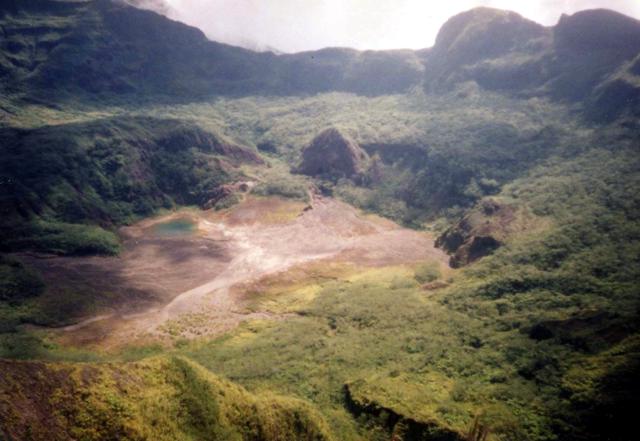
Awu extruded a new dome in its crater by 2 June 2004 (BGVN 29:05). Several photos received from the Directorate of Volcanology and Geological Hazard Mitigation (DVGHM) taken from the crater's upper S side illustrate the crater prior to and just after the 2004 dome emplacement (figures 4-6). Elevated seismicity continued into the week ending on 8 August 2004 (table 2). During 12-25 July, observers saw white thin-medium plumes gently rising to 50 m above the summit. A report covering 9-15 August, noted that the Awu observation post documented a weak plume 200 m tall. They also reported nine type-B earthquakes. A brief message from DVGHM on 7 December noted that Awu was then quiet.
Table 2. Summary of volcanic type-A earthquakes and tectonic earthquakes at Awu during 22 June through 15 August 2004. Volcanic type-B volcanic earthquakes also occurred occasionally, perhaps once a week, except in the 9-15 August interval, when they occurred nine times. Data for several days and time intervals (eg., 6 and 11 July, and 26 July-1 August) was not available. Courtesy of DVGHM.
| Date |
Deep Volcanic (A-type) |
Tectonic |
| 22 Jun-28 Jun 2004 |
5 |
84 |
| 29 Jun-05 Jul 2004 |
6 |
74 |
| 07 Jul-12 Jul 2004 |
3 |
93 |
| 13 Jul-18 Jul 2004 |
2 |
74 |
| 19 Jul-25 Jul 2004 |
25 |
110 |
| 26 Jul-01 Aug 2004 |
-- |
-- |
| 02 Aug-08 Aug 2004 |
7 |
92 |
| 09 Aug-15 Aug 2004 |
0 |
75 |
Aviation reports. The Volcanic Ash Advisory Centre at Darwin, Australia, issued 15 reports (Volcanic Ash Advisories) regarding Awu during June 2004. These were the first and only Awu reports available in their archive of reports going back to 1998. The first message (on 8 June) was "Major eruption possible, but no eruption yet." Similar terminology accompanied Advisories until 12 June. The 9 June report noted "continuous small eruptions" and "four larger explosions in past two days." A plume also seen on satellite imagery was estimated by pilots to be at ~ 4.5-6 km. Later it became difficult to see the plume with satellite imagery. On 10 June two Advisories noted thin plumes directed NE extending ~ 37 km. The plumes were seen on imagery at 2325 and 0220 UTC (in aerospace shorthand, the imagery came from DVGHM, DMSP, GOES, and NOAA 17 satellites). The final Advisory, on 14 June, noted "Eruption details: Nil obs[erved] ash." That notice also commented that the alert status had dropped and no significant activity had been recorded, but a white plume rose ~ 100 m above the summit in the last 24 hours.
Geologic Background. The massive Gunung Awu stratovolcano occupies the northern end of Great Sangihe Island, the largest of the Sangihe arc. Deep valleys that form passageways for lahars dissect the flanks of the volcano, which was constructed within a 4.5-km-wide caldera. Powerful explosive eruptions in 1711, 1812, 1856, 1892, and 1966 produced devastating pyroclastic flows and lahars that caused more than 8000 cumulative fatalities. Awu contained a summit crater lake that was 1 km wide and 172 m deep in 1922, but was largely ejected during the 1966 eruption.
Information Contacts: Dali Ahmad, Volcanological Survey of Indonesia (VSI), Directorate of Volcanology and Geological Hazard Mitigation, Jalan Diponegoro 57, Bandung 40122, Indonesia (URL: http://www.vsi.esdm.go.id/); Office for the Coordination of Humanitarian Affairs (OCHA), United Nations, New York, NY 10017, USA; Darwin Volcanic Ash Advisory Centre (VAAC), Bureau of Meteorology, Northern Territory Regional Office, PO Box 40050, Casuarina, NT 0811, Australia (URL: http://www.bom.gov.au/info/vaac/).
Grimsvotn (Iceland) — October 2004 Cite this Report
Grimsvotn
Iceland
64.416°N, 17.316°W; summit elev. 1719 m
All times are local (unless otherwise noted)
Subglacial eruption penetrates ice cover and sends ash far as Finland
According to scientists from the Institute of Earth Sciences at the University of Iceland and the Icelandic Meteorological Office, an eruption began at the subglacial Grímsvötn volcano in the Vatnajökull ice cap, Iceland, on 1 November 2004 around 2100, and was declining by 5 November. The eruption, preceded by both long- and short-term precursors, was triggered by the release of overburden pressure associated with a glacial-outburst flood (jökulhlaup) originating from the subglacial caldera lake. The jökulhlaup reached a maximum on the afternoon of 2 November. At that time the peak discharge from affected rivers on the coastal plain at Skeidararsandur was 3,000-4,000 m3/s (based on information from the Icelandic Hydrological Service). Discharge declined quickly after the peak. No damage occurred to roads or bridges. The total volume of the jökulhlaup was ~ 0.5 km3.
Seismicity increased at the volcano in mid-2003, about the same time that uplift exceeded a maximum reached in 1998. Tthe last eruption at Grímsvötn occurred within the caldera beginning on 18 December 1998.... Additional uplift and expansion of the volcano since mid-2003 heralded the latest activity. Seismicity further increased in late October 2004, and on 26 October high-frequency tremor indicated increased water flow from the caldera lake and suggested that a glacial outburst flood was about to begin. On 29 October, the amount of discharge increased in the Skeidara River. About 3 hours before the eruption an intense swarm of volcanic earthquakes started, changing to continuous low-frequency tremor at the onset of the eruption.
The release in overburden pressure associated with the outburst flood triggered the eruption. The amount of drop in water level in the caldera at the onset of the eruption was uncertain, but was probably on the order of 10-20 m, corresponding to a pressure change of 0.1-0.2 MPa at the volcano's surface. This modest pressure change triggered the eruption because pressure in the shallow magma chamber was high after continuous inflow of magma since 1998.
Figure 5 shows the epicenters from 18 October to 1 November 2004, along with preliminary locations of the eruption site. In the early morning of 1 November, an earthquake swarm began beneath Grímsvötn. By 1400 there were 12 earthquakes; at 0651 the largest, an event of M 3 occurred. At 2010 on 1 November an eruption warning was sent to the Civil Defense, earthquake magnitudes had increased and around that time the swarm intensified. About 160 earthquakes with magnitudes up to 2.8 were recorded during the next 2 hours.
Initially under ice 150-200 m thick, the eruption melted its way through to the surface in about 1 hour. An eruption plume was detected by radar around midnight on 1 November. Radar estimates of plume altitude stood at 12-13 km numerous times during 2-3 November. A plot of altitude versus time showed two cases where plume heights were almost 13 km; each occurred about 0200 on 2 and 3 November. The weather radar used to make the plot was located at Keflavik-Airport, 260 km from Grímsvötn.
Lightning. Early on 2 November and through most of the morning on 3 November, numerous lightning strikes were detected by instruments, and their computed locations largely centered over Grímsvötn. The ash plume was driven to the N by southerly winds during the whole eruption. Accordingly, both the scatter and SE extension of the lightning were judged likely artifacts of imprecision in estimates of lighning locations (figure 6).
Regarding the lightning data, geophysicist Pordur Arason described the three systems used. First, the Icelandic lightning location system consists of three LLP direction finder stations, each measuring time, direction, polarity, intensity and multiplicity. The stations discriminate lightning and record only cloud-to-ground (CG) lightning. The location system is old (produced pre-1980) and unfortunately only one station (Sydri-Neslond) gave useful measurements. By assuming distance from the station to Grímsvötn, Arason calculated the current in the lightning. He noted that almost all of this CG lightning showed negative polarity (lightning polarity is determined by the charge of the cloud compared to Earth).
A second lightning system results from cooperation with the UK Met Office, and one of their ATD sferics stations in Iceland. Arason had access to their data. The locations on figure 2 are those of the ATD system, which gives times and locations but does not discriminate between cloud-to-ground (CG) lightning and cloud-to-cloud (CC) lightning, although it is biased towards CG, since its antennas only measure vertical electric-field variations.
The third system was a one-station recording system of vertical electric field variations (EFMS) in Reykjavik that records the vertical component of the electric field every 200 ns for a period of a 1 ms. During the eruption it recorded the waveforms of about 150 lightning events. About half of these show characteristics of a negative polarity CG and half CC.
Magma-water interactions lead to explosions, emission of ash and steam, and to charge separation. Erupted ash becomes negatively charged and the steam positively charged. Almost all of the CG lightning had negative polarity, indicating its origin in the ash, and not the steam.
Other observations. The initial inspection of the eruption from an airplane took place around 0800 UTC on 2 November. It confirmed that a phreatomagmatic eruption was in progress from a short (less than 1-km-long) eruptive fissure at 64.40°N, 17.23°W. At that time a continuous plume rose to ~ 9 km altitude. Observations throughout the day revealed periods of high explosive activity, with maximum plume heights of 12-14 km. The strength of the eruption correlated with the seismically recorded volcanic tremor. Some explosive activity had occurred in a second ice cauldron near the SE edge of Grímsvötn, 8 km to the E of the main crater. This ice cauldron issued steam when first detected after noon on 2 November.
The London VAAC reported that the ash plume produced from the eruption reached a height of ~ 12.2 km a.s.l. According to news articles, the eruption occurred in an unpopulated region so no evacuations were needed, but air traffic was diverted away from the region.
Observation flights later on 2 November photographed and videoed the vent that had opened through in the ice (figures 7-9). Plumes were sometimes nearly white and steam dominated, at other times black and ash dominated, and in some cases visible portions of the plumes simultaneously reflected both of these extremes (figure 7, 8, and 9). A 2 November view of the jökulhlaup appears as figure 10.
On 3 November, eruptive activity occurred in pulses, resulting in changing eruption column heights from 8-9 km to 13-14 km above the volcano. During the course of the eruption, ash plumes and tephra distributions imaged by satellites typically showed trends to the NE; in some cases plumes remained visible at least 150 km from the eruption site. A distal ash plume was observed in Norway, Finland, and Sweden.
On 9 November from 0630 to 1330 a tremor pulse was recorded, and on 11 November, from a little past 0900 and again around 1100, the seismic station at the volcano showed what the Iceland Meteorological Office called "increased jökulhlaup tremor." This tremor decreased after midnight on 12 November, increased from 0500 to 0830, then decreased again. The eruption followed a pattern similar to previous eruptions in 1983 and 1998, with probably less than 0.1 km3 of magma erupted.
According to scientists at the Iceland Meteorological Office and the Institute of Earth Sciences, University of Iceland, these eruptions, together with the 1996 Gjalp eruption N of Grímsvötn reflect much higher activity at Grímsvötn than during the middle part of last century, and may indicate that Grímsvötn is entering into a new period of high volcanism that may last for decades. Such a high activity period had been predicted on the basis of the observed cyclic volcanism in the area in the preceding millennium.
Geologic Background. Grímsvötn, Iceland's most frequently active volcano in recent history, lies largely beneath the vast Vatnajökull icecap. The caldera lake is covered by a 200-m-thick ice shelf, and only the southern rim of the 6 x 8 km caldera is exposed. The geothermal area in the caldera causes frequent jökulhlaups (glacier outburst floods) when melting raises the water level high enough to lift its ice dam. Long NE-SW-trending fissure systems extend from the central volcano. The most prominent of these is the noted Laki (Skaftar) fissure, which extends to the SW and produced the world's largest known historical lava flow in 1783. The 15 km3 basaltic Laki lavas were erupted over 7 months from a 27-km-long fissure system. Extensive crop damage and livestock losses caused a severe famine that resulted in the loss of one-fifth of the population of Iceland.
Information Contacts: Freysteinn Sigmundsson, Pall Einarsson, Magnus Tumi Gudmundsson, Thordis Hognadottir, Anette Mortensen, and Fredrik Holm, Institute of Earth Sciences, University of Iceland, Reykjavik, Iceland (URL: http://nordvulk.hi.is/, http://raunvisindastofnun.hi.is/); Steinunn Jakobsdottir, Matthew J. Roberts, Kristin Vogfjord, Ragnar Stefansson, and Pordur Arason, Icelandic Meteorological Office, Reykjavik, Iceland (URL: http://www.vedur.is/); London Volcanic Ash Advisory Center, Met Office, FitzRoy Road, Exeter, Devon EX1 3PB, United Kingdom (URL: http://www.metoffice.com/).
Manam (Papua New Guinea) — October 2004 Cite this Report
Manam
Papua New Guinea
4.08°S, 145.037°E; summit elev. 1807 m
All times are local (unless otherwise noted)
Eruption from Southern Crater on 24 October; pyroclastic flows and ashfall
The Rabaul Volcano Observatory (RVO) issued a series of information bulletins on Manam, describing conditions and hazard status recommendations associated with a strong eruption that started on 24 October 2004. That eruption was preceded by a clear buildup in seismicity, leading to a felt earthquake the day prior to the eruption. The eruption generated pyroclastic flows which traveled down the valley SE of the volcano and into the sea. The aviation color code rose to Red, the highest value.
The eruption's plume was imaged from space. Ash and condensed water vapor in the form of ice reached a maximum height of ~ 15 km altitude, intersecting the base of the tropopause but not entering the stratosphere. Low-level eruptive activity persisted after the 24 October eruption.
Lead-up to the 24 October eruption. RVO noticed increased low-frequency earthquakes at Manam beginning 15 October 2004. Its reports suggested the volcanic system had changed to a dynamic mode from its previously stable state. The escalation in low-frequency earthquakes during that interval was described as a "steady rise." But overall, the level was portrayed as low to moderate. In retrospect, RVO reports noted that seismicity increased steadily after 16 October; moreover, it rose further after a felt earthquake at about 1845 on the 23rd.
During 15-21 October RVO noted occasional weak roaring and rumbling noises from the Main Crater. The noises prevailed on 15, 16, and 17 October, becoming more frequent on the 18th, but reduced again on the 19th. The noises continued at a level similar to the 16th and 17th on the 20th and 21st. Noise from Southern Crater began on the 19th, consisting of the sound of a single low explosion. After the 20th, occasional low roaring and rumbling noises continued from both craters. Observers saw night glow from the Main Crater on the 18th and 19th. Occasionally the glow fluctuated at 3-5 minute intervals. Glow remained absent over Southern Crater. Both Craters released weak white-gray vapor.
Occasional ash-laden vapor was seen on the 21st from Southern Crater. In their report for 15-21 October, RVO recommended Alert Level 1. They said "Whilst no official public warning is required under this Alert Level, people living in and near the four main valleys of the Island should be informed to refrain from venturing into them unnecessarily." RVO later stressed the presence of NW winds at altitude, warning residents on that flank of possible ashfall.
Eruption on 24 October 2004. The eruption came from Southern Crater, beginning after 0800 on the 24th; it persisted throughout the morning and the early part of the afternoon, peaking between 1000 and 1100. At 1400 the eruption's intensity decreased slightly. Later that day it continued at a reduced level with moderate explosions and sub-continuous low rumbling and roaring noises.
The eruption produced a pyroclastic flow channeled into the SE valley, that eventually reached the sea. The NW part of the island, including villages between Tabele Mission and Baliau, were affected by ash and scoria falls. Some of the scoriae were fist-size and punched holes through the thatched-roofing of houses. The greatest impact occurred at Kuluguma and the surrounding villages. Casualties remained unreported. Between the hours of 0300 and 0500, residents of Wewak town called RVO, advising that fine ash had reached them.
Seismicity reflected the eruptive activity, with events peaking between the hours of 1000 and 1100, after which event counts reverted to low to moderate levels. Ongoing seismicity suggested that the volcano has not reached a completely quiet state. Still, the eruption level had declined as it continued. It was recommended that the Alert Level be upgraded from 1 to 2 (Stage 2 Alert Level does not call for evacuation from the Island). Authorities called for community information exchange ("toksave") on volcano status; for avoiding the four main valleys; for the population to stay prepared and organized, including village efforts.
The 24 October eruption caused the aviation color code to rise to Red, the highest value. According to RVO, low-level eruptive activity persisted after the 24 October eruption, decreasing further by 26 October. A RVO report issued at 0800 on 27 October noted that activity had subsided significantly since late on the 24th. An aerial inspection confirmed pyroclastic flows had gone down the SE- and upper part of the SW-trending valleys. A lava flow traveled 600 m down the SE valley. Tephra fall most affected the area from Kuluguma to Boda villages, including the Bieng Catholic mission on the island's NW side. Numerous food gardens were destroyed by the tephra deposit, which had an average thickness of 7 cm measured at the Bieng mission. RVO recommended that the Alert Level be downgraded to 1.
On 27-28 October occasional ash emissions still escaped from Southern Crater. Brown ash clouds rose several hundred meters above the summit before drifting to the NW and SW, resulting in fine ashfall. The ash emissions were accompanied by weak roaring and rumbling noises. Weak night-time glows were visible. Although earthquakes were few, tremor persisted. Low seismicity was coupled with a decline in eruptive vigor.
During 28-29 October, comparatively mild eruptions continued. Southern Crater continued to eject occasional emissions of dark, moderately thick, ash-laden clouds. The ash clouds were again blown NW, traversing the area between Yassa and Baliau villages. Low roaring and rumbling noises accompanied some of the activity. It was difficult to observe Main Crater due to cloud cover. Glow was difficult to observe due to cloud cover as well. Few earthquakes occurred, but volcanic tremor continued.
Media reports. News articles reported that authorities advised evacuation of ~ 3,000 people to safer parts of the island. Some of those articles revealed that the island's current population stood at 7,000, and that the government had helped provide food and shelter for those displaced.
According to the online version of the Papua New Guinea (PNG) Post-Courier, the Inter-Government Relations Minister, Sir Peter Barter, flew over the eruption. He allegedly saw large volumes of lava discharging into the sea, but judging from RVO observations, the term "lava" was mistakenly used for pyroclastic flows. In the news report Peter Barter had also stated that the entire SE side of the mountain, ~ 1 km wide, blew out, forcing lava (or other hot pyroclastic material) to flow down the SE valley to the sea. He was also reported as saying that at Bien (sometimes spelled Bieng, on the island's NW coast) his helicopter was hit by rocks (or other volcanic particles) that damaged its windscreen. Also, the Bien mission station lay beneath a heavy layer of ash. The damage to his helicopter kept him from flying completely around the island, missing the western segment between Bien, Yassa, Jorai, and the SW-flank settlement of Tabele, areas hit hardest by dust and rocks. He commented that much of the SE side of the island was relatively ash-free and safe, apart from the S-coast area between Dugulava (on the S coast) to Warisi.
A 27 October article by Dominic Krau in PNG's The National noted that the 24 October eruption had included a forceful outburst at 0800 on the 24th, and then climaxed during 1100-1400 that day, but had since been emitting only "smoke" and ash. It noted that prime minister Michael Somare had flown to Manam for a first-hand look at the damage. The same article mentioned that Peter Barter had assured that functioning radios were available at the settlements of Bien, Tabele, Warisis, Dugalava, Abereia, Bukure, and Kolang. It reported that volcanic ash fell in Wewak (on the main island's coast, 120 km NW), resulting in the civil aviation authority temporarily closing down the Boram airport for safety reasons.
Andrew Tupper of the Australian Bureau of Meteorology (BOM) posted satellite images of the 24 October eruption's ash cloud, which occurred just before the Terra and Aqua satellites passed over. They also captured AVHRR and GOES data of a very ice-rich volcanic cloud. The coldest temperature measured by BOM from the high-level cloud was about 204 K (a couple of hours after the eruption), which translates to an altitude of ~ 15 km. This altitude was in harmony with the cloud's subsequent dispersion pattern and wind-velocity models. Pilot reports have been generally lower, as is usual for large eruptions. There was no evidence of significant stratospheric penetration (the tropopause height was 15-16 km).
Geologic Background. The 10-km-wide island of Manam, lying 13 km off the northern coast of mainland Papua New Guinea, is one of the country's most active volcanoes. Four large radial valleys extend from the unvegetated summit of the conical basaltic-andesitic stratovolcano to its lower flanks. These valleys channel lava flows and pyroclastic avalanches that have sometimes reached the coast. Five small satellitic centers are located near the island's shoreline on the northern, southern, and western sides. Two summit craters are present; both are active, although most observed eruptions have originated from the southern crater, concentrating eruptive products during much of the past century into the SE valley. Frequent eruptions, typically of mild-to-moderate scale, have been recorded since 1616. Occasional larger eruptions have produced pyroclastic flows and lava flows that reached flat-lying coastal areas and entered the sea, sometimes impacting populated areas.
Information Contacts: Andrew Tupper, Australian Bureau of Meteorology; Darwin Volcanic Ash Advisory Centre, Australian Bureau of Meteorology (URL: http://www.bom.gov.au/info/vaac); Rabaul Volcanological Observatory (RVO), P.O. Box 386, Rabaul, Papua New Guinea; Papua New Guinea Post-Courier Online (URL: http://www.postcourier.com.pg).
Montagu Island (United Kingdom) — October 2004 Cite this Report
Montagu Island
United Kingdom
58.445°S, 26.374°W; summit elev. 1370 m
All times are local (unless otherwise noted)
Higher-resolution image shows abundant ash, not lava, on the N-flank
Matt Patrick of the Hawaii Institute of Geophysics and Planetology reviewed our previous report on Montagu Island (BGVN 29:09) and noted some erroneous interpretations. These had relied on imagery from 1 October 2004. Patrick generated a significantly improved, scaled, higher (4-m) resolution IKONOS image from the same time frame (figure 8), and offered some refinements and important corrections.
First, the previous report noted that "the area of apparently continuous flows seems to have reached the island's N margin (a distance of 3 km)." Over the entire new image there doesn't seem to be any new vents nor lava. The darkened area N of the Belinda summit cone contains clear crevasses indicating a region of ice entirely covered in ash.
A second erroneous statement was, "Another visible feature, the black area to the NNW . . . presumably reveals lava flows emerging from beneath the ice." Patrick points out that on the new image this area is seen to contain some of the island's rocky cliffs contrasting against the ice cover. He attributed the darkness around this area mainly to shadow. The presence of rocky cliffs negates another statement in the previous issue: "The black area to the NNW may thus be a new vent area."
The previous report commented that, "Another such [dark, presumably lava-covered] area may reside on the NNE flanks, midway from the summit area and the coast." Patrick noted that on the new image this area appears chaotic and can easily be misidentified as recent volcanics. He goes on to say, "We made a similar mistake earlier on, thinking there were concentric fractures related to subglacial melting. But it turned out from pre-eruption images that this area is just covered in topographic crevasses. Looking at the [improved] IKONOS image, one can see this more clearly."
Patrick offered interpretations of some features on the new image, the first high-resolution image since February 2004. It shows continued steaming from Mount Belinda as well as tephra cover on the surrounding ice field, activity very similar to that seen on all the previous imagery. Although the new IKONOS image lacks any evidence of new lava since the 2003 lava flow, that particular lava field lies hidden under the steam plume in the IKONOS image. Thus, there could be newer material in that small region. The IKONOS image appears devoid of new vents, and emissions come solely from the summit area.
Geologic Background. The largest of the South Sandwich Islands, Montagu consists of a massive shield volcano cut by a 6-km-wide ice-filled summit caldera. The summit of the 11 x 15 km island rises about 3,000 m from the sea floor between Bristol and Saunders Islands. Around 90% of the island is ice-covered; glaciers extending to the sea typically form vertical ice cliffs. The name Mount Belinda has been applied both to the high point at the southern end of the summit caldera and to the young central cone. Mount Oceanite, an isolated peak at the SE tip of the island, was the source of lava flows exposed at Mathias Point and Allen Point. There was no record of Holocene activity until MODIS satellite data, beginning in late 2001, revealed thermal anomalies consistent with lava lake activity. Apparent plumes and single anomalous pixels were observed intermittently on AVHRR images from March 1995 to February 1998, possibly indicating earlier volcanic activity.
Information Contacts: Matt Patrick, HIGP Thermal Alerts Team, Hawai'i Institute of Geophysics and Planetology (HIGP) / School of Ocean and Earth Science and Technology (SOEST), University of Hawai'i, 2525 Correa Road, Honolulu, HI 96822, USA (URL: http://modis.higp.hawaii.edu/).
Soufriere Hills (United Kingdom) — October 2004 Cite this Report
Soufriere Hills
United Kingdom
16.72°N, 62.18°W; summit elev. 915 m
All times are local (unless otherwise noted)
Heavy rains cause frequent mudflows and increased seismicity
Table 58, taken from reports of the Monserrat Volcano Observatory (MVO), summarizes activity at Soufrière Hills between 1 October and 26 November. The activity level remained elevated during much of this time period due to increases in seismicity, gas emission, rainfall, and mudflows.
Table 58. Activity recorded at Soufrière Hills, 1 October to 26 November 2004. One of the gas-monitoring sites only functioned on 18 November. Courtesy of Montserrat Volcano Observatory (MVO).
| Date |
Activity Level |
Hybrid EQ's |
Mixed EQ's |
Volcano-tectonic EQ's |
Long-period EQ's |
SO2 emissions (tons/day) |
Rockfalls |
| 01 Oct-08 Oct 2004 |
elevated |
8 |
-- |
-- |
2 |
187-1144 |
1 |
| 08 Oct-15 Oct 2004 |
elevated |
9 |
-- |
-- |
-- |
156- 553 |
1 |
| 15 Oct-22 Oct 2004 |
elevated |
49 |
-- |
1 |
-- |
250-1100 |
4 |
| 22 Oct-29 Oct 2004 |
elevated |
40 |
-- |
1 |
-- |
320-370 |
-- |
| 29 Oct-05 Nov 2004 |
elevated |
33 |
-- |
39 |
-- |
140- 440 |
1 |
| 05 Nov-12 Nov 2004 |
-- |
21 |
-- |
14 |
-- |
147- 225 |
3 |
| 12 Nov-19 Nov 2004 |
-- |
12 |
-- |
40 |
5 |
1111 |
3 |
| 19 Nov-26 Nov 2004 |
-- |
25 |
-- |
5 |
1 |
125-330 |
3 |
Heavy rains during the first six weeks of the reporting period led to steam venting, which triggered an increase in hybrid and volcanic-tectonic earthquakes. A large number of hybrid and volcano-tectonic (VT) earthquakes was recorded during most of October and early November. The most intense seismicity occurred during 2106-2216 on 12 November and 1335-1436 on 14 November.
Following the rains of 5-12 November, several fumaroles developed along the former Tuitt's Bottom and Pea Ghauts, but by 12 November, drier conditions prevailed and fumaroles diminished. Sulfur dioxide emissions remained low throughout most of the reporting period, however two surges in SO2 flux occurred during the weeks of 1 October and 15 October. Mudflows occurred since May. As heavy rainfall continued during October and November, more mudflows occurred. Nine separate mudflow events were recorded for this reporting period. The flows of 15, 19, 21, 22-29 October and 1, 3, 9, and 11 November were minor, though one of the flows, which traveled down the NW flank, reached the Belham River. A much heavier flow began around 0620 on 19 November, with a pulse occurring at 1138.
One MVO scientist deemed mudflows the "ongoing legacy of this [the 1995] eruption." Montserrat's rainy season typically continues until December, and more mudflows may occur in coming months. Mudflows have proven to be destructive, whether they have arisen from short, intense downpours or from a buildup over several rains. The example was given of mudflows after two hours of heavy rain on the afternoon of 21 May, which led to burial of the gateway to the Radio Antilles' offices.
MVO personnel made two observation flights during the reporting period (on 28 October and 4 November). Both flights confirmed the presence of the pond seen 30 August in the pit formed by the 3 March dome collapse. Looking into the crater, MVO scientists found no evidence of ongoing dome-building.
Geologic Background. The complex, dominantly andesitic Soufrière Hills volcano occupies the southern half of the island of Montserrat. The summit area consists primarily of a series of lava domes emplaced along an ESE-trending zone. The volcano is flanked by Pleistocene complexes to the north and south. English's Crater, a 1-km-wide crater breached widely to the east by edifice collapse, was formed about 2000 years ago as a result of the youngest of several collapse events producing submarine debris-avalanche deposits. Block-and-ash flow and surge deposits associated with dome growth predominate in flank deposits, including those from an eruption that likely preceded the 1632 CE settlement of the island, allowing cultivation on recently devegetated land to near the summit. Non-eruptive seismic swarms occurred at 30-year intervals in the 20th century, but no historical eruptions were recorded until 1995. Long-term small-to-moderate ash eruptions beginning in that year were later accompanied by lava-dome growth and pyroclastic flows that forced evacuation of the southern half of the island and ultimately destroyed the capital city of Plymouth, causing major social and economic disruption.
Information Contacts: Montserrat Volcano Observatory (MVO), Fleming, Montserrat, West Indies (URL: http://www.mvo.ms/).
Spurr (United States) — October 2004 Cite this Report
Spurr
United States
61.299°N, 152.251°W; summit elev. 3374 m
All times are local (unless otherwise noted)
Elevated seismicity, increased carbon dioxide emissions, and melting of the ice cap
Spurr, ~ 125 km W of Anchorage across Cook Inlet, became restless in recent months. This activity consisted of increased seismicity beginning in February 2004, melting of the summit ice cap, and substantial emission rates of carbon dioxide (CO2) and sulfur dioxide (SO2). Scientists at the Alaska Volcano Observatory (AVO) recorded hundreds of small earthquakes centered 4.8-6.4 km beneath the summit. Elevated levels of seismicity continued through early November 2004 (table 2). Although the rate of seismicity is greater than typical background levels, AVO has found no indication that an eruption is imminent.
Table 2. Weekly seismicity within 30 km of the summit at Spurr, with magnitudes over 1.5 and depths of 1-6 km. Courtesy of AVO.
| Dates |
Average earthquakes per day |
| 24 Jul-30 Jul 2004 |
10-20 |
| 31 Jul-06 Aug 2004 |
10-20 |
| 07 Aug-13 Aug 2004 |
10-20 |
| 14 Aug-20 Aug 2004 |
15 (70 events on 14 Aug) |
| 21 Aug-27 Aug 2004 |
12 |
| 28 Aug-03 Sep 2004 |
14 |
| 04 Sep-10 Sep 2004 |
13 |
| 11 Sep-17 Sep 2004 |
12 |
| 18 Sep-24 Sep 2004 |
10 |
| 25 Sep-01 Oct 2004 |
13 |
| 02 Oct-08 Oct 2004 |
8 |
| 09 Oct-15 Oct 2004 |
9 |
| 16 Oct-22 Oct 2004 |
2-14 |
| 23 Oct-29 Oct 2004 |
12-24 (3 per hour on 26 Oct) |
| 30 Oct-05 Nov 2004 |
0-24 (10 per hour on 4 Nov) |
Aerial reconnaissance in mid-July and early August documented recent small flows of mud and rock and a depression in the icecap (an "ice cauldron") just NE of the summit that was ~ 50 x 75 m in size and ~ 25 m deep. The floor of the depression contained an icy pond, with small areas of open water. No steam or volcanic emissions were observed. The ice cauldron is a collapse feature possibly caused by an increase in heat coming from deep beneath the summit. Using sensitive instruments, scientists flying around the volcano on 7 August detected small amounts of the volcanic gases in a plume from the summit.
Observations and photography during the week ending 10 September revealed that the ice cauldron had enlarged substantially (to ~ 150 x 170 m), presumably as the roof of the meltwater basin continued to subside and collapse. AVO scientists measured gases being emitted by the summit vent and Crater Peak, a flank vent, during a fixed-wing flight on 15 September 2004. The combined output of CO2 from the two vents was ~ 2,300 tons/day, an increase from the ~ 760 tons/day measured 7-8 August 2004. The gray color of the lake at the bottom of the ice cauldron is typical of crater lakes containing dissolved SO2.
AVO staff took an overflight of the volcano on 18 October and reported that the summit ice cauldron persisted without appreciable change of its geometry or of the surrounding crevasses. The ice cauldron continued to contain standing water, no steam or sulfur scent was observed from the summit, and steam issuing from Crater Peak had not changed from previous observations.
References. Power, J., 2004, Renewed unrest at Mount Spurr Volcano, Alaska: Eos (Transactions, American Geophysical Union), v. 85, no. 43, p. 2.
Waythomas, C.F., and Nye, C.J., 2002, Preliminary volcano-hazard assessment for Mount Spurr Volcano, Alaska: U.S. Geological Survey Open-File Report 01.482, Alaska Volcano Observatory, Anchorage, Alaska, 39 pp.
Geologic Background. Mount Spurr is the closest volcano to Anchorage, Alaska (130 km W) and just NE of Chakachamna Lake. The summit is a large lava dome at the center of a roughly 5-km-wide amphitheater open to the south formed by a late-Pleistocene or early Holocene debris avalanche and associated pyroclastic flows that destroyed an older edifice. The debris avalanche traveled more than 25 km SE, and the resulting deposit contains blocks as large as 100 m in diameter. Several ice-carved post-collapse cones or lava domes are present. The youngest vent, Crater Peak, formed at the southern end of the amphitheater and has been the source of about 40 identified Holocene tephra layers. Eruptions from Crater Peak in 1953 and 1992 deposited ash in Anchorage.
Information Contacts: U.S. Geological Survey Alaska Volcano Observatory (AVO), a cooperative program of the USGS, University of Alaska Fairbanks Geophysical Institute, and the Alaska Division of Geological and Geophysical Surveys (URL: http://www.avo.alaska.edu/).
St. Helens (United States) — October 2004 Cite this Report
St. Helens
United States
46.2°N, 122.18°W; summit elev. 2549 m
All times are local (unless otherwise noted)
Swelling dome rises ~250 m; minor plumes and few earthquakes
At St. Helens, rapid dome growth and pronounced uplift continued. Although this report covers 9 October-12 November 2004, there are several photos and comments on prior events. Figure 47, for example, contains a satellite image from 5 October. R. Scott Ireland photographically documented the 4 and 5 October eruptions, starting from the smallest plumes and including later wind-blown ash-bearing plumes. Digital copies of Ireland's set will be preserved in the Smithsonian's archives. Much of this report came from information posted by the Cascades Volcano Observatory (CVO).
Figure 48 presents four aerial views into the crater, taken on 8 August and 7, 10, and 14 October. They portray the southern part of the crater containing a broad area of uplift and deformation associated with a more restricted zone of dome emergence. On 7 October the broad area of uplift on the S side of the 1980-86 lava dome stood ~ 400 m (N-S) by ~500 m (E-W), with a maximum uplift of about 100-120 m. For perspective on this growth, CVO's 11 November estimate noted an expanded area of uplift and some parts of the dome rising ~250 m above the glacier.
Table 5 summarizes CVO's observations. The terminology of numbered days for this eruption began at Day 1 (23 September), when precursory earthquakes began (BGVN 29:09). In contrast to those initial several weeks, during the current reporting interval seismicity generally remained low, an observation consistent with the slow rise of gas-poor magma. The emerging magma drove uplift of the glacier within the crater but did not yield large explosive discharges and tall plumes.
Table 5. A simplified chronology of the events at St. Helens from 23 September to 12 November 2004. Regarding the Hazard Status column, the colors in parentheses represent an informal aviation hazard status (low to high; green, yellow, orange, and red). Taken from material posted by the USGS.
| Day |
Date |
Hazard Status |
Comment |
| DAY 17 |
09 Oct 2004 |
2 - Advisory (Orange) |
Moderate seismic activity-earthquakes up to M 2 at one event every two or three minutes. |
| DAY 18 |
10 Oct 2004 |
2 - Advisory (Orange) |
Earthquakes up to M 1 every minute. |
| DAY 19 |
11 Oct 2004 |
2 - Advisory (Orange) |
Low seismicity. Thermal imaging of the uplifted area (last seen on the 7th) found it had grown. The W portion of the uplift was steaming over a large diffuse area. Maximum measured surface temperatures were 200-300°C. Uplifting area discharged a brief emission at about 1600. Dusting of ash on new snow disclosed minor ash emissions the previous night. |
| DAY 20 |
12 Oct 2004 |
2 - Advisory (Orange) |
Low seismicity (earthquakes up to M 1 every 5-10 minutes). Thermal imaging of the W part of the uplifting area revealed temperatures of 500-600°C on a large pinkish-gray fin of rock and in nearby fumaroles and cracks. |
| DAY 21 |
13 Oct 2004 |
2 - Advisory (Orange) |
Hot (600°C) area both confirmed and appeared to have increased in size. Low seismicity; abundant steaming; SO2 and H2S detected; CO2 undetected; temperature and flow rate of water in streams similar to that measured in September. |
| DAY 22 |
14 Oct 2004 |
2 - Advisory (Orange) |
A zone approaching 700°C and in places reaching 761°C was measured on the new lobe, which emitted ash-rich jets rising ten's of meters. Abundant steam continued to rise from the area of lava extrusion to the crater rim. Low seismicity. |
| DAY 23-40 |
15-31 Oct 2004 |
2 - Advisory (Orange) |
Slight increase noted in area of uplift and new lobe of lava. On the 22nd a new protrusion of lava registered ~ 650°C. Slight increase in seismicity on 17th, but storm noise as well as rainfall triggering a small debris flow had also occurred; otherwise, seismicity was low. |
| DAY 41-53 |
01-12 Nov 2004 |
2 - Advisory (Orange) |
On the 5th there was an ash plume to ~ 3 km altitude; on the 9th, a steam plume rose to similar altitude. Also, a new extrusion was noted on the 5th (see text). By the 11th the dome's highest point stood ~ 250 m above the height of the glacier's surface prior to the eruption. On the 11th the hottest lava registered ~700°C. Low seismicity generally prevailed. |
Thermal images of the exposed dome revealed elevated temperatures there. This confirmed that new lava had reached the surface of the uplift.
Other details. The weather enabled clear views on 10 October. A photo of the scene at dawn showed an orange-colored plume. Field observers noted fresh snow over the crater floor contained a thin SE-directed ash deposit stretching to just beyond the crater rim. A steam plume rose to crater rim level or slightly above all day on 10 October and continued to blow SE. USGS field workers described the plume as "lazy," emphasing the absence of gas thrusts or notably vigorous convection. When the field crew visited the volcano, the plume appeared clean, with no noticeable ash nor blue nor orange haze. The odor of H2S was noted at the crater's breach, but not elsewhere.
On 14 October observers noted an increase in the deforming and uplifting area on the S side of the 1980-1986 lava dome and the new lobe of lava in the W part of that area. The maximum temperature of 761°C was measured in parts of the new lobe from which ash rich jets rose ten's of meters. Magma extruded onto the surface, forming a new lobe of the lava dome. Instruments detected low levels of H2S and SO2, but no CO2.
Crews collected samples and documented clear dome growth on 20-21 October. The new lava extrusion had horizontal dimensions of ~ 300 x 75 m and a thickness of ~ 70 m. The fin-shaped lava spine had collapsed. The 21 October volume estimate was almost 2 x 10⁶ m3. By 21 October the area of uplift and intense deformation had advanced S, nearing the crater wall. That day, ~ 30 cm of new snow with a light dusting of ash covered much of the uplift, except for the new lava extrusion, which steamed heavily. A vigorous steam plume rose to 3 km. Fluxes of gaseous H2S, SO2, and CO2 were low. Samples of the new dome were scooped up by a container slung on a line beneath a helicopter.
Atmospheric conditions on 27 October and 7 November again gave airborne observers clear views into the crater (figures 49, 50, and 51). The N-looking photo in figure 12 documents how the new dome and area of uplift had achieved substantial size, standing topographically above what was previously the moat to the S of the older dome. In plan view, the margin of the dome complex shifted from a circle to a figure-eight.
In addition to photos documenting crater changes, a CVO report on 29 October discussed rapid movement at a new GPS station on the southern part of the new dome (an area of uplifted glacial ice, rock debris, and new lava). The station showed continued southward motion of ~6 m in the previous 36 hours. A station near the summit of the old dome showed continued, slow northward motion.
Analysis of aerial photographs taken on 4 November led to an estimate of the volume of the uplifted area and new lava dome at ~ 20 x 106 m3. This followed other preliminary estimates made for 4 and 13 October of ~5 x 10⁶ m3 and ~12 x 106 m3, respectively. This most recent volume estimate (20 x 106 m3) amounted to more than 25% of the 1980-86 lava dome volume.
On 5 November the SO2 emission rates remained low. No H2S was detected and CO2 emission rates were not measurable. On that day viewers noted that a new mass of dacite had extruded, forming a spine rising ~100 m. Exposed rock faces had temperatures of 400-500°C. The steep new faces on the dome generated small hot rockfalls and avalanches. The finer particulate material rose to about 3 km altitude, a height ~900 m above the crater rim.
A sample of the new dome collected on 4 November established that the new dacite lava contained visible crystals of plagioclase, hornblende, and hypersthene. A comparison of the 1986 and 2004 dacites (table 6) shows that the new lava lacks augite, distinctive reaction rims on hornblende, and large plagioclase with sieve-textured cores.
Table 6. A comparison of the dome dacites extruded at St. Helens in 1986 and 2004. Courtesy of CVO.
| Year |
Rock type |
Mineralogy description |
| 1986 |
Augite-hornblende-hypersthene dacite |
63.5 weight percent SiO2. Hypersthene is the dominant mafic mineral. Hornblende contains distinctive reaction rims. Accessory augite. Large plagioclase phenocrysts, commonly with sieve-textured cores. |
| 2004 |
Hypersthene-hornblende dacite (collected 4 November) |
65.3 weight percent SiO2. Hornblende is the dominant mafic mineral, but it lacks significant reaction rims. Hypersthene is smaller and less abundant. Augite absent. Plagioclase phenocrysts, but absent large ones with sieve-textured cores. |
On 11 November the dome had reached ~ 250 m in height; it lay within a broad area of deformation that was ~ 600 m in diameter. Within this area, the new lava dome continued to occupy the E-central segment (broadly similar to the situation on figures 13 and 14). In plan view, the new dome stood 400 x 180 m. Regarding its height, the 11 November report noted that the highest point on the new lava dome was ~ 250 m "above the former surface of the glacier that occupied that point in mid-September."
Aviation Advisories. The first sentence of this section in BGVN 29:09 should be corrected to read, "The Washington VAAC issued advisories beginning on 29 September" (not 29 October).
The Washington Volcanic Ash Advisory Center issued one Ash Advisory each day during 9-18 October, noting elevated seismicity but a lack of explosive eruptions and substantial plumes. On 18 October the VAAC mentioned GOES-10 and -12 infrared and multispectral imagery of the volcano but concluded that "...after discussion with authorities at [CVO] we are discontinuing the Watch.... There continues to be low level [activity] ... not posing an [imminent] threat to aviation. A Notice to Aviation within ~9 km and below FL 130 should continue [Note: FL130, Flight Level 130, is the aviation community's shorthand for 13,000 feet; an altitude equivalent to 3,962 m, but typically rounded in the Bulletin to the nearest hundred meters]. If threat conditions rise[,] a Watch will again be issued. The Washington VAAC will continue to monitor the area and if ash is observed or reported a Volcanic Ash Advisory will be issued as soon as possible."
As of 12 November, the last Ash Advisory on St. Helens was issued on 6 November. It was in response to a minor ash emission that day. The emission was too small to detect with available satellite imagery. The local webcamera showed a weak, passively rising plume that barely rose above the crater rim.
Geologic Background. Prior to 1980, Mount St. Helens was a conical volcano sometimes known as the Fujisan of America. During the 1980 eruption the upper 400 m of the summit was removed by slope failure, leaving a 2 x 3.5 km breached crater now partially filled by a lava dome. There have been nine major eruptive periods beginning about 40-50,000 years ago, and it has been the most active volcano in the Cascade Range during the Holocene. Prior to 2,200 years ago, tephra, lava domes, and pyroclastic flows were erupted, forming the older edifice, but few lava flows extended beyond the base of the volcano. The modern edifice consists of basaltic as well as andesitic and dacitic products from summit and flank vents. Eruptions in the 19th century originated from the Goat Rocks area on the N flank, and were witnessed by early settlers.
Information Contacts: Cascades Volcano Observatory (USGS/CVO), U.S. Geological Survey, 1300 SE Cardinal Court, Building 10, Suite 100, Vancouver, WA 98683-9589, USA (URL: https://volcanoes.usgs.gov/observatories/cvo/); Pacific Northwest Seismograph Network (PNSN), Seismology Lab, University of Washington, Department of Earth and Space Sciences, Box 351310, Seattle, WA 98195-1310, USA (URL: http://www.pnsn.org/); Washington Volcanic Ash Advisory Center (VAAC), Satellite Analysis Branch (SAB), NOAA/NESDIS E/SP23, NOAA Science Center Room 401, 5200 Auth Road, Camp Springs, MD 20746, USA (URL: http://www.ospo.noaa.gov/Products/atmosphere/vaac/); R. Scott Ireland, 1660 NW 101 Way, Plantation, FL 33322, USA (URL: http://rsiphotos.com/); Stephen and Donna O'Meara, Volcano Watch International, PO Box 218, Volcano, HI 96785, USA.
Taftan
Iran
28.6°N, 61.13°E; summit elev. 3940 m
All times are local (unless otherwise noted)
October 2003 visit found passive degassing; petrography of andesite lava sample
When visited in October 2003, Taftan's behavior was similar to that reported in July 1999 (BGVN 24:10), consisting of a fumarolic zone on the SE cone's W side, ~ 10 m2 in area, emitting steam and SO2 gas, and depositing sulfur. Degassing was clearly visible from the refuge at 3,250 m elevation. A mixture of sulfur and clay derived from highly altered lavas gave a snowy appearance to the summit. This snowy appearance was also noted in July 1999 (BGVN 24:10). Close to the refuge, a warm acid spring generated deep yellow deposits along the ditch down the valley for more than 1 km. A chemical analysis showed that the deposits were predominantly iron salts.
A surface lava sample, taken on 30 October 2003 from just below the refuge on the volcano's W slopes, was judged to be relatively young. George Morris analyzed the sample by X-ray fluorescence spectroscopy (XRF) and described the sample as andesite. This was the first known chemical analysis for Taftan rocks. In addition to the sampled lava flow, thick deposits of ignimbrite appeared in the walls of a deep gorge followed by the trail ascending to the refuge (at ~ 2,500 m elevation). It looked fresh and was judged to be Holocene in age.
Petrography of the lava sample. The sample is phenocryst rich (by volume, ~ 40-50% phenocrysts) in a microcrystalline to cryptocrystalline groundmass. Plagioclase is the predominant phenocryst phase (30-40%) with hornblende (< 5%), pyroxene (< 1%), opaque Fe-Ti oxide phases (< 1%), and trace amounts of biotite. Microxenoliths (1-3 mm in size) were observed, contributing < 2% volume to the whole rock.
Plagioclase phenocrysts invariably show complex zoning, but can be roughly divided into four groups. Euhedral plagioclase (0.5-1 mm long) show fine oscillatory zoning as well as internal dissolution and overgrowth surfaces. They are invariably euhedral but show no sieve-textured zones or dissolution channeling. Sieve-texture mantled plagioclase (0.5-5 mm long) can either have an un-zoned anhedral or an oscillatory zoned core. This is mantled with a zone of fine sieve-textured plagioclase of variable width, then overgrown by an un-sieved rim that may be oscillatory zoned. Inclusion-rich zones were observed running parallel to the sieve-textured zones within the cores of larger phenocrysts. Sieve-cored plagioclase (0.3-1 mm long) contain a completely sieve-textured core overgrown (normally) with an oscillatory zoned rim. These are generally smaller than the sieve-texture mantled plagioclase; however, the thicker un-sieved rims suggest that they form a distinct group rather than being a smaller version of the above. Small euhedral lath shaped plagioclase (< 0.3 mm) are common in the groundmass.
Hornblende occurs as lozenge-shaped crystals 0.2-1.5 mm long. These are invariably rimmed by thick reaction zones dominated by opaque oxides. These reaction zones can sometimes completely replace the original phenocryst.
Rare euhedral crystals of clinopyroxene were observed as phenocrysts. Similar pyroxenes were observed both in clots (with plagioclase) and in microxenoliths. Opaque oxide phases were observed as euhedral to anhedral phenocrysts 0.2-0.3 mm in diameter but account for less than 1% of the whole rock. Trace amounts of biotite were also observed; similar biotite was seen in microxenoliths. Most microphenocrysts contained a microcrystalline mass dominated by opaque oxides. Where less altered examples survive, the mineralogy is dominated by subhedral plagioclase and euhedral clinopyroxene, the pyroxene often partially altered to biotite and oxide phases. Crystal faces on feldspar in contact with the groundmass show sieve-textured reaction mantles, which is absent on crystal faces internal to the microxenoliths.
Interpretation. The phenocryst assemblage of the lava sample suggests multiple phenocryst sources and disequilibrium between mineral phases and groundmass, typical of stratovolcanoes. The correspondence of some phenocryst phases with mineral phases in microxenoliths suggest that at least some of the phenocrysts were inherited during the assimilation of country rock, while the oscillatory zoning, sieve-textured cores and mantles, and multiple dissolution surfaces in feldspars indicates that other phenocrysts have undergone long and complex magmatic histories.
Setting and summit elevation. Taftan is in eastern Iran, 100 km SSE of the city of Zahedan and 50 km W of the Pakistan border. Several necks, representing erosional remnants of cinder cones, rise from the plain W from Taftan, as well as a second stratovolcano, Buzman (~ 3,500 m summit elevation), which remains largely unknown.
The summit elevation is listed in the Catalog of Active Volcanoes of the World (Gansser, 1964) as 4,050 m. Jean Sesiano found (presumably more current) Iranian maps with the volcanically active SE summit shown as 3,940 m, and the dissected NW summit, as 3,840 m.
Reference. Gansser, A., 1964, Catalog of the Active Volcanoes and Solfatara Fields of Iran; Rome, IAVCEI, part XVII-Appendix, p. 1-20.
Geologic Background. Taftan is a strongly eroded andesitic stratovolcano with two prominent summits. The volcano was constructed along the Makran-Chagai Arc in SE Iran. The higher SE summit cone has been the source of lava flows, as well as of highly active, sulfur-encrusted fumaroles. In January 1902 the volcano was reported to be smoking heavily for several days, with occasional strong night-time glow. A lava flow was reported in 1993, but may have been a mistaken observation of a molten sulfur flow. Despite these reports there is no clear evidence for Holocene activity. The youngest date obtained by Pang et al. (2014), using U-Pb on a zircon, was about 800 ka. Biabangard and Moradian (2008) obtained K-Ar dates around 700 ka.
Information Contacts: Jean Sesiano and George Morris, Earth Sciences Section, Mineralogy Dept, University of Geneva, 13 rue des Maraîchers, 1205 Genève, Switzerland