Recently Published Bulletin Reports
Ibu (Indonesia) Daily ash explosions continue, along with thermal anomalies in the crater, October 2022-May 2023
Dukono (Indonesia) Continuing ash emissions, SO2 plumes, and thermal signals during October 2022-May 2023
Sabancaya (Peru) Explosions, gas-and-ash plumes, and thermal activity persist during November 2022-April 2023
Sheveluch (Russia) Significant explosions destroyed part of the lava-dome complex during April 2023
Bezymianny (Russia) Explosions, ash plumes, lava flows, and avalanches during November 2022-April 2023
Chikurachki (Russia) New explosive eruption during late January-early February 2023
Marapi (Indonesia) New explosive eruption with ash emissions during January-March 2023
Kikai (Japan) Intermittent white gas-and-steam plumes, discolored water, and seismicity during May 2021-April 2023
Lewotolok (Indonesia) Strombolian eruption continues through April 2023 with intermittent ash plumes
Barren Island (India) Thermal activity during December 2022-March 2023
Villarrica (Chile) Nighttime crater incandescence, ash emissions, and seismicity during October 2022-March 2023
Fuego (Guatemala) Daily explosions, gas-and-ash plumes, avalanches, and ashfall during December 2022-March 2023
Ibu
Indonesia
1.488°N, 127.63°E; summit elev. 1325 m
All times are local (unless otherwise noted)
Daily ash explosions continue, along with thermal anomalies in the crater, October 2022-May 2023
Persistent eruptive activity since April 2008 at Ibu, a stratovolcano on Indonesian’s Halmahera Island, has consisted of daily explosive ash emissions and plumes, along with observations of thermal anomalies (BGVN 47:04). The current eruption continued during October 2022-May 2023, described below, based on advisories issued by the Pusat Vulkanologi dan Mitigasi Bencana Geologi (PVMBG, also known as Indonesian Center for Volcanology and Geological Hazard Mitigation, CVGHM), daily reports by MAGMA Indonesia (a PVMBG platform), and the Darwin Volcanic Ash Advisory Centre (VAAC), and various satellite data. The Alert Level during the reporting period remained at 2 (on a scale of 1-4), except raised briefly to 3 on 27 May, and the public was warned to stay at least 2 km away from the active crater and 3.5 km away on the N side of the volcano.
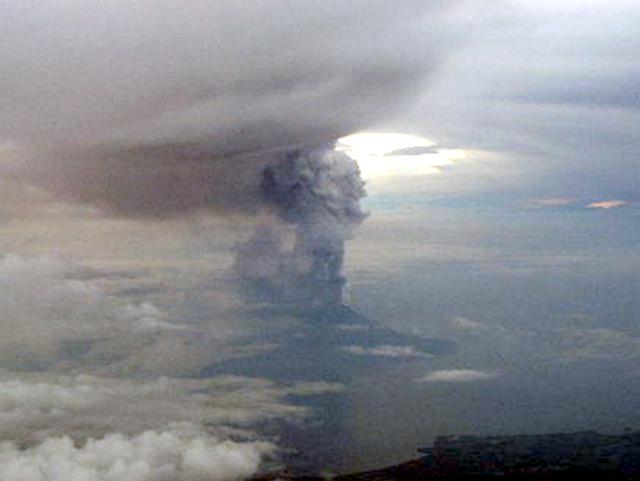
According to MAGMA Indonesia, during October 2022-May 2023, daily gray-and-white ash plumes of variable densities rose 200-1,000 m above the summit and drifted in multiple directions. On 30 October and 11 November, plumes rose a maximum of 2 km and 1.5 km above the summit, respectively (figures 42 and 43). According to the Darwin VAAC, discrete ash emissions on 13 November rose to 2.1 km altitude, or 800 m above the summit, and drifted W, and multiple ash emissions on 15 November rose 1.4 km above the summit and drifted NE. Occasional larger ash explosions through May 2023 prompted PVMBG to issue Volcano Observatory Notice for Aviation (VONA) alerts (table 6); the Aviation Color Code remained at Orange throughout this period.
Table 6. Volcano Observatory Notice for Aviation (VONA) ash plume alerts for Ibu issued by PVMBG during October 2022-May 2023. Maximum height above the summit was estimated by a ground observer. VONAs in January-May 2023 all described the ash plumes as dense.
| Date |
Time (local) |
Max height above summit |
Direction |
| 17 Oct 2022 |
0858 |
800 m |
SW |
| 18 Oct 2022 |
1425 |
800 m |
S |
| 19 Oct 2022 |
2017 |
600 m |
SW |
| 21 Oct 2022 |
0916 |
800 m |
NW |
| 16 Jan 2023 |
1959 |
600 m |
NE |
| 22 Jan 2023 |
0942 |
1,000 m |
E |
| 29 Jan 2023 |
2138 |
1,000 m |
E |
| 10 May 2023 |
0940 |
800 m |
NW |
| 10 May 2023 |
2035 |
600 m |
E |
| 21 May 2023 |
2021 |
600 m |
W |
| 21 May 2023 |
2140 |
1,000 m |
W |
| 29 May 2023 |
1342 |
800 m |
N |
| 31 May 2023 |
1011 |
1,000 m |
SW |
Sentinel-2 L1C satellite images throughout the reporting period show two, sometimes three persistent thermal anomalies in the summit crater, with the most prominent hotspot from the top of a cone within the crater. Clear views were more common during March-April 2023, when a vent and lava flows on the NE flank of the intra-crater cone could be distinguished (figure 44). White-to-grayish emissions were also observed during brief periods when weather clouds allowed clear views.
The MIROVA space-based volcano hotspot detection system recorded almost daily thermal anomalies throughout the reporting period, though cloud cover often interfered with detections. Data from imaging spectroradiometers aboard NASA’s Aqua and Terra satellites and processed using the MODVOLC algorithm (MODIS-MODVOLC) recorded hotspots on one day during October 2022 and December 2022, two days in April 2023, three days in November 2022 and May 2023, and four days in March 2023.
Geologic Background. The truncated summit of Gunung Ibu stratovolcano along the NW coast of Halmahera Island has large nested summit craters. The inner crater, 1 km wide and 400 m deep, has contained several small crater lakes. The 1.2-km-wide outer crater is breached on the N, creating a steep-walled valley. A large cone grew ENE of the summit, and a smaller one to the WSW has fed a lava flow down the W flank. A group of maars is located below the N and W flanks. The first observed and recorded eruption was a small explosion from the summit crater in 1911. Eruptive activity began again in December 1998, producing a lava dome that eventually covered much of the floor of the inner summit crater along with ongoing explosive ash emissions.
Information Contacts: Pusat Vulkanologi dan Mitigasi Bencana Geologi (PVMBG, also known as Indonesian Center for Volcanology and Geological Hazard Mitigation, CVGHM), Jalan Diponegoro 57, Bandung 40122, Indonesia (URL: http://www.vsi.esdm.go.id/); MAGMA Indonesia (Multiplatform Application for Geohazard Mitigation and Assessment in Indonesia), Kementerian Energi dan Sumber Daya Mineral (URL: https://magma.esdm.go.id/v1); Copernicus Browser, Copernicus Data Space Ecosystem, European Space Agency (URL: https://dataspace.copernicus.eu/browser/); MIROVA (Middle InfraRed Observation of Volcanic Activity), a collaborative project between the Universities of Turin and Florence (Italy) supported by the Centre for Volcanic Risk of the Italian Civil Protection Department (URL: http://www.mirovaweb.it/); Hawai'i Institute of Geophysics and Planetology (HIGP) - MODVOLC Thermal Alerts System, School of Ocean and Earth Science and Technology (SOEST), Univ. of Hawai'i, 2525 Correa Road, Honolulu, HI 96822, USA (URL: http://modis.higp.hawaii.edu/).
Dukono
Indonesia
1.6992°N, 127.8783°E; summit elev. 1273 m
All times are local (unless otherwise noted)
Continuing ash emissions, SO2 plumes, and thermal signals during October 2022-May 2023
Dukono, a remote volcano on Indonesia’s Halmahera Island, has been erupting continuously since 1933, with frequent ash explosions and sulfur dioxide plumes (BGVN 46:11, 47:10). This activity continued during October 2022 through May 2023, based on reports from the Pusat Vulkanologi dan Mitigasi Bencana Geologi (PVMBG; also known as Indonesian Center for Volcanology and Geological Hazard Mitigation, CVGHM), the Darwin Volcanic Ash Advisory Centre (VAAC), and satellite data. During this period, the Alert Level remained at 2 (on a scale of 1-4) and the public was warned to remain outside of the 2-km exclusion zone. The highest reported plume of the period reached 9.4 km above the summit on 14 November 2022.
According to MAGMA Indonesia (a platform developed by PVMBG), white, gray, or dark plumes of variable densities were observed almost every day during the reporting period, except when fog obscured the volcano (figure 33). Plumes generally rose 25-450 m above the summit, but rose as high as 700-800 m on several days, somewhat lower than the maximum heights reached earlier in 2022 when plumes reached as high as 1 km. However, the Darwin VAAC reported that on 14 November 2022, a discrete ash plume rose 9.4 km above the summit (10.7 km altitude), accompanied by a strong hotspot and a sulfur dioxide signal observed in satellite imagery; a continuous ash plume that day and through the 15th rose to 2.1-2.4 km altitude and drifted NE.
Sentinel-2 images were obscured by weather clouds almost every viewing day during the reporting period. However, the few reasonably clear images showed a hotspot and white or gray emissions and plumes. Strong SO2 plumes from Dukono were present on many days during October 2022-May 2023, as detected using the TROPOMI instrument on the Sentinel-5P satellite (figure 34).
Geologic Background. Reports from this remote volcano in northernmost Halmahera are rare, but Dukono has been one of Indonesia's most active volcanoes. More-or-less continuous explosive eruptions, sometimes accompanied by lava flows, have occurred since 1933. During a major eruption in 1550 CE, a lava flow filled in the strait between Halmahera and the N-flank Gunung Mamuya cone. This complex volcano presents a broad, low profile with multiple summit peaks and overlapping craters. Malupang Wariang, 1 km SW of the summit crater complex, contains a 700 x 570 m crater that has also been active during historical time.
Information Contacts: Pusat Vulkanologi dan Mitigasi Bencana Geologi (PVMBG, also known as Indonesian Center for Volcanology and Geological Hazard Mitigation, CVGHM), Jalan Diponegoro 57, Bandung 40122, Indonesia (URL: http://www.vsi.esdm.go.id/); MAGMA Indonesia (Multiplatform Application for Geohazard Mitigation and Assessment in Indonesia), Kementerian Energi dan Sumber Daya Mineral (URL: https://magma.esdm.go.id/v1); Darwin Volcanic Ash Advisory Centre (VAAC), Bureau of Meteorology, Northern Territory Regional Office, PO Box 40050, Casuarina, NT 0811, Australia (URL: http://www.bom.gov.au/info/vaac/); NASA Global Sulfur Dioxide Monitoring Page, Atmospheric Chemistry and Dynamics Laboratory, NASA Goddard Space Flight Center (NASA/GSFC), 8800 Greenbelt Road, Goddard, Maryland, USA (URL: https://so2.gsfc.nasa.gov/); Sentinel Hub Playground (URL: https://www.sentinel-hub.com/explore/sentinel-playground).
Sabancaya
Peru
15.787°S, 71.857°W; summit elev. 5960 m
All times are local (unless otherwise noted)
Explosions, gas-and-ash plumes, and thermal activity persist during November 2022-April 2023
Sabancaya is located in Peru, NE of Ampato and SE of Hualca Hualca. Eruptions date back to 1750 and have been characterized by explosions, phreatic activity, ash plumes, and ashfall. The current eruption period began in November 2016 and has more recently consisted of daily explosions, gas-and-ash plumes, and thermal activity (BGVN 47:11). This report updates activity during November 2022 through April 2023 using information from Instituto Geophysico del Peru (IGP) that use weekly activity reports and various satellite data.
Intermittent low-to-moderate power thermal anomalies were reported by the MIROVA project during November 2022 through April 2023 (figure 119). There were few short gaps in thermal activity during mid-December 2022, late December-to-early January 2023, late January to mid-February, and late February. According to data recorded by the MODVOLC thermal algorithm, there were a total of eight thermal hotspots: three in November 2022, three in February 2023, one in March, and one in April. On clear weather days, some of this thermal anomaly was visible in infrared satellite imagery showing the active lava dome in the summit crater (figure 120). Almost daily moderate-to-strong sulfur dioxide plumes were recorded during the reporting period by the TROPOMI instrument on the Sentinel-5P satellite (figure 121). Many of these plumes exceeded 2 Dobson Units (DU) and drifted in multiple directions.
IGP reported that moderate activity during November and December 2022 continued; during November, an average number of explosions were reported each week: 30, 33, 36, and 35, and during December, it was 32, 40, 47, 52, and 67. Gas-and-ash plumes in November rose 3-3.5 km above the summit and drifted E, NE, SE, S, N, W, and SW. During December the gas-and-ash plumes rose 2-4 km above the summit and drifted in different directions. There were 1,259 volcanic earthquakes recorded during November and 1,693 during December. Seismicity also included volcano-tectonic-type events that indicate rock fracturing events. Slight inflation was observed in the N part of the volcano near Hualca Hualca (4 km N). Thermal activity was frequently reported in the crater at the active lava dome (figure 120).
Explosive activity continued during January and February 2023. The average number of explosions were reported each week during January (51, 50, 60, and 59) and February (43, 54, 51, and 50). Gas-and-ash plumes rose 1.6-2.9 km above the summit and drifted NW, SW, and W during January and rose 1.4-2.8 above the summit and drifted W, SW, E, SE, N, S, NW, and NE during February. IGP also detected 1,881 volcanic earthquakes during January and 1,661 during February. VT-type earthquakes were also reported. Minor inflation persisted near Hualca Hualca. Satellite imagery showed continuous thermal activity in the crater at the lava dome (figure 120).
During March, the average number of explosions each week was 46, 48, 31, 35, and 22 and during April, it was 29, 41, 31, and 27. Accompanying gas-and-ash plumes rose 1.7-2.6 km above the summit crater and drifted W, SW, NW, S, and SE during March. According to a Buenos Aires Volcano Ash Advisory Center (VAAC) notice, on 22 March at 1800 through 23 March an ash plume rose to 7 km altitude and drifted NW. By 0430 an ash plume rose to 7.6 km altitude and drifted W. On 24 and 26 March continuous ash emissions rose to 7.3 km altitude and drifted SW and on 28 March ash emissions rose to 7.6 km altitude. During April, gas-and-ash plumes rose 1.6-2.5 km above the summit and drifted W, SW, S, NW, NE, and E. Frequent volcanic earthquakes were recorded, with 1,828 in March and 1,077 in April, in addition to VT-type events. Thermal activity continued to be reported in the summit crater at the lava dome (figure 120).
Geologic Background. Sabancaya, located in the saddle NE of Ampato and SE of Hualca Hualca volcanoes, is the youngest of these volcanic centers and the only one to have erupted in historical time. The oldest of the three, Nevado Hualca Hualca, is of probable late-Pliocene to early Pleistocene age. The name Sabancaya (meaning "tongue of fire" in the Quechua language) first appeared in records in 1595 CE, suggesting activity prior to that date. Holocene activity has consisted of Plinian eruptions followed by emission of voluminous andesitic and dacitic lava flows, which form an extensive apron around the volcano on all sides but the south. Records of historical eruptions date back to 1750.
Information Contacts: Instituto Geofisico del Peru (IGP), Centro Vulcanológico Nacional (CENVUL), Calle Badajoz N° 169 Urb. Mayorazgo IV Etapa, Ate, Lima 15012, Perú (URL: https://www.igp.gob.pe/servicios/centro-vulcanologico-nacional/inicio); Buenos Aires Volcanic Ash Advisory Center (VAAC), Servicio Meteorológico Nacional-Fuerza Aérea Argentina, 25 de mayo 658, Buenos Aires, Argentina (URL: http://www.smn.gov.ar/vaac/buenosaires/inicio.php); MIROVA (Middle InfraRed Observation of Volcanic Activity), a collaborative project between the Universities of Turin and Florence (Italy) supported by the Centre for Volcanic Risk of the Italian Civil Protection Department (URL: http://www.mirovaweb.it/); Hawai'i Institute of Geophysics and Planetology (HIGP) - MODVOLC Thermal Alerts System, School of Ocean and Earth Science and Technology (SOEST), Univ. of Hawai'i, 2525 Correa Road, Honolulu, HI 96822, USA (URL: http://modis.higp.hawaii.edu/); NASA Global Sulfur Dioxide Monitoring Page, Atmospheric Chemistry and Dynamics Laboratory, NASA Goddard Space Flight Center (NASA/GSFC), 8800 Greenbelt Road, Goddard MD 20771, USA (URL: https://so2.gsfc.nasa.gov/); Copernicus Browser, Copernicus Data Space Ecosystem, European Space Agency (URL: https://dataspace.copernicus.eu/browser/).
Sheveluch
Russia
56.653°N, 161.36°E; summit elev. 3283 m
All times are local (unless otherwise noted)
Significant explosions destroyed part of the lava-dome complex during April 2023
Sheveluch (also spelled Shiveluch) in Kamchatka, has had at least 60 large eruptions during the last 10,000 years. The summit is truncated by a broad 9-km-wide caldera that is breached to the S, and many lava domes occur on the outer flanks. The lava dome complex was constructed within the large open caldera. Frequent collapses of the dome complex have produced debris avalanches; the resulting deposits cover much of the caldera floor. A major south-flank collapse during a 1964 Plinian explosion produced a scarp in which a “Young Sheveluch” dome began to form in 1980. Repeated episodes of dome formation and destruction since then have produced major and minor ash plumes, pyroclastic flows, block-and-ash flows, and “whaleback domes” of spine-like extrusions in 1993 and 2020 (BGVN 45:11). The current eruption period began in August 1999 and has more recently consisted of lava dome growth, explosions, ash plumes, and avalanches (BGVN 48:01). This report covers a significant explosive eruption during early-to-mid-April 2023 that generated a 20 km altitude ash plume, produced a strong sulfur dioxide plume, and destroyed part of the lava-dome complex; activity described during January through April 2023 use information primarily from the Kamchatka Volcanic Eruptions Response Team (KVERT) and various satellite data.
Satellite data. Activity during the majority of this reporting period was characterized by continued lava dome growth, strong fumarole activity, explosions, and hot avalanches. According to the MODVOLC Thermal Alerts System, 140 hotspots were detected through the reporting period, with 33 recorded in January 2023, 29 in February, 44 in March, and 34 in April. Frequent strong thermal activity was recorded during January 2023 through April, according to the MIROVA (Middle InfraRed Observation of Volcanic Activity) graph and resulted from the continuously growing lava dome (figure 94). A slightly stronger pulse in thermal activity was detected in early-to-mid-April, which represented the significant eruption that destroyed part of the lava-dome complex. Thermal anomalies were also visible in infrared satellite imagery at the summit crater (figure 95).
During January 2023 KVERT reported continued growth of the lava dome, accompanied by strong fumarolic activity, incandescence from the lava dome, explosions, ash plumes, and avalanches. Satellite data showed a daily thermal anomaly over the volcano. Video data showed ash plumes associated with collapses at the dome that generated avalanches that in turn produced ash plumes rising to 3.5 km altitude and drifting 40 km W on 4 January and rising to 7-7.5 km altitude and drifting 15 km SW on 5 January. A gas-and-steam plume containing some ash that was associated with avalanches rose to 5-6 km altitude and extended 52-92 km W on 7 January. Explosions that same day produced ash plumes that rose to 7-7.5 km altitude and drifted 10 km W. According to a Volcano Observatory Notice for Aviation (VONA) issued at 1344 on 19 January, explosions produced an ash cloud that was 15 x 25 km in size and rose to 9.6-10 km altitude, drifting 21-25 km W; as a result, the Aviation Color Code (ACC) was raised to Red (the highest level on a four-color scale). Another VONA issued at 1635 reported that no more ash plumes were observed, and the ACC was lowered to Orange (the second highest level on a four-color scale). On 22 January an ash plume from collapses and avalanches rose to 5 km altitude and drifted 25 km NE and SW; ash plumes associated with collapses extended 70 km NE on 27 and 31 January.
Lava dome growth, fumarolic activity, dome incandescence, and occasional explosions and avalanches continued during February and March. A daily thermal anomaly was visible in satellite data. Explosions on 1 February generated ash plumes that rose to 6.3-6.5 km altitude and extended 15 km NE. Video data showed an ash cloud from avalanches rising to 5.5 km altitude and drifting 5 km SE on 2 February. Satellite data showed gas-and-steam plumes containing some ash rose to 5-5.5 km altitude and drifted 68-110 km ENE and NE on 6 February, to 4.5-5 km altitude and drifted 35 km WNW on 22 February, and to 3.7-4 km altitude and drifted 47 km NE on 28 February. Scientists from the Kamchatka Volcanological Station (KVS) went on a field excursion on 25 February to document the growing lava dome, and although it was cloudy most of the day, nighttime incandescence was visible. Satellite data showed an ash plume extending up to 118 km E during 4-5 March. Video data from 1150 showed an ash cloud from avalanches rose to 3.7-5.5 km altitude and drifted 5-10 km ENE and E on 5 March. On 11 March an ash plume drifted 62 km E. On 27 March ash plumes rose to 3.5 km altitude and drifted 100 km E. Avalanches and constant incandescence at the lava dome was focused on the E and NE slopes on 28 March. A gas-and-steam plume containing some ash rose to 3.5 km altitude and moved 40 km E on 29 March. Ash plumes on 30 March rose to 3.5-3.7 km altitude and drifted 70 km NE.
Similar activity continued during April, with lava dome growth, strong fumarolic activity, incandescence in the dome, occasional explosions, and avalanches. A thermal anomaly persisted throughout the month. During 1-4 April weak ash plumes rose to 2.5-3 km altitude and extended 13-65 km SE and E.
Activity during 11 April 2023. The Institute of Volcanology and Seismology, Far Eastern Branch, Russian Academy of Sciences (IVS FEB RAS) reported a significant increase in seismicity around 0054 on 11 April, as reported by strong explosions detected on 11 April beginning at 0110 that sent ash plumes up to 7-10 km altitude and extended 100-435 km W, WNW, NNW, WSW, and SW. According to a Tokyo VAAC report the ash plume rose to 15.8 km altitude. By 0158 the plume extended over a 75 x 100 km area. According to an IVS FEB RAS report, the eruptive column was not vertical: the initial plume at 0120 on 11 April deviated to the NNE, at 0000 on 12 April, it drifted NW, and by 1900 it drifted SW. KVS reported that significant pulses of activity occurred at around 0200, 0320, and then a stronger phase around 0600. Levin Dmitry took a video from near Békés (3 km away) at around 0600 showing a rising plume; he also reported that a pyroclastic flow traveled across the road behind him as he left the area. According to IVS FEB RAS, the pyroclastic flow traveled several kilometers SSE, stopping a few hundred meters from a bridge on the road between Klyuchi and Petropavlovsk-Kamchatsky.
Ashfall was first observed in Klyuchi (45 km SW) at 0630, and a large, black ash plume blocked light by 0700. At 0729 KVERT issued a Volcano Observatory Notice for Aviation (VONA) raising the Aviation Color Code to Red (the highest level on a four-color scale). It also stated that a large ash plume had risen to 10 km altitude and drifted 100 km W. Near-constant lightning strikes were reported in the plume and sounds like thunderclaps were heard until about 1000. According to IVS FEB RAS the cloud was 200 km long and 76 km wide by 0830, and was spreading W at altitudes of 6-12 km. In the Klyuchi Village, the layer of both ash and snow reached 8.5 cm (figure 96); ashfall was also reported in Kozyrevsk (112 km SW) at 0930, Mayskoye, Anavgay, Atlasovo, Lazo, and Esso. Residents in Klyuchi reported continued darkness and ashfall at 1100. In some areas, ashfall was 6 cm deep and some residents reported dirty water coming from their plumbing. According to IVS FEB RAS, an ash cloud at 1150 rose to 5-20 km altitude and was 400 km long and 250 km wide, extending W. A VONA issued at 1155 reported that ash had risen to 10 km and drifted 340 km NNW and 240 km WSW. According to Simon Carn (Michigan Technological University), about 0.2 Tg of sulfur dioxide in the plume was measured in a satellite image from the TROPOMI instrument on the Sentinel-5P satellite acquired at 1343 that covered an area of about 189,000 km2 (figure 97). Satellite data at 1748 showed an ash plume that rose to 8 km altitude and drifted 430 km WSW and S, according to a VONA.
Activity during 12-15 April 2023. On 12 April at 0730 satellite images showed ash plumes rose to 7-8 km altitude and extended 600 km SW, 1,050 km ESE, and 1,300-3,000 km E. By 1710 that day, the explosions weakened. According to news sources, the ash-and-gas plumes drifted E toward the Aleutian Islands and reached the Gulf of Alaska by 13 April, causing flight disruptions. More than 100 flights involving Alaska airspace were cancelled due to the plume. Satellite data showed ash plumes rising to 4-5.5 km altitude and drifted 400-415 km SE and ESE on 13 April. KVS volcanologists observed the pyroclastic flow deposits and noted that steam rose from downed, smoldering trees. They also noted that the deposits were thin with very few large fragments, which differed from previous flows. The ash clouds traveled across the Pacific Ocean. Flight cancellations were also reported in NW Canada (British Columbia) during 13-14 April. During 14-15 April ash plumes rose to 6 km altitude and drifted 700 km NW.
Alaskan flight schedules were mostly back to normal by 15 April, with only minor delays and far less cancellations; a few cancellations continued to be reported in Canada. Clear weather on 15 April showed that most of the previous lava-dome complex was gone and a new crater roughly 1 km in diameter was observed (figure 98); gas-and-steam emissions were rising from this crater. Evidence suggested that there had been a directed blast to the SE, and pyroclastic flows traveled more than 20 km. An ash plume rose to 4.5-5.2 km altitude and drifted 93-870 km NW on 15 April.
Activity during 16-30 April 2023. Resuspended ash was lifted by the wind from the slopes and rose to 4 km altitude and drifted 224 km NW on 17 April. KVERT reported a plume of resuspended ash from the activity during 10-13 April on 19 April that rose to 3.5-4 km altitude and drifted 146-204 km WNW. During 21-22 April a plume stretched over the Scandinavian Peninsula. A gas-and-steam plume containing some ash rose to 3-3.5 km altitude and drifted 60 km SE on 30 April. A possible new lava dome was visible on the W slope of the volcano on 29-30 April (figure 99); satellite data showed two thermal anomalies, a bright one over the existing lava dome and a weaker one over the possible new one.
References. Girina, O., Loupian, E., Horvath, A., Melnikov, D., Manevich, A., Nuzhdaev, A., Bril, A., Ozerov, A., Kramareva, L., Sorokin, A., 2023, Analysis of the development of the paroxysmal eruption of Sheveluch volcano on April 10–13, 2023, based on data from various satellite systems, ??????????? ???????? ??? ?? ???????, 20(2).
Geologic Background. The high, isolated massif of Sheveluch volcano (also spelled Shiveluch) rises above the lowlands NNE of the Kliuchevskaya volcano group. The 1,300 km3 andesitic volcano is one of Kamchatka's largest and most active volcanic structures, with at least 60 large eruptions during the Holocene. The summit of roughly 65,000-year-old Stary Shiveluch is truncated by a broad 9-km-wide late-Pleistocene caldera breached to the south. Many lava domes occur on its outer flanks. The Molodoy Shiveluch lava dome complex was constructed during the Holocene within the large open caldera; Holocene lava dome extrusion also took place on the flanks of Stary Shiveluch. Widespread tephra layers from these eruptions have provided valuable time markers for dating volcanic events in Kamchatka. Frequent collapses of dome complexes, most recently in 1964, have produced debris avalanches whose deposits cover much of the floor of the breached caldera.
Information Contacts: Kamchatka Volcanic Eruptions Response Team (KVERT), Far Eastern Branch, Russian Academy of Sciences, 9 Piip Blvd., Petropavlovsk-Kamchatsky, 683006, Russia (URL: http://www.kscnet.ru/ivs/kvert/); Institute of Volcanology and Seismology, Far Eastern Branch, Russian Academy of Sciences (IVS FEB RAS), 9 Piip Blvd., Petropavlovsk-Kamchatsky 683006, Russia (URL: http://www.kscnet.ru/ivs/eng/); Kamchatka Volcanological Station, Kamchatka Branch of Geophysical Survey, (KB GS RAS), Klyuchi, Kamchatka Krai, Russia (URL: http://volkstat.ru/); Hawai'i Institute of Geophysics and Planetology (HIGP) - MODVOLC Thermal Alerts System, School of Ocean and Earth Science and Technology (SOEST), Univ. of Hawai'i, 2525 Correa Road, Honolulu, HI 96822, USA (URL: http://modis.higp.hawaii.edu/); MIROVA (Middle InfraRed Observation of Volcanic Activity), a collaborative project between the Universities of Turin and Florence (Italy) supported by the Centre for Volcanic Risk of the Italian Civil Protection Department (URL: http://www.mirovaweb.it/); Copernicus Browser, Copernicus Data Space Ecosystem, European Space Agency (URL: https://dataspace.copernicus.eu/browser/); Kam 24 News Agency, 683032, Kamchatka Territory, Petropavlovsk-Kamchatsky, Vysotnaya St., 2A (URL: https://kam24.ru/news/main/20230411/96657.html#.Cj5Jrky6.dpuf); Simon Carn, Geological and Mining Engineering and Sciences, Michigan Technological University, 1400 Townsend Drive, Houghton, MI 49931, USA (URL: http://www.volcarno.com/, Twitter: @simoncarn).
Bezymianny
Russia
55.972°N, 160.595°E; summit elev. 2882 m
All times are local (unless otherwise noted)
Explosions, ash plumes, lava flows, and avalanches during November 2022-April 2023
Bezymianny is located on the Kamchatka Peninsula of Russia as part of the Klyuchevskoy volcano group. Historic eruptions began in 1955 and have been characterized by dome growth, explosions, pyroclastic flows, ash plumes, and ashfall. During the 1955-56 eruption a large open crater was formed by collapse of the summit and an associated lateral blast. Subsequent episodic but ongoing lava-dome growth, accompanied by intermittent explosive activity and pyroclastic flows, has largely filled the 1956 crater. The current eruption period began in December 2016 and more recent activity has consisted of strong explosions, ash plumes, and thermal activity (BGVN 47:11). This report covers activity during November 2022 through April 2023, based on weekly and daily reports from the Kamchatka Volcano Eruptions Response Team (KVERT) and satellite data.
Activity during November and March 2023 was relatively low and mostly consisted of gas-and-steam emissions, occasional small collapses that generated avalanches along the lava dome slopes, and a persistent thermal anomaly over the volcano that was observed in satellite data on clear weather days. According to the Tokyo VAAC and KVERT, an explosion produced an ash plume that rose to 6 km altitude and drifted 25 km NE at 1825 on 29 March.
Gas-and-steam emissions, collapses generating avalanches, and thermal activity continued during April. According to two Volcano Observatory Notice for Aviation (VONA) issued on 2 and 6 April (local time) ash plumes rose to 3 km and 3.5-3.8 km altitude and drifted 35 km E and 140 km E, respectively. Satellite data from KVERT showed weak ash plumes extending up to 550 km E on 2 and 5-6 April.
A VONA issued at 0843 on 7 April described an ash plume that rose to 4.5-5 km altitude and drifted 250 km ESE. Later that day at 1326 satellite data showed an ash plume that rose to 5.5-6 km altitude and drifted 150 km ESE. A satellite image from 1600 showed an ash plume extending as far as 230 km ESE; KVERT noted that ash emissions were intensifying, likely due to avalanches from the growing lava dome. The Aviation Color Code (ACC) was raised to Red (the highest level on a four-color scale). At 1520 satellite data showed an ash plume rising to 5-5.5 km altitude and drifting 230 km ESE. That same day, Kamchatka Volcanological Station (KVS) volcanologists traveled to Ambon to collect ash; they reported that a notable eruption began at 1730, and within 20 minutes a large ash plume rose to 10 km altitude and drifted NW. KVERT reported that the strong explosive phase began at 1738. Video and satellite data taken at 1738 showed an ash plume that rose to 10-12 km altitude and drifted up to 2,800 km SE and E. Explosions were clearly audible 20 km away for 90 minutes, according to KVS. Significant amounts of ash fell at the Apakhonchich station, which turned the snow gray; ash continued to fall until the morning of 8 April. In a VONA issued at 0906 on 8 April, KVERT stated that the explosive eruption had ended; ash plumes had drifted 2,000 km E. The ACC was lowered to Orange (the third highest level on a four-color scale). The KVS team saw a lava flow on the active dome once the conditions were clear that same day (figure 53). On 20 April lava dome extrusion was reported; lava flows were noted on the flanks of the dome, and according to KVERT satellite data, a thermal anomaly was observed in the area. The ACC was lowered to Yellow (the second lowest on a four-color scale).
Satellite data showed an increase in thermal activity beginning in early April 2023. A total of 31 thermal hotspots were detected by the MODVOLC thermal algorithm on 4, 5, 7, and 12 April 2023. The elevated thermal activity resulted from an increase in explosive activity and the start of an active lava flow. The MIROVA (Middle InfraRed Observation of Volcanic Activity) volcano hotspot detection system based on the analysis of MODIS data also showed a pulse in thermal activity during the same time (figure 54). Infrared satellite imagery captured a continuous thermal anomaly at the summit crater, often accompanied by white gas-and-steam emissions (figure 55). On 4 April 2023 an active lava flow was observed descending the SE flank.
Geologic Background. The modern Bezymianny, much smaller than its massive neighbors Kamen and Kliuchevskoi on the Kamchatka Peninsula, was formed about 4,700 years ago over a late-Pleistocene lava-dome complex and an edifice built about 11,000-7,000 years ago. Three periods of intensified activity have occurred during the past 3,000 years. The latest period, which was preceded by a 1,000-year quiescence, began with the dramatic 1955-56 eruption. This eruption, similar to that of St. Helens in 1980, produced a large open crater that was formed by collapse of the summit and an associated lateral blast. Subsequent episodic but ongoing lava-dome growth, accompanied by intermittent explosive activity and pyroclastic flows, has largely filled the 1956 crater.
Information Contacts: Kamchatka Volcanic Eruptions Response Team (KVERT), Far Eastern Branch, Russian Academy of Sciences, 9 Piip Blvd., Petropavlovsk-Kamchatsky, 683006, Russia (URL: http://www.kscnet.ru/ivs/kvert/); Kamchatka Volcanological Station, Kamchatka Branch of Geophysical Survey, (KB GS RAS), Klyuchi, Kamchatka Krai, Russia (URL: http://volkstat.ru/); Hawai'i Institute of Geophysics and Planetology (HIGP) - MODVOLC Thermal Alerts System, School of Ocean and Earth Science and Technology (SOEST), Univ. of Hawai'i, 2525 Correa Road, Honolulu, HI 96822, USA (URL: http://modis.higp.hawaii.edu/); MIROVA (Middle InfraRed Observation of Volcanic Activity), a collaborative project between the Universities of Turin and Florence (Italy) supported by the Centre for Volcanic Risk of the Italian Civil Protection Department (URL: http://www.mirovaweb.it/); Copernicus Browser, Copernicus Data Space Ecosystem, European Space Agency (URL: https://dataspace.copernicus.eu/browser/).
Chikurachki
Russia
50.324°N, 155.461°E; summit elev. 1781 m
All times are local (unless otherwise noted)
New explosive eruption during late January-early February 2023
Chikurachki, located on Paramushir Island in the northern Kuriles, has had Plinian eruptions during the Holocene. Lava flows have reached the sea and formed capes on the NW coast; several young lava flows are also present on the E flank beneath a scoria deposit. Reported eruptions date back to 1690, with the most recent eruption period occurring during January through October 2022, characterized by occasional explosions, ash plumes, and thermal activity (BGVN 47:11). This report covers a new eruptive period during January through February 2023 that consisted of ash explosions and ash plumes, based on information from the Kamchatka Volcanic Eruptions Response Team (KVERT) and satellite data.
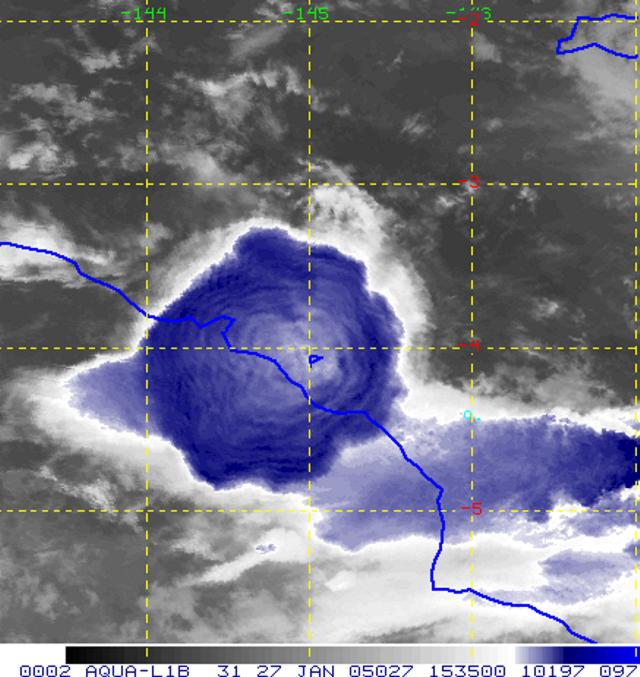
According to reports from KVERT, an explosive eruption began around 0630 on 29 January. Explosions generated ash plumes that rose to 3-3.5 km altitude and drifted 6-75 km SE and E, based on satellite data. As a result, the Aviation Color Code (ACC) was raised to Orange (the second highest level on a four-color scale). At 1406 and 1720 ash plumes were identified in satellite images that rose to 4.3 km altitude and extended 70 km E. By 2320 the ash plume had dissipated. A thermal anomaly was visible at the volcano on 31 January, according to a satellite image, and an ash plume was observed drifting 66 km NE.
Occasional explosions and ash plumes continued during early February. At 0850 on 1 February an ash plume rose to 3.5 km altitude and drifted 35 km NE. Satellite data showed an ash plume that rose to 3.2-3.5 km altitude and drifted 50 km NE at 1222 later that day (figure 22). A thermal anomaly was detected over the volcano during 5-6 February and ash plumes drifted as far as 125 km SE, E, and NE. Explosive events were reported at 0330 on 6 February that produced ash plumes rising to 4-4.5 km altitude and drifting 72-90 km N, NE, and ENE. KVERT noted that the last gas-and steam plume that contained some ash was observed on 8 February and drifted 55 km NE before the explosive eruption ended. The ACC was lowered to Yellow and then Green (the lowest level on a four-color scale) on 18 February.
Geologic Background. Chikurachki, the highest volcano on Paramushir Island in the northern Kuriles, is a relatively small cone constructed on a high Pleistocene edifice. Oxidized basaltic-to-andesitic scoria deposits covering the upper part of the young cone give it a distinctive red color. Frequent basaltic Plinian eruptions have occurred during the Holocene. Lava flows have reached the sea and formed capes on the NW coast; several young lava flows are also present on the E flank beneath a scoria deposit. The Tatarinov group of six volcanic centers is located immediately to the south, and the Lomonosov cinder cone group, the source of an early Holocene lava flow that reached the saddle between it and Fuss Peak to the west, lies at the southern end of the N-S-trending Chikurachki-Tatarinov complex. In contrast to the frequently active Chikurachki, the Tatarinov centers are extensively modified by erosion and have a more complex structure. Tephrochronology gives evidence of an eruption around 1690 CE from Tatarinov, although its southern cone contains a sulfur-encrusted crater with fumaroles that were active along the margin of a crater lake until 1959.
Information Contacts: Kamchatka Volcanic Eruptions Response Team (KVERT), Far East Division, Russian Academy of Sciences, 9 Piip Blvd., Petropavlovsk-Kamchatsky, 683006, Russia (URL: http://www.kscnet.ru/ivs/); Copernicus Browser, Copernicus Data Space Ecosystem, European Space Agency (URL: https://dataspace.copernicus.eu/browser/).
Marapi
Indonesia
0.38°S, 100.474°E; summit elev. 2885 m
All times are local (unless otherwise noted)
New explosive eruption with ash emissions during January-March 2023
Marapi in Sumatra, Indonesia, is a massive stratovolcano that rises 2 km above the Bukittinggi Plain in the Padang Highlands. A broad summit contains multiple partially overlapping summit craters constructed within the small 1.4-km-wide Bancah caldera and trending ENE-WSW, with volcanism migrating to the west. Since the end of the 18th century, more than 50 eruptions, typically characterized by small-to-moderate explosive activity, have been recorded. The previous eruption consisted of two explosions during April-May 2018, which caused ashfall to the SE (BGVN 43:06). This report covers a new eruption during January-March 2023, which included explosive events and ash emissions, as reported by Pusat Vulkanologi dan Mitigasi Bencana Geologi (PVMBG, also known as Indonesian Center for Volcanology and Geological Hazard Mitigation, CVGHM) and MAGMA Indonesia.
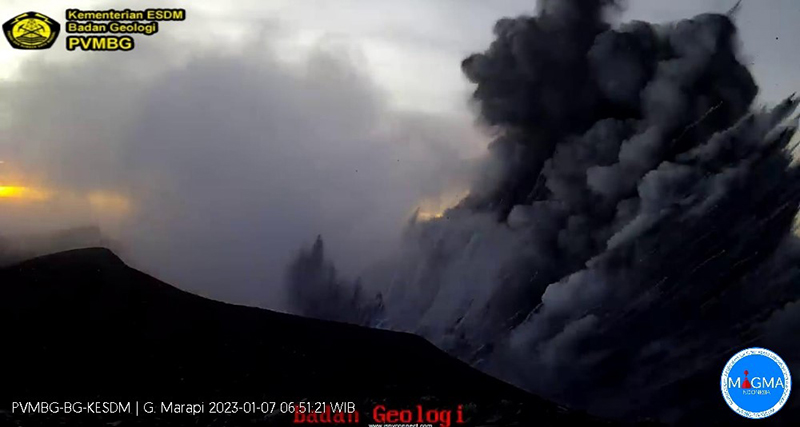
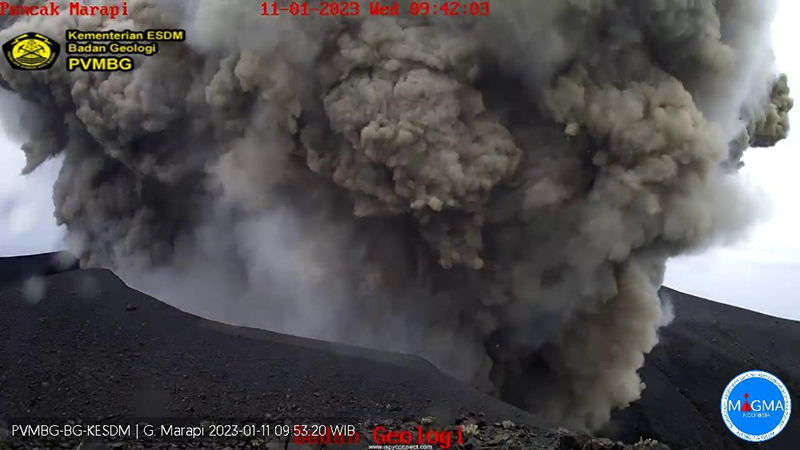
According to a press release issued by PVMBG and MAGMA Indonesia on 26 December, primary volcanic activity at Marapi consisted of white gas-and-steam puffs that rose 500-100 m above the summit during April-December 2022. On 25 December 2022 there was an increase in the number of deep volcanic earthquakes and summit inflation. White gas-and-steam emissions rose 80-158 m above the summit on 5 January. An explosive eruption began at 0611 on 7 January 2023, which generated white gas-and-steam emissions and gray ash emissions mixed with ejecta that rose 300 m above the summit and drifted SE (figure 10). According to ground observations, white-to-gray ash clouds during 0944-1034 rose 200-250 m above the summit and drifted SE and around 1451 emissions rose 200 m above the summit. Seismic signals indicated that eruptive events also occurred at 1135, 1144, 1230, 1715, and 1821, but no ash emissions were visually observed. On 8 January white-and-gray emissions rose 150-250 m above the summit that drifted E and SE. Seismic signals indicated eruptive events at 0447, 1038, and 1145, but again no ash emissions were visually observed on 8 January. White-to-gray ash plumes continued to be observed on clear weather days during 9-15, 18-21, 25, and 29-30 January, rising 100-1,000 m above the summit and drifted generally NE, SE, N, and E, based on ground observations (figure 11).
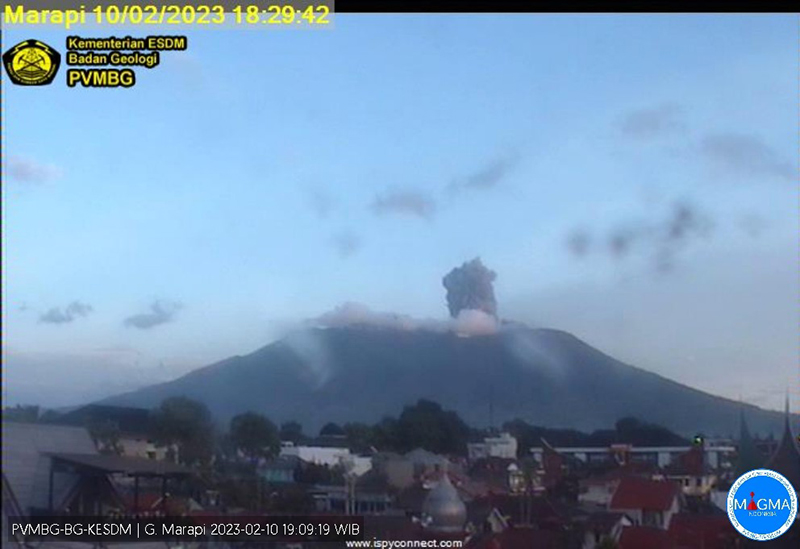
White-and-gray and brown emissions persisted in February, rising 50-500 m above the summit and drifting E, S, SW, N, NE, and W, though weather sometimes prevented clear views of the summit. An eruption at 1827 on 10 February produced a black ash plume that rose 400 m above the summit and drifted NE and E (figure 12). Similar activity was reported on clear weather days, with white gas-and-steam emissions rising 50 m above the summit on 9, 11-12, 20, and 27 March and drifted E, SE, SW, NE, E, and N. On 17 March white-and-gray emissions rose 400 m above the summit and drifted N and E.
Geologic Background. Gunung Marapi, not to be confused with the better-known Merapi volcano on Java, is Sumatra's most active volcano. This massive complex stratovolcano rises 2,000 m above the Bukittinggi Plain in the Padang Highlands. A broad summit contains multiple partially overlapping summit craters constructed within the small 1.4-km-wide Bancah caldera. The summit craters are located along an ENE-WSW line, with volcanism migrating to the west. More than 50 eruptions, typically consisting of small-to-moderate explosive activity, have been recorded since the end of the 18th century; no lava flows outside the summit craters have been reported in historical time.
Information Contacts: Pusat Vulkanologi dan Mitigasi Bencana Geologi (PVMBG, also known as Indonesian Center for Volcanology and Geological Hazard Mitigation, CVGHM), Jalan Diponegoro 57, Bandung 40122, Indonesia (URL: http://www.vsi.esdm.go.id/); MAGMA Indonesia, Kementerian Energi dan Sumber Daya Mineral (URL: https://magma.esdm.go.id/v1).
Kikai
Japan
30.793°N, 130.305°E; summit elev. 704 m
All times are local (unless otherwise noted)
Intermittent white gas-and-steam plumes, discolored water, and seismicity during May 2021-April 2023
Kikai, located just S of the Ryukyu islands of Japan, contains a 19-km-wide mostly submarine caldera. The island of Satsuma Iwo Jima (also known as Satsuma-Iwo Jima and Tokara Iojima) is located at the NW caldera rim, as well as the island’s highest peak, Iodake. Its previous eruption period occurred on 6 October 2020 and was characterized by an explosion and thermal anomalies in the crater (BGVN 45:11). More recent activity has consisted of intermittent thermal activity and gas-and-steam plumes (BGVN 46:06). This report covers similar low-level activity including white gas-and-steam plumes, nighttime incandescence, seismicity, and discolored water during May 2021 through April 2023, using information from the Japan Meteorological Agency (JMA) and various satellite data. During this time, the Alert Level remained at a 2 (on a 5-level scale), according to JMA.
Activity was relatively low throughout the reporting period and has consisted of intermittent white gas-and-steam emissions that rose 200-1,400 m above the Iodake crater and nighttime incandescence was observed at the Iodake crater using a high-sensitivity surveillance camera. Each month, frequent volcanic earthquakes were detected, and sulfur dioxide masses were measured by the University of Tokyo Graduate School of Science, Kyoto University Disaster Prevention Research Institute, Mishima Village, and JMA (table 6).
Table 6. Summary of gas-and-steam plume heights, number of volcanic earthquakes detected, and amount of sulfur dioxide emissions in tons per day (t/d). Courtesy of JMA monthly reports.
| Month |
Max plume height (m) |
Volcanic earthquakes |
Sulfur dioxide emissions (t/d) |
| May 2021 |
400 |
162 |
900-1,300 |
| Jun 2021 |
800 |
117 |
500 |
| Jul 2021 |
1,400 |
324 |
800-1,500 |
| Aug 2021 |
1,000 |
235 |
700-1,000 |
| Sep 2021 |
800 |
194 |
500-1,100 |
| Oct 2021 |
800 |
223 |
600-800 |
| Nov 2021 |
900 |
200 |
400-900 |
| Dec 2021 |
1,000 |
161 |
500-1,800 |
| Jan 2022 |
1,000 |
164 |
600-1,100 |
| Feb 2022 |
1,000 |
146 |
500-1,600 |
| Mar 2022 |
1,200 |
171 |
500-1,200 |
| Apr 2022 |
1,000 |
144 |
600-1,000 |
| May 2022 |
1,200 |
126 |
300-500 |
| Jun 2022 |
1,000 |
154 |
400 |
| Jul 2022 |
1,300 |
153 |
600-1,100 |
| Aug 2022 |
1,100 |
109 |
600-1,500 |
| Sep 2022 |
1,000 |
170 |
900 |
| Oct 2022 |
800 |
249 |
700-1,200 |
| Nov 2022 |
800 |
198 |
800-1,200 |
| Dec 2022 |
700 |
116 |
600-1,500 |
| Jan 2023 |
800 |
146 |
500-1,400 |
| Feb 2023 |
800 |
135 |
600-800 |
| Mar 2023 |
1,100 |
94 |
500-600 |
| Apr 2023 |
800 |
82 |
500-700 |
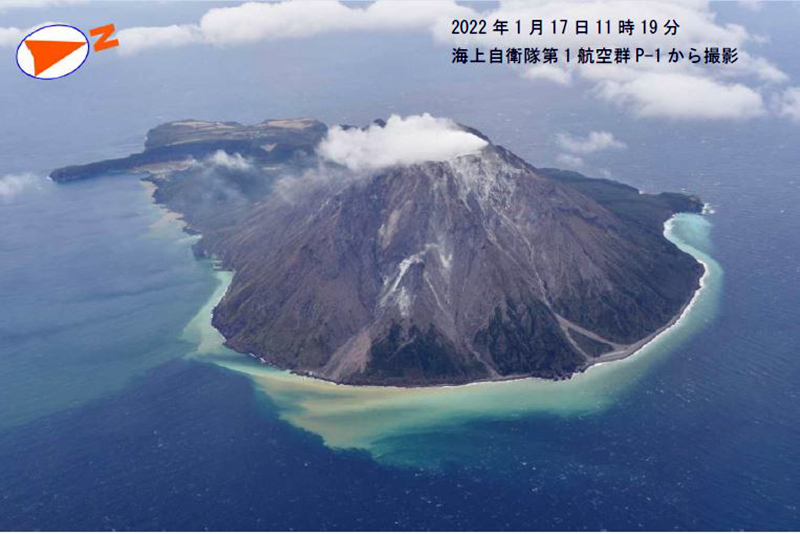
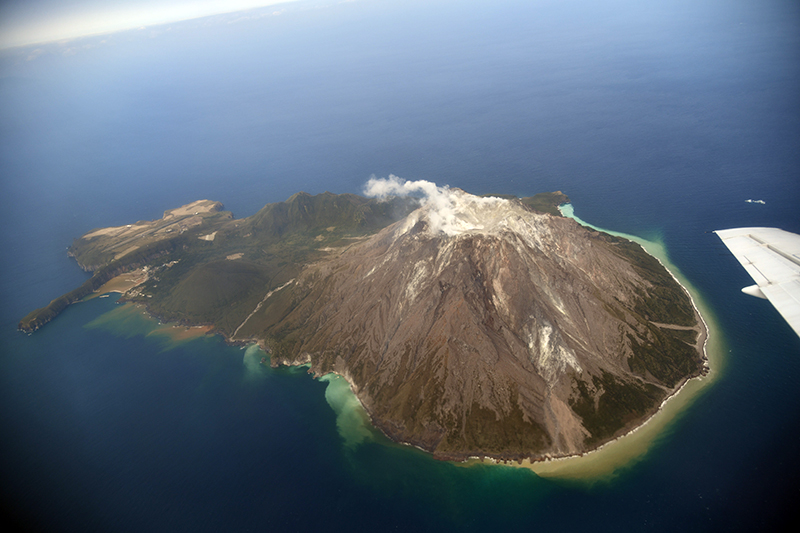
Sentinel-2 satellite images show weak thermal anomalies at the Iodake crater on clear weather days, accompanied by white gas-and-steam emissions and occasional discolored water (figure 24). On 17 January 2022 JMA conducted an aerial overflight in cooperation with the Japan Maritime Self-Defense Force’s 1st Air Group, which confirmed a white gas-and-steam plume rising from the Iodake crater (figure 25). They also observed plumes from fumaroles rising from around the crater and on the E, SW, and N slopes. In addition, discolored water was reported near the coast around Iodake, which JMA stated was likely related to volcanic activity (figure 25). Similarly, an overflight taken on 11 January 2023 showed white gas-and-steam emissions rising from the Iodake crater, as well as discolored water that spread E from the coast around the island. On 14 February 2023 white fumaroles and discolored water were also captured during an overflight (figure 26).
Geologic Background. Multiple eruption centers have exhibited recent activity at Kikai, a mostly submerged, 19-km-wide caldera near the northern end of the Ryukyu Islands south of Kyushu. It was the source of one of the world's largest Holocene eruptions about 6,300 years ago when rhyolitic pyroclastic flows traveled across the sea for a total distance of 100 km to southern Kyushu, and ashfall reached the northern Japanese island of Hokkaido. The eruption devastated southern and central Kyushu, which remained uninhabited for several centuries. Post-caldera eruptions formed Iodake (or Iwo-dake) lava dome and Inamuradake scoria cone, as well as submarine lava domes. Recorded eruptions have occurred at or near Satsuma-Iojima (also known as Tokara-Iojima), a small 3 x 6 km island forming part of the NW caldera rim. Showa-Iojima lava dome (also known as Iojima-Shinto), a small island 2 km E of Satsuma-Iojima, was formed during submarine eruptions in 1934 and 1935. Mild-to-moderate explosive eruptions have occurred during the past few decades from Iodake, a rhyolitic lava dome at the eastern end of Satsuma-Iojima.
Information Contacts: Japan Meteorological Agency (JMA), Otemachi, 1-3-4, Chiyoda-ku Tokyo 100-8122, Japan (URL: http://www.jma.go.jp/jma/indexe.html); Japan Coast Guard (JCG) Volcano Database, Hydrographic and Oceanographic Department, 3-1-1, Kasumigaseki, Chiyoda-ku, Tokyo 100-8932, Japan (URL: https://www1.kaiho.mlit.go.jp/kaiikiDB/kaiyo30-2.htm); Copernicus Browser, Copernicus Data Space Ecosystem, European Space Agency (URL: https://dataspace.copernicus.eu/browser/).
Lewotolok (Indonesia) — May 2023  Cite this Report
Lewotolok
Indonesia
8.274°S, 123.508°E; summit elev. 1431 m
All times are local (unless otherwise noted)
Strombolian eruption continues through April 2023 with intermittent ash plumes
The current eruption at Lewotolok, in Indonesian’s Lesser Sunda Islands, began in late November 2020 and has included Strombolian explosions, occasional ash plumes, incandescent ejecta, intermittent thermal anomalies, and persistent white and white-and-gray emissions (BGVN 47:10). Similar activity continued during October 2022-April 2023, as described in this report based on information provided by Pusat Vulkanologi dan Mitigasi Bencana Geologi (PVMBG, also known as CVGHM, or the Center of Volcanology and Geological Hazard Mitigation), MAGMA Indonesia, the Darwin Volcanic Ash Advisory Centre (VAAC), and satellite data.
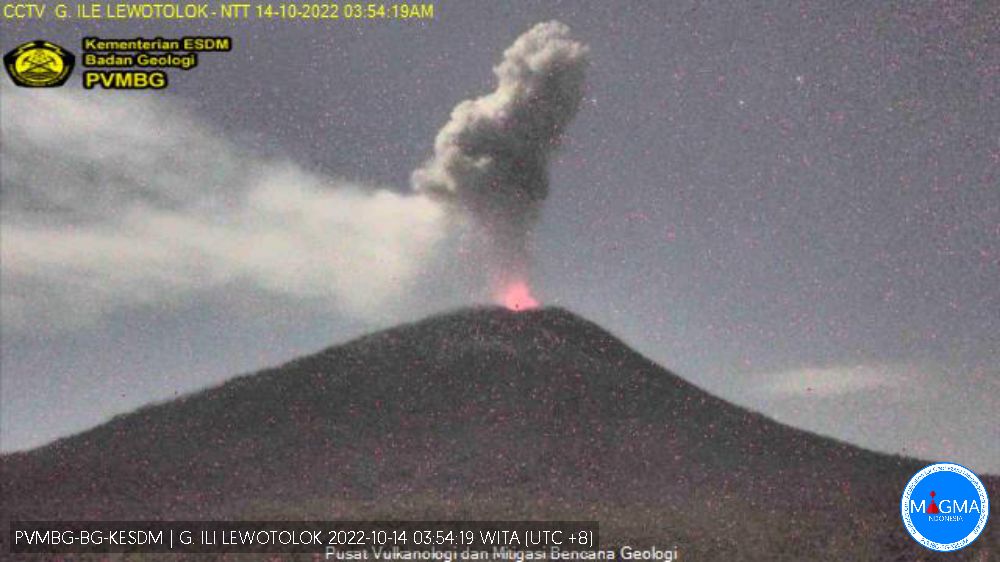
During most days in October 2022 white and white-gray emissions rose as high as 200-600 m above the summit. Webcam images often showed incandescence above the crater rim. At 0351 on 14 October, an explosion produced a dense ash plume that rose about 1.2 km above the summit and drifted SW (figure 43). After this event, activity subsided and remained low through the rest of the year, but with almost daily white emissions.
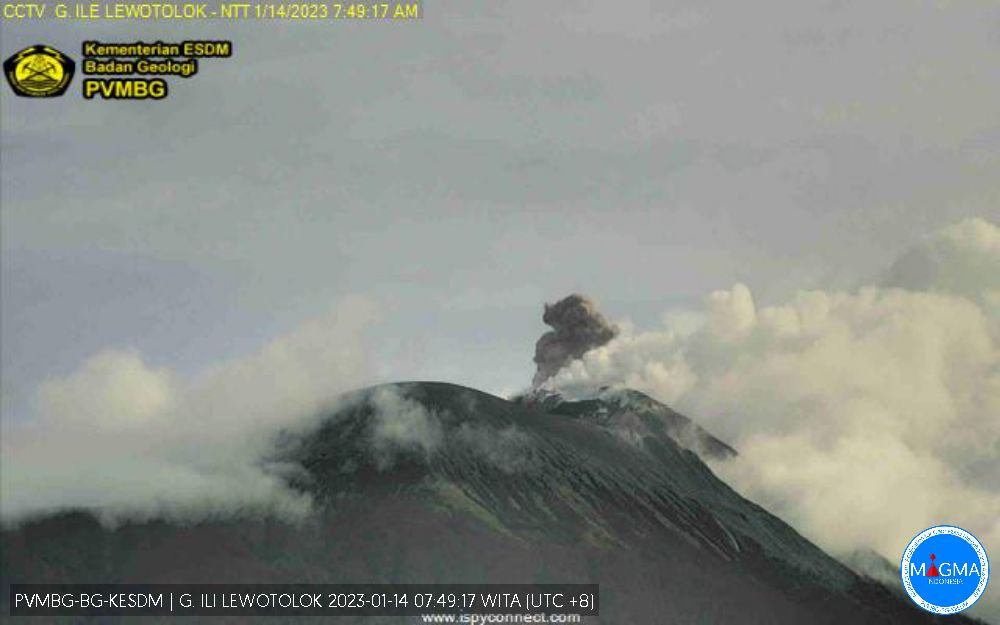
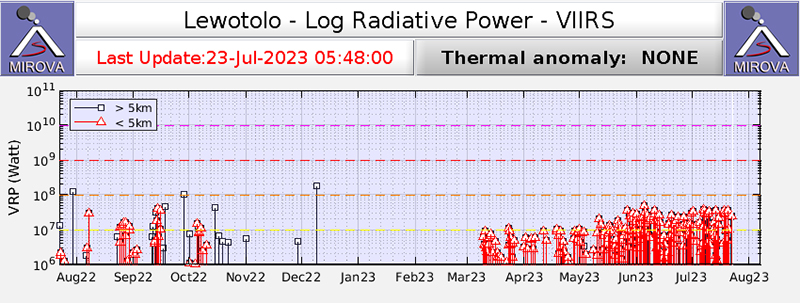
After more than two months of relative quiet, PVMBG reported that explosions at 0747 on 14 January 2023 and at 2055 on 16 January produced white-and-gray ash plumes that rose around 400 m above the summit and drifted E and SE (figure 44). During the latter half of January through April, almost daily white or white-and-gray emissions were observed rising 25-800 m above the summit, and nighttime webcam images often showed incandescent material being ejected above the summit crater. Strombolian activity was visible in webcam images at 2140 on 11 February, 0210 on 18 February, and during 22-28 March. Frequent hotspots were recorded by the MIROVA detection system starting in approximately the second week of March 2023 that progressively increased into April (figure 45).
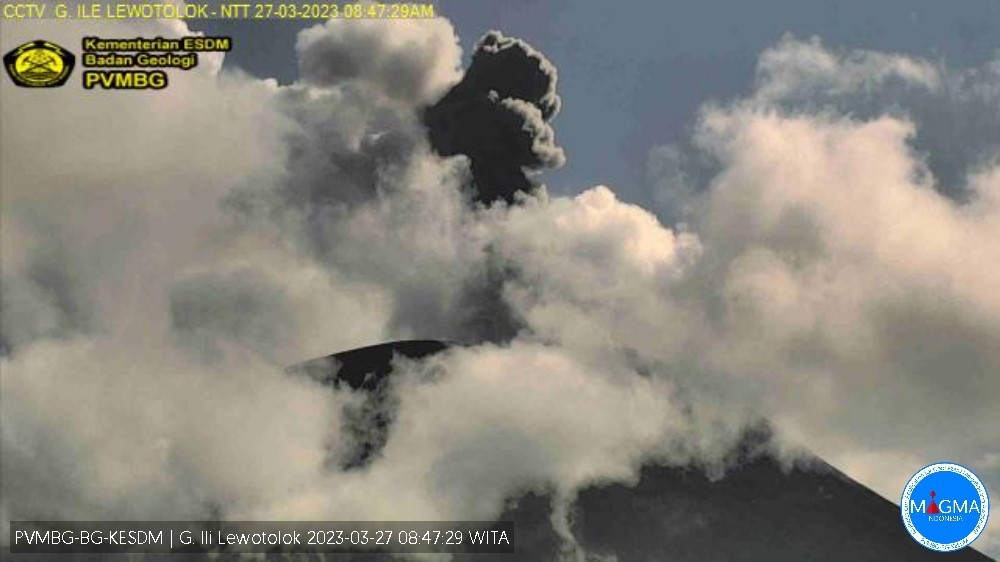
Explosions that produced dense ash plumes as high as 750 m above the summit were described in Volcano Observatory Notices for Aviation (VONA) at 0517, 1623, and 2016 on 22 March, at 1744 on 24 March, at 0103 on 26 March, at 0845 and 1604 on 27 March (figure 46), and at 0538 on 28 March. According to the Darwin VAAC, on 6 April another ash plume rose to 1.8 km altitude (about 370 m above the summit) and drifted N.
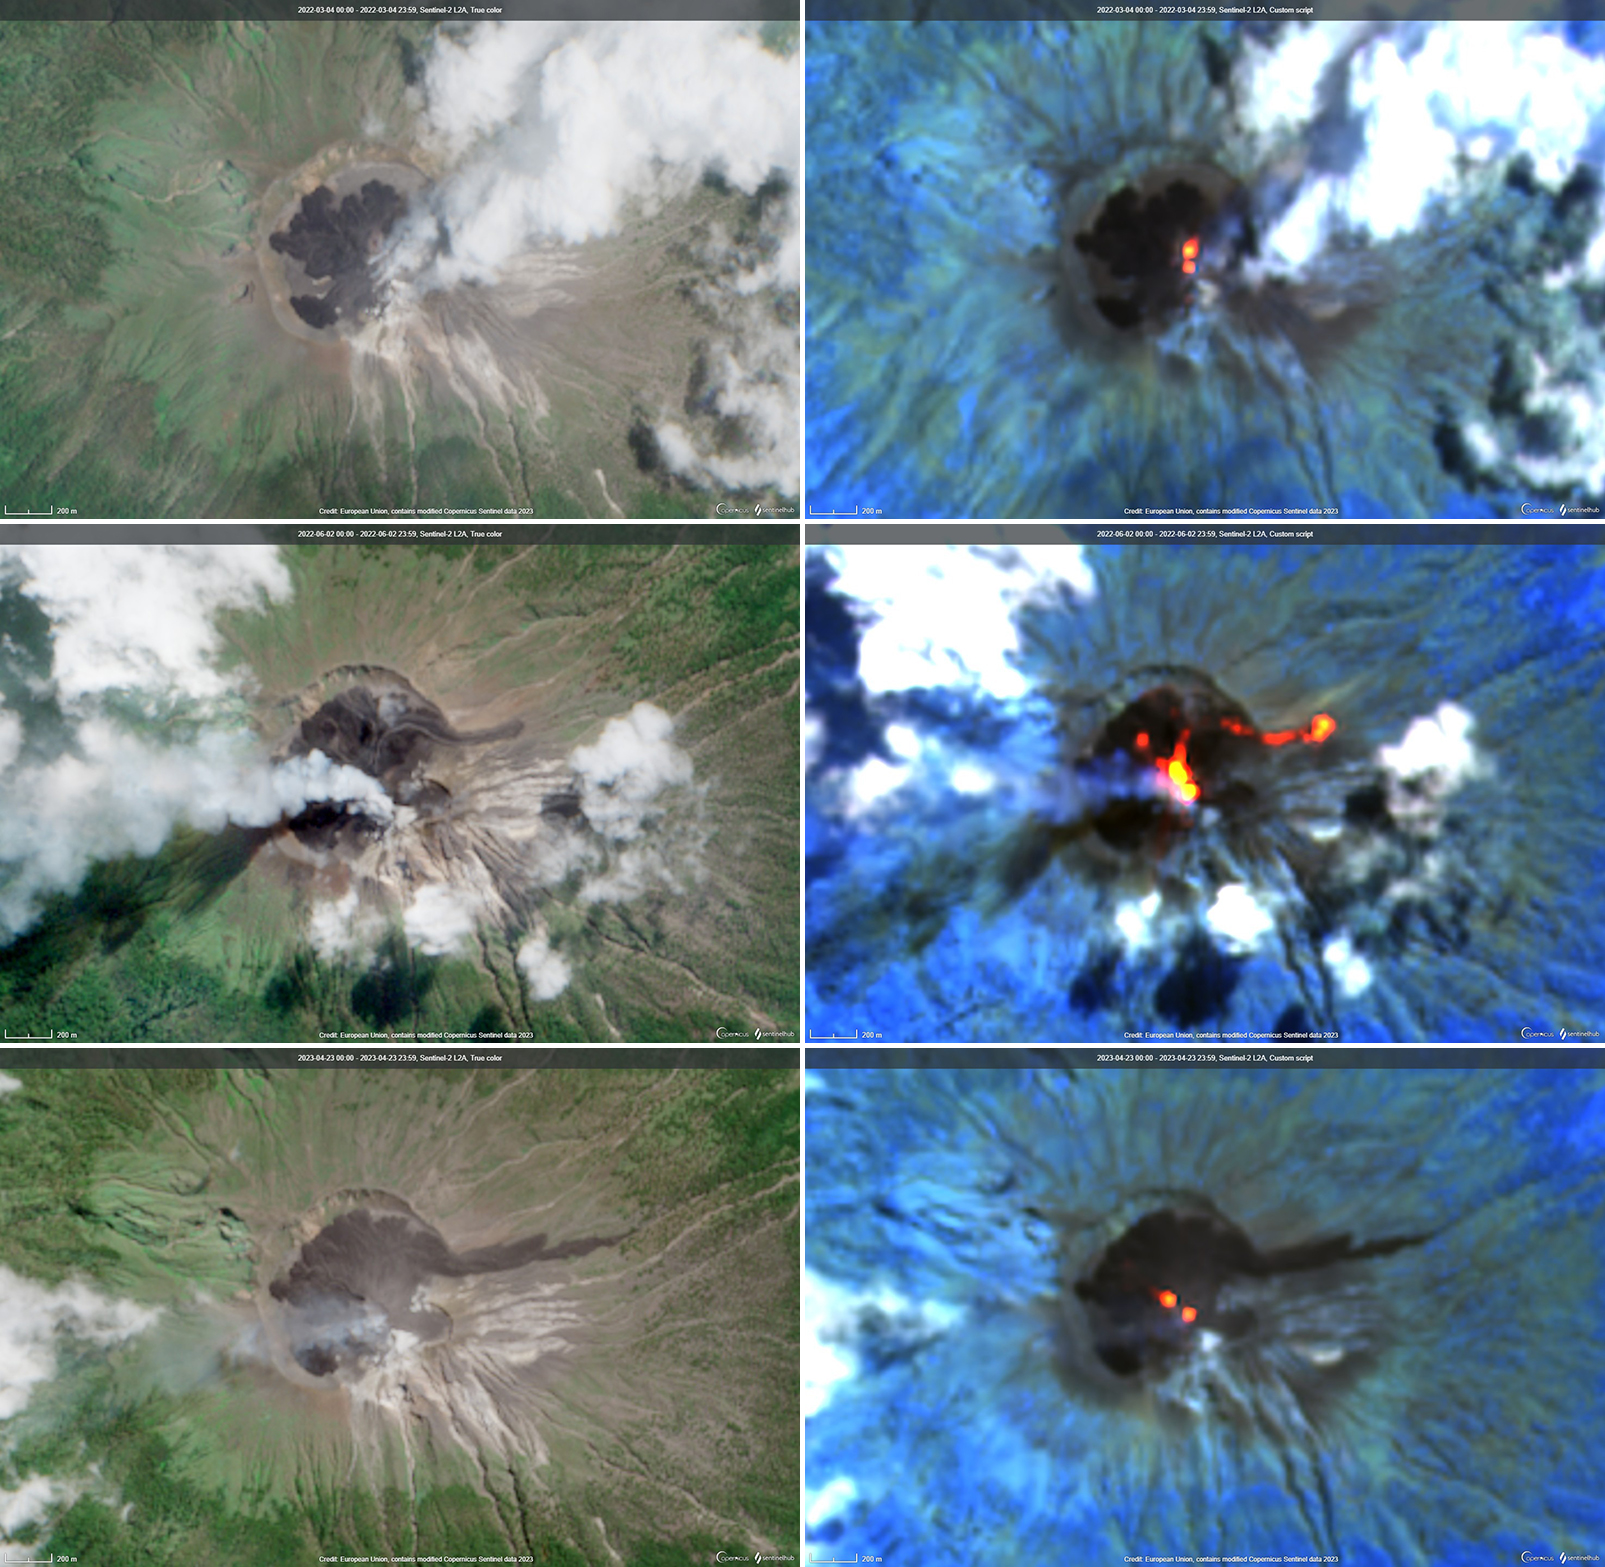
Sentinel-2 images over the previous year recorded thermal anomalies as well as the development of a lava flow that descended the NE flank beginning in June 2022 (figure 47). The volcano was often obscured by weather clouds, which also often hampered ground observations. Ash emissions were reported in March 2022 (BGVN 47:10), and clear imagery from 4 March 2022 showed recent lava flows confined to the crater, two thermal anomaly spots in the eastern part of the crater, and mainly white emissions from the SE. Thermal anomalies became stronger and more frequent in mid-May 2022, followed by strong Strombolian activity through June and July (BGVN 47:10); Sentinel-2 images on 2 June 2022 showed active lava flows within the crater and overflowing onto the NE flank. Clear images from 23 April 2023 (figure 47) show the extent of the cooled NE-flank lava flow, more extensive intra-crater flows, and two hotspots in slightly different locations compared to the previous March.
Geologic Background. The Lewotolok (or Lewotolo) stratovolcano occupies the eastern end of an elongated peninsula extending north into the Flores Sea, connected to Lembata (formerly Lomblen) Island by a narrow isthmus. It is symmetrical when viewed from the north and east. A small cone with a 130-m-wide crater constructed at the SE side of a larger crater forms the volcano's high point. Many lava flows have reached the coastline. Eruptions recorded since 1660 have consisted of explosive activity from the summit crater.
Information Contacts: Pusat Vulkanologi dan Mitigasi Bencana Geologi (PVMBG, also known as Indonesian Center for Volcanology and Geological Hazard Mitigation, CVGHM), Jalan Diponegoro 57, Bandung 40122, Indonesia (URL: http://www.vsi.esdm.go.id/); MAGMA Indonesia, Kementerian Energi dan Sumber Daya Mineral (URL: https://magma.esdm.go.id/v1); Darwin Volcanic Ash Advisory Centre (VAAC), Bureau of Meteorology, Northern Territory Regional Office, PO Box 40050, Casuarina, NT 0811, Australia (URL: http://www.bom.gov.au/info/vaac/); MIROVA (Middle InfraRed Observation of Volcanic Activity), a collaborative project between the Universities of Turin and Florence (Italy) supported by the Centre for Volcanic Risk of the Italian Civil Protection Department (URL: http://www.mirovaweb.it/); Copernicus Browser, Copernicus Data Space Ecosystem, European Space Agency (URL: https://dataspace.copernicus.eu/browser/).
Barren Island (India) — April 2023 Cite this Report
Barren Island
India
12.278°N, 93.858°E; summit elev. 354 m
All times are local (unless otherwise noted)
Thermal activity during December 2022-March 2023
Barren Island is part of a N-S-trending volcanic arc extending between Sumatra and Burma (Myanmar). The caldera, which is open to the sea on the west, was created during a major explosive eruption in the late Pleistocene that produced pyroclastic flow and surge deposits. Eruptions dating back to 1787, have changed the morphology of the pyroclastic cone in the center of the caldera, and lava flows that fill much of the caldera floor have reached the sea along the western coast. Previous activity was detected during mid-May 2022, consisting of intermittent thermal activity. This report covers June 2022 through March 2023, which included strong thermal activity beginning in late December 2022, based on various satellite data.
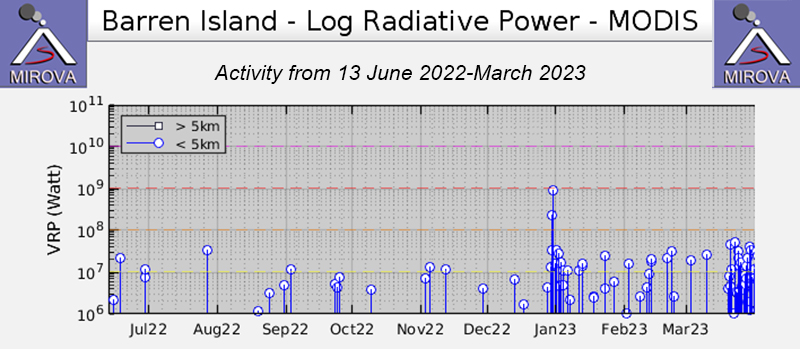
Activity was relatively quiet during June through late December 2022 and mostly consisted of low-power thermal anomalies, based on the MIROVA (Middle InfraRed Observation of Volcanic Activity) graph. During late December, a spike in both power and frequency of thermal anomalies was detected (figure 58). There was another pulse in thermal activity in mid-March, which consisted of more frequent and relatively strong anomalies.
The Suomi NPP/VIIRS sensor data showed five thermal alerts on 29 December 2022. The number of alerts increased to 19 on 30 December. According to the Darwin VAAC, ash plumes identified in satellite images captured at 2340 on 30 December and at 0050 on 31 December rose to 1.5 km altitude and drifted SW. The ash emissions dissipated by 0940. On 31 December, a large thermal anomaly was detected; based on a Sentinel-2 infrared satellite image, the anomaly was relatively strong and extended to the N (figure 59).
Thermal activity continued during January through March. Sentinel-2 infrared satellite data showed some thermal anomalies of varying intensity on clear weather days on 5, 10, 15, 20, and 30 January 2023, 9, 14, 19, and 24 February 2023, and 21, 26, and 31 March (figure 59). According to Suomi NPP/VIIRS sensor data, a total of 30 thermal anomalies were detected over 18 days on 2-3, 7, 9-14, 16-17, 20, 23, 25, and 28-31 January. The sensor data showed a total of six hotspots detected over six days on 1, 4-5, and 10-12 February. During March, a total of 33 hotspots were visible over 11 days on 20-31 March. Four MODVOLC thermal alerts were issued on 25, 27, and 29 March.
Geologic Background. Barren Island, a possession of India in the Andaman Sea about 135 km NE of Port Blair in the Andaman Islands, is the only historically active volcano along the N-S volcanic arc extending between Sumatra and Burma (Myanmar). It is the emergent summit of a volcano that rises from a depth of about 2250 m. The small, uninhabited 3-km-wide island contains a roughly 2-km-wide caldera with walls 250-350 m high. The caldera, which is open to the sea on the west, was created during a major explosive eruption in the late Pleistocene that produced pyroclastic-flow and -surge deposits. Historical eruptions have changed the morphology of the pyroclastic cone in the center of the caldera, and lava flows that fill much of the caldera floor have reached the sea along the western coast.
Information Contacts: Darwin Volcanic Ash Advisory Centre (VAAC), Bureau of Meteorology, Northern Territory Regional Office, PO Box 40050, Casuarina, NT 0811, Australia (URL: http://www.bom.gov.au/info/vaac/); MIROVA (Middle InfraRed Observation of Volcanic Activity), a collaborative project between the Universities of Turin and Florence (Italy) supported by the Centre for Volcanic Risk of the Italian Civil Protection Department (URL: http://www.mirovaweb.it/); Hawai'i Institute of Geophysics and Planetology (HIGP) - MODVOLC Thermal Alerts System, School of Ocean and Earth Science and Technology (SOEST), Univ. of Hawai'i, 2525 Correa Road, Honolulu, HI 96822, USA (URL: http://modis.higp.hawaii.edu/); Sentinel Hub Playground (URL: https://www.sentinel-hub.com/explore/sentinel-playground); NASA Worldview (URL: https://worldview.earthdata.nasa.gov/).
Villarrica
Chile
39.42°S, 71.93°W; summit elev. 2847 m
All times are local (unless otherwise noted)
Nighttime crater incandescence, ash emissions, and seismicity during October 2022-March 2023
Villarrica, located in central Chile, consists of a 2-km-wide caldera that formed about 3,500 years ago, located at the base of the presently active cone. Historical eruptions date back to 1558 and have been characterized by mild-to-moderate explosive activity with occasional lava effusions. The current eruption period began in December 2014 and has recently consisted of ongoing seismicity, gas-and-steam emissions, and thermal activity (BGVN 47:10). This report covers activity during October 2022 through March 2023 and describes Strombolian explosions, ash emissions, and crater incandescence. Information for this report primarily comes from the Southern Andes Volcano Observatory (Observatorio Volcanológico de Los Andes del Sur, OVDAS), part of Chile's National Service of Geology and Mining (Servicio Nacional de Geología y Minería, SERNAGEOMIN) and satellite data.
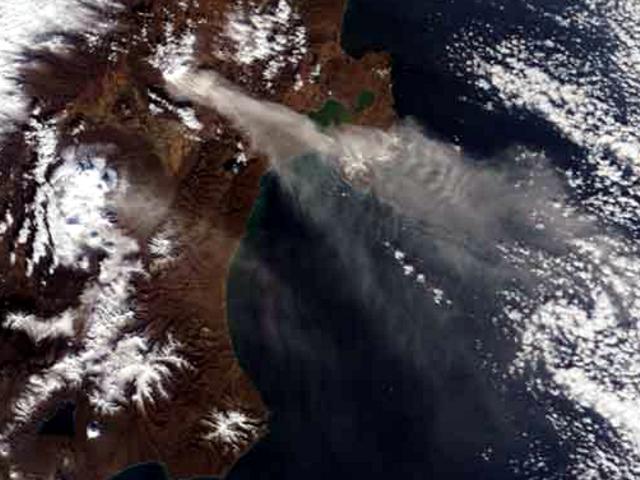
Seismicity during October consisted of discrete long-period (LP)-type events, tremor (TR), and volcano-tectonic (VT)-type events. Webcam images showed eruption plumes rising as high as 460 m above the crater rim; plumes deposited tephra on the E, S, and SW flanks within 500 m of the crater on 2, 18, 23, and 31 October. White gas-and-steam emissions rose 80-300 m above the crater accompanied by crater incandescence during 2-3 October. There was a total of 5 VT-type events, 10,625 LP-type events, and 2,232 TR-type events detected throughout the month. Sulfur dioxide data was obtained by the Differential Absorption Optical Spectroscopy Equipment (DOAS) installed 6 km in an ESE direction. The average value of the sulfur dioxide emissions was 535 ± 115 tons per day (t/d); the highest daily maximum was 1,273 t/d on 13 October. These values were within normal levels and were lower compared to September. During the night of 3-4 October Strombolian activity ejected blocks as far as 40 m toward the NW flank. Small, gray-brown ash pulses rose 60 m above the crater accompanied white gas-and-steam emissions that rose 40-300 m high during 4-5 October. In addition, crater incandescence and Strombolian explosions that ejected blocks were reported during 4-5 and 9-11 October. Based on satellite images from 12 October, ballistic ejecta traveled as far as 400 m and the resulting ash was deposited 3.2 km to the E and SE and 900 m to the NW.
Satellite images from 14 October showed an active lava lake that covered an area of 36 square meters in the E part of the crater floor. There was also evidence of a partial collapse (less than 300 square meters) at the inner SSW crater rim. POVI posted an 18 October photo that showed incandescence above the crater rim, noting that crater incandescence was visible during clear weather nights. In addition, webcam images at 1917 showed lava fountaining and Strombolian explosions; tourists also described seeing splashes of lava ejected from a depth of 80 m and hearing loud degassing sounds. Tephra deposits were visible around the crater rim and on the upper flanks on 24 October. On 25 October SERNAGEOMIN reported that both the number and amplitude of LP earthquakes had increased, and continuous tremor also increased; intense crater incandescence was visible in satellite images. On 31 October Strombolian explosions intensified and ejected material onto the upper flanks.
Activity during November consisted of above-baseline seismicity, including intensifying continuous tremor and an increase in the number of LP earthquakes. On 1 November a lava fountain was visible rising above the crater rim. Nighttime crater incandescence was captured in webcam images on clear weather days. Strombolian explosions ejected incandescent material on the NW and SW flanks during 1, 2, and 6-7 November. POVI reported that the width of the lava fountains that rose above the crater rim on 2 November suggested that the vent on the crater floor was roughly 6 m in diameter. Based on reports from observers and analyses of satellite imagery, material that was deposited on the upper flanks, primarily to the NW, consisted of clasts up to 20 cm in diameter. During an overflight on 19 November SERNAGEOMIN scientists observed a cone on the crater floor with an incandescent vent at its center that contained a lava lake. Deposits of ejecta were also visible on the flanks. That same day a 75-minute-long series of volcano-tectonic earthquakes was detected at 1940; a total of 21 events occurred 7.8 km ESE of the crater. Another overflight on 25 November showed the small cone on the crater floor with an incandescent lava lake at the center; the temperature of the lava lake was 1,043 °C, based data gathered during the overflight.
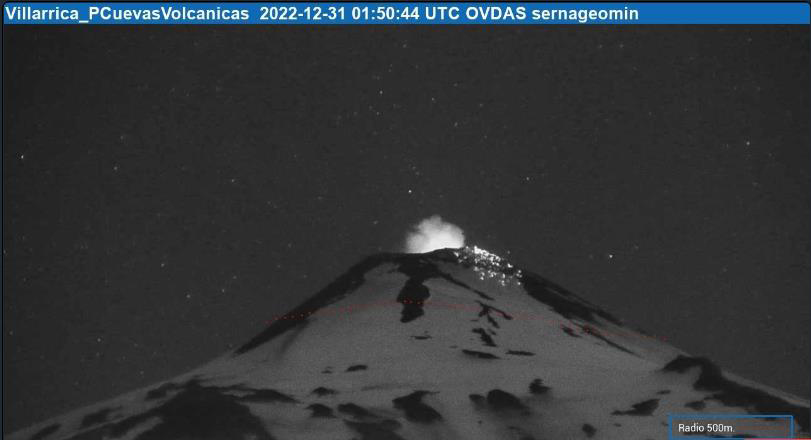
Similar seismicity, crater incandescence, and gas-and-steam emissions continued during December. On 1 December incandescent material was ejected 80-220 m above the crater rim. During an overflight on 6 December, intense gas-and-steam emissions from the lava lake was reported, in addition to tephra deposits on the S and SE flanks as far as 500 m from the crater. During 7-12 December seismicity increased slightly and white, low-altitude gas-and-steam emissions and crater incandescence were occasionally visible. On 24 December at 0845 SERNAGEOMIN reported an increase in Strombolian activity; explosions ejected material that generally rose 100 m above the crater, although one explosion ejected incandescent tephra as far as 400 m from the crater onto the SW flank. According to POVI, 11 explosions ejected incandescent material that affected the upper SW flank between 2225 on 25 December to 0519 on 26 December. POVI recorded 21 Strombolian explosions that ejected incandescent material onto the upper SW flank from 2200 on 28 December to 0540 on 29 December. More than 100 Strombolian explosions ejected material onto the upper W and NW flanks during 30-31 December. On 30 December at 2250 an explosion was detected that generated an eruptive column rising 120 m above the crater and ejecting incandescent material 300 m on the NW flank (figure 120). Explosions detected at 2356 on 31 December ejected material 480 m from the crater rim onto the NW flank and at 0219 material was deposited on the same flank as far as 150 m. Both explosions ejected material as high as 120 m above the crater rim.
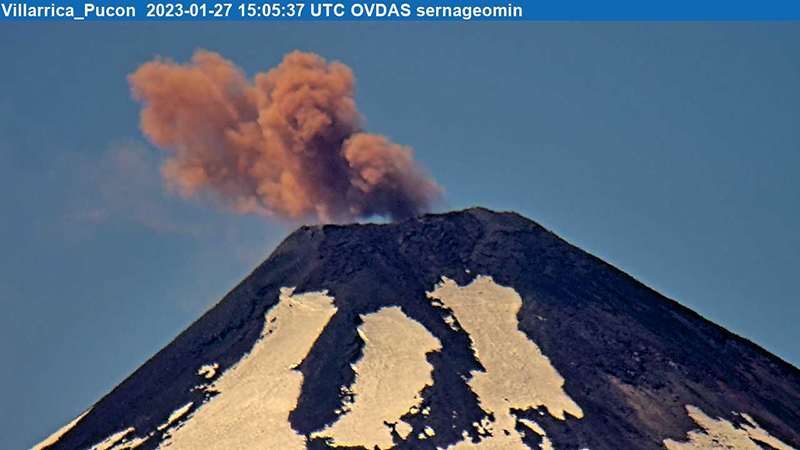
During January 2023, Strombolian explosions and lava fountaining continued mainly in the crater, ejecting material 100 m above the crater. Gas-and-steam emissions rose 40-260 m above the crater and drifted in different directions, and LP-type events continued. Emissions during the night of 11 January including some ash rose 80 m above the crater and as far as 250 m NE flank. POVI scientists reported about 70 lava fountaining events from 2130 on 14 January to 0600 on 15 January. At 2211 on 15 January there was an increase in frequency of Strombolian explosions that ejected incandescent material 60-150 m above the crater. Some ashfall was detected around the crater. POVI noted that on 19 January lava was ejected as high as 140 m above the crater rim and onto the W and SW flanks. Explosion noises were heard on 19 and 22 January in areas within a radius of 10 km. During 22-23 January Strombolian explosions ejected incandescent material 60-100 m above the crater that drifted SE. A seismic event at 1204 on 27 January was accompanied by an ash plume that rose 220 m above the crater and drifted E (figure 121); later that same day at 2102 an ash plume rose 180 m above the crater and drifted E.
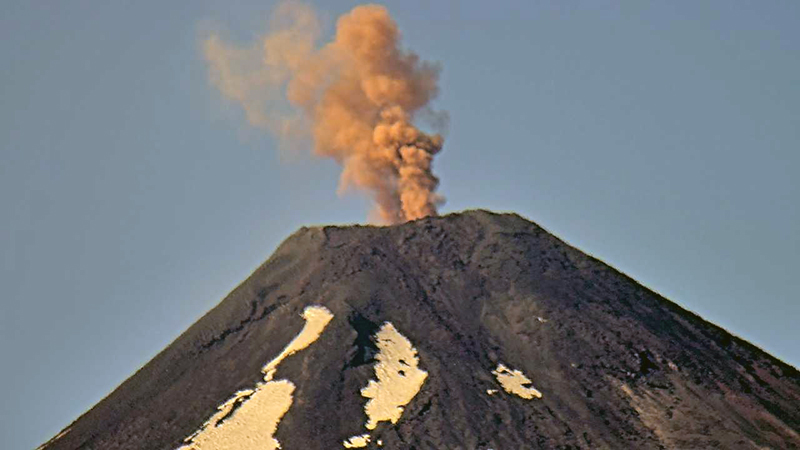
Seismicity, primarily characterized by LP-type events, and Strombolian explosions persisted during February and March. POVI reported that three explosions were heard during 1940-1942 on 6 February, and spatter was seen rising 30 m above the crater rim hours later. On 9 February lava fountains were visible rising 50 m above the crater rim. On 17 February Strombolian explosions ejected material 100 m above the crater rim and onto the upper SW flank. Webcam images from 20 February showed two separate fountains of incandescent material, which suggested that a second vent had opened to the E of the first vent. Spatter was ejected as high as 80 m above the crater rim and onto the upper NE flank. A sequence of Strombolian explosions was visible from 2030 on 20 February to 0630 on 21 February. Material was ejected as high as 80 m above the crater rim and onto the upper E flank. LP-type earthquakes recorded 1056 and at 1301 on 27 February were associated with ash plumes that rose 300 m above the crater and drifted NE (figure 122). Crater incandescence above the crater rim was observed in webcam images on 13 March, which indicated Strombolian activity. POVI posted a webcam image from 2227 on 18 March showing Strombolian explosions that ejected material as high as 100 m above the crater rim. Explosions were heard up to 8 km away. On 19 March at 1921 an ash emission rose 340 m above the crater and drifted NE. On 21 and 26 March Strombolian explosions ejected material 100 and 110 m above the crater rim, respectively. On 21 March Strombolian explosions ejected material 100 m above the crater rim. Low-intensity nighttime crater incandescence was detected by surveillance cameras on 24 March.
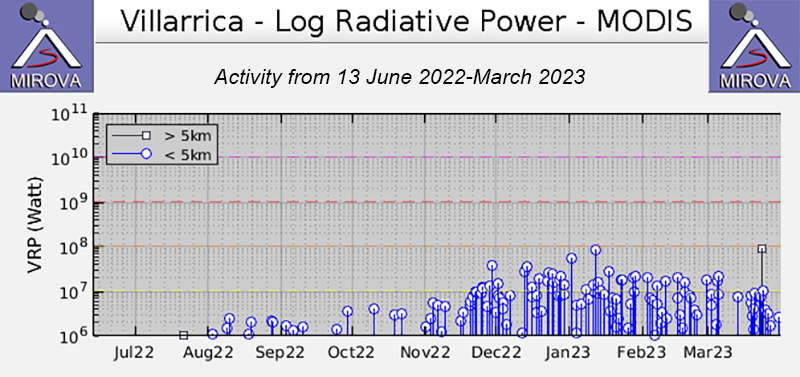
Infrared MODIS satellite data processed by MIROVA (Middle InfraRed Observation of Volcanic Activity) detected an increase in thermal activity during mid-November, which corresponds to sustained Strombolian explosions, lava fountaining, and crater incandescence (figure 123). This activity was also consistently captured on clear weather days throughout the reporting period in Sentinel-2 infrared satellite images (figure 124).
Geologic Background. The glacier-covered Villarrica stratovolcano, in the northern Lakes District of central Chile, is ~15 km south of the city of Pucon. A 2-km-wide caldera that formed about 3,500 years ago is located at the base of the presently active, dominantly basaltic to basaltic-andesite cone at the NW margin of a 6-km-wide Pleistocene caldera. More than 30 scoria cones and fissure vents are present on the flanks. Plinian eruptions and pyroclastic flows that have extended up to 20 km from the volcano were produced during the Holocene. Lava flows up to 18 km long have issued from summit and flank vents. Eruptions documented since 1558 CE have consisted largely of mild-to-moderate explosive activity with occasional lava effusion. Glaciers cover 40 km2 of the volcano, and lahars have damaged towns on its flanks.
Information Contacts: Servicio Nacional de Geología y Minería (SERNAGEOMIN), Observatorio Volcanológico de Los Andes del Sur (OVDAS), Avda Sta María No. 0104, Santiago, Chile (URL: http://www.sernageomin.cl/); Proyecto Observación Villarrica Internet (POVI) (URL: http://www.povi.cl/); MIROVA (Middle InfraRed Observation of Volcanic Activity), a collaborative project between the Universities of Turin and Florence (Italy) supported by the Centre for Volcanic Risk of the Italian Civil Protection Department (URL: http://www.mirovaweb.it/); Sentinel Hub Playground (URL: https://www.sentinel-hub.com/explore/sentinel-playground).
Fuego
Guatemala
14.473°N, 90.88°W; summit elev. 3763 m
All times are local (unless otherwise noted)
Daily explosions, gas-and-ash plumes, avalanches, and ashfall during December 2022-March 2023
Fuego, one of three large stratovolcanoes overlooking the city of Antigua, Guatemala, has been vigorously erupting since January 2002, with recorded eruptions dating back to 1531 CE. Eruptive activity has included major ashfalls, pyroclastic flows, lava flows, and lahars. Frequent explosions with ash emissions, block avalanches, and lava flows have persisted since 2018. More recently, activity remained relatively consistent with daily explosions, ash plumes, ashfall, avalanches, and lahars (BGVN 48:03). This report covers similar activity during December 2022 through March 2023, based on information from the Instituto Nacional de Sismologia, Vulcanología, Meteorología e Hidrologia (INSIVUMEH) daily reports, Coordinadora Nacional para la Reducción de Desastres (CONRED) newsletters, and various satellite data.
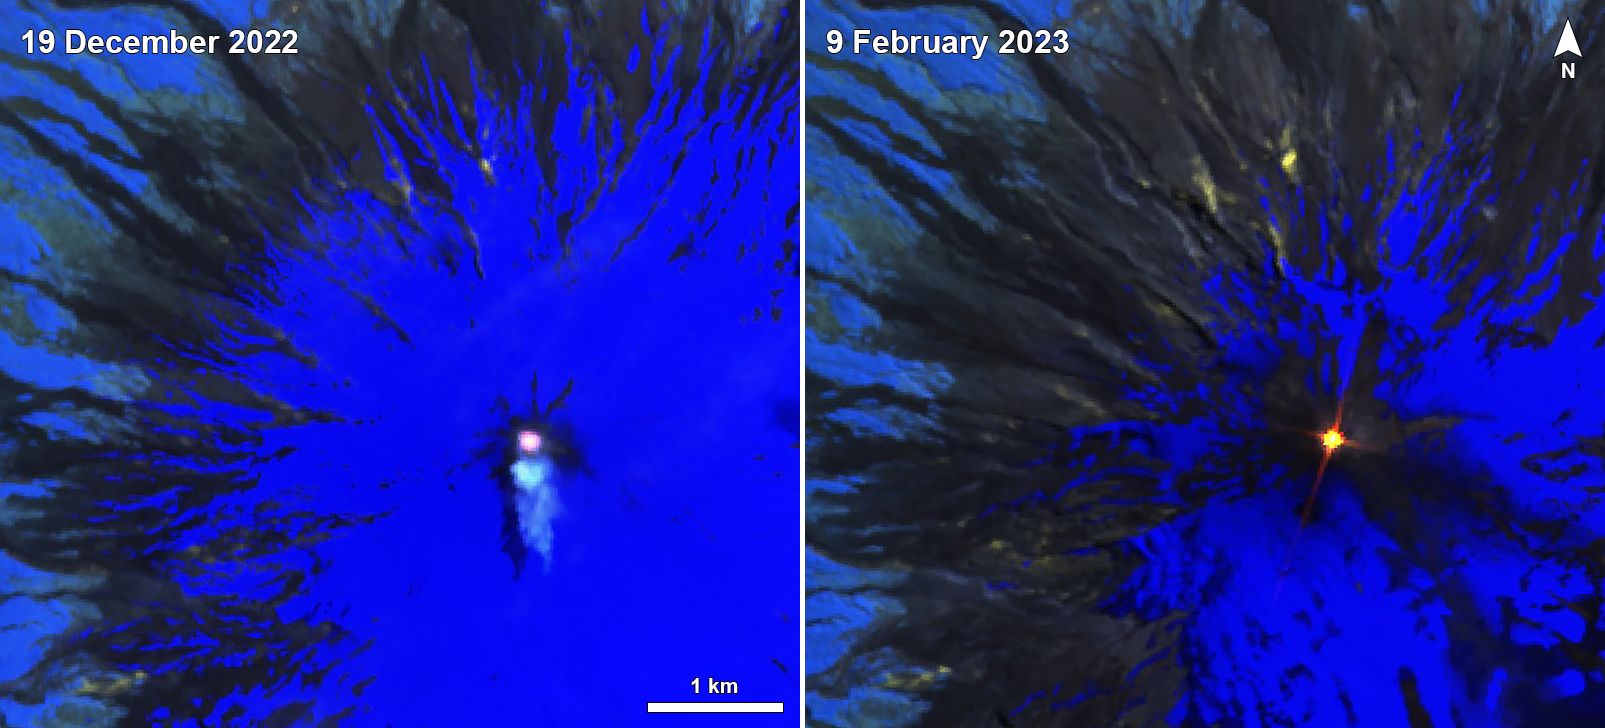
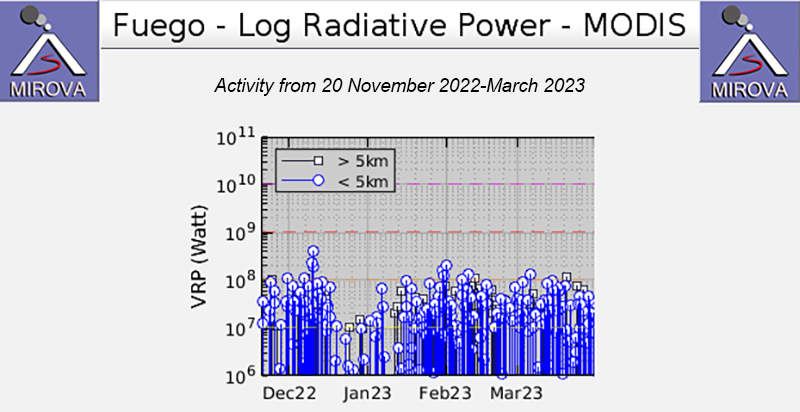
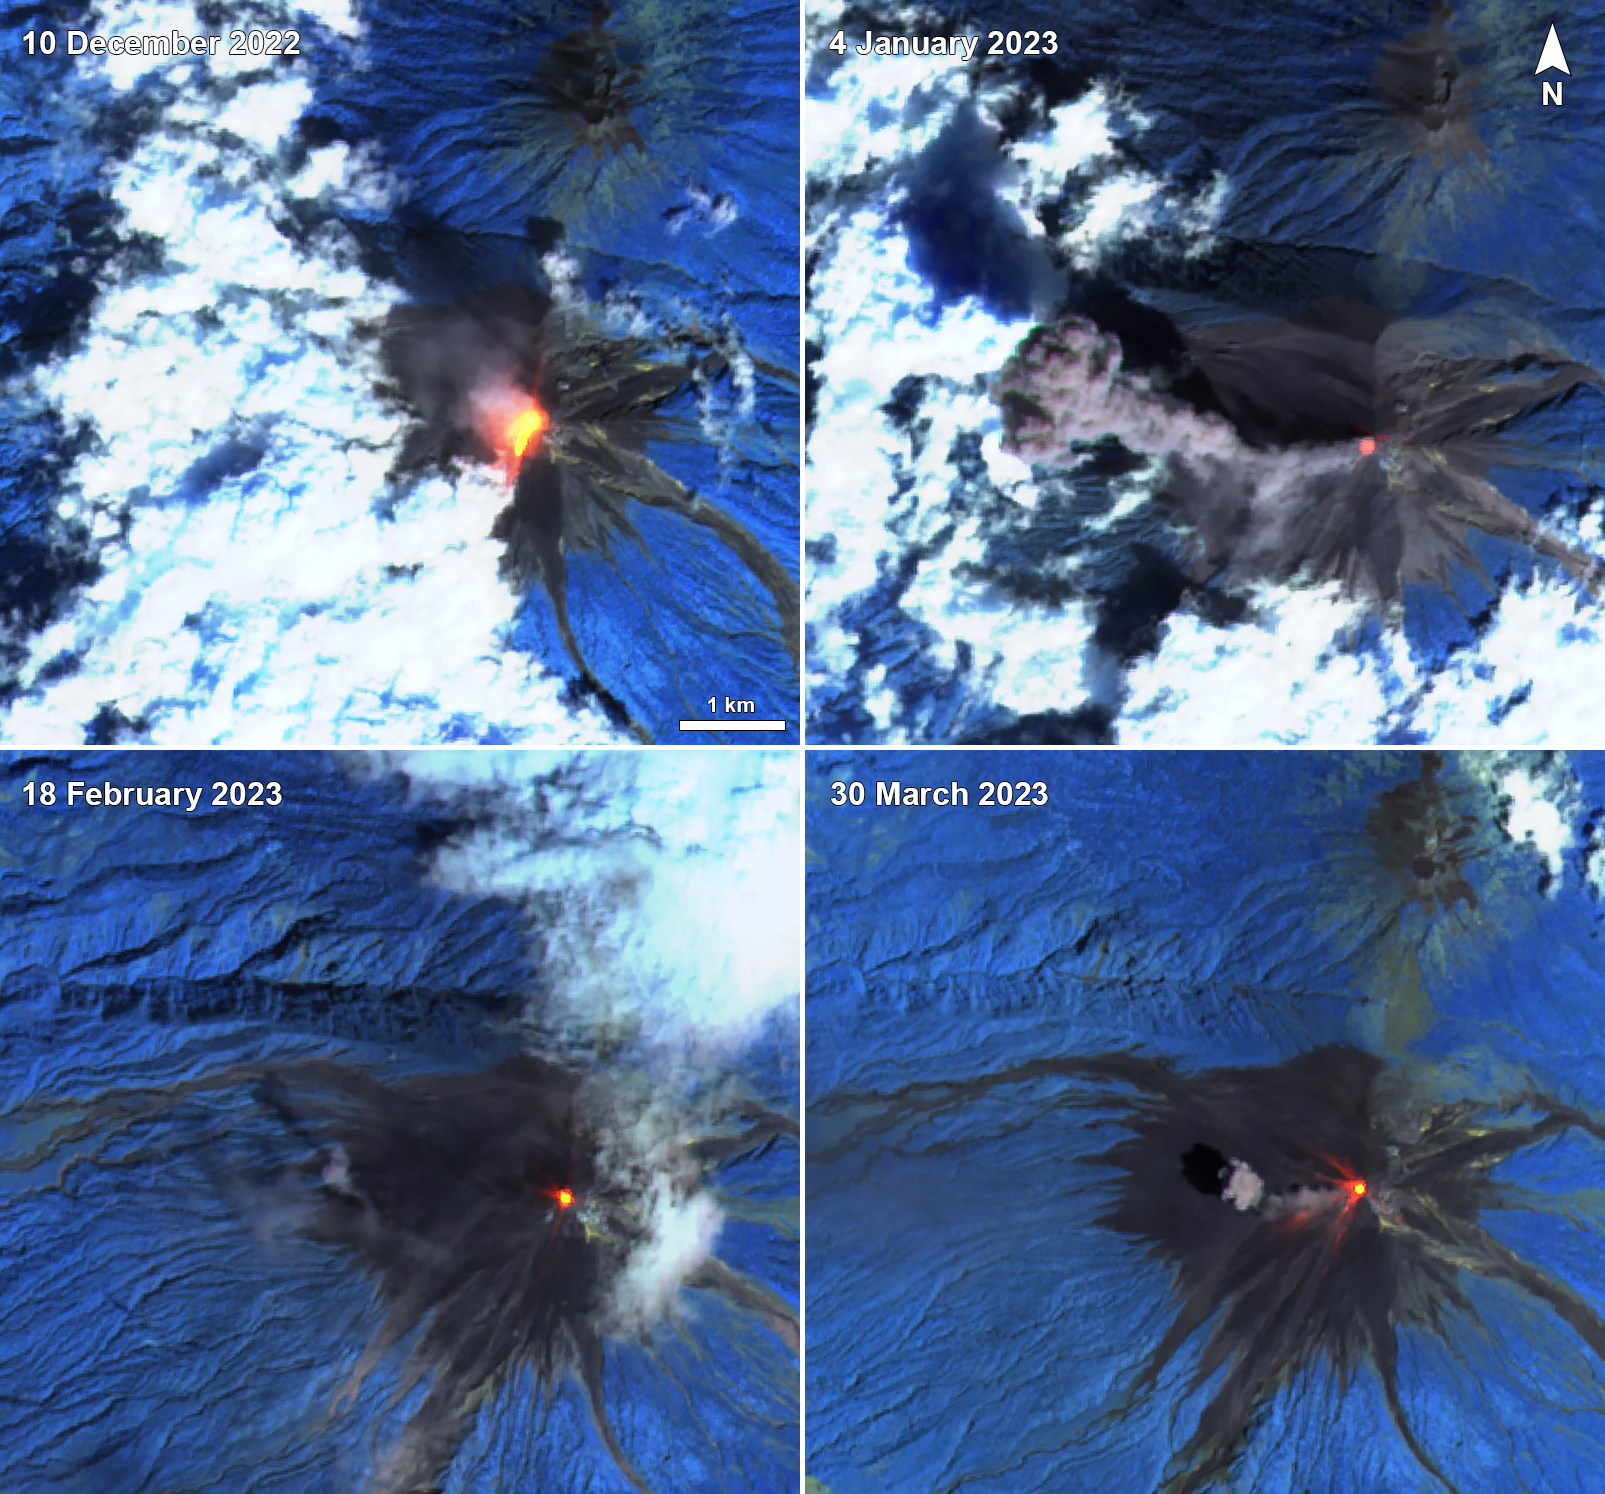
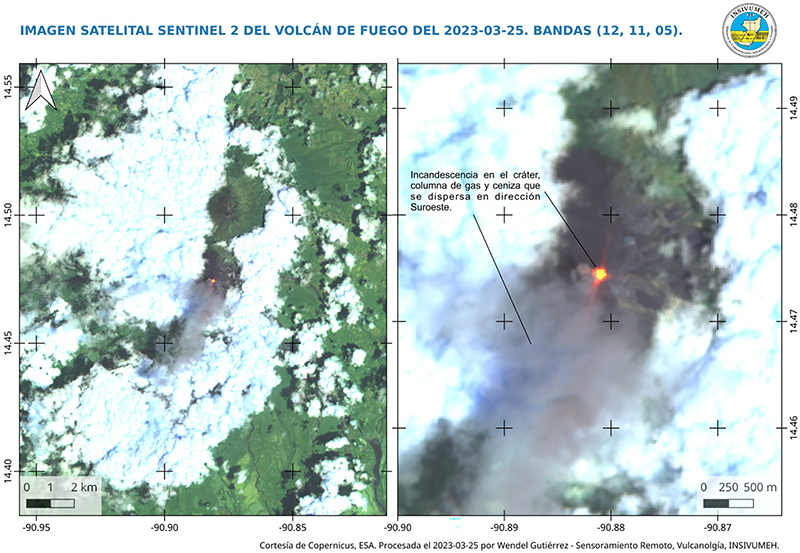
Daily explosions reported throughout December 2022-March 2023 generated ash plumes to 6 km altitude that drifted as far as 60 km in multiple directions. The explosions also caused rumbling sounds of varying intensities, with shock waves that vibrated the roofs and windows of homes near the volcano. Incandescent pulses of material rose 100-500 m above the crater, which caused block avalanches around the crater and toward the Santa Teresa, Taniluyá (SW), Ceniza (SSW), El Jute, Honda, Las Lajas (SE), Seca (W), and Trinidad (S) drainages. Fine ashfall was also frequently reported in nearby communities (table 27). MIROVA (Middle InfraRed Observation of Volcanic Activity) analysis of MODIS satellite data showed frequent, moderate thermal activity throughout the reporting period; however, there was a brief decline in both power and frequency during late-to-mid-January 2023 (figure 166). A total of 79 MODVOLC thermal alerts were issued: 16 during December 2022, 17 during January 2023, 23 during February, and 23 during March. Some of these thermal evets were also visible in Sentinel-2 infrared satellite imagery at the summit crater, which also showed occasional incandescent block avalanches descending the S, W, and NW flanks, and accompanying ash plumes that drifted W (figure 167).
Table 27. Activity at Fuego during December 2022 through March 2023 included multiple explosions every hour. Ash emissions rose as high as 6 km altitude and drifted generally W and SW as far as 60 km, causing ashfall in many communities around the volcano. Data from daily INSIVUMEH reports and CONRED newsletters.
| Month |
Explosions per hour |
Ash plume altitude (max) |
Ash plume distance (km) and direction |
Drainages affected by block avalanches |
Communities reporting ashfall |
| Dec 2022 |
1-12 |
6 km |
WSW, W, SW, NW, S, SE, NE, and E, 10-30 km |
Santa Teresa, Taniluyá, Ceniza, El Jute, Honda, Las Lajas, Seca, and Trinidad |
Panimaché I and II, Morelia, Santa Sofía, El Porvenir, Finca Palo Verde, Yepocapa, Yucales, Sangre de Cristo, La Rochela, Ceilán, San Andrés Osuna, and Aldea La Cruz |
| Jan 2023 |
1-12 |
5 km |
W, SW, NW, S, N, NE, E, and SE, 7-60 km |
Ceniza, Las Lajas, Santa Teresa, Taniluyá, Trinidad, Seca, Honda, and El Jute |
Panimaché I and II, Morelia, Santa Sofía, El Porvenir, Palo Verde, Yucales, Yepocapa, Sangre de Cristo, La Rochela, Ceylon, Alotenango, and San Andrés Osuna |
| Feb 2023 |
1-12 |
4.9 km |
SW, W, NW, and N, 10-30 km |
Santa Teresa, Taniluyá, Ceniza, Las Lajas, Seca, Trinidad, El Jute, and Honda |
Panimaché I and II, Morelia, Santa Sofía, Palo Verde, San Pedro Yepocapa, El Porvenir, Sangre de Cristo, La Soledad, Acatenango, El Campamento, and La Asunción |
| Mar 2023 |
3-11 |
5 km |
W, SW, NW, NE, N, S, SE, and E, 10-30 km |
Seca, Ceniza, Taniluyá, Las Lajas, Honda, Trinidad, El Jute, and Santa Teresa |
Yepocapa, Sangre de Cristo, Panimaché I and II, Morelia, Santa Sofía, El Porvenir, La Asunción, Palo Verde, La Rochela, San Andrés Osuna, Ceilán, and Aldeas |
Daily explosions ranged between 1 and 12 per hour during December 2022, generating ash plumes that rose to 4.5-6 km altitude and drifted 10-30 km in multiple directions. These explosions created rumbling sounds with a shock wave that vibrated the roofs and windows of homes near the volcano. Frequent white gas-and-steam plumes rose to 4.6 km altitude. Strombolian activity resulted in incandescent pulses that generally rose 100-500 m above the crater, which generated weak-to-moderate avalanches around the crater and toward the Santa Teresa, Taniluyá, Ceniza, El Jute, Honda, Las Lajas, Seca, and Trinidad drainages, where material sometimes reached vegetation. Fine ashfall was recorded in Panimaché I and II (8 km SW), Morelia (9 km SW), Santa Sofía (12 km SW), El Porvenir (8 km ENE), Finca Palo Verde, Yepocapa (8 km NW), Yucales (12 km SW), Sangre de Cristo (8 km WSW), La Rochela, Ceilán, San Andrés Osuna, and Aldea La Cruz. INSIVUMEH reported that on 10 December a lava flow formed in the Ceniza drainage and measured 800 m long; it remained active at least through 12 December and block avalanches were reported at the front of the flow. A pyroclastic flow was reported at 1100 on 10 December, descending the Las Lajas drainage for several kilometers and reaching the base of the volcano. Pyroclastic flows were also observed in the Ceniza drainage for several kilometers, reaching the base of the volcano on 11 December. Ash plumes rose as high as 6 km altitude, according to a special bulletin from INSIVUMEH. On 31 December explosions produced incandescent pulses that rose 300 m above the crater, which covered the upper part of the cone.
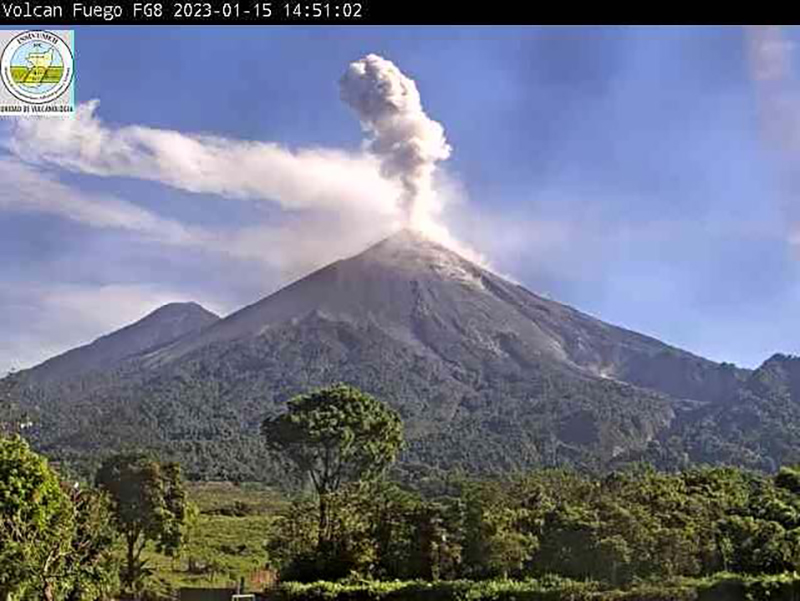
Activity during January 2023 consisted of 1-12 daily explosions, which produced ash plumes that rose to 4.2-5 km altitude and drifted 7-60 km in multiple directions (figure 168). Incandescent pulses of material were observed 100-350 m above the crater, which generated avalanches around the crater and down the Ceniza, Las Lajas, Santa Teresa, Taniluyá, Trinidad, Seca, Honda, and El Jute drainages. Sometimes, the avalanches resuspended older fine material 100-500 m above the surface that drifted W and SW. Ashfall was recorded in Panimaché I and II, Morelia, Santa Sofía, El Porvenir, Palo Verde, Yucales, Yepocapa, Sangre de Cristo, La Rochela, Ceylon, Alotenango, and San Andrés Osuna. Intermittent white gas-and-steam plumes rose to 4.5 km altitude and drifted W and NW.
There were 1-12 daily explosions recorded through February, which generated ash plumes that rose to 4.2-4.9 km altitude and drifted 10-30 km SW, W, NW, and N. Intermittent white gas-and-steam emissions rose 4.5 km altitude and drifted W and SW. During the nights and early mornings, incandescent pulses were observed 100-400 m above the crater. Weak-to-moderate avalanches were also observed down the Santa Teresa, Taniluyá, Ceniza, Las Lajas, Seca, Trinidad, El Jute, and Honda drainages, sometimes reaching the edge of vegetated areas. Occasional ashfall was reported in Panimaché I and II, Morelia, Santa Sofía, Palo Verde, San Pedro Yepocapa, El Porvenir, Sangre de Cristo, La Soledad, Acatenango, El Campamento, and La Asunción. On 18 February strong winds resuspended previous ash deposits as high as 1 km above the surface that blew 12 km SW and S.
During March, daily explosions ranged from 3-11 per hour, producing ash plumes that rose to 4-5 km altitude and drifted 10-30 km W, SW, NW, NE, N, S, SE, and E. During the night and early morning, crater incandescence (figure 169) and incandescent pulses of material were observed 50-400 m above the crater. Weak-to-moderate avalanches affected the Seca, Ceniza, Taniluyá, Las Lajas, Honda, Trinidad, El Jute, and Santa Teresa drainages, sometimes reaching the edge of vegetation. Frequent ashfall was detected in Yepocapa, Sangre de Cristo, Panimaché I and II, Morelia, Santa Sofía, El Porvenir, La Asunción, Palo Verde, La Rochela, San Andrés Osuna, Ceilán, and Aldeas. Weak ashfall was recorded in San Andrés Osuna, La Rochela, Ceylon during 8-9 March. A lahar was reported in the Ceniza drainage on 15 March, carrying fine, hot volcanic material, tree branches, trunks, and blocks from 30 cm to 1.5 m in diameter. On 18 March lahars were observed in the Las Lajas and El Jute drainages, carrying fine volcanic material, tree branches and trunks, and blocks from 30 cm to 1.5 m in diameter. As a result, there was also damage to the road infrastructure between El Rodeo and El Zapote.
Geologic Background. Volcán Fuego, one of Central America's most active volcanoes, is also one of three large stratovolcanoes overlooking Guatemala's former capital, Antigua. The scarp of an older edifice, Meseta, lies between Fuego and Acatenango to the north. Construction of Meseta dates back to about 230,000 years and continued until the late Pleistocene or early Holocene. Collapse of Meseta may have produced the massive Escuintla debris-avalanche deposit, which extends about 50 km onto the Pacific coastal plain. Growth of the modern Fuego volcano followed, continuing the southward migration of volcanism that began at the mostly andesitic Acatenango. Eruptions at Fuego have become more mafic with time, and most historical activity has produced basaltic rocks. Frequent vigorous historical eruptions have been recorded since the onset of the Spanish era in 1524, and have produced major ashfalls, along with occasional pyroclastic flows and lava flows.
Information Contacts: Instituto Nacional de Sismologia, Vulcanologia, Meteorologia e Hydrologia (INSIVUMEH), Unit of Volcanology, Geologic Department of Investigation and Services, 7a Av. 14-57, Zona 13, Guatemala City, Guatemala (URL: http://www.insivumeh.gob.gt/ ); MIROVA (Middle InfraRed Observation of Volcanic Activity), a collaborative project between the Universities of Turin and Florence (Italy) supported by the Centre for Volcanic Risk of the Italian Civil Protection Department (URL: http://www.mirovaweb.it/); Hawai'i Institute of Geophysics and Planetology (HIGP) - MODVOLC Thermal Alerts System, School of Ocean and Earth Science and Technology (SOEST), Univ. of Hawai'i, 2525 Correa Road, Honolulu, HI 96822, USA (URL: http://modis.higp.hawaii.edu/); Sentinel Hub Playground (URL: https://www.sentinel-hub.com/explore/sentinel-playground).
Search Bulletin Archive by Publication Date
Select a month and year from the drop-downs and click "Show Issue" to have that issue displayed in this tab.
The default month and year is the latest issue available.
Bulletin of the Global Volcanism Network - Volume 30, Number 02 (February 2005)
Managing Editor: Richard Wunderman
Anatahan (United States)
Remotely sensed ash plumes in February; Guam air-quality problems
Asamayama (Japan)
Maps of 2004 tephra deposits; radar images of the crater's interior and a dome
Kick 'em Jenny (Grenada)
Monitored and quiet; multi-beam finds craters and domes
Manam (Papua New Guinea)
One death, 14 injuries due to 27 January eruption; stratospheric injection
Marion Island (South Africa)
Small eruption seen 24 June 2004 on S side of this Antarctic island
Rinjani (Indonesia)
Witnessed eruptions in October 2004 with material escaping from two vents
Sheveluch (Russia)
27 February eruption left deposits covering 24,800 km2 to W of volcano
St. Helens (United States)
On 21 February the still-growing dome stood 160 m higher than the 1980's dome
Veniaminof (United States)
Ash emissions in January and Strombolian eruptions in February
Anatahan (United States) — February 2005 Cite this Report
Anatahan
United States
16.35°N, 145.67°E; summit elev. 790 m
All times are local (unless otherwise noted)
Remotely sensed ash plumes in February; Guam air-quality problems
As discussed in our previous report (BGVN 29:12), Anatahan's third historical eruption began on 5 January 2005. Ongoing eruptions continued through at least 18 February 2005.
Anatahan lies in the Commonwealth of the Northern Mariana Islands (CNMI) ~ 120 km N of Saipan and ~ 320 km N of Guam. The first historical eruption of Anatahan began 10 May 2003 (BGVN 28:04 and 28:05); after several hours of increasing seismicity, a phreatomagmatic eruption sent ash to over ~ 9 km (~ 30,000 feet) and deposited about 10 million cubic meters of material over the island and sea. A small craggy dome extruded in late May and was destroyed during explosions on 13 and 14 June, after which the eruption ceased. The second historical eruption began about 9 April 2004 after a week or so of increasing seismicity (BGVN 29:04). That eruption primarily comprised Strombolian explosions every minute or so and occasionally sent ash up to a few thousand feet. The eruption ended 26 July 2004.
Charles Holliday (US Airforce Weather Agency, AFWA) contributed a series of remotely sensed images showing plumes in February (table 3, figure 13). The plume in the 4 February Terra image (figure 13, top) contains a brownish tinge suggesting considerable ash. The Anatahan region was on the western edge of the Terra pass. The image contains an artifact reminiscent of Venetian blinds (commonly called the bow-tie effect), which arose due to pixel replication in the mapping/processing algorithm filling in for missing data on the edge of the scan.
Table 3. A list of some of the satellite images recording Anatahan plumes during 3-15 February 2005. Those shown with an asterisk appear in the next figure. Date and time are both UTC; for example, 04 Feb 2005 at 0105 is the date and time in UTC, in this example equivalent to 04 Feb 2005 at 1105 local time. Names affiliated with satellites are as follows: DMSP (Defense Meteorological Satellite Program), NOAA (National Oceanic and Atmospheric Administration), NASA (National Aeronautics and Space Administration). Courtesy of Charles Holliday, U.S. Air Force Weather Agency.
| Date |
Time (UTC) |
Satellite and type of image |
Predominant direction of plume and comments |
| 03 Feb 2005 |
2329 |
DMSP F16 (capturing visible data at 0.3 nanometer (nm) wavelength) |
Steam and vog; seen at least 95 NM (~180 km) from Anatahan, trending slightly E of S. |
| 04 Feb 2005 |
*0105 |
NASA TERRA MODIS (250 m resolution) |
Steam and vog; seen for at least 100 NM (~185 km) to the S. |
| 06 Feb 2005 |
0050 |
NASA TERRA MODIS (500 m resolution) |
Steam and vog; 100 NM (~185 km) trending to WSW. |
| 06 Feb 2005 |
0043 |
NOAA 17 (visible, 0.5 nm wavelength) |
Steam and vog; 175 NM (~320 km) to SW. |
| 06 Feb 2005 |
0335 |
NASA AQUA MODIS (500 m resolution) |
Steam and vog; 150 NM (~280 km) trending to WSW. |
| 08 Feb 2005 |
2226 |
DMSP F15 (visible, 0.3 nm) |
Steam and vog; 150 NM (~280 km) trending to SW. |
| 09 Feb 2005 |
0125 |
NASA TERRA MODIS (500 m resolution) |
Steam and vog to the SSW; plume length undisclosed. |
| 09 Feb 2005 |
0442 |
NOAA 16 (visible, 0.5 nm and infrared (IR), 0.5 nm) |
Steam and vog; 150 NM (~280 km) trending over a sector from SW to WSW. |
| 09 Feb 2005 |
2207 |
DMSP F16 (visible, 0.5 nm) |
Ash and steam for ten's of kilometers; vog at greater distances, up to at least 130 NM (240 km) WSW. |
| 10 Feb 2005 |
0030 |
NASA TERRA MODIS (250 m resolution) |
Ash and steam nearer volcano, blowing S to SSW; region interpreted as vog at distances of ten's of kilometers SW of volcano. |
| 10 Feb 2005 |
0052 |
NOAA 17 (0.5 nm) |
Vog visible 220 NM (~410 km) to the WSW. |
| 10 Feb 2005 |
0330 |
NASA AQUA MODIS (500 m resolution) |
Ash and steam nearer volcano, blowing SW; vog at distances ~150 NM (~280 km) WSW of volcano. |
| 10 Feb 2005 |
0423 |
NOAA 16 (IR, 0.5 nm) |
Ash and steam; plume blown 100 NM (185 km) to W and WSW. |
| 10 Feb 2005 |
0423 |
NOAA 16 (visible, 0.5 nm) |
Ash and steam; 475 NM (967 km) trending to WSW. |
| 10 Feb 2005 |
2251 |
DMSP F15 (visible, 0.3 nm) |
Ash and steam for ten's of kilometers WSW from Anatahan; vog at greater distances visible up to at least 475 NM (967 km) from the volcano. |
| 11 Feb 2005 |
0110 |
NASA TERRA MODIS (1 km resolution) |
One of the longer-extended plumes identified in this set, trending SW and reaching 525 NM (~972 km) from source to identified vog near the SW corner of the image. Ash and steam to ten's of kilometers from source. |
| 11 Feb 2005 |
0412 |
NOAA 16 (0.5 nm) |
Ash and steam plume that gradually broadens as it drifts WSW. The plume was ultimately identified as vog in the more distal areas. Total length identified 505 NM (936 km). |
| 11 Feb 2005 |
0415 |
NASA AQUA MODIS (500 m resolution) |
Plume clearer than on most other images in this set, with few weather clouds obscuring; SW-directed plume identified as ash and steam near source; vog in distal areas to ~150 NM (~280 km). |
| 11 Feb 2005 |
0702 |
GOES-9 (visible) |
Longest-extending plume of this set; ash and steam WSW of volcano; vog detected at 850 NM (~1,600 km) from Anatahan. |
| 12 Feb 2005 |
0401 |
NOAA 16 (visible, 0.3 nm) |
W-directed plume with ash/steam near source, vog at 355 NM (657 km). |
| 12 Feb 2005 |
2316 |
DMSP F16 (visible, 0.3 nm) |
SW-directed plume, ~140 NM long (~260 km). |
| 13 Feb 2005 |
0100 |
NASA TERRA MODIS (500 m resolution) |
SW-directed plume, ~200 NM (~370 km) long. |
| 13 Feb 2005 |
0124 |
NOAA 17 (visible, 0.5 nm) |
W-directed plume, ~360 NM long (~670 km). |
| 13 Feb 2005 |
1229 |
NOAA 17 IR (0.5 nm) |
WNW-directed plume, 95 NM (180 km) long. |
| 13 Feb 2005 |
*2303 |
DMSP F16 (visible, 0.3 nm) |
SW-directed plume, ash and steam for much of 140 NM (260 km) length (unusually clear conditions). |
| 14 Feb 2005 |
0101 |
NOAA 17 IR (0.5 nm) |
Elongate ash-and-steam plume stretched SW to ~120 NM (~220 km). |
| 14 Feb 2005 |
0101 |
NOAA 17 (visible, 0.5 nm) |
Ash and steam plume(s) near source; vog visible on image to over 400 NM (740 km). |
| 14 Feb 2005 |
0305 |
NASA AQUA MODIS (250 m resolution) |
SSW-directed plume with ash and steam, but length undisclosed. |
| 14 Feb 2005 |
0519 |
NOAA 16 (visible, 0.5 nm) |
W-directed ash-and-steam plume in the near source, vog seen ~500 NM (~930 km) to the W. |
| 15 Feb 2005 |
0038 |
NOAA 17 (visible, 0.5 nm) |
Gravity waves to the W for 25 NM (~45 km); faint vog seen to ~80 km (~150 km). |
| 15 Feb 2005 |
0045 |
NASA TERRA MODIS (500 m resolution) |
(Similar to above) |
| 15 Feb 2005 |
0350 |
NASA TERRA MODIS (1 km resolution) |
Ash and steam ~350 NM to the W to SW; faint vog in more distal areas. |
| 15 Feb 2005 |
0507 |
NOAA 16 (visible, 0.5 nm) |
Plume directed WSW stretching 345 NM (640 km). |
| 15 Feb 2005 |
0812 |
NOAA 15 (IR, 0.5 nm) |
Ash and steam directed WSW stretching 175 NM (326 km). |
Randy White of the U.S. Geological Survey noted that the energy release from seismic stations monitoring Anatahan dropped to near zero on 13 February 2005, yet a monitoring microphone continued to indicate considerable acoustic-energy release. Corresponding to this, a MODIS image clearly showed ash still being emitted early on 14 February (see table 3). In other words, the seismicity failed to accurately portray the eruption's vigor.
Reporters Katie Worth and Natalie Quinata wrote in the 5 February 2005 issue of the Pacific Daily News that many students in school on Guam had been sent home after experiencing dizziness or nausea because of the foul-smelling 'vog' or volcanic smog hovering over the island from the eruption. Guam lies ~ 320 km S of Anatahan.
John Ravelo wrote a news article for the Saipan Tribune published on 15 February with the title "Anatahan ash cloud continues to hinder flights." Ravelo said that, "An aircraft coming from Manila to Saipan experienced zero visibility before landing at the Francisco C. Ada-Saipan International Airport yesterday morning, prompting the carrier's pilots to fly around the island and search for a clearer approach to the runway. The passenger aircraft landed safely at the airport, but the hazy condition delayed its arrival."
At about 0909 on 14 February, the Washington Volcanic Ash Advisory Center (VAAC) reported that a plume of ash extended SW of the volcano at an altitude of 4.3 km. The plume was 18-28 km wide. Later in the afternoon, the Washington VAAC reported an ash plume below an altitude of 2.7 km that extended SW of the volcano for about 460 km. The VAAC also forecasted that the plume would shift to a more westerly direction within the next 12 hours.
According to Ravelo's 15 February Saipan Tribune article, the CNMI Emergency Management Office and the U.S. Geological Survey "said in a joint report that the magnitude of the volcanic eruption declined during the past few days." During the eruption's peak on 26 January and 1 February 2005, however, the article stated that both agencies noted that the volcano sent ash to about 4.6-6.1 km altitude.
A message from Holliday filed at 0100 UTC on 17 February 2005 included a series of remarks, mainly from unnamed scientists on the scene in the field. As background prior to presenting those remarks, we note that the term 'RSAM' (real-time seismic amplitude) signifies estimates the average amplitude of ground shaking. RSAM values increase with increases in tremor amplitude or the rate of occurrence and size of earthquakes. The RSAM estimates the seismicity during intervals when many earthquakes might occur, times when rapid earthquake-magnitude assessments might become impractical. The remarks follow.
"Over the past 24 hours, the eruptive activity at Anatahan apparently continued to decline, with RSAM levels at the seismic station ANAT now only marginally above the levels recorded just before the 5 January eruption began. Microphone amplitudes have also dropped to similar levels.
"The 2003 crater floor is now essentially entirely covered by fresh lava [with] a diameter of about one kilometer. The current eruption peaked during the period between 26 January and 2 February [2005], during which the volcano sent ash as high as 15,000 to 20,000 feet a.s.l. [~ 5,000 to ~ 6,000 m] . . .. In the days following, ash blew as far as 100 nautical miles [185 km] and vog blew nearly 600 [nautical] miles [~ 1,100 km] downwind.
"The third historical eruption of Anatahan began on 5 January, after three days of precursory seismicity. On 6 January frequent strombolian explosion signals began and by the next day ash was rising to 10,000 feet [~ 3 km] and blowing 40 nautical miles [72 km] downwind. Bombs a meter in diameter were being thrown hundreds of feet in the air [ 1 foot = 0.305 m]. By January 20 explosions were occurring every 3 to 10 seconds and fresh ejecta and small lava flows had filled the innermost crater to nearly the level of the pre-2003 East Crater floor.
"The Emergency Management Office, Office of the Governor, CNMI, has placed Anatahan Island off limits until further notice and concludes that, although the volcano is not currently dangerous to most aircraft within the CNMI airspace, conditions may change rapidly, and aircraft should pass upwind of Anatahan or beyond 30 km downwind from the island and exercise due caution within 30 km of Anatahan."
Geologic Background. The elongate, 9-km-long island of Anatahan in the central Mariana Islands consists of a large stratovolcano with a 2.3 x 5 km compound summit caldera. The larger western portion of the caldera is 2.3 x 3 km wide, and its western rim forms the island's high point. Ponded lava flows overlain by pyroclastic deposits fill the floor of the western caldera, whose SW side is cut by a fresh-looking smaller crater. The 2-km-wide eastern portion of the caldera contained a steep-walled inner crater whose floor prior to the 2003 eruption was only 68 m above sea level. A submarine cone, named NE Anatahan, rises to within 460 m of the sea surface on the NE flank, and numerous other submarine vents are found on the NE-to-SE flanks. Sparseness of vegetation on the most recent lava flows had indicated that they were of Holocene age, but the first historical eruption did not occur until May 2003, when a large explosive eruption took place forming a new crater inside the eastern caldera.
Information Contacts: Charles Holliday, U.S. Air Force Weather Agency (AFWA), Offutt Air Force Base, Nebraska 68113, USA; Randy White, U.S. Geological Survey, 345 Middlefield Road, Menlo Park, CA 94025-3591 USA; Katie Worth and Natalie Quinata, Guam Pacific Daily News, P.O. Box DN, Hagatna, Guam 96932, USA (URL: http://www.guampdn.com/); John Ravelo, Saipan Tribune (15 February 2005), PMB 34, Box 10001, Saipan, MP 96950, USA (URL: http://www.saipantribune.com/); Operational Significant Event Imagery (OSEI) team, World Weather Bldg., 5200 Auth Rd Rm 510 (E/SP 22), NOAA/NESDIS, Camp Springs, MD 20748, USA (URL: https://www.nnvl.noaa.gov/); Washington Volcanic Ash Advisory Center (VAAC), Satellite Analysis Branch, NOAA/NESDIS E/SP23, NOAA Science Center Room 401, 5200 Auth Road, Camp Springs, MD 20746, USA (URL: http://www.ssd.noaa.gov/).
Asamayama (Japan) — February 2005 Cite this Report
Asamayama
Japan
36.406°N, 138.523°E; summit elev. 2568 m
All times are local (unless otherwise noted)
Maps of 2004 tephra deposits; radar images of the crater's interior and a dome
Setsuya Nakada and Yukio Hayakawa provided follow-up information on events at Asama since our last report (BGVN 30:01). Asama's largest recent explosion occurred on 1 September 2004, and the second largest, on 14 November 2004. Subsequent eruptions have been absent except for a small one in early December 2004.
The eruption that started on 1 September 2004 was characterized by an increase in the number of A-type earthquakes occurring during and after the main phase of explosions (based on data collected by the University of Tokyo's Earthquake Research Institute (ERI) and the Japan Meteorological Agency). Deep seismicity peaked at the end of 2004, but had subsequently remained moderate. GPS (global positioning system) instruments maintained ERI and the Geographical Survey Institute (GSI) disclosed inflation of the edifice. This inflationary trend has continued since mid-October 2004.
ERI undertook detailed analysis of earthquake hypocenters and the pressure source for the observed GPS data. This showed the existence of a dike-shaped magma reservoir trending WNW-ESE. The reservoir occurred just W of the summit and 1-2 km below sea level.
Around October 2004 the height of the lava filling the summit crater reached a maximum. Around that time the dome attained a height just ~70 m below the crater's lowest notch (an opening along the N rim). By the end of January 2005, in contrast, the center of the lava pool had deepened, possibly due to draining of the lava body back into the conduit.
A sequence of radar images provided glimpses into changeable features inside the steamy crater. Two images appear here, from 16 September and 15 December 2004 (figures 28 and 29). The former shows a flat-looking disk-shaped extrusion in the crater. The latter shows that the earlier extrusion had by this time become disrupted or perhaps buried.
Strong glowing at the summit was considered to be due to significant degassing after the main explosive phase. SO2 flux peaked around October (at ~5,000 metric tons a day) and has continued at a relatively high level, as much as 2,000 to 3,000 metric tons a day.
The eruptions emitted andesite (SiO2 ~61%), with high crystallinity, and containing partially melted sedimentary and other rock (felsic tuff?). The rock chemistry has remained uniform throughout the eruptions of the past several thousand years, though the inclusion of melted sedimentary rock was absent in products erupted prior to 2004.
Yukio Hayakawa provided a composite isomass map of 2004 Asama tephra deposits (figure 30). By far the largest deposit of the year erupted on 1 September. The smallest documented deposit occurred on 10 October. Ash deposits from activity on 1 September drifted NE, deposits from 16 September drifted SSE; 23 September, NNE; 29 September, N; 10 October, NE; and 14 November, E.
Geologic Background. Asamayama, Honshu's most active volcano, overlooks the resort town of Karuizawa, 140 km NW of Tokyo. The volcano is located at the junction of the Izu-Marianas and NE Japan volcanic arcs. The modern Maekake cone forms the summit and is situated east of the remnant of an older andesitic volcano, Kurofuyama, which was destroyed by a late-Pleistocene landslide about 20,000 years before present (BP). Growth of a dacitic shield volcano was accompanied by pumiceous pyroclastic flows, the largest of which occurred about 14,000-11,000 BP, and by growth of the Ko-Asamayama lava dome on the east flank. Maekake, capped by the Kamayama pyroclastic cone that forms the present summit, is probably only a few thousand years old and has observed activity dating back at least to the 11th century CE. Maekake has had several major Plinian eruptions, the last two of which occurred in 1108 (Asamayama's largest Holocene eruption) and 1783 CE.
Information Contacts: Setsuya Nakada, Volcano Research Center, Earthquake Research Institute (ERI), University of Tokyo, Yayoi 1-1-1, Bunkyo-ku, Tokyo 113, Japan (URL: http://www.eri.u-tokyo.ac.jp/VRC/index_E.html); Yukio Hayakawa, Faculty of Education, Gunma University, Aramaki 4-2, Maebashi Gunma 371-8510, Japan (URL: http://www.hayakawayukio.jp/English.html); Geographical Survey Institute, Ministry of Land, Infrastructure and Transport, 1, Kitasato, Tsukuba-shi, Ibaraki-ken 305-0811 Japan (URL: http://www.gsi.go.jp, with radar data (text in Japanese): http://www.gsi.go.jp/BOUSAI/ASAMA/); Japan Meteorological Agency, Otemachi, 1-3-4, Chiyoda-ku Tokyo 100-8122, Japan (URL: http://www.jma.go.jp/).
Kick 'em Jenny (Grenada) — February 2005 Cite this Report
Kick 'em Jenny
Grenada
12.3°N, 61.64°W; summit elev. -185 m
All times are local (unless otherwise noted)
Monitored and quiet; multi-beam finds craters and domes
The University of West Indies Seismic Research Unit (SRU) has augmented their instrumental monitoring network and warning system at Kick 'em Jenny submarine volcano. In addition to long-period and broadband seismometers to sense earthquakes, they have also employed tide gauges to measure seawater disturbances, hydrophones to discern submarine explosions, and tilt meters and global positioning system (GPS) stations to detect long-term ground deformation. The instruments may disclose anomalies and critical symptoms before an eruption begins. Various combinations of these instruments were installed at Mt. St. Catherine, Sauteurs, The Sisters Rocks, Isle de Ronde, Isle de Caille, and Carriacou (figure 4).
The NSF Caribbean Tsunami Workshop was held in March 2004 (Mercado-Irizarry and Liu, 2004). The Workshop's program ended its Introduction section with this statement: " . . . Kick 'em Jenny, close to the islands of the southeastern Caribbean (just 10 km N of Grenada), is of much concern to the local governments. Past eruptions during the last century (1939, 1965) resulted in observed deep water tsunamis, with the one in 1939 being measured as 1 m high [Shepherd, 2001]. The concern is such that, for the first time (at least in the region), a banking institution (the Caribbean Development Bank) is funding a monitoring program [at] the volcano."
A 29 December 2004 article entitled "Tsunami warning system for the Caribbean," posted on the SRU website, also addressed the issue. It noted that, "The devastation caused by the tsunami which ravaged several Asian countries on 26th December 2004 has sparked discussion on the importance of a tsunami early warning system in the Caribbean. While in theory such a system may seem invaluable in light of the Asian disaster, scientists at the Seismic Research Unit currently believe that several factors should be seriously considered before assuming that a tsunami early warning system would be beneficial to the region. Head of the Seismic Research Unit, Dr. Richard Robertson, says that 'Before the region spends valuable resources on setting up new instruments for a tsunami early warning system, we need to strengthen our existing networks and focus on improving public education and communication activities with regard to geologic hazards in the region.'"
Gas release, T-phase seismicity, and minor eruption clouds. The question of whether or not there is strong fumarolic activity in the crater has been a source of speculation for a number of years. It has been suggested that warmed water rising in convection currents contributed to the reputation of the Kick 'em Jenny region for rough water. The emission of large quantities of bubbles was observed in 1989 when the submersible Johnson Sealink entered the crater a few months after the 1988 eruption (SEAN 14:05).
A water column containing a significant proportion of rising gas bubbles results in a local lowering of the seawater's density. (The rising bubbles displace some of the sea water, and at or near the sea surface they provide negligible support to the ship, thus resulting in a loss of buoyancy for ships passing over the volcano.) To account for this hazard, and the risk posed by ejecta, an exclusion zone 1.5 km in radius was created over the volcano (Shepherd, 2004).
At least 11 historical episodes of hydro-acoustic (T phase) signals have been detected since 1939 when an eruption cloud rose 275 m above the sea surface (Shepherd and Robson, 1967, Smith and Shepherd, 1995, Lindsay et al., 2005). Material was also ejected during the 1974 eruption, and the 1988 eruption was associated with turbulent discolored water (Lindsay and others, 2005). Some of these were described in Smithsonian reports dating back to 1977.
Regarding T-Phase waves. A short-period wave group from a seismic source that has propagated in part through the ocean is called T-phase or T(ertiary)-wave (Linehan, 1940; Tolstoy and Ewing, 1950; Walker and Hammond, 1998). The wave group propagates with low attenuation as hydro-acoustic (compressional) waves in the ocean, constrained within a low sound-speed wave guide (the sound fixing and ranging-SOFAR-channel) formed by the sound-speed structure in the ocean. The T-phase signal may be picked up by hydrophones in the ocean or by land seismometers. Upon incidence with the continental shelf/slope, the wave group is transformed into ordinary seismic waves that arrive considerably later than seismic wave groups from the same source that propagated entirely through the solid Earth.
2002 and 2003 Surveys. A 2003 oceanographic survey of Kick 'em Jenny was conducted jointly by the National Oceanic and Atmospheric Agency (NOAA), SRU, and the University of Rhode Island (URI) using the NOAA Research VesselRonald H. Brown. This survey supplemented data obtained previously from a cruise passing the volcano on 12 March 2002 (BGVN 27:06). That effort produced the bathymetric image ... reproduced here as figure 5 (BGVN 27:06). The arcuate scarp on the image suggested that the volcano was once the scene of sector collapse. The inferred submarine debris avalanche has an estimated total volume of ~ 10 km3, and a maximum runout distance of at least 15 km (Sigurdsson and others, 2004; Shepherd 2004). The collapse clearly occurred prior to the growth of the small central edifice at Kick 'em Jenny. The ages of these various features remain unknown.
Figures 6 and 7 highlight the discovery of other volcanic features on the sea floor just E of Kick 'em Jenny. Little is known about them aside from their basic morphology illuminated by the 2003 survey. Discoveries near Kick 'em Jenny included three craters (C1, C2, and the largest, Kick 'em Jack) and two domes (D1 and D2). The mutual relations and ages of these newly recognized features remain uncertain.
References. Linehan, D., 1940, Earthquakes in the West Indian region: Transactions, American Geophysical Union, Pt. II, p. 229-232.
Mercado-Irizarry, A., and Liu, P. L.-F., 2004, NSF Caribbean Tsunami Workshop, 30-31 March 2004: San Juan Beach Hotel, San Juan, P.R., sponsored by the U. S. National Science Foundation, Puerto Rico State Emergency Management Agency, Department of Marine Sciences at the University of Puerto Rico at Mayagüez, and the Sea Grant Program at the University of Puerto Rico.
Lindsay, J. M., Shepherd, J.B., and Wilson D., 2005, Volcanic and scientific activity at Kick 'em Jenny submarine volcano 2001-2002: Implications for volcanic hazard in the Southern Grenadines, Lesser Antilles: Natural Hazards, v. 31, p. 1-24.
Shepherd, J.B., and Robson, G.R., 1967, The source of the T-phase recorded in the Eastern Caribbean on October 24, 1965: Bull. Seismol. Soc. Amer., v. 57, p. 227-234.
Shepherd, J.B., 2001, Marine and coastal hazards from Kick 'em Jenny submarine volcano, southern Grenadine Islands (copyrighted slide-show presentation): URL: http://www.uwichill.edu.bb/bnccde/grenada/grendoc/KickemJenny/kickemjenny.html.
Shepherd, J.B., 2004, Report on studies of Kick 'em Jenny submarine volcano March 2002 and March 2003 with updated estimates of marine and coastal hazards: The University of the West Indies Seismic Research Unit, KEJ Report Feb 2004, St. Augustine, Trinidad and Tobago, West Indies, 44 p.
Sigurdsson, H., Carey, S., and Wilson, D., 2004, Debris avalanche formation at Kick 'em Jenny submarine volcano, in NSF Caribbean Tsunami Workshop, 30-31 March 2004, San Juan Beach Hotel, San Juan, P.R. (URL: http://nsfctw.uprm.edu/agenda.html).
Smith, M., and Shepherd, J., 1995, Potential Cauchy-Poisson waves generated by submarine eruptions of Kick 'em Jenny volcano: Natural Hazards, v. 11, p. 75-94.
Tolstoy, I., and Ewing, M., 1950, The T phase of shallow-focus earthquakes: Bulletin of the Seismological Society of America, v. 40, p. 25-51.
Walker, D.A., and Hammond, S.R., 1998, Historical Gorda Ridge T-phase swarms; relationships to ridge structure and the tectonic and volcanic state of the ridge during 1964-1966: Deep-Sea Research Part II, v. 45, n. 12, p. 2531-2545.
Geologic Background. Kick 'em Jenny, an active submarine volcano 8 km off the N shore of Grenada, rises 1,300 m from the sea floor. Recent bathymetric surveys have shown evidence for a major arcuate collapse structure, which was the source of a submarine debris avalanche that traveled more than 15 km W. Bathymetry also revealed another submarine cone to the SE, Kick 'em Jack, and submarine lava domes to its S. These and subaerial tuff rings and lava flows at Ile de Caille and other nearby islands may represent a single large volcanic complex. Numerous eruptions have occurred since 1939, mostly documented by acoustic signals. Prior to the 1939 eruption, when an eruption cloud rose 275 m above the ocean and was witnessed by a large number of people in northern Grenada, there had been no written mention of the volcano. Eruptions have involved both explosive activity and the quiet extrusion of lava flows and lava domes in the summit crater; deep rumbling noises have sometimes been heard onshore. Recent eruptions have modified the morphology of the summit crater.
Information Contacts: Seismic Research Unit (SRU), The University of the West Indies, St. Augustine, Trinidad & Tobago, West Indies (URL: http://www.uwiseismic.com); Research Vessel Ronald H. Brown, National Oceanic and Atmospheric Agency (NOAA), Marine Operations Center, Atlantic, 439 West York Street, Norfolk, VA 23510-1145, USA (URL: http://oceanexplorer.noaa.gov/explorations/).
Manam (Papua New Guinea) — February 2005 Cite this Report
Manam
Papua New Guinea
4.08°S, 145.037°E; summit elev. 1807 m
All times are local (unless otherwise noted)
One death, 14 injuries due to 27 January eruption; stratospheric injection
On 24 October 2004 a strong eruption occurred at Manam (BGVN 29:10). Several more significant eruptions followed in late 2004 (BGVN 29:11), leading to the most severe and damaging one, which took place on 27 January 2005. That event occurred in conditions favorable to satellite imagery, enabling Andrew Tupper of the Darwin Volcanic Ash Advisory Centre (VAAC), and colleagues, to confirm that the associated ash cloud reached to over 20 km altitude, well into the stratosphere.
Satellite remote sensing documented 5 eruption plumes ascending to over 15 km during this issue's reporting interval, 23 October 2004-28 January 2005. One additional plume may have been missed by remote sensing in adverse weather conditions. Various images from the 2004 and 2005 eruptions are on the Darwin VAAC website (see Information Contacts, below). Sulfur dioxide is discussed there as well as on websites of the OMI-TOMS Volcanic Emissions Group and related sites.
The Bulletin has benefitted from reports by the Rabaul Volcano Observatory (RVO), the media, and the Darwin VAAC. Although the 27 January eruption received comparatively little press coverage, it caused several injuries and one death. RVO staff working at Manam faced challenging, hazardous conditions. The island had been home to ~ 9,500 now-displaced residents.
Summary of RVO observations. During the reporting interval both lava flows and pyroclastic flows reached the sea at various times (BGVN 29:10 and 29:11). The main pathways were the NE and SE valleys (table 2, figures 16 and 17). Intervals of tremor were common.
Table 2. A summary of RVO observations involving lava flows and pyroclastic flows associated with Manam's eruptions during 23 October 2004-28 January 2005. Andrew Tupper (of the Darwin VAAC) compiled this list from available RVO reports and communications with RVO staff.
| Date |
Event Description |
| 24 Oct 2004 |
Pyroclastic flows reached the sea and lava flowed 600 m down the SE valley. |
| 31 Oct 2004 |
Three-lobed lava flow in NE valley, and possibly a small flow in the NW valley. |
| 11 Nov 2004 |
Lava in NE valley. |
| 23-24 Nov 2004 |
Lava in NE valley. "The flow that headed towards Bokure 1 terminated about 100 m away from the main road . . . the Kolang lava flow had reached the sea" (reported by Warisi observer Herman Tibong). Ash on roofs caused a number of houses to collapse. |
| 19-20 Dec 2004 |
Lava and pyroclastic flows in SE valley. Pyroclastic flows stopped 200 m from the sea on the 19th (no report on what happened on the 20th). |
| 27-28 Jan 2005 |
14 injured and 1 dead at Warisi; debris voluminous and widespread on the island; ashfall reported ~230 km W of Manam. |
Eruption on 27 January 2005. RVO reported that eruptive activity during the evening of 27 January was more severe than previous eruptions of the current eruptive period. As indicated on table 1, during 27-28 January there were 14 people injured and one person killed at Warisi village. RVO's monitoring base at Warisi was completely destroyed, taking out its HF radio, seismograph, and a satellite phone, thus preventing RVO from providing information on the current level of activity. The phone had been donated by an airline just a few weeks prior, provided as a means of aiding eruption-warning efforts. The station sat on the E flank at Warisi village (figures 1 and 2). RVO later recovered the station's seismograph and installed it on the island's NW side; they also restored radio communications.
According to the Papua New Guinea (PNG) news source,The National, some people had returned on 27 January from the displacement camps on the mainland to gather food from their island gardens, only to have their boat destroyed by impacts from erupted rocks. The National also reported that many of the residents of the island who were originally evacuated in November 2004 had returned. There were reports of several houses that had burned down from hot emissions and others that collapsed under the weight of ash and pyroclastic material. It was reported that after the large eruption on 27 January, local authorities planned to evacuate about 2,000 residents.
Ash fell at ~ 230 km W of Manam (in Ambunti district, East Sepik province, PNG). Tupper recognized NW monsoon winds that took low-level ash SE. Thus, the ash that fell in Ambunti must have traveled at a higher altitude, which Tupper estimated to be above 6 km altitude.
The October-January eruptive sequence. Figure 18 plots eruption heights versus time during 23 October 2004 to late January 2005. Three kinds of eruption-height estimates appear: those from pilot reports, RVO's estimates (ground-based observations), and Tupper's post-analysis studies of satellite data. In a descussion below, Tupper mentions the differences between the three height-estimate techniques. The line showing alert level corresponds to the right-hand scale. Six eruptive clouds are clear on the graph.
The 24 October eruption at Manam occurred just before the Terra and Aqua satellites passed over. The data from those satellites, and from AVHRR and GOES satellites, indicated a very ice-rich cloud. Associated with Manam's eruption on 24 October, the coldest temperature measured from the high-level cloud was about 204 K (a couple of hours after the eruption), which translated to an altitude of about 15-18 km (a height supported by the ash cloud's subsequent dispersion, including wind trajectories consistent with the ~ 18 km altitude plotted on figure 3). There was no evidence of significant stratospheric penetration. Pilot reports for the cloud's top were generally lower, as is usual for large eruptions (Tupper and Kinoshita, 2003).
Figure 19 presents a photo of the 11 November eruption plume as seen by Air Niugini pilot David Innes. He estimated the visible portion of the plume height at "30,000 feet" (~ 9 km), but the cloud probably ascended at least a bit higher as it entered into masking cirrus clouds from a tropical disturbance to the N, so the pilot's estimate might be stated as 'above 9 km.' RVO's ground observer estimated a plume at ~ 8 km slightly earlier in the eruption, on about 10 November. The satellite-based analysis was thwarted by the cirrus cloud cover during this eruption.
From 20 December until just before the 27 January eruption, no plumes or hot spots were visible. Few plumes were reported by RVO, and none were seen by pilots (table 2). The 27 January eruption began about 1400 UTC; and an Aqua/MODIS image from 0507 UTC is shown as figure 20.
The Darwin VAAC initially estimated the 27 January eruption cloud's maximum height as 21 km altitude, but later analysis found the range 21-24 km a better estimate. Infrared 11-µm imagery from GOES-9 at 1440 UTC and Aqua/MODIS at 1539 UTC on 27 January showed 'warm' spots in the middle of the umbrella cloud of 215.4 K and 210.4 K, respectively, indicating a substantial overshoot of the cloud top into the warmer stratosphere (tropopause temperatures were around 187 K). The GOES-9 temperature may be less useful because of poorer satellite resolution and calibration, and because at that stage the cloud may not have come into equilibrium with its environment. Comparing these temperatures to a temperature sonde taken from nearby Manus Island at 0000 UTC on 28 January suggests a cloud altitude of 21-24 km. Tupper plotted the more conservative (smaller) value on figure 3.
The 27 January eruption cloud was extremely difficult to track, as it was ice-rich and mixed with monsoonal storms, but dispersion models and satellite analysis suggest that a mid-tropospheric portion spread quite quickly W over Irian Jaya, while higher cloud remained near the eruption site for some time. The best 'tracer' for the cloud in operations turned out to be the strong 'ice' signature in split-window imagery similar to the Hekla (Iceland) eruption in the year 2000.
Another large eruption occurred around 2300 on 28 January. That plume's height plots at 18 km altitude (figure 3).
Preliminary synopsis. Tupper wrote that he and his group were aware of five or six major events "during these [Manam] eruptions that have generated high (over 10 km altitude) eruption clouds—23-24 October 2004, 31 October 2004, 10-11 November 2004, 23-24 November 2004, 19-20 December 2004, and 27-28 January 2005 [figure 3]. On each of these occasions a high and sometimes persistent cloud has developed over a stronger phase of the eruption. The largest event by far has been the 27-28 January event, which was the only one to clearly penetrate into the stratosphere.
"Attached is a graph [figure 3] showing the heights reported by ground observers, by local pilots, and derived from satellite analysis. Some major differences of perspective are evident. I believe that, in general, the ground observer heights are most accurate for the lower eruptions, pilot reports can be accurate or quite inaccurate depending on the pilot and the viewing angle, and satellite estimates are most accurate for the larger eruptions.
"The cold-point tropopause generally occurs at around 16-18 km at this time of year in Papua New Guinea, and scores of thunderstorms reach these altitudes every day in the area. Consequently, it is not surprising that the larger eruptions are easily able to reach these altitudes. The tropopause is also the major dynamical limit on the rise of the larger eruption clouds. The eruption of 27 January clearly penetrated into the stratosphere, to altitudes of 21-24 km, based on the warmth of the central umbrella cloud, and the subsequent dispersion of the ice-cloud, and the SO2 from the eruption."
"All of the eruption clouds have been water/ice rich, and difficult to track using satellite techniques. The ash signal at altitudes above the freezing level has been overwhelmed by the ice signal in infrared split-window imagery. Similarly, in visible and true-colour imagery, even where the lower level clouds have shown an ash signal, the higher clouds have been a brilliant white and have only been revealed as volcanic in short-wave infrared (3.7 µm) imagery and with SO2 retrievals. For example, [in BGVN 29:11 (the first of two satellite photos)] the large brilliant white cloud to the N of Manam (overlying the dark ash cloud) derives from the same 24 October eruption."
References. Tupper, A., and Kinoshita, K., 2003, Satellite, air and ground observations of volcanic clouds over island of the Southwest Pacific: South Pacific Study, v. 23, no. 2, p. 21-46.
Geologic Background. The 10-km-wide island of Manam, lying 13 km off the northern coast of mainland Papua New Guinea, is one of the country's most active volcanoes. Four large radial valleys extend from the unvegetated summit of the conical basaltic-andesitic stratovolcano to its lower flanks. These valleys channel lava flows and pyroclastic avalanches that have sometimes reached the coast. Five small satellitic centers are located near the island's shoreline on the northern, southern, and western sides. Two summit craters are present; both are active, although most observed eruptions have originated from the southern crater, concentrating eruptive products during much of the past century into the SE valley. Frequent eruptions, typically of mild-to-moderate scale, have been recorded since 1616. Occasional larger eruptions have produced pyroclastic flows and lava flows that reached flat-lying coastal areas and entered the sea, sometimes impacting populated areas.
Information Contacts: Andrew Tupper, Darwin Volcanic Ash Advisory Centre, Australian Bureau of Meteorology (URL: http://www.bom.gov.au/info/vaac); Rabaul Volcano Observatory (RVO), P.O. Box 386, Rabaul, Papua New Guinea; National Disaster Centre, Department of Provincial Affairs and Local Level Government (Ministry of Inter-Government Relations), PO Box 4970, Boroko, National Capital District, Papua New Guinea (URL: http://www.pngndc.gov.pg/); The National Online, Lot 13 Section 38, Waigani Drive Hohola, PO Box 6817 Boroko, National Capital District, Papua New Guinea (URL: http://www.thenational.com.pg/); Papua New Guinea Mapserver (Mapu), EDF 8/9 EU-SOPAC Reducing Vulnerability of Pacific ACP States Project; David Innes, Flight Safety Office, Air Niugini, P.O.Box 7186, Boroko, Port Moresby, National Capital District, Papua New Guinea (URL: http://www.airniugini.com.pg/); Simon Carn, TOMS Volcanic Emissions Group, University of Maryland, 1000 Hilltop Circle, Baltimore, MD 21250, USA (URL: https://so2.gsfc.nasa.gov/).
Marion Island (South Africa) — February 2005 Cite this Report
Marion Island
South Africa
46.9°S, 37.75°E; summit elev. 1230 m
All times are local (unless otherwise noted)
Small eruption seen 24 June 2004 on S side of this Antarctic island
A small volcanic eruption was observed on 24 June 2004 by a member of the South African National Antarctic Programme's (SANAP) over-wintering team on Marion Island (figure 1). While conducting fieldwork in a mountainous area on the S part of the island, David Heddings was able to video an eruption that comprised gas and small pieces of scoria (a few centimeters in diameter).
While it has been assumed that small volcanic eruptions often take place on Marion Island, the remoteness and hilly terrain over much of the island has meant that such events have not been witnessed. The last confirmed eruption on Marion took place in 1980 when ornithologists found a fresh basaltic lava flow on the W side of the Island.
Geologic Background. Marion Island lies at the SW end of a submarine plateau immediately south of the SW Indian Ocean Ridge, opposite Prince Edward Island. The low profile of the 24-km-wide dominantly basaltic and trachybasaltic volcano is formed by two young shields that rise above a flat-topped submarine platform. The island includes about 150 cinder cones, smaller scoria cones, and coastal tuff cones. The earliest dated eruptions took place about 450,000 years ago, but much of the island is covered by Holocene aa and pahoehoe lava flows, and more than 130 scoria cones formed during the Holocene. Many of these appear younger than the 4,020 BP peat layer overlying one of the flows (Verwoerd, 1981). Unvegetated lava flows appear to be only a few hundred years old (Verwoerd, 1967). An eruption in 1980 produced explosive activity and lava flows from a 5-km-long fissure that extended from the summit to the west coast.
Information Contacts: Ian Meiklejohn and David Hedding, University of Pretoria, 0002, Pretoria, South Africa, 012-420 4049 (URL: http://www.up.ac.za/).
Rinjani (Indonesia) — February 2005 Cite this Report
Rinjani
Indonesia
8.42°S, 116.47°E; summit elev. 3726 m
All times are local (unless otherwise noted)
Witnessed eruptions in October 2004 with material escaping from two vents
Rinjani had increases in some monitored parameters and hazard status during this report interval, covering much of 2004 through 30 January 2005. An eruption occurred on 1 October 2004. We previously presented a brief aviation report concerning an unconfirmed ash cloud from Rinjani in September 1995 (BGVN 20:10). In their text associated with recent reporting used here, The Directorate of Volcanology and Geological Hazard Mitigation (DVGHM) noted that Rinjani's last explosions occurred during 4 June 1994-January 1995. Those explosions came from Barujari volcano (see Background for morphologic information).
On 27 September 2004 a DVGHM report noted the decision to increase Rinjani's hazard status to Alert Level II (Yellow, on a scale with the most hazardous at IV). During the last third of 2004, the number of volcanic and tectonic earthquakes had increased. Their increase followed a rise in the number of tectonic earthquakes that began 18 August 2004. Tremor registered on 23, 24, 25, and 26 September 2004. Tremor amplitudes ranged between 12 and 13.5 mm, and the duration of the tremor stood between 94 and 290 seconds.
At 0530 on 1 October 2004 Rinjani clearly erupted. The observation station where visual monitoring occurs (Sembalun Lawang) lies in a spot where the caldera wall blocks views into the active zone, so a smaller eruption might have been missed. The eruption caused authorities to immediately raise the hazard status to Alert Level III (Orange). Further details have not emerged regarding the initial 1 October eruption. During the next few days of eruptions, the lake Segara Anak remained undisturbed.
During 2-5 October 2004 continued explosions sent ash columns ~ 300 to 800 m above the summit. Gray, thick ash columns drifted to the N. Detonation sounds accompanied every explosion. Successive explosions occurred at intervals of 5 to 160 minutes. Explosions vented on the NE slope of Barujari volcano. Some material also vented from Barujari's peak, however, and fell down around its edifice. A press report in the Jakarta Post indicated that evacuations were not considered necessary.
Available monthly seismic data appears in table 2. Seismicity was dominated by explosion earthquakes with maximum amplitudes of 30 mm. Explosion and emission signals were common during February and March 2004 and became absent or unreported after April 2004. Data were unavailable for October 2004 when known eruptions occurred.
Table 2. Available seismicity at Rinjani during 10 February 2004 to 30 January 2005. The symbol " - " means not reported. Courtesy of VSI.
| Date |
Volcanic A |
Volcanic B |
Tremor |
Emission |
Explosion |
| 10 Feb 2004 |
2 |
-- |
20 |
3 |
37 |
| 10 Mar 2004 |
3 |
3 |
16 |
5 |
32 |
| 10 Apr 2004 |
-- |
-- |
5 |
-- |
5 |
| 17-23 Jan 2005 |
20 |
28 |
11 |
-- |
-- |
| 24-30 Jan 2005 |
9 |
34 |
11 |
-- |
-- |
During 24 to 30 January 2005, gas plumes remained less than 600 m tall. The tremor record had a maximum amplitude of 1.5 mm.
Geologic Background. Rinjani volcano on the island of Lombok rises to 3726 m, second in height among Indonesian volcanoes only to Sumatra's Kerinci volcano. Rinjani has a steep-sided conical profile when viewed from the east, but the west side of the compound volcano is truncated by the 6 x 8.5 km, oval-shaped Segara Anak (Samalas) caldera. The caldera formed during one of the largest Holocene eruptions globally in 1257 CE, which truncated Samalas stratovolcano. The western half of the caldera contains a 230-m-deep lake whose crescentic form results from growth of the post-caldera cone Barujari at the east end of the caldera. Historical eruptions dating back to 1847 have been restricted to Barujari cone and consist of moderate explosive activity and occasional lava flows that have entered Segara Anak lake.
Information Contacts: Directorate of Volcanology and Geological Hazard Mitigation (DVGHM), Jalan Diponegoro 57, Bandung 40122, Indonesia (URL: http://www.vsi.esdm.go.id/); The Jakarta Post, Indonesia (URL: http://www.thejakartapost.com/).
Sheveluch (Russia) — February 2005 Cite this Report
Sheveluch
Russia
56.653°N, 161.36°E; summit elev. 3283 m
All times are local (unless otherwise noted)
27 February eruption left deposits covering 24,800 km2 to W of volcano
The previous report on Shiveluch (BGVN 29:05) covered activity until 27 May 2004. From May 2004 until September 2004, seismicity at Shiveluch was above background, with many shallow earthquakes recorded 0-5 km beneath the active lava dome, and Shiveluch remained at Concern Color Code Orange. Periods of continuous spasmodic tremor were recorded in May, June, July, and October 2004. Gas-and-steam plumes rising to 3-6 km altitude were frequent, sometimes drifting up to 10 km or more. A small lava flow on top of the active dome, first observed on 21 May, continued to flow until 28 May. On 19 June, a likely ash cloud was seen 10-20 km S of the volcano. The lava dome continued to grow in Shiveluch's active crater.
On 6 September at 2054 an explosion produced small pyroclastic flows and an ash plume that rose to ~ 5.5 km altitude. According to satellite data, 1- to 12-pixel thermal anomalies were registered over the lava dome on 15-16 September 2004. During 23-29 September, 26 strong shallow earthquakes up to M 2.3 were recorded. An explosion on 25 September was accompanied by small pyroclastic flows. The Kamchatka Volcanic Eruptions Response Team (KVERT),again reported seeing a new lava flow at Shiveluch's lava dome around 26 October.
Based on interpretations of seismic data, possible ash-and-gas explosions up to 7 km altitude occurred throughout October (figure 8), November, and December 2004. Possible minor ash-and-gas explosions and hot avalanches also occurred. On 28 December a gas-and-steam plume extended as far as 50 km E.
During January and February 2005, seismicity decreased slightly at Shiveluch but remained above background levels, with weak shallow earthquakes occurring beneath the active dome. Possible weak ash-and-gas explosions and hot avalanches occurred throughout January and February, and gas-and-steam plumes rose up to 2-7 km altitude.
On 13 January, several ash explosions up to 5 km altitude and a pyroclastic flow probably occurred. The Tokyo Volcanic Ash Advisory Center (VAAC) reported an eruption of Shiveluch on 17 January at 1625 with a plume that rose to a height of ~ 4.5 km altitude. On 6 February a pyroclastic flow traveled ~ 2 km down the volcano's flank. On 17 February ash deposits were seen on the volcano's snow-covered lava dome extending to the SE and S.
A large eruption occurred at Shiveluch from 1825 on 27 February to 0100 on 28 February, leading KVERT to raise the Concern Color Code from Orange to Red (the highest level). Meteorological clouds obscured the volcano during the eruption. According to satellite data (NOAA 16 at 1656 UTC on 27 February), a 45-pixel thermal anomaly was registered near the dome (band 3). This anomaly was probably related to a large pyroclastic flow on the SW flank. At this time analysts detected a 45-km-long ash cloud on satellite imagery trending NW of the volcano. At 0900 on the 28th, ash deposits were noted in the town of Klyuchi, ~ 46 km from the volcano. Satellite imagery from 1205 on 28 February showed ash deposits W of Shiveluch covering an area of 24,800 km2. Later that day, an ash cloud extending more than 360 km was centered over the western half of Kamchatka. On 1 March the Concern Color Code was reduced to Orange. Prior to the 27 February eruption, seismicity was above background levels and ash-and-gas plumes were seen on video rising to ~ 3 km above the lava dome.
Explosions deposited ash in Ust'-Hairyuzovo village, about 250 km to the W, on 27 and 28 February, and on 2 March. The seismic station at Shiveluch stopped working on 27 February. According to visual and video data on 2 March, part of a large pyroclastic flow was observed on the SW flank of the volcano. According to satellite data from the USA and Russia, a 2- to 23-pixel thermal anomaly was registered at the dome on 1-3 March. Clouds obscured the volcano at other times. Shiveluch remained at Concern Color Code Orange.
Geologic Background. The high, isolated massif of Sheveluch volcano (also spelled Shiveluch) rises above the lowlands NNE of the Kliuchevskaya volcano group. The 1,300 km3 andesitic volcano is one of Kamchatka's largest and most active volcanic structures, with at least 60 large eruptions during the Holocene. The summit of roughly 65,000-year-old Stary Shiveluch is truncated by a broad 9-km-wide late-Pleistocene caldera breached to the south. Many lava domes occur on its outer flanks. The Molodoy Shiveluch lava dome complex was constructed during the Holocene within the large open caldera; Holocene lava dome extrusion also took place on the flanks of Stary Shiveluch. Widespread tephra layers from these eruptions have provided valuable time markers for dating volcanic events in Kamchatka. Frequent collapses of dome complexes, most recently in 1964, have produced debris avalanches whose deposits cover much of the floor of the breached caldera.
Information Contacts: Olga A. Girina, Kamchatka Volcanic Eruptions Response Team (KVERT), a cooperative program of the Institute of Volcanic Geology and Geochemistry, Far East Division, Russian Academy of Sciences, Piip Ave. 9, Petropavlovsk-Kamchatsky, 683006, Russia, the Kamchatka Experimental and Methodical Seismological Department (KEMSD), GS RAS (Russia), and the Alaska Volcano Observatory (USA); Alaska Volcano Observatory (AVO), a cooperative program of the U.S. Geological Survey, 4200 University Drive, Anchorage, AK 99508-4667, USA (URL: http://www.avo.alaska.edu/), the Geophysical Institute, University of Alaska, PO Box 757320, Fairbanks, AK 99775-7320, USA, and the Alaska Division of Geological and Geophysical Surveys, 794 University Ave., Suite 200, Fairbanks, AK 99709, USA; Tokyo Volcanic Ash Advisory Center, Tokyo Aviation Weather Service Center, Haneda Airport 3-3-1, Ota-ku, Tokyo 144-0041, Japan (URL: https://ds.data.jma.go.jp/svd/vaac/data/).
St. Helens (United States) — February 2005 Cite this Report
St. Helens
United States
46.2°N, 122.18°W; summit elev. 2549 m
All times are local (unless otherwise noted)
On 21 February the still-growing dome stood 160 m higher than the 1980's dome
Growth of the new lava dome inside the crater of Mount St. Helens has continued since the last report (BGVN 29:10), accompanied by low rates of seismicity, low emissions of steam and volcanic gases, and minor production of ash. During such eruptions, episodic changes in the level of activity can occur over days to months. The eruption can also intensify suddenly or with little warning and produce explosions that may cause hazardous conditions within several kilometers of the crater and farther downwind. The current status is Volcano Advisory (Alert Level 2), and the aviation color code is orange.
A small, short-lived explosive event at St. Helens volcano began at approximately 1725 hours on 8 March 2005. Airplane pilot reports indicated that the resulting steam-and-ash plume reached an altitude of about 11 km above sea level within a few minutes and drifted NE.
Results from analysis of imagery by the U.S. Geological Survey of 21 February 2005 showed that the highest part of the new lava dome stands at an altitude of 2.3 km, 160 m higher than the old lava dome, and only 28 m below Shoestring Notch, a low point on the SE crater rim. Further analysis of recent aerial photos revealed that as of 1 February, the whaleback-shaped dome extrusion was about 470 m long and 150 m wide. The new dome and uplifted welt of crater floor and deformed glacier ice have grown to a combined volume of about 38 million m3, almost one-half the volume of the old lava dome.
Geologic Background. Prior to 1980, Mount St. Helens was a conical volcano sometimes known as the Fujisan of America. During the 1980 eruption the upper 400 m of the summit was removed by slope failure, leaving a 2 x 3.5 km breached crater now partially filled by a lava dome. There have been nine major eruptive periods beginning about 40-50,000 years ago, and it has been the most active volcano in the Cascade Range during the Holocene. Prior to 2,200 years ago, tephra, lava domes, and pyroclastic flows were erupted, forming the older edifice, but few lava flows extended beyond the base of the volcano. The modern edifice consists of basaltic as well as andesitic and dacitic products from summit and flank vents. Eruptions in the 19th century originated from the Goat Rocks area on the N flank, and were witnessed by early settlers.
Information Contacts: Cascades Volcano Observatory (CVO), U.S. Geological Survey, 1300 SE Cardinal Court, Building 10, Suite 100, Vancouver, WA 98683-9589, USA (URL: https://volcanoes.usgs.gov/observatories/cvo/); Pacific Northwest Seismograph Network (PNSN), Seismology Lab, University of Washington, Department of Earth and Space Sciences, Box 351310, Seattle, WA 98195-1310, USA (URL: http://www.pnsn.org/).
Veniaminof (United States) — February 2005 Cite this Report
Veniaminof
United States
56.17°N, 159.38°W; summit elev. 2507 m
All times are local (unless otherwise noted)
Ash emissions in January and Strombolian eruptions in February
After a long period of quiescence, Veniaminof began exhibiting increased seismicity and possible low-level eruptive activity from September 2002 through mid-April 2003. Between mid-April 2003 and February 2004 no signs of activity were observed. From February 2004 until the end of June 2004 steam and ash emissions were observed and volcanic tremor and earthquakes recorded (BGVN 29:06).
Activity during July 2004. Throughout July 2004 short intervals of volcanic tremor continued. Small amounts of dark ash were seen in the ice-filled caldera on 27 June. During the second week of July, the Alaska Volcano Observatory (AVO) reported that the tremor correlated well with ash-and-steam plumes as high as 1.5 km altitude; during the rest of the month, these plumes may have reached as high as 3.7 km altitude. On 22 July at 1229, an AVO field crew witnessed a small ash burst rise a few hundred meters above the summit of the intracaldera cone (figure 10). This type of activity had prevailed at Veniaminof during the previous three months. During the last week of July, the cone produced variable amounts of white steam from at least two separate craters near its top. The snow-and-ice field over much of the caldera was covered with a discontinuous, 1- to 2-mm thick ash blanket. No visual observations of ash emissions were made after 22 July, although the recorded seismicity was similar to that observed during ash emissions in the previous few months. Veniaminof remained at Concern Color Code Yellow throughout July.
Activity during August 2004. Episodes of volcanic tremor continued throughout August. No visual observations of ash emissions were made from 22 July through the first week of August, although the recorded seismicity was similar to that observed during ash emissions in the previous weeks. Throughout the month, frequent small ash-and-steam emissions from Veniaminof were visible on the web camera in Perryville and confirmed by AVO geologists working in the area. Bursts of volcanic tremor recorded intermittently on 17 August were probably associated with low-level, short-term ash emissions. Veniaminof remained at Concern Color Code Yellow throughout August 2004.
Activity during September 2004. During the first three weeks of September both low-level tremor and intermittent bursts of tremor continued at Veniaminof. AVO scientists believed tremor episodes likely represented low-level ash-and-steam emissions similar to those observed during the previous two months. Minor emissions of ash and steam were occasionally seen on the web camera during clear weather. During the last week of September, low-level tremor and intermittent small tremor bursts may have occurred at Veniaminof, but high winds in the area caused considerable vibrational noise, masking the signal of interest, and making analysis of seismic records inconclusive. The winds were strong enough to hide evidence of low-level tremor. If the tremor episodes continued, they likely corresponded with low-level ash-and-steam emissions similar to those observed over the previous four months. Cloudy conditions obscured views of the volcano by web camera and satellite. Veniaminof remained at Concern Color Code Yellow throughout September.
Activity during October 2004. Low-level seismic tremor and intermittent small tremor bursts continued. These tremor episodes likely represented low-level ash and steam emissions similar to those observed over the past four months, although cloudy conditions obscured views of the volcano by web camera and satellite. Low-level tremor during 8-15 October correlated with weak steaming of the intracaldera cone as observed on the web camera. No ash emissions were observed, although cloudy conditions over the caldera restricted viewing for much of the week. AVO lowered the Concern Color Code at Veniaminof on 26 October from Yellow to Green. Seismicity, which had been associated with ash emissions during the summer of 2004, decreased to levels that indicated ash, ash-and-steam, or steam emissions were no longer occurring on a regular basis. Since early September, no ash emissions were seen on the web camera and no evidence of ash was visible on satellite imagery. Also, AVO had received no recent reports of ash from pilots or ground observers. AVO considered the intermittent, low-level seismic tremor that continued to be recorded at the volcano to be part of the background activity.
Activity during January 2005. AVO raised the Concern Color Code at Veniaminof from Green to Yellow on 4 January because around that time several small ash emissions from the volcano's intracaldera cone were observed on the web camera in Perryville. Ash emissions were visible starting around 0938, but may have been obscured by meteorological clouds in previous images. The discrete ash emissions were small, rose hundreds of meters above the cone, and dissipated as they drifted E. Minor ash fall was probably confined to the summit caldera. Very weak seismic tremor was recorded beginning on 1 January, and increased slightly over the next 2 days. These seismic signals were similar to those recorded during steam-and-ash emissions in April to October 2004. However, there were no indications from seismic data that events significantly larger than those observed around 4 January were imminent.
AVO raised the Concern Color Code at Veniaminof from Yellow to Orange on 10 January as ash emissions from the volcano's intracaldera cone reached heights of nearly 4 km during 8-10 January (figure 11). Seismicity remained at elevated levels and satellite images showed a persistent thermal anomaly at the intracaldera cone. On 11 January, the Anchorage VAAC again reported emission of a thin ash cloud to ~ 3 km altitude visible on the Perryville web camera. On 12 January the Anchorage VAAC reported emission of a thin ash cloud, visible on the Perryville web camera, that rose to 3-4 km altitude, extended ENE, and dissipated within ~ 55 km of the volcano. On 14 January, a satellite image showed a thermal anomaly in the vicinity of the Veniaminof summit. Although the anomaly appeared less intense than when first detected on 8 January and volcanism seemed to have declined significantly since 12 January, activity still remained significantly higher than normal with occasional bursts of volcanic tremor.
During the rest of the month of January, seismic data, web camera views, and satellite images indicated that low-level ash emissions continued at Veniaminof. Seismicity was similar to levels observed during the previous week, consisting of low-amplitude volcanic tremor with occasional larger bursts. During clear weather, satellite imagery showed anomalous heat at the summit cone, consistent with hot blocks and ash being ejected from the active vent. In addition, the web camera showed intermittent ash plumes reaching as high as 3 km altitude. Occasional stronger bursts of seismic tremor during 20-21 January and around 28 January may have indicated plumes to higher levels, but not above 4 km altitude. Veniaminof remained at Concern Color Code Orange.
Activity during February 2005. On the evening of 3 February, Strombolian activity at Veniaminof was visible by residents of Perryville ~ 30 km from the volcano. Activity was also observed on web camera views and seen by satellite as an increase in radiated surface heat. An increase in seismicity suggested that Strombolian activity may have continued through 4 February while the volcano was obscured by clouds.
During 28 January to 4 February, seismicity at Veniaminof was similar to levels for the previous week, with low-amplitude tremor and occasional larger bursts. During clear weather, satellite imagery showed anomalous heat at the summit cone, consistent with hot blocks and ash being ejected from the active vent. The web camera showed intermittent ash plumes reaching as high as 3 km altitude. Veniaminof remained at Concern Color Code Orange.
Low-level Strombolian eruptive activity continued at Veniaminof during 4-11 February. On 9 February, an ash burst rose hundreds of meters above the intracaldera cone. Satellite images continued to show a thermal anomaly in the vicinity of the intracaldera cone, consistent with the presence of hot material at the vent. Seismicity remained above background levels at the volcano. On the morning of 10 February there was a distinct increase in the amplitude and frequency of earthquakes. The increase continued through 11 February. This activity was consistent with more energetic explosions from the active cone, but there were no indications that the bursts rose higher than 4 km altitude. Veniaminof remained at Concern Color Code Orange.
During 11-18 February, it was likely that low-level Strombolian eruptive activity continued at Veniaminof based on seismic data and satellite imagery. Cloudy conditions obscured web camera views of the volcano, and no ash emissions were observed above the cloud cover. Seismicity remained above background levels at Veniaminof. The character of the seismicity changed slightly during the report period, with frequent periods of continuous banded volcanic tremor occurring, but the amplitudes of earthquakes did not increase. This activity was consistent with explosions from the active cone; however, there was no indication that these bursts rose more than 4 km altitude. Veniaminof remained at Concern Color Code Orange.
Seismicity decreased substantially at Veniaminof during 18-25 February in comparison to previous weeks, leading AVO to decrease the Concern Color Code from Orange to Yellow. Periods of volcanic tremor diminished, and no discrete events associated with ash bursts had occurred for several days. Only minor steam emissions were seen. AVO received no reports of ash emissions from pilots or ground observers. AVO concluded that given the decline in seismicity, it appeared that the most recent episode of Strombolian eruptive activity at Veniaminof had ended.
Activity during March 2005. A further reduction in activity at Veniaminof during 25 February to 4 March led AVO to reduce the Concern Color Code from Yellow to Green, the lowest level. For more than a week seismic activity was at background levels, periods of volcanic tremor had ceased, and there were no discrete events associated with ash bursts. Only minor emissions of steam were observed on the web camera and satellite imagery. AVO received no reports of ash emissions from pilots or observers on the ground. They concluded that given the decline in seismicity it appeared that the most recent episode of eruptive activity had ended at Veniaminof.
Geologic Background. Veniaminof, on the Alaska Peninsula, is truncated by a steep-walled, 8 x 11 km, glacier-filled caldera that formed around 3,700 years ago. The caldera rim is up to 520 m high on the north, is deeply notched on the west by Cone Glacier, and is covered by an ice sheet on the south. Post-caldera vents are located along a NW-SE zone bisecting the caldera that extends 55 km from near the Bering Sea coast, across the caldera, and down the Pacific flank. Historical eruptions probably all originated from the westernmost and most prominent of two intra-caldera cones, which rises about 300 m above the surrounding icefield. The other cone is larger, and has a summit crater or caldera that may reach 2.5 km in diameter, but is more subdued and barely rises above the glacier surface.
Information Contacts: Alaska Volcano Observatory (AVO), a cooperative program of a) U.S. Geological Survey, 4200 University Drive, Anchorage, AK 99508-4667, USA (URL: http://www.avo.alaska.edu/), b) Geophysical Institute, University of Alaska, PO Box 757320, Fairbanks, AK 99775-7320, USA, and c) Alaska Division of Geological & Geophysical Surveys, 794 University Ave., Suite 200, Fairbanks, AK 99709, USA; Kristi L. Wallace, USGS/AVO, Alaska Tephra Laboratory and Data Center, 4230 University Drive, Suite 201, Anchorage, AK 99508, USA.