Recently Published Bulletin Reports
Manam (Papua New Guinea) Few ash plumes during November-December 2022
Krakatau (Indonesia) Strombolian activity and ash plumes during November 2022-April 2023
Stromboli (Italy) Strombolian explosions and lava flows continue during January-April 2023
Nishinoshima (Japan) Small ash plumes and fumarolic activity during November 2022 through April 2023
Karangetang (Indonesia) Lava flows, incandescent avalanches, and ash plumes during January-June 2023
Ahyi (United States) Intermittent hydroacoustic signals and discolored plumes during November 2022-June 2023
Kadovar (Papua New Guinea) An ash plume and weak thermal anomaly during May 2023
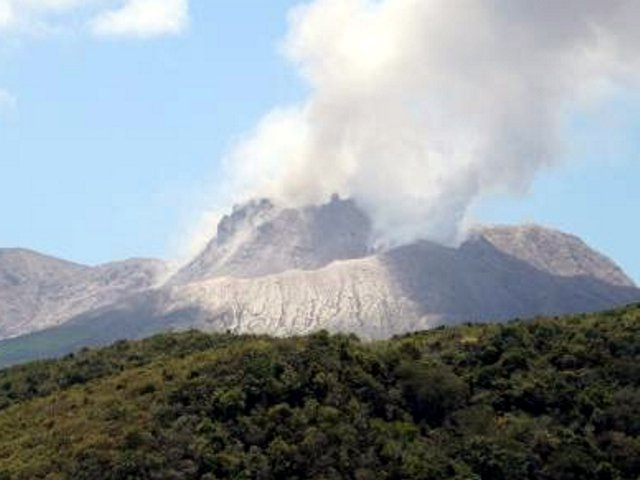
San Miguel (El Salvador) Small gas-and-ash explosions during March and May 2023
Semisopochnoi (United States) Occasional explosions, ash deposits, and gas-and-steam plumes during December 2022-May 2023
Ebeko (Russia) Continued explosions, ash plumes, and ashfall during October 2022-May 2023
Home Reef (Tonga) Discolored plumes continued during November 2022-April 2023
Ambae (Vanuatu) New lava flow, ash plumes, and sulfur dioxide plumes during February-May 2023
Manam (Papua New Guinea) — July 2023  Cite this Report
Manam
Papua New Guinea
4.08°S, 145.037°E; summit elev. 1807 m
All times are local (unless otherwise noted)
Few ash plumes during November-December 2022
Manam is a 10-km-wide island that consists of two active summit craters: the Main summit crater and the South summit crater and is located 13 km off the northern coast of mainland Papua New Guinea. Frequent mild-to-moderate eruptions have been recorded since 1616. The current eruption period began during June 2014 and has more recently been characterized by intermittent ash plumes and thermal activity (BGVN 47:11). This report updates activity that occurred from November 2022 through May 2023 based on information from the Darwin Volcanic Ash Advisory Center (VAAC) and various satellite data.
Ash plumes were reported during November and December 2022 by the Darwin VAAC. On 7 November an ash plume rose to 2.1 km altitude and drifted NE based on satellite images and weather models. On 14 November an ash plume rose to 2.1 km altitude and drifted W based on RVO webcam images. On 20 November ash plumes rose to 1.8 km altitude and drifted NW. On 26 December an ash plume rose to 3 km altitude and drifted S and SSE.
Intermittent sulfur dioxide plumes were detected using the TROPOMI instrument on the Sentinel-5P satellite, some of which exceeded at least two Dobson Units (DU) and drifted in different directions (figure 93). Occasional low-to-moderate power thermal anomalies were recorded by the MIROVA (Middle InfraRed Observation of Volcanic Activity) system; less than five anomalies were recorded each month during November 2022 through May 2023 (figure 94). Two thermal hotspots were detected by the MODVOLC thermal alerts system on 10 December 2022. On clear weather days, thermal activity was also captured in infrared satellite imagery in both the Main and South summit craters, accompanied by gas-and-steam emissions (figure 95).
Geologic Background. The 10-km-wide island of Manam, lying 13 km off the northern coast of mainland Papua New Guinea, is one of the country's most active volcanoes. Four large radial valleys extend from the unvegetated summit of the conical basaltic-andesitic stratovolcano to its lower flanks. These valleys channel lava flows and pyroclastic avalanches that have sometimes reached the coast. Five small satellitic centers are located near the island's shoreline on the northern, southern, and western sides. Two summit craters are present; both are active, although most observed eruptions have originated from the southern crater, concentrating eruptive products during much of the past century into the SE valley. Frequent eruptions, typically of mild-to-moderate scale, have been recorded since 1616. Occasional larger eruptions have produced pyroclastic flows and lava flows that reached flat-lying coastal areas and entered the sea, sometimes impacting populated areas.
Information Contacts: Rabaul Volcano Observatory (RVO), Geohazards Management Division, Department of Mineral Policy and Geohazards Management (DMPGM), PO Box 3386, Kokopo, East New Britain Province, Papua New Guinea; Darwin Volcanic Ash Advisory Centre (VAAC), Bureau of Meteorology, Northern Territory Regional Office, PO Box 40050, Casuarina, NT 0811, Australia (URL: http://www.bom.gov.au/info/vaac/); MIROVA (Middle InfraRed Observation of Volcanic Activity), a collaborative project between the Universities of Turin and Florence (Italy) supported by the Centre for Volcanic Risk of the Italian Civil Protection Department (URL: http://www.mirovaweb.it/); Hawai'i Institute of Geophysics and Planetology (HIGP) - MODVOLC Thermal Alerts System, School of Ocean and Earth Science and Technology (SOEST), Univ. of Hawai'i, 2525 Correa Road, Honolulu, HI 96822, USA (URL: http://modis.higp.hawaii.edu/); NASA Global Sulfur Dioxide Monitoring Page, Atmospheric Chemistry and Dynamics Laboratory, NASA Goddard Space Flight Center (NASA/GSFC), 8800 Greenbelt Road, Goddard, Maryland, USA (URL: https://so2.gsfc.nasa.gov/); Copernicus Browser, Copernicus Data Space Ecosystem, European Space Agency (URL: https://dataspace.copernicus.eu/browser/).
Krakatau (Indonesia) — July 2023 Cite this Report
Krakatau
Indonesia
6.1009°S, 105.4233°E; summit elev. 285 m
All times are local (unless otherwise noted)
Strombolian activity and ash plumes during November 2022-April 2023
Krakatau is located in the Sunda Strait between Java and Sumatra, Indonesia. Caldera collapse during the catastrophic 1883 eruption destroyed Danan and Perbuwatan cones and left only a remnant of Rakata. The post-collapse cone of Anak Krakatau (Child of Krakatau) was constructed within the 1883 caldera at a point between the former Danan and Perbuwatan cones; it has been the site of frequent eruptions since 1927. The current eruption period began in May 2021 and has recently consisted of explosions, ash plumes, and thermal activity (BGVN 47:11). This report covers activity during November 2022 through April 2023 based on information provided by the Indonesian Center for Volcanology and Geological Hazard Mitigation, referred to as Pusat Vulkanologi dan Mitigasi Bencana Geologi (PVMBG), MAGMA Indonesia, the Darwin Volcanic Ash Advisory Center (VAAC), and several sources of satellite data.
Activity was relatively low during November and December 2022. Daily white gas-and-steam plumes rose 25-100 m above the summit and drifted in different directions. Gray ash plumes rose 200 m above the summit and drifted NE at 1047 and at 2343 on 11 November. On 14 November at 0933 ash plumes rose 300 m above the summit and drifted E. An ash plume was reported at 0935 on 15 December that rose 100 m above the summit and drifted NE. An eruptive event at 1031 later that day generated an ash plume that rose 700 m above the summit and drifted NE. A gray ash plume at 1910 rose 100 m above the summit and drifted E. Incandescent material was ejected above the vent based on an image taken at 1936.
During January 2023 daily white gas-and-steam plumes rose 25-300 m above the summit and drifted in multiple directions. Gray-to-brown ash plumes were reported at 1638 on 3 January, at 1410 and 1509 on 4 January, and at 0013 on 5 January that rose 100-750 m above the summit and drifted NE and E; the gray-to-black ash plume at 1509 on 4 January rose as high as 3 km above the summit and drifted E. Gray ash plumes were recorded at 1754, 2241, and 2325 on 11 January and at 0046 on 12 January and rose 200-300 m above the summit and drifted NE. Toward the end of January, PVMBG reported that activity had intensified; Strombolian activity was visible in webcam images taken at 0041, 0043, and 0450 on 23 January. Multiple gray ash plumes throughout the day rose 200-500 m above the summit and drifted E and SE (figure 135). Webcam images showed progressively intensifying Strombolian activity at 1919, 1958, and 2113 on 24 January; a gray ash plume at 1957 rose 300 m above the summit and drifted E (figure 135). Eruptive events at 0231 and 2256 on 25 January and at 0003 on 26 January ejected incandescent material from the vent, based on webcam images. Gray ash plumes observed during 26-27 January rose 300-500 m above the summit and drifted NE, E, and SE.
Low levels of activity were reported during February and March. Daily white gas-and-steam plumes rose 25-300 m above the summit and drifted in different directions. The Darwin VAAC reported that continuous ash emissions rose to 1.5-1.8 km altitude and drifted W and NW during 1240-1300 on 10 March, based on satellite images, weather models, and PVMBG webcams. White-and-gray ash plumes rose 500 m and 300 m above the summit and drifted SW at 1446 and 1846 on 18 March, respectively. An eruptive event was recorded at 2143, though it was not visible due to darkness. Multiple ash plumes were reported during 27-29 March that rose as high as 2.5 km above the summit and drifted NE, W, and SW (figure 136). Webcam images captured incandescent ejecta above the vent at 0415 and around the summit area at 2003 on 28 March and at 0047 above the vent on 29 March.
Daily white gas-and-steam plumes rose 25-300 m above the summit and drifted in multiple directions during April and May. White-and-gray and black plumes rose 50-300 m above the summit on 2 and 9 April. On 11 May at 1241 a gray ash plume rose 1-3 km above the summit and drifted SW. On 12 May at 0920 a gray ash plume rose 2.5 km above the summit and drifted SW and at 2320 an ash plume rose 1.5 km above the summit and drifted SW. An accompanying webcam image showed incandescent ejecta. On 13 May at 0710 a gray ash plume rose 2 km above the summit and drifted SW (figure 137).
The MIROVA (Middle InfraRed Observation of Volcanic Activity) graph of MODIS thermal anomaly data showed intermittent low-to-moderate power thermal anomalies during November 2022 through April 2023 (figure 138). Some of this thermal activity was also visible in infrared satellite imagery at the crater, accompanied by gas-and-steam and ash plumes that drifted in different directions (figure 139).
Geologic Background. The renowned Krakatau (frequently mis-named as Krakatoa) volcano lies in the Sunda Strait between Java and Sumatra. Collapse of an older edifice, perhaps in 416 or 535 CE, formed a 7-km-wide caldera. Remnants of that volcano are preserved in Verlaten and Lang Islands; subsequently the Rakata, Danan, and Perbuwatan cones were formed, coalescing to create the pre-1883 Krakatau Island. Caldera collapse during the catastrophic 1883 eruption destroyed Danan and Perbuwatan, and left only a remnant of Rakata. This eruption caused more than 36,000 fatalities, most as a result of tsunamis that swept the adjacent coastlines of Sumatra and Java. Pyroclastic surges traveled 40 km across the Sunda Strait and reached the Sumatra coast. After a quiescence of less than a half century, the post-collapse cone of Anak Krakatau (Child of Krakatau) was constructed within the 1883 caldera at a point between the former Danan and Perbuwatan cones. Anak Krakatau has been the site of frequent eruptions since 1927.
Information Contacts: Pusat Vulkanologi dan Mitigasi Bencana Geologi (PVMBG, also known as Indonesian Center for Volcanology and Geological Hazard Mitigation, CVGHM), Jalan Diponegoro 57, Bandung 40122, Indonesia (URL: http://www.vsi.esdm.go.id/); MAGMA Indonesia, Kementerian Energi dan Sumber Daya Mineral (URL: https://magma.esdm.go.id/v1); Darwin Volcanic Ash Advisory Centre (VAAC), Bureau of Meteorology, Northern Territory Regional Office, PO Box 40050, Casuarina, NT 0811, Australia (URL: http://www.bom.gov.au/info/vaac/); MIROVA (Middle InfraRed Observation of Volcanic Activity), a collaborative project between the Universities of Turin and Florence (Italy) supported by the Centre for Volcanic Risk of the Italian Civil Protection Department (URL: http://www.mirovaweb.it/); Copernicus Browser, Copernicus Data Space Ecosystem, European Space Agency (URL: https://dataspace.copernicus.eu/browser/).
Stromboli
Italy
38.789°N, 15.213°E; summit elev. 924 m
All times are local (unless otherwise noted)
Strombolian explosions and lava flows continue during January-April 2023
Stromboli, located in Italy, has exhibited nearly constant lava fountains for the past 2,000 years; recorded eruptions date back to 350 BCE. Eruptive activity occurs at the summit from multiple vents, which include a north crater area (N area) and a central-southern crater (CS area) on a terrace known as the ‘terrazza craterica’ at the head of the Sciara del Fuoco, a large scarp that runs from the summit down the NW side of the volcano-island. Activity typically consists of Strombolian explosions, incandescent ejecta, lava flows, and pyroclastic flows. Thermal and visual monitoring cameras are located on the nearby Pizzo Sopra La Fossa, above the terrazza craterica, and at multiple flank locations. The current eruption period has been ongoing since 1934 and recent activity has consisted of frequent Strombolian explosions and lava flows (BGVN 48:02). This report updates activity during January through April 2023 primarily characterized by Strombolian explosions and lava flows based on reports from Italy's Istituto Nazionale di Geofisica e Vulcanologia (INGV) and various satellite data.
Frequent explosive activity continued throughout the reporting period, generally in the low-to-medium range, based on the number of hourly explosions in the summit crater (figure 253, table 16). Intermittent thermal activity was recorded by the MIROVA (Middle InfraRed Observation of Volcanic Activity) analysis of MODIS satellite data (figure 254). According to data collected by the MODVOLC thermal algorithm, a total of 9 thermal alerts were detected: one on 2 January 2023, one on 1 February, five on 24 March, and two on 26 March. The stronger pulses of thermal activity likely reflected lava flow events. Infrared satellite imagery captured relatively strong thermal hotspots at the two active summit craters on clear weather days, showing an especially strong event on 8 March (figure 255).
Table 16. Summary of type, frequency, and intensity of explosive activity at Stromboli by month during January-April 2023; information from webcam observations. Courtesy of INGV weekly reports.
| Month |
Explosive Activity |
| Jan 2023 |
Typical Strombolian activity with spattering and lava overflows in the N crater area. Explosions were reported from 4 vents in the N area and 1-2 vents in the CS area. The average hourly frequency of explosions was low-to-medium (1-12 events/hour). The intensity of the explosions varied from low (less than 80 m high) to medium (less than 150 m high) in the N crater area and up to high (greater than 150 m high) in the CS crater area. |
| Feb 2023 |
Typical Strombolian activity with spattering in the N crater area. Explosions were reported from 2-3 vents in the N area and 1-4 vents in the CS area. The average hourly frequency of explosions was low-to-medium (1-14 events/hour). The intensity of the explosions varied from low (less than 80 m high) to medium (less than 150 m high) in the N crater area and up to high (greater than 150 m high) in the CS crater area. |
| Mar 2023 |
Typical Strombolian activity with spattering and lava overflows in the N crater area. Explosions were reported from 2-3 vents in the N area and 2-4 vents in the CS area. The average hourly frequency of explosions was low-to-medium (1-18 events/hour). The intensity of the explosions varied from low (less than 80 m high) to medium (less than 150 m high) in the N crater area and up to high (greater than 150 m high) in the CS crater area. |
| Apr 2023 |
Typical Strombolian activity. Explosions were reported from 2 vents in the N area and 2-3 vents in the CS area. The average hourly frequency of explosions was low-to-high (1-16 events/hour). The intensity of the explosions varied from low (less than 80 m high) to medium (less than 150 m high) in both the N and CS crater areas. |
Activity during January-February 2023. Strombolian explosions were reported in the N crater area, as well as lava effusion. Explosive activity in the N crater area ejected coarse material (bombs and lapilli). Intense spattering was observed in both the N1 and N2 craters. In the CS crater area, explosions generally ejected fine material (ash), sometimes to heights greater than 250 m. The intensity of the explosions was characterized as low-to-medium in the N crater and medium-to-high in the CS crater. After intense spattering activity from the N crater area, a lava overflow began at 2136 on 2 January that flowed part way down the Sciara del Fuoco, possibly moving down the drainage that formed in October, out of view from webcams. The flow remained active for a couple of hours before stopping and beginning to cool. A second lava flow was reported at 0224 on 4 January that similarly remained active for a few hours before stopping and cooling. Intense spattering was observed on 11 and 13 January from the N1 crater. After intense spattering activity at the N2 crater at 1052 on 17 January another lava flow started to flow into the upper part of the Sciara del Fuoco (figure 256), dividing into two: one that traveled in the direction of the drainage formed in October, and the other one moving parallel to the point of emission. By the afternoon, the rate of the flow began to decrease, and at 1900 it started to cool. A lava flow was reported at 1519 on 24 January following intense spattering in the N2 area, which began to flow into the upper part of the Sciara del Fuoco. By the morning of 25 January, the lava flow had begun to cool. During 27 January the frequency of eruption in the CS crater area increased to 6-7 events/hour compared to the typical 1-7 events/hour; the following two days showed a decrease in frequency to less than 1 event/hour. Starting at 1007 on 30 January a high-energy explosive sequence was produced by vents in the CS crater area. The sequence began with an initial energetic pulse that lasted 45 seconds, ejecting predominantly coarse products 300 m above the crater that fell in an ESE direction. Subsequent and less intense explosions ejected material 100 m above the crater. The total duration of this event lasted approximately two minutes. During 31 January through 6, 13, and 24 February spattering activity was particularly intense for short periods in the N2 crater.
An explosive sequence was reported on 16 February that was characterized by a major explosion in the CS crater area (figure 257). The sequence began at 1817 near the S2 crater that ejected material radially. A few seconds later, lava fountains were observed in the central part of the crater. Three explosions of medium intensity (material was ejected less than 150 m high) were recorded at the S2 crater. The first part of this sequence lasted approximately one minute, according to INGV, and material rose 300 m above the crater and then was deposited along the Sciara del Fuoco. The second phase began at 1818 at the S1 crater; it lasted seven seconds and material was ejected 150 m above the crater. Another event 20 seconds later lasted 12 seconds, also ejecting material 150 m above the crater. The sequence ended with at least three explosions of mostly fine material from the S1 crater. The total duration of this sequence was about two minutes.
Short, intense spattering activity was noted above the N1 crater on 27 and 28 February. A lava overflow was first reported at 0657 from the N2 crater on 27 February that flowed into the October 2022 drainage. By 1900 the flow had stopped. A second lava overflow also in the N crater area occurred at 2149, which overlapped the first flow and then stopped by 0150 on 28 February. Material detached from both the lava overflows rolled down the Sciara del Fuoco, some of which was visible in webcam images.
Activity during March-April 2023. Strombolian activity continued with spattering activity and lava overflows in the N crater area during March. Explosive activity at the N crater area varied from low (less than 80 m high) to medium (less than 150 m high) and ejected coarse material, such as bombs and lapilli. Spattering was observed above the N1 crater, while explosive activity at the CS crater area varied from medium to high (greater than 150 m high) and ejected coarse material. Intense spattering activity was observed for short periods on 6 March above the N1 crater. At approximately 0610 a lava overflow was reported around the N2 crater on 8 March, which then flowed into the October 2022 drainage. By 1700 the flow started to cool. A second overflow began at 1712 on 9 March and overlapped the previous flow. It had stopped by 2100. Material from both flows was deposited along the Sciara del Fuoco, though much of the activity was not visible in webcam images. On 11 March a lava overflow was observed at 0215 that overlapped the two previous flows in the October 2022 drainage. By late afternoon on 12 March, it had stopped.
During a field excursion on 16 March, scientists noted that a vent in the central crater area was degassing. Another vent showed occasional Strombolian activity that emitted ash and lapilli. During 1200-1430 low-to-medium intense activity was reported; the N1 crater emitted ash emissions and the N2 crater emitted both ash and coarse material. Some explosions also occurred in the CS crater area that ejected coarse material. The C crater in the CS crater area occasionally showed gas jetting and low intensity explosions on 17 and 22 March; no activity was observed at the S1 crater. Intense, longer periods of spattering were reported in the N1 crater on 19, 24, and 25 March. Around 2242 on 23 March a lava overflow began from the N1 crater that, after about an hour, began moving down the October 2022 drainage and flow along the Sciara del Fuoco (figure 258). Between 0200 and 0400 on 26 March the flow rate increased, which generated avalanches of material from collapses at the advancing flow front. By early afternoon, the flow began to cool. On 25 March at 1548 an explosive sequence began from one of the vents at S2 in the CS crater area (figure 258). Fine ash mixed with coarse material was ejected 300 m above the crater rim and drifted SSE. Some modest explosions around Vent C were detected at 1549 on 25 March, which included an explosion at 1551 that ejected coarse material. The entire explosive sequence lasted approximately three minutes.
During April explosions persisted in both the N and CS crater areas. Fine material was ejected less than 80 m above the N crater rim until 6 April, followed by ejection of coarser material. Fine material was also ejected less than 80 m above the CS crater rim. The C and S2 crater did not show significant eruptive activity. On 7 April an explosive sequence was detected in the CS crater area at 1203 (figure 259). The first explosion lasted approximately 18 seconds and ejected material 400 m above the crater rim, depositing pyroclastic material in the upper part of the Sciara del Fuoco. At 1204 a second, less intense explosion lasted approximately four seconds and deposited pyroclastic products outside the crater area and near Pizzo Sopra La Fossa. A third explosion at 1205 was mainly composed of ash that rose about 150 m above the crater and lasted roughly 20 seconds. A fourth explosion occurred at 1205 about 28 seconds after the third explosion and ejected a mixture of coarse and fine material about 200 m above the crater; the explosion lasted roughly seven seconds. Overall, the entire explosive sequence lasted about two minutes and 20 seconds. After the explosive sequence on 7 April, explosions in both the N and CS crater areas ejected material as high as 150 m above the crater.
On 21 April research scientists from INGV made field observations in the summit area of Stromboli, and some lapilli samples were collected. In the N crater area near the N1 crater, a small cone was observed with at least two active vents, one of which was characterized by Strombolian explosions. The other vent produced explosions that ejected ash and chunks of cooled lava. At the N2 crater at least one vent was active and frequently emitted ash. In the CS crater area, a small cone contained 2-3 degassing vents and a smaller, possible fissure area also showed signs of degassing close to the Pizzo Sopra La Fossa. In the S part of the crater, three vents were active: a small hornito was characterized by modest and rare explosions, a vent that intermittently produced weak Strombolian explosions, and a vent at the end of the terrace that produced frequent ash emissions. Near the S1 crater there was a hornito that generally emitted weak gas-and-steam emissions, sometimes associated with “gas rings”. On 22 April another field inspection was carried out that reported two large sliding surfaces on the Sciara del Fuoco that showed where blocks frequently descended toward the sea. A thermal anomaly was detected at 0150 on 29 April.
Geologic Background. Spectacular incandescent nighttime explosions at Stromboli have long attracted visitors to the "Lighthouse of the Mediterranean" in the NE Aeolian Islands. This volcano has lent its name to the frequent mild explosive activity that has characterized its eruptions throughout much of historical time. The small island is the emergent summit of a volcano that grew in two main eruptive cycles, the last of which formed the western portion of the island. The Neostromboli eruptive period took place between about 13,000 and 5,000 years ago. The active summit vents are located at the head of the Sciara del Fuoco, a prominent scarp that formed about 5,000 years ago due to a series of slope failures which extends to below sea level. The modern volcano has been constructed within this scarp, which funnels pyroclastic ejecta and lava flows to the NW. Essentially continuous mild Strombolian explosions, sometimes accompanied by lava flows, have been recorded for more than a millennium.
Information Contacts: Istituto Nazionale di Geofisica e Vulcanologia (INGV), Sezione di Catania, Piazza Roma 2, 95123 Catania, Italy, (URL: http://www.ct.ingv.it/en/); MIROVA (Middle InfraRed Observation of Volcanic Activity), a collaborative project between the Universities of Turin and Florence (Italy) supported by the Centre for Volcanic Risk of the Italian Civil Protection Department (URL: http://www.mirovaweb.it/); Hawai'i Institute of Geophysics and Planetology (HIGP) - MODVOLC Thermal Alerts System, School of Ocean and Earth Science and Technology (SOEST), Univ. of Hawai'i, 2525 Correa Road, Honolulu, HI 96822, USA (URL: http://modis.higp.hawaii.edu/); Copernicus Browser, Copernicus Data Space Ecosystem, European Space Agency (URL: https://dataspace.copernicus.eu/browser/).
Nishinoshima (Japan) — July 2023 Cite this Report
Nishinoshima
Japan
27.247°N, 140.874°E; summit elev. 100 m
All times are local (unless otherwise noted)
Small ash plumes and fumarolic activity during November 2022 through April 2023
Nishinoshima is a small island located about 1,000 km S of Tokyo in the Ogasawara Arc in Japan. The island is the summit of a massive submarine volcano that has prominent peaks to the S, W, and NE. Eruptions date back to 1973; the most recent eruption period began in October 2022 and was characterized by ash plumes and fumarolic activity (BGVN 47:12). This report describes ash plumes and fumarolic activity during November 2022 through April 2023 based on monthly reports from the Japan Meteorological Agency (JMA) monthly reports and satellite data.
The most recent eruptive activity prior to the reporting internal occurred on 12 October 2022, when an ash plume rose 3.5 km above the crater rim. An aerial observation conducted by the Japan Coast Guard (JCG) on 25 November reported that white fumaroles rose approximately 200 m above the central crater of a pyroclastic cone (figure 119), and multiple plumes were observed on the ESE flank of the cone. Discolored water ranging from reddish-brown to brown and yellowish-green were visible around the perimeter of the island (figure 119). No significant activity was reported in December.
During an overflight conducted by JCG on 25 January 2023 intermittent activity and small, blackish-gray plumes rose 900 m above the central part of the crater were observed (figure 120). The fumarolic zone of the E flank and base of the cone had expanded and emissions had intensified. Dark brown discolored water was visible around the perimeter of the island.
No significant activity was reported during February through March. Ash plumes at 1050 and 1420 on 11 April rose 1.9 km above the crater rim and drifted NW and N. These were the first ash plumes observed since 12 October 2022. On 14 April JCG carried out an overflight and reported that no further eruptive activity was visible, although white gas-and-steam plumes were visible from the central crater and rose 900 m high (figure 121). Brownish and yellow-green discolored water surrounded the island.
Intermittent low-to-moderate power thermal anomalies were recorded in the MIROVA graph (Middle InfraRed Observation of Volcanic Activity) during November 2022 through April 2023 (figure 123). A cluster of six to eight anomalies were detected during November while a smaller number were detected during the following months: two to three during December, one during mid-January 2023, one during February, five during March, and two during April. Thermal activity was also reflected in infrared satellite data at the summit crater, accompanied by occasional gas-and-steam plumes (figure 124).
Geologic Background. The small island of Nishinoshima was enlarged when several new islands coalesced during an eruption in 1973-74. Multiple eruptions that began in 2013 completely covered the previous exposed surface and continued to enlarge the island. The island is the summit of a massive submarine volcano that has prominent peaks to the S, W, and NE. The summit of the southern cone rises to within 214 m of the ocean surface 9 km SSE.
Information Contacts: Japan Meteorological Agency (JMA), 1-3-4 Otemachi, Chiyoda-ku, Tokyo 100-8122, Japan (URL: http://www.jma.go.jp/jma/indexe.html); MIROVA (Middle InfraRed Observation of Volcanic Activity), a collaborative project between the Universities of Turin and Florence (Italy) supported by the Centre for Volcanic Risk of the Italian Civil Protection Department (URL: http://www.mirovaweb.it/); Copernicus Browser, Copernicus Data Space Ecosystem, European Space Agency (URL: https://dataspace.copernicus.eu/browser/).
Karangetang (Indonesia) — July 2023 Cite this Report
Karangetang
Indonesia
2.781°N, 125.407°E; summit elev. 1797 m
All times are local (unless otherwise noted)
Lava flows, incandescent avalanches, and ash plumes during January-June 2023
Karangetang (also known as Api Siau), at the northern end of the island of Siau, Indonesia, contains five summit craters along a N-S line. More than 40 eruptions have been recorded since 1675; recent eruptions have included frequent explosive activity, sometimes accompanied by pyroclastic flows and lahars. Lava dome growth has occurred in the summit craters and collapses of lava flow fronts have produced pyroclastic flows. The two active summit craters are Kawah Dua (the N crater) and Kawah Utama (the S crater, also referred to as the “Main Crater”). The most recent eruption began in late November 2018 and has more recently consisted of weak thermal activity and gas-and-steam emissions (BGVN 48:01). This report updates activity characterized by lava flows, incandescent avalanches, and ash plumes during January through June 2023 using reports from Pusat Vulkanologi dan Mitigasi Bencana Geologi (PVMBG, also known as CVGHM, or the Center of Volcanology and Geological Hazard Mitigation), MAGMA Indonesia, the Darwin VAAC (Volcano Ash Advisory Center), and satellite data.
Activity during January was relatively low and mainly consisted of white gas-and-steam emissions that rose 25-150 m above Main Crater (S crater) and drifted in different directions. Incandescence was visible from the lava dome in Kawah Dua (the N crater). Weather conditions often prevented clear views of the summit. On 18 January the number of seismic signals that indicated avalanches of material began to increase. In addition, there were a total of 71 earthquakes detected during the month.
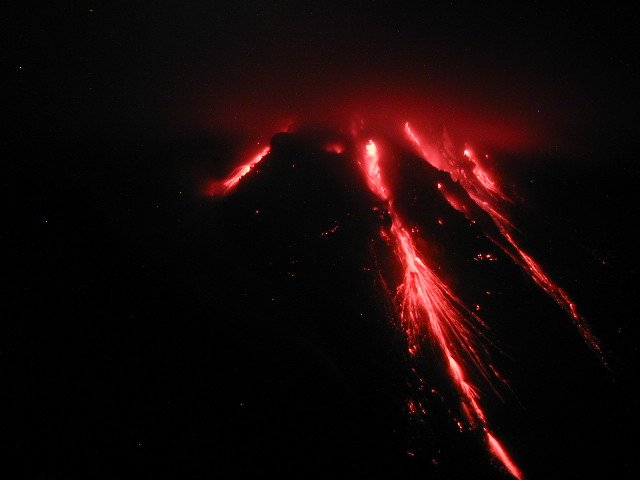
Activity continued to increase during the first week of February. Material from Main Crater traveled as far as 800 m down the Batuawang (S) and Batang (W) drainages and as far as 1 km W down the Beha (W) drainage on 4 February. On 6 February 43 earthquake events were recorded, and on 7 February, 62 events were recorded. White gas-and-steam emissions rose 25-250 m above both summit craters throughout the month. PVMBG reported an eruption began during the evening of 8 February around 1700. Photos showed incandescent material at Main Crater. Incandescent material had also descended the flank in at least two unconfirmed directions as far as 2 km from Main Crater, accompanied by ash plumes (figure 60). As a result, PVMBG increased the Volcano Alert Level (VAL) to 3 (the second highest level on a 1-4 scale).
Occasional nighttime webcam images showed three main incandescent lava flows of differing lengths traveling down the S, SW, and W flanks (figure 61). Incandescent rocks were visible on the upper flanks, possibly from ejected or collapsed material from the crater, and incandescence was the most intense at the summit. Based on analyses of satellite imagery and weather models, the Darwin VAAC reported that daily ash plumes during 16-20 February rose to 2.1-3 km altitude and drifted NNE, E, and SE. BNPB reported on 16 February that as many as 77 people were evacuated and relocated to the East Siau Museum. A webcam image taken at 2156 on 17 February possibly showed incandescent material descending the SE flank. Ash plumes rose to 2.1 km altitude and drifted SE during 22-23 February, according to the Darwin VAAC.
Incandescent avalanches of material and summit incandescence at Main Crater continued during March. White gas-and-steam emissions during March generally rose 25-150 m above the summit crater; on 31 March gas-and-steam emissions rose 200-400 m high. An ash plume rose to 2.4 km altitude and drifted S at 1710 on 9 March and a large thermal anomaly was visible in images taken at 0550 and 0930 on 10 March. Incandescent material was visible at the summit and on the flanks based on webcam images taken at 0007 and 2345 on 16 March, at 1828 on 17 March, at 1940 on 18 March, at 2311 on 19 March, and at 2351 on 20 March. Incandescence was most intense on 18 and 20 March and webcam images showed possible Strombolian explosions (figure 62). An ash plume rose to 2.4 km altitude and drifted SW on 18 March, accompanied by a thermal anomaly.
Summit crater incandescence at Main Crater and on the flanks persisted during April. Incandescent material at the S crater and on the flanks was reported at 0016 on 1 April. The lava flows had stopped by 1 April according to PVMBG, although incandescence was still visible up to 10 m high. Seismic signals indicating effusion decreased and by 6 April they were no longer detected. Incandescence was visible from both summit craters. On 26 April the VAL was lowered to 2 (the second lowest level on a 1-4 scale). White gas-and-steam emissions rose 25-200 m above the summit crater.
During May white gas-and-steam emissions generally rose 50-250 m above the summit, though it was often cloudy, which prevented clear views; on 21 May gas-and-steam emissions rose 50-400 m high. Nighttime N summit crater incandescence rose 10-25 m above the lava dome, and less intense incandescence was noted above Main Crater, which reached about 10 m above the dome. Sounds of falling rocks at Main Crater were heard on 15 May and the seismic network recorded 32 rockfall events in the crater on 17 May. Avalanches traveled as far as 1.5 km down the SW and S flanks, accompanied by rumbling sounds on 18 May. Incandescent material descending the flanks was captured in a webcam image at 2025 on 19 May (figure 63) and on 29 May; summit crater incandescence was observed in webcam images at 2332 on 26 May and at 2304 on 29 May. On 19 May the VAL was again raised to 3.
Occasional Main Crater incandescence was reported during June, as well as incandescent material on the flanks. White gas-and-steam emissions rose 10-200 m above the summit crater. Ash plumes rose to 2.1 km altitude and drifted SE and E during 2-4 June, according to the Darwin VAAC. Material on the flanks of Main Crater were observed at 2225 on 7 June, at 2051 on 9 June, at 0007 on 17 June, and at 0440 on 18 June. Webcam images taken on 21, 25, and 27 June showed incandescence at Main Crater and from material on the flanks.
MIROVA (Middle InfraRed Observation of Volcanic Activity) analysis of MODIS satellite data showed strong thermal activity during mid-February through March and mid-May through June, which represented incandescent avalanches and lava flows (figure 64). During April through mid-May the power of the anomalies decreased but frequent anomalies were still detected. Brief gaps in activity occurred during late March through early April and during mid-June. Infrared satellite images showed strong lava flows mainly affecting the SW and S flanks, accompanied by gas-and-steam emissions (figure 65). According to data recorded by the MODVOLC thermal algorithm, there were a total of 79 thermal hotspots detected: 28 during February, 24 during March, one during April, five during May, and 21 during June.
Geologic Background. Karangetang (Api Siau) volcano lies at the northern end of the island of Siau, about 125 km NNE of the NE-most point of Sulawesi. The stratovolcano contains five summit craters along a N-S line. It is one of Indonesia's most active volcanoes, with more than 40 eruptions recorded since 1675 and many additional small eruptions that were not documented (Neumann van Padang, 1951). Twentieth-century eruptions have included frequent explosive activity sometimes accompanied by pyroclastic flows and lahars. Lava dome growth has occurred in the summit craters; collapse of lava flow fronts have produced pyroclastic flows.
Information Contacts: Pusat Vulkanologi dan Mitigasi Bencana Geologi (PVMBG, also known as Indonesian Center for Volcanology and Geological Hazard Mitigation, CVGHM), Jalan Diponegoro 57, Bandung 40122, Indonesia (URL: http://www.vsi.esdm.go.id/); MAGMA Indonesia, Kementerian Energi dan Sumber Daya Mineral (URL: https://magma.esdm.go.id/v1); Badan Nasional Penanggulangan Bencana (BNPB), National Disaster Management Agency, Graha BNPB - Jl. Scout Kav.38, East Jakarta 13120, Indonesia (URL: http://www.bnpb.go.id/); Darwin Volcanic Ash Advisory Centre (VAAC), Bureau of Meteorology, Northern Territory Regional Office, PO Box 40050, Casuarina, NT 0811, Australia (URL: http://www.bom.gov.au/info/vaac/); MIROVA (Middle InfraRed Observation of Volcanic Activity), a collaborative project between the Universities of Turin and Florence (Italy) supported by the Centre for Volcanic Risk of the Italian Civil Protection Department (URL: http://www.mirovaweb.it/); Hawai'i Institute of Geophysics and Planetology (HIGP) - MODVOLC Thermal Alerts System, School of Ocean and Earth Science and Technology (SOEST), Univ. of Hawai'i, 2525 Correa Road, Honolulu, HI 96822, USA (URL: http://modis.higp.hawaii.edu/); Copernicus Browser, Copernicus Data Space Ecosystem, European Space Agency (URL: https://dataspace.copernicus.eu/browser/); IDN Times, Jl. Jend. Gatot Subroto Kav. 27 3rd Floor Kuningan, Jakarta, Indonesia 12950, Status of Karangetang Volcano in Sitaro Islands Increases (URL: https://sulsel.idntimes.com/news/indonesia/savi/status-gunung-api-karangetang-di-kepulauan-sitaro-meningkat?page=all).
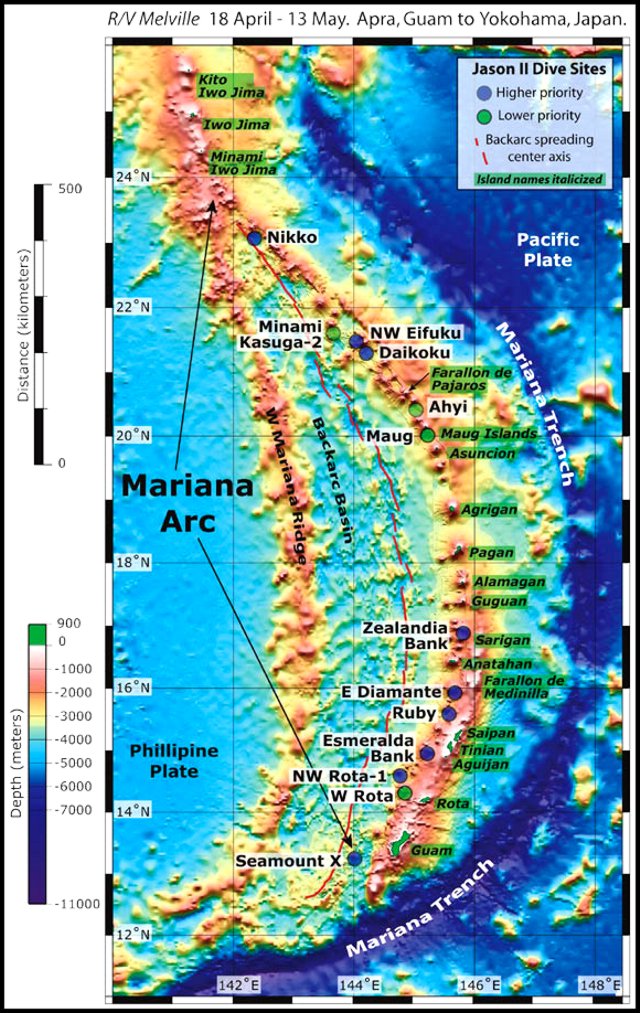
Ahyi (United States) — July 2023 Cite this Report
Ahyi
United States
20.42°N, 145.03°E; summit elev. -75 m
All times are local (unless otherwise noted)
Intermittent hydroacoustic signals and discolored plumes during November 2022-June 2023
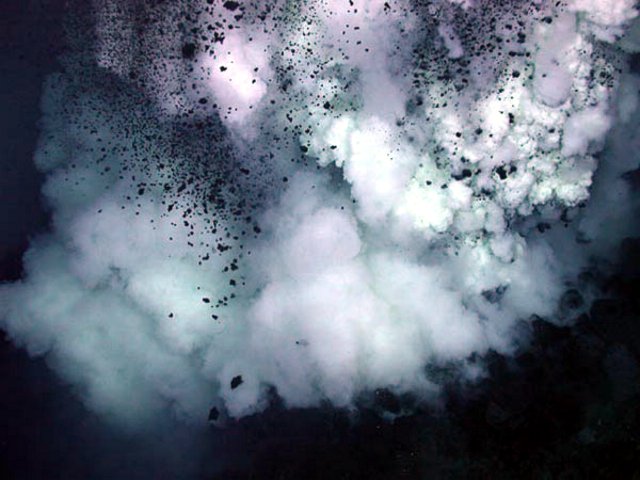
Ahyi seamount is a large, conical submarine volcano that rises to within 75 m of the ocean surface about 18 km SE of the island of Farallon de Pajaros in the Northern Marianas. The remote location of the seamount has made eruptions difficult to document, but seismic stations installed in the region confirmed an eruption in the vicinity in 2001. No new activity was detected until April-May 2014 when an eruption was detected by NOAA (National Oceanic and Atmospheric Administration) divers, hydroacoustic sensors, and seismic stations (BGVN 42:04). New activity was first detected on 15 November by hydroacoustic sensors that were consistent with submarine volcanic activity. This report covers activity during November 2022 through June 2023 based on daily and weekly reports from the US Geological Survey.
Starting in mid-October, hydroacoustic sensors at Wake Island (2.2 km E) recorded signals consistent with submarine volcanic activity, according to a report from the USGS issued on 15 November 2022. A combined analysis of the hydroacoustic signals and seismic stations located at Guam and Chichijima Island, Japan, suggested that the source of this activity was at or near the Ahyi seamount. After a re-analysis of a satellite image of the area that was captured on 6 November, USGS confirmed that there was no evidence of discoloration at the ocean surface. Few hydroacoustic and seismic signals continued through November, including on 18 November, which USGS suggested signified a decline or pause in unrest. A VONA (Volcano Observatory Notice for Aviation) reported that a discolored water plume was persistently visible in satellite data starting on 18 November (figure 6). Though clouds often obscured clear views of the volcano, another discolored water plume was captured in a satellite image on 26 November. The Aviation Color Code (ACC) was raised to Yellow (the second lowest level on a four-color scale) and the Volcano Alert Level (VAL) was raised to Advisory (the second lowest level on a four-level scale) on 29 November.
During December, occasional detections were recorded on the Wake Island hydrophone sensors and discolored water over the seamount remained visible. During 2-7, 10-12, and 16-31 December possible explosion signals were detected. A small area of discolored water was observed in high-resolution Sentinel-2 satellite images during 1-6 December (figure 7). High-resolution satellite images recorded discolored water plumes on 13 December that originated from the summit region; no observations indicated that activity breached the ocean surface. A possible underwater plume was visible in satellite images on 18 December, and during 19-20 December a definite but diffuse underwater plume located SSE from the main vent was reported. An underwater plume was visible in a satellite image taken on 26 December (figure 7).
Hydrophone sensors continued to detect signals consistent with possible explosions during 1-8 January 2023. USGS reported that the number of detections decreased during 4-5 January. The hydrophone sensors experienced a data outage that started at 0118 on 8 January and continued through 10 January, though according to USGS, possible explosions were recorded prior to the data outage and likely continued during the outage. A discolored water plume originating from the summit region was detected in a partly cloudy satellite image on 8 January. On 11-12 and 15-17 January possible explosion signals were recorded again. One small signal was detected during 22-23 January and several signals were recorded on 25 and 31 January. During 27-31 January a plume of discolored water was observed above the seamount in satellite imagery (figure 8).
Low levels of activity continued during February and March, based on data from pressure sensors on Wake Island. During 1 and 4-6 February activity was reported, and a submarine plume was observed on 4 February (figure 8). Possible explosion signals were detected during 7-8, 10, 13-14, and 24 February. During 1-2 and 3-5 March a plume of discolored water was observed in satellite imagery (figure 8). Almost continuous hydroacoustic signals were detected in remote pressure sensor data on Wake Island 2,270 km E from the volcano during 7-13 March. During 12-13 March water discoloration around the seamount was observed in satellite imagery, despite cloudy weather. By 14 March discolored water extended about 35 km, but no direction was noted. USGS reported that the continuous hydroacoustic signals detected during 13-14 March stopped abruptly on 14 March and no new detections were observed. Three 30 second hydroacoustic detections were reported during 17-19 March, but no activity was visible due to cloudy weather. A data outage was reported during 21-22 March, making pressure sensor data unavailable; a discolored water plume was, however, visible in satellite data. A possible underwater explosion signal was detected by pressure sensors at Wake Island on 26, 29, and 31 March, though the cause and origin of these events were unclear.
Similar low activity continued during April, May, and June. Several signals were detected during 1-3 April in pressure sensors at Wake Island. USGS suggested that these may be related to underwater explosions or earthquakes at the volcano, but no underwater plumes were visible in clear satellite images. The pressure sensors had data outages during 12-13 April and no data were recorded; no underwater plumes were visible in satellite images, although cloudy weather obscured most clear views. Eruptive activity was reported starting at 2210 on 21 May. On 22 May a discolored water plume that extended 4 km was visible in satellite images, though no direction was recorded. During 23-24 May some signals were detected by the underwater pressure sensors. Possible hydroacoustic signals were detected during 2-3 and 6-8 June. Multiple hydroacoustic signals were detected during 9-11 and 16-17 June, although no activity was visible in satellite images. One hydroacoustic signal was detected during 23-24 June, but there was some uncertainty about its association with volcanic activity. A single possible hydroacoustic signal was detected during 30 June to 1 July.
Geologic Background. Ahyi seamount is a large conical submarine volcano that rises to within 75 m of the ocean surface ~18 km SE of the island of Farallon de Pajaros in the northern Marianas. Water discoloration has been observed there, and in 1979 the crew of a fishing boat felt shocks over the summit area, followed by upwelling of sulfur-bearing water. On 24-25 April 2001 an explosive eruption was detected seismically by a station on Rangiroa Atoll, Tuamotu Archipelago. The event was well constrained (+/- 15 km) at a location near the southern base of Ahyi. An eruption in April-May 2014 was detected by NOAA divers, hydroacoustic sensors, and seismic stations.
Information Contacts: US Geological Survey, Volcano Hazards Program (USGS-VHP), 12201 Sunrise Valley Drive, Reston, VA, USA, https://volcanoes.usgs.gov/index.html; Copernicus Browser, Copernicus Data Space Ecosystem, European Space Agency (URL: https://dataspace.copernicus.eu/browser/).
Kadovar (Papua New Guinea) — June 2023 Cite this Report
Kadovar
Papua New Guinea
3.608°S, 144.588°E; summit elev. 365 m
All times are local (unless otherwise noted)
An ash plume and weak thermal anomaly during May 2023
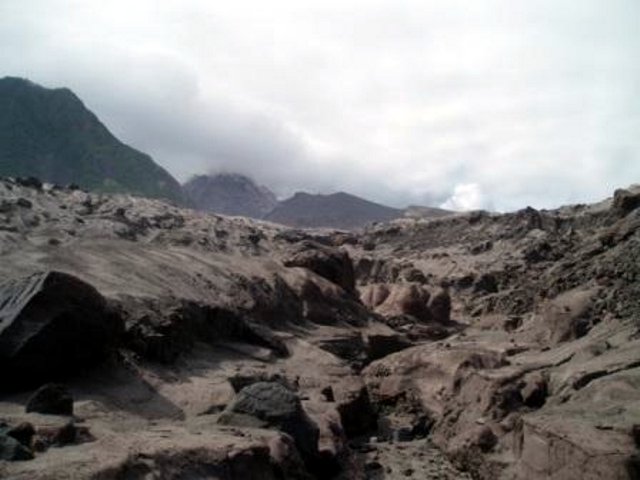
Kadovar is a 2-km-wide island that is the emergent summit of a Bismarck Sea stratovolcano. It lies off the coast of New Guinea, about 25 km N of the mouth of the Sepik River. Prior to an eruption that began in 2018, a lava dome formed the high point of the volcano, filling an arcuate landslide scarp open to the S. Submarine debris-avalanche deposits occur to the S of the island. The current eruption began in January 2018 and has comprised lava effusion from vents at the summit and at the E coast; more recent activity has consisted of ash plumes, weak thermal activity, and gas-and-steam plumes (BGVN 48:02). This report covers activity during February through May 2023 using information from the Darwin Volcanic Ash Advisory Center (VAAC) and satellite data.
Activity during the reporting period was relatively low and mainly consisted of white gas-and-steam plumes that were visible in natural color satellite images on clear weather days (figure 67). According to a Darwin VAAC report, at 2040 on 6 May an ash plume rose to 4.6 km altitude and drifted W; by 2300 the plume had dissipated. MODIS satellite instruments using the MODVOLC thermal algorithm detected a single thermal hotspot on the SE side of the island on 7 May. Weak thermal activity was also detected in a satellite image on the E side of the island on 14 May, accompanied by a white gas-and-steam plume that drifted SE (figure 68).
Geologic Background. The 2-km-wide island of Kadovar is the emergent summit of a Bismarck Sea stratovolcano of Holocene age. It is part of the Schouten Islands, and lies off the coast of New Guinea, about 25 km N of the mouth of the Sepik River. Prior to an eruption that began in 2018, a lava dome formed the high point of the andesitic volcano, filling an arcuate landslide scarp open to the south; submarine debris-avalanche deposits occur in that direction. Thick lava flows with columnar jointing forms low cliffs along the coast. The youthful island lacks fringing or offshore reefs. A period of heightened thermal phenomena took place in 1976. An eruption began in January 2018 that included lava effusion from vents at the summit and at the E coast.
Information Contacts: Darwin Volcanic Ash Advisory Centre (VAAC), Bureau of Meteorology, Northern Territory Regional Office, PO Box 40050, Casuarina, NT 0811, Australia (URL: http://www.bom.gov.au/info/vaac/); Hawai'i Institute of Geophysics and Planetology (HIGP) - MODVOLC Thermal Alerts System, School of Ocean and Earth Science and Technology (SOEST), Univ. of Hawai'i, 2525 Correa Road, Honolulu, HI 96822, USA (URL: http://modis.higp.hawaii.edu/); Copernicus Browser, Copernicus Data Space Ecosystem, European Space Agency (URL: https://dataspace.copernicus.eu/browser/).
San Miguel (El Salvador) — June 2023 Cite this Report
San Miguel
El Salvador
13.434°N, 88.269°W; summit elev. 2130 m
All times are local (unless otherwise noted)
Small gas-and-ash explosions during March and May 2023
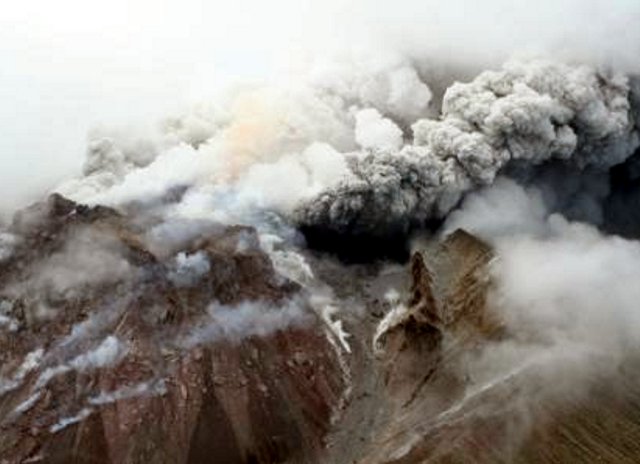
San Miguel in El Salvador is a broad, deep crater complex that has been frequently modified by eruptions recorded since the early 16th century and consists of the summit known locally as Chaparrastique. Flank eruptions have produced lava flows that extended to the N, NE, and SE during the 17-19th centuries. The most recent activity has consisted of minor ash eruptions from the summit crater. The current eruption period began in November 2022 and has been characterized by frequent phreatic explosions, gas-and-ash emissions, and sulfur dioxide plumes (BGVN 47:12). This report describes small gas-and-ash explosions during December 2022 through May 2023 based on special reports from the Ministero de Medio Ambiente y Recursos Naturales (MARN).
Activity has been relatively low since the last recorded explosions on 29 November 2022. Seismicity recorded by the San Miguel Volcano Station (VSM) located on the N flank at 1.7 km elevation had decreased by 7 December. Sulfur dioxide gas measurements taken with DOAS (Differential Optical Absorption Spectroscopy) mobile equipment were below typical previously recorded values: 300 tons per day (t/d). During December, small explosions were recorded by the seismic network and manifested as gas-and-steam emissions.
Gas-and-ash explosions in the crater occurred during January 2023, which were recorded by the seismic network. Sulfur dioxide values remained low, between 300-400 t/d through 10 March. At 0817 on 14 January a gas-and-ash emission was visible in webcam images, rising just above the crater rim. Some mornings during February, small gas-and-steam plumes were visible in the crater. On 7 March at 2252 MARN noted an increase in degassing from the central crater; gas emissions were constantly observed through the early morning hours on 8 March. During the early morning of 8 March through the afternoon on 9 March, 12 emissions were registered, some accompanied by ash. The last gas-and-ash emission was recorded at 1210 on 9 March; very fine ashfall was reported in El Tránsito (10 km S), La Morita (6 km W), and La Piedrita (3 km W). The smell of sulfur was reported in Piedra Azul (5 km SW). On 16 March MARN reported that gas-and-steam emissions decreased.
Low degassing and very low seismicity were reported during April; no explosions have been detected between 9 March and 27 May. The sulfur dioxide emissions remained between 350-400 t/d; during 13-20 April sulfur dioxide values fluctuated between 30-300 t/d. Activity remained low through most of May; on 23 May seismicity increased. An explosion was detected at 1647 on 27 May generated a gas-and-ash plume that rose 700 m high (figure 32); a decrease in seismicity and gas emissions followed. The DOAS station installed on the W flank recorded sulfur dioxide values that reached 400 t/d on 27 May; subsequent measurements showed a decrease to 268 t/d on 28 May and 100 t/d on 29 May.
Geologic Background. The symmetrical cone of San Miguel, one of the most active volcanoes in El Salvador, rises from near sea level to form one of the country's most prominent landmarks. A broad, deep, crater complex that has been frequently modified by eruptions recorded since the early 16th century caps the truncated unvegetated summit, also known locally as Chaparrastique. Flanks eruptions of the basaltic-andesitic volcano have produced many lava flows, including several during the 17th-19th centuries that extended to the N, NE, and SE. The SE-flank flows are the largest and form broad, sparsely vegetated lava fields crossed by highways and a railroad skirting the base of the volcano. Flank vent locations have migrated higher on the edifice during historical time, and the most recent activity has consisted of minor ash eruptions from the summit crater.
Information Contacts: Ministero de Medio Ambiente y Recursos Naturales (MARN), Km. 5½ Carretera a Nueva San Salvador, Avenida las Mercedes, San Salvador, El Salvador (URL: http://www.snet.gob.sv/ver/vulcanologia).
Semisopochnoi (United States) — June 2023 Cite this Report
Semisopochnoi
United States
51.93°N, 179.58°E; summit elev. 1221 m
All times are local (unless otherwise noted)
Occasional explosions, ash deposits, and gas-and-steam plumes during December 2022-May 2023
Semisopochnoi is located in the western Aleutians, is 20-km-wide at sea level, and contains an 8-km-wide caldera. The three-peaked Mount Young (formerly Cerberus) was constructed within the caldera during the Holocene. Each of these peaks contains a summit crater; the lava flows on the N flank appear younger than those on the S side. The current eruption period began in early February 2021 and has more recently consisted of intermittent explosions and ash emissions (BGVN 47:12). This report updates activity during December 2022 through May 2023 using daily, weekly, and special reports from the Alaska Volcano Observatory (AVO). AVO monitors the volcano using local seismic and infrasound sensors, satellite data, web cameras, and remote infrasound and lightning networks.
Activity during most of December 2022 was relatively quiet; according to AVO no eruptive or explosive activity was observed since 7 November 2022. Intermittent tremor and occasional small earthquakes were observed in geophysical data. Continuous gas-and-steam emissions were observed from the N crater of Mount Young in webcam images on clear weather days (figure 25). On 24 December, there was a slight increase in earthquake activity and several small possible explosion signals were detected in infrasound data. Eruptive activity resumed on 27 December at the N crater of Mount Young; AVO issued a Volcano Activity Notice (VAN) that reported minor ash deposits on the flanks of Mount Young that extended as far as 1 km from the vent, according to webcam images taken during 27-28 December (figure 26). No ash plumes were observed in webcam or satellite imagery, but a persistent gas-and-steam plume that might have contained some ash rose to 1.5 km altitude. As a result, AVO raised the Aviation Color Code (ACC) to Orange (the second highest level on a four-color scale) and the Volcano Alert Level (VAL) to Watch (the second highest level on a four-level scale). Possible explosions were detected during 21 December 2022 through 1 January 2023 and seismic tremor was recorded during 30-31 December.
During January 2023 eruptive activity continued at the active N crater of Mount Young. Minor ash deposits were observed on the flanks, extending about 2 km SSW, based on webcam images from 1 and 3 January. A possible explosion occurred during 1-2 January based on elevated seismicity recorded on local seismometers and an infrasound signal recorded minutes later by an array at Adak. Though no ash plumes were observed in webcam or satellite imagery, a persistent gas-and-steam plume rose to 1.5 km altitude that might have carried minor traces of ash. Ash deposits were accompanied by periods of elevated seismicity and infrasound signals from the local geophysical network, which AVO reported were likely due to weak explosive activity. Low-level explosive activity was also detected during 2-3 January, with minor gas-and-steam emissions and a new ash deposit that was visible in webcam images. Low-level explosive activity was detected in geophysical data during 4-5 January, with elevated seismicity and infrasound signals observed on local stations. Volcanic tremor was detected during 7-9 January and very weak explosive activity was detected in seismic and infrasound data on 9 January. Weak seismic and infrasound signals were recorded on 17 January, which indicated minor explosive activity, but no ash emissions were observed in clear webcam images; a gas-and-steam plume continued to rise to 1.5 km altitude. During 29-30 January, ash deposits near the summit were observed on fresh snow, according to webcam images.
The active N cone at Mount Young continued to produce a gas-and-steam plume during February, but no ash emissions or explosive events were detected. Seismicity remained elevated with faint tremor during early February. Gas-and-steam emissions from the N crater were observed in clear webcam images on 11-13 and 16 February; no explosive activity was detected in seismic, infrasound, or satellite data. Seismicity has also decreased, with no significant seismic tremor observed since 25 January. Therefore, the ACC was lowered to Yellow (the second lowest level on a four-color scale) and the VAL was lowered to Advisory (the second lowest level on a four-color scale) on 22 February.
Gas-and-steam emissions persisted during March from the N cone of Mount Young, based on clear webcam images. A few brief episodes of weak tremor were detected in seismic data, although seismicity decreased over the month. A gas-and-steam plume detected in satellite data extended 150 km on 18 March. Low-level ash emissions from the N cone at Mount Young were observed in several webcam images during 18-19 March, in addition to small explosions and volcanic tremor. The ACC was raised to Orange and the VAL increased to Watch on 19 March. A small explosion was detected in seismic and infrasound data on 21 March.
Low-level unrest continued during April, although cloudy weather often obscured views of the summit; periods of seismic tremor and local earthquakes were recorded. During 3-4 April a gas-and-steam plume was visible traveling more than 200 km overnight; no ash was evident in the plume, according to AVO. A gas-and-steam plume was observed during 4-6 April that extended 400 km but did not seem to contain ash. Small explosions were detected in seismic and infrasound data on 5 April. Occasional clear webcam images showed continuing gas-and-steam emissions rose from Mount Young, but no ash deposits were observed on the snow. On 19 April small explosions and tremor were detected in seismic and infrasound data. A period of seismic tremor was detected during 22-25 April, with possible weak explosions on 25 April. Ash deposits were visible near the crater rim, but it was unclear if these deposits were recent or due to older deposits.
Occasional small earthquakes were recorded during May, but there were no signs of explosive activity seen in geophysical data. Gas-and-steam emissions continued from the N crater of Mount Young, based on webcam images, and seismicity remained slightly elevated. A new, light ash deposit was visible during the morning of 5 May on fresh snow on the NW flank of Mount Young. During 10 May periods of volcanic tremor were observed. The ACC was lowered to Yellow and the VAL to Advisory on 17 May due to no additional evidence of activity.
Geologic Background. Semisopochnoi, the largest subaerial volcano of the western Aleutians, is 20 km wide at sea level and contains an 8-km-wide caldera. It formed as a result of collapse of a low-angle, dominantly basaltic volcano following the eruption of a large volume of dacitic pumice. The high point of the island is Anvil Peak, a double-peaked late-Pleistocene cone that forms much of the island's northern part. The three-peaked Mount Cerberus (renamed Mount Young in 2023) was constructed within the caldera during the Holocene. Each of the peaks contains a summit crater; lava flows on the N flank appear younger than those on the south side. Other post-caldera volcanoes include the symmetrical Sugarloaf Peak SSE of the caldera and Lakeshore Cone, a small cinder cone at the edge of Fenner Lake in the NE part of the caldera. Most documented eruptions have originated from Young, although Coats (1950) considered that both Sugarloaf and Lakeshore Cone could have been recently active.
Information Contacts: Alaska Volcano Observatory (AVO), a cooperative program of a) U.S. Geological Survey, 4200 University Drive, Anchorage, AK 99508-4667 USA (URL: https://avo.alaska.edu/), b) Geophysical Institute, University of Alaska, PO Box 757320, Fairbanks, AK 99775-7320, USA, and c) Alaska Division of Geological & Geophysical Surveys, 794 University Ave., Suite 200, Fairbanks, AK 99709, USA (URL: http://dggs.alaska.gov/).
Ebeko
Russia
50.686°N, 156.014°E; summit elev. 1103 m
All times are local (unless otherwise noted)
Continued explosions, ash plumes, and ashfall during October 2022-May 2023
Ebeko, located on the N end of Paramushir Island in the Kuril Islands, consists of three summit craters along a SSW-NNE line at the northern end of a complex of five volcanic cones. Eruptions date back to the late 18th century and have been characterized as small-to-moderate explosions from the summit crater, accompanied by intense fumarolic activity. The current eruption period began in June 2022 and has recently consisted of frequent explosions, ash plumes, and thermal activity (BGVN 47:10). This report covers similar activity during October 2022 through May 2023, based on information from the Kamchatka Volcanic Eruptions Response Team (KVERT) and satellite data.
Activity during October consisted of explosive activity, ash plumes, and occasional thermal anomalies. Visual data by volcanologists from Severo-Kurilsk showed explosions producing ash clouds up to 2.1-3 km altitude which drifted E, N, NE, and SE during 1-8, 10, 16, and 18 October. KVERT issued several Volcano Observatory Notices for Aviation (VONA) on 7, 13-15, and 27 October 2022, stating that explosions generated ash plumes that rose to 2.3-4 km altitude and drifted 5 km E, NE, and SE. Ashfall was reported in Severo-Kurilsk (Paramushir Island, about 7 km E) on 7 and 13 October. Satellite data showed a thermal anomaly over the volcano on 15-16 October. Visual data showed ash plumes rising to 2.5-3.6 km altitude on 22, 25-29, and 31 October and moving NE due to constant explosions.
Similar activity continued during November, with explosions, ash plumes, and ashfall occurring. KVERT issued VONAs on 1-2, 4, 6-7, 9, 13, and 16 November that reported explosions and resulting ash plumes that rose to 1.7-3.6 km altitude and drifted 3-5 km SE, ESE, E, and NE. On 1 November ash plumes extended as far as 110 km SE. On 5, 8, 12, and 24-25 November explosions and ash plumes rose to 2-3.1 km altitude and drifted N and E. Ashfall was observed in Severo-Kurilsk on 7 and 16 November. A thermal anomaly was visible during 1-4, 16, and 20 November. Explosions during 26 November rose as high as 2.7 km altitude and drifted NE (figure 45).
Explosions and ash plumes continued to occur in December. During 1-2 and 4 December volcanologists from Severo-Kurilsk observed explosions that sent ash to 1.9-2.5 km altitude and drifted NE and SE (figure 46). VONAs were issued on 5, 9, and 16 December reporting that explosions generated ash plumes rising to 1.9 km, 2.6 km, and 2.4 km altitude and drifted 5 km SE, E, and NE, respectively. A thermal anomaly was visible in satellite imagery on 16 December. On 18 and 27-28 December explosions produced ash plumes that rose to 2.5 km altitude and drifted NE and SE. On 31 December an ash plume rose to 2 km altitude and drifted NE.
Explosions continued during January 2023, based on visual observations by volcanologists from Severo-Kurilsk. During 1-7 January explosions generated ash plumes that rose to 4 km altitude and drifted NE, E, W, and SE. According to VONAs issued by KVERT on 2, 4, 10, and 23 January, explosions produced ash plumes that rose to 2-4 km altitude and drifted 5 km N, NE, E, and ENE; the ash plume that rose to 4 km altitude occurred on 10 January (figure 47). Satellite data showed a thermal anomaly during 3-4, 10, 13, 16, 21, 22, and 31 January. KVERT reported that an ash cloud on 4 January moved 12 km NE. On 6 and 9-11 January explosions sent ash plumes to 4.5 km altitude and drifted W and ESE. On 13 January an ash plume rose to 3 km altitude and drifted SE. During 20-24 January ash plumes from explosions rose to 3.7 km altitude and drifted SE, N, and NE. On 21 January the ash plume drifted as far as 40 km NE. During 28-29 and 31 January and 1 February ash plumes rose to 4 km altitude and drifted NE.
During February, explosions, ash plumes, and ashfall were reported. During 1, 4-5 and 7-8 February explosions generated ash plumes that rose to 4.5 km altitude and drifted E and NE; ashfall was observed on 5 and 8 February. On 6 February an explosion produced an ash plume that rose to 3 km altitude and drifted 7 km E, causing ashfall in Severo-Kurilsk. A thermal anomaly was visible in satellite data on 8, 9, 13, and 21 February. Explosions on 9 and 12-13 February produced ash plumes that rose to 4 km altitude and drifted E and NE; the ash cloud on 12 February extended as far as 45 km E. On 22 February explosions sent ash to 3 km altitude that drifted E. During 24 and 26-27 February ash plumes rose to 4 km altitude and drifted E. On 28 February an explosion sent ash to 2.5-3 km altitude and drifted 5 km E; ashfall was observed in Severo-Kurilsk.
Activity continued during March; visual observations showed that explosions generated ash plumes that rose to 3.6 km altitude on 3, 5-7, and 9-12 March and drifted E, NE, and NW. Thermal anomalies were visible on 10, 13, and 29-30 March in satellite imagery. On 18, 21-23, 26, and 29-30 March explosions produced ash plumes that rose to 2.8 km altitude and drifted NE and E; the ash plumes during 22-23 March extended up to 76 km E. A VONA issued on 21 March reported an explosion that produced an ash plume that rose to 2.8 km altitude and drifted 5 km E. Another VONA issued on 23 March reported that satellite data showed an ash plume rising to 3 km altitude and drifted 14 km E.
Explosions during April continued to generate ash plumes. On 1 and 4 April an ash plume rose to 2.8-3.5 km altitude and drifted SE and NE. A thermal anomaly was visible in satellite imagery during 1-6 April. Satellite data showed ash plumes and clouds rising to 2-3 km altitude and drifting up to 12 km SW and E on 3 and 6 April (figure 48). KVERT issued VONAs on 3, 5, 14, 16 April describing explosions that produced ash plumes rising to 3 km, 3.5 km, 3.5 km, and 3 km altitude and drifting 5 km S, 5 km NE and SE, 72 km NNE, and 5 km NE, respectively. According to satellite data, the resulting ash cloud from the explosion on 14 April was 25 x 7 km in size and drifted 72-104 km NNE during 14-15 April. According to visual data by volcanologists from Severo-Kurilsk explosions sent ash up to 3.5 km altitude that drifted NE and E during 15-16, 22, 25-26, and 29 April.
The explosive eruption continued during May. Explosions during 3-4, 6-7, and 9-10 May generated ash plumes that rose to 4 km altitude and drifted SW and E. Satellite data showed a thermal anomaly on 3, 9, 13-14, and 24 May. During 12-16, 23-25, and 27-28 May ash plumes rose to 3.5 km altitude and drifted in different directions due to explosions. Two VONA notices were issued on 16 and 25 May, describing explosions that generated ash plumes rising to 3 km and 3.5 km altitude, respectively and extending 5 km E. The ash cloud on 25 May drifted 75 km SE.
Thermal activity in the summit crater, occasionally accompanied by ash plumes and ash deposits on the SE and E flanks due to frequent explosions, were visible in infrared and true color satellite images (figure 49).
Geologic Background. The flat-topped summit of the central cone of Ebeko volcano, one of the most active in the Kuril Islands, occupies the northern end of Paramushir Island. Three summit craters located along a SSW-NNE line form Ebeko volcano proper, at the northern end of a complex of five volcanic cones. Blocky lava flows extend west from Ebeko and SE from the neighboring Nezametnyi cone. The eastern part of the southern crater contains strong solfataras and a large boiling spring. The central crater is filled by a lake about 20 m deep whose shores are lined with steaming solfataras; the northern crater lies across a narrow, low barrier from the central crater and contains a small, cold crescentic lake. Historical activity, recorded since the late-18th century, has been restricted to small-to-moderate explosive eruptions from the summit craters. Intense fumarolic activity occurs in the summit craters, on the outer flanks of the cone, and in lateral explosion craters.
Information Contacts: Kamchatka Volcanic Eruptions Response Team (KVERT), Far Eastern Branch, Russian Academy of Sciences, 9 Piip Blvd., Petropavlovsk-Kamchatsky, 683006, Russia (URL: http://www.kscnet.ru/ivs/kvert/); MIROVA (Middle InfraRed Observation of Volcanic Activity), a collaborative project between the Universities of Turin and Florence (Italy) supported by the Centre for Volcanic Risk of the Italian Civil Protection Department (URL: http://www.mirovaweb.it/); Copernicus Browser, Copernicus Data Space Ecosystem, European Space Agency (URL: https://dataspace.copernicus.eu/browser/).
Home Reef
Tonga
18.992°S, 174.775°W; summit elev. -10 m
All times are local (unless otherwise noted)
Discolored plumes continued during November 2022-April 2023
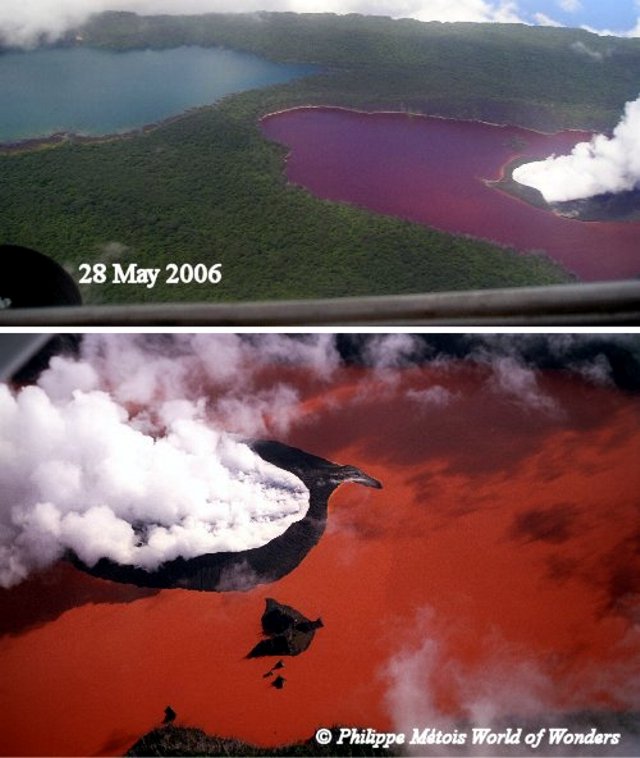
Home Reef is a submarine volcano located in the central Tonga islands between Lateiki (Metis Shoal) and Late Island. The first recorded eruption occurred in the mid-19th century, when an ephemeral island formed. An eruption in 1984 produced a 12-km-high eruption plume, a large volume of floating pumice, and an ephemeral island 500 x 1,500 m wide, with cliffs 30-50 m high that enclosed a water-filled crater. Another island-forming eruption in 2006 produced widespread pumice rafts that drifted as far as Australia; by 2008 the island had eroded below sea level. The previous eruption occurred during October 2022 and was characterized by a new island-forming eruption, lava effusion, ash plumes, discolored water, and gas-and-steam plumes (BGVN 47:11). This report covers discolored water plumes during November 2022 through April 2023 using satellite data.
Discolored plumes continued during the reporting period and were observed in true color satellite images on clear weather days. Satellite images show light green-yellow discolored water extending W on 8 and 28 November 2022 (figure 31), and SW on 18 November. Light green-yellow plumes extended W on 3 December, S on 13 December, SW on 18 December, and W and S on 23 December (figure 31). On 12 January 2023 discolored green-yellow plumes extended to the NE, E, SE, and N. The plume moved SE on 17 January and NW on 22 January. Faint discolored water in February was visible moving NE on 1 February. A discolored plume extended NW on 8 and 28 March and NW on 13 March (figure 31). During April, clear weather showed green-blue discolored plumes moving S on 2 April, W on 7 April, and NE and S on 12 April. A strong green-yellow discolored plume extended E and NE on 22 April for several kilometers (figure 31).
Geologic Background. Home Reef, a submarine volcano midway between Metis Shoal and Late Island in the central Tonga islands, was first reported active in the mid-19th century, when an ephemeral island formed. An eruption in 1984 produced a 12-km-high eruption plume, large amounts of floating pumice, and an ephemeral 500 x 1,500 m island, with cliffs 30-50 m high that enclosed a water-filled crater. In 2006 an island-forming eruption produced widespread dacitic pumice rafts that drifted as far as Australia. Another island was built during a September-October 2022 eruption.
Information Contacts: Copernicus Browser, Copernicus Data Space Ecosystem, European Space Agency (URL: https://dataspace.copernicus.eu/browser/).
Ambae
Vanuatu
15.389°S, 167.835°E; summit elev. 1496 m
All times are local (unless otherwise noted)
New lava flow, ash plumes, and sulfur dioxide plumes during February-May 2023
Ambae, also known as Aoba, is a large basaltic shield volcano in Vanuatu. A broad pyroclastic cone containing three crater lakes (Manaro Ngoru, Voui, and Manaro Lakua) is located at the summit within the youngest of at least two nested calderas. Periodic phreatic and pyroclastic explosions have been reported since the 16th century. A large eruption more than 400 years ago resulted in a volcanic cone within the summit crater that is now filled by Lake Voui; the similarly sized Lake Manaro fills the western third of the caldera. The previous eruption ended in August 2022 that was characterized by gas-and-steam and ash emissions and explosions of wet tephra (BGVN 47:10). This report covers a new eruption during February through May 2023 that consisted of a new lava flow, ash plumes, and sulfur dioxide emissions, using information from the Vanuatu Meteorology and Geo-Hazards Department (VMGD) and satellite data.
During the reporting period, the Alert Level remained at a 2 (on a scale of 0-5), which has been in place since December 2021. Activity during October 2022 through March 2023 remained relatively low and mostly consisted of gas-and-steam emissions in Lake Voui. VMGD reported that at 1300 on 15 November a satellite image captured a strong amount of sulfur dioxide rising above the volcano (figure 99), and that seismicity slightly increased. The southern and northern part of the island reported a strong sulfur dioxide smell and heard explosions. On 20 February 2023 a gas-and-ash plume rose 1.3 km above the summit and drifted SSW, according to a webcam image (figure 100). Gas-and-steam and possibly ash emissions continued on 23 February and volcanic earthquakes were recorded by the seismic network.
During April, volcanic earthquakes and gas-and-steam and ash emissions were reported from the cone in Lake Voui. VMGD reported that activity increased during 5-7 April; high gas-and-steam and ash plumes were visible, accompanied by nighttime incandescence. According to a Wellington VAAC report, a low-level ash plume rose as high as 2.5 km above the summit and drifted W and SW on 5 April, based on satellite imagery. Reports in Saratamata stated that a dark ash plume drifted to the WSW, but no loud explosion was heard. Webcam images from 2100 showed incandescence above the crater and reflected in the clouds. According to an aerial survey, field observations, and satellite data, water was no longer present in the lake. A lava flow was reported effusing from the vent and traveling N into the dry Lake Voui, which lasted three days. The next morning at 0745 on 6 April a gas-and-steam and ash plume rose 5.4 km above the summit and drifted ESE, based on information from VMGD (figure 101). The Wellington VAAC also reported that light ashfall was observed on the island. Intermittent gas-and-steam and ash emissions were visible on 7 April, some of which rose to an estimated 3 km above the summit and drifted E. Webcam images during 0107-0730 on 7 April showed continuing ash emissions. A gas-and-steam and ash plume rose 695 m above the summit crater at 0730 on 19 April and drifted ESE, based on a webcam image (figure 102).
According to visual and infrared satellite data, water was visible in Lake Voui as late as 24 March 2023 (figure 103). The vent in the caldera showed a gas-and-steam plume drifted SE. On 3 April thermal activity was first detected, accompanied by a gas-and-ash plume that drifted W (figure 103). The lava flow moved N within the dry lake and was shown cooling by 8 April. By 23 April much of the water in the lake had returned. Occasional sulfur dioxide plumes were detected by the TROPOMI instrument on the Sentinel-5P satellite that exceeded 2 Dobson Units (DU) and drifted in different directions (figure 104).
Geologic Background. The island of Ambae, also known as Aoba, is a massive 2,500 km3 basaltic shield that is the most voluminous volcano of the New Hebrides archipelago. A pronounced NE-SW-trending rift zone with numerous scoria cones gives the 16 x 38 km island an elongated form. A broad pyroclastic cone containing three crater lakes (Manaro Ngoru, Voui, and Manaro Lakua) is located at the summit within the youngest of at least two nested calderas, the largest of which is 6 km in diameter. That large central edifice is also called Manaro Voui or Lombenben volcano. Post-caldera explosive eruptions formed the summit craters about 360 years ago. A tuff cone was constructed within Lake Voui (or Vui) about 60 years later. The latest known flank eruption, about 300 years ago, destroyed the population of the Nduindui area near the western coast.
Information Contacts: Geo-Hazards Division, Vanuatu Meteorology and Geo-Hazards Department (VMGD), Ministry of Climate Change Adaptation, Meteorology, Geo-Hazards, Energy, Environment and Disaster Management, Private Mail Bag 9054, Lini Highway, Port Vila, Vanuatu (URL: http://www.vmgd.gov.vu/, https://www.facebook.com/VanuatuGeohazardsObservatory/); Wellington Volcanic Ash Advisory Centre (VAAC), Meteorological Service of New Zealand Ltd (MetService), PO Box 722, Wellington, New Zealand (URL: http://www.metservice.com/vaac/, http://www.ssd.noaa.gov/VAAC/OTH/NZ/messages.html); MIROVA (Middle InfraRed Observation of Volcanic Activity), a collaborative project between the Universities of Turin and Florence (Italy) supported by the Centre for Volcanic Risk of the Italian Civil Protection Department (URL: http://www.mirovaweb.it/); Global Sulfur Dioxide Monitoring Page, Atmospheric Chemistry and Dynamics Laboratory, NASA Goddard Space Flight Center (NASA/GSFC), 8800 Greenbelt Road, Goddard, Maryland, USA (URL: https://so2.gsfc.nasa.gov/); Copernicus Browser, Copernicus Data Space Ecosystem, European Space Agency (URL: https://dataspace.copernicus.eu/browser/).
Search Bulletin Archive by Publication Date
Select a month and year from the drop-downs and click "Show Issue" to have that issue displayed in this tab.
The default month and year is the latest issue available.
Bulletin of the Global Volcanism Network - Volume 31, Number 05 (May 2006)
Managing Editor: Richard Wunderman
Ambae (Vanuatu)
During May-June 2006, Lake Voui's water rapidly turns from blue to red
Anatahan (United States)
Eruptions restarted in 2005 and continued until at least June 2006
Bagana (Papua New Guinea)
Lava flows and ash emission throughout March 2006
Bulusan (Philippines)
Explosive activity continues
Daikoku (United States)
Discovery of agitated pool of molten sulfur at 420 m ocean depth
Heard (Australia)
2006 imagery indicates renewed volcanism
Krummel-Garbuna-Welcker (Papua New Guinea)
Earthquakes continue while vents remain calm through April 2006
Lamington (Papua New Guinea)
Mild vapor emission and earthquakes through March 2006
Langila (Papua New Guinea)
Moderate activity steady through March 2006
Merapi (Indonesia)
Mid-2006 brings multiple pyroclastic flows that kill two, and travel up to 7 km
NW Rota-1 (United States)
Views of submarine volcano ejecting lava and bombs
Popocatepetl (Mexico)
During first half of 2006, several ash plumes rose to ~ 7-8 km altitude
Rabaul (Papua New Guinea)
Gas emissions and earthquakes during March-April 2006
Soufriere Hills (United Kingdom)
Big dome collapse and tall plume on 20 May 2006 leave a W-leaning crater
St. Helens (United States)
Intracrater lava dome continues to grow through at least May 2006
Ubinas (Peru)
Ash and steam emissions stir hazard and environmental concerns
Villarrica (Chile)
Unusual seismicity, minor pyroclastic, and gas explosions, January-April 2005
Ambae
Vanuatu
15.389°S, 167.835°E; summit elev. 1496 m
All times are local (unless otherwise noted)
During May-June 2006, Lake Voui's water rapidly turns from blue to red
Alain Bernard reported that Lake Voui in Aoba-Ambae volcano (BGVN 31:01) was undergoing a spectacular change in its color?the previously aqua-colored lake was turning red (figure 27).
Images of a pale reddish Lake Voui were obtained by Esline Garaebiti, who flew over the volcano 28 May 2006. Philippe Métois, who flew over on 3 June 2006, photographed a blood-red lake. These photos were are posted on the CVL website along with recent ASTER temperature data. This color change was tentatively attributed to a rapid shift in the lake water's redox state. The change might be linked to the ratio of SO2/H2S in the hydrothermal fluids.
Geologic Background. The island of Ambae, also known as Aoba, is a massive 2,500 km3 basaltic shield that is the most voluminous volcano of the New Hebrides archipelago. A pronounced NE-SW-trending rift zone with numerous scoria cones gives the 16 x 38 km island an elongated form. A broad pyroclastic cone containing three crater lakes (Manaro Ngoru, Voui, and Manaro Lakua) is located at the summit within the youngest of at least two nested calderas, the largest of which is 6 km in diameter. That large central edifice is also called Manaro Voui or Lombenben volcano. Post-caldera explosive eruptions formed the summit craters about 360 years ago. A tuff cone was constructed within Lake Voui (or Vui) about 60 years later. The latest known flank eruption, about 300 years ago, destroyed the population of the Nduindui area near the western coast.
Information Contacts: Alain Bernard, IAVCEI Commission on Volcanic Lakes (CVL), Université Libre de Bruxelles (ULB), CP160/02, avenue F.D. Roosevelt 50, Brussels, Belgium (URL: http://www.ulb.ac.be/sciences/cvl/aoba/Ambae1.html, http://www.ulb.ac.be/sciences/cvl/multispectral/multispectral2.htm); Esline Garaebiti, Department of Geology, Mines, and Water Resources (DGMWR), Port-Vila, Vanuatu; Philippe Métois, World of Wonders.
Anatahan (United States) — May 2006 Cite this Report
Anatahan
United States
16.35°N, 145.67°E; summit elev. 790 m
All times are local (unless otherwise noted)
Eruptions restarted in 2005 and continued until at least June 2006
Anatahan erupted almost continuously from 5 January 2005 until 3 September 2005 when eruptions suddenly ceased (BGVN 30:07, 30:08). Observations through 16 September indicated relative quiet. Indications from later reports (discussed below) are that this lull continued through at least mid- to late-February 2006. Eruptions resumed after that, although the observations suggest chiefly or entirely gas-rich plumes. Jenifer Piatt suggested that plumes after early September 2005 and through May 2006 rose only to low altitude, perhaps 2,500 m.
This report covers the period through early June 2006 and includes both field observations as well as several satellite-based SO2 measurements, and extensive satellite images of thin plumes assessed as vog (volcanic smog; table 5). Some of those plumes extended W to SW from Anatahan and had overall atmospheric SO2 masses on the order of up to 4 kilotons (kt).
Table 5. AURA/OMI SO2 from Anatahan plumes at stated dates in 2006 (the two indicated with asterisks ("**") shown as figures). The last column displays the plume's overall estimated SO2 mass. The second and third columns indicate, respectively, the area of the sulfurous plume, and the estimated maximum SO2 concentration (in DU) and its latitude and longitude. Courtesy of Simon Carn.
| Date |
Time (UTC) |
Orbit |
Area of plume (km2) |
Highest concentration in Dobson Units (DU) |
Coordinates |
Atmospheric SO2 (kilotons) |
| 15 Mar 2006 |
0400-0420** |
08852 |
-- |
-- |
-- |
1-2 |
| 12 Apr 2006 |
0249-0428** |
-- |
9.1 x 10⁴ |
1.9 DU |
13.16°N, 137.26°E |
2.2 |
| 16 Apr 2006 |
0401-0404 |
09318 |
9.8 x 10⁴ |
6.7 DU |
16.28°N, 145.39°E |
3.9 |
| 23 Apr 2006 |
0407-0410 |
09420 |
11.0 x 10⁴ |
4.6 DU |
17.42°N, 143.06°E |
3.5 |
| 31 May 2006 |
0331-0334 |
09979 |
4.8 x 10⁴ |
3.0 DU |
16.07°N, 145.24°E |
1.4 |
During the week ending 19 September 2005, there were three periods of elevated tremor. On 13 September, technicians from the Emergency Management Office of the Commonwealth of the Northern Mariana Islands (EMO-CNMI) who were reinstalling seismic station ANA2 on Anatahan reported that the plume was gray, small, and moving to the NW. They heard no explosions and saw no craters or large ballistics in vicinity of ANA2.
CMNI-USGS reports for 3 September until at least 26 December 2005 noted an absence of erupted ash. At least as late as 27 February 2006, Anatahan lacked reported ash emissions. Also as late as the 27th, seismicity was at background levels, amounting to a few percent of the late June 2005 maximum, with occasional long-period earthquakes. On 27 February 2006, the Alert level was reduced to Normal and the Aviation Color Code to Green because of the continuing low levels of activity.
By the date of the next USGS update, on 20 March 2006, activity had increased somewhat and the Alert level was raised to Advisory and the Aviation Color Code to Yellow. A faint, thin plume of gas that was occasionally observable during January and February became continuous and slightly more dense on satellite imagery during the first three weeks of March.
Using the Ozone Monitoring Instrument (OMI) on NASA's EOS/Aura satellite, Simon Carn imaged Anatahan's plume of 15 March 2006 (figure 27). Anatahan lies at the solid triangle; the plume blew largely SW. Carn found that the atmospheric SO2 mass was 1-2 kilotons. He noted that there had been an upsurge in satellite-detected SO2 output that began in mid-February 2006. The highest concentrations of several OMI analyses (table 6 and figure 28) were measured on 16 and 23 April (3.9 and 3.5 kilotons of SO2, respectively).
Table 6. A summary of Anatahan plume data based on US AFWA satellite observations during 15 March to 31 May 2006. DMSP stands for Defense Meteorological Satellite Program. Courtesy of Charles Holliday and Jenifer E. Piatt, AFWA.
| Date |
Time (UTC) |
Satellite (resolution or wavelength) |
Observation |
| 15 Mar 2006 |
0354 |
Aqua Modis (500 m res.) |
Faint vog plume seen drifting generally SSW |
| 16 Mar 2006 |
0125 |
Terra Modis (500 m res.) |
Vog seen drifting generally to the SW |
| 17 Mar 2006 |
0330 |
Aqua Modis (1 km res.) |
Cloud cover obscured visibility |
| 18 Mar 2006 |
0415 |
Aqua Modis (500 m res.) |
Vog plume appears longer and more dense, drifting generally SW |
| 19 Mar 2006 |
0320 |
Aqua Modis (500 m res.) |
Moderately dense vog plume, extending over 370 km SW. No signature has been visible on MTSAT split window IR imagery nor NOAA channel differencing images, suggesting minimal ash content in the plume. |
| 19 Mar 2006 |
1606 |
NOAA-18 Shortwave IR (3.55-3.93 µm) |
Hot spot visible at island |
| 19 Mar 2006 |
2221 |
DMSP F-16 Visible (566 m res.) |
A very faint plume discernable out to 230 km SW from source |
| 20 Mar 2006 |
0400 |
Aqua Modis (500 m res.) |
Vog plume drifting S and SW |
| 20 Mar 2006 |
2209 |
DMSP F-16 Visible (556 m res.) |
Very light vog drifting SSW |
| 21 Mar 2006 |
0305 |
Aqua Modis (500 m res.) |
Distinct vog plume drifting SSW |
| 21 Mar 2006 |
1546 |
NOAA-18 Shortwave IR (3.55-3.93 µm) |
Hot spot indicated at island |
| 24 Mar 2006 |
0035 |
Terra Modis (500 m res.) |
Vog plume drifting W then NW |
| 24 Mar 2006 |
0804 |
DMSP F-13 Visible (1.11 km res.) |
Plume extended at least 833 km W before curling N. Using shadows, the plume is estimated at below ~1.2 km (4,000 ft). |
| 29 Mar 2006 |
1604 |
NOAA - 18 Shortwave IR (3.55-3.93 µm) |
Hot spot indicated at island |
| 29 Mar 2006 |
2110 |
DMSP F-13 Visual (1.11 km res.) |
Steam measures 37 km W and vog measures ~320 km SW and ~670 km NNE of the summit. Tops are estimated below ~1.5 km (5,000 ft). |
| 29 Mar 2006 |
2110 |
DSMP F-13 Visual (556 m res.) |
Steam and vog visible at island; greater detail of vog trending ~320 km to SW |
| 30 Mar 2006 |
0820 |
DMSP F-13 Visual (1.11 km res.) |
Steam measured 56 km NW; vog measured ~600 km SW and ~670 km NNE of the summit. Tops are estimated below ~1.5 km (5,000 ft). |
| 30 Mar 2006 |
1554 |
NOAA 18 Shortwave IR (3.55-3.93 µm) |
Hot spot detected at the island |
| 02 Apr 2006 |
1953 |
NOAA18 Shortwaave IR (3.55-3.93 µm) |
Hot spot detected |
| 04 Apr 2006 |
0320 |
Aqua Modis (500 m res.) |
Cloud formation along the vog plume with tops estimated at below ~3 km (10,000 ft) |
| 04 Apr 2006 |
0559 |
DMSP-F-12 Visual (556 m res.) |
Vog measures 210 km SSW of the summit |
| 14 Apr 2006 |
0355 |
Aqua Modis (500 m res.) |
Vog drifting over ~390 km SW |
| 14 Apr 2006 |
0808 |
DMSP F-13 Visual (556 m res.) |
Vog seen drifting over ~ 500 km SW, expanding extensively as it spreads |
| 17 Apr 2006 |
0125 |
Terra Modis (500 m res.) |
Light vog plume blown over 400 km WSW to W |
| 17 Apr 2006 |
1612 |
NOAA-18 Shortwave IR (3.55-3.93 µm) |
Hot spot visible |
| 17 Apr 2006 |
2143 |
DMSP F-13 Visual (556 m res.) |
Vog measures over 490 km WSW |
| 22 Apr 2006 |
2153 |
DMSP F-16 Visual (556 m res.) |
Faint vog plume trended ~40 km NW |
| 23 Apr 2006 |
0045 |
Terra Modis (250 m res.) |
Possible gray steam/ash plume extending under 28 km NW and vog extending over 155 km NW |
| 23 Apr 2006 |
1954 |
NOAA-17 Shortwave IR (3.55-3.93 µm) |
Hot spot detected at island |
| 24 Apr 2006 |
0130 |
Terra Modis (500 m res.) |
Visible vog trended ~325 km W then curved ~130 km NE and dissipated |
| 23 May 2006 |
0430 |
Aqua Modis (500 m res.) |
Vog seen drifting generally W, then curving S and SW |
| 23 May 2006 |
0710 |
NOAA 15 Visual (1.85 km res.) |
Vog trending generally SW then W for ~390 km |
| 26 May 2006 |
0130 |
Terra Modis (500 m res.) |
Vog trending WNW(?) |
| 26 May 2006 |
0800 |
DMSP F-16 Visual (2.78 km res.) |
Vog seen drifting WSW for up to 1,250 km |
| 26 May 2006 |
1234 |
NOAA 17 Shortwave IR (3.55-3.93 µm) |
Hot spot detected at the island |
| 30 May 2006 |
2120 |
DMSP F-14 Visible (2.77 km res.) |
Plume extends over 1,480 km to the WSW |
| 30 May 2006 |
2120 |
DMSP F-14 Visible (556 m res.) |
Plume extends over 1,480 to the WSW. NASA Aura/OMI estimated the columnar SO2 concentration associated with the plume. |
| 31 May 2006 |
0315 |
Aqua Modis (500 m res.) |
Vog seen drifting generally to the SW, with great dispersion |
OMI is a Dutch-Finnish imaging spectrometer that measures ozone and other atmospheric trace gases such as SO2. OMI is a nadir-viewing imaging spectrometer that covers the ultraviolet and visible spectral range (270-500 nm). Its high spatial resolution increases the chance of observing cloud-free pixels, thereby enhancing the accuracy of the data products. OMI observes a strip of the Earth's surface about 2,600-2,800 km wide in one shot. The satellite's own movement along with Earth's rotation enables OMI to scan the entire globe. A two-dimensional CCD detector records both the complete swath and the spectrum of every ground pixel in the swath. The spatial information is imaged on one dimension of the CCD detector while the spectrum is projected along the other dimension of the CCD detector. OMI detects the total column amount of SO2 between the sensor and the Earth's surface and maps this quantity as it orbits.
On 17 March around 2200 UTC, the level of seismicity nearly doubled and continued at that level for 2 hours. On the 18th around 1400 UTC, the level of seismicity again nearly doubled and continued at that level for about 8 hours before returning to the baseline level prior to 17 March. The increased seismicity consisted of small (M 0-1) long-period earthquakes occurring approximately every minute, sometimes reaching two per minute. A total of about 600 such events were detected during 17 and 18 March. Volcanic Ash Advisories were issued by the Washington VAAC; plumes appeared to contain gas and only insignificant amounts of ash.
According to the Air Force Weather Agency (AFWA), on 19 March a hot spot at Anatahan was visible on satellite imagery. Vog (volcanic smog) extended 200 km from the island (figure 29).
On 24 March around 1330, seismicity at Anatahan abruptly increased to about twice the background level. The seismicity consisted of low-amplitude tremor and small, long-period earthquakes, similar to the seismicity on 17 and 18 March. On 24 March, vog from Anatahan was visible on satellite imagery extending W, then curling N. The plume was estimated to be below 1.2 km altitude, and no ash or hot spots were visible. Anatahan remained at Alert level Advisory; Aviation Color Code Yellow (Volcanic activity has increased somewhat, but remains fairly low and is being closely monitored).
From 28 March to 4 April, seismic levels fluctuated. Seismicity again jumped up to about double the background level for a few hours on 29 and 31 March and 2 April. Anatahan continued to produce a gas-and-steam plume visible in satellite imagery. On 4 April, Saipan residents reported smog and the smell of sulphur.
On 8 April a team from EMO-CNMI visited Anatahan and found steam and gas discharging from the E crater along the SW crater wall above a discolored lake. Testing confirmed the presence of SO2 and H2S in the plume. The plume rose to an altitude of less than 2 km and drifted to the NW as brownish vog. No ash fell from the plume onto the island. Based on these results and satellite surveillance, Anatahan was inferred to be emitting steam, gas, and vog.
Three long-period earthquakes occurred on 14 and 15 April. Each was preceded by several minutes of significantly reduced seismicity. AFWA reported that a hot spot was visible on NOAA shortwave IR imagery on 17 April at 1612 UTC, and vog extended over 490 km WSW in F-13 imagery on 17 April at 2143 UTC. SO2 mass values for 23 April were the second highest in this reporting interval. On 24 April 2006 AFWA reported that hot spots were occasionally visible and that vog was nearly always visible in satellite images.
Throughout May 2006, Anatahan's E crater continued to emit vog that was visible in MODIS imagery. Seismicity levels were low throughout April and May. A few to several microearthquakes occurred each day, all with magnitudes M 1 or smaller.
Ash may have erupted in late May. Although ash was indicated on radar on 27 May, and in a pilot's report for 29 May, those events took place during intervals of such low seismicity that people watching that data felt eruptions were unlikely to have occurred then.
On the other hand, based on a pilot report, the Washington VAAC declared that an ash plume from Anatahan reached an altitude of 3 km on 29 May and drifted W. Vog issuing from the E crater was visible on satellite imagery at about 1333 on 29 May 2006, and increased prior to emission of an ash plume. A report issued from the Washington VAAC on 30 May at 0535 indicated a faint, low-level gas-and-ash plume extending from the summit. At 2120 UTC on 30 May the plume extended over 1,480 km WSW.
By 19 June continued gas and steam emissions remained visible in satellite imagery. Seismicity dropped from recent levels and occasional microearthquakes were recorded locally.
Geologic Background. The elongate, 9-km-long island of Anatahan in the central Mariana Islands consists of a large stratovolcano with a 2.3 x 5 km compound summit caldera. The larger western portion of the caldera is 2.3 x 3 km wide, and its western rim forms the island's high point. Ponded lava flows overlain by pyroclastic deposits fill the floor of the western caldera, whose SW side is cut by a fresh-looking smaller crater. The 2-km-wide eastern portion of the caldera contained a steep-walled inner crater whose floor prior to the 2003 eruption was only 68 m above sea level. A submarine cone, named NE Anatahan, rises to within 460 m of the sea surface on the NE flank, and numerous other submarine vents are found on the NE-to-SE flanks. Sparseness of vegetation on the most recent lava flows had indicated that they were of Holocene age, but the first historical eruption did not occur until May 2003, when a large explosive eruption took place forming a new crater inside the eastern caldera.
Information Contacts: Juan Takai Camacho and Ramon Chong, Emergency Management Office of the Commonwealth of the Northern Mariana Islands (EMO-CNMI), PO Box 100007, Saipan, MP 96950, USA (URL: http://www.cnmihsem.gov.mp/); Simon Carn, Joint Center for Earth Systems Technology (JCET), University of Maryland Baltimore County (UMBC), 1000 Hilltop Circle, Baltimore, MD 21250, USA; Charles Holliday and Jenifer E. Piatt, U.S. Air Force Weather Agency (AFWA)/XOGM, Offutt Air Force Base, NE 68113, USA.
Bagana (Papua New Guinea) — May 2006 Cite this Report
Bagana
Papua New Guinea
6.137°S, 155.196°E; summit elev. 1855 m
All times are local (unless otherwise noted)
Lava flows and ash emission throughout March 2006
Little activity had been recorded at Bagana since 18 September 2005, when forceful emissions of whitish-brown ash occurred, accompanied by ash fall in downwind areas and large booming noises. From the end of January to mid-April 2006 there were brief periods of effusive activity. The summit crater released moderate to dense white vapor throughout this time.
Emissions were forceful on 27 February, and on 3, 5, 7, 13, 22, 24, and 29 March. Denser emissions of pale gray ash clouds were reported on 27 March. Rumbling and roaring noises were heard on 15-16, 22, and 26-28 March. Moderate to bright glow was accompanied by projections of lava fragments and the advance of a lava flow down the S-SW flank, which was visible from 15 March until the end of the month. During April, the summit crater continued to release white vapor. A forceful emission was recorded on 8 April. A weak glow was visible on 9 April. Occasional weak rumbling noises were heard on 12-13 and 15 April. On 4 May, there was an ash plume visible on satellite imagery at a height of ~ 3 km (10,000 ft) altitude that extended 4 km W. On 18 June there was an ash-and-steam plume drifting SW; the height of the plume was not recorded.
Geologic Background. Bagana volcano, in a remote portion of central Bougainville Island, is frequently active. This massive symmetrical cone was largely constructed by an accumulation of viscous andesitic lava flows. The entire edifice could have been constructed in about 300 years at its present rate of lava production. Eruptive activity is characterized by non-explosive effusion of viscous lava that maintains a small lava dome in the summit crater, although occasional explosive activity produces pyroclastic flows. Lava flows with tongue-shaped lobes up to 50 m thick and prominent levees descend the flanks on all sides.
Information Contacts: Ima Itikarai and Herman Patia, Rabaul Volcano Observatory (RVO), P.O. Box 386, Rabaul, Papua New Guinea.
Bulusan (Philippines) — May 2006 Cite this Report
Bulusan
Philippines
12.769°N, 124.056°E; summit elev. 1535 m
All times are local (unless otherwise noted)
Explosive activity continues
Bulusan erupted at 2258 on 21 March 2006, continuing into April 2006 (BGVN 31:04). Figure 2 shows the location of Bulusan volcano on the SE tip of Luzon. Figure 3 gives satellite measurements of SO2 one day after the eruption.
An ash eruption on 29 April did not cause any damage, but authorities asked people to avoid the region near the crater (figure 4). The current report stems in large part from information coming from The Philippine Institute of Volcanology and Seismology (PHIVOLCS). Table 2 provides a brief summary of 2006 activity and resulting plumes.
Table 2. Bulusan explosive plumes recorded during 2006. Courtesy of PHIVOLCS.
| Date |
Local Time |
Plume character |
Plume height above summit |
Direction(s) of plume drift |
| 21 Mar 2006 |
2258 |
ash |
1.5 km |
N, W, SW |
| 29 Apr 2006 |
1044 |
ash |
1.5 km |
WSW, NW |
| 25 May 2006 |
2117 |
ash |
-- |
W, SW |
| 31 May 2006 |
1617 |
ash/steam |
1.5 km |
W, WNW |
| 07 Jun 2006 |
2017 |
ash/steam |
2.0 km |
N, W, SW |
| 10 Jun 2006 |
0018 |
ash/steam |
1.0 km |
N, NE |
| 13 Jun 2006 |
1904 |
ash/steam |
1.5 km |
NW |
| 18 Jun 2006 |
1556 |
ash/steam |
1.5 km |
W |
| 20 Jun 2006 |
2013 |
cloud-covered summit |
-- |
-- |
| 28 Jun 2006 |
0206 |
cloud-covered summit |
-- |
-- |
A phreatic ash explosion was recorded by the seismograph network at Bulusan between 2117 and 2130 on 25 May 2006. Light ashfall ranging from trace amounts to deposits 2 mm thick was reported from the W and SW villages of Bacolod, Sankayon, Puting Sapa, Rangas, Mapili, Caladgao, and Buraburan in the municipality of Juban, and Bolos in the municipality of Irosin, province of Sorsogon. PHIVOLCS reported that the ash explosion was more-or-less typical of activity at Bulusan during its current eruptive phase, and they expect more explosions to occur. Bulusan was at Alert Level 1, with a Permanent Danger Zone of 4 kilometers around the summit. The PHIVOLCS volcano alert signals range from Alert Level 1 (low-level unrest, no eruption imminent) through Alert Level 5 (hazardous explosive eruption in progress).
An ash-and-steam cloud emitted from the volcano on 31 May 2006 (figure 5) resulted in light ashfall, from trace amounts to 1.5 mm thickness, in areas W and NW of the volcano. An ash-and-steam cloud from Bulusan on 7 June 2006 resulted in light ashfall 5 km N and trace amounts as far as 20 km N. The Alert Level was raised to 2, which means restricted entry within 4 km of the summit. On 10 June, an ash-and-steam cloud reached a height of ~ 1 km above the summit and drifted N and NE. The Manila Standard Today reported one death caused by an asthma condition aggravated by exposure to ash.
On 13 June 2006 at 1904, an explosion lasting ~13 minutes issued from a fissure W of the summit vent of Bulusan. It produced an ash-and-steam cloud (table 2). Ashfall up to 7 mm thick accumulated at the foot of the volcano in neighborhoods in the municipality of Juban.
On 18 June at 1556 , an explosion lasted ~11 minutes; it produced an ash-and-steam cloud (figure 6). This was the 8th explosion since Bulusan reactivated in March. Ash up to 5 mm thick fell on a W-flank village.
On 20 June, a mild ash-and-steam explosion lasted approximately 17 minutes. The seismic network around the volcano recorded only one high frequency volcanic earthquake prior to the explosion. The ash and steam emission coincided with heavy rains that generated some lahars and torrential flows. The sulfur dioxide (SO2) emission rate that morning was 469 tons per day (t/d).
At 0800 on 26 June 2006, PHIVOLCS reported that the Bulusan seismic network had recorded four volcanic earthquakes during the past 24 hours. Steaming activity was wispy to moderate and reached an approximate height of 50 m above the summit before drifting WNW. On 28 June 2006, PHIVOLCS reported at 0800 that continuous seismic observation at Bulusan disclosed one small explosion-type earthquake and two volcanic earthquakes for the past 24 hours. The explosion occurred at 0206 on 28 June and lasted for about 4 minutes. However, the event was not observed because the summit was cloud covered all of 27 June until early in the morning of 28 June. No ashfall was reported following the explosion, and no lahar occurred at Gulang-gulang River in Cogon, Irosin. Sulfur dioxide (SO2) emission rates of the volcanic plume measured on 27 June decreased slightly, to 597 tons per day (t/d) in comparison to the 26 June 2006 rate of 942 t/d.
PHIVOLCS summarized the current 2006 activity as follows. In general, the character of explosions evolved only slightly, apparently becoming a little stronger later. The explosions in June were also somewhat longer in duration than earlier ash ejections, based on instrumental records and general visual monitoring. However, the absence of earthquakes, tremor, and generally low SO2 emission rates prior to each explosion suggested an absence of a large or active magmatic intrusion into shallow depths. Instead, they interpreted the sequence of explosions since March 2006 as pointing to interaction of small volumes of magma with an overlying water-saturated zone beneath the summit. These were thought to develop overpressures released during each explosion. It remains to be seen if the recent explosions would provide an "uncorking effect" and induce a major hazardous eruption. The very low earthquake activity was taken to suggests otherwise.
Geologic Background. Luzon's southernmost volcano, Bulusan, was constructed along the rim of the 11-km-diameter dacitic-to-rhyolitic Irosin caldera, which was formed about 36,000 years ago. It lies at the SE end of the Bicol volcanic arc occupying the peninsula of the same name that forms the elongated SE tip of Luzon. A broad, flat moat is located below the topographically prominent SW rim of Irosin caldera; the NE rim is buried by the andesitic complex. Bulusan is flanked by several other large intracaldera lava domes and cones, including the prominent Mount Jormajan lava dome on the SW flank and Sharp Peak to the NE. The summit is unvegetated and contains a 300-m-wide, 50-m-deep crater. Three small craters are located on the SE flank. Many moderate explosive eruptions have been recorded since the mid-19th century.
Information Contacts: Philippine Institute of Volcanology and Seismology (PHIVOLCS), PHIVOLCS Building, C.P. Garcia Avenue, U.P. Campus, Diliman, Quezon City, PHILIPPINES (URL: http://www.phivolcs.dost.gov.ph/); Earth Observatory, National Aeronautics and Space Administration (NASA) (URL: http://earthobservatory.nasa.gov/NaturalHarards/); The Manila Standard Today (URL: http://manilastandard.net/); Simon Carn, Joint Center for Earth Systems Technology (JCET), University of Maryland Baltimore County (UMBC), 1000 Hilltop Circle, Baltimore, MD 21250.
Daikoku (United States) — May 2006 Cite this Report
Daikoku
United States
21.324°N, 144.194°E; summit elev. -323 m
All times are local (unless otherwise noted)
Discovery of agitated pool of molten sulfur at 420 m ocean depth
Submarine exploration at Daikoku seamount has discovered a small pit or cauldron containing a pool of molten sulfur. During the period of 18 April-13 May 2006, scientists from the National Oceanic and Atmospheric Agency (NOAA), aboard the research vessel Melville completed the 2006 Submarine Ring of Fire Expedition. This expedition was the third in a series exploring of the submarine volcanoes lying along the Mariana arc (figure 1). The arc extends from S of the island of Guam northward more than 1,450 km. Daily logs of the 2006 expedition, including photographs and video clips, can be viewed on the NOAA Ocean Explorer website (see Information Contacts below).
William Chadwick reported on the 2006 expedition (Oregon State University press release, 25 May 2006) that ". . . on another volcano called Daikoku, in the northern part of the Mariana volcanic arc, the researchers discovered a pool of molten sulfur at a depth of 420 m. It was measured at 187°C. It was a sulfur pond with a flexible 'crust' that was moving in a wavelike motion. The movement was triggered by continuous gases being emitted from beneath the pool and passing through the sulfur." (figure 2).
In another pit on the summit of Daikoku, over 100 m deep and ~ 80 m in diameter, the scientists observed a large plume of slowly rising white fluid.
References. Embley, R.W., Baker, E.T., Chadwick, W.W., Jr., Lipton, J.E., Resing, J.A., Massoth, G.J., and Nakamura, K., 2004, Explorations of Mariana Arc volcanoes reveal new hydrothermal systems: EOS, Transactions, American Geophysical Union, v. 85, no. 2, p. 37, 40.
Embley, R.W., Chadwick, W.W., Jr, Baker, E.T., Butterfield, D.A., Resing, J.A., de Ronde, C. E.J., Tunnicliffe, V., Lupton, J.E., Juniper, S.K., Rubin, K.H., Stern, R.J., Lebon, G.T., Nakamura, K., Merle, S.G., Hein, J.R., Wiens, D.A., and Tamura, Y., 2006, Long-term eruptive activity at a submarine arc volcano: Nature, v. 441, no. 7092, p. 494-497.
Oregon State University, 25 May 2006, Press Release: Nature paper details eruption activity at submarine volcano: College of Oceanic and Atmospheric Science (COAS), 104 COAS Admininstration Building, Corvallis, OR 97331.
Geologic Background. The conical summit of Daikoku seamount lies along an E-W ridge SE of Eifuku and rises to within 323 m of the sea surface. A steep-walled, 50-m-wide crater on the N flank, about 75 m below the summit, is at least 135 m deep and was observed to emit cloudy hydrothermal fluid. During a NOAA expedition in 2006, scientists observed a convecting black pool of liquid sulfur with a partly solidified, undulating sulfur crust at a depth of 420 m below the summit. Gases, particulates with the appearance of smoke, and liquid sulfur were bubbling up from an edge of the sulfur pool.
Information Contacts: William W. Chadwick, Jr., Cooperative Institute for Marine Resources Studies (CIMRS), NOAA Pacific Marine Environmental Laboratory (PMEL), 2115 SE OSU Drive, Newport, OR 97365 USA; NOAA Ocean Explorer (URL: http://oceanexplorer.noaa.gov/explorations/06fire/welcome.html).
Heard
Australia
53.106°S, 73.513°E; summit elev. 2745 m
All times are local (unless otherwise noted)
2006 imagery indicates renewed volcanism
Matt Patrick observed from MODIS (Moderate Resolution Imaging Spectroradiometer) images analyzed by the HIGP MODVOLC algorithm that relatively new activity began in March 2006 at Heard Island. Two isolated alerts occurred on 11-12 March 2006, and sustained alerts occurred from 7-18 May, 28 May-5 June, and 13-20 June (table 1). Alerts were 1-3 pixels in size. The pixel locations all appeared to be clustered generally near the summit of Big Ben, suggesting central vent (lava lake?) activity rather than lava flows. Advanced Spaceborne Thermal Emission and Reflection Radiometer (ASTER) images over the last several months have all been cloudy and therefore unable to reinforce or support the MODVOLC results. However, a nighttime ASTER image on 29 May 2006 at 0110 showed the new activity (figure 9).
Table 1. MODVOLC alerts for 2006 through 21 June. Courtesy of Hawai'i Institute of Geophysical and Planetology (HIGP) Thermal Alerts Team.
| Date |
Time (local) |
Pixels |
Satellite |
| 11 Mar 2006 |
2315 |
1 |
Terra |
| 12 Mar 2006 |
0100 |
2 |
Aqua |
| 07 May 2006 |
0100 |
1 |
Terra |
| 07 May 2006 |
2305 |
1 |
Terra |
| 08 May 2006 |
0150 |
1 |
Aqua |
| 09 May 2006 |
2255 |
1 |
Terra |
| 10 May 2006 |
0140 |
1 |
Aqua |
| 11 May 2006 |
2335 |
1 |
Terra |
| 18 May 2006 |
2250 |
2 |
Terra |
| 28 May 2006 |
2325 |
1 |
Terra |
| 29 May 2006 |
0110 |
2 |
Aqua |
| 02 Jun 2006 |
2345 |
3 |
Terra |
| 03 Jun 2006 |
0130 |
2 |
Aqua |
| 05 Jun 2006 |
0115 |
1 |
Aqua |
| 13 Jun 2006 |
2325 |
2 |
Terra |
| 14 Jun 2006 |
0110 |
4 |
Aqua |
| 15 Jun 2006 |
0010 |
2 |
Terra |
| 16 Jun 2006 |
0100 |
1 |
Aqua |
| 20 Jun 2006 |
2330 |
1 |
Terra |
The previous phases of activity spanned May 2000-February 2001 and June 2003-June 2004 (BGVN 29:12).
Geologic Background. Heard Island on the Kerguelen Plateau in the southern Indian Ocean consists primarily of the emergent portion of two volcanic structures. The large glacier-covered composite basaltic-to-trachytic cone of Big Ben comprises most of the island, and the smaller Mt. Dixon lies at the NW tip of the island across a narrow isthmus. Little is known about the structure of Big Ben because of its extensive ice cover. The active Mawson Peak forms the island's high point and lies within a 5-6 km wide caldera breached to the SW side of Big Ben. Small satellitic scoria cones are mostly located on the northern coast. Several subglacial eruptions have been reported at this isolated volcano, but observations are infrequent and additional activity may have occurred.
Information Contacts: Matt Patrick, HIGP Thermal Alerts Team, Hawai'i Institute of Geophysics and Planetology (HIGP) / School of Ocean and Earth Science and Technology (SOEST), University of Hawai'i, 2525 Correa Road, Honolulu, HI 96822, USA (URL: http://modis.higp.hawaii.edu/); Andrew Tupper, Darwin Volcanic Ash Advisory Centre, Bureau of Meteorology, Australia.
Krummel-Garbuna-Welcker (Papua New Guinea) — May 2006 Cite this Report
Krummel-Garbuna-Welcker
Papua New Guinea
5.416°S, 150.027°E; summit elev. 564 m
All times are local (unless otherwise noted)
Earthquakes continue while vents remain calm through April 2006
Garbuna remained relatively quiet between mid-February and mid-April 2006. The two vents at the summit released weak to moderate volumes of white vapor during this time, but no glow was observed. There was a weak rumbling noise on 14 April. Seismic activity remained at a low level. Few earthquakes were recorded during February and March; the daily average number of high-frequency events was 3 and of low-frequency events between 0 and 5. In April, a few earthquake swarms were recorded with individual events every 1-2 minutes. These episodes lasted less than 20 minutes. Low-frequency earthquakes occurred at the rate of 3-5 times per day and the Real-time Seismic Amplitude Measurement (RSAM) data was at background level fluctuating between 8 and 51 units.
Geologic Background. The basaltic-to-dacitic Krummel-Garbuna-Welcker Volcanic Complex consists of three volcanic peaks located along a 7-km N-S line above a shield-like foundation at the southern end of the Willaumez Peninsula. The central and lower peaks of the centrally located Garbuna contain a large vegetation-free area that is probably the most extensive thermal field in Papua New Guinea. A prominent lava dome and blocky lava flow in the center of thermal area have resisted destruction by thermal activity, and may be of Holocene age. Krummel volcano at the south end of the group contains a summit crater, breached to the NW. The highest peak of the group is Welcker volcano, which has fed blocky lava flows that extend to the eastern coast of the peninsula. The last major eruption from both it and Garbuna volcanoes took place about 1800 years ago. The first historical eruption took place at Garbuna in October 2005.
Information Contacts: Ima Itikarai and Herman Patia, Rabaul Volcano Observatory (RVO), P.O. Box 386, Rabaul, Papua New Guinea.
Lamington (Papua New Guinea) — May 2006 Cite this Report
Lamington
Papua New Guinea
8.95°S, 148.15°E; summit elev. 1680 m
All times are local (unless otherwise noted)
Mild vapor emission and earthquakes through March 2006
Lamington has continued the trend of relative quiet during mid-January to the end of March 2006. Consistent reporting has been difficult due to overcast weather. Small volumes of thin white vapor were released during this time. No audible noises or glow were recorded. High frequency earthquakes continued to be recorded. The highest total was 25 recorded on 18 February.
Geologic Background. Lamington is an andesitic stratovolcano with a 1.3-km-wide breached summit crater containing a lava dome that rises above the coastal plain of the Papuan Peninsula of New Guinea north of the Owen Stanley Range. A summit complex of lava domes and crater remnants tops a low-angle base of volcaniclastic deposits dissected by radial valleys. A prominent broad "avalanche valley" extends northward from the breached crater. Ash layers from two early Holocene eruptions have been identified. In 1951 a powerful explosive eruption produced pyroclastic flows and surges that swept all sides of the volcano, killing nearly 3,000 people. The eruption concluded with growth of a 560-m-high lava dome in the summit crater.
Information Contacts: Ima Itikarai and Herman Patia, Rabaul Volcano Observatory (RVO), P.O. Box 386, Rabaul, Papua New Guinea.
Langila (Papua New Guinea) — May 2006 Cite this Report
Langila
Papua New Guinea
5.525°S, 148.42°E; summit elev. 1330 m
All times are local (unless otherwise noted)
Moderate activity steady through March 2006
Moderate activity took place at Langila during January 2006, including continuous ash fall, rumbling, and weak emissions of lava fragments. During 20 January to 7 February eruptive activity was characterized by thin, pale gray ash clouds. Minimal noises were heard on 26-27 February. A changing weak-to-bright glow accompanied by projections of glowing lava fragments were visible on the nights of 22-23 and 28 February, and 1-2, and 6 March. Moderate-to-thick dark gray ash clouds were reported on 1-2, 6-7, and 9 March. Ash plumes rose less than 2 km above the summit crater before drifting SW-W of the volcano. Crater 3 remained quiet.
Geologic Background. Langila, one of the most active volcanoes of New Britain, consists of a group of four small overlapping composite basaltic-andesitic cones on the lower E flank of the extinct Talawe volcano in the Cape Gloucester area of NW New Britain. A rectangular, 2.5-km-long crater is breached widely to the SE; Langila was constructed NE of the breached crater of Talawe. An extensive lava field reaches the coast on the N and NE sides of Langila. Frequent mild-to-moderate explosive eruptions, sometimes accompanied by lava flows, have been recorded since the 19th century from three active craters at the summit. The youngest and smallest crater (no. 3 crater) was formed in 1960 and has a diameter of 150 m.
Information Contacts: Ima Itikarai and Herman Patia, Rabaul Volcano Observatory (RVO), P.O. Box 386, Rabaul, Papua New Guinea.
Merapi
Indonesia
7.54°S, 110.446°E; summit elev. 2910 m
All times are local (unless otherwise noted)
Mid-2006 brings multiple pyroclastic flows that kill two, and travel up to 7 km
Seismic activity at Merapi began to increase on 19 March 2006, leading the Center of Volcanology and Geological Hazard Mitigation (CVGHM) to raise the Alert Level from 1 to 2 (on a scale of 1-4). Ten thousand residents were warned to prepare for possible evacuation.
On 10 April, authorities banned mountain climbing due to reports of increased tremor. Unverified preliminary reports indicated "lava" reportedly flowing near Pasar Bubar village, ~ 350 m from the volcano's crater. At 1500 on 12 April, CVGHM raised the Alert Level from 2 to 3. No one was permitted within 8 km of the summit.
During 21-25 April, seismicity remained elevated; several seismic signals associated with rockfalls were recorded. The SO2 flux measured from Merapi was 175 metric tons on 22 April. On 22 and 23 April, fumarolic emissions rose 400 m above the summit. On 25 April, two rockslides from lava-flow fronts were heard from nearby observatories. According to news reports, about 600 of the approximately 14,000 people living near the volcano had been evacuated by 24 April.
According to news reports, on 27 April nearly 2,000 villagers were evacuated from Sidorejo and Tegalmulyo villages. That day, small amounts of ash fell in Gemer village about 5 km from the summit.
On 28 April, CVGHM reported volcanic material traveling ~ 1.5 km SW to the Lamat River. Seismicity that day was dominated by multi-phase earthquakes; but signals from landslides, rockfalls, and low-frequency events were also recorded.
On 6 May, gas plumes rose to 800 m above the summit and eighteen incandescent avalanches of volcanic material were observed. On 7 May, 26 incandescent avalanches that extended ~ 100 m were seen during the morning. On 6 and 7 May, the lava dome continued to grow and seismicity was dominated by multi-phase earthquakes. Shallow volcanic earthquakes and signals from landslides and rockfalls were also recorded. On 8 May, the Darwin VAAC reported that CVGHM warned of a plume rising to ~ 3.7 km, but no ash was visible on satellite imagery.
According to the Darwin VAAC, gas plumes that rose ~ 600 m above the summit were visible on satellite imagery on 11 May. Avalanches of incandescent material extended 200 m SE towards the Gendol River, and 1.5 km SW towards the Krasak River. Several small incandescent avalanches of volcanic material were visible from observatory posts. The new lava dome at the volcano's summit had grown to fill the gap between the 1997 and 2001 lava flows on the W side of the summit, and had reached a height about the same as the 1997 lava flows. Seismicity was dominated by multi-phase earthquakes and signals associated with avalanches.
At 0940 on 13 May, the Alert Level was raised from 3 to 4, the highest level, and ~ 4,500 people living near the volcano were evacuated.
On 15 May pyroclastic flows traveled as far as 4 km to the W. By 16 May, more than 22,000 people had been evacuated, according to figures posted at the district disaster center; about 16,870 people were evacuated from three districts in Central Java Province, and more than 5,600 others were evacuated from the Slemen district. On 17 May, pyroclastic flows traveled as far as 3 km. Local volcanologists reported that the lava dome continued to grow, but at a slower rate than during previous days.
Pyroclastic flows to the SW and SE reached 4 km on 19 May and 3 km on 20 May. On 22 May, the lava dome volume was estimated at ~ 2.3 million cubic meters. The Darwin VAAC reported that low-level emissions continued during 18-19 and 23 May. CVGHM recommended that residents who lived in valleys on the NNW flanks near Sat, Lamat, Senowo, Trising, and Apu Rivers and on the SE flank near Woro River be allowed to return to their homes. Residents remained evacuated from villages within a 7 km radius from the volcano's summit and within 300 m of the banks of the Krasak/Bebeng, Bedog, and Boyong Rivers to the SW, and the Gendol River to the SE.
According to news reports, an eruption produced a cloud of hot gas and ash on 17 May. Witnesses said the size of the plume was smaller than ash-and-gas plumes seen on 15 May. On 18 May, a representative for Merapi from the Center for Volcanological Research and Technology Development (part of CVGHM), reported new ashfall.
On 24-25 May, lava flows were observed moving SW towards the Krasak River and SE towards the Gendol River. News reports indicated that on 27 May a M 6.3 earthquake that killed about 5,400 people resulted in a three-fold increase in activity at Merapi. A M 5.9 earthquake coincided with pyroclastic flows of unknown origin that extended 3.8 km SW. During 28-30 May, multiple pyroclastic flows reached 3 km SE and 4 km SW. Gas plumes reached 500 m above the summit on 25 May, 1,200 m on 26 May, 100 m on 29 May, and 900 m on 30 May.
From 31 May to 6 June, SO2-bearing plumes were observed daily; on 1 June they reached 1.3 km above the summit. According to the Darwin VAAC, low-level emissions were visible on satellite imagery on 1 and 6 June. Multiple pyroclastic flows reached ~ 4 km SE toward the Gendol River and 3.5 km SW toward the Krasak and Boyong Rivers. CVGHM reported on 31 May that lava avalanches moved W for the first time during the recent eruption.
According to a volcanologist in Yogyakarta, lava-flow distances and dome volume had both approximately doubled since the 27 May M 6.2 earthquake. On 6 June, people living near the base of the volcano began to move into temporary shelters. Activities remain restricted within a 7 km radius from the volcano's summit and within 300 m of the banks of Krasak/Bebeng, Bedog, and Boyong Rivers to the SW, and Gendol River to the SE.
On 8 June, the lava-dome growth rate at Merapi was an estimated 100,000 cubic meters per day and the estimated volume was then ~ 4 million cubic meters. An estimated volume loss of 400,000 cubic meters on 4 June had been due to a partial collapse of the S part of the Geger Buaya crater wall, which was constructed from 1910 lava flows.
On 8 June, a pyroclastic flow, lasting 12 minutes, reached a distance of ~ 5 km SE toward the Gendol River, the predominant travel direction since the M 6.2 earthquake on 27 May. According to a news report, this event prompted approximately 15,500 people to evacuate from the Sleman district to the S and the Magelang district to the W. On 13 June, the Alert Level was lowered from 4 to 3 but renewed pyroclastic-flow activity the next day prompted a return to Alert Level 4.
Gas plumes were observed almost daily during 7-13 June and reached ~ 1.2 km above the summit on 10 June. The Darwin VAAC reported small ash plumes visible on satellite imagery; minor ashfall was reported to the S at an observatory outpost, and in Yogyakarta, about 32 km away.
Gas plumes emitted on 14 and 15 June reached 900 m above the summit. On 14 June a dome collapse lasting ~ 3.5 hours produced pyroclastic flows that reached 7 km SE. Two volunteers on a search-and-rescue team assisting with evacuation efforts were trapped in an underground refuge in Kaliadem village and died, the first fatalities of the current eruption. Stone (2006) wrote that the volunteers had ". . . sought refuge in a bunker, one of several on the mountain built for that contingency. The blast door was slightly ajar when rescuers dug down to the bunker the next day. The men had burned to death."
On 15 June, pyroclastic flows reached a distance of 4.5 km SE along the Gendol River. Pyroclastic flows continued during 16-19 June as a new dome grew. The Alert Level remained at 4.
During 21-25 June, seismic signals at Merapi indicated almost daily occurrences of rockfalls and pyroclastic flows. Due to inclement weather, pyroclastic flows were only observed on 24 June and reached a distance of 4 km SE along the Gendol River and 2.5 km SW along the Krasak River. Gas plumes were observed during 22-25 June and reached 1.5 km above the summit on 24 June.
Reference. Stone, Richard, 2006, Volcanology?Scientists steal a daring look at Merapi's explosive potential; Science, American Association for the Advancement of Science (AAAS), v. 312, pp. 1724-6.
Geologic Background. Merapi, one of Indonesia's most active volcanoes, lies in one of the world's most densely populated areas and dominates the landscape immediately north of the major city of Yogyakarta. It is the youngest and southernmost of a volcanic chain extending NNW to Ungaran volcano. Growth of Old Merapi during the Pleistocene ended with major edifice collapse perhaps about 2,000 years ago, leaving a large arcuate scarp cutting the eroded older Batulawang volcano. Subsequent growth of the steep-sided Young Merapi edifice, its upper part unvegetated due to frequent activity, began SW of the earlier collapse scarp. Pyroclastic flows and lahars accompanying growth and collapse of the steep-sided active summit lava dome have devastated cultivated lands on the western-to-southern flanks and caused many fatalities.
Information Contacts: Center of Volcanology and Geological Hazard Mitigation (CVGHM), Jalan Diponegoro 57, Bandung 40122, Indonesia (URL: http://www.vsi.esdm.go.id/); Associated Press (URL: http://news.yahoo.com/s/ap/indonesia_volcano); Reuters (URL: http://news.yahoo.com/s/nm/20060418/wl_nm/indonesia_volcano_dc_2).
NW Rota-1 (United States) — May 2006 Cite this Report
NW Rota-1
United States
14.601°N, 144.775°E; summit elev. -517 m
All times are local (unless otherwise noted)
Views of submarine volcano ejecting lava and bombs
During 18 April-13 May 2006, scientists from the National Oceanic and Atmospheric Agency (NOAA) and Oregon State University completed the 2006 Submarine Ring of Fire Expedition aboard the research vessel Melville. This expedition was the third in a series of explorations of the submarine volcanoes lying along the Mariana intra-ocean volcanic arc. That arc extends from S of the island of Guam northward more than 1,450 km through the Commonwealth of the Northern Mariana Islands (see map in above report on Daikoku). A previous expedition to Northwest Rota-1 in 2004 discovered and named this volcano and found it erupting (BGVN 29:03). Daily logs of the 2006 expedition, including photographs and video clips, can be viewed on the NOAA Ocean Explorer web site noted below, from which much of this report was taken.
On 23 and 24 April 2006, the unmanned (remotely operated vessel, ROV) submersible Jason 2 revisited Brimstone Pit, a spot on the volcano where an ash-and-gas plume was discovered in 2004 and observed again in 2005 (Embley and others, 2004 and 2006). The changes were striking. According to Robert Embley (Oregon State University press release, 25 May 2006), "we saw features of submarine volcanic activity never before directly observed, including explosions of lava from a crater accompanied by a red glow and voluminous volcanic gases and ejected rocks." A degassing event at Brimstone Pit began releasing bubbles that formed a growing submarine plume cloud. The Pit, at a depth of 560 m, was significantly deeper (by ~ 20 m) than it was in the previous visits and there appeared to have been a recent collapse of the summit area. The Pit exuded a sluggish pulsating cloud of white color along with some gas bubbles. Some time later, the pit was almost filled with the white cloud, which appeared to come from the lavas themselves. The observers concluded that they witnessed lava extruding on the seafloor.
Particle plumes were mapped using a light-scattering sensor (LSS), part of the CTD (conductivity-temperature-depth) instrument package towed over the summit and flanks of the volcano. The CTD revealed layers of turbid (cloudy) water extending as far as 8 km down the S flank, and to depths up to 2,900 m. The turbid layers may arise from periodic collapse of the unstable slopes of volcanic fallout material similar to that found in the white cloud observed at the summit.
Submersible dives on 25 April 2006 to the Brimstone Pit revealed a lava flow forming there. The initial approach to the Pit revealed a line of bubbles (mainly CO2) escaping from a fracture in the underlying rock. However, in place of the previously flat ground that described the Pit on 24 April, a small ash cone had formed. It was ~ 6 m in diameter with walls about 1 m high, made up entirely of fine-grained ash. As the submersible approached, observers saw a plume discharging out of the cone's center and, on closer inspection, it appeared that ash was raining out of the bottom of the plume and falling onto the flanks of the small cone.
Near Brimstone Pit, the submersible collected a piece of newly erupted andesite lava containing elemental sulfur filling vesicles. The lava flow advanced but slowly, traveling forward bit by bit, chunk by chunk. As the lava advanced, the flow's toe vigorously degassed. The emitted gas and the associated plume took on a yellow hue. Scientists interpreted the escaping gases as mainly sulfur-rich (SO2 and H2S), which can mix with and make the surrounding seawater strongly acidic and precipitate elemental sulfur, the source of the plume's yellow hue. Liquid native sulfur inside the plume was seen raining on the seafloor as small droplets and filled in the numerous holes in the lava where the gases escaped. Locally, carbon dioxide formed bubbles in front of the advancing lava. These different gases provided the force behind the vigorous 'mini-explosions' within the lava flow.
Finishing the last of six dives at Northwest Rota-1 on 29 April 2006, and combining observations from the two previous expeditions, scientists developed some conclusions about processes at this extremely dynamic site. Prior to arrival in 2006, a major landslide must have originated near Brimstone Pit. During the first day of 2006 submersible observations, a turbid layer generated by the slide surrounded the lower flanks. The next day, when the water had cleared, half of Brimstone Pit had fallen away and the seafloor around the vent was swept clean of recent lava. Over the next week, eruptive activity gradually increased in intensity and vigor. By the end of the week, a 5-m-high cone made of ash and lava blocks had built up over the vent, and the turbid layer on the flanks was almost gone. On the last dive, scientists saw glowing lava jetting from the vent (figure 5).
The scientists concluded that observing explosive volcanic activity at a submarine volcano was easier and more revealing in many ways than on land, perhaps because the eruptive activity, although violent at times, is usually limited to a small area due to the dampening effect of the surrounding water (figure 6). For example, at Brimstone Pit the pressure of 560 m of water over the site reduced the power of the explosive bursts. Also, the water quickly slows down the rocks and ash violently thrown out of the vent. The scientists viewed the release of volcanic gases from the erupting lava with new clarity, with the help of the streams of bubbles and multicolored plumes as they were emitted. In addition, the scientists recorded the activity using a portable underwater microphone (hydrophone).
Chadwick and his associates at NOAA have identified and named 56 seamounts in the Mariana Arc, 11 of which show hydrothermal activity, based primarily on CTD instrument tows (table 1; see figure 5 for map showing locations).
Table 1. Seamounts in the Mariana arc that are active volcanos based on submersible observations and/or that registered signs of hydrothermal activity on CTD tows. Brief comments on noteworthy observations from several of those visited in 2006 are included. Courtesy of William Chadwick, NOAA, June 2006.
| Seamounts (listed S to N) |
Shallowest summit depth |
Longitude |
Latitude |
Comments |
| [Seamount X] |
1,230 m |
144.0167°E |
13.2500°N |
-- |
| Northwest Rota-1 |
517 m |
144.7750°E |
14.6000°N |
-- |
| Esmeralda Bank |
54 m |
145.2458°E |
14.9583°N |
-- |
| E. Diamante |
127 m |
145.6583°E |
15.9167°N |
Active, metal-rich, ephemeral 'black smokers' shallowest yet discovered. |
| Zealandia Bank |
144 m |
145.8000°E |
16.8833°N |
-- |
| Maug |
54 m |
145.2217°E |
20.0208°N |
-- |
| NW Uracas |
703 m |
144.8400°E |
20.5833°N |
-- |
| Daikoku |
323 m |
144.1942°E |
21.3242°N |
See report in this issue. |
| NW Eifuku |
1,551 m |
144.0433°E |
21.4875°N |
Liquid CO2 venting from 'white smokers.' |
| Kasuga |
297 m |
143.6417°E |
21.6100°N |
-- |
| Nikko |
392 m |
142.3255°E |
23.0784°N |
Sulfur chimneys, boiling pots of molten sulfur surrounded by a thin crust on a larger lava lake. |
References. Embley, R.W., Baker, E.T., Chadwick, W.W., Jr., Lipton, J.E., Resing, J.A., Massoth, G.J., and Nakamura, K., 2004, Explorations of Mariana Arc volcanoes reveal new hydrothermal systems: EOS, Transactions, American Geophysical Union, v. 85, no. 2, p. 37, 40.
Embley, R.W., Chadwick, W.W., Jr, Baker, E.T., Butterfield, D.A., Resing, J.A., de Ronde, C. E.J., Tunnicliffe, V., Lupton, J.E., Juniper, S.K., Rubin, K.H., Stern, R.J., Lebon, G.T., Nakamura, K., Merle, S.G., Hein, J.R., Wiens, D.A., and Tamura, Y., 2006, Long-term eruptive activity at a submarine arc volcano: Nature, v. 441, no. 7092, p. 494-497.
Oregon State University, 25 May 2006, Press Release: Nature paper details eruption activity at submarine volcano: College of Oceanic and Atmospheric Science (COAS), 104 COAS Admininstration Building, Corvallis, OR 97331.
Geologic Background. A submarine volcano detected during a 2003 NOAA bathymetric survey of the Mariana Island arc was found to be hydrothermally active and named NW Rota-1. The basaltic to basaltic-andesite seamount rises to within 517 m of the ocean surface SW of Esmeralda Bank, 64 km NW of Rota Island and ~100 km N of Guam. When Northwest Rota-1 was revisited in 2004, a minor submarine eruption from a vent named Brimstone Pit on the upper south flank about 40 m below the summit intermittently ejected a plume several hundred meters high containing ash, rock particles, and molten sulfur droplets that adhered to the surface of the remotely operated submersible vehicle. The active vent was funnel-shaped, about 20 m wide and 12 m deep. Prominent structural lineaments about a kilometer apart cut across the summit of the edifice and down the NE and SW flanks.
Information Contacts: William W. Chadwick, Jr., Cooperative Institute for Marine Resources Studies (CIMRS), NOAA Pacific Marine Environmental Laboratory (PMEL), 2115 SE OSU Drive, Newport, OR 97365 USA; NOAA Ocean Explorer (URL: http://oceanexplorer.noaa.gov/explorations/06fire/welcome.html).
Popocatepetl (Mexico) — May 2006 Cite this Report
Popocatepetl
Mexico
19.023°N, 98.622°W; summit elev. 5393 m
All times are local (unless otherwise noted)
During first half of 2006, several ash plumes rose to ~ 7-8 km altitude
The last report on Popocatépetl covered February-December 2005 (BGVN 30:12). This report covers January-June 2006. Throughout this reporting interval, the warning level remained at Yellow. Seismicity is summarized on table 18.
Table 18. Recorded earthquakes near Popocatépetl during April-June 2006. Courtesy of CENAPRED.
| Date |
Local Time |
Depth (km) |
Magnitude |
| 04 Apr 2006 |
1426 |
5.4 |
2.2 |
| 05 Apr 2006 |
0416 |
5.4 |
2.3 |
| 05 Apr 2006 |
1557 |
8.0 |
2.4 |
| 06 Apr 2006 |
0921 |
1.0 |
2.3 |
| 07 Apr 2006 |
0339 |
6.3 |
1.9 |
| 12 Apr 2006 |
0457 |
5 |
2.8 |
| 18 Apr 2006 |
0101 |
6.4 |
2.6 |
| 27 Apr 2006 |
1024 |
4.3 |
2.2 |
| 25 May 2006 |
2019 |
4.9 |
2.3 |
| 29 May 2006 |
1548 |
5.6 |
2.1 |
| 30 May 2006 |
1224 |
7.7 |
2.2 |
| 31 May 2006 |
0238 |
9.3 |
2.4 |
| 31 May 2006 |
1253 |
4.2 |
2.0 |
| 02 Jun 2006 |
0502 |
5.4 |
2.2 |
| 08 Jun 2006 |
0637 |
4.7 |
3.0 |
On 6 January 2006, a small explosion occurred at Popocatépetl around 0042. According to the Washington VAAC, the resultant ash plume was visible on satellite imagery and its top reached ~ 5.8 km altitude, extending NE. Centro Nacional de Prevención de Desastres (CENAPRED) reported that after the explosion overall activity decreased to previous levels. During 24-30 January, several emissions of gas, steam, and small amounts of ash occurred. A moderate explosion on 26 January at 0957 produced an ash plume that rose to ~ 8.4 km altitude and drifted NE.
Throughout the month of February, several small-to-moderate emissions of steam, gas, and ash occurred. On the 4th, an explosion produced a plume that rose to ~ 6.7 km altitude. Aerial photos taken on 10 February showed a 130-m-diameter lava dome at the bottom of the crater. At 0528 on 24 February an M 2.3 earthquake was detected and was located 0.5 km to the N of the crater at a depth of 4.1 km.
During April-June, the volcano issued several small emissions of steam, gas, and ash; reports also noted several small coincident earthquakes. At 1807 on 23 May, an ash emission was observed that reached a height of ~ 7.4 km altitude. The ash column was dispersed towards the SE and was followed by a high-frequency, low-amplitude tremor signal that lasted 90 minutes and then returned to previous low levels.
Geologic Background. Volcán Popocatépetl, whose name is the Aztec word for smoking mountain, rises 70 km SE of Mexico City to form North America's 2nd-highest volcano. The glacier-clad stratovolcano contains a steep-walled, 400 x 600 m wide crater. The generally symmetrical volcano is modified by the sharp-peaked Ventorrillo on the NW, a remnant of an earlier volcano. At least three previous major cones were destroyed by gravitational failure during the Pleistocene, producing massive debris-avalanche deposits covering broad areas to the south. The modern volcano was constructed south of the late-Pleistocene to Holocene El Fraile cone. Three major Plinian eruptions, the most recent of which took place about 800 CE, have occurred since the mid-Holocene, accompanied by pyroclastic flows and voluminous lahars that swept basins below the volcano. Frequent historical eruptions, first recorded in Aztec codices, have occurred since Pre-Columbian time.
Information Contacts: Centro Nacional de Prevención de Desastres (CENAPRED), Av. Delfín Madrigal No.665. Coyoacan, México D.F. 04360, México (URL: https://www.gob.mx/cenapred/).
Rabaul (Papua New Guinea) — May 2006 Cite this Report
Rabaul
Papua New Guinea
4.2459°S, 152.1937°E; summit elev. 688 m
All times are local (unless otherwise noted)
Gas emissions and earthquakes during March-April 2006
Despite minor inflationary movements that began in mid-February 2006, Tavurvur remained relatively quiet from the end of March to mid-April 2006. Variable amounts of white vapor were released from the summit area and from an active fumarole on the upper W flank during this period. Vapor emissions became denser during and after rainfall. There were no noises heard or visible glow detected at night. Seismic activity remained at a low level. A high-frequency earthquake that originated NE of the caldera was recorded on 22 March. No other distinct high-frequency events were recorded, but 53 low-frequency earthquakes were recorded during 1-14 April.
Geologic Background. The low-lying Rabaul caldera on the tip of the Gazelle Peninsula at the NE end of New Britain forms a broad sheltered harbor utilized by what was the island's largest city prior to a major eruption in 1994. The outer flanks of the asymmetrical shield volcano are formed by thick pyroclastic-flow deposits. The 8 x 14 km caldera is widely breached on the east, where its floor is flooded by Blanche Bay and was formed about 1,400 years ago. An earlier caldera-forming eruption about 7,100 years ago is thought to have originated from Tavui caldera, offshore to the north. Three small stratovolcanoes lie outside the N and NE caldera rims. Post-caldera eruptions built basaltic-to-dacitic pyroclastic cones on the caldera floor near the NE and W caldera walls. Several of these, including Vulcan cone, which was formed during a large eruption in 1878, have produced major explosive activity during historical time. A powerful explosive eruption in 1994 occurred simultaneously from Vulcan and Tavurvur volcanoes and forced the temporary abandonment of Rabaul city.
Information Contacts: Ima Itikarai and Herman Patia, Rabaul Volcano Observatory (RVO), P.O. Box 386, Rabaul, Papua New Guinea.
Soufriere Hills (United Kingdom) — May 2006 Cite this Report
Soufriere Hills
United Kingdom
16.72°N, 62.18°W; summit elev. 915 m
All times are local (unless otherwise noted)
Big dome collapse and tall plume on 20 May 2006 leave a W-leaning crater
Activity at Soufrière Hills remained at elevated levels (table 63), similar to that previously reported (BGVN 30:12), a state that culminated with a dome collapse on 20 May 2006. Although that event took away considerable portions of the dome (and caused a small tsunami), photographs revealed post-collapse dome growth focused over a broad SE sector extending from the SW around to the NE. Numerous rockfalls continued from the S, E, and NE flanks of the lava dome. The NE-side rockfalls added talus to the upper reaches of the Tar River valley and were visible at night.
Table 63. Soufrière Hills seismicity during 28 December 2005 to 12 May 2006. * Due to weather conditions, gas measurements were not made. ** As a result of the collapse, instrumentation was lost and gas measurements were not able to be measured. Courtesy of MVO.
| Date |
Hybrid EQ's |
Volcano-tectonic EQ's |
Long-period EQ's |
Rockfall signals |
SO2 flux (metric tons/day) |
| 28 Dec-06 Jan 2006 |
-- |
-- |
11 |
37 |
522 |
| 06 Jan-13 Jan 2006 |
-- |
1 |
30 |
116 |
724 |
| 13 Jan-20 Jan 2006 |
-- |
-- |
17 |
61 |
767 |
| 20 Jan-27 Jan 2006 |
-- |
-- |
11 |
60 |
470 |
| 27 Jan-03 Feb 2006 |
1 |
3 |
11 |
92 |
594 |
| 03 Feb-10 Feb 2006 |
2 |
39 |
61 |
84 |
465 |
| 10 Feb-17 Feb 2006 |
2 |
9 |
121 |
10 |
568 |
| 17 Feb-24 Feb 2006 |
1 |
3 |
26 |
30 |
286 |
| 22 Feb-03 Mar 2006 |
1 |
7 |
157 |
18 |
388 |
| 03 Mar-10 Mar 2006 |
2 |
2 |
148 |
282 |
454 |
| 10 Mar-17 Mar 2006 |
-- |
4 |
115 |
319 |
480 |
| 17 Mar-24 Mar 2006 |
13 |
3 |
231 |
336 |
1,034 |
| 24 Mar-31 Mar 2006 |
12 |
1 |
230 |
316 |
523 |
| 31 Mar-07 Apr 2006 |
-- |
3 |
38 |
507 |
578 |
| 07 Apr-14 Apr 2006 |
-- |
3 |
99 |
620 |
540 |
| 14 Apr-21 Apr 2006 |
3 |
-- |
80 |
100 |
* |
| 21 Apr-28 Apr 2006 |
-- |
-- |
30 |
589 |
521 |
| 28 Apr-05 May 2006 |
-- |
-- |
109 |
279 |
310 |
| 05 May-12 May 2006 |
-- |
-- |
74 |
571 |
702 |
| 12 May-19 May 2006 |
7 |
1 |
130 |
753 |
674 |
| 19 May-26 May 2006 |
89 |
11 |
229 |
373 |
** |
| 26 May-02 Jun 2006 |
62 |
4 |
172 |
195 |
** |
| 02 Jun-09 Jun 2006 |
20 |
-- |
28 |
163 |
** |
A central spine was first observed on 17 January 2006 when clouds briefly cleared from the dome. On 22 January, two new relatively thin, vertical planar spines were seen on the SE flank of the lava dome and collapsed on 29 January. Helicopter and field observations indicated continued dome growth, particularly in the SE (figure 64).
On 10 February, MVO reported increased activity to the Washington VAAC. Satellite imagery showed a prominent hotspot at the volcano and a NW-drifting ash plume at an altitude of ~3 km. A small dark lobe of lava was observed on the western side of the lava dome in the crater. Steaming and venting were observed throughout the day. A photo appears as figure 65.
By early 11 February, this lobe had advanced rapidly towards the NE side of the dome and was visible as a steep-sided plateau of lava from inhabited areas around Salem. Photographs from fixed cameras showed continued changes to this lava lobe over the next few days, and the NE margin could be seen glowing at night and shedding rockfalls into the NE part of the crater. Ash-and-gas emissions continued through 15 February, producing plumes to an altitude of ~2.7 km. The initial growth rate of this lobe surpassed 5 cubic meters per second, but the rate declined around 17 February. The new lava lobe began to fill the gap between the lava dome and the N and W crater walls, raising the possibility that small rockfalls could spill over those areas in coming weeks. After 22 February, incandescent rockfalls were visible at night, coursing down the N, E, and SW sides of the dome and into the Tar River Valley (figure 66).
On 26 February, rapid vertical growth of the lava dome at Soufrière Hills was visible on camera images, and by 27 February a large spine about 30 m wide and at least 30 m high had developed at the dome's summit. By 28 February this spine had split into two parts and was leaning precariously to the NE. At about 2115 on 28 February the overhanging parts of the spine disintegrated and generated pyroclastic flows that traveled down the Tar River Valley almost as far as the coast. A low-level ash cloud drifted W. Additional changes to the shape of the spines and the upper NE flank of the volcano were noted in the following days as they disintegrated further. Rockfalls were visible on the N, NE, and E flanks of the volcano. Some fumaroles were observed on the upper outside part of Gages Wall (W of the lava dome) on 27 February, suggesting movement of fluids in this area.
During 3-17 March, lava-dome growth continued and the dome reached an altitude of ~950 m. The active lava lobe shed rockfalls and small pyroclastic flows to the W, N, and E. A vigorous gas vent was seen on the W side of the lava dome on 8 March, above Gages valley. Small fumaroles were visible at the top of Gages valley and below the lava dome remnant that stands at the top of Gages Valley.
Observations during 17 March-7 April revealed that lava-dome growth was focused in the summit area and towards the E and NE (figure 67). The N side of the lava dome showed little change. Rockfalls and pyroclastic flows were restricted to the Tar River Valley and were numerous on 19-20 March. The largest pyroclastic flows traveled as far as 2 km.
Lava extrusion continued during 7-21 April. Growth occurred to the E and N, and an eastward-facing lobe developed on the NE side of the dome. Numerous small rockfalls continued from the active eastern flanks of the dome, adding to the talus in the upper reaches of the Tar River valley. Rockfalls were accompanied by minor ash venting. Due to unusual wind conditions, plumes were predominately transported N and NW, shifting to the E on 20 April. As a result of this process, light ashfall occurred over much of Montserrat. Thermal images taken on 27 April indicated some very hot areas on the E flank of the dome.
Deposits from a series of pyroclastic flows occurring on 4 May extended as far as the Tar River delta. Northerly directed winds during the reporting period resulted in light ashfall in areas north of the Belham valley. The dome volume was approximately 80 million cubic meters and the average growth rate through April was about 8 cubic meters per second.
On 18 May, a survey conducted on the southern half of the dome was carried out using a terrestrial laser scanner and showed that the summit of the dome had reached a height of 1,006 m, this is 83 m higher than Chance's Peak (figure 68).
20 May collapse. A major lava dome collapse took place on the morning of 20 May (figure 69). A helicopter flight in the afternoon confirmed that most of the lava dome had gone, together with some remnants of the 2003 lava dome, leaving a broad, deep, eastward-sloping crater at the summit of the volcano. The volume of the lava dome was believed to be about 90 million cubic meters and most of this collapsed over a period of less than three hours. Views of the W part of the crater where ash venting is continuing were not possible but it is unlikely that there is significant dome material remaining there.
At 0222 on 20 May there was a single precursor, a long-period seismic event located 3 km below the dome. A brief episode of heightened seismic amplitude corresponding to ash venting occurred during 0300-0330. During heavy rain, another episode of increased seismic amplitude, interpreted as ash venting, began at 0552, and it developed into a high-amplitude seismic signal. The heavy rain caused mudflows in Belham River valley. By 0632 low-level ash clouds were drifting to the NW of the volcano from the crater area and a steam plume was rising to 6,000 ft (~1800 m). Unconfirmed reports suggested that pyroclastic flows first reached the sea at about 0645. Regular pulses of pyroclastic flows were reaching the sea down the Tar River valley by 0720 with major pulses recorded in seismic amplitude at 0736, 0743, and between 0801 and 0804. Also between 0730 and 0810 a number of long-period seismic events were detected. At 0740 an ash cloud was reported at nearly 17 km, altitude the highest reported ash cloud during the ten years of the eruption. At 0743, pyroclastic surges were observed spreading across the NE flanks of the volcano reaching the Spanish Point area. It was also estimated at this time that surges had spread 3 km offshore from Tar River valley, across the surface of the ocean.
By 0750, lithics were falling in areas NW of the volcano; most were less than 3.5 cm across, and the largest found in the inhabited area was 6 cm across. Six car windscreens were reported broken. The deepest ash fall in inhabited areas was about 3 cm. Activity began to reduce in intensity after 0815 and a high-amplitude seismic signal remained until 0900. At this time, residents in the Old Towne and Salem area were subjected to high levels of volcanic gases particularly hydrogen chloride causing some to move N (figure 69). Widespread and noisy mudflows were reported in the Trants area to the NE of the volcano. Ash venting from the W of the crater continued until about 1700 when it began to decline.
A 1-m-high tsunami was reported from Deshaies beach in Guadeloupe and swells were detected in Little Bay, Montserrat, and at Jolly and English Harbour, Antigua. Relatively light but continuous ash-and-steam venting followed the collapse.
The weeks after the 20 May collapse. Wind direction shifted towards the N late on 21 May causing ash fall and raining mud in most parts of the island. Scientists remained alert to the possibility of further explosive activity but seismic activity was at low levels after the event on 20 May.
Since the May collapse, the lava dome continued to grow. As of 9 June it was approximately 20 million cubic meters in size. This is similar to the size of the dome in early January 2006. The average growth rate since the dome collapsed on 20 May was close to 10 cubic meters per second, well above the average growth rate of 6 cubic meters per second noted between January and April 2006.
By the end of the report period the dome was broad and flat-topped with a growing talus slope extending E. The lava on the summit of the dome is blocky, which is typical of lava extruded at a high rate. Vigorous ash and gas emitted by a vent W of the lava dome occurred during the week of 2 June. The venting is accompanied by a roaring sound that is sometimes audible in the Salem area. Prevailing winds have taken most of this ash and gas to the west over Plymouth. Satellite imagery on 4 June showed a thin area of ash out to St. Croix. In addition, there were multiple SFC and pilot reports of ash over the E portion of Puerto Rico and the Virgin Islands. Mudflows were reported on the 11 and 13 June during heavy rainfall.
Geologic Background. The complex, dominantly andesitic Soufrière Hills volcano occupies the southern half of the island of Montserrat. The summit area consists primarily of a series of lava domes emplaced along an ESE-trending zone. The volcano is flanked by Pleistocene complexes to the north and south. English's Crater, a 1-km-wide crater breached widely to the east by edifice collapse, was formed about 2000 years ago as a result of the youngest of several collapse events producing submarine debris-avalanche deposits. Block-and-ash flow and surge deposits associated with dome growth predominate in flank deposits, including those from an eruption that likely preceded the 1632 CE settlement of the island, allowing cultivation on recently devegetated land to near the summit. Non-eruptive seismic swarms occurred at 30-year intervals in the 20th century, but no historical eruptions were recorded until 1995. Long-term small-to-moderate ash eruptions beginning in that year were later accompanied by lava-dome growth and pyroclastic flows that forced evacuation of the southern half of the island and ultimately destroyed the capital city of Plymouth, causing major social and economic disruption.
Information Contacts: Montserrat Volcano Observatory (MVO), Fleming, Montserrat, West Indies (URL: http://www.mvo.ms/).
St. Helens (United States) — May 2006 Cite this Report
St. Helens
United States
46.2°N, 122.18°W; summit elev. 2549 m
All times are local (unless otherwise noted)
Intracrater lava dome continues to grow through at least May 2006
From August to December 2005, the lava dome inside the crater of Mount St. Helens continued to grow, accompanied by low rates of seismicity, low emissions of steam and volcanic gases, and minor production of ash (BGVN 30:12). The hazard status was at Volcano Advisory (Alert Level 2); aviation color code Orange.
Based on the online reports of the Cascades Volcano Observatory (CVO) of the U.S. Geological Survey (USGS), this pattern of activity continued in January and February 2006 and suggests that the slow extrusion of dacite onto the crater floor at Mount St. Helens continued. Slight decreases in seismicity occurred on two occasions after larger than normal earthquakes. By mid-January the new dome was noticeably taller and broader than in December. Rockfalls from its summit generated small ash plumes that slowly rose above the crater rim and dissipated as they drifted E.
On 24 January a shallow M 2.7 earthquake triggered a rockfall from the new lava dome, which in turn produced an ash plume that filled the crater before dissipating and drifting N over the pumice plain. Analysis of recent photographs from cameras in the crater showed that the top of the new lava dome was at an elevation of ~ 2,240 m, about 90 m higher than it was in early November 2005.
In February, occasional clear views of the volcano revealed incandescence on the currently growing lava lobe and a few incandescent rockfalls. Comparison of photos taken between 17 December and 7 February showed that the base of the active lobe of the lava dome enlarged by about 100 m. Photographs taken during the week of 5 February showed that the active part of the new lava dome continued to extrude, with points on the surface of the dome moving a couple of meters per day (figure 61).
Gas measurements made on 15 February suggested that the volcanic-gas flux remained unchanged from recent measurements. Observations made on 17 February revealed that the active NE part of the new lava dome was developing a steeply inclined jagged spine. At its top, temperatures as high as 580°C were measured using a thermal sensor.
Growth of the new lava dome inside the crater of Mount St. Helens continued during March, April, and May 2006, accompanied by low rates of seismicity, low emissions of steam and volcanic gases, and minor production of ash. Small earthquakes occurred every several minutes, punctuated by occasional larger earthquakes. The Global Positioning System (GPS) receiver on the new lava dome showed that lava emerging from the vent was still advancing WNW at about a meter per day. Small rockfalls produced small ash clouds that rose from the dome's NW flank. The eruption of lava into the crater continued, shown by ongoing rockfalls and continuous GPS measurements made on the growing lava lobe.
Analysis of photographs revealed that a slab of rock approximately 50,000 cubic meters in volume was shed from the N margin of the growing spine during 6-7 May. This probably coincided with a large seismic signal recorded on the night of 7 May. Rock-avalanche deposits extended a few hundred meters to the NE. The avalanche was accompanied by an ash cloud. The spine continued to grow during 10-15 May, producing rockfalls that intensified on the evening of 14 May. Incandescence was visible on satellite imagery. On 17 May night-time incandescence from rockfalls was observed.
During 24-25 May, seismicity was at levels typical of the continuing lava-dome extrusion at Mount St. Helens. On 29 May, a M 3.1 earthquake and simultaneous large rockfall occurred. An ash plume produced at 0810 reached an altitude of 4.9 km - 6.1 km according to ground observations and pilot reports (figure 62). One pilot report suggested that the plume reached an altitude of 7.3 km. By 1308, ash from the event was no longer visible on satellite imagery. The rockfall originated primarily from the N side of the growing fin (figures 63 and 64).
During June 2006, seismicity indicated that the lava spine continued to grow inside the crater of Mount St. Helens and occasionally produced minor rockfalls. On 9 June, pilots reported that an ash-and-steam plume, generated after a rockfall following a M 3.2 earthquake, reached an altitude of 4.6 km. According to seismic data, a medium-sized rockfall occurred on 13 June. Incandescence was observed on satellite imagery. A small steam plume from the lava dome and dust from minor rockfalls were visible from the US Forest Service's web camera at the Johnston Ridge Observatory on 25 and 26 June. On 26 June, a pilot reported that dust and ash reached an altitude of ~ 2.4 km and drifted W.
From January through June 2006, St Helens remained at Volcano Advisory (Alert Level 2); aviation color code Orange.
Geologic Background. Prior to 1980, Mount St. Helens was a conical volcano sometimes known as the Fujisan of America. During the 1980 eruption the upper 400 m of the summit was removed by slope failure, leaving a 2 x 3.5 km breached crater now partially filled by a lava dome. There have been nine major eruptive periods beginning about 40-50,000 years ago, and it has been the most active volcano in the Cascade Range during the Holocene. Prior to 2,200 years ago, tephra, lava domes, and pyroclastic flows were erupted, forming the older edifice, but few lava flows extended beyond the base of the volcano. The modern edifice consists of basaltic as well as andesitic and dacitic products from summit and flank vents. Eruptions in the 19th century originated from the Goat Rocks area on the N flank, and were witnessed by early settlers.
Information Contacts: Cascades Volcano Observatory (CVO), U.S. Geological Survey, 1300 SE Cardinal Court, Building 10, Suite 100, Vancouver, WA 98683-9589, USA (URL: https://volcanoes.usgs.gov/observatories/cvo/).
Ubinas
Peru
16.345°S, 70.8972°W; summit elev. 5608 m
All times are local (unless otherwise noted)
Ash and steam emissions stir hazard and environmental concerns
Ubinas began erupting ash on 25 March 2006 (BGVN 31:03). Randall White from the U.S. Geological Survey (USGS) reported on 1 April that increased fumarolic activity occurred during the end of March. Victor Aguilar from the Universidad de San Agustint, visited the volcano on 31 March. He found strong steam-and-ash emissions occurring. Also, leaves of nearby crops were burned and a sound similar to a jet engine emanated from the vent area. Table 1 gives a summary of some recent plumes. Figure 3 contains an ASTER image of the volcano and surroundings on 8 May 2006.
Table 1. Summary of some recent plume activity from Ubinas. Courtesy of the Buenos Aires VAAC and INGEMMET; satellite imagery courtesy of NASA Earth Observatory.
| Date (time) |
Altitude |
Drift direction |
Comments |
| 06 Apr (1220) |
6.1-9.1 km |
-- |
Ash absent on satellite imagery |
| 06 Apr (1900) |
6.1-7.3 km |
NE |
-- |
| 08 Apr |
-- |
-- |
Volcanic activity ceased |
| 09 Apr |
6.1-7.3 km |
SW |
-- |
| 11 Apr |
-- |
-- |
Volcanic activity ceased |
| 13 Apr |
-- |
-- |
Ash emissions increased, ashfall reached 7 km from volcano |
| 15 Apr |
6.1-9.1 km |
-- |
Ash cloud |
| 16 Apr |
-- |
-- |
Volcanic activity ceased |
| 18 Apr (0715-1600) |
1-3 km |
-- |
Continuous emissions of ash and gas |
| 19 Apr |
~3 km |
-- |
Plume containing ash/lava fragments lasted 6-7 hours |
| 20 Apr-22 Apr |
-- |
NW, W, SW |
Plume reached 60 km from the volcano; traces of ash reached the Arequipa airport. |
| 25 Apr-26 Apr |
0.2-0.7 km |
-- |
-- |
| 04 May-08 May |
~6.7 km |
-- |
See fig. 15 |
| 9-11, 13-14 May |
7.3 km (max) |
-- |
-- |
| 20 May-25 May |
7.3 km (max) |
-- |
-- |
| 24 May |
6.7 km |
E |
Plume reported by pilot |
| 25 May |
7 km |
NW |
-- |
| 30 May |
7.9 km |
E |
Ash plume seen on satellite imagery |
| 31 May-05 Jun |
7.9 km |
N, NE, SE, S |
-- |
| 09 Jun-11 Jun |
6.7 km |
E, SW |
Ash clouds reported by pilots |
The Perú Instituto Geológico Minero y Metalúrgico (INGEMMET) reported that gas and ash were emitted from Ubinas from 27 March to at least 19 April. On 13 April, ash emissions increased noticeably in comparison to the previous days, with ashfall in the villages of Ubinas, Querapi, and Sacuaya, and as far as 7 km from the volcano. Acid rain was also noted in these villages, particularly between 1400 and 1600 hours on 14 April. Explosions on 13 and 14 April were heard in nearby villages. According to a news report on 18 April, however, officials urged residents of the town of Querapi ~ 5 km from the volcano to evacuate.
On 19 April, a lava dome was observed on the crater floor for the first time. It was incandescent, 60 m in diameter, and 4 m high. Explosions were heard as far as 6 km from the volcano and a plume composed of ash and lava fragments rose ~ 3 km above the volcano. Plumes lasted for 6-7 hours and hazard statements suggested significant danger within 4 km of the crater. The Buenos Aires Volcanic Ash Advisory Center (VAAC) released volcanic ash advisory statements during the report period.
According to news reports, as of 19 April at least 1,000 people living N of the volcano suffered respiratory problems, dozens of livestock died and many more were ill after eating ash-covered grass, and water sources were polluted with ash. Dozens of people from Querapi, the town closest to the volcano, began to evacuate on 21 April. On 22 April, officials declared a state of emergency for the area near the volcano and sent aid for evacuees.
During 25 and 26 April, the volume of ash emitted from the volcano decreased significantly. Gas plumes rose between 200 and 700 m above the volcano's caldera. Seismicity during 22-26 April was higher than normal. The Buenos Aires VAAC posted volcanic ash advisories during the report period.
Several thermal anomalies were observed by MODIS/MODVOLC in 2006 at the following local times: 0105 hours, 27 May; 2220 hours, 31 May; 2225 hours, 7 June; 2210 hours, 18 June; and 2235 hours, 30 June. On 3 June, the Alert Level for Ubinas was increased to Orange due to heightened explosive activity. According to a news report, on 5 June, officials in S Perú prepared to evacuate approximately 480 families; approximately 550 families were evacuated on 10 and 11 June. Ubinas emitted a plume of ash and/or steam on 24 June 2006. The Moderate Resolution Imaging Spectroradiometer (MODIS) flying onboard NASA's Aqua satellite showed the plume moving E.
Geologic Background. The truncated appearance of Ubinas, Perú's most active volcano, is a result of a 1.4-km-wide crater at the summit. It is the northernmost of three young volcanoes located along a regional structural lineament about 50 km behind the main volcanic front. The growth and destruction of Ubinas I was followed by construction of Ubinas II beginning in the mid-Pleistocene. The upper slopes of the andesitic-to-rhyolitic Ubinas II stratovolcano are composed primarily of andesitic and trachyandesitic lava flows and steepen to nearly 45°. The steep-walled, 150-m-deep summit crater contains an ash cone with a 500-m-wide funnel-shaped vent that is 200 m deep. Debris-avalanche deposits from the collapse of the SE flank about 3,700 years ago extend 10 km from the volcano. Widespread Plinian pumice-fall deposits include one from about 1,000 years ago. Holocene lava flows are visible on the flanks, but activity documented since the 16th century has consisted of intermittent minor-to-moderate explosive eruptions.
Information Contacts: Randall A. White, USGS/OFDA Volcano Disaster Assistance Program; Victor Aguilar, Universidad de San Agustin, Perú; Buenos Aires Volcanic Ash Advisory Center; Instituto Geológico Minero y Metalúrgico (INGEMMET ? Institution of Mining and Metallurgical Geology); National Aeronautics and Space Administration (NASA) Earth Observer (URL: http://earthobservatory.nasa.gov/NaturalHarards/).
Villarrica
Chile
39.42°S, 71.93°W; summit elev. 2847 m
All times are local (unless otherwise noted)
Unusual seismicity, minor pyroclastic, and gas explosions, January-April 2005
Our last report on Villarrica, through January 2005, described plumes, the growth of a lava lake in the crater, and some night-time Strombolian explosions (BGVN 29:12). This report covers January to April 2005.
According to the March 2005 newsletter of the Multinational Andean Project: Geoscience for Andean Communities (MAP-GAC) produced by the Geological Survey of Canada, both seismic activity and degassing from the permanent fumarole increased in January. One of the early January explosions described above sent pyroclastic material (ash and scoriaceous lapilli) onto the flanks of the snow-and-ice covered volcano, covering an area 1 km wide and 3 km long. Subsequent minor explosions have sent pyroclastic material to estimated heights of 300 m above the crater. Onlookers have reported incandescent material within the gas-and-pyroclastic column.
On 19 January 2005, volcanologists Hugo Moreno and Edmundo Polanco of OVDAS–SERNAGEOMIN observed the lava lake actively spattering at a distance of 30 m below the edge of the principal crater; the crater interior and perimeter were covered in spatter. The glacier covering the cone had developed new fractures and crevasses. Activity in February 2005 lessened.
During 29 March to 3 April 2005, the lava lake inside Villarrica's crater remained active, with Strombolian explosions occurring. Some gas explosions were observed to hurl volcanic bombs as far as ~ 300 m. According to a news report on 12 April 2005, the Oficina Nacional de Emergencia reported that unusual seismicity was recorded at Villarrica during early April. Fresh ash deposits were seen outside of the volcano's crater. Visitors were banned from climbing the volcano.
Geologic Background. The glacier-covered Villarrica stratovolcano, in the northern Lakes District of central Chile, is ~15 km south of the city of Pucon. A 2-km-wide caldera that formed about 3,500 years ago is located at the base of the presently active, dominantly basaltic to basaltic-andesite cone at the NW margin of a 6-km-wide Pleistocene caldera. More than 30 scoria cones and fissure vents are present on the flanks. Plinian eruptions and pyroclastic flows that have extended up to 20 km from the volcano were produced during the Holocene. Lava flows up to 18 km long have issued from summit and flank vents. Eruptions documented since 1558 CE have consisted largely of mild-to-moderate explosive activity with occasional lava effusion. Glaciers cover 40 km2 of the volcano, and lahars have damaged towns on its flanks.
Information Contacts: Werner Keller, Proyecto de Observacion Villarrica (POVI), Wiesenstrasse 8, 86438 Kissing, Germany (URL: http://www.povi.cl/); Hugo Moreno and Edmundo Polanco, Observatorio Volcanológico de los Andes del Sur (OVDAS), Servicio Nacional de Geología y Minería, Casilla 23D, Temuco, Chile (URL: http://www.sernageomin.cl/); MAP:GAC Newsletter, Geological Survey of Canada, 101-605 Robson Street, Vancouver, BC,V6B 5J3, Canada.