Recently Published Bulletin Reports
Kadovar (Papua New Guinea) An ash plume and weak thermal anomaly during May 2023
San Miguel (El Salvador) Small gas-and-ash explosions during March and May 2023
Ebeko (Russia) Continued explosions, ash plumes, and ashfall during October 2022-May 2023
Home Reef (Tonga) Discolored plumes continued during November 2022-April 2023
Semisopochnoi (United States) Occasional explosions, ash deposits, and gas-and-steam plumes during December 2022-May 2023
Ambae (Vanuatu) New lava flow, ash plumes, and sulfur dioxide plumes during February-May 2023
Ibu (Indonesia) Daily ash explosions continue, along with thermal anomalies in the crater, October 2022-May 2023
Dukono (Indonesia) Continuing ash emissions, SO2 plumes, and thermal signals during October 2022-May 2023
Sabancaya (Peru) Explosions, gas-and-ash plumes, and thermal activity persist during November 2022-April 2023
Sheveluch (Russia) Significant explosions destroyed part of the lava-dome complex during April 2023
Bezymianny (Russia) Explosions, ash plumes, lava flows, and avalanches during November 2022-April 2023
Chikurachki (Russia) New explosive eruption during late January-early February 2023
Kadovar (Papua New Guinea) — June 2023  Cite this Report
Kadovar
Papua New Guinea
3.608°S, 144.588°E; summit elev. 365 m
All times are local (unless otherwise noted)
An ash plume and weak thermal anomaly during May 2023
Kadovar is a 2-km-wide island that is the emergent summit of a Bismarck Sea stratovolcano. It lies off the coast of New Guinea, about 25 km N of the mouth of the Sepik River. Prior to an eruption that began in 2018, a lava dome formed the high point of the volcano, filling an arcuate landslide scarp open to the S. Submarine debris-avalanche deposits occur to the S of the island. The current eruption began in January 2018 and has comprised lava effusion from vents at the summit and at the E coast; more recent activity has consisted of ash plumes, weak thermal activity, and gas-and-steam plumes (BGVN 48:02). This report covers activity during February through May 2023 using information from the Darwin Volcanic Ash Advisory Center (VAAC) and satellite data.
Activity during the reporting period was relatively low and mainly consisted of white gas-and-steam plumes that were visible in natural color satellite images on clear weather days (figure 67). According to a Darwin VAAC report, at 2040 on 6 May an ash plume rose to 4.6 km altitude and drifted W; by 2300 the plume had dissipated. MODIS satellite instruments using the MODVOLC thermal algorithm detected a single thermal hotspot on the SE side of the island on 7 May. Weak thermal activity was also detected in a satellite image on the E side of the island on 14 May, accompanied by a white gas-and-steam plume that drifted SE (figure 68).
Geologic Background. The 2-km-wide island of Kadovar is the emergent summit of a Bismarck Sea stratovolcano of Holocene age. It is part of the Schouten Islands, and lies off the coast of New Guinea, about 25 km N of the mouth of the Sepik River. Prior to an eruption that began in 2018, a lava dome formed the high point of the andesitic volcano, filling an arcuate landslide scarp open to the south; submarine debris-avalanche deposits occur in that direction. Thick lava flows with columnar jointing forms low cliffs along the coast. The youthful island lacks fringing or offshore reefs. A period of heightened thermal phenomena took place in 1976. An eruption began in January 2018 that included lava effusion from vents at the summit and at the E coast.
Information Contacts: Darwin Volcanic Ash Advisory Centre (VAAC), Bureau of Meteorology, Northern Territory Regional Office, PO Box 40050, Casuarina, NT 0811, Australia (URL: http://www.bom.gov.au/info/vaac/); Hawai'i Institute of Geophysics and Planetology (HIGP) - MODVOLC Thermal Alerts System, School of Ocean and Earth Science and Technology (SOEST), Univ. of Hawai'i, 2525 Correa Road, Honolulu, HI 96822, USA (URL: http://modis.higp.hawaii.edu/); Copernicus Browser, Copernicus Data Space Ecosystem, European Space Agency (URL: https://dataspace.copernicus.eu/browser/).
San Miguel (El Salvador) — June 2023 Cite this Report
San Miguel
El Salvador
13.434°N, 88.269°W; summit elev. 2130 m
All times are local (unless otherwise noted)
Small gas-and-ash explosions during March and May 2023
San Miguel in El Salvador is a broad, deep crater complex that has been frequently modified by eruptions recorded since the early 16th century and consists of the summit known locally as Chaparrastique. Flank eruptions have produced lava flows that extended to the N, NE, and SE during the 17-19th centuries. The most recent activity has consisted of minor ash eruptions from the summit crater. The current eruption period began in November 2022 and has been characterized by frequent phreatic explosions, gas-and-ash emissions, and sulfur dioxide plumes (BGVN 47:12). This report describes small gas-and-ash explosions during December 2022 through May 2023 based on special reports from the Ministero de Medio Ambiente y Recursos Naturales (MARN).
Activity has been relatively low since the last recorded explosions on 29 November 2022. Seismicity recorded by the San Miguel Volcano Station (VSM) located on the N flank at 1.7 km elevation had decreased by 7 December. Sulfur dioxide gas measurements taken with DOAS (Differential Optical Absorption Spectroscopy) mobile equipment were below typical previously recorded values: 300 tons per day (t/d). During December, small explosions were recorded by the seismic network and manifested as gas-and-steam emissions.
Gas-and-ash explosions in the crater occurred during January 2023, which were recorded by the seismic network. Sulfur dioxide values remained low, between 300-400 t/d through 10 March. At 0817 on 14 January a gas-and-ash emission was visible in webcam images, rising just above the crater rim. Some mornings during February, small gas-and-steam plumes were visible in the crater. On 7 March at 2252 MARN noted an increase in degassing from the central crater; gas emissions were constantly observed through the early morning hours on 8 March. During the early morning of 8 March through the afternoon on 9 March, 12 emissions were registered, some accompanied by ash. The last gas-and-ash emission was recorded at 1210 on 9 March; very fine ashfall was reported in El Tránsito (10 km S), La Morita (6 km W), and La Piedrita (3 km W). The smell of sulfur was reported in Piedra Azul (5 km SW). On 16 March MARN reported that gas-and-steam emissions decreased.
Low degassing and very low seismicity were reported during April; no explosions have been detected between 9 March and 27 May. The sulfur dioxide emissions remained between 350-400 t/d; during 13-20 April sulfur dioxide values fluctuated between 30-300 t/d. Activity remained low through most of May; on 23 May seismicity increased. An explosion was detected at 1647 on 27 May generated a gas-and-ash plume that rose 700 m high (figure 32); a decrease in seismicity and gas emissions followed. The DOAS station installed on the W flank recorded sulfur dioxide values that reached 400 t/d on 27 May; subsequent measurements showed a decrease to 268 t/d on 28 May and 100 t/d on 29 May.
Geologic Background. The symmetrical cone of San Miguel, one of the most active volcanoes in El Salvador, rises from near sea level to form one of the country's most prominent landmarks. A broad, deep, crater complex that has been frequently modified by eruptions recorded since the early 16th century caps the truncated unvegetated summit, also known locally as Chaparrastique. Flanks eruptions of the basaltic-andesitic volcano have produced many lava flows, including several during the 17th-19th centuries that extended to the N, NE, and SE. The SE-flank flows are the largest and form broad, sparsely vegetated lava fields crossed by highways and a railroad skirting the base of the volcano. Flank vent locations have migrated higher on the edifice during historical time, and the most recent activity has consisted of minor ash eruptions from the summit crater.
Information Contacts: Ministero de Medio Ambiente y Recursos Naturales (MARN), Km. 5½ Carretera a Nueva San Salvador, Avenida las Mercedes, San Salvador, El Salvador (URL: http://www.snet.gob.sv/ver/vulcanologia).
Ebeko
Russia
50.686°N, 156.014°E; summit elev. 1103 m
All times are local (unless otherwise noted)
Continued explosions, ash plumes, and ashfall during October 2022-May 2023
Ebeko, located on the N end of Paramushir Island in the Kuril Islands, consists of three summit craters along a SSW-NNE line at the northern end of a complex of five volcanic cones. Eruptions date back to the late 18th century and have been characterized as small-to-moderate explosions from the summit crater, accompanied by intense fumarolic activity. The current eruption period began in June 2022 and has recently consisted of frequent explosions, ash plumes, and thermal activity (BGVN 47:10). This report covers similar activity during October 2022 through May 2023, based on information from the Kamchatka Volcanic Eruptions Response Team (KVERT) and satellite data.
Activity during October consisted of explosive activity, ash plumes, and occasional thermal anomalies. Visual data by volcanologists from Severo-Kurilsk showed explosions producing ash clouds up to 2.1-3 km altitude which drifted E, N, NE, and SE during 1-8, 10, 16, and 18 October. KVERT issued several Volcano Observatory Notices for Aviation (VONA) on 7, 13-15, and 27 October 2022, stating that explosions generated ash plumes that rose to 2.3-4 km altitude and drifted 5 km E, NE, and SE. Ashfall was reported in Severo-Kurilsk (Paramushir Island, about 7 km E) on 7 and 13 October. Satellite data showed a thermal anomaly over the volcano on 15-16 October. Visual data showed ash plumes rising to 2.5-3.6 km altitude on 22, 25-29, and 31 October and moving NE due to constant explosions.
Similar activity continued during November, with explosions, ash plumes, and ashfall occurring. KVERT issued VONAs on 1-2, 4, 6-7, 9, 13, and 16 November that reported explosions and resulting ash plumes that rose to 1.7-3.6 km altitude and drifted 3-5 km SE, ESE, E, and NE. On 1 November ash plumes extended as far as 110 km SE. On 5, 8, 12, and 24-25 November explosions and ash plumes rose to 2-3.1 km altitude and drifted N and E. Ashfall was observed in Severo-Kurilsk on 7 and 16 November. A thermal anomaly was visible during 1-4, 16, and 20 November. Explosions during 26 November rose as high as 2.7 km altitude and drifted NE (figure 45).
Explosions and ash plumes continued to occur in December. During 1-2 and 4 December volcanologists from Severo-Kurilsk observed explosions that sent ash to 1.9-2.5 km altitude and drifted NE and SE (figure 46). VONAs were issued on 5, 9, and 16 December reporting that explosions generated ash plumes rising to 1.9 km, 2.6 km, and 2.4 km altitude and drifted 5 km SE, E, and NE, respectively. A thermal anomaly was visible in satellite imagery on 16 December. On 18 and 27-28 December explosions produced ash plumes that rose to 2.5 km altitude and drifted NE and SE. On 31 December an ash plume rose to 2 km altitude and drifted NE.
Explosions continued during January 2023, based on visual observations by volcanologists from Severo-Kurilsk. During 1-7 January explosions generated ash plumes that rose to 4 km altitude and drifted NE, E, W, and SE. According to VONAs issued by KVERT on 2, 4, 10, and 23 January, explosions produced ash plumes that rose to 2-4 km altitude and drifted 5 km N, NE, E, and ENE; the ash plume that rose to 4 km altitude occurred on 10 January (figure 47). Satellite data showed a thermal anomaly during 3-4, 10, 13, 16, 21, 22, and 31 January. KVERT reported that an ash cloud on 4 January moved 12 km NE. On 6 and 9-11 January explosions sent ash plumes to 4.5 km altitude and drifted W and ESE. On 13 January an ash plume rose to 3 km altitude and drifted SE. During 20-24 January ash plumes from explosions rose to 3.7 km altitude and drifted SE, N, and NE. On 21 January the ash plume drifted as far as 40 km NE. During 28-29 and 31 January and 1 February ash plumes rose to 4 km altitude and drifted NE.
During February, explosions, ash plumes, and ashfall were reported. During 1, 4-5 and 7-8 February explosions generated ash plumes that rose to 4.5 km altitude and drifted E and NE; ashfall was observed on 5 and 8 February. On 6 February an explosion produced an ash plume that rose to 3 km altitude and drifted 7 km E, causing ashfall in Severo-Kurilsk. A thermal anomaly was visible in satellite data on 8, 9, 13, and 21 February. Explosions on 9 and 12-13 February produced ash plumes that rose to 4 km altitude and drifted E and NE; the ash cloud on 12 February extended as far as 45 km E. On 22 February explosions sent ash to 3 km altitude that drifted E. During 24 and 26-27 February ash plumes rose to 4 km altitude and drifted E. On 28 February an explosion sent ash to 2.5-3 km altitude and drifted 5 km E; ashfall was observed in Severo-Kurilsk.
Activity continued during March; visual observations showed that explosions generated ash plumes that rose to 3.6 km altitude on 3, 5-7, and 9-12 March and drifted E, NE, and NW. Thermal anomalies were visible on 10, 13, and 29-30 March in satellite imagery. On 18, 21-23, 26, and 29-30 March explosions produced ash plumes that rose to 2.8 km altitude and drifted NE and E; the ash plumes during 22-23 March extended up to 76 km E. A VONA issued on 21 March reported an explosion that produced an ash plume that rose to 2.8 km altitude and drifted 5 km E. Another VONA issued on 23 March reported that satellite data showed an ash plume rising to 3 km altitude and drifted 14 km E.
Explosions during April continued to generate ash plumes. On 1 and 4 April an ash plume rose to 2.8-3.5 km altitude and drifted SE and NE. A thermal anomaly was visible in satellite imagery during 1-6 April. Satellite data showed ash plumes and clouds rising to 2-3 km altitude and drifting up to 12 km SW and E on 3 and 6 April (figure 48). KVERT issued VONAs on 3, 5, 14, 16 April describing explosions that produced ash plumes rising to 3 km, 3.5 km, 3.5 km, and 3 km altitude and drifting 5 km S, 5 km NE and SE, 72 km NNE, and 5 km NE, respectively. According to satellite data, the resulting ash cloud from the explosion on 14 April was 25 x 7 km in size and drifted 72-104 km NNE during 14-15 April. According to visual data by volcanologists from Severo-Kurilsk explosions sent ash up to 3.5 km altitude that drifted NE and E during 15-16, 22, 25-26, and 29 April.
The explosive eruption continued during May. Explosions during 3-4, 6-7, and 9-10 May generated ash plumes that rose to 4 km altitude and drifted SW and E. Satellite data showed a thermal anomaly on 3, 9, 13-14, and 24 May. During 12-16, 23-25, and 27-28 May ash plumes rose to 3.5 km altitude and drifted in different directions due to explosions. Two VONA notices were issued on 16 and 25 May, describing explosions that generated ash plumes rising to 3 km and 3.5 km altitude, respectively and extending 5 km E. The ash cloud on 25 May drifted 75 km SE.
Thermal activity in the summit crater, occasionally accompanied by ash plumes and ash deposits on the SE and E flanks due to frequent explosions, were visible in infrared and true color satellite images (figure 49).
Geologic Background. The flat-topped summit of the central cone of Ebeko volcano, one of the most active in the Kuril Islands, occupies the northern end of Paramushir Island. Three summit craters located along a SSW-NNE line form Ebeko volcano proper, at the northern end of a complex of five volcanic cones. Blocky lava flows extend west from Ebeko and SE from the neighboring Nezametnyi cone. The eastern part of the southern crater contains strong solfataras and a large boiling spring. The central crater is filled by a lake about 20 m deep whose shores are lined with steaming solfataras; the northern crater lies across a narrow, low barrier from the central crater and contains a small, cold crescentic lake. Historical activity, recorded since the late-18th century, has been restricted to small-to-moderate explosive eruptions from the summit craters. Intense fumarolic activity occurs in the summit craters, on the outer flanks of the cone, and in lateral explosion craters.
Information Contacts: Kamchatka Volcanic Eruptions Response Team (KVERT), Far Eastern Branch, Russian Academy of Sciences, 9 Piip Blvd., Petropavlovsk-Kamchatsky, 683006, Russia (URL: http://www.kscnet.ru/ivs/kvert/); MIROVA (Middle InfraRed Observation of Volcanic Activity), a collaborative project between the Universities of Turin and Florence (Italy) supported by the Centre for Volcanic Risk of the Italian Civil Protection Department (URL: http://www.mirovaweb.it/); Copernicus Browser, Copernicus Data Space Ecosystem, European Space Agency (URL: https://dataspace.copernicus.eu/browser/).
Home Reef
Tonga
18.992°S, 174.775°W; summit elev. -10 m
All times are local (unless otherwise noted)
Discolored plumes continued during November 2022-April 2023
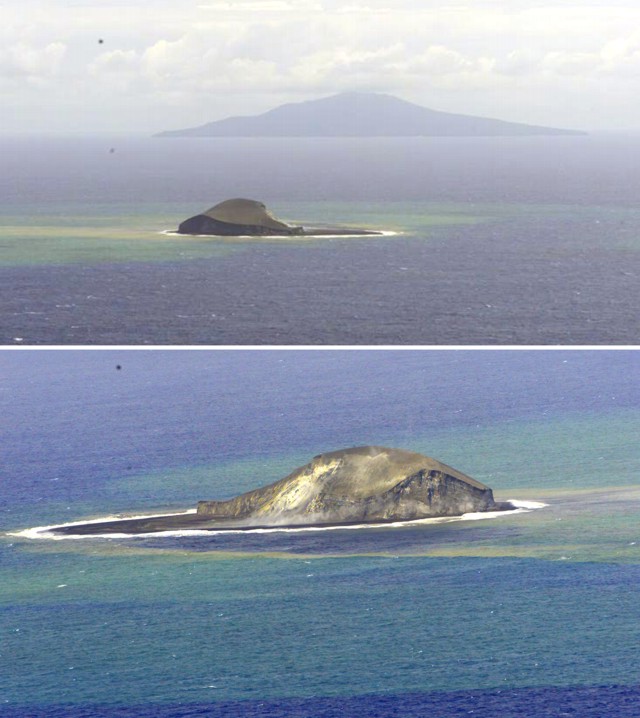
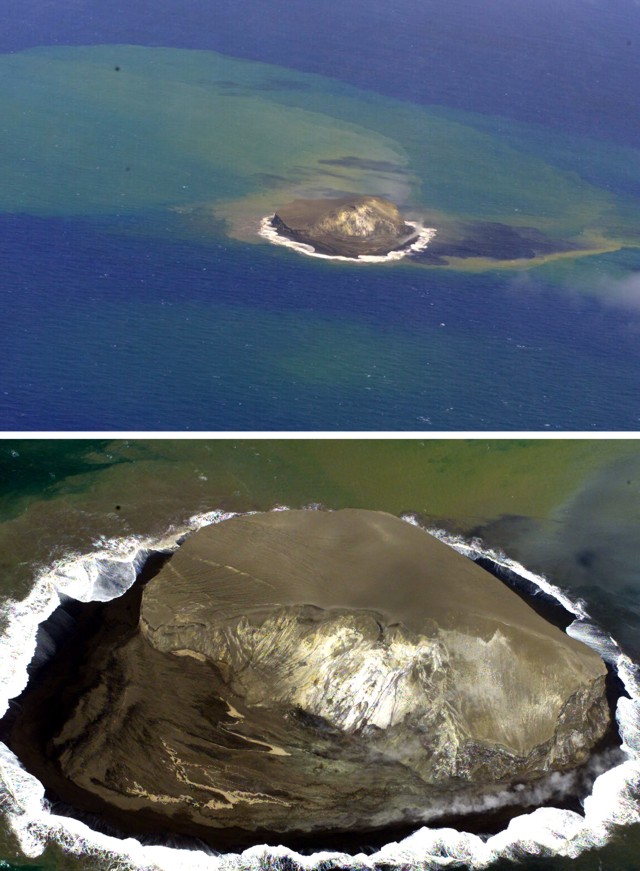
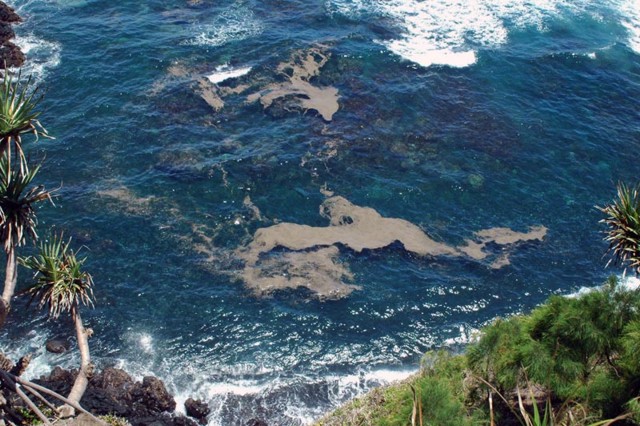
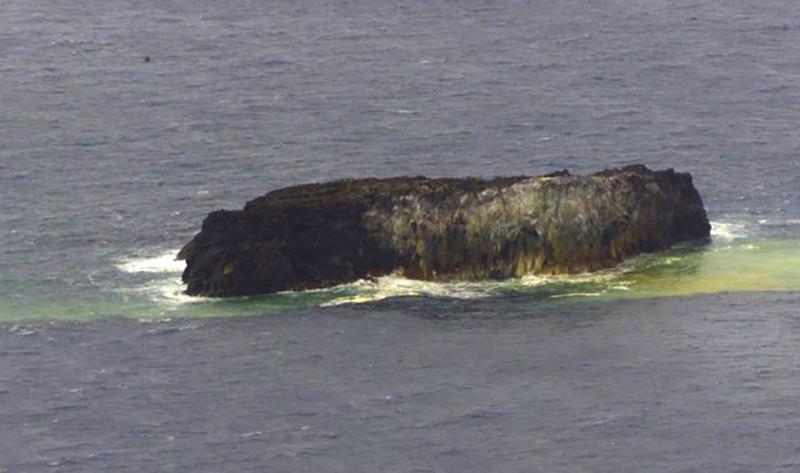
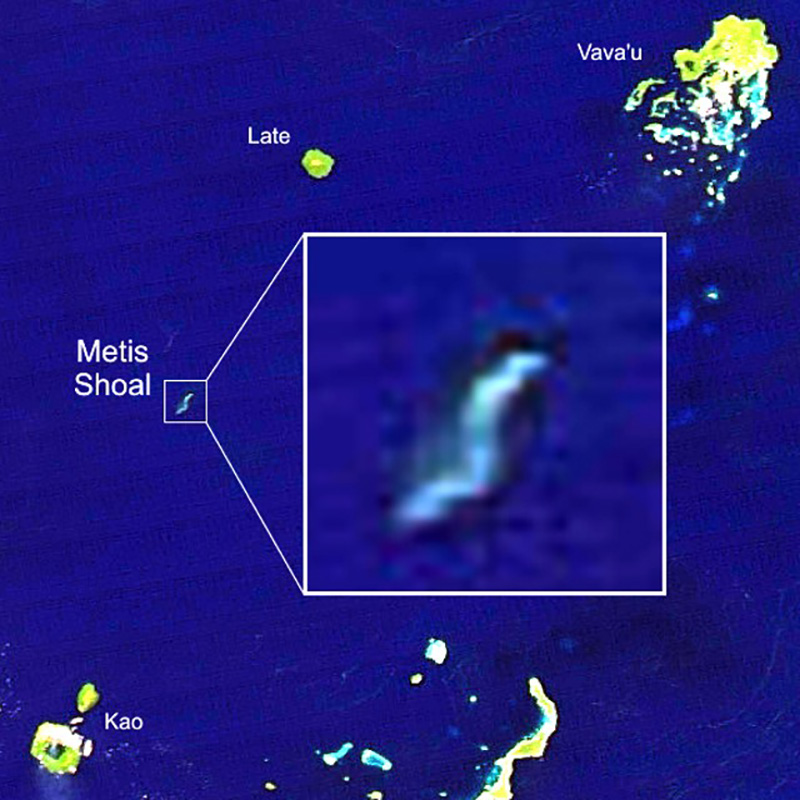
Home Reef is a submarine volcano located in the central Tonga islands between Lateiki (Metis Shoal) and Late Island. The first recorded eruption occurred in the mid-19th century, when an ephemeral island formed. An eruption in 1984 produced a 12-km-high eruption plume, a large volume of floating pumice, and an ephemeral island 500 x 1,500 m wide, with cliffs 30-50 m high that enclosed a water-filled crater. Another island-forming eruption in 2006 produced widespread pumice rafts that drifted as far as Australia; by 2008 the island had eroded below sea level. The previous eruption occurred during October 2022 and was characterized by a new island-forming eruption, lava effusion, ash plumes, discolored water, and gas-and-steam plumes (BGVN 47:11). This report covers discolored water plumes during November 2022 through April 2023 using satellite data.
Discolored plumes continued during the reporting period and were observed in true color satellite images on clear weather days. Satellite images show light green-yellow discolored water extending W on 8 and 28 November 2022 (figure 31), and SW on 18 November. Light green-yellow plumes extended W on 3 December, S on 13 December, SW on 18 December, and W and S on 23 December (figure 31). On 12 January 2023 discolored green-yellow plumes extended to the NE, E, SE, and N. The plume moved SE on 17 January and NW on 22 January. Faint discolored water in February was visible moving NE on 1 February. A discolored plume extended NW on 8 and 28 March and NW on 13 March (figure 31). During April, clear weather showed green-blue discolored plumes moving S on 2 April, W on 7 April, and NE and S on 12 April. A strong green-yellow discolored plume extended E and NE on 22 April for several kilometers (figure 31).
Geologic Background. Home Reef, a submarine volcano midway between Metis Shoal and Late Island in the central Tonga islands, was first reported active in the mid-19th century, when an ephemeral island formed. An eruption in 1984 produced a 12-km-high eruption plume, large amounts of floating pumice, and an ephemeral 500 x 1,500 m island, with cliffs 30-50 m high that enclosed a water-filled crater. In 2006 an island-forming eruption produced widespread dacitic pumice rafts that drifted as far as Australia. Another island was built during a September-October 2022 eruption.
Information Contacts: Copernicus Browser, Copernicus Data Space Ecosystem, European Space Agency (URL: https://dataspace.copernicus.eu/browser/).
Semisopochnoi (United States) — June 2023 Cite this Report
Semisopochnoi
United States
51.93°N, 179.58°E; summit elev. 1221 m
All times are local (unless otherwise noted)
Occasional explosions, ash deposits, and gas-and-steam plumes during December 2022-May 2023
Semisopochnoi is located in the western Aleutians, is 20-km-wide at sea level, and contains an 8-km-wide caldera. The three-peaked Mount Young (formerly Cerberus) was constructed within the caldera during the Holocene. Each of these peaks contains a summit crater; the lava flows on the N flank appear younger than those on the S side. The current eruption period began in early February 2021 and has more recently consisted of intermittent explosions and ash emissions (BGVN 47:12). This report updates activity during December 2022 through May 2023 using daily, weekly, and special reports from the Alaska Volcano Observatory (AVO). AVO monitors the volcano using local seismic and infrasound sensors, satellite data, web cameras, and remote infrasound and lightning networks.
Activity during most of December 2022 was relatively quiet; according to AVO no eruptive or explosive activity was observed since 7 November 2022. Intermittent tremor and occasional small earthquakes were observed in geophysical data. Continuous gas-and-steam emissions were observed from the N crater of Mount Young in webcam images on clear weather days (figure 25). On 24 December, there was a slight increase in earthquake activity and several small possible explosion signals were detected in infrasound data. Eruptive activity resumed on 27 December at the N crater of Mount Young; AVO issued a Volcano Activity Notice (VAN) that reported minor ash deposits on the flanks of Mount Young that extended as far as 1 km from the vent, according to webcam images taken during 27-28 December (figure 26). No ash plumes were observed in webcam or satellite imagery, but a persistent gas-and-steam plume that might have contained some ash rose to 1.5 km altitude. As a result, AVO raised the Aviation Color Code (ACC) to Orange (the second highest level on a four-color scale) and the Volcano Alert Level (VAL) to Watch (the second highest level on a four-level scale). Possible explosions were detected during 21 December 2022 through 1 January 2023 and seismic tremor was recorded during 30-31 December.
During January 2023 eruptive activity continued at the active N crater of Mount Young. Minor ash deposits were observed on the flanks, extending about 2 km SSW, based on webcam images from 1 and 3 January. A possible explosion occurred during 1-2 January based on elevated seismicity recorded on local seismometers and an infrasound signal recorded minutes later by an array at Adak. Though no ash plumes were observed in webcam or satellite imagery, a persistent gas-and-steam plume rose to 1.5 km altitude that might have carried minor traces of ash. Ash deposits were accompanied by periods of elevated seismicity and infrasound signals from the local geophysical network, which AVO reported were likely due to weak explosive activity. Low-level explosive activity was also detected during 2-3 January, with minor gas-and-steam emissions and a new ash deposit that was visible in webcam images. Low-level explosive activity was detected in geophysical data during 4-5 January, with elevated seismicity and infrasound signals observed on local stations. Volcanic tremor was detected during 7-9 January and very weak explosive activity was detected in seismic and infrasound data on 9 January. Weak seismic and infrasound signals were recorded on 17 January, which indicated minor explosive activity, but no ash emissions were observed in clear webcam images; a gas-and-steam plume continued to rise to 1.5 km altitude. During 29-30 January, ash deposits near the summit were observed on fresh snow, according to webcam images.
The active N cone at Mount Young continued to produce a gas-and-steam plume during February, but no ash emissions or explosive events were detected. Seismicity remained elevated with faint tremor during early February. Gas-and-steam emissions from the N crater were observed in clear webcam images on 11-13 and 16 February; no explosive activity was detected in seismic, infrasound, or satellite data. Seismicity has also decreased, with no significant seismic tremor observed since 25 January. Therefore, the ACC was lowered to Yellow (the second lowest level on a four-color scale) and the VAL was lowered to Advisory (the second lowest level on a four-color scale) on 22 February.
Gas-and-steam emissions persisted during March from the N cone of Mount Young, based on clear webcam images. A few brief episodes of weak tremor were detected in seismic data, although seismicity decreased over the month. A gas-and-steam plume detected in satellite data extended 150 km on 18 March. Low-level ash emissions from the N cone at Mount Young were observed in several webcam images during 18-19 March, in addition to small explosions and volcanic tremor. The ACC was raised to Orange and the VAL increased to Watch on 19 March. A small explosion was detected in seismic and infrasound data on 21 March.
Low-level unrest continued during April, although cloudy weather often obscured views of the summit; periods of seismic tremor and local earthquakes were recorded. During 3-4 April a gas-and-steam plume was visible traveling more than 200 km overnight; no ash was evident in the plume, according to AVO. A gas-and-steam plume was observed during 4-6 April that extended 400 km but did not seem to contain ash. Small explosions were detected in seismic and infrasound data on 5 April. Occasional clear webcam images showed continuing gas-and-steam emissions rose from Mount Young, but no ash deposits were observed on the snow. On 19 April small explosions and tremor were detected in seismic and infrasound data. A period of seismic tremor was detected during 22-25 April, with possible weak explosions on 25 April. Ash deposits were visible near the crater rim, but it was unclear if these deposits were recent or due to older deposits.
Occasional small earthquakes were recorded during May, but there were no signs of explosive activity seen in geophysical data. Gas-and-steam emissions continued from the N crater of Mount Young, based on webcam images, and seismicity remained slightly elevated. A new, light ash deposit was visible during the morning of 5 May on fresh snow on the NW flank of Mount Young. During 10 May periods of volcanic tremor were observed. The ACC was lowered to Yellow and the VAL to Advisory on 17 May due to no additional evidence of activity.
Geologic Background. Semisopochnoi, the largest subaerial volcano of the western Aleutians, is 20 km wide at sea level and contains an 8-km-wide caldera. It formed as a result of collapse of a low-angle, dominantly basaltic volcano following the eruption of a large volume of dacitic pumice. The high point of the island is Anvil Peak, a double-peaked late-Pleistocene cone that forms much of the island's northern part. The three-peaked Mount Cerberus (renamed Mount Young in 2023) was constructed within the caldera during the Holocene. Each of the peaks contains a summit crater; lava flows on the N flank appear younger than those on the south side. Other post-caldera volcanoes include the symmetrical Sugarloaf Peak SSE of the caldera and Lakeshore Cone, a small cinder cone at the edge of Fenner Lake in the NE part of the caldera. Most documented eruptions have originated from Young, although Coats (1950) considered that both Sugarloaf and Lakeshore Cone could have been recently active.
Information Contacts: Alaska Volcano Observatory (AVO), a cooperative program of a) U.S. Geological Survey, 4200 University Drive, Anchorage, AK 99508-4667 USA (URL: https://avo.alaska.edu/), b) Geophysical Institute, University of Alaska, PO Box 757320, Fairbanks, AK 99775-7320, USA, and c) Alaska Division of Geological & Geophysical Surveys, 794 University Ave., Suite 200, Fairbanks, AK 99709, USA (URL: http://dggs.alaska.gov/).
Ambae
Vanuatu
15.389°S, 167.835°E; summit elev. 1496 m
All times are local (unless otherwise noted)
New lava flow, ash plumes, and sulfur dioxide plumes during February-May 2023
Ambae, also known as Aoba, is a large basaltic shield volcano in Vanuatu. A broad pyroclastic cone containing three crater lakes (Manaro Ngoru, Voui, and Manaro Lakua) is located at the summit within the youngest of at least two nested calderas. Periodic phreatic and pyroclastic explosions have been reported since the 16th century. A large eruption more than 400 years ago resulted in a volcanic cone within the summit crater that is now filled by Lake Voui; the similarly sized Lake Manaro fills the western third of the caldera. The previous eruption ended in August 2022 that was characterized by gas-and-steam and ash emissions and explosions of wet tephra (BGVN 47:10). This report covers a new eruption during February through May 2023 that consisted of a new lava flow, ash plumes, and sulfur dioxide emissions, using information from the Vanuatu Meteorology and Geo-Hazards Department (VMGD) and satellite data.
During the reporting period, the Alert Level remained at a 2 (on a scale of 0-5), which has been in place since December 2021. Activity during October 2022 through March 2023 remained relatively low and mostly consisted of gas-and-steam emissions in Lake Voui. VMGD reported that at 1300 on 15 November a satellite image captured a strong amount of sulfur dioxide rising above the volcano (figure 99), and that seismicity slightly increased. The southern and northern part of the island reported a strong sulfur dioxide smell and heard explosions. On 20 February 2023 a gas-and-ash plume rose 1.3 km above the summit and drifted SSW, according to a webcam image (figure 100). Gas-and-steam and possibly ash emissions continued on 23 February and volcanic earthquakes were recorded by the seismic network.
During April, volcanic earthquakes and gas-and-steam and ash emissions were reported from the cone in Lake Voui. VMGD reported that activity increased during 5-7 April; high gas-and-steam and ash plumes were visible, accompanied by nighttime incandescence. According to a Wellington VAAC report, a low-level ash plume rose as high as 2.5 km above the summit and drifted W and SW on 5 April, based on satellite imagery. Reports in Saratamata stated that a dark ash plume drifted to the WSW, but no loud explosion was heard. Webcam images from 2100 showed incandescence above the crater and reflected in the clouds. According to an aerial survey, field observations, and satellite data, water was no longer present in the lake. A lava flow was reported effusing from the vent and traveling N into the dry Lake Voui, which lasted three days. The next morning at 0745 on 6 April a gas-and-steam and ash plume rose 5.4 km above the summit and drifted ESE, based on information from VMGD (figure 101). The Wellington VAAC also reported that light ashfall was observed on the island. Intermittent gas-and-steam and ash emissions were visible on 7 April, some of which rose to an estimated 3 km above the summit and drifted E. Webcam images during 0107-0730 on 7 April showed continuing ash emissions. A gas-and-steam and ash plume rose 695 m above the summit crater at 0730 on 19 April and drifted ESE, based on a webcam image (figure 102).
According to visual and infrared satellite data, water was visible in Lake Voui as late as 24 March 2023 (figure 103). The vent in the caldera showed a gas-and-steam plume drifted SE. On 3 April thermal activity was first detected, accompanied by a gas-and-ash plume that drifted W (figure 103). The lava flow moved N within the dry lake and was shown cooling by 8 April. By 23 April much of the water in the lake had returned. Occasional sulfur dioxide plumes were detected by the TROPOMI instrument on the Sentinel-5P satellite that exceeded 2 Dobson Units (DU) and drifted in different directions (figure 104).
Geologic Background. The island of Ambae, also known as Aoba, is a massive 2,500 km3 basaltic shield that is the most voluminous volcano of the New Hebrides archipelago. A pronounced NE-SW-trending rift zone with numerous scoria cones gives the 16 x 38 km island an elongated form. A broad pyroclastic cone containing three crater lakes (Manaro Ngoru, Voui, and Manaro Lakua) is located at the summit within the youngest of at least two nested calderas, the largest of which is 6 km in diameter. That large central edifice is also called Manaro Voui or Lombenben volcano. Post-caldera explosive eruptions formed the summit craters about 360 years ago. A tuff cone was constructed within Lake Voui (or Vui) about 60 years later. The latest known flank eruption, about 300 years ago, destroyed the population of the Nduindui area near the western coast.
Information Contacts: Geo-Hazards Division, Vanuatu Meteorology and Geo-Hazards Department (VMGD), Ministry of Climate Change Adaptation, Meteorology, Geo-Hazards, Energy, Environment and Disaster Management, Private Mail Bag 9054, Lini Highway, Port Vila, Vanuatu (URL: http://www.vmgd.gov.vu/, https://www.facebook.com/VanuatuGeohazardsObservatory/); Wellington Volcanic Ash Advisory Centre (VAAC), Meteorological Service of New Zealand Ltd (MetService), PO Box 722, Wellington, New Zealand (URL: http://www.metservice.com/vaac/, http://www.ssd.noaa.gov/VAAC/OTH/NZ/messages.html); MIROVA (Middle InfraRed Observation of Volcanic Activity), a collaborative project between the Universities of Turin and Florence (Italy) supported by the Centre for Volcanic Risk of the Italian Civil Protection Department (URL: http://www.mirovaweb.it/); Global Sulfur Dioxide Monitoring Page, Atmospheric Chemistry and Dynamics Laboratory, NASA Goddard Space Flight Center (NASA/GSFC), 8800 Greenbelt Road, Goddard, Maryland, USA (URL: https://so2.gsfc.nasa.gov/); Copernicus Browser, Copernicus Data Space Ecosystem, European Space Agency (URL: https://dataspace.copernicus.eu/browser/).
Ibu
Indonesia
1.488°N, 127.63°E; summit elev. 1325 m
All times are local (unless otherwise noted)
Daily ash explosions continue, along with thermal anomalies in the crater, October 2022-May 2023
Persistent eruptive activity since April 2008 at Ibu, a stratovolcano on Indonesian’s Halmahera Island, has consisted of daily explosive ash emissions and plumes, along with observations of thermal anomalies (BGVN 47:04). The current eruption continued during October 2022-May 2023, described below, based on advisories issued by the Pusat Vulkanologi dan Mitigasi Bencana Geologi (PVMBG, also known as Indonesian Center for Volcanology and Geological Hazard Mitigation, CVGHM), daily reports by MAGMA Indonesia (a PVMBG platform), and the Darwin Volcanic Ash Advisory Centre (VAAC), and various satellite data. The Alert Level during the reporting period remained at 2 (on a scale of 1-4), except raised briefly to 3 on 27 May, and the public was warned to stay at least 2 km away from the active crater and 3.5 km away on the N side of the volcano.
According to MAGMA Indonesia, during October 2022-May 2023, daily gray-and-white ash plumes of variable densities rose 200-1,000 m above the summit and drifted in multiple directions. On 30 October and 11 November, plumes rose a maximum of 2 km and 1.5 km above the summit, respectively (figures 42 and 43). According to the Darwin VAAC, discrete ash emissions on 13 November rose to 2.1 km altitude, or 800 m above the summit, and drifted W, and multiple ash emissions on 15 November rose 1.4 km above the summit and drifted NE. Occasional larger ash explosions through May 2023 prompted PVMBG to issue Volcano Observatory Notice for Aviation (VONA) alerts (table 6); the Aviation Color Code remained at Orange throughout this period.
Table 6. Volcano Observatory Notice for Aviation (VONA) ash plume alerts for Ibu issued by PVMBG during October 2022-May 2023. Maximum height above the summit was estimated by a ground observer. VONAs in January-May 2023 all described the ash plumes as dense.
| Date |
Time (local) |
Max height above summit |
Direction |
| 17 Oct 2022 |
0858 |
800 m |
SW |
| 18 Oct 2022 |
1425 |
800 m |
S |
| 19 Oct 2022 |
2017 |
600 m |
SW |
| 21 Oct 2022 |
0916 |
800 m |
NW |
| 16 Jan 2023 |
1959 |
600 m |
NE |
| 22 Jan 2023 |
0942 |
1,000 m |
E |
| 29 Jan 2023 |
2138 |
1,000 m |
E |
| 10 May 2023 |
0940 |
800 m |
NW |
| 10 May 2023 |
2035 |
600 m |
E |
| 21 May 2023 |
2021 |
600 m |
W |
| 21 May 2023 |
2140 |
1,000 m |
W |
| 29 May 2023 |
1342 |
800 m |
N |
| 31 May 2023 |
1011 |
1,000 m |
SW |
Sentinel-2 L1C satellite images throughout the reporting period show two, sometimes three persistent thermal anomalies in the summit crater, with the most prominent hotspot from the top of a cone within the crater. Clear views were more common during March-April 2023, when a vent and lava flows on the NE flank of the intra-crater cone could be distinguished (figure 44). White-to-grayish emissions were also observed during brief periods when weather clouds allowed clear views.
The MIROVA space-based volcano hotspot detection system recorded almost daily thermal anomalies throughout the reporting period, though cloud cover often interfered with detections. Data from imaging spectroradiometers aboard NASA’s Aqua and Terra satellites and processed using the MODVOLC algorithm (MODIS-MODVOLC) recorded hotspots on one day during October 2022 and December 2022, two days in April 2023, three days in November 2022 and May 2023, and four days in March 2023.
Geologic Background. The truncated summit of Gunung Ibu stratovolcano along the NW coast of Halmahera Island has large nested summit craters. The inner crater, 1 km wide and 400 m deep, has contained several small crater lakes. The 1.2-km-wide outer crater is breached on the N, creating a steep-walled valley. A large cone grew ENE of the summit, and a smaller one to the WSW has fed a lava flow down the W flank. A group of maars is located below the N and W flanks. The first observed and recorded eruption was a small explosion from the summit crater in 1911. Eruptive activity began again in December 1998, producing a lava dome that eventually covered much of the floor of the inner summit crater along with ongoing explosive ash emissions.
Information Contacts: Pusat Vulkanologi dan Mitigasi Bencana Geologi (PVMBG, also known as Indonesian Center for Volcanology and Geological Hazard Mitigation, CVGHM), Jalan Diponegoro 57, Bandung 40122, Indonesia (URL: http://www.vsi.esdm.go.id/); MAGMA Indonesia (Multiplatform Application for Geohazard Mitigation and Assessment in Indonesia), Kementerian Energi dan Sumber Daya Mineral (URL: https://magma.esdm.go.id/v1); Copernicus Browser, Copernicus Data Space Ecosystem, European Space Agency (URL: https://dataspace.copernicus.eu/browser/); MIROVA (Middle InfraRed Observation of Volcanic Activity), a collaborative project between the Universities of Turin and Florence (Italy) supported by the Centre for Volcanic Risk of the Italian Civil Protection Department (URL: http://www.mirovaweb.it/); Hawai'i Institute of Geophysics and Planetology (HIGP) - MODVOLC Thermal Alerts System, School of Ocean and Earth Science and Technology (SOEST), Univ. of Hawai'i, 2525 Correa Road, Honolulu, HI 96822, USA (URL: http://modis.higp.hawaii.edu/).
Dukono
Indonesia
1.6992°N, 127.8783°E; summit elev. 1273 m
All times are local (unless otherwise noted)
Continuing ash emissions, SO2 plumes, and thermal signals during October 2022-May 2023
Dukono, a remote volcano on Indonesia’s Halmahera Island, has been erupting continuously since 1933, with frequent ash explosions and sulfur dioxide plumes (BGVN 46:11, 47:10). This activity continued during October 2022 through May 2023, based on reports from the Pusat Vulkanologi dan Mitigasi Bencana Geologi (PVMBG; also known as Indonesian Center for Volcanology and Geological Hazard Mitigation, CVGHM), the Darwin Volcanic Ash Advisory Centre (VAAC), and satellite data. During this period, the Alert Level remained at 2 (on a scale of 1-4) and the public was warned to remain outside of the 2-km exclusion zone. The highest reported plume of the period reached 9.4 km above the summit on 14 November 2022.
According to MAGMA Indonesia (a platform developed by PVMBG), white, gray, or dark plumes of variable densities were observed almost every day during the reporting period, except when fog obscured the volcano (figure 33). Plumes generally rose 25-450 m above the summit, but rose as high as 700-800 m on several days, somewhat lower than the maximum heights reached earlier in 2022 when plumes reached as high as 1 km. However, the Darwin VAAC reported that on 14 November 2022, a discrete ash plume rose 9.4 km above the summit (10.7 km altitude), accompanied by a strong hotspot and a sulfur dioxide signal observed in satellite imagery; a continuous ash plume that day and through the 15th rose to 2.1-2.4 km altitude and drifted NE.
Sentinel-2 images were obscured by weather clouds almost every viewing day during the reporting period. However, the few reasonably clear images showed a hotspot and white or gray emissions and plumes. Strong SO2 plumes from Dukono were present on many days during October 2022-May 2023, as detected using the TROPOMI instrument on the Sentinel-5P satellite (figure 34).
Geologic Background. Reports from this remote volcano in northernmost Halmahera are rare, but Dukono has been one of Indonesia's most active volcanoes. More-or-less continuous explosive eruptions, sometimes accompanied by lava flows, have occurred since 1933. During a major eruption in 1550 CE, a lava flow filled in the strait between Halmahera and the N-flank Gunung Mamuya cone. This complex volcano presents a broad, low profile with multiple summit peaks and overlapping craters. Malupang Wariang, 1 km SW of the summit crater complex, contains a 700 x 570 m crater that has also been active during historical time.
Information Contacts: Pusat Vulkanologi dan Mitigasi Bencana Geologi (PVMBG, also known as Indonesian Center for Volcanology and Geological Hazard Mitigation, CVGHM), Jalan Diponegoro 57, Bandung 40122, Indonesia (URL: http://www.vsi.esdm.go.id/); MAGMA Indonesia (Multiplatform Application for Geohazard Mitigation and Assessment in Indonesia), Kementerian Energi dan Sumber Daya Mineral (URL: https://magma.esdm.go.id/v1); Darwin Volcanic Ash Advisory Centre (VAAC), Bureau of Meteorology, Northern Territory Regional Office, PO Box 40050, Casuarina, NT 0811, Australia (URL: http://www.bom.gov.au/info/vaac/); NASA Global Sulfur Dioxide Monitoring Page, Atmospheric Chemistry and Dynamics Laboratory, NASA Goddard Space Flight Center (NASA/GSFC), 8800 Greenbelt Road, Goddard, Maryland, USA (URL: https://so2.gsfc.nasa.gov/); Sentinel Hub Playground (URL: https://www.sentinel-hub.com/explore/sentinel-playground).
Sabancaya
Peru
15.787°S, 71.857°W; summit elev. 5960 m
All times are local (unless otherwise noted)
Explosions, gas-and-ash plumes, and thermal activity persist during November 2022-April 2023
Sabancaya is located in Peru, NE of Ampato and SE of Hualca Hualca. Eruptions date back to 1750 and have been characterized by explosions, phreatic activity, ash plumes, and ashfall. The current eruption period began in November 2016 and has more recently consisted of daily explosions, gas-and-ash plumes, and thermal activity (BGVN 47:11). This report updates activity during November 2022 through April 2023 using information from Instituto Geophysico del Peru (IGP) that use weekly activity reports and various satellite data.
Intermittent low-to-moderate power thermal anomalies were reported by the MIROVA project during November 2022 through April 2023 (figure 119). There were few short gaps in thermal activity during mid-December 2022, late December-to-early January 2023, late January to mid-February, and late February. According to data recorded by the MODVOLC thermal algorithm, there were a total of eight thermal hotspots: three in November 2022, three in February 2023, one in March, and one in April. On clear weather days, some of this thermal anomaly was visible in infrared satellite imagery showing the active lava dome in the summit crater (figure 120). Almost daily moderate-to-strong sulfur dioxide plumes were recorded during the reporting period by the TROPOMI instrument on the Sentinel-5P satellite (figure 121). Many of these plumes exceeded 2 Dobson Units (DU) and drifted in multiple directions.
IGP reported that moderate activity during November and December 2022 continued; during November, an average number of explosions were reported each week: 30, 33, 36, and 35, and during December, it was 32, 40, 47, 52, and 67. Gas-and-ash plumes in November rose 3-3.5 km above the summit and drifted E, NE, SE, S, N, W, and SW. During December the gas-and-ash plumes rose 2-4 km above the summit and drifted in different directions. There were 1,259 volcanic earthquakes recorded during November and 1,693 during December. Seismicity also included volcano-tectonic-type events that indicate rock fracturing events. Slight inflation was observed in the N part of the volcano near Hualca Hualca (4 km N). Thermal activity was frequently reported in the crater at the active lava dome (figure 120).
Explosive activity continued during January and February 2023. The average number of explosions were reported each week during January (51, 50, 60, and 59) and February (43, 54, 51, and 50). Gas-and-ash plumes rose 1.6-2.9 km above the summit and drifted NW, SW, and W during January and rose 1.4-2.8 above the summit and drifted W, SW, E, SE, N, S, NW, and NE during February. IGP also detected 1,881 volcanic earthquakes during January and 1,661 during February. VT-type earthquakes were also reported. Minor inflation persisted near Hualca Hualca. Satellite imagery showed continuous thermal activity in the crater at the lava dome (figure 120).
During March, the average number of explosions each week was 46, 48, 31, 35, and 22 and during April, it was 29, 41, 31, and 27. Accompanying gas-and-ash plumes rose 1.7-2.6 km above the summit crater and drifted W, SW, NW, S, and SE during March. According to a Buenos Aires Volcano Ash Advisory Center (VAAC) notice, on 22 March at 1800 through 23 March an ash plume rose to 7 km altitude and drifted NW. By 0430 an ash plume rose to 7.6 km altitude and drifted W. On 24 and 26 March continuous ash emissions rose to 7.3 km altitude and drifted SW and on 28 March ash emissions rose to 7.6 km altitude. During April, gas-and-ash plumes rose 1.6-2.5 km above the summit and drifted W, SW, S, NW, NE, and E. Frequent volcanic earthquakes were recorded, with 1,828 in March and 1,077 in April, in addition to VT-type events. Thermal activity continued to be reported in the summit crater at the lava dome (figure 120).
Geologic Background. Sabancaya, located in the saddle NE of Ampato and SE of Hualca Hualca volcanoes, is the youngest of these volcanic centers and the only one to have erupted in historical time. The oldest of the three, Nevado Hualca Hualca, is of probable late-Pliocene to early Pleistocene age. The name Sabancaya (meaning "tongue of fire" in the Quechua language) first appeared in records in 1595 CE, suggesting activity prior to that date. Holocene activity has consisted of Plinian eruptions followed by emission of voluminous andesitic and dacitic lava flows, which form an extensive apron around the volcano on all sides but the south. Records of historical eruptions date back to 1750.
Information Contacts: Instituto Geofisico del Peru (IGP), Centro Vulcanológico Nacional (CENVUL), Calle Badajoz N° 169 Urb. Mayorazgo IV Etapa, Ate, Lima 15012, Perú (URL: https://www.igp.gob.pe/servicios/centro-vulcanologico-nacional/inicio); Buenos Aires Volcanic Ash Advisory Center (VAAC), Servicio Meteorológico Nacional-Fuerza Aérea Argentina, 25 de mayo 658, Buenos Aires, Argentina (URL: http://www.smn.gov.ar/vaac/buenosaires/inicio.php); MIROVA (Middle InfraRed Observation of Volcanic Activity), a collaborative project between the Universities of Turin and Florence (Italy) supported by the Centre for Volcanic Risk of the Italian Civil Protection Department (URL: http://www.mirovaweb.it/); Hawai'i Institute of Geophysics and Planetology (HIGP) - MODVOLC Thermal Alerts System, School of Ocean and Earth Science and Technology (SOEST), Univ. of Hawai'i, 2525 Correa Road, Honolulu, HI 96822, USA (URL: http://modis.higp.hawaii.edu/); NASA Global Sulfur Dioxide Monitoring Page, Atmospheric Chemistry and Dynamics Laboratory, NASA Goddard Space Flight Center (NASA/GSFC), 8800 Greenbelt Road, Goddard MD 20771, USA (URL: https://so2.gsfc.nasa.gov/); Copernicus Browser, Copernicus Data Space Ecosystem, European Space Agency (URL: https://dataspace.copernicus.eu/browser/).
Sheveluch
Russia
56.653°N, 161.36°E; summit elev. 3283 m
All times are local (unless otherwise noted)
Significant explosions destroyed part of the lava-dome complex during April 2023
Sheveluch (also spelled Shiveluch) in Kamchatka, has had at least 60 large eruptions during the last 10,000 years. The summit is truncated by a broad 9-km-wide caldera that is breached to the S, and many lava domes occur on the outer flanks. The lava dome complex was constructed within the large open caldera. Frequent collapses of the dome complex have produced debris avalanches; the resulting deposits cover much of the caldera floor. A major south-flank collapse during a 1964 Plinian explosion produced a scarp in which a “Young Sheveluch” dome began to form in 1980. Repeated episodes of dome formation and destruction since then have produced major and minor ash plumes, pyroclastic flows, block-and-ash flows, and “whaleback domes” of spine-like extrusions in 1993 and 2020 (BGVN 45:11). The current eruption period began in August 1999 and has more recently consisted of lava dome growth, explosions, ash plumes, and avalanches (BGVN 48:01). This report covers a significant explosive eruption during early-to-mid-April 2023 that generated a 20 km altitude ash plume, produced a strong sulfur dioxide plume, and destroyed part of the lava-dome complex; activity described during January through April 2023 use information primarily from the Kamchatka Volcanic Eruptions Response Team (KVERT) and various satellite data.
Satellite data. Activity during the majority of this reporting period was characterized by continued lava dome growth, strong fumarole activity, explosions, and hot avalanches. According to the MODVOLC Thermal Alerts System, 140 hotspots were detected through the reporting period, with 33 recorded in January 2023, 29 in February, 44 in March, and 34 in April. Frequent strong thermal activity was recorded during January 2023 through April, according to the MIROVA (Middle InfraRed Observation of Volcanic Activity) graph and resulted from the continuously growing lava dome (figure 94). A slightly stronger pulse in thermal activity was detected in early-to-mid-April, which represented the significant eruption that destroyed part of the lava-dome complex. Thermal anomalies were also visible in infrared satellite imagery at the summit crater (figure 95).
During January 2023 KVERT reported continued growth of the lava dome, accompanied by strong fumarolic activity, incandescence from the lava dome, explosions, ash plumes, and avalanches. Satellite data showed a daily thermal anomaly over the volcano. Video data showed ash plumes associated with collapses at the dome that generated avalanches that in turn produced ash plumes rising to 3.5 km altitude and drifting 40 km W on 4 January and rising to 7-7.5 km altitude and drifting 15 km SW on 5 January. A gas-and-steam plume containing some ash that was associated with avalanches rose to 5-6 km altitude and extended 52-92 km W on 7 January. Explosions that same day produced ash plumes that rose to 7-7.5 km altitude and drifted 10 km W. According to a Volcano Observatory Notice for Aviation (VONA) issued at 1344 on 19 January, explosions produced an ash cloud that was 15 x 25 km in size and rose to 9.6-10 km altitude, drifting 21-25 km W; as a result, the Aviation Color Code (ACC) was raised to Red (the highest level on a four-color scale). Another VONA issued at 1635 reported that no more ash plumes were observed, and the ACC was lowered to Orange (the second highest level on a four-color scale). On 22 January an ash plume from collapses and avalanches rose to 5 km altitude and drifted 25 km NE and SW; ash plumes associated with collapses extended 70 km NE on 27 and 31 January.
Lava dome growth, fumarolic activity, dome incandescence, and occasional explosions and avalanches continued during February and March. A daily thermal anomaly was visible in satellite data. Explosions on 1 February generated ash plumes that rose to 6.3-6.5 km altitude and extended 15 km NE. Video data showed an ash cloud from avalanches rising to 5.5 km altitude and drifting 5 km SE on 2 February. Satellite data showed gas-and-steam plumes containing some ash rose to 5-5.5 km altitude and drifted 68-110 km ENE and NE on 6 February, to 4.5-5 km altitude and drifted 35 km WNW on 22 February, and to 3.7-4 km altitude and drifted 47 km NE on 28 February. Scientists from the Kamchatka Volcanological Station (KVS) went on a field excursion on 25 February to document the growing lava dome, and although it was cloudy most of the day, nighttime incandescence was visible. Satellite data showed an ash plume extending up to 118 km E during 4-5 March. Video data from 1150 showed an ash cloud from avalanches rose to 3.7-5.5 km altitude and drifted 5-10 km ENE and E on 5 March. On 11 March an ash plume drifted 62 km E. On 27 March ash plumes rose to 3.5 km altitude and drifted 100 km E. Avalanches and constant incandescence at the lava dome was focused on the E and NE slopes on 28 March. A gas-and-steam plume containing some ash rose to 3.5 km altitude and moved 40 km E on 29 March. Ash plumes on 30 March rose to 3.5-3.7 km altitude and drifted 70 km NE.
Similar activity continued during April, with lava dome growth, strong fumarolic activity, incandescence in the dome, occasional explosions, and avalanches. A thermal anomaly persisted throughout the month. During 1-4 April weak ash plumes rose to 2.5-3 km altitude and extended 13-65 km SE and E.
Activity during 11 April 2023. The Institute of Volcanology and Seismology, Far Eastern Branch, Russian Academy of Sciences (IVS FEB RAS) reported a significant increase in seismicity around 0054 on 11 April, as reported by strong explosions detected on 11 April beginning at 0110 that sent ash plumes up to 7-10 km altitude and extended 100-435 km W, WNW, NNW, WSW, and SW. According to a Tokyo VAAC report the ash plume rose to 15.8 km altitude. By 0158 the plume extended over a 75 x 100 km area. According to an IVS FEB RAS report, the eruptive column was not vertical: the initial plume at 0120 on 11 April deviated to the NNE, at 0000 on 12 April, it drifted NW, and by 1900 it drifted SW. KVS reported that significant pulses of activity occurred at around 0200, 0320, and then a stronger phase around 0600. Levin Dmitry took a video from near Békés (3 km away) at around 0600 showing a rising plume; he also reported that a pyroclastic flow traveled across the road behind him as he left the area. According to IVS FEB RAS, the pyroclastic flow traveled several kilometers SSE, stopping a few hundred meters from a bridge on the road between Klyuchi and Petropavlovsk-Kamchatsky.
Ashfall was first observed in Klyuchi (45 km SW) at 0630, and a large, black ash plume blocked light by 0700. At 0729 KVERT issued a Volcano Observatory Notice for Aviation (VONA) raising the Aviation Color Code to Red (the highest level on a four-color scale). It also stated that a large ash plume had risen to 10 km altitude and drifted 100 km W. Near-constant lightning strikes were reported in the plume and sounds like thunderclaps were heard until about 1000. According to IVS FEB RAS the cloud was 200 km long and 76 km wide by 0830, and was spreading W at altitudes of 6-12 km. In the Klyuchi Village, the layer of both ash and snow reached 8.5 cm (figure 96); ashfall was also reported in Kozyrevsk (112 km SW) at 0930, Mayskoye, Anavgay, Atlasovo, Lazo, and Esso. Residents in Klyuchi reported continued darkness and ashfall at 1100. In some areas, ashfall was 6 cm deep and some residents reported dirty water coming from their plumbing. According to IVS FEB RAS, an ash cloud at 1150 rose to 5-20 km altitude and was 400 km long and 250 km wide, extending W. A VONA issued at 1155 reported that ash had risen to 10 km and drifted 340 km NNW and 240 km WSW. According to Simon Carn (Michigan Technological University), about 0.2 Tg of sulfur dioxide in the plume was measured in a satellite image from the TROPOMI instrument on the Sentinel-5P satellite acquired at 1343 that covered an area of about 189,000 km2 (figure 97). Satellite data at 1748 showed an ash plume that rose to 8 km altitude and drifted 430 km WSW and S, according to a VONA.
Activity during 12-15 April 2023. On 12 April at 0730 satellite images showed ash plumes rose to 7-8 km altitude and extended 600 km SW, 1,050 km ESE, and 1,300-3,000 km E. By 1710 that day, the explosions weakened. According to news sources, the ash-and-gas plumes drifted E toward the Aleutian Islands and reached the Gulf of Alaska by 13 April, causing flight disruptions. More than 100 flights involving Alaska airspace were cancelled due to the plume. Satellite data showed ash plumes rising to 4-5.5 km altitude and drifted 400-415 km SE and ESE on 13 April. KVS volcanologists observed the pyroclastic flow deposits and noted that steam rose from downed, smoldering trees. They also noted that the deposits were thin with very few large fragments, which differed from previous flows. The ash clouds traveled across the Pacific Ocean. Flight cancellations were also reported in NW Canada (British Columbia) during 13-14 April. During 14-15 April ash plumes rose to 6 km altitude and drifted 700 km NW.
Alaskan flight schedules were mostly back to normal by 15 April, with only minor delays and far less cancellations; a few cancellations continued to be reported in Canada. Clear weather on 15 April showed that most of the previous lava-dome complex was gone and a new crater roughly 1 km in diameter was observed (figure 98); gas-and-steam emissions were rising from this crater. Evidence suggested that there had been a directed blast to the SE, and pyroclastic flows traveled more than 20 km. An ash plume rose to 4.5-5.2 km altitude and drifted 93-870 km NW on 15 April.
Activity during 16-30 April 2023. Resuspended ash was lifted by the wind from the slopes and rose to 4 km altitude and drifted 224 km NW on 17 April. KVERT reported a plume of resuspended ash from the activity during 10-13 April on 19 April that rose to 3.5-4 km altitude and drifted 146-204 km WNW. During 21-22 April a plume stretched over the Scandinavian Peninsula. A gas-and-steam plume containing some ash rose to 3-3.5 km altitude and drifted 60 km SE on 30 April. A possible new lava dome was visible on the W slope of the volcano on 29-30 April (figure 99); satellite data showed two thermal anomalies, a bright one over the existing lava dome and a weaker one over the possible new one.
References. Girina, O., Loupian, E., Horvath, A., Melnikov, D., Manevich, A., Nuzhdaev, A., Bril, A., Ozerov, A., Kramareva, L., Sorokin, A., 2023, Analysis of the development of the paroxysmal eruption of Sheveluch volcano on April 10–13, 2023, based on data from various satellite systems, ??????????? ???????? ??? ?? ???????, 20(2).
Geologic Background. The high, isolated massif of Sheveluch volcano (also spelled Shiveluch) rises above the lowlands NNE of the Kliuchevskaya volcano group. The 1,300 km3 andesitic volcano is one of Kamchatka's largest and most active volcanic structures, with at least 60 large eruptions during the Holocene. The summit of roughly 65,000-year-old Stary Shiveluch is truncated by a broad 9-km-wide late-Pleistocene caldera breached to the south. Many lava domes occur on its outer flanks. The Molodoy Shiveluch lava dome complex was constructed during the Holocene within the large open caldera; Holocene lava dome extrusion also took place on the flanks of Stary Shiveluch. Widespread tephra layers from these eruptions have provided valuable time markers for dating volcanic events in Kamchatka. Frequent collapses of dome complexes, most recently in 1964, have produced debris avalanches whose deposits cover much of the floor of the breached caldera.
Information Contacts: Kamchatka Volcanic Eruptions Response Team (KVERT), Far Eastern Branch, Russian Academy of Sciences, 9 Piip Blvd., Petropavlovsk-Kamchatsky, 683006, Russia (URL: http://www.kscnet.ru/ivs/kvert/); Institute of Volcanology and Seismology, Far Eastern Branch, Russian Academy of Sciences (IVS FEB RAS), 9 Piip Blvd., Petropavlovsk-Kamchatsky 683006, Russia (URL: http://www.kscnet.ru/ivs/eng/); Kamchatka Volcanological Station, Kamchatka Branch of Geophysical Survey, (KB GS RAS), Klyuchi, Kamchatka Krai, Russia (URL: http://volkstat.ru/); Hawai'i Institute of Geophysics and Planetology (HIGP) - MODVOLC Thermal Alerts System, School of Ocean and Earth Science and Technology (SOEST), Univ. of Hawai'i, 2525 Correa Road, Honolulu, HI 96822, USA (URL: http://modis.higp.hawaii.edu/); MIROVA (Middle InfraRed Observation of Volcanic Activity), a collaborative project between the Universities of Turin and Florence (Italy) supported by the Centre for Volcanic Risk of the Italian Civil Protection Department (URL: http://www.mirovaweb.it/); Copernicus Browser, Copernicus Data Space Ecosystem, European Space Agency (URL: https://dataspace.copernicus.eu/browser/); Kam 24 News Agency, 683032, Kamchatka Territory, Petropavlovsk-Kamchatsky, Vysotnaya St., 2A (URL: https://kam24.ru/news/main/20230411/96657.html#.Cj5Jrky6.dpuf); Simon Carn, Geological and Mining Engineering and Sciences, Michigan Technological University, 1400 Townsend Drive, Houghton, MI 49931, USA (URL: http://www.volcarno.com/, Twitter: @simoncarn).
Bezymianny
Russia
55.972°N, 160.595°E; summit elev. 2882 m
All times are local (unless otherwise noted)
Explosions, ash plumes, lava flows, and avalanches during November 2022-April 2023
Bezymianny is located on the Kamchatka Peninsula of Russia as part of the Klyuchevskoy volcano group. Historic eruptions began in 1955 and have been characterized by dome growth, explosions, pyroclastic flows, ash plumes, and ashfall. During the 1955-56 eruption a large open crater was formed by collapse of the summit and an associated lateral blast. Subsequent episodic but ongoing lava-dome growth, accompanied by intermittent explosive activity and pyroclastic flows, has largely filled the 1956 crater. The current eruption period began in December 2016 and more recent activity has consisted of strong explosions, ash plumes, and thermal activity (BGVN 47:11). This report covers activity during November 2022 through April 2023, based on weekly and daily reports from the Kamchatka Volcano Eruptions Response Team (KVERT) and satellite data.
Activity during November and March 2023 was relatively low and mostly consisted of gas-and-steam emissions, occasional small collapses that generated avalanches along the lava dome slopes, and a persistent thermal anomaly over the volcano that was observed in satellite data on clear weather days. According to the Tokyo VAAC and KVERT, an explosion produced an ash plume that rose to 6 km altitude and drifted 25 km NE at 1825 on 29 March.
Gas-and-steam emissions, collapses generating avalanches, and thermal activity continued during April. According to two Volcano Observatory Notice for Aviation (VONA) issued on 2 and 6 April (local time) ash plumes rose to 3 km and 3.5-3.8 km altitude and drifted 35 km E and 140 km E, respectively. Satellite data from KVERT showed weak ash plumes extending up to 550 km E on 2 and 5-6 April.
A VONA issued at 0843 on 7 April described an ash plume that rose to 4.5-5 km altitude and drifted 250 km ESE. Later that day at 1326 satellite data showed an ash plume that rose to 5.5-6 km altitude and drifted 150 km ESE. A satellite image from 1600 showed an ash plume extending as far as 230 km ESE; KVERT noted that ash emissions were intensifying, likely due to avalanches from the growing lava dome. The Aviation Color Code (ACC) was raised to Red (the highest level on a four-color scale). At 1520 satellite data showed an ash plume rising to 5-5.5 km altitude and drifting 230 km ESE. That same day, Kamchatka Volcanological Station (KVS) volcanologists traveled to Ambon to collect ash; they reported that a notable eruption began at 1730, and within 20 minutes a large ash plume rose to 10 km altitude and drifted NW. KVERT reported that the strong explosive phase began at 1738. Video and satellite data taken at 1738 showed an ash plume that rose to 10-12 km altitude and drifted up to 2,800 km SE and E. Explosions were clearly audible 20 km away for 90 minutes, according to KVS. Significant amounts of ash fell at the Apakhonchich station, which turned the snow gray; ash continued to fall until the morning of 8 April. In a VONA issued at 0906 on 8 April, KVERT stated that the explosive eruption had ended; ash plumes had drifted 2,000 km E. The ACC was lowered to Orange (the third highest level on a four-color scale). The KVS team saw a lava flow on the active dome once the conditions were clear that same day (figure 53). On 20 April lava dome extrusion was reported; lava flows were noted on the flanks of the dome, and according to KVERT satellite data, a thermal anomaly was observed in the area. The ACC was lowered to Yellow (the second lowest on a four-color scale).
Satellite data showed an increase in thermal activity beginning in early April 2023. A total of 31 thermal hotspots were detected by the MODVOLC thermal algorithm on 4, 5, 7, and 12 April 2023. The elevated thermal activity resulted from an increase in explosive activity and the start of an active lava flow. The MIROVA (Middle InfraRed Observation of Volcanic Activity) volcano hotspot detection system based on the analysis of MODIS data also showed a pulse in thermal activity during the same time (figure 54). Infrared satellite imagery captured a continuous thermal anomaly at the summit crater, often accompanied by white gas-and-steam emissions (figure 55). On 4 April 2023 an active lava flow was observed descending the SE flank.
Geologic Background. The modern Bezymianny, much smaller than its massive neighbors Kamen and Kliuchevskoi on the Kamchatka Peninsula, was formed about 4,700 years ago over a late-Pleistocene lava-dome complex and an edifice built about 11,000-7,000 years ago. Three periods of intensified activity have occurred during the past 3,000 years. The latest period, which was preceded by a 1,000-year quiescence, began with the dramatic 1955-56 eruption. This eruption, similar to that of St. Helens in 1980, produced a large open crater that was formed by collapse of the summit and an associated lateral blast. Subsequent episodic but ongoing lava-dome growth, accompanied by intermittent explosive activity and pyroclastic flows, has largely filled the 1956 crater.
Information Contacts: Kamchatka Volcanic Eruptions Response Team (KVERT), Far Eastern Branch, Russian Academy of Sciences, 9 Piip Blvd., Petropavlovsk-Kamchatsky, 683006, Russia (URL: http://www.kscnet.ru/ivs/kvert/); Kamchatka Volcanological Station, Kamchatka Branch of Geophysical Survey, (KB GS RAS), Klyuchi, Kamchatka Krai, Russia (URL: http://volkstat.ru/); Hawai'i Institute of Geophysics and Planetology (HIGP) - MODVOLC Thermal Alerts System, School of Ocean and Earth Science and Technology (SOEST), Univ. of Hawai'i, 2525 Correa Road, Honolulu, HI 96822, USA (URL: http://modis.higp.hawaii.edu/); MIROVA (Middle InfraRed Observation of Volcanic Activity), a collaborative project between the Universities of Turin and Florence (Italy) supported by the Centre for Volcanic Risk of the Italian Civil Protection Department (URL: http://www.mirovaweb.it/); Copernicus Browser, Copernicus Data Space Ecosystem, European Space Agency (URL: https://dataspace.copernicus.eu/browser/).
Chikurachki
Russia
50.324°N, 155.461°E; summit elev. 1781 m
All times are local (unless otherwise noted)
New explosive eruption during late January-early February 2023
Chikurachki, located on Paramushir Island in the northern Kuriles, has had Plinian eruptions during the Holocene. Lava flows have reached the sea and formed capes on the NW coast; several young lava flows are also present on the E flank beneath a scoria deposit. Reported eruptions date back to 1690, with the most recent eruption period occurring during January through October 2022, characterized by occasional explosions, ash plumes, and thermal activity (BGVN 47:11). This report covers a new eruptive period during January through February 2023 that consisted of ash explosions and ash plumes, based on information from the Kamchatka Volcanic Eruptions Response Team (KVERT) and satellite data.
According to reports from KVERT, an explosive eruption began around 0630 on 29 January. Explosions generated ash plumes that rose to 3-3.5 km altitude and drifted 6-75 km SE and E, based on satellite data. As a result, the Aviation Color Code (ACC) was raised to Orange (the second highest level on a four-color scale). At 1406 and 1720 ash plumes were identified in satellite images that rose to 4.3 km altitude and extended 70 km E. By 2320 the ash plume had dissipated. A thermal anomaly was visible at the volcano on 31 January, according to a satellite image, and an ash plume was observed drifting 66 km NE.
Occasional explosions and ash plumes continued during early February. At 0850 on 1 February an ash plume rose to 3.5 km altitude and drifted 35 km NE. Satellite data showed an ash plume that rose to 3.2-3.5 km altitude and drifted 50 km NE at 1222 later that day (figure 22). A thermal anomaly was detected over the volcano during 5-6 February and ash plumes drifted as far as 125 km SE, E, and NE. Explosive events were reported at 0330 on 6 February that produced ash plumes rising to 4-4.5 km altitude and drifting 72-90 km N, NE, and ENE. KVERT noted that the last gas-and steam plume that contained some ash was observed on 8 February and drifted 55 km NE before the explosive eruption ended. The ACC was lowered to Yellow and then Green (the lowest level on a four-color scale) on 18 February.
Geologic Background. Chikurachki, the highest volcano on Paramushir Island in the northern Kuriles, is a relatively small cone constructed on a high Pleistocene edifice. Oxidized basaltic-to-andesitic scoria deposits covering the upper part of the young cone give it a distinctive red color. Frequent basaltic Plinian eruptions have occurred during the Holocene. Lava flows have reached the sea and formed capes on the NW coast; several young lava flows are also present on the E flank beneath a scoria deposit. The Tatarinov group of six volcanic centers is located immediately to the south, and the Lomonosov cinder cone group, the source of an early Holocene lava flow that reached the saddle between it and Fuss Peak to the west, lies at the southern end of the N-S-trending Chikurachki-Tatarinov complex. In contrast to the frequently active Chikurachki, the Tatarinov centers are extensively modified by erosion and have a more complex structure. Tephrochronology gives evidence of an eruption around 1690 CE from Tatarinov, although its southern cone contains a sulfur-encrusted crater with fumaroles that were active along the margin of a crater lake until 1959.
Information Contacts: Kamchatka Volcanic Eruptions Response Team (KVERT), Far East Division, Russian Academy of Sciences, 9 Piip Blvd., Petropavlovsk-Kamchatsky, 683006, Russia (URL: http://www.kscnet.ru/ivs/); Copernicus Browser, Copernicus Data Space Ecosystem, European Space Agency (URL: https://dataspace.copernicus.eu/browser/).
Search Bulletin Archive by Publication Date
Select a month and year from the drop-downs and click "Show Issue" to have that issue displayed in this tab.
The default month and year is the latest issue available.
Bulletin of the Global Volcanism Network - Volume 31, Number 12 (December 2006)
Managing Editor: Richard Wunderman
Ambae (Vanuatu)
Acidic gas emissions destroy vegetation; islet lake breached
Augustine (United States)
Low activity remains the trend during April 2006-January 2007
Erebus (Antarctica)
Large eruptions stop in June 2006
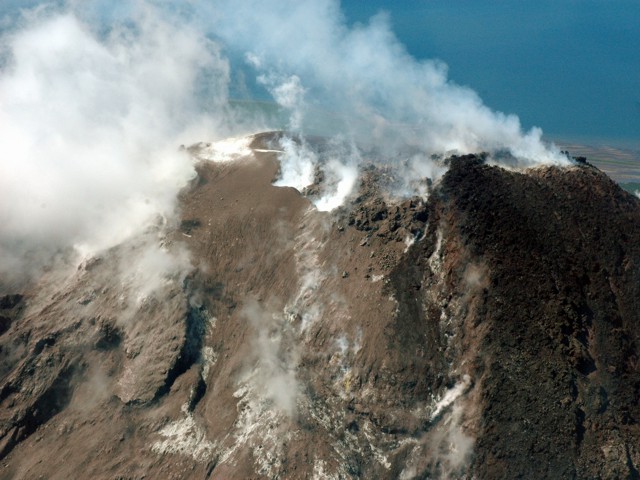
Etna (Italy)
Changing lava chemistry after 24 October 2006
Home Reef (Tonga)
Island photographs; pumice description; pumice tracking
Lateiki (Tonga)
Island present in December 2006; discolored water
Nyiragongo (DR Congo)
Activity within the crater lake due to lava bubbles and fountain
St. Helens (United States)
Continued lava-dome growth through 2006
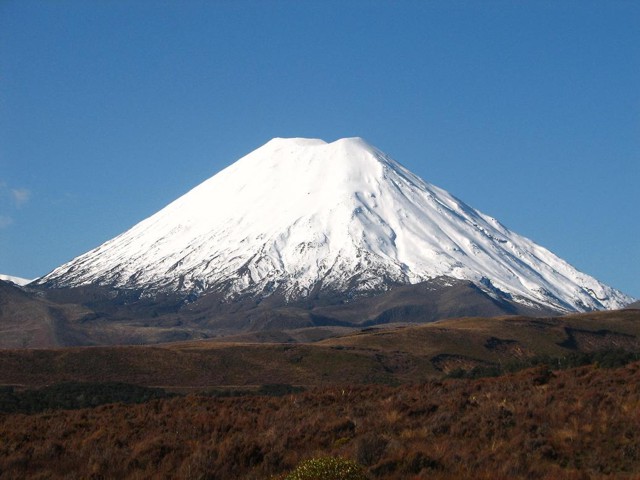
Tongariro (New Zealand)
Elevated seismicity at Ngauruhoe during May-October 2006
Tungurahua (Ecuador)
Intense ongoing activity in 2006; new bulge on the N flank
Whakaari/White Island (New Zealand)
Relative quite prevails during 2005-6
Ambae
Vanuatu
15.389°S, 167.835°E; summit elev. 1496 m
All times are local (unless otherwise noted)
Acidic gas emissions destroy vegetation; islet lake breached
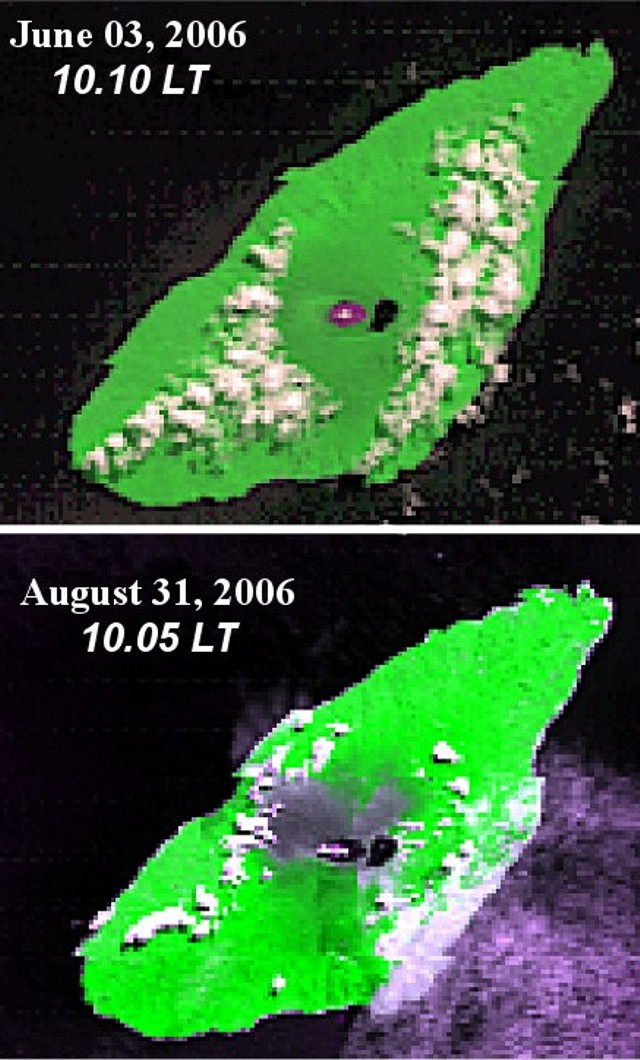
The Aura/OMI satellite detected elevated SO2 concentrations above Aoba volcano during July and August 2006. Comparison of MODIS imagery between 3 June and 31 August 2006 (figure 28) revealed the effects of emissions on vegetation around the crater. The conditions in the field were investigated by a scientific team from Institut de Recherche pour le Développement (IRD). They concluded that a significant area of the summit (30 to 40 km2) was burned by acid gas emissions.
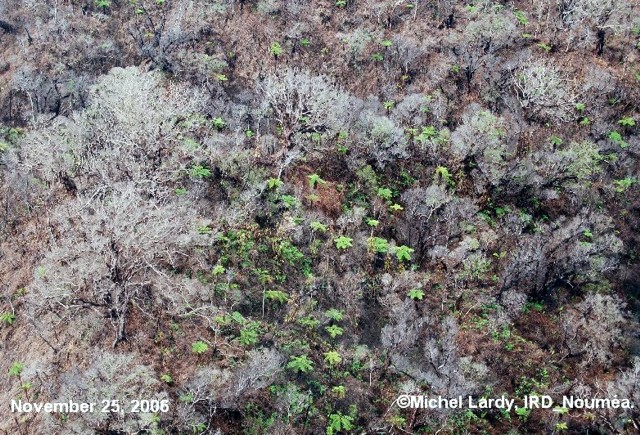
When IRD scientists conducted a visit to Aoba in late November 2006 vegetation surrounding the crater lake had been recently defoliated (figure 29), with trees completely burned and dead, due to plumes of acidic gas and aerosols during June-August 2006. They also concluded that heavy rainfalls since September 2006 diluted the acidity of plumes. Occasional green spots seen during the November visit were where new growths of ferns and tree ferns had become established. The acid effects were more extensive than previously seen since the early 1990s. This new behavior may reflect increased degassing from the source vent inside the ring-shaped tephra (or tuff) cone.
On 25 November 2006 an IRD team measured an SO2 flux of 3,000 tons/day. This value coincided with the measurement provided by the ozone monitoring instrument (OMI on the EOS Aura satellite). The value represented a marked reduction in SO2 degassing compared to that measured on 10 June 2006.
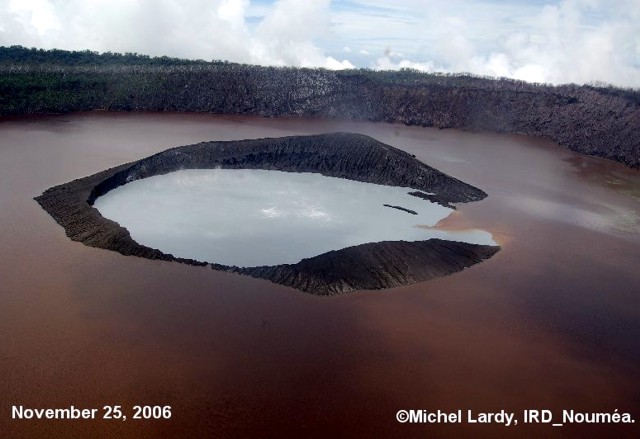
The team noted that the main lake in the crater, Lake Voui, was still a red color, an effect due to oxidation of the iron in its large mass of water (BGVN 31:05). Within that larger lake resides the ring-shaped island, which largely formed during the late 2005-early 2006 eruptions (BGVN 31:01). The island's form had been that of an unbroken ring, but by the time of their 25 November visit, the preceding month's heavy rains had eroded the smaller islands wall, allowing water in the two lakes to easily mix (figure 30). The W shore of Lake Voui has also been eroded, and fumaroles were observed in the lake. The breach in the tephra ring coincided with gas emissions ceasing.
The IRD team implemented the first permanent real-time temperature monitoring during their visit. Due to the heavy rainfall since June 2006 and the lowered levels of evaporation associated with the lowered average lake temperature (~ 25°C on 25 November 2006), the lake level remained high. In addition, the average level of Lake Voui is higher due to volcanic material (ash, scoria) deposited between December 2005 and January 2006, and it should continue to fluctuate seasonally, as in the past.
Geologic Background. The island of Ambae, also known as Aoba, is a massive 2,500 km3 basaltic shield that is the most voluminous volcano of the New Hebrides archipelago. A pronounced NE-SW-trending rift zone with numerous scoria cones gives the 16 x 38 km island an elongated form. A broad pyroclastic cone containing three crater lakes (Manaro Ngoru, Voui, and Manaro Lakua) is located at the summit within the youngest of at least two nested calderas, the largest of which is 6 km in diameter. That large central edifice is also called Manaro Voui or Lombenben volcano. Post-caldera explosive eruptions formed the summit craters about 360 years ago. A tuff cone was constructed within Lake Voui (or Vui) about 60 years later. The latest known flank eruption, about 300 years ago, destroyed the population of the Nduindui area near the western coast.
Information Contacts: Michel Lardy, Institut de Recherche pour le Développement (IRD), BP A 5 98 848 Noumea Cedex, New Caledonia (URL: http://nouvelle-caledonie.ird.fr/); Department Geology Mines and Water Resources (DGMWR), Geohazard Section, PMB 01 Port-Vila, Republic of Vanuatu; Alain Bernard, Universite Libre de Bruxelles, Brussels, Belgium (URL: http://www.ulb.ac.be/sciences/cvl/aoba/Ambae1.html).
Augustine (United States) — December 2006 Cite this Report
Augustine
United States
59.3626°N, 153.435°W; summit elev. 1218 m
All times are local (unless otherwise noted)
Low activity remains the trend during April 2006-January 2007
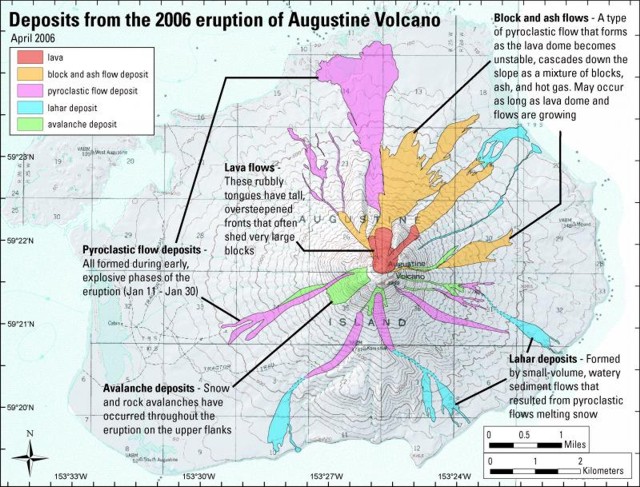
During the latter half of 2006 and through January 2007, Augustine experienced low-level activity, in stark contrast to the energetic eruptions of January and February 2006 (BGVN 31:04). Five ocean-bottom seismometers were deployed on 8 February 2006 around Augustine Island in Cook Inlet to assist the Alaska Volcano Observatory (AVO) in monitoring activity on the island. Figure 31 shows new deposits as of April 2006. This report covers the declining volcanism from April 2006 through January 2007.
Activity during mid-2006. The frequency of rock falls, avalanche events, and hot block-and-ash flows consistently decreased during April to August 2006. One exception was a minor spike consisting of 17-18 April avalanche signals that were larger relative to those seen in previous weeks. Based on aerial observations on 19 April, an active rock fall and avalanche chute developed near the margin of the new lava flow/dome complex in the NW summit area. Associated rockfalls contributed to an ash blanket visible on the SW flank.
Steaming was consistently seen during periods of visibility (figure 32). Visible growth of the lava dome continued, and the new dome and lava flows remained highly unstable through June 2006. Web camera views showed a low-level steam plume during the first two weeks of June 2006. According to the Anchorage VAAC, on 27 July 2006 around midnight, a pilot reported an ash emission that reached ~ 1.5 km altitude and drifted SSE. There was no seismic evidence for the event.
On 28 April, AVO lowered the Concern Code level from orange to yellow where it remained until August. Satellite images indicated declining thermal output consistent with the decrease in activity during April 2006. Airborne sulfur dioxide gas measurements showed continued high levels of magmatic gas emission that could be associated with degassing of lava at the summit in April 2006. Weak thermal anomalies persisted in satellite data through August 2006, and seismic levels decreased to background by this time. On 9 August 2006, it lowered the level of Concern Color Code from yellow to green (the lowest level).
Activity during late 2006-early 2007. Since 9 August 2006, seismicity remained at or near background and AVO did not detect ash plumes or significant temperature fluctuations.
Brief seismic activity occurred during 11 September-4 October 2006. During that time period, the number of earthquakes rose from zero to seven, followed by a plunge of activity that persisted through January 2007. AVO web camera views showed typically light steaming from the summit from September 2006 to January 2007.
Geologic Background. Augustine volcano, rising above Kamishak Bay in the southern Cook Inlet about 290 km SW of Anchorage, is the most active volcano of the eastern Aleutian arc. It consists of a complex of overlapping summit lava domes surrounded by an apron of volcaniclastic debris that descends to the sea on all sides. Few lava flows are exposed; the flanks consist mainly of debris-avalanche and pyroclastic-flow deposits formed by repeated collapse and regrowth of the summit. The latest episode of edifice collapse occurred during Augustine's large 1883 eruption; subsequent dome growth has restored the edifice to a height comparable to that prior to 1883. The oldest dated volcanic rocks on Augustine are more than 40,000 years old. At least 11 large debris avalanches have reached the sea during the past 1,800-2,000 years, and five major pumiceous tephras have been erupted during this interval. Recorded eruptions have typically consisted of explosive activity with emplacement of pumiceous pyroclastic-flow deposits followed by lava dome extrusion with associated block-and-ash flows.
Information Contacts: Alaska Volcano Observatory (AVO), a cooperative program of the U.S. Geological Survey, 4200 University Drive, Anchorage, AK 99508-4667, USA (URL: http://www.avo.alaska.edu/), Geophysical Institute, University of Alaska, PO Box 757320, Fairbanks, AK 99775-7320, USA, and Alaska Division of Geological & Geophysical Surveys, 794 University Ave., Suite 200, Fairbanks, AK 99709, USA.
Erebus (Antarctica) — December 2006 Cite this Report
Erebus
Antarctica
77.53°S, 167.17°E; summit elev. 3794 m
All times are local (unless otherwise noted)
Large eruptions stop in June 2006
The Mt. Erebus Volcano Observatory (MEVO) website contains a graph showing activity measured at the volcano since 1992 (figure 10). The most substantial peaks in the number of eruptions recorded appeared in 1995, 1997, 1998, 2000, and a broad peak beginning in late 2005 that continued into late 2006. It is important to note that the graph reports events of all sizes, including periods of extremely frequent and small (
The older records are based on interpretation of short-period seismographs, and many of the events could have been icequakes (seismic events related to the stick and slip nature of glacial ice movement) and not eruptions. In recent years the use of a video camera, infrasound, and broadband seismic records have allowed better recognition of eruptions. Because of extreme weather, the seismic network is subject to power loss during the darkness of winter.
The MEVO activity log gives information on each eruption measured and shows daily activity that usually includes several eruptions. Erebus eruption sizes are based on the infrasonic overpressure at Station E1S.IS1, measured in pascals (Pa) (see references articles on infrasound measurements). This eruption index scale is divided into small (0-19), medium (20-39), large (40-59), and very large (>=60) events. Although the total number of eruptions remained high during most months of 2006, large or very large events were rarely recorded after 1 June (table 1). The largest event had an index of 116.6 on 26 February.
Table 1. Large and very large eruptions recorded at Erebus, January-November 2006. Data courtesy of MEVO.
| Month |
Large Eruptions |
Very Large Eruptions |
| Jan 2006 |
22 |
0 |
| Feb 2006 |
18 |
5 |
| Mar 2006 |
13 |
7 |
| Apr 2006 |
11 |
9 |
| May 2006 |
12 |
3 |
| Jun 2006 |
1 |
0 |
| Jul 2006 |
0 |
0 |
| Aug 2006 |
0 |
1 |
| Sep 2006 |
1 |
0 |
| Oct 2006 |
1 |
0 |
| Nov 2006 |
0 |
0 |
General References. Wilson, C.R., J.V. Olson, D.L. Oborne, and A. Le Pichon, 2003 (December), Infrasound from Erebus Volcano at 155US in Antarctica, Inframatics-The Newsletter of Subaudible Sound, no. 04, p.1-8.
Johnson, J.B., and Aster, R.C., 2005, Relative partitioning of acoustic and seismic energy during Strombolian eruptions: Journal of Volcanology and Geothermal Research, v. 148, p. 334-354.
Johnson, J.B., Aster, R.C., and Kyle, P.R., 2004, Volcanic eruptions observed with infrasound: Geophysics Research Letters, v. 31, no. L14604, 4 p.
Johnson, J.B., Aster, R.C., Ruiz, M.C., Malone, S.D., McChesney, P.J., Lee, J.M., and Kyle, P.R., 2003, Interpretation and utility of infrasonic records from erupting volcanoes: Journal of Volcanology and Geothermal Research, v. 121, p. 15-63.
Geologic Background. Mount Erebus, the world's southernmost historically active volcano, overlooks the McMurdo research station on Ross Island. It is the largest of three major volcanoes forming the crudely triangular Ross Island. The summit of the dominantly phonolitic volcano has been modified by one or two generations of caldera formation. A summit plateau at about 3,200 m elevation marks the rim of the youngest caldera, which formed during the late-Pleistocene and within which the modern cone was constructed. An elliptical 500 x 600 m wide, 110-m-deep crater truncates the summit and contains an active lava lake within a 250-m-wide, 100-m-deep inner crater; other lava lakes are sometimes present. The glacier-covered volcano was erupting when first sighted by Captain James Ross in 1841. Continuous lava-lake activity with minor explosions, punctuated by occasional larger Strombolian explosions that eject bombs onto the crater rim, has been documented since 1972, but has probably been occurring for much of the volcano's recent history.
Information Contacts: Philip R. Kyle and Kyle Jones, Mt. Erebus Volcano Observatory, New Mexico Institute of Mining and Technology, Socorro, NM 87801, USA (URL: https://nmtearth.com/); Hawai'i Institute of Geophysics and Planetology (HIGP) MODIS Thermal Alerts, School of Ocean and Earth Science and Technology (SOEST), Univ of Hawai'i, 2525 Correa Road, Honolulu, HI 96822, USA (URL: http://modis.higp.hawaii.edu/).
Etna
Italy
37.748°N, 14.999°E; summit elev. 3357 m
All times are local (unless otherwise noted)
Changing lava chemistry after 24 October 2006
Roberto Clocchiatti and colleagues have provided information on the chemical composition of Etna lavas discharged during the recent eruptive period. Results of 18 major-element analyses on lavas erupted beginning 24 October 2006 are presented below.
The violent 2001 and 2002-2003 flank eruptions were fed by both trachybasaltic ("hawaiite") and basaltic magmas from various erupting vents (e.g. Clocchiatti and others, 2004). Conversely, the summit activity resuming from September 2004 to March 2005 produced only trachybasalt, which came from the upper levels of the magmatic system (Corsaro and Miraglia, 2005). After 16 months of calm characterized by mild gas venting, new lava emission began on 14 July 2006 at the summit SE Crater (SEC), lasting 10 days (BGVN 31:07). Since 31 August the SEC area exhibited a number of Strombolian episodes and lava flows, either from the SEC cone itself or from fissure vents which opened eastward at 2,800 m elevation (13 October), then southward at 3,000 m (23, 25 October), and finally westward at 3,050 m (26 October) and 3,180 m (8 November, internal reports from the INGV-Catania and the Omega-Acireale observatory) (figure 115).
Whole-rock analyses from 24 October onward show a significant increase of the MgO content and of the CaO/Al2O3 ratio (figure 116). The higher MgO and CaO, as compared to lower Al2O3 and alkalis, indicate a larger content of olivine and Ca-rich clinopyroxene at the expense of less plagioclase, so that the last analyzed lava is very close to a basalt composition (5.7% MgO, 10.7% CaO, 11.6% total Fe as Fe2O3, and 5.8% Na2O + K2O).
References. Clocchiatti, R., Condomines, M., Guénot, N., and Tanguy, J.C., 2004, Magma changes at Mount Etna: the 2001 and 2002-2003 eruptions: Earth Planet. Sci. Lett. 226, p. 397-414.
Corsaro, R.A., and Miraglia, L., 2005, Dynamics of the 2004-2005 Mt. Etna effusive eruption as inferred from petrologic monitoring: Geophys. Res. Lett. vol. 32, L13302.
Geologic Background. Mount Etna, towering above Catania on the island of Sicily, has one of the world's longest documented records of volcanism, dating back to 1500 BCE. Historical lava flows of basaltic composition cover much of the surface of this massive volcano, whose edifice is the highest and most voluminous in Italy. The Mongibello stratovolcano, truncated by several small calderas, was constructed during the late Pleistocene and Holocene over an older shield volcano. The most prominent morphological feature of Etna is the Valle del Bove, a 5 x 10 km caldera open to the east. Two styles of eruptive activity typically occur, sometimes simultaneously. Persistent explosive eruptions, sometimes with minor lava emissions, take place from one or more summit craters. Flank vents, typically with higher effusion rates, are less frequently active and originate from fissures that open progressively downward from near the summit (usually accompanied by Strombolian eruptions at the upper end). Cinder cones are commonly constructed over the vents of lower-flank lava flows. Lava flows extend to the foot of the volcano on all sides and have reached the sea over a broad area on the SE flank.
Information Contacts: Roberto Clocchiatti, CEN Saclay, 91191 Gif-sur-Yvette Cedex, France; Gilles Chazot, Observatoire de Physique du Globe Clermont, 63038 Clermont Ferrand, France; Jean-Claude Tanguy, IPGP, Observatoire de St. Maur, 94107 St. Maur des Fossés, France; Giovanni Tringali, Osservatorio Meteorologico, Geodinamico e Ambientale (Omega), 95024 Acireale, Italy.
Home Reef (Tonga) — December 2006 Cite this Report
Home Reef
Tonga
18.992°S, 174.775°W; summit elev. -10 m
All times are local (unless otherwise noted)
Island photographs; pumice description; pumice tracking
The island built by the eruption from Home Reef in early August (BGVN 31:09 and 31:10, table 1) was directly observed on 14 November and 7 December. No additional information about the eruption site has been received after 7 December.
Table 1. Summary of activity at Home Reef, August-December 2006. Only near-source observations are included, not dispersed pumice sightings. Revised area calculations were made using a Google Earth tool. Data supplemented, especially with additional satellite observations, from a table originally prepared by Paul Taylor.
| Date |
Activity / Phenomena |
| 05 Aug 2006 |
MODIS satellite image shows no activity. |
| 08 Aug 2006 |
At 1020 local time (2120 UTC on 7 Aug) MODIS image shows eruption plume surrounded by roughly 8-km-diameter circular pumice raft (55 km2). The diffuse eruption plume was seen in imagery extending 80 km SSW and 70 km SSE. MODIS image at 1445 (0145 UTC) showed larger pumice raft still attached to vent, and diffuse plume visible to 300 km S. SO2 first detected by OMI on Aura satellite. Late in the afternoon a continuous rumbling like thunder was heard from Vava'u; red glow was seen on the horizon that evening. |
| 09 Aug 2006 |
Continuous rumbling like thunder to the S of Vava'u, large mushroom-shaped eruption plume was being ejected above the vent in the morning. MODIS imagery at 1103 local time (2203 UTC on 8 Aug) showed that the pumice raft was still attached to vent, but had drifted to the W and was approximately 150 km2. White eruption plume quickly lost in cloud cover. SO2 mass (determined by OMI) detected E of Tonga was ~ 25 kilotons. |
| 10 Aug 2006 |
Continuous rumbling like thunder to the S of Vava'u. MODIS imagery at 1432 (0132 UTC) shows that a large pumice raft has moved N of Late Island (20 km NE). Some pumice remains around vent site, but is hidden by eruptive plume. Submarine plume of discolored water extends to Late Island. Diffuse plumes extend at least 100 km SE and 330 km NW. |
| 11 Aug 2006 |
Continuous rumbling like thunder to the S of Vava'u, large eruption plume above the vent. MODIS imagery at 1052 (2152 UTC on 10 Aug) showed a thin white eruption plume directed 25 km SW before being lost in cloud cover. No significant pumice raft seen near the vent, but there was an extensive area (150 km2) of discolored water surrounding the site. |
| 12 Aug 2006 |
Eruption column moving NW reported by crew of the yacht Maiken. Surtseyan explosive jets being emitted, producing projectiles that fell to the sea around the vent area. Multiple peaks had formed around a central crater that was open to the sea on one side. The island was about 1.5 km in diameter. OMI detection of SO2 shows 3.3 kilotons in the area. |
| 14 Aug 2006 |
MODIS image at 1405 (0105 UTC) shows small E-directed white plume, probable island, and large area of strongly discolored water (30 km2) E of the island. Sinuous submarine plume of discolored water extends 60 km NW. |
| 16 Aug 2006 |
Island was completely covered by clouds in a MODIS image at 1110 (2210 UTC on 15 Aug), but a plume of discolored water stretched more than 50 km N to some pumice rafts. |
| 17 Aug 2006 |
MODIS imagery at 1435 (0135 UTC) revealed meteorological clouds streaming from Late Island and Home Reef. Discolored water throughout the area N towards Late, and extending 80 km N to large pumice rafts. No significant pumice rafts seen near the island. |
| 19 Aug 2006 |
No eruption plume seen from island in MODIS imagery at 1425 (0125 UTC). Weakly discolored water patches extending NNW. |
| 22 Aug 2006 |
Small whitish cloud attached to island seen in MODIS image at 1030 (2130 UTC on 21 Aug) may be meteorological (similar clouds attached to Late). Strongly discolored water in narrow submarine plume very coherent to 8 km NE before diffusing and moving NW. |
| 23 Aug 2006 |
MODIS imagery at 1115 (2215 UTC on 22 Aug) very cloud-covered, but large zone of discolored water located N of the island. |
| 27 Aug 2006 |
Island present on MODIS image at 1050 (2150 UTC on 26 Aug) with a coherent submarine plume being dispersed to the N. |
| mid-Sep 2006 |
Island reported present at the site of Home Reef by Tongan fishing vessel. |
| 20 Sep 2006 |
"Strong sulfur odor" noted by a yacht passing W of the volcano. |
| 04 Oct 2006 |
Several submarine plumes observed on ASTER images. The island present was oval in shape, with the long axis orientated NE-SW. The island measured about 800 x 400 m and covered an area of 0.23-0.26 km2. Several small lakes were present within the island. |
| 12 Nov 2006 |
No activity observed on ASTER images. Island was still present but with no crater lakes. The island was triangular in shape and covered an area of 0.146 km2. |
| 14 Nov 2006 |
Island observed by Defence Force patrol boat was ~40 m high, square in shape, 300 m on a side. The island looked quite consolidated. Plume of smoke/steam, but no eruptive activity. |
| 07 Dec 2006 |
Overflight by a RNZAF Orion revealed a roughly circular island, 450 m in diameter, at 18°59.4'S 174°45.4'W. The crew estimated the height as "up to 240 ft" (75 m). Minor fumarolic activity was occurring in the crater and there was a noticeable smell of sulfur. Sediment/hydrothermal plumes were present in the surrounding waters. |
Paul Taylor reported that the Home Reef island was observed on 14 November by a Tongan Defence Force patrol boat. The island was reported to be ~ 40 m high, roughly 300 x 300 m at that time, and looked quite consolidated with pumice on the outside, while the center looked "more substantial." Although not in eruption, a considerable plume of smoke/steam was being emitted.
The island was photographed on 7 December 2006 (figure 18) by the Royal New Zealand Air Force (RNZAF) at the request of volcanologists from the Institute of Geological & Nuclear Sciences (IGNS). Satellite imagery on 4 October showed an island about 0.24 km2, which decreased by about one-third to 0.15 km2 by 12 November. The RNZAF Orion crew reported that the roughly circular island was 450 m in diameter (0.16 km2), with a maximum height of 75 m (figure 19). The position was reported as 18°59.4'S, 174°45.4'W (18.99°S, 174.757°W). Minor fumarolic activity was occurring in the crater and there was a noticeable smell of sulfur. Plumes of discolored water were present in the surrounding area. The higher-angle views of the island showed an area that had eroded to just below the ocean surface, possibly reflecting the previous extent of the island.
Floating pumice observations. Pumice from the Home Reef eruption was identified in Terra and Aqua MODIS satellite images as well as being reported by sailors and Fijians (BGVN 31:09 and 31:10). A compilation of all of these sources (figure 20) seemed to indicate that two major tracks were taken by most of the pumice. Initially, all of the pumice went N, then WNW across the ocean towards Fiji. Approximately midway to Fiji, some of the pumice turned on a more westerly course then moved south before impacting Vatoa and passing the southern Lau Islands enroute to Kadavu and Vanua Levu. Another batch of pumice continued on a WNW course, penetrating the northern Lau Islands to Taveuni, the Koro Sea, and Viti Levu. Both groups of pumice eventually passed W of Fiji, with some getting to Vanuatu in November. Most of the pumice appears to have been generated during 8-10 August, but there may have been smaller pumice-creating eruptions that were not documented.
Satellite imagery revealed not only the paths taken by pumice rafts, but also their changing morphology. Although cloud-cover was a problem, the MODIS images did show enough pumice zones to allow their areas to be sketched (figure 21). Note that all dates and times in this section are UTC. During the early stages of the eruption pumice built up and remained in the immediate vicinity of the vent (2120 on 7 August through 2203 on 8 August UTC) (figure 21A). Though clouds prevented a view of the entire raft, at it's greatest extent pumice covered about 140 km2 while still attached to the vent.
By 0132 on 10 August the main mass of pumice had moved to the N side of Late island (figure 21A). The raft generally remained as a single large coherent feature in that area for at least 20 hours. Over those 20 hours the raft spread from covering about 300 km2 to almost 400 km2 in a contiguous irregular area, more than double the area of Washington D.C. When it began moving NE towards another unnamed submarine volcano, by 0120 on 12 August UTC, the main mass was reduced in size by about 50% and left a "tail" looping towards Vava'u with smaller stray pumice rafts throughout the area.
Between 0105 on 14 August and 0135 on 17 August (UTC) the pumice began moving NE and ENE (figure 21B). Pieces of the large raft began to shear off, with currents carrying smaller rafts away and often leaving a trail of connected pumice fragments in the wake. However, a contiguous mass of almost 150 km2 remained 60 km N of Late Island. Over the next couple of days all of the pumice drifted N and continued to string out ENE across the ocean towards northern Fiji (figure 21C). By 2215 on 22 August (UTC) there was still pumice 25 km W of Fonualei volcano, but the farthest identifiable rafts of pumice were 270 km E and ENE of Fonualei. The pumice appeared to form a continuous, connected stream for most of that distance. In other locations the strand of pumice fragments had broken and individual segments had turned, creating multiple parallel lines of pumice spread across the water.
By 2150 on 26 August there were three distinct areas of pumice still visible (figure 21D), though they were all greatly diminished in area and starting to be difficult to distinguish through intermittent cloud cover. One area was still a connected, or semi-connected, strand about 250 km long directed to the NE. Another area of pumice about 60 km N-S was within 100 km of the central Lau Islands. The second pumice zone was encountered on 28 August by the Yacht KB1LSY as it approached the islands. Pumice from one or both of these sources had penetrated into the northern Lau Islands and the Koro Sea by 14 September, landing on Taveuni, Naitauba, and Vanua Levu. Pumice was then reported around Koro Island and in the "Bligh Triangle" area between Vanua Levu and Viti Levu starting on 20 September. At least some of this pumice drifted through the passage to Yasawa Island, N of Viti Levu, by early November.
The third distinct set of pumice rafts seen in imagery on 26 August extended across an 80-km distance directed SE-NW and was drifting towards the southern Lau Islands. This batch of pumice was encountered on 30 August by the Soren Larsen just W of the central Lau Islands, and is most likely the same pumice that was reported by the Endeavor extending 90 km NE from Vatoa Island on 16 September. On 30 September large volumes of pumice were landing on Kadavu Island, another 350 km from Vatoa. That same day pumice was seen an additional 200 km NW, on the western side of Viti Levu.
Although pumice was seen on Efate Island in Vanuatu during early October, it was thought to be from the Ambrym-Lopevi area. Pumice from Home Reef was seen on the W coast of Efate Island on 4 November. Floating pumice was also seen in Shark Bay on the E side of Tanna Island around mid-November (figure 22).
Pumice description. Scott Bryan received some pumice samples from Roman Leslie via Peter Colls at the University of Queensland, who made some thin sections of the pumices. Initial observations are that the Home Reef pumice sampled are very similar to the 2001 pumice from the unnamed volcano along a submarine plateau south of Fonualei (volcano number 0403-091), about 85 km NE of Home Reef. The pumice is similar in terms of color (darkish gray-green), vesicularity (highly vesicular), and phenocryst content (low, mostly fine-grained). The pumice has the same mineralogy as the 2001 pumice: plagioclase, two pyroxenes (cpx dominant, and probably relatively Fe-rich), and Ti-magnetite. However, the Home Reef pumice has slightly higher abundances of plagioclase microphenocrysts (~ 0.1-1 mm). Small polymineralic clots of plagioclase, pyroxene, and magnetite are distinctive, and most readily visible to the naked eye in the pumice samples; similar polymineralic aggregates were also present in the 2001 pumice. The pumice observed in thin-section have high vesicularities (> 60%). The pumice would have similar bulk compositions to the 2001 pumice of ~ 65-70 wt% SiO2.
Eruptive history. The August 2006 eruption is the third confirmed eruptive episode in historical time, with earlier eruptions in 1852 and 1984 (SEAN 09:02). In addition, there may have been activity in 1857, but no eruption was confirmed. Paul Taylor noted that there may have also been another eruption that was occurring when some aerial photos were taken in 1990. No eruption was reported, so any activity probably didn't reach the surface or was not observed. The photos seemed to show a small submarine plume being dispersed to the NW.
Geologic Background. Home Reef, a submarine volcano midway between Metis Shoal and Late Island in the central Tonga islands, was first reported active in the mid-19th century, when an ephemeral island formed. An eruption in 1984 produced a 12-km-high eruption plume, large amounts of floating pumice, and an ephemeral 500 x 1,500 m island, with cliffs 30-50 m high that enclosed a water-filled crater. In 2006 an island-forming eruption produced widespread dacitic pumice rafts that drifted as far as Australia. Another island was built during a September-October 2022 eruption.
Information Contacts: Paul W. Taylor, Australian Volcanological Investigations, PO Box 291, Pymble, NSW 2073, Australia; Brad Scott, Institute of Geological & Nuclear Sciences (IGNS), Wairakei Research Centre, PO Box 2000, Taupo, New Zealand (URL: http://www.geonet.org.nz/, http://www.gns.cri.nz/); Scott Bryan, School of Earth Sciences & Geography, Kingston University, Penrhyn Rd, Kingston Upon Thames, Surrey KT1 2EE United Kingdom; Norman Kuring, NASA/Goddard Space Flight Center, Code 970.2, Greenbelt, MD 20771, USA; George Kourounis, Toronto, ON, Canada (URL: http://www.stormchaser.ca/).
Lateiki
Tonga
19.18°S, 174.87°W; summit elev. 43 m
All times are local (unless otherwise noted)
Island present in December 2006; discolored water
On 7 December 2006 the Royal New Zealand Air Force (RNZAF) flew over the Home Reef and Metis Shoal area of Tonga at the request of volcanologists from the Institute of Geological & Nuclear Sciences (IGNS). At that time an island was present (figure 4), but it is not known if this is a remnant of the island built in 1995 (BGVN 20:06) or the result of later undocumented eruptions. Areas of discolored water were present adjacent to the island, the result of either erosion or fumarolic activity. Discolored water extending about 5 km SW from the location of the island was also observed in an Aqua MODIS satellite image taken on 15 September 2005 (figure 5).
Geologic Background. Lateiki, previously known as Metis Shoal, is a submarine volcano midway between the islands of Kao and Late that has produced a series of ephemeral islands since the first confirmed activity in the mid-19th century. An island, perhaps not in eruption, was reported in 1781 and subsequently eroded away. During periods of inactivity following 20th-century eruptions, waves have been observed to break on rocky reefs or sandy banks with depths of 10 m or less. Dacitic tuff cones formed during the eruptions in 1967 and 1979 were soon eroded beneath the ocean surface. An eruption in 1995 produced an island with a diameter of 280 m and a height of 43 m following growth of a lava dome above the surface.
Information Contacts: Brad Scott, Institute of Geological & Nuclear Sciences (IGNS), Wairakei Research Centre, PO Box 2000, Taupo, New Zealand (URL: http://www.geonet.org.nz/, http://www.gns.cri.nz/); NASA Earth Observatory (URL: http://earthobservatory.nasa.gov/).
Nyiragongo (DR Congo) — December 2006 Cite this Report
Nyiragongo
DR Congo
1.52°S, 29.25°E; summit elev. 3470 m
All times are local (unless otherwise noted)
Activity within the crater lake due to lava bubbles and fountain
Due to political turmoil and civil unrest, expeditions to Nyiragongo's summit lava lake are rare. Two expeditions to the summit were successful in January and July 2006. Photos of the lava lake provided by expedition leader Marco Fulle and crew are posted on the Stromboli Online website. These photos document the changes in the lake over a six-month period. Thermal anomalies measured with the MODIS satellite and associated with this volcano were nearly continuous at this time due to the lava lake within the summit crater.
Two terraces created from a 1977 (upper) lake and a 2002 (lower) lake are evident in photos from January 2006. Closer views of the lava lake showed bubbles breaking through the very dynamic lake surface. Bubbles continuously bursted through the lake's surface. Near the SW shore line, white sulfur deposits and fumaroles were observed. Lava from fountains at the N shoreline splashed on the E lake shore. By July 2006, the lava lake was smaller and seemingly more crusted over. A large fountain was continuously active on the lake's N shore, generating waves up to 10 m high (figure 35).
Geologic Background. The Nyiragongo stratovolcano contained a lava lake in its deep summit crater that was active for half a century before draining catastrophically through its outer flanks in 1977. The steep slopes contrast to the low profile of its neighboring shield volcano, Nyamuragira. Benches in the steep-walled, 1.2-km-wide summit crater mark levels of former lava lakes, which have been observed since the late-19th century. Two older stratovolcanoes, Baruta and Shaheru, are partially overlapped by Nyiragongo on the north and south. About 100 cones are located primarily along radial fissures south of Shaheru, east of the summit, and along a NE-SW zone extending as far as Lake Kivu. Many cones are buried by voluminous lava flows that extend long distances down the flanks, which is characterized by the eruption of foiditic rocks. The extremely fluid 1977 lava flows caused many fatalities, as did lava flows that inundated portions of the major city of Goma in January 2002.
Information Contacts: Marco Fulle, Stromboli Online and Department of Astronomy, Triste University, Trieste, Italy (URL: http://www.swisseduc.ch/stromboli/perm/nyiragongo/lake-en.html).
St. Helens (United States) — December 2006 Cite this Report
St. Helens
United States
46.2°N, 122.18°W; summit elev. 2549 m
All times are local (unless otherwise noted)
Continued lava-dome growth through 2006
The current and ongoing eruption of the St. Helens started on 11 October 2004. Extrusion of the growing dacitic lava dome has continued in the same quiescent but sustained mode exhibited throughout the first half of 2006 (BGVN 31:07) . Levels of seismicity have remained generally low, with low emissions of steam and volcanic gases and minor production of ash.
From 26 July through 3 October 2006, the lava dome continued to grow and produce small rockfalls accompanied by minor earthquakes. M 3-3.6 earthquakes occurred on 26, 28, and 31 July. Resulting dust plumes rose well above the crater rim. A steam plume was observed rising from the growing lava dome on 13 August. During 16-22 August, based on interpretations of seismic data, spine extrusion from the dome continued in conjunction with small earthquakes and rockfalls. By mid-August 2006 the dome's volume was about 85 million cubic meters growing at an average rate of less than 1 m3/s. The lava dome's height above the 1986-crater floor started at 396 m. On 9 and 10 September, five shallow earthquakes greater than M 2 occurred in association with the growing dome. A period of relatively low seismic activity followed.
From 20 September through 3 October, lava extruded slowly from the vent onto the S crater floor; there was only low seismicity that generated occasional rockfalls as talus sloughed off the flanks of the growing dome. The rate of dome deformation was low. There was no change in rock chemistry, suggesting little to no change in eruptive style. The lack of explosive activity coupled with continuing low number of earthquakes and small quantities of volcanic gas indicate that the risks posed by the hazards are currently relatively low.
During October, lava continued to extrude onto the S crater floor of St. Helens and observations and data from deformation-monitoring instruments showed the dome continued to grow. Low seismicity and slight tilting of the crater floor produced small rockfalls. A small steam plume was visible on 9 October. On 22 October, an M 3.5 earthquake triggered the collapse of material from the largest of the lava-dome spines. The resulting ash plume rose to about 3.2 km and quickly dissipated to the W. On 29 October, a M 3.2 earthquake was accompanied by a rockfall that produced a small plume. The plume filled the crater to just above the rim and quickly dissipated.
Throughout November and December, data from deformation-monitoring instruments showed that during 1-7 November, the lava dome continued to grow. Inclement weather prohibited visual observation during most of the reporting period. On 5 and 6 November, acoustic flow monitors recorded rain-induced debris flows within the crater and in the upper part of the North and South Fork Toutle River valleys. Seismicity continued at low levels, punctuated by M 1.5-2.5, and occasionally larger, earthquakes. On 21 November, views from an aircraft and a crater camera showed that an active spine continued to extrude. On 18 December, a steam plume rose several hundred meters above the rim and was visible from the Portland area, about 80 km away.
Scientists working on the "old part" of the new lava dome found evidence to suggest that the lava dome was essentially solidified within several hundred meters beneath the crater floor. The outer 2-3 m of the lava dome was composed of ground rock that transitions to solid rock with numerous fractures. These findings support the stick-slip model of lava dome extrusion. If the model is correct, it may help explain the origin of many of the million plus small, shallow earthquakes as the result of numerous sub-surface slips that created the ground and fractured rock. Scientists have also noted that for short periods (hours to perhaps a day) part of the growing lava dome appears to stick (no movement detected in photographs) and then restarts again after high-M 2 to low-M 3 earthquakes.
Alert Level terminology. On October 1, the alert-level system for all volcanoes monitored by the USGS was changed to a descriptive system (table 9). In the new system, "Normal" indicates background conditions are stable; this is equivalent to aviation color-code Green. The previous alert levels of Volcanic Unrest (Alert Level 1), Volcano Advisory (Alert Level 2) and Volcano Alert (Alert Level 3) have changed to "Advisory," "Watch," and "Warning," respectively. There is a minor additional change for the aviation color-code definitions in that there is no longer an ash-plume threshold given for either Orange or Red. The ash-plume height threshold of 25,000 ft. or less for aviation warning condition "Orange" is no longer mandatory; condition "Red" was for ash above 25,000 ft. Now the height threshold can be adjusted for each case.
Table 9. Revised nomenclature and descriptions of volcano Alert Levels for all volcanos in the Cascade range. Courtesy USGS-CVO.
| Old Numerical Level |
New Descriptor |
Aviation Color Code |
| Background conditions are stable |
Green |
| 1 "Unrest" |
"Advisory" |
Yellow |
| 2 "Advisory" |
"Watch" |
Orange |
| 3 "Alert" |
"Warning" |
Red |
Throughout the period covered by this report, the hazard status for St. Helens remained at Volcano Advisory Alert Level (2) "Watch;" aviation color code Orange. The alert-level "Watch" is used for two different situations: (1) heightened or escalating unrest indicating a higher potential that an eruption is likely, but still not certain; or (2) an eruption that poses only limited hazard. Descriptor definition "Watch" fits the current lava-dome eruption at St. Helens.
Geologic Background. Prior to 1980, Mount St. Helens was a conical volcano sometimes known as the Fujisan of America. During the 1980 eruption the upper 400 m of the summit was removed by slope failure, leaving a 2 x 3.5 km breached crater now partially filled by a lava dome. There have been nine major eruptive periods beginning about 40-50,000 years ago, and it has been the most active volcano in the Cascade Range during the Holocene. Prior to 2,200 years ago, tephra, lava domes, and pyroclastic flows were erupted, forming the older edifice, but few lava flows extended beyond the base of the volcano. The modern edifice consists of basaltic as well as andesitic and dacitic products from summit and flank vents. Eruptions in the 19th century originated from the Goat Rocks area on the N flank, and were witnessed by early settlers.
Information Contacts: Cascades Volcano Observatory (CVO), U.S. Geological Survey, 1300 SE Cardinal Court, Building 10, Suite 100, Vancouver, WA 98683-9589, USA (URL: https://volcanoes.usgs.gov/observatories/cvo/).
Tongariro (New Zealand) — December 2006 Cite this Report
Tongariro
New Zealand
39.157°S, 175.632°E; summit elev. 1978 m
All times are local (unless otherwise noted)
Elevated seismicity at Ngauruhoe during May-October 2006
Ngāuruhoe is the youngest and highest volcanic cone (figure 1) of the Tongariro volcanic complex on the North Island of New Zealand. According to New Zealand GeoNet Project volcanologists, the number of small (less than magnitude 2), low-frequency earthquakes near Ngāuruhoe recorded by seismometers increased from less than five per day at the beginning of May 2006 to more than 20/day by the end of May. Typically, only a few earthquakes of any type are recorded in the vicinity of Ngāuruhoe each year. In 1983, 1991, and 1994 there were clusters of similar earthquakes recorded near Ngāuruhoe, but there have been very few recorded since then. Due to the increased seismicity, the Scientific Alert Level was raised to Alert Level 1 (some signs of unrest) on 6 June. Earthquakes of this type are commonly interpreted as being related to the movement of magma and/or volcanic gases.
Earthquakes peaked in early June at about 50/day and then declined to about 10-20/day by the 14th, with the largest about magnitude 1. Seismic activity has remained elevated through the middle of December 2006. Initial observations suggested that hypocenters were 1-4 km deep, slightly N or E of the summit. By mid-June volcanologists had installed three additional seismographs around the base of Ngāuruhoe, including one that could be monitored in real-time. Between 14 June and 3 July the number of volcanic earthquakes recorded near Ngāuruhoe has varied between approximately 20 and 40 per day. Using data from the additional seismographs, volcanologists were able to refine the location of the earthquakes to within about 1 km of the surface beneath the N flank; the largest events were approximately magnitude 1. Elevated seismicity continued at up to 30 events/day through October 2006.
As of the last GeoNet report on 1 November, no other signs of unrest had been recorded. Multiple measurements showed that temperatures and volcanic gas concentrations have not changed since the increased seismicity began in May, and were similar to measurements made in 2003. Carbon-dioxide release through the soil (from degassing magma) is also similar to measurements in 2003. The maximum fumarole temperature near the summit is about 85°C. Reports of steaming in the summit area were investigated, but because no new features were seen that could have caused emissions, the sightings were attributed to clouds rather than volcanic activity.
Geologic Background. Tongariro is a large volcanic massif, located immediately NE of Ruapehu volcano, that is composed of more than a dozen composite cones constructed over a period of 275,000 years. Vents along a NE-trending zone extending from Saddle Cone (below Ruapehu) to Te Maari crater (including vents at the present-day location of Ngauruhoe) were active during several hundred years around 10,000 years ago, producing the largest known eruptions at the Tongariro complex during the Holocene. North Crater stratovolcano is truncated by a broad, shallow crater filled by a solidified lava lake that is cut on the NW side by a small explosion crater. The youngest cone, Ngauruhoe, is also the highest peak.
Information Contacts: New Zealand GeoNet Project, a project sponsored by the New Zealand Government through these agencies: Earthquake Commission (E.C.), Geological and Nuclear Sciences (GNS), and Foundation for Research, Science and Technology (FAST) (URL: https://www.geonet.org.nz/); University of Auckland Snowsports Club, University of Auckland, New Zealand (URL: http://www.uasc.co.nz/).
Tungurahua (Ecuador) — December 2006 Cite this Report
Tungurahua
Ecuador
1.467°S, 78.442°W; summit elev. 5023 m
All times are local (unless otherwise noted)
Intense ongoing activity in 2006; new bulge on the N flank
According to the Instituto Geofísico-Escuela Politécnica Nacional (IG), Tungurahua, located 180 km S of the capital Quito, erupted on 14 July 2006 (BGVN 31:07), and again with great intensity in mid-August, resulting in at least five deaths. The 14 July event marked the beginning of a new energetic phase of activity different from that seen since October 1999. This report was taken from the IG's Special Reports and Bulletins (Numbers 7-15) discussing events from mid-July 2006 through early January 2007.
The new phase that began in July 2006 was characterized by highly explosive activity. It was associated with the arrival of a large volume of magma and the expulsion of hot, sometimes incandescent, pyroclastic flows. These flows traveled downslope with speeds of ~ 40 km/hour from the W, NW, and N flanks of the cone and ended at the Chambo river. The primary route of the flows was via the Achupashal, Cusua, La Hacienda, Juive Grande, Mandur, and Vascún gorges (see maps and figures in BGVN 31:07). Some of these flows were sufficiently large and mobile as to reach the Baños-Penipe road. The settlements of Cusúa, Bilbao, and to a lesser extent Juive Grande, were affected by these flows, which devastated pastures, fields, livestock, and basic infrastructure.
Additionally, small-volume pyroclastic flows descended the Vascún valley (upslope from the western part of Baños) but ended 2.5 km upstream from the hot springs of El Salado. The emission of hot incandescent pyroclastic flows ended one week after the explosive eruptions of 14-15 July.
Volcanic activity decreased significantly several weeks after 14 July, as shown by the seismic-based indicator developed for Tungurahua by the IG (figure 36). The daily indicator value decreased after mid-July and remained consistent until a slight increase during 8-13 August.
On 1 August, a pyroclastic flow traveled W and SW down the flanks and reached the Rea gorge, where it left deposits an estimated 50 m thick consisting largely of blocks and ash. On 2 August, a small lahar traveled NW and blocked a highway. Strombolian activity was observed at night on 3 August. Small explosions were registered during 3-7 August. On 6 August, light ashfall was reported ~ 8 km SW in the town of Manzano.
During 9-15 August, small-to-moderate explosions produced plumes composed of gas, steam, and small amounts of ash that reached heights of ~ 1 km above the summit. Light ashfall was reported in nearby localities during 9-10 August. On 9 and 13 August, explosions expelled blocks of incandescent material that rolled 100 m down the W flank.
Bulge detected and intense explosive eruptions on 16 August. Clinometer measurements on 16 August indicated a bulge on the N flank as compared to 11 August. Seismic activity increased, as ash-and-gas plumes reached heights of 3 km above the summit and drifted W and NW. About 3,200 people were evacuated from "at-risk" areas. At 1900 on 16 August, a new, intense explosive eruption began that continued throughout the day. A large pyroclastic flow did not reach the road.
The eruption continued through 0145 on 17 August at high levels of intensity, ejecting incandescent rocks and generating pyroclastic flows. Several pyroclastic flows were reported in the Achupashal, Mandur y La Hacienda, Juive and Vascún ravines. On the 17th tephra fall (with pumice clasts ~ 3 cm in diameter) was reported from several areas in a wide zone that extended from Penipe in the SW to ~ 15 km NW. Ash plumes reached estimated heights of 10 km above the summit and covered the central part of Ecuador, forming a cloud ~ 742 km long and ~ 185 km wide trending NNW and SSE.
As of mid-August, about 20 pyroclastic flows had descended the above-mentioned ravines, and possibly others on the SW flank. At 2125 the largest pyroclastic flow of the sequence descended the Achupashal ravine and reached and dammed the Chambo river.
At 0033 on the 18th activity intensified, generating several pyroclastic flows and ashfall in several sectors from Penipe in the SW to the N; hot ashfall was reported in the villages of Pelileo, Cevallos, San Juan, and Cotaló. The large quantity of accumulated ash on roofs in the village of Pillate caused their collapse. The city of Baños lost electrical service. During this period, one of the pyroclastic flows descended near Juive Grande and crossed the Ambato-Baños. A sustained eruption column appeared incandescent and glowing at the base, with an associated ash cloud to 7 km above the crater that was blown W and SW. Continuous sprays and jets of lava rose hundreds of meters above the crater.
The explosive eruption on 16-17 August culminated around 0200 (figure 37), after which time the activity gradually decreased. The IG report stated that on 17 August, although the eruptive activity had ceased, longer lasting events including movement of magma and continuous deformation on the N flank indicated that residual magmatic fluid in the volcanic system was putting pressure on the structure. Additionally, emission of SO2 continued to be detected in moderate amounts. This report (Special Report ##14, 17 August 2006) also reminded authorities that the events of 1918 included five explosive eruptions interspersed with periods of reduced activity and that the entire W flank remained at risk of collapse, which could release a large volume of lava and produce much larger pyroclastic flows. Communities at most risk would be on the NW flank (Juive Grande, Los Pájaros, Cusua, Bilbao), but more distant zones at the bottom of the Chambo and Pastaza valleys (Chacauco, and eventually Puñapí) would also be affected.
Dramatic developments. On 18 August, incandescent blocks ejected from the summit descended ~ 1.7 km down the flank. Also that day, based on seismic interpretation, one of the blockages damming part of the Chambo River had been breached.
During 18-19 August, the N flank continued to inflate. During 20-21 August, steam emissions were observed during breaks in the cloud cover and the N flank exhibited deflation. On 23 August, two slow-moving lava flows were identified on the NW slope.
According to news reports, falling ash and debris caused fires and severe damage to five villages. An estimated 20,000 hectares of crops were destroyed. At least five people were dead or missing, and several more were injured. An estimated 4,000 people relocated to shelters.
Relative quiet, late August-October. During 23-27 August, visual observations of Tungurahua were impaired due to inclement weather. Based on seismic interpretation, lava continued to slowly flow NW towards Cusúa and La Hacienda. Seismicity was low and dominated by long-period earthquakes. Inclinometer measurements indicated no additional inflation on the flanks.
During September, seismicity remained low. On 1 September, lava flows on the NW flank were confirmed to have ceased. On 7 September lahars descended the NW gorges of Chontapamba and Mandur. During the month, there were several steam-and-gas plumes with little or no ash content. The emission heights ranged from ~ 0.1 to 2 km above the summit, and the primary wind drift was to the NW and W. Incandescence at the summit was observed at night. On the afternoon of 21 and on 22 September, moderate ash emissions occurred. Three more emissions on 23 September caused ashfall in Penipe; one plume rose 3 km and another 4 km above the summit. Ash plumes were seen again on 25 September.
No ash emissions were reported between 27 September and 2 October; however, on 2 October a slow-moving lava flow was seen descending the NNW flank and some fumarolic activity from the crater was observed. On 3 October an explosion resulted in ash falling in nearby communities to the W. According to the IG and aviation sources, the plume rose to at least 5 km above the summit.
During 4-5 October, Tungurahua's N flank fumaroles were active and steam emissions with minor ash content rose to 1 km above the summit and drifted W. Additional steam plumes possibly originated from the recent lava-flow's front. The IG again reported an increase in emissions and seismicity on 11 and 12 October, when steam plumes with slight to moderate amounts of ash reached 9-12 km altitude. Light ash fell in areas to the NW and W. During 13-17 October, seismicity decreased and plumes reached 7-8 km altitude.
On 16 October a small lava flow spalled off incandescent blocks; gas plumes were observed. Lahars traveled N toward Baños and down the Vazcún and Ulba gorges.
During 18-19 October, ash emissions increased in intensity and seismic tremor was continuous. During the night, lava fountains reached heights of 1 km above the crater rim and blocks rolled 800 m down the flanks. According to the Washington VAAC, around this time a pilot reported an ash plume to an altitude of 8.5 km. Ash plumes drifted NE and E and generated ashfall about 50 km E, in Puyo. According to news articles, about 300 villagers were evacuated.
Emissions continued during 20-24 October, producing plumes to 7-8 km. Ashfall was reported from towns on the N, NW, W, SW, and E flanks. On 28 October, incandescent blocks were expelled from the summit and rolled about 500 m down the W and E flanks. The next day, a lahar traveled NNW down the Mandur drainage and muddy water swelled in the Vazcún drainage. Incandescence from the crater was seen during most of October.
Ash plumes of steam and gas, and moderate ashfalls, were reported from several downwind towns on 5 and 6 November, including Bilbao (8 km W), Cotaló (13 km NW), and Manzano (8 km SW). On 2 November incandescent blocks were expelled from the summit and rolled 700 m down the W and E flanks. Nighttime incandescence was observed during 2-4 November.
On 7 November, a voluminous lahar traveled down gorges to the W and reached as far as the Chambo river, ~ 7 km from the summit. On 8 November, blocks expelled from the summit rolled down the flanks and ashfall was reported from areas including Casúa (7 km NW) and Baños (8 km NE). On 10, 11, and 13 November, ash fall was reported from areas including Penipe (8 km SW). During 12-13 November, lahars traveled down W and NW drainages and the Vazcún river swelled with muddy water.
On 17 November, an ash plume reached an altitude greater than 10 km and drifted NW and NE. During 26-27 November, Strombolian activity propelled incandescent material up to 600 m above the summit. Blocks rolled 2 km down the flanks. Lightning was visible in an ash plume that reached 7 km altitude and ashfall was reported from areas 8 km WSW. On 27 November, an ash plume rose to 9 km and drifted W. These conditions continued on into early December. On 6 December, plumes reached an altitude of 10 km. Ashfall was reported in areas including Cotaló, about 13 km NW, Pillate, about 7 km to the W, and Puela, about 8 km SW. On 9 December, ashfall up to 1 mm thick was reported about 12 km N in Baños.
Around this time seismicity was minimal in both intensity and duration. The plumes drifted in multiple directions. On 14 December, a lahar traveled SW down the Mapayacu gorge. On 21 December, lahars from Tungurahua traveled NW down the Mandur gorge resulting in a road closing and W down the Bilbao gorge. Gas-and-steam emissions produced small plumes on 22, 23, and 25 December. During 27 December-2 January, seismicity at Tungurahua remained moderate to low. On 27 and 28 December, lahars traveled down drainages including Bilbao to the W, Mandur to the NNW, and Mapayacu to the SW. During 3-9 January, seismicity at Tungurahua remained low to moderate.
Geologic Background. Tungurahua, a steep-sided andesitic-dacitic stratovolcano that towers more than 3 km above its northern base, is one of Ecuador's most active volcanoes. Three major edifices have been sequentially constructed since the mid-Pleistocene over a basement of metamorphic rocks. Tungurahua II was built within the past 14,000 years following the collapse of the initial edifice. Tungurahua II collapsed about 3,000 years ago and produced a large debris-avalanche deposit to the west. The modern glacier-capped stratovolcano (Tungurahua III) was constructed within the landslide scarp. Historical eruptions have all originated from the summit crater, accompanied by strong explosions and sometimes by pyroclastic flows and lava flows that reached populated areas at the volcano's base. Prior to a long-term eruption beginning in 1999 that caused the temporary evacuation of the city of Baños at the foot of the volcano, the last major eruption had occurred from 1916 to 1918, although minor activity continued until 1925.
Information Contacts: Geophysical Institute (IG), Escuela Politécnica Nacional, Apartado 17-01-2759, Quito, Ecuador (URL: http://www.igepn.edu.ec/); Washington Volcanic Ash Advisory Center (VAAC), Satellite Analysis Branch (SAB), NOAA/NESDIS E/SP23, NOAA Science Center Room 401, 5200 Auth Road, Camp Springs, MD 20746, USA (URL: http://www.ospo.noaa.gov/Products/atmosphere/vaac/); International Federation of Red Cross And Red Crescent Societies (IFRC) (URL: https://reliefweb.int/); Agence France-Presse (URL: http://www.afp.com/); Associated Press (URL: http://www.ap.org/).
Whakaari/White Island (New Zealand) — December 2006 Cite this Report
Whakaari/White Island
New Zealand
37.52°S, 177.18°E; summit elev. 294 m
All times are local (unless otherwise noted)
Relative quite prevails during 2005-6
Between June 2005 and December 2006, seismic activity remained low at White Island. According to the Institute of Geological and Nuclear Sciences (GNS), observers have occasionally seen elevated levels of sulfur gases (sulfur dioxide, hydrogen sulfide) and carbon dioxide, as well as periods of micro-earthquakes and steam plumes. Minor changes in fumarole activity have also occurred. The crater lake has remained well below the overflow level. As of 15 December 2006, White Island remained at Alert Level 1 (some signs of volcano unrest).
Franz Jeker visited White Island on 9 January 2005 and took a series of photos showing some crater features (figures 47-49). Images from a web camera located on the crater rim show that no significant change in activity has occurred as of 9 February 2007 (figure 50).
Geologic Background. The uninhabited Whakaari/White Island is the 2 x 2.4 km emergent summit of a 16 x 18 km submarine volcano in the Bay of Plenty about 50 km offshore of North Island. The island consists of two overlapping andesitic-to-dacitic stratovolcanoes. The SE side of the crater is open at sea level, with the recent activity centered about 1 km from the shore close to the rear crater wall. Volckner Rocks, sea stacks that are remnants of a lava dome, lie 5 km NW. Descriptions of volcanism since 1826 have included intermittent moderate phreatic, phreatomagmatic, and Strombolian eruptions; activity there also forms a prominent part of Maori legends. The formation of many new vents during the 19th and 20th centuries caused rapid changes in crater floor topography. Collapse of the crater wall in 1914 produced a debris avalanche that buried buildings and workers at a sulfur-mining project. Explosive activity in December 2019 took place while tourists were present, resulting in many fatalities. The official government name Whakaari/White Island is a combination of the full Maori name of Te Puia o Whakaari ("The Dramatic Volcano") and White Island (referencing the constant steam plume) given by Captain James Cook in 1769.
Information Contacts: Institute of Geological and Nuclear Sciences (GNS), Private Bag 2000, Wairakwi, New Zealand (URL: http://www.gns.cri.nz/); GeoNet, a project sponsored by the New Zealand Government through these agencies: Earthquake Commission (E.C.), Geological and Nuclear Sciences (GNS), and Foundation for Research, Science and Technology (FAST) (URL: http://www.geonet.org.nz/); Franz Jeker, Rigistrasse 10, 8173 Neerach, Switzerland.