Recently Published Bulletin Reports
Manam (Papua New Guinea) Few ash plumes during November-December 2022
Krakatau (Indonesia) Strombolian activity and ash plumes during November 2022-April 2023
Stromboli (Italy) Strombolian explosions and lava flows continue during January-April 2023
Nishinoshima (Japan) Small ash plumes and fumarolic activity during November 2022 through April 2023
Karangetang (Indonesia) Lava flows, incandescent avalanches, and ash plumes during January-June 2023
Ahyi (United States) Intermittent hydroacoustic signals and discolored plumes during November 2022-June 2023
Kadovar (Papua New Guinea) An ash plume and weak thermal anomaly during May 2023
San Miguel (El Salvador) Small gas-and-ash explosions during March and May 2023
Ebeko (Russia) Continued explosions, ash plumes, and ashfall during October 2022-May 2023
Home Reef (Tonga) Discolored plumes continued during November 2022-April 2023
Semisopochnoi (United States) Occasional explosions, ash deposits, and gas-and-steam plumes during December 2022-May 2023
Ambae (Vanuatu) New lava flow, ash plumes, and sulfur dioxide plumes during February-May 2023
Manam (Papua New Guinea) — July 2023  Cite this Report
Manam
Papua New Guinea
4.08°S, 145.037°E; summit elev. 1807 m
All times are local (unless otherwise noted)
Few ash plumes during November-December 2022
Manam is a 10-km-wide island that consists of two active summit craters: the Main summit crater and the South summit crater and is located 13 km off the northern coast of mainland Papua New Guinea. Frequent mild-to-moderate eruptions have been recorded since 1616. The current eruption period began during June 2014 and has more recently been characterized by intermittent ash plumes and thermal activity (BGVN 47:11). This report updates activity that occurred from November 2022 through May 2023 based on information from the Darwin Volcanic Ash Advisory Center (VAAC) and various satellite data.
Ash plumes were reported during November and December 2022 by the Darwin VAAC. On 7 November an ash plume rose to 2.1 km altitude and drifted NE based on satellite images and weather models. On 14 November an ash plume rose to 2.1 km altitude and drifted W based on RVO webcam images. On 20 November ash plumes rose to 1.8 km altitude and drifted NW. On 26 December an ash plume rose to 3 km altitude and drifted S and SSE.
Intermittent sulfur dioxide plumes were detected using the TROPOMI instrument on the Sentinel-5P satellite, some of which exceeded at least two Dobson Units (DU) and drifted in different directions (figure 93). Occasional low-to-moderate power thermal anomalies were recorded by the MIROVA (Middle InfraRed Observation of Volcanic Activity) system; less than five anomalies were recorded each month during November 2022 through May 2023 (figure 94). Two thermal hotspots were detected by the MODVOLC thermal alerts system on 10 December 2022. On clear weather days, thermal activity was also captured in infrared satellite imagery in both the Main and South summit craters, accompanied by gas-and-steam emissions (figure 95).
Geologic Background. The 10-km-wide island of Manam, lying 13 km off the northern coast of mainland Papua New Guinea, is one of the country's most active volcanoes. Four large radial valleys extend from the unvegetated summit of the conical basaltic-andesitic stratovolcano to its lower flanks. These valleys channel lava flows and pyroclastic avalanches that have sometimes reached the coast. Five small satellitic centers are located near the island's shoreline on the northern, southern, and western sides. Two summit craters are present; both are active, although most observed eruptions have originated from the southern crater, concentrating eruptive products during much of the past century into the SE valley. Frequent eruptions, typically of mild-to-moderate scale, have been recorded since 1616. Occasional larger eruptions have produced pyroclastic flows and lava flows that reached flat-lying coastal areas and entered the sea, sometimes impacting populated areas.
Information Contacts: Rabaul Volcano Observatory (RVO), Geohazards Management Division, Department of Mineral Policy and Geohazards Management (DMPGM), PO Box 3386, Kokopo, East New Britain Province, Papua New Guinea; Darwin Volcanic Ash Advisory Centre (VAAC), Bureau of Meteorology, Northern Territory Regional Office, PO Box 40050, Casuarina, NT 0811, Australia (URL: http://www.bom.gov.au/info/vaac/); MIROVA (Middle InfraRed Observation of Volcanic Activity), a collaborative project between the Universities of Turin and Florence (Italy) supported by the Centre for Volcanic Risk of the Italian Civil Protection Department (URL: http://www.mirovaweb.it/); Hawai'i Institute of Geophysics and Planetology (HIGP) - MODVOLC Thermal Alerts System, School of Ocean and Earth Science and Technology (SOEST), Univ. of Hawai'i, 2525 Correa Road, Honolulu, HI 96822, USA (URL: http://modis.higp.hawaii.edu/); NASA Global Sulfur Dioxide Monitoring Page, Atmospheric Chemistry and Dynamics Laboratory, NASA Goddard Space Flight Center (NASA/GSFC), 8800 Greenbelt Road, Goddard, Maryland, USA (URL: https://so2.gsfc.nasa.gov/); Copernicus Browser, Copernicus Data Space Ecosystem, European Space Agency (URL: https://dataspace.copernicus.eu/browser/).
Krakatau (Indonesia) — July 2023 Cite this Report
Krakatau
Indonesia
6.1009°S, 105.4233°E; summit elev. 285 m
All times are local (unless otherwise noted)
Strombolian activity and ash plumes during November 2022-April 2023
Krakatau is located in the Sunda Strait between Java and Sumatra, Indonesia. Caldera collapse during the catastrophic 1883 eruption destroyed Danan and Perbuwatan cones and left only a remnant of Rakata. The post-collapse cone of Anak Krakatau (Child of Krakatau) was constructed within the 1883 caldera at a point between the former Danan and Perbuwatan cones; it has been the site of frequent eruptions since 1927. The current eruption period began in May 2021 and has recently consisted of explosions, ash plumes, and thermal activity (BGVN 47:11). This report covers activity during November 2022 through April 2023 based on information provided by the Indonesian Center for Volcanology and Geological Hazard Mitigation, referred to as Pusat Vulkanologi dan Mitigasi Bencana Geologi (PVMBG), MAGMA Indonesia, the Darwin Volcanic Ash Advisory Center (VAAC), and several sources of satellite data.
Activity was relatively low during November and December 2022. Daily white gas-and-steam plumes rose 25-100 m above the summit and drifted in different directions. Gray ash plumes rose 200 m above the summit and drifted NE at 1047 and at 2343 on 11 November. On 14 November at 0933 ash plumes rose 300 m above the summit and drifted E. An ash plume was reported at 0935 on 15 December that rose 100 m above the summit and drifted NE. An eruptive event at 1031 later that day generated an ash plume that rose 700 m above the summit and drifted NE. A gray ash plume at 1910 rose 100 m above the summit and drifted E. Incandescent material was ejected above the vent based on an image taken at 1936.
During January 2023 daily white gas-and-steam plumes rose 25-300 m above the summit and drifted in multiple directions. Gray-to-brown ash plumes were reported at 1638 on 3 January, at 1410 and 1509 on 4 January, and at 0013 on 5 January that rose 100-750 m above the summit and drifted NE and E; the gray-to-black ash plume at 1509 on 4 January rose as high as 3 km above the summit and drifted E. Gray ash plumes were recorded at 1754, 2241, and 2325 on 11 January and at 0046 on 12 January and rose 200-300 m above the summit and drifted NE. Toward the end of January, PVMBG reported that activity had intensified; Strombolian activity was visible in webcam images taken at 0041, 0043, and 0450 on 23 January. Multiple gray ash plumes throughout the day rose 200-500 m above the summit and drifted E and SE (figure 135). Webcam images showed progressively intensifying Strombolian activity at 1919, 1958, and 2113 on 24 January; a gray ash plume at 1957 rose 300 m above the summit and drifted E (figure 135). Eruptive events at 0231 and 2256 on 25 January and at 0003 on 26 January ejected incandescent material from the vent, based on webcam images. Gray ash plumes observed during 26-27 January rose 300-500 m above the summit and drifted NE, E, and SE.
Low levels of activity were reported during February and March. Daily white gas-and-steam plumes rose 25-300 m above the summit and drifted in different directions. The Darwin VAAC reported that continuous ash emissions rose to 1.5-1.8 km altitude and drifted W and NW during 1240-1300 on 10 March, based on satellite images, weather models, and PVMBG webcams. White-and-gray ash plumes rose 500 m and 300 m above the summit and drifted SW at 1446 and 1846 on 18 March, respectively. An eruptive event was recorded at 2143, though it was not visible due to darkness. Multiple ash plumes were reported during 27-29 March that rose as high as 2.5 km above the summit and drifted NE, W, and SW (figure 136). Webcam images captured incandescent ejecta above the vent at 0415 and around the summit area at 2003 on 28 March and at 0047 above the vent on 29 March.
Daily white gas-and-steam plumes rose 25-300 m above the summit and drifted in multiple directions during April and May. White-and-gray and black plumes rose 50-300 m above the summit on 2 and 9 April. On 11 May at 1241 a gray ash plume rose 1-3 km above the summit and drifted SW. On 12 May at 0920 a gray ash plume rose 2.5 km above the summit and drifted SW and at 2320 an ash plume rose 1.5 km above the summit and drifted SW. An accompanying webcam image showed incandescent ejecta. On 13 May at 0710 a gray ash plume rose 2 km above the summit and drifted SW (figure 137).
The MIROVA (Middle InfraRed Observation of Volcanic Activity) graph of MODIS thermal anomaly data showed intermittent low-to-moderate power thermal anomalies during November 2022 through April 2023 (figure 138). Some of this thermal activity was also visible in infrared satellite imagery at the crater, accompanied by gas-and-steam and ash plumes that drifted in different directions (figure 139).
Geologic Background. The renowned Krakatau (frequently mis-named as Krakatoa) volcano lies in the Sunda Strait between Java and Sumatra. Collapse of an older edifice, perhaps in 416 or 535 CE, formed a 7-km-wide caldera. Remnants of that volcano are preserved in Verlaten and Lang Islands; subsequently the Rakata, Danan, and Perbuwatan cones were formed, coalescing to create the pre-1883 Krakatau Island. Caldera collapse during the catastrophic 1883 eruption destroyed Danan and Perbuwatan, and left only a remnant of Rakata. This eruption caused more than 36,000 fatalities, most as a result of tsunamis that swept the adjacent coastlines of Sumatra and Java. Pyroclastic surges traveled 40 km across the Sunda Strait and reached the Sumatra coast. After a quiescence of less than a half century, the post-collapse cone of Anak Krakatau (Child of Krakatau) was constructed within the 1883 caldera at a point between the former Danan and Perbuwatan cones. Anak Krakatau has been the site of frequent eruptions since 1927.
Information Contacts: Pusat Vulkanologi dan Mitigasi Bencana Geologi (PVMBG, also known as Indonesian Center for Volcanology and Geological Hazard Mitigation, CVGHM), Jalan Diponegoro 57, Bandung 40122, Indonesia (URL: http://www.vsi.esdm.go.id/); MAGMA Indonesia, Kementerian Energi dan Sumber Daya Mineral (URL: https://magma.esdm.go.id/v1); Darwin Volcanic Ash Advisory Centre (VAAC), Bureau of Meteorology, Northern Territory Regional Office, PO Box 40050, Casuarina, NT 0811, Australia (URL: http://www.bom.gov.au/info/vaac/); MIROVA (Middle InfraRed Observation of Volcanic Activity), a collaborative project between the Universities of Turin and Florence (Italy) supported by the Centre for Volcanic Risk of the Italian Civil Protection Department (URL: http://www.mirovaweb.it/); Copernicus Browser, Copernicus Data Space Ecosystem, European Space Agency (URL: https://dataspace.copernicus.eu/browser/).
Stromboli
Italy
38.789°N, 15.213°E; summit elev. 924 m
All times are local (unless otherwise noted)
Strombolian explosions and lava flows continue during January-April 2023
Stromboli, located in Italy, has exhibited nearly constant lava fountains for the past 2,000 years; recorded eruptions date back to 350 BCE. Eruptive activity occurs at the summit from multiple vents, which include a north crater area (N area) and a central-southern crater (CS area) on a terrace known as the ‘terrazza craterica’ at the head of the Sciara del Fuoco, a large scarp that runs from the summit down the NW side of the volcano-island. Activity typically consists of Strombolian explosions, incandescent ejecta, lava flows, and pyroclastic flows. Thermal and visual monitoring cameras are located on the nearby Pizzo Sopra La Fossa, above the terrazza craterica, and at multiple flank locations. The current eruption period has been ongoing since 1934 and recent activity has consisted of frequent Strombolian explosions and lava flows (BGVN 48:02). This report updates activity during January through April 2023 primarily characterized by Strombolian explosions and lava flows based on reports from Italy's Istituto Nazionale di Geofisica e Vulcanologia (INGV) and various satellite data.
Frequent explosive activity continued throughout the reporting period, generally in the low-to-medium range, based on the number of hourly explosions in the summit crater (figure 253, table 16). Intermittent thermal activity was recorded by the MIROVA (Middle InfraRed Observation of Volcanic Activity) analysis of MODIS satellite data (figure 254). According to data collected by the MODVOLC thermal algorithm, a total of 9 thermal alerts were detected: one on 2 January 2023, one on 1 February, five on 24 March, and two on 26 March. The stronger pulses of thermal activity likely reflected lava flow events. Infrared satellite imagery captured relatively strong thermal hotspots at the two active summit craters on clear weather days, showing an especially strong event on 8 March (figure 255).
Table 16. Summary of type, frequency, and intensity of explosive activity at Stromboli by month during January-April 2023; information from webcam observations. Courtesy of INGV weekly reports.
| Month |
Explosive Activity |
| Jan 2023 |
Typical Strombolian activity with spattering and lava overflows in the N crater area. Explosions were reported from 4 vents in the N area and 1-2 vents in the CS area. The average hourly frequency of explosions was low-to-medium (1-12 events/hour). The intensity of the explosions varied from low (less than 80 m high) to medium (less than 150 m high) in the N crater area and up to high (greater than 150 m high) in the CS crater area. |
| Feb 2023 |
Typical Strombolian activity with spattering in the N crater area. Explosions were reported from 2-3 vents in the N area and 1-4 vents in the CS area. The average hourly frequency of explosions was low-to-medium (1-14 events/hour). The intensity of the explosions varied from low (less than 80 m high) to medium (less than 150 m high) in the N crater area and up to high (greater than 150 m high) in the CS crater area. |
| Mar 2023 |
Typical Strombolian activity with spattering and lava overflows in the N crater area. Explosions were reported from 2-3 vents in the N area and 2-4 vents in the CS area. The average hourly frequency of explosions was low-to-medium (1-18 events/hour). The intensity of the explosions varied from low (less than 80 m high) to medium (less than 150 m high) in the N crater area and up to high (greater than 150 m high) in the CS crater area. |
| Apr 2023 |
Typical Strombolian activity. Explosions were reported from 2 vents in the N area and 2-3 vents in the CS area. The average hourly frequency of explosions was low-to-high (1-16 events/hour). The intensity of the explosions varied from low (less than 80 m high) to medium (less than 150 m high) in both the N and CS crater areas. |
Activity during January-February 2023. Strombolian explosions were reported in the N crater area, as well as lava effusion. Explosive activity in the N crater area ejected coarse material (bombs and lapilli). Intense spattering was observed in both the N1 and N2 craters. In the CS crater area, explosions generally ejected fine material (ash), sometimes to heights greater than 250 m. The intensity of the explosions was characterized as low-to-medium in the N crater and medium-to-high in the CS crater. After intense spattering activity from the N crater area, a lava overflow began at 2136 on 2 January that flowed part way down the Sciara del Fuoco, possibly moving down the drainage that formed in October, out of view from webcams. The flow remained active for a couple of hours before stopping and beginning to cool. A second lava flow was reported at 0224 on 4 January that similarly remained active for a few hours before stopping and cooling. Intense spattering was observed on 11 and 13 January from the N1 crater. After intense spattering activity at the N2 crater at 1052 on 17 January another lava flow started to flow into the upper part of the Sciara del Fuoco (figure 256), dividing into two: one that traveled in the direction of the drainage formed in October, and the other one moving parallel to the point of emission. By the afternoon, the rate of the flow began to decrease, and at 1900 it started to cool. A lava flow was reported at 1519 on 24 January following intense spattering in the N2 area, which began to flow into the upper part of the Sciara del Fuoco. By the morning of 25 January, the lava flow had begun to cool. During 27 January the frequency of eruption in the CS crater area increased to 6-7 events/hour compared to the typical 1-7 events/hour; the following two days showed a decrease in frequency to less than 1 event/hour. Starting at 1007 on 30 January a high-energy explosive sequence was produced by vents in the CS crater area. The sequence began with an initial energetic pulse that lasted 45 seconds, ejecting predominantly coarse products 300 m above the crater that fell in an ESE direction. Subsequent and less intense explosions ejected material 100 m above the crater. The total duration of this event lasted approximately two minutes. During 31 January through 6, 13, and 24 February spattering activity was particularly intense for short periods in the N2 crater.
An explosive sequence was reported on 16 February that was characterized by a major explosion in the CS crater area (figure 257). The sequence began at 1817 near the S2 crater that ejected material radially. A few seconds later, lava fountains were observed in the central part of the crater. Three explosions of medium intensity (material was ejected less than 150 m high) were recorded at the S2 crater. The first part of this sequence lasted approximately one minute, according to INGV, and material rose 300 m above the crater and then was deposited along the Sciara del Fuoco. The second phase began at 1818 at the S1 crater; it lasted seven seconds and material was ejected 150 m above the crater. Another event 20 seconds later lasted 12 seconds, also ejecting material 150 m above the crater. The sequence ended with at least three explosions of mostly fine material from the S1 crater. The total duration of this sequence was about two minutes.
Short, intense spattering activity was noted above the N1 crater on 27 and 28 February. A lava overflow was first reported at 0657 from the N2 crater on 27 February that flowed into the October 2022 drainage. By 1900 the flow had stopped. A second lava overflow also in the N crater area occurred at 2149, which overlapped the first flow and then stopped by 0150 on 28 February. Material detached from both the lava overflows rolled down the Sciara del Fuoco, some of which was visible in webcam images.
Activity during March-April 2023. Strombolian activity continued with spattering activity and lava overflows in the N crater area during March. Explosive activity at the N crater area varied from low (less than 80 m high) to medium (less than 150 m high) and ejected coarse material, such as bombs and lapilli. Spattering was observed above the N1 crater, while explosive activity at the CS crater area varied from medium to high (greater than 150 m high) and ejected coarse material. Intense spattering activity was observed for short periods on 6 March above the N1 crater. At approximately 0610 a lava overflow was reported around the N2 crater on 8 March, which then flowed into the October 2022 drainage. By 1700 the flow started to cool. A second overflow began at 1712 on 9 March and overlapped the previous flow. It had stopped by 2100. Material from both flows was deposited along the Sciara del Fuoco, though much of the activity was not visible in webcam images. On 11 March a lava overflow was observed at 0215 that overlapped the two previous flows in the October 2022 drainage. By late afternoon on 12 March, it had stopped.
During a field excursion on 16 March, scientists noted that a vent in the central crater area was degassing. Another vent showed occasional Strombolian activity that emitted ash and lapilli. During 1200-1430 low-to-medium intense activity was reported; the N1 crater emitted ash emissions and the N2 crater emitted both ash and coarse material. Some explosions also occurred in the CS crater area that ejected coarse material. The C crater in the CS crater area occasionally showed gas jetting and low intensity explosions on 17 and 22 March; no activity was observed at the S1 crater. Intense, longer periods of spattering were reported in the N1 crater on 19, 24, and 25 March. Around 2242 on 23 March a lava overflow began from the N1 crater that, after about an hour, began moving down the October 2022 drainage and flow along the Sciara del Fuoco (figure 258). Between 0200 and 0400 on 26 March the flow rate increased, which generated avalanches of material from collapses at the advancing flow front. By early afternoon, the flow began to cool. On 25 March at 1548 an explosive sequence began from one of the vents at S2 in the CS crater area (figure 258). Fine ash mixed with coarse material was ejected 300 m above the crater rim and drifted SSE. Some modest explosions around Vent C were detected at 1549 on 25 March, which included an explosion at 1551 that ejected coarse material. The entire explosive sequence lasted approximately three minutes.
During April explosions persisted in both the N and CS crater areas. Fine material was ejected less than 80 m above the N crater rim until 6 April, followed by ejection of coarser material. Fine material was also ejected less than 80 m above the CS crater rim. The C and S2 crater did not show significant eruptive activity. On 7 April an explosive sequence was detected in the CS crater area at 1203 (figure 259). The first explosion lasted approximately 18 seconds and ejected material 400 m above the crater rim, depositing pyroclastic material in the upper part of the Sciara del Fuoco. At 1204 a second, less intense explosion lasted approximately four seconds and deposited pyroclastic products outside the crater area and near Pizzo Sopra La Fossa. A third explosion at 1205 was mainly composed of ash that rose about 150 m above the crater and lasted roughly 20 seconds. A fourth explosion occurred at 1205 about 28 seconds after the third explosion and ejected a mixture of coarse and fine material about 200 m above the crater; the explosion lasted roughly seven seconds. Overall, the entire explosive sequence lasted about two minutes and 20 seconds. After the explosive sequence on 7 April, explosions in both the N and CS crater areas ejected material as high as 150 m above the crater.
On 21 April research scientists from INGV made field observations in the summit area of Stromboli, and some lapilli samples were collected. In the N crater area near the N1 crater, a small cone was observed with at least two active vents, one of which was characterized by Strombolian explosions. The other vent produced explosions that ejected ash and chunks of cooled lava. At the N2 crater at least one vent was active and frequently emitted ash. In the CS crater area, a small cone contained 2-3 degassing vents and a smaller, possible fissure area also showed signs of degassing close to the Pizzo Sopra La Fossa. In the S part of the crater, three vents were active: a small hornito was characterized by modest and rare explosions, a vent that intermittently produced weak Strombolian explosions, and a vent at the end of the terrace that produced frequent ash emissions. Near the S1 crater there was a hornito that generally emitted weak gas-and-steam emissions, sometimes associated with “gas rings”. On 22 April another field inspection was carried out that reported two large sliding surfaces on the Sciara del Fuoco that showed where blocks frequently descended toward the sea. A thermal anomaly was detected at 0150 on 29 April.
Geologic Background. Spectacular incandescent nighttime explosions at Stromboli have long attracted visitors to the "Lighthouse of the Mediterranean" in the NE Aeolian Islands. This volcano has lent its name to the frequent mild explosive activity that has characterized its eruptions throughout much of historical time. The small island is the emergent summit of a volcano that grew in two main eruptive cycles, the last of which formed the western portion of the island. The Neostromboli eruptive period took place between about 13,000 and 5,000 years ago. The active summit vents are located at the head of the Sciara del Fuoco, a prominent scarp that formed about 5,000 years ago due to a series of slope failures which extends to below sea level. The modern volcano has been constructed within this scarp, which funnels pyroclastic ejecta and lava flows to the NW. Essentially continuous mild Strombolian explosions, sometimes accompanied by lava flows, have been recorded for more than a millennium.
Information Contacts: Istituto Nazionale di Geofisica e Vulcanologia (INGV), Sezione di Catania, Piazza Roma 2, 95123 Catania, Italy, (URL: http://www.ct.ingv.it/en/); MIROVA (Middle InfraRed Observation of Volcanic Activity), a collaborative project between the Universities of Turin and Florence (Italy) supported by the Centre for Volcanic Risk of the Italian Civil Protection Department (URL: http://www.mirovaweb.it/); Hawai'i Institute of Geophysics and Planetology (HIGP) - MODVOLC Thermal Alerts System, School of Ocean and Earth Science and Technology (SOEST), Univ. of Hawai'i, 2525 Correa Road, Honolulu, HI 96822, USA (URL: http://modis.higp.hawaii.edu/); Copernicus Browser, Copernicus Data Space Ecosystem, European Space Agency (URL: https://dataspace.copernicus.eu/browser/).
Nishinoshima (Japan) — July 2023 Cite this Report
Nishinoshima
Japan
27.247°N, 140.874°E; summit elev. 100 m
All times are local (unless otherwise noted)
Small ash plumes and fumarolic activity during November 2022 through April 2023
Nishinoshima is a small island located about 1,000 km S of Tokyo in the Ogasawara Arc in Japan. The island is the summit of a massive submarine volcano that has prominent peaks to the S, W, and NE. Eruptions date back to 1973; the most recent eruption period began in October 2022 and was characterized by ash plumes and fumarolic activity (BGVN 47:12). This report describes ash plumes and fumarolic activity during November 2022 through April 2023 based on monthly reports from the Japan Meteorological Agency (JMA) monthly reports and satellite data.
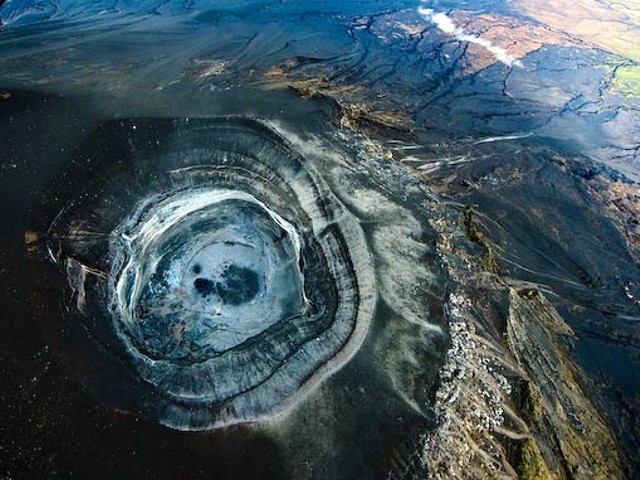
The most recent eruptive activity prior to the reporting internal occurred on 12 October 2022, when an ash plume rose 3.5 km above the crater rim. An aerial observation conducted by the Japan Coast Guard (JCG) on 25 November reported that white fumaroles rose approximately 200 m above the central crater of a pyroclastic cone (figure 119), and multiple plumes were observed on the ESE flank of the cone. Discolored water ranging from reddish-brown to brown and yellowish-green were visible around the perimeter of the island (figure 119). No significant activity was reported in December.
During an overflight conducted by JCG on 25 January 2023 intermittent activity and small, blackish-gray plumes rose 900 m above the central part of the crater were observed (figure 120). The fumarolic zone of the E flank and base of the cone had expanded and emissions had intensified. Dark brown discolored water was visible around the perimeter of the island.
No significant activity was reported during February through March. Ash plumes at 1050 and 1420 on 11 April rose 1.9 km above the crater rim and drifted NW and N. These were the first ash plumes observed since 12 October 2022. On 14 April JCG carried out an overflight and reported that no further eruptive activity was visible, although white gas-and-steam plumes were visible from the central crater and rose 900 m high (figure 121). Brownish and yellow-green discolored water surrounded the island.
Intermittent low-to-moderate power thermal anomalies were recorded in the MIROVA graph (Middle InfraRed Observation of Volcanic Activity) during November 2022 through April 2023 (figure 123). A cluster of six to eight anomalies were detected during November while a smaller number were detected during the following months: two to three during December, one during mid-January 2023, one during February, five during March, and two during April. Thermal activity was also reflected in infrared satellite data at the summit crater, accompanied by occasional gas-and-steam plumes (figure 124).
Geologic Background. The small island of Nishinoshima was enlarged when several new islands coalesced during an eruption in 1973-74. Multiple eruptions that began in 2013 completely covered the previous exposed surface and continued to enlarge the island. The island is the summit of a massive submarine volcano that has prominent peaks to the S, W, and NE. The summit of the southern cone rises to within 214 m of the ocean surface 9 km SSE.
Information Contacts: Japan Meteorological Agency (JMA), 1-3-4 Otemachi, Chiyoda-ku, Tokyo 100-8122, Japan (URL: http://www.jma.go.jp/jma/indexe.html); MIROVA (Middle InfraRed Observation of Volcanic Activity), a collaborative project between the Universities of Turin and Florence (Italy) supported by the Centre for Volcanic Risk of the Italian Civil Protection Department (URL: http://www.mirovaweb.it/); Copernicus Browser, Copernicus Data Space Ecosystem, European Space Agency (URL: https://dataspace.copernicus.eu/browser/).
Karangetang (Indonesia) — July 2023 Cite this Report
Karangetang
Indonesia
2.781°N, 125.407°E; summit elev. 1797 m
All times are local (unless otherwise noted)
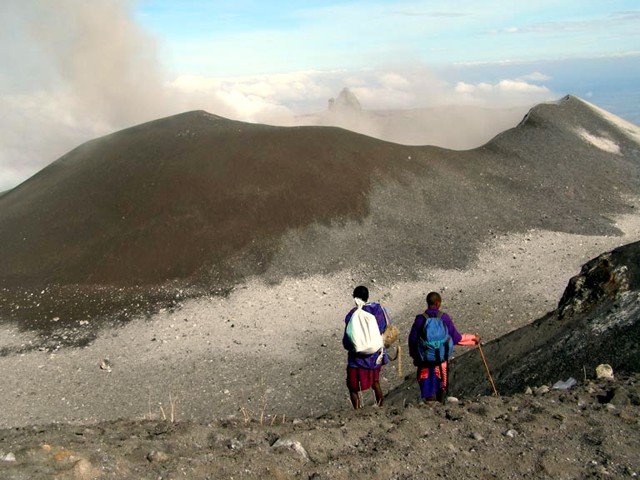
Lava flows, incandescent avalanches, and ash plumes during January-June 2023
Karangetang (also known as Api Siau), at the northern end of the island of Siau, Indonesia, contains five summit craters along a N-S line. More than 40 eruptions have been recorded since 1675; recent eruptions have included frequent explosive activity, sometimes accompanied by pyroclastic flows and lahars. Lava dome growth has occurred in the summit craters and collapses of lava flow fronts have produced pyroclastic flows. The two active summit craters are Kawah Dua (the N crater) and Kawah Utama (the S crater, also referred to as the “Main Crater”). The most recent eruption began in late November 2018 and has more recently consisted of weak thermal activity and gas-and-steam emissions (BGVN 48:01). This report updates activity characterized by lava flows, incandescent avalanches, and ash plumes during January through June 2023 using reports from Pusat Vulkanologi dan Mitigasi Bencana Geologi (PVMBG, also known as CVGHM, or the Center of Volcanology and Geological Hazard Mitigation), MAGMA Indonesia, the Darwin VAAC (Volcano Ash Advisory Center), and satellite data.
Activity during January was relatively low and mainly consisted of white gas-and-steam emissions that rose 25-150 m above Main Crater (S crater) and drifted in different directions. Incandescence was visible from the lava dome in Kawah Dua (the N crater). Weather conditions often prevented clear views of the summit. On 18 January the number of seismic signals that indicated avalanches of material began to increase. In addition, there were a total of 71 earthquakes detected during the month.
Activity continued to increase during the first week of February. Material from Main Crater traveled as far as 800 m down the Batuawang (S) and Batang (W) drainages and as far as 1 km W down the Beha (W) drainage on 4 February. On 6 February 43 earthquake events were recorded, and on 7 February, 62 events were recorded. White gas-and-steam emissions rose 25-250 m above both summit craters throughout the month. PVMBG reported an eruption began during the evening of 8 February around 1700. Photos showed incandescent material at Main Crater. Incandescent material had also descended the flank in at least two unconfirmed directions as far as 2 km from Main Crater, accompanied by ash plumes (figure 60). As a result, PVMBG increased the Volcano Alert Level (VAL) to 3 (the second highest level on a 1-4 scale).
Occasional nighttime webcam images showed three main incandescent lava flows of differing lengths traveling down the S, SW, and W flanks (figure 61). Incandescent rocks were visible on the upper flanks, possibly from ejected or collapsed material from the crater, and incandescence was the most intense at the summit. Based on analyses of satellite imagery and weather models, the Darwin VAAC reported that daily ash plumes during 16-20 February rose to 2.1-3 km altitude and drifted NNE, E, and SE. BNPB reported on 16 February that as many as 77 people were evacuated and relocated to the East Siau Museum. A webcam image taken at 2156 on 17 February possibly showed incandescent material descending the SE flank. Ash plumes rose to 2.1 km altitude and drifted SE during 22-23 February, according to the Darwin VAAC.
Incandescent avalanches of material and summit incandescence at Main Crater continued during March. White gas-and-steam emissions during March generally rose 25-150 m above the summit crater; on 31 March gas-and-steam emissions rose 200-400 m high. An ash plume rose to 2.4 km altitude and drifted S at 1710 on 9 March and a large thermal anomaly was visible in images taken at 0550 and 0930 on 10 March. Incandescent material was visible at the summit and on the flanks based on webcam images taken at 0007 and 2345 on 16 March, at 1828 on 17 March, at 1940 on 18 March, at 2311 on 19 March, and at 2351 on 20 March. Incandescence was most intense on 18 and 20 March and webcam images showed possible Strombolian explosions (figure 62). An ash plume rose to 2.4 km altitude and drifted SW on 18 March, accompanied by a thermal anomaly.
Summit crater incandescence at Main Crater and on the flanks persisted during April. Incandescent material at the S crater and on the flanks was reported at 0016 on 1 April. The lava flows had stopped by 1 April according to PVMBG, although incandescence was still visible up to 10 m high. Seismic signals indicating effusion decreased and by 6 April they were no longer detected. Incandescence was visible from both summit craters. On 26 April the VAL was lowered to 2 (the second lowest level on a 1-4 scale). White gas-and-steam emissions rose 25-200 m above the summit crater.
During May white gas-and-steam emissions generally rose 50-250 m above the summit, though it was often cloudy, which prevented clear views; on 21 May gas-and-steam emissions rose 50-400 m high. Nighttime N summit crater incandescence rose 10-25 m above the lava dome, and less intense incandescence was noted above Main Crater, which reached about 10 m above the dome. Sounds of falling rocks at Main Crater were heard on 15 May and the seismic network recorded 32 rockfall events in the crater on 17 May. Avalanches traveled as far as 1.5 km down the SW and S flanks, accompanied by rumbling sounds on 18 May. Incandescent material descending the flanks was captured in a webcam image at 2025 on 19 May (figure 63) and on 29 May; summit crater incandescence was observed in webcam images at 2332 on 26 May and at 2304 on 29 May. On 19 May the VAL was again raised to 3.
Occasional Main Crater incandescence was reported during June, as well as incandescent material on the flanks. White gas-and-steam emissions rose 10-200 m above the summit crater. Ash plumes rose to 2.1 km altitude and drifted SE and E during 2-4 June, according to the Darwin VAAC. Material on the flanks of Main Crater were observed at 2225 on 7 June, at 2051 on 9 June, at 0007 on 17 June, and at 0440 on 18 June. Webcam images taken on 21, 25, and 27 June showed incandescence at Main Crater and from material on the flanks.
MIROVA (Middle InfraRed Observation of Volcanic Activity) analysis of MODIS satellite data showed strong thermal activity during mid-February through March and mid-May through June, which represented incandescent avalanches and lava flows (figure 64). During April through mid-May the power of the anomalies decreased but frequent anomalies were still detected. Brief gaps in activity occurred during late March through early April and during mid-June. Infrared satellite images showed strong lava flows mainly affecting the SW and S flanks, accompanied by gas-and-steam emissions (figure 65). According to data recorded by the MODVOLC thermal algorithm, there were a total of 79 thermal hotspots detected: 28 during February, 24 during March, one during April, five during May, and 21 during June.
Geologic Background. Karangetang (Api Siau) volcano lies at the northern end of the island of Siau, about 125 km NNE of the NE-most point of Sulawesi. The stratovolcano contains five summit craters along a N-S line. It is one of Indonesia's most active volcanoes, with more than 40 eruptions recorded since 1675 and many additional small eruptions that were not documented (Neumann van Padang, 1951). Twentieth-century eruptions have included frequent explosive activity sometimes accompanied by pyroclastic flows and lahars. Lava dome growth has occurred in the summit craters; collapse of lava flow fronts have produced pyroclastic flows.
Information Contacts: Pusat Vulkanologi dan Mitigasi Bencana Geologi (PVMBG, also known as Indonesian Center for Volcanology and Geological Hazard Mitigation, CVGHM), Jalan Diponegoro 57, Bandung 40122, Indonesia (URL: http://www.vsi.esdm.go.id/); MAGMA Indonesia, Kementerian Energi dan Sumber Daya Mineral (URL: https://magma.esdm.go.id/v1); Badan Nasional Penanggulangan Bencana (BNPB), National Disaster Management Agency, Graha BNPB - Jl. Scout Kav.38, East Jakarta 13120, Indonesia (URL: http://www.bnpb.go.id/); Darwin Volcanic Ash Advisory Centre (VAAC), Bureau of Meteorology, Northern Territory Regional Office, PO Box 40050, Casuarina, NT 0811, Australia (URL: http://www.bom.gov.au/info/vaac/); MIROVA (Middle InfraRed Observation of Volcanic Activity), a collaborative project between the Universities of Turin and Florence (Italy) supported by the Centre for Volcanic Risk of the Italian Civil Protection Department (URL: http://www.mirovaweb.it/); Hawai'i Institute of Geophysics and Planetology (HIGP) - MODVOLC Thermal Alerts System, School of Ocean and Earth Science and Technology (SOEST), Univ. of Hawai'i, 2525 Correa Road, Honolulu, HI 96822, USA (URL: http://modis.higp.hawaii.edu/); Copernicus Browser, Copernicus Data Space Ecosystem, European Space Agency (URL: https://dataspace.copernicus.eu/browser/); IDN Times, Jl. Jend. Gatot Subroto Kav. 27 3rd Floor Kuningan, Jakarta, Indonesia 12950, Status of Karangetang Volcano in Sitaro Islands Increases (URL: https://sulsel.idntimes.com/news/indonesia/savi/status-gunung-api-karangetang-di-kepulauan-sitaro-meningkat?page=all).
Ahyi (United States) — July 2023 Cite this Report
Ahyi
United States
20.42°N, 145.03°E; summit elev. -75 m
All times are local (unless otherwise noted)
Intermittent hydroacoustic signals and discolored plumes during November 2022-June 2023
Ahyi seamount is a large, conical submarine volcano that rises to within 75 m of the ocean surface about 18 km SE of the island of Farallon de Pajaros in the Northern Marianas. The remote location of the seamount has made eruptions difficult to document, but seismic stations installed in the region confirmed an eruption in the vicinity in 2001. No new activity was detected until April-May 2014 when an eruption was detected by NOAA (National Oceanic and Atmospheric Administration) divers, hydroacoustic sensors, and seismic stations (BGVN 42:04). New activity was first detected on 15 November by hydroacoustic sensors that were consistent with submarine volcanic activity. This report covers activity during November 2022 through June 2023 based on daily and weekly reports from the US Geological Survey.
Starting in mid-October, hydroacoustic sensors at Wake Island (2.2 km E) recorded signals consistent with submarine volcanic activity, according to a report from the USGS issued on 15 November 2022. A combined analysis of the hydroacoustic signals and seismic stations located at Guam and Chichijima Island, Japan, suggested that the source of this activity was at or near the Ahyi seamount. After a re-analysis of a satellite image of the area that was captured on 6 November, USGS confirmed that there was no evidence of discoloration at the ocean surface. Few hydroacoustic and seismic signals continued through November, including on 18 November, which USGS suggested signified a decline or pause in unrest. A VONA (Volcano Observatory Notice for Aviation) reported that a discolored water plume was persistently visible in satellite data starting on 18 November (figure 6). Though clouds often obscured clear views of the volcano, another discolored water plume was captured in a satellite image on 26 November. The Aviation Color Code (ACC) was raised to Yellow (the second lowest level on a four-color scale) and the Volcano Alert Level (VAL) was raised to Advisory (the second lowest level on a four-level scale) on 29 November.
During December, occasional detections were recorded on the Wake Island hydrophone sensors and discolored water over the seamount remained visible. During 2-7, 10-12, and 16-31 December possible explosion signals were detected. A small area of discolored water was observed in high-resolution Sentinel-2 satellite images during 1-6 December (figure 7). High-resolution satellite images recorded discolored water plumes on 13 December that originated from the summit region; no observations indicated that activity breached the ocean surface. A possible underwater plume was visible in satellite images on 18 December, and during 19-20 December a definite but diffuse underwater plume located SSE from the main vent was reported. An underwater plume was visible in a satellite image taken on 26 December (figure 7).
Hydrophone sensors continued to detect signals consistent with possible explosions during 1-8 January 2023. USGS reported that the number of detections decreased during 4-5 January. The hydrophone sensors experienced a data outage that started at 0118 on 8 January and continued through 10 January, though according to USGS, possible explosions were recorded prior to the data outage and likely continued during the outage. A discolored water plume originating from the summit region was detected in a partly cloudy satellite image on 8 January. On 11-12 and 15-17 January possible explosion signals were recorded again. One small signal was detected during 22-23 January and several signals were recorded on 25 and 31 January. During 27-31 January a plume of discolored water was observed above the seamount in satellite imagery (figure 8).
Low levels of activity continued during February and March, based on data from pressure sensors on Wake Island. During 1 and 4-6 February activity was reported, and a submarine plume was observed on 4 February (figure 8). Possible explosion signals were detected during 7-8, 10, 13-14, and 24 February. During 1-2 and 3-5 March a plume of discolored water was observed in satellite imagery (figure 8). Almost continuous hydroacoustic signals were detected in remote pressure sensor data on Wake Island 2,270 km E from the volcano during 7-13 March. During 12-13 March water discoloration around the seamount was observed in satellite imagery, despite cloudy weather. By 14 March discolored water extended about 35 km, but no direction was noted. USGS reported that the continuous hydroacoustic signals detected during 13-14 March stopped abruptly on 14 March and no new detections were observed. Three 30 second hydroacoustic detections were reported during 17-19 March, but no activity was visible due to cloudy weather. A data outage was reported during 21-22 March, making pressure sensor data unavailable; a discolored water plume was, however, visible in satellite data. A possible underwater explosion signal was detected by pressure sensors at Wake Island on 26, 29, and 31 March, though the cause and origin of these events were unclear.
Similar low activity continued during April, May, and June. Several signals were detected during 1-3 April in pressure sensors at Wake Island. USGS suggested that these may be related to underwater explosions or earthquakes at the volcano, but no underwater plumes were visible in clear satellite images. The pressure sensors had data outages during 12-13 April and no data were recorded; no underwater plumes were visible in satellite images, although cloudy weather obscured most clear views. Eruptive activity was reported starting at 2210 on 21 May. On 22 May a discolored water plume that extended 4 km was visible in satellite images, though no direction was recorded. During 23-24 May some signals were detected by the underwater pressure sensors. Possible hydroacoustic signals were detected during 2-3 and 6-8 June. Multiple hydroacoustic signals were detected during 9-11 and 16-17 June, although no activity was visible in satellite images. One hydroacoustic signal was detected during 23-24 June, but there was some uncertainty about its association with volcanic activity. A single possible hydroacoustic signal was detected during 30 June to 1 July.
Geologic Background. Ahyi seamount is a large conical submarine volcano that rises to within 75 m of the ocean surface ~18 km SE of the island of Farallon de Pajaros in the northern Marianas. Water discoloration has been observed there, and in 1979 the crew of a fishing boat felt shocks over the summit area, followed by upwelling of sulfur-bearing water. On 24-25 April 2001 an explosive eruption was detected seismically by a station on Rangiroa Atoll, Tuamotu Archipelago. The event was well constrained (+/- 15 km) at a location near the southern base of Ahyi. An eruption in April-May 2014 was detected by NOAA divers, hydroacoustic sensors, and seismic stations.
Information Contacts: US Geological Survey, Volcano Hazards Program (USGS-VHP), 12201 Sunrise Valley Drive, Reston, VA, USA, https://volcanoes.usgs.gov/index.html; Copernicus Browser, Copernicus Data Space Ecosystem, European Space Agency (URL: https://dataspace.copernicus.eu/browser/).
Kadovar (Papua New Guinea) — June 2023 Cite this Report
Kadovar
Papua New Guinea
3.608°S, 144.588°E; summit elev. 365 m
All times are local (unless otherwise noted)
An ash plume and weak thermal anomaly during May 2023
Kadovar is a 2-km-wide island that is the emergent summit of a Bismarck Sea stratovolcano. It lies off the coast of New Guinea, about 25 km N of the mouth of the Sepik River. Prior to an eruption that began in 2018, a lava dome formed the high point of the volcano, filling an arcuate landslide scarp open to the S. Submarine debris-avalanche deposits occur to the S of the island. The current eruption began in January 2018 and has comprised lava effusion from vents at the summit and at the E coast; more recent activity has consisted of ash plumes, weak thermal activity, and gas-and-steam plumes (BGVN 48:02). This report covers activity during February through May 2023 using information from the Darwin Volcanic Ash Advisory Center (VAAC) and satellite data.
Activity during the reporting period was relatively low and mainly consisted of white gas-and-steam plumes that were visible in natural color satellite images on clear weather days (figure 67). According to a Darwin VAAC report, at 2040 on 6 May an ash plume rose to 4.6 km altitude and drifted W; by 2300 the plume had dissipated. MODIS satellite instruments using the MODVOLC thermal algorithm detected a single thermal hotspot on the SE side of the island on 7 May. Weak thermal activity was also detected in a satellite image on the E side of the island on 14 May, accompanied by a white gas-and-steam plume that drifted SE (figure 68).
Geologic Background. The 2-km-wide island of Kadovar is the emergent summit of a Bismarck Sea stratovolcano of Holocene age. It is part of the Schouten Islands, and lies off the coast of New Guinea, about 25 km N of the mouth of the Sepik River. Prior to an eruption that began in 2018, a lava dome formed the high point of the andesitic volcano, filling an arcuate landslide scarp open to the south; submarine debris-avalanche deposits occur in that direction. Thick lava flows with columnar jointing forms low cliffs along the coast. The youthful island lacks fringing or offshore reefs. A period of heightened thermal phenomena took place in 1976. An eruption began in January 2018 that included lava effusion from vents at the summit and at the E coast.
Information Contacts: Darwin Volcanic Ash Advisory Centre (VAAC), Bureau of Meteorology, Northern Territory Regional Office, PO Box 40050, Casuarina, NT 0811, Australia (URL: http://www.bom.gov.au/info/vaac/); Hawai'i Institute of Geophysics and Planetology (HIGP) - MODVOLC Thermal Alerts System, School of Ocean and Earth Science and Technology (SOEST), Univ. of Hawai'i, 2525 Correa Road, Honolulu, HI 96822, USA (URL: http://modis.higp.hawaii.edu/); Copernicus Browser, Copernicus Data Space Ecosystem, European Space Agency (URL: https://dataspace.copernicus.eu/browser/).
San Miguel (El Salvador) — June 2023 Cite this Report
San Miguel
El Salvador
13.434°N, 88.269°W; summit elev. 2130 m
All times are local (unless otherwise noted)
Small gas-and-ash explosions during March and May 2023
San Miguel in El Salvador is a broad, deep crater complex that has been frequently modified by eruptions recorded since the early 16th century and consists of the summit known locally as Chaparrastique. Flank eruptions have produced lava flows that extended to the N, NE, and SE during the 17-19th centuries. The most recent activity has consisted of minor ash eruptions from the summit crater. The current eruption period began in November 2022 and has been characterized by frequent phreatic explosions, gas-and-ash emissions, and sulfur dioxide plumes (BGVN 47:12). This report describes small gas-and-ash explosions during December 2022 through May 2023 based on special reports from the Ministero de Medio Ambiente y Recursos Naturales (MARN).
Activity has been relatively low since the last recorded explosions on 29 November 2022. Seismicity recorded by the San Miguel Volcano Station (VSM) located on the N flank at 1.7 km elevation had decreased by 7 December. Sulfur dioxide gas measurements taken with DOAS (Differential Optical Absorption Spectroscopy) mobile equipment were below typical previously recorded values: 300 tons per day (t/d). During December, small explosions were recorded by the seismic network and manifested as gas-and-steam emissions.
Gas-and-ash explosions in the crater occurred during January 2023, which were recorded by the seismic network. Sulfur dioxide values remained low, between 300-400 t/d through 10 March. At 0817 on 14 January a gas-and-ash emission was visible in webcam images, rising just above the crater rim. Some mornings during February, small gas-and-steam plumes were visible in the crater. On 7 March at 2252 MARN noted an increase in degassing from the central crater; gas emissions were constantly observed through the early morning hours on 8 March. During the early morning of 8 March through the afternoon on 9 March, 12 emissions were registered, some accompanied by ash. The last gas-and-ash emission was recorded at 1210 on 9 March; very fine ashfall was reported in El Tránsito (10 km S), La Morita (6 km W), and La Piedrita (3 km W). The smell of sulfur was reported in Piedra Azul (5 km SW). On 16 March MARN reported that gas-and-steam emissions decreased.
Low degassing and very low seismicity were reported during April; no explosions have been detected between 9 March and 27 May. The sulfur dioxide emissions remained between 350-400 t/d; during 13-20 April sulfur dioxide values fluctuated between 30-300 t/d. Activity remained low through most of May; on 23 May seismicity increased. An explosion was detected at 1647 on 27 May generated a gas-and-ash plume that rose 700 m high (figure 32); a decrease in seismicity and gas emissions followed. The DOAS station installed on the W flank recorded sulfur dioxide values that reached 400 t/d on 27 May; subsequent measurements showed a decrease to 268 t/d on 28 May and 100 t/d on 29 May.
Geologic Background. The symmetrical cone of San Miguel, one of the most active volcanoes in El Salvador, rises from near sea level to form one of the country's most prominent landmarks. A broad, deep, crater complex that has been frequently modified by eruptions recorded since the early 16th century caps the truncated unvegetated summit, also known locally as Chaparrastique. Flanks eruptions of the basaltic-andesitic volcano have produced many lava flows, including several during the 17th-19th centuries that extended to the N, NE, and SE. The SE-flank flows are the largest and form broad, sparsely vegetated lava fields crossed by highways and a railroad skirting the base of the volcano. Flank vent locations have migrated higher on the edifice during historical time, and the most recent activity has consisted of minor ash eruptions from the summit crater.
Information Contacts: Ministero de Medio Ambiente y Recursos Naturales (MARN), Km. 5½ Carretera a Nueva San Salvador, Avenida las Mercedes, San Salvador, El Salvador (URL: http://www.snet.gob.sv/ver/vulcanologia).
Ebeko
Russia
50.686°N, 156.014°E; summit elev. 1103 m
All times are local (unless otherwise noted)
Continued explosions, ash plumes, and ashfall during October 2022-May 2023
Ebeko, located on the N end of Paramushir Island in the Kuril Islands, consists of three summit craters along a SSW-NNE line at the northern end of a complex of five volcanic cones. Eruptions date back to the late 18th century and have been characterized as small-to-moderate explosions from the summit crater, accompanied by intense fumarolic activity. The current eruption period began in June 2022 and has recently consisted of frequent explosions, ash plumes, and thermal activity (BGVN 47:10). This report covers similar activity during October 2022 through May 2023, based on information from the Kamchatka Volcanic Eruptions Response Team (KVERT) and satellite data.
Activity during October consisted of explosive activity, ash plumes, and occasional thermal anomalies. Visual data by volcanologists from Severo-Kurilsk showed explosions producing ash clouds up to 2.1-3 km altitude which drifted E, N, NE, and SE during 1-8, 10, 16, and 18 October. KVERT issued several Volcano Observatory Notices for Aviation (VONA) on 7, 13-15, and 27 October 2022, stating that explosions generated ash plumes that rose to 2.3-4 km altitude and drifted 5 km E, NE, and SE. Ashfall was reported in Severo-Kurilsk (Paramushir Island, about 7 km E) on 7 and 13 October. Satellite data showed a thermal anomaly over the volcano on 15-16 October. Visual data showed ash plumes rising to 2.5-3.6 km altitude on 22, 25-29, and 31 October and moving NE due to constant explosions.
Similar activity continued during November, with explosions, ash plumes, and ashfall occurring. KVERT issued VONAs on 1-2, 4, 6-7, 9, 13, and 16 November that reported explosions and resulting ash plumes that rose to 1.7-3.6 km altitude and drifted 3-5 km SE, ESE, E, and NE. On 1 November ash plumes extended as far as 110 km SE. On 5, 8, 12, and 24-25 November explosions and ash plumes rose to 2-3.1 km altitude and drifted N and E. Ashfall was observed in Severo-Kurilsk on 7 and 16 November. A thermal anomaly was visible during 1-4, 16, and 20 November. Explosions during 26 November rose as high as 2.7 km altitude and drifted NE (figure 45).
Explosions and ash plumes continued to occur in December. During 1-2 and 4 December volcanologists from Severo-Kurilsk observed explosions that sent ash to 1.9-2.5 km altitude and drifted NE and SE (figure 46). VONAs were issued on 5, 9, and 16 December reporting that explosions generated ash plumes rising to 1.9 km, 2.6 km, and 2.4 km altitude and drifted 5 km SE, E, and NE, respectively. A thermal anomaly was visible in satellite imagery on 16 December. On 18 and 27-28 December explosions produced ash plumes that rose to 2.5 km altitude and drifted NE and SE. On 31 December an ash plume rose to 2 km altitude and drifted NE.
Explosions continued during January 2023, based on visual observations by volcanologists from Severo-Kurilsk. During 1-7 January explosions generated ash plumes that rose to 4 km altitude and drifted NE, E, W, and SE. According to VONAs issued by KVERT on 2, 4, 10, and 23 January, explosions produced ash plumes that rose to 2-4 km altitude and drifted 5 km N, NE, E, and ENE; the ash plume that rose to 4 km altitude occurred on 10 January (figure 47). Satellite data showed a thermal anomaly during 3-4, 10, 13, 16, 21, 22, and 31 January. KVERT reported that an ash cloud on 4 January moved 12 km NE. On 6 and 9-11 January explosions sent ash plumes to 4.5 km altitude and drifted W and ESE. On 13 January an ash plume rose to 3 km altitude and drifted SE. During 20-24 January ash plumes from explosions rose to 3.7 km altitude and drifted SE, N, and NE. On 21 January the ash plume drifted as far as 40 km NE. During 28-29 and 31 January and 1 February ash plumes rose to 4 km altitude and drifted NE.
During February, explosions, ash plumes, and ashfall were reported. During 1, 4-5 and 7-8 February explosions generated ash plumes that rose to 4.5 km altitude and drifted E and NE; ashfall was observed on 5 and 8 February. On 6 February an explosion produced an ash plume that rose to 3 km altitude and drifted 7 km E, causing ashfall in Severo-Kurilsk. A thermal anomaly was visible in satellite data on 8, 9, 13, and 21 February. Explosions on 9 and 12-13 February produced ash plumes that rose to 4 km altitude and drifted E and NE; the ash cloud on 12 February extended as far as 45 km E. On 22 February explosions sent ash to 3 km altitude that drifted E. During 24 and 26-27 February ash plumes rose to 4 km altitude and drifted E. On 28 February an explosion sent ash to 2.5-3 km altitude and drifted 5 km E; ashfall was observed in Severo-Kurilsk.
Activity continued during March; visual observations showed that explosions generated ash plumes that rose to 3.6 km altitude on 3, 5-7, and 9-12 March and drifted E, NE, and NW. Thermal anomalies were visible on 10, 13, and 29-30 March in satellite imagery. On 18, 21-23, 26, and 29-30 March explosions produced ash plumes that rose to 2.8 km altitude and drifted NE and E; the ash plumes during 22-23 March extended up to 76 km E. A VONA issued on 21 March reported an explosion that produced an ash plume that rose to 2.8 km altitude and drifted 5 km E. Another VONA issued on 23 March reported that satellite data showed an ash plume rising to 3 km altitude and drifted 14 km E.
Explosions during April continued to generate ash plumes. On 1 and 4 April an ash plume rose to 2.8-3.5 km altitude and drifted SE and NE. A thermal anomaly was visible in satellite imagery during 1-6 April. Satellite data showed ash plumes and clouds rising to 2-3 km altitude and drifting up to 12 km SW and E on 3 and 6 April (figure 48). KVERT issued VONAs on 3, 5, 14, 16 April describing explosions that produced ash plumes rising to 3 km, 3.5 km, 3.5 km, and 3 km altitude and drifting 5 km S, 5 km NE and SE, 72 km NNE, and 5 km NE, respectively. According to satellite data, the resulting ash cloud from the explosion on 14 April was 25 x 7 km in size and drifted 72-104 km NNE during 14-15 April. According to visual data by volcanologists from Severo-Kurilsk explosions sent ash up to 3.5 km altitude that drifted NE and E during 15-16, 22, 25-26, and 29 April.
The explosive eruption continued during May. Explosions during 3-4, 6-7, and 9-10 May generated ash plumes that rose to 4 km altitude and drifted SW and E. Satellite data showed a thermal anomaly on 3, 9, 13-14, and 24 May. During 12-16, 23-25, and 27-28 May ash plumes rose to 3.5 km altitude and drifted in different directions due to explosions. Two VONA notices were issued on 16 and 25 May, describing explosions that generated ash plumes rising to 3 km and 3.5 km altitude, respectively and extending 5 km E. The ash cloud on 25 May drifted 75 km SE.
Thermal activity in the summit crater, occasionally accompanied by ash plumes and ash deposits on the SE and E flanks due to frequent explosions, were visible in infrared and true color satellite images (figure 49).
Geologic Background. The flat-topped summit of the central cone of Ebeko volcano, one of the most active in the Kuril Islands, occupies the northern end of Paramushir Island. Three summit craters located along a SSW-NNE line form Ebeko volcano proper, at the northern end of a complex of five volcanic cones. Blocky lava flows extend west from Ebeko and SE from the neighboring Nezametnyi cone. The eastern part of the southern crater contains strong solfataras and a large boiling spring. The central crater is filled by a lake about 20 m deep whose shores are lined with steaming solfataras; the northern crater lies across a narrow, low barrier from the central crater and contains a small, cold crescentic lake. Historical activity, recorded since the late-18th century, has been restricted to small-to-moderate explosive eruptions from the summit craters. Intense fumarolic activity occurs in the summit craters, on the outer flanks of the cone, and in lateral explosion craters.
Information Contacts: Kamchatka Volcanic Eruptions Response Team (KVERT), Far Eastern Branch, Russian Academy of Sciences, 9 Piip Blvd., Petropavlovsk-Kamchatsky, 683006, Russia (URL: http://www.kscnet.ru/ivs/kvert/); MIROVA (Middle InfraRed Observation of Volcanic Activity), a collaborative project between the Universities of Turin and Florence (Italy) supported by the Centre for Volcanic Risk of the Italian Civil Protection Department (URL: http://www.mirovaweb.it/); Copernicus Browser, Copernicus Data Space Ecosystem, European Space Agency (URL: https://dataspace.copernicus.eu/browser/).
Home Reef
Tonga
18.992°S, 174.775°W; summit elev. -10 m
All times are local (unless otherwise noted)
Discolored plumes continued during November 2022-April 2023
Home Reef is a submarine volcano located in the central Tonga islands between Lateiki (Metis Shoal) and Late Island. The first recorded eruption occurred in the mid-19th century, when an ephemeral island formed. An eruption in 1984 produced a 12-km-high eruption plume, a large volume of floating pumice, and an ephemeral island 500 x 1,500 m wide, with cliffs 30-50 m high that enclosed a water-filled crater. Another island-forming eruption in 2006 produced widespread pumice rafts that drifted as far as Australia; by 2008 the island had eroded below sea level. The previous eruption occurred during October 2022 and was characterized by a new island-forming eruption, lava effusion, ash plumes, discolored water, and gas-and-steam plumes (BGVN 47:11). This report covers discolored water plumes during November 2022 through April 2023 using satellite data.
Discolored plumes continued during the reporting period and were observed in true color satellite images on clear weather days. Satellite images show light green-yellow discolored water extending W on 8 and 28 November 2022 (figure 31), and SW on 18 November. Light green-yellow plumes extended W on 3 December, S on 13 December, SW on 18 December, and W and S on 23 December (figure 31). On 12 January 2023 discolored green-yellow plumes extended to the NE, E, SE, and N. The plume moved SE on 17 January and NW on 22 January. Faint discolored water in February was visible moving NE on 1 February. A discolored plume extended NW on 8 and 28 March and NW on 13 March (figure 31). During April, clear weather showed green-blue discolored plumes moving S on 2 April, W on 7 April, and NE and S on 12 April. A strong green-yellow discolored plume extended E and NE on 22 April for several kilometers (figure 31).
Geologic Background. Home Reef, a submarine volcano midway between Metis Shoal and Late Island in the central Tonga islands, was first reported active in the mid-19th century, when an ephemeral island formed. An eruption in 1984 produced a 12-km-high eruption plume, large amounts of floating pumice, and an ephemeral 500 x 1,500 m island, with cliffs 30-50 m high that enclosed a water-filled crater. In 2006 an island-forming eruption produced widespread dacitic pumice rafts that drifted as far as Australia. Another island was built during a September-October 2022 eruption.
Information Contacts: Copernicus Browser, Copernicus Data Space Ecosystem, European Space Agency (URL: https://dataspace.copernicus.eu/browser/).
Semisopochnoi (United States) — June 2023 Cite this Report
Semisopochnoi
United States
51.93°N, 179.58°E; summit elev. 1221 m
All times are local (unless otherwise noted)
Occasional explosions, ash deposits, and gas-and-steam plumes during December 2022-May 2023
Semisopochnoi is located in the western Aleutians, is 20-km-wide at sea level, and contains an 8-km-wide caldera. The three-peaked Mount Young (formerly Cerberus) was constructed within the caldera during the Holocene. Each of these peaks contains a summit crater; the lava flows on the N flank appear younger than those on the S side. The current eruption period began in early February 2021 and has more recently consisted of intermittent explosions and ash emissions (BGVN 47:12). This report updates activity during December 2022 through May 2023 using daily, weekly, and special reports from the Alaska Volcano Observatory (AVO). AVO monitors the volcano using local seismic and infrasound sensors, satellite data, web cameras, and remote infrasound and lightning networks.
Activity during most of December 2022 was relatively quiet; according to AVO no eruptive or explosive activity was observed since 7 November 2022. Intermittent tremor and occasional small earthquakes were observed in geophysical data. Continuous gas-and-steam emissions were observed from the N crater of Mount Young in webcam images on clear weather days (figure 25). On 24 December, there was a slight increase in earthquake activity and several small possible explosion signals were detected in infrasound data. Eruptive activity resumed on 27 December at the N crater of Mount Young; AVO issued a Volcano Activity Notice (VAN) that reported minor ash deposits on the flanks of Mount Young that extended as far as 1 km from the vent, according to webcam images taken during 27-28 December (figure 26). No ash plumes were observed in webcam or satellite imagery, but a persistent gas-and-steam plume that might have contained some ash rose to 1.5 km altitude. As a result, AVO raised the Aviation Color Code (ACC) to Orange (the second highest level on a four-color scale) and the Volcano Alert Level (VAL) to Watch (the second highest level on a four-level scale). Possible explosions were detected during 21 December 2022 through 1 January 2023 and seismic tremor was recorded during 30-31 December.
During January 2023 eruptive activity continued at the active N crater of Mount Young. Minor ash deposits were observed on the flanks, extending about 2 km SSW, based on webcam images from 1 and 3 January. A possible explosion occurred during 1-2 January based on elevated seismicity recorded on local seismometers and an infrasound signal recorded minutes later by an array at Adak. Though no ash plumes were observed in webcam or satellite imagery, a persistent gas-and-steam plume rose to 1.5 km altitude that might have carried minor traces of ash. Ash deposits were accompanied by periods of elevated seismicity and infrasound signals from the local geophysical network, which AVO reported were likely due to weak explosive activity. Low-level explosive activity was also detected during 2-3 January, with minor gas-and-steam emissions and a new ash deposit that was visible in webcam images. Low-level explosive activity was detected in geophysical data during 4-5 January, with elevated seismicity and infrasound signals observed on local stations. Volcanic tremor was detected during 7-9 January and very weak explosive activity was detected in seismic and infrasound data on 9 January. Weak seismic and infrasound signals were recorded on 17 January, which indicated minor explosive activity, but no ash emissions were observed in clear webcam images; a gas-and-steam plume continued to rise to 1.5 km altitude. During 29-30 January, ash deposits near the summit were observed on fresh snow, according to webcam images.
The active N cone at Mount Young continued to produce a gas-and-steam plume during February, but no ash emissions or explosive events were detected. Seismicity remained elevated with faint tremor during early February. Gas-and-steam emissions from the N crater were observed in clear webcam images on 11-13 and 16 February; no explosive activity was detected in seismic, infrasound, or satellite data. Seismicity has also decreased, with no significant seismic tremor observed since 25 January. Therefore, the ACC was lowered to Yellow (the second lowest level on a four-color scale) and the VAL was lowered to Advisory (the second lowest level on a four-color scale) on 22 February.
Gas-and-steam emissions persisted during March from the N cone of Mount Young, based on clear webcam images. A few brief episodes of weak tremor were detected in seismic data, although seismicity decreased over the month. A gas-and-steam plume detected in satellite data extended 150 km on 18 March. Low-level ash emissions from the N cone at Mount Young were observed in several webcam images during 18-19 March, in addition to small explosions and volcanic tremor. The ACC was raised to Orange and the VAL increased to Watch on 19 March. A small explosion was detected in seismic and infrasound data on 21 March.
Low-level unrest continued during April, although cloudy weather often obscured views of the summit; periods of seismic tremor and local earthquakes were recorded. During 3-4 April a gas-and-steam plume was visible traveling more than 200 km overnight; no ash was evident in the plume, according to AVO. A gas-and-steam plume was observed during 4-6 April that extended 400 km but did not seem to contain ash. Small explosions were detected in seismic and infrasound data on 5 April. Occasional clear webcam images showed continuing gas-and-steam emissions rose from Mount Young, but no ash deposits were observed on the snow. On 19 April small explosions and tremor were detected in seismic and infrasound data. A period of seismic tremor was detected during 22-25 April, with possible weak explosions on 25 April. Ash deposits were visible near the crater rim, but it was unclear if these deposits were recent or due to older deposits.
Occasional small earthquakes were recorded during May, but there were no signs of explosive activity seen in geophysical data. Gas-and-steam emissions continued from the N crater of Mount Young, based on webcam images, and seismicity remained slightly elevated. A new, light ash deposit was visible during the morning of 5 May on fresh snow on the NW flank of Mount Young. During 10 May periods of volcanic tremor were observed. The ACC was lowered to Yellow and the VAL to Advisory on 17 May due to no additional evidence of activity.
Geologic Background. Semisopochnoi, the largest subaerial volcano of the western Aleutians, is 20 km wide at sea level and contains an 8-km-wide caldera. It formed as a result of collapse of a low-angle, dominantly basaltic volcano following the eruption of a large volume of dacitic pumice. The high point of the island is Anvil Peak, a double-peaked late-Pleistocene cone that forms much of the island's northern part. The three-peaked Mount Cerberus (renamed Mount Young in 2023) was constructed within the caldera during the Holocene. Each of the peaks contains a summit crater; lava flows on the N flank appear younger than those on the south side. Other post-caldera volcanoes include the symmetrical Sugarloaf Peak SSE of the caldera and Lakeshore Cone, a small cinder cone at the edge of Fenner Lake in the NE part of the caldera. Most documented eruptions have originated from Young, although Coats (1950) considered that both Sugarloaf and Lakeshore Cone could have been recently active.
Information Contacts: Alaska Volcano Observatory (AVO), a cooperative program of a) U.S. Geological Survey, 4200 University Drive, Anchorage, AK 99508-4667 USA (URL: https://avo.alaska.edu/), b) Geophysical Institute, University of Alaska, PO Box 757320, Fairbanks, AK 99775-7320, USA, and c) Alaska Division of Geological & Geophysical Surveys, 794 University Ave., Suite 200, Fairbanks, AK 99709, USA (URL: http://dggs.alaska.gov/).
Ambae
Vanuatu
15.389°S, 167.835°E; summit elev. 1496 m
All times are local (unless otherwise noted)
New lava flow, ash plumes, and sulfur dioxide plumes during February-May 2023
Ambae, also known as Aoba, is a large basaltic shield volcano in Vanuatu. A broad pyroclastic cone containing three crater lakes (Manaro Ngoru, Voui, and Manaro Lakua) is located at the summit within the youngest of at least two nested calderas. Periodic phreatic and pyroclastic explosions have been reported since the 16th century. A large eruption more than 400 years ago resulted in a volcanic cone within the summit crater that is now filled by Lake Voui; the similarly sized Lake Manaro fills the western third of the caldera. The previous eruption ended in August 2022 that was characterized by gas-and-steam and ash emissions and explosions of wet tephra (BGVN 47:10). This report covers a new eruption during February through May 2023 that consisted of a new lava flow, ash plumes, and sulfur dioxide emissions, using information from the Vanuatu Meteorology and Geo-Hazards Department (VMGD) and satellite data.
During the reporting period, the Alert Level remained at a 2 (on a scale of 0-5), which has been in place since December 2021. Activity during October 2022 through March 2023 remained relatively low and mostly consisted of gas-and-steam emissions in Lake Voui. VMGD reported that at 1300 on 15 November a satellite image captured a strong amount of sulfur dioxide rising above the volcano (figure 99), and that seismicity slightly increased. The southern and northern part of the island reported a strong sulfur dioxide smell and heard explosions. On 20 February 2023 a gas-and-ash plume rose 1.3 km above the summit and drifted SSW, according to a webcam image (figure 100). Gas-and-steam and possibly ash emissions continued on 23 February and volcanic earthquakes were recorded by the seismic network.
During April, volcanic earthquakes and gas-and-steam and ash emissions were reported from the cone in Lake Voui. VMGD reported that activity increased during 5-7 April; high gas-and-steam and ash plumes were visible, accompanied by nighttime incandescence. According to a Wellington VAAC report, a low-level ash plume rose as high as 2.5 km above the summit and drifted W and SW on 5 April, based on satellite imagery. Reports in Saratamata stated that a dark ash plume drifted to the WSW, but no loud explosion was heard. Webcam images from 2100 showed incandescence above the crater and reflected in the clouds. According to an aerial survey, field observations, and satellite data, water was no longer present in the lake. A lava flow was reported effusing from the vent and traveling N into the dry Lake Voui, which lasted three days. The next morning at 0745 on 6 April a gas-and-steam and ash plume rose 5.4 km above the summit and drifted ESE, based on information from VMGD (figure 101). The Wellington VAAC also reported that light ashfall was observed on the island. Intermittent gas-and-steam and ash emissions were visible on 7 April, some of which rose to an estimated 3 km above the summit and drifted E. Webcam images during 0107-0730 on 7 April showed continuing ash emissions. A gas-and-steam and ash plume rose 695 m above the summit crater at 0730 on 19 April and drifted ESE, based on a webcam image (figure 102).
According to visual and infrared satellite data, water was visible in Lake Voui as late as 24 March 2023 (figure 103). The vent in the caldera showed a gas-and-steam plume drifted SE. On 3 April thermal activity was first detected, accompanied by a gas-and-ash plume that drifted W (figure 103). The lava flow moved N within the dry lake and was shown cooling by 8 April. By 23 April much of the water in the lake had returned. Occasional sulfur dioxide plumes were detected by the TROPOMI instrument on the Sentinel-5P satellite that exceeded 2 Dobson Units (DU) and drifted in different directions (figure 104).
Geologic Background. The island of Ambae, also known as Aoba, is a massive 2,500 km3 basaltic shield that is the most voluminous volcano of the New Hebrides archipelago. A pronounced NE-SW-trending rift zone with numerous scoria cones gives the 16 x 38 km island an elongated form. A broad pyroclastic cone containing three crater lakes (Manaro Ngoru, Voui, and Manaro Lakua) is located at the summit within the youngest of at least two nested calderas, the largest of which is 6 km in diameter. That large central edifice is also called Manaro Voui or Lombenben volcano. Post-caldera explosive eruptions formed the summit craters about 360 years ago. A tuff cone was constructed within Lake Voui (or Vui) about 60 years later. The latest known flank eruption, about 300 years ago, destroyed the population of the Nduindui area near the western coast.
Information Contacts: Geo-Hazards Division, Vanuatu Meteorology and Geo-Hazards Department (VMGD), Ministry of Climate Change Adaptation, Meteorology, Geo-Hazards, Energy, Environment and Disaster Management, Private Mail Bag 9054, Lini Highway, Port Vila, Vanuatu (URL: http://www.vmgd.gov.vu/, https://www.facebook.com/VanuatuGeohazardsObservatory/); Wellington Volcanic Ash Advisory Centre (VAAC), Meteorological Service of New Zealand Ltd (MetService), PO Box 722, Wellington, New Zealand (URL: http://www.metservice.com/vaac/, http://www.ssd.noaa.gov/VAAC/OTH/NZ/messages.html); MIROVA (Middle InfraRed Observation of Volcanic Activity), a collaborative project between the Universities of Turin and Florence (Italy) supported by the Centre for Volcanic Risk of the Italian Civil Protection Department (URL: http://www.mirovaweb.it/); Global Sulfur Dioxide Monitoring Page, Atmospheric Chemistry and Dynamics Laboratory, NASA Goddard Space Flight Center (NASA/GSFC), 8800 Greenbelt Road, Goddard, Maryland, USA (URL: https://so2.gsfc.nasa.gov/); Copernicus Browser, Copernicus Data Space Ecosystem, European Space Agency (URL: https://dataspace.copernicus.eu/browser/).
Search Bulletin Archive by Publication Date
Select a month and year from the drop-downs and click "Show Issue" to have that issue displayed in this tab.
The default month and year is the latest issue available.
Bulletin of the Global Volcanism Network - Volume 33, Number 02 (February 2008)
Managing Editor: Richard Wunderman
Barren Island (India)
Satellite imagery of ash plume, 23 December 2007
Bulusan (Philippines)
Ash ejections continued to at least late 2007
Cleveland (United States)
Thermal anomalies and minor explosions continue through February 2008
Krummel-Garbuna-Welcker (Papua New Guinea)
Ash emissions during March 2008
Langila (Papua New Guinea)
Intermittent ash emissions in May and August 2007
Lengai, Ol Doinyo (Tanzania)
Explosive eruptions of December 2007-March 2008; hazard warnings
Lokon-Empung (Indonesia)
June 2007-March 2008, variable seismicity and minor white plumes
NW Rota-1 (United States)
Visit on 24 February 2008 found eruption plume and acoustic signals
Suwanosejima (Japan)
Small (~1 km) plumes noted during late 2007-early 2008
Talang (Indonesia)
Ash emissions in March, June, and November 2007
Tara, Batu (Indonesia)
Satellite thermal anomalies indicate that near-daily eruptions continue
Barren Island (India) — February 2008 Cite this Report
Barren Island
India
12.278°N, 93.858°E; summit elev. 354 m
All times are local (unless otherwise noted)
Satellite imagery of ash plume, 23 December 2007
Thermal anomalies associated with the eruption that began in May 2005 were noted at Barren Island through 1 September 2007 (BGVN 32:07). Anomalies detected on 4 and 5 October 2007 again generated MODIS thermal alerts. On 23 December 2007 the Darwin Volcanic Ash Advisory Centre reported that an ash plume seen on satellite imagery rose to an altitude of 1.5 km and drifted S.
Geologic Background. Barren Island, a possession of India in the Andaman Sea about 135 km NE of Port Blair in the Andaman Islands, is the only historically active volcano along the N-S volcanic arc extending between Sumatra and Burma (Myanmar). It is the emergent summit of a volcano that rises from a depth of about 2250 m. The small, uninhabited 3-km-wide island contains a roughly 2-km-wide caldera with walls 250-350 m high. The caldera, which is open to the sea on the west, was created during a major explosive eruption in the late Pleistocene that produced pyroclastic-flow and -surge deposits. Historical eruptions have changed the morphology of the pyroclastic cone in the center of the caldera, and lava flows that fill much of the caldera floor have reached the sea along the western coast.
Information Contacts: HIGP MODIS Thermal Alert System, Hawai'i Institute of Geophysics and Planetology (HIGP), University of Hawaii and Manoa, 168 East-West Road, Post 602, Honolulu, HI 96822, USA (URL: http://modis.higp.hawaii.edu/); Darwin Volcanic Ash Advisory Centre, Bureau of Meteorology, Northern Territory Regional Office, PO Box 40050, Casuarina, Northern Territory 0811, Australia (URL: http://www.bom.gov.au/info/vaac/).
Bulusan (Philippines) — February 2008 Cite this Report
Bulusan
Philippines
12.769°N, 124.056°E; summit elev. 1535 m
All times are local (unless otherwise noted)
Ash ejections continued to at least late 2007
Our last report on Bulusan described explosive eruptions and ashfall during 10 October 2006 to 12 May 2007 (BGVN 32:04). This current report will cover the events from late May 2007 to January 2008. There were ash-bearing eruptions on 31 July and 4 October 2007. Hazard concerns also included steam-driven explosions, lahars, and related flooding.
The Philippine Institute of Volcanology and Seismology (PHIVOLCS) reported on 20 May 2007 that seismicity remained high following an explosion on 12 May (BGVN 32:04). The seismic network detected 673 volcanic earthquakes during five days. The epicenters were located along a NW-SE trend. Ground deformation measurements conducted on 17 May on the NE flank revealed 4 mm of inflation since 7 April, measurements in a series which have shown continued inflation since June 2006. Sulfur dioxide flux measurements were 165-315 tons per day (t/d), below a baseline level of 500 t/d. The Alert Level was raised in mid-May from 1 to 2 (out of 5) due to the increased seismicity and inflation. On 22 May, heavy rain triggered lahars, but they were confined and did not affect populated areas. On 25 May 2007 sulfur emission reached 500 t/d.
During mid-2007, scientists from PHIVOLCS conducting an aerial investigation discovered lahar deposits and three steaming fissures. Scientists also observed steam plumes that rose to altitudes of 1.6-1.7 km and drifted NW and NE. The S flank had inflated by 3 mm. Residents near the base of the volcano noted the odor of sulfur dioxide.
No significant activity was reported during June 2007. Steaming from the active vents and fissures generally consisted of weak to moderate emissions of steam. On 13 July 2007, PHIVOLCS lowered the Alert Level to 1 due to a decline in activity including decreased seismicity, and lower than baseline sulfur dioxide emissions. On 19-21 June the NE and SE flanks were deflated when compared to previous surveys. Sulfur dioxide emission rates were 50-400 t/d.
On the morning of 31 July 2007 an explosion produced an ash plume that rose to an altitude of 6.6 km and drifted WSW and WNW. Initial field reports indicated that light ashfalls were experienced in Cogon, Gulang-gulang, Puting Sapa, Bolos, Monbon and Gabao in Irosin, and Sangkayon and Buraburan in Juban. Small to moderate sized earthquakes and ash explosions continued. On 2 August, white steam plumes rose from active craters and fissures.
On 28 September 2007 the number of volcanic earthquakes increased and PHIVOLCS noted a possible eruption. Explosions at 0134 and 0139 on 4 October 2007 caused a blanket of thick ashfall in sixteen villages that resulted in minor injuries and damage. Instruments recorded 40 volcanic earthquakes and eight short harmonic tremors during a 24 hour interval ending at 0526 that day. Moderate steaming from fissures were found on the SW flank.
According to the news source Southen Luzon Bureau, on 15 October 2007 PHIVOLCS found an additional six points of emission around the volcano, three each on the NW and SE slopes. Several other emission points had stopped on the N, SSW, and SW slopes. Overall, nine emission points were active. News reports also mentioned that residents in the village of San Rogue noted bulging of the ground. A deformation survey was allegedly conducted, but results were not available in PHIVOLCS reports.
In the 24 hours from 0800 on 6 January 2008, at least seven minor earthquakes were recorded, but no steaming was noted. Although the Alert Level remained at 1, authorities began to enforce a no-entry policy in a 4-km radius.
Geologic Background. Luzon's southernmost volcano, Bulusan, was constructed along the rim of the 11-km-diameter dacitic-to-rhyolitic Irosin caldera, which was formed about 36,000 years ago. It lies at the SE end of the Bicol volcanic arc occupying the peninsula of the same name that forms the elongated SE tip of Luzon. A broad, flat moat is located below the topographically prominent SW rim of Irosin caldera; the NE rim is buried by the andesitic complex. Bulusan is flanked by several other large intracaldera lava domes and cones, including the prominent Mount Jormajan lava dome on the SW flank and Sharp Peak to the NE. The summit is unvegetated and contains a 300-m-wide, 50-m-deep crater. Three small craters are located on the SE flank. Many moderate explosive eruptions have been recorded since the mid-19th century.
Information Contacts: Philippine Institute of Volcanology and Seismology (PHIVOLCS), University of the Philippines Campus, Diliman, Quezon City, Philippines (URL: http://www.phivolcs.dost.gov.ph); Southern Luzon Bureau, Philippine Daily Inquirer, PO Box 2353, Makati Central Post Office, 1263 Makati City, Philippines (URL: http://newsinfo.inquirer.net/).
Cleveland (United States) — February 2008 Cite this Report
Cleveland
United States
52.825°N, 169.944°W; summit elev. 1730 m
All times are local (unless otherwise noted)
Thermal anomalies and minor explosions continue through February 2008
Our previous reports on Cleveland discussed short duration explosions on 6 February 2006 (BGVN 31:01), 23 May 2006 (BGVN 31:07), and on 24 August and 28 October 2006 (BGVN 31:09).
We received no further reports on Cleveland until June 2007. On 12 June, steam emissions were observed. The plume rose to an altitude of 3.7 km and drifted SE for 200 km. On 17 June, satellite imagery showed a significant thermal anomaly. Low level eruptive activity was suggested. No ash plume was detected. On 26 June, satellite imagery showed another thermal anomaly. On 20 July, the Alaska Volcano Observatory (AVO) raised the Alert Level from Advisory to Watch and the Aviation Color Code from Yellow to Orange, based upon an intense thermal anomaly in the crater and an associated steam-and-gas plume observed on satellite imagery. Three small SO2 clouds produced by small explosions on 20 July were detected in OMI satellite data. Weak thermal activity was observed by satellite imagery throughout the month.
On 27 July AVO noted that low-level eruptive activity continued. Photographs from 27 July and a pilot report from 2 August indicated fresh volcanic ejecta on the slopes and summit. The E portion of Chuginadak Island was dusted with ash on 3 August. AVO lacks a local seismic system at the volcano was thus unable to track local volcanic earthquakes.
Thermal anomalies continued to be detected on satellite imagery, although clouds obscured satellite and web camera views of the volcano on most days during August through 11 September. A few clear views of the crater during this time revealed multiple thermal anomalies at the summit, indicating that low-level eruptive activity continued.
On 6 September, AVO lowered the Volcanic Alert Level for Cleveland from Watch to Advisory and the Aviation Color Code from Orange to Yellow, based on the observation that since late July, ash and gas plumes had been absent in satellite imagery and no reports of activity had been received. On 20 November the last weak thermal anomaly was observed for the year.
At 1200 on 17 January 2008, minor ash emission was detected, which drifted N. The plume height could not be determined. Thermal anomalies were found in the satellite imagery later that day. According to the AVO, on 8 February, during a break in the cloud cover, satellite imagery detected a diffuse ash plume extending about 12 km SE at an altitude below 1.5 km. Later that day AVO received pilot reports of a diffuse ash plume that rose to an altitude of 6.1 km and, according to satellite imagery, drifted NW. Due to the increased activity, the Volcanic Alert Level was raised to Watch and the Aviation Color Code was raised to Orange. During 10-11 February, a feeble thermal anomaly was marginally visible on satellite imagery.
On 12 February, the Volcanic Alert Level was lowered back to Advisory and the Aviation Color Code was lowered to Yellow. This occurred in response to the observation that minor eruptive activity appeared to have subsided and no further evidence of ash emission had been reported.
On 15 February, a minor explosion from Cleveland produced a small, diffuse ash plume that rose to an altitude of below 3 km and drifted NW. On 16 February, a brief explosion occurred. On 22 February, satellite imagery detected a low-level ash plume that drifted about 300 km SE. On 23 February, satellite imagery revealed a thermal anomaly. On 29 February, satellite imagery detected a weak thermal anomaly and a small ash plume that rose to an altitude of below 3 km. On 15, 27, and 30 March, weak thermal anomalies were detected. As of 4 April 2008, Cleveland remains at Advisory and the Aviation code Yellow.
Geologic Background. The beautifully symmetrical Mount Cleveland stratovolcano is situated at the western end of the uninhabited Chuginadak Island. It lies SE across Carlisle Pass strait from Carlisle volcano and NE across Chuginadak Pass strait from Herbert volcano. Joined to the rest of Chuginadak Island by a low isthmus, Cleveland is the highest of the Islands of the Four Mountains group and is one of the most active of the Aleutian Islands. The native name, Chuginadak, refers to the Aleut goddess of fire, who was thought to reside on the volcano. Numerous large lava flows descend the steep-sided flanks. It is possible that some 18th-to-19th century eruptions attributed to Carlisle should be ascribed to Cleveland (Miller et al., 1998). In 1944 it produced the only known fatality from an Aleutian eruption. Recent eruptions have been characterized by short-lived explosive ash emissions, at times accompanied by lava fountaining and lava flows down the flanks.
Information Contacts: Alaska Volcano Observatory (AVO), a cooperative program of the U.S. Geological Survey, 4200 University Drive, Anchorage, AK 99508-4667, USA, the Geophysical Institute, University of Alaska, PO Box 757320, Fairbanks, AK 99775-7320, USA, and the Alaska Division of Geological & Geophysical Surveys, 794 University Ave., Suite 200, Fairbanks, AK 99709, USA (URL: http://www.avo.alaska.edu/); Volcanic Emissions Group, Ozone Monitoring Instrument (OMI)-Total Ozone Monitoring Spectrometer (TOMS), Joint Center for Earth Systems Technology, University of Maryland Baltimore County (UMBC), and NASA Goddard Space Flight Center (URL: http://toms.unbc.edu/).
Krummel-Garbuna-Welcker (Papua New Guinea) — February 2008 Cite this Report
Krummel-Garbuna-Welcker
Papua New Guinea
5.416°S, 150.027°E; summit elev. 564 m
All times are local (unless otherwise noted)
Ash emissions during March 2008
Garbuna again began to erupt in March 2008. Prior to that, during late June 2007, the summit continued to release variable volumes of white vapor. Occasional increases in volume caused concern in local communities, although noises and night-time glow were absent. An investigation by the West New Britain Disaster Office indicated no other increased activity or emission of solid material. Vapor emissions from the active vent continued through October 2007. Through the end of 2007 and into January and February 2008 activity was characteristically uneventful, with no indication of an eruption.
A new eruption began on 11 March 2008. Gray ash clouds rose less than a kilometer above the summit before being blown SW, causing fine ashfall. Occasional booming noises were heard accompanying the ash emissions. Ash emissions continued on 12-13 March, and reports indicated most of the ash fell in the summit area. On 14-15 March the odor of sulfur was reported downwind. No glow was visible at night. Around this time, observations from the Kulingai Volcano Observatory (15 km SE) noted white vapor emissions from numerous vents at the summit area. During 17-18 March activity increased slightly with forceful and continuous emission of white vapor. Emissions rose vertically less than a kilometer before dissipating. There were no noises heard and no glow visible at night. A strong smell of sulfur was again noted to the E.
All of the monitoring equipment installed during 2005 and 2006 was destroyed. The two GPS stations at the summit and at the base remained out of service, and for most of the reporting interval there was no functioning seismometer. Seismicity began to be monitored using a KD1 recorder, along with a portable seismometer to the E, at SiSi village. Seismicity fluctuated between low and moderate levels. On 17 March, seismicity increased to a moderate level characterized by non-overlapping tremor. Only three high-frequency volcano-tectonic earthquakes were noted during the first day of recording; no low-frequency events were recorded. Seismicity declined on 18 March but rose to a moderate level on 19 March.
Geologic Background. The basaltic-to-dacitic Krummel-Garbuna-Welcker Volcanic Complex consists of three volcanic peaks located along a 7-km N-S line above a shield-like foundation at the southern end of the Willaumez Peninsula. The central and lower peaks of the centrally located Garbuna contain a large vegetation-free area that is probably the most extensive thermal field in Papua New Guinea. A prominent lava dome and blocky lava flow in the center of thermal area have resisted destruction by thermal activity, and may be of Holocene age. Krummel volcano at the south end of the group contains a summit crater, breached to the NW. The highest peak of the group is Welcker volcano, which has fed blocky lava flows that extend to the eastern coast of the peninsula. The last major eruption from both it and Garbuna volcanoes took place about 1800 years ago. The first historical eruption took place at Garbuna in October 2005.
Information Contacts: Herman Patia, Steve Saunders, and Felix Taranu, Rabaul Volcano Observatory (RVO), PO Box 3386, Rabaul, E.N.B.P, Papua New Guinea.
Langila (Papua New Guinea) — February 2008 Cite this Report
Langila
Papua New Guinea
5.525°S, 148.42°E; summit elev. 1330 m
All times are local (unless otherwise noted)
Intermittent ash emissions in May and August 2007
Satellite thermal anomalies occurred at or near Langila on three different days in early 2007 (BGVN 32:02). Although erupting regularly, only one other anomaly (on 2 April 2007) was detected after that time through 6 March 2008. Langila is noted for its ongoing fluctuating eruptions and occasional ash clouds that rise to more than 5 km altitude and pose a threat to aviation. Throughout this reporting period, April 2007 to January 2008, ash emissions were usually accompanied by weak to moderately loud roaring.
During May 2007, the Rabaul Volcanic Observatory (RVO) reported the emission of ash clouds from Langila's Crater 2. Ash plumes rose to an altitude of 3.3-4.3 km and drifted NW. Weak roaring noises were heard on 11-12 May and a weak glow was visible on 7-8, 11-12, and 15 May. Weak roaring noises were again heard on 20 May, and an increased phase of eruptive activity that began on 22 May continued until end of the month. The increased activity was characterized by forceful emission of thick pale-gray to dark gray-brown ash clouds from 22-27 May. The emission changed to subcontinuous thick dark gray-brown ash clouds on 28-29 May before changing back to occasional thick, pale-gray clouds on 30-31 May. Two large explosions on 30 May accompanied the ash emission. The ash clouds from these two explosions rose 4 km above the summit before being blown NW. On the other days, the ash clouds rose 2-3 km above the summit before drifting NW of the volcano. Continuous fine ashfall occurred at Kilenge Catholic Mission (~10 km NW) and surrounding areas during 22-31 May. The ash emissions were accompanied by occasional weak to loud roaring noises from the 22 to 28 May before turning subcontinuous during 29-31 May. On 30 May two large explosions produced ash plumes that rose to ~5.3 km and drifted NW. A weak glow was visible on 7-8, 11-12, 15, and 20 May and again on 29 and 31 May. Incandescence was visible on 29 May. On 26 May, the seismograph deployed at Kilenge became operational.
During June RVO reported a slight decrease in eruptive activity that began on 22 May, however, the emissions of ash plumes from Crater 2 were occasionally forceful. The emissions were continuous on 6, 7, and 10 June and accompanied by roaring noises; booming noises were heard on 1 and 10 June. Ash plumes rose to ~ 2.3-4.3 km and drifted NNW. Based on observations of satellite imagery and information from RVO, the Darwin VAAC reported that on 3 June, an ash plume rose to an altitude of 3 km and drifted W. Ashfall was again reported at Kilenge Catholic Mission and surrounding areas. Seismic activity in June was at a high level, dominated by continuous tremor and occasional explosion signals. During the latter part of the month, seismic activity decreased to a low-moderate level. It was dominated by continuous irregular tremors and occasional harmonic tremors. Low-frequency earthquakes ranged from 1 to 7 events per day.
During July 2007, eruptive activity continued at a low level but included thin-to-thick, pale-gray ash clouds. Weak roaring noises were heard on 1 July, but glow was absent at night. On 2 July ash clouds were ejected forcefully and rose ~2 km, drifted NW, and resulted in a fine ashfall downwind. On 6-7, and 9-13 July, ash clouds rose less than 1 km above the summit before drifting NNW. Except for 1 July when weak roaring noises were heard, the volcano was quiet and without appreciable night glow. Seismicity registered at low-moderate levels, dominated by non-harmonic and harmonic tremor of continuous, irregular, or banded character. During July, the daily number of low-frequency earthquakes ranged between 1 and 12 events per day. The one high-frequency earthquake occurred on 27 July.
RVO reports noted mild but continuous ash and white vapor plumes from Crater 2 during 1 August-30 September. Ash plumes generally rose to altitudes of ~1.8-3.3 km and drifted WNW. On 8 August, a large explosion produced an ash plume that rose to an altitude of 5.3 km and drifted SW. Ashfall was reported downwind. Incandescent fragments were ejected from the summit on 21-22 September.
During 1-7 October 2007, RVO reported low-to-moderate eruptive activity consisting of continuous emission of pale gray ash clouds which rose to ~1.8-3.3 km and were blown W to NW. During the second week, the white vapor accompanied by pale gray ash clouds continued; these rose less than 1 km before being blown to the NW of the volcano. On 19, 16, and 27 October, the ash clouds rose less than 2 km before being blown WNW. Consistently, the ash emissions were accompanied by occasional weak-to-loud roaring or booming noises.
On most occasions, there was no glow observed at night, however, a weak-to-bright glow accompanied by projection of incandescent lava fragments was visible on 12 and 22 October. Crater 3 remained quiet. Seismic activity was at low-to- moderate level dominated by low frequency earthquakes and bands of harmonic and non-harmonic tremors. The daily number of low-frequency earthquakes ranged from 2-15. Less than 10 high-frequency events were recorded during October.
In January 2008, activity generally remained low. Some ash fell on 6-7, and 9 January with fluctuating glow visible. On 10, 13, and 25 January the incandescent glow was bright. More direct observations through late February 2008 by RVO staff and affiliates confirmed ongoing eruptions. During February, Crater 2 continued to erupt. Most days, these eruptions generated ash plumes typically rising a few hundred meters. Observers noted incandescent glow or noises on 7, 9, 11, and 21-23 February.
Geologic Background. Langila, one of the most active volcanoes of New Britain, consists of a group of four small overlapping composite basaltic-andesitic cones on the lower E flank of the extinct Talawe volcano in the Cape Gloucester area of NW New Britain. A rectangular, 2.5-km-long crater is breached widely to the SE; Langila was constructed NE of the breached crater of Talawe. An extensive lava field reaches the coast on the N and NE sides of Langila. Frequent mild-to-moderate explosive eruptions, sometimes accompanied by lava flows, have been recorded since the 19th century from three active craters at the summit. The youngest and smallest crater (no. 3 crater) was formed in 1960 and has a diameter of 150 m.
Information Contacts: Herman Patia, Rabaul Volcano Observatory (RVO), PO Box 386, Rabaul, Papua New Guinea; Darwin Volcanic Ash Advisory Centre (VAAC), Bureau of Meteorology, Northern Territory Regional Office, PO Box 40050, Casuarina, Northern Territory 0811, Australia (URL: http://www.bom.gov.au/info/vaac/); Hawai'i Institute of Geophysics and Planetology (HIGP) Thermal Alerts System, School of Ocean and Earth Science and Technology (SOEST), Univ. of Hawai'i, 2525 Correa Road, Honolulu, HI 96822, USA (URL: http://modis.higp.hawaii.edu/).
Ol Doinyo Lengai (Tanzania) — February 2008 Cite this Report
Ol Doinyo Lengai
Tanzania
2.764°S, 35.914°E; summit elev. 2962 m
All times are local (unless otherwise noted)
Explosive eruptions of December 2007-March 2008; hazard warnings
The previous report on Ol Doinyo Lengai (BGVN 32:11), often simply called Lengai, summarized seismicity and energetic ash emissions during 2007. The development of a single large cone with a prominent venting crater significantly changed the crater morphology.
This report discusses field observations by various individuals during December 2007 through March 2008. The reports and photos from visitors provided by Frederick Belton on his website form the source for much of which follows. Table 16 summarizes the observations from December 2007 through March 2008.
Table 16. Summary of visitors to Ol Doinyo Lengai and their brief observations (from a climb, aerial overflight, or flank) from December 2007 through 26 March 2008. Observations for 2007 were reported in BGVN 32:11. Most of this list is courtesy of Frederick Belton.
| Date |
Observer |
Observation Location |
Brief Observations |
| 07 Dec 2007 |
Joerg Keller, Jurgis Klaudius |
Climb |
Geological samples collected; ash eruption with plumes rising to several thousand meters above volcano (see text). |
| 25 Dec 2007 |
Jens Fissenebert, Paul Johns |
Aerial/Climb |
Observations of crater from helicopter and ground (see text). |
| 31 Dec 2007 |
Raphael Wolf |
Climb |
Volcano "shook 3 times as my guide and I were climbing;" vent of new cinder cone steaming. |
| 06 Jan 2008 |
Paul Johns |
Aerial/Climb |
Helicopter landed in S crater, group walked to summit; eruption during flight to crater and 15 minutes after they left; large rocks (bombs?) had been thrown into the S crater. |
| 14 Jan 2008 |
Vegard Laukhammer |
Climb |
Experienced eruption (see text). |
| 17 Jan-21 Jan 2008 |
Tom Pfeiffer, group from Volcano Discovery |
Climb |
See text. |
| 18 Jan 2008 |
Thomas Holden |
Climb |
New climbing route on the SE described. |
| 19 Jan 2008 |
Bernhard Donth, Thomas Schulmeister, William (Maasai) |
Climb |
Occasional rain of fine gray ash and small white pebbles during ascent; small ash jets from the active crater. |
| 04 Feb 2008 |
Michael Dalton-Smith |
Flank |
See text. |
| 12 Feb 2008 |
Michel Picard |
Aerial |
Photographed a dark ash cloud. |
| 13 Feb 2008 |
Walt Bilofsky |
Aerial |
Ash rising from summit crater. |
| 15 Feb 2008 |
Gerrit Jan Plaisier, Rob Alakaposa |
Aerial |
Plume over Lengai to altitude of 11 km. |
| 15 Feb 2008 |
Benoit Wangermez (pilot) |
Aerial |
Summit crater heavily cloaked in fresh ash; ash cloud rising from crater; movie of eruption on Celia Nyamweru's website. |
| 20 Feb 2008 |
Nigel D'Aubrey |
Aerial |
Plume over Lengai. |
| 21 Feb 2008 |
KLM pilot |
Aerial |
Eruption. |
| 24 Feb 2008 |
Claude Humbert |
Climb |
Party of 11 people attempted to climb the S side, but terminated the climb about half-way up due to eruption. |
| 27 Feb 2008 |
Reported to Michael Dalton-Smith |
Flank |
Eruptions getting stronger; observed from Gol, massive cloud. |
| 27-28 Feb 2008 |
Flight crew |
Aerial |
Ash emissions at 1030 and 1200 on 27 Feb and 0530 on 28 Feb; ash cloud moved SW and dissipated. |
| 27-28 Feb 2008 |
Dave Rhys |
Flank |
Eruptions observed from the Serengeti Plain and Ngorongoro Crater 3; single ash plumes rose rapidly following each eruption (none continuous) and dispersed S (thin ash coating on leaves around the rim of Ngorongoro crater). |
| 01 Mar 2008 |
Max Voight |
Aerial |
Photo of ash plume rising. |
| late Feb 2008, 1-2 Mar 2008 |
Benoit Wilhelmi (pilot) |
Aerial |
Photos of ash plumes. |
| 03 Mar-05 Mar 2008 |
Tony Drummond-Murray |
Flank |
Massive eruptions (see text). |
| 05 Mar 2008 |
Benoit Wilhelmi (pilot) |
Aerial |
Plume to altitude of ~15.2 km. |
| 11 Mar-12 Mar 2008 |
Benoit Wilhelmi (pilot) |
Aerial |
Strong ash eruption (see text). |
| 18 Mar 2008 |
Benoit Wilhelmi (pilot) |
Aerial |
Photos of crater (see text). |
| 22 Mar 2008 |
Benoit Wilhelmi (pilot) |
Aerial |
Photos of new crater (see text). |
| 25 Mar 2008 |
Paul Westerman, friend, and Maasai guide |
Climb |
Walked to the top of the ash cone and heard the tremendous roar; no sulfur smell but some heat. |
| 26 Mar 2008 |
Paul Westerman |
Flank |
From shore of Lake Natron observed some smoke and ashfall (on the downwind side) starting around 0930. |
An accident last August highlights the hazards of summit access. On his 21 August 2007 ascent, Chris Weber's group evacuated a local Maasai porter who had fallen into an active lava flow (around 500°C) in the crater. The porter had managed to get out of the lava, but with both legs and one arm seriously burned. Initial treatment at an Arusha hospital was financed by Weber's tour company. As of January 2008 he was bedridden in his home near Engare Sero, experiencing pain and muscle wasting. Celia Nyamweru (see web address below) has appealed for financial support to assist the young man during his recovery.
Keller and Klaudius fieldwork, December 2007. Subsequent to publication of BGVN 32:11, we received an unpublished report by Joerg Keller and Jurgis Klaudius on their fieldwork during 5-11 December 2007. According to them, the 4 September eruption ended a period of about 25 years of activity dominated by the effusion of highly fluid natrocarbonatite lavas within the summit crater. The deep pit crater from the 1966/67 eruption period had gradually filled by about 1999/2000. According to the report, the last days of August 2007 were characterized by Weber as displaying seemingly increased lava output. A natrocarbonatite lava, collected by Weber during his ascent on 23 August, was analyzed by Keller at Freiburg University and was close to the average or standard composition for natrocarbonatite from the last 20 years.
During their field work on 5-11 December 2007, Keller and Klaudius observed intermittent but impressive explosions with ash plumes rising to several thousand meters above the volcano. This activity alternated with periods dominated by either minor puffing or degassing, or with seemingly dormant phases up to several days long. This pattern seemed to be representative of the period following the 4 September 2007 paroxysm, which Keller and Klaudius had also studied.
Keller and Klaudius reported that an impressive bomb field with impacted blocks of up to 1 m in diameter extended along the crater rim, on the E ridge to the summit, and on the flank down into the S crater. They noted that, given the observed sudden onset of explosions from the intra-crater vent, the summit area was potentially dangerous. They found that fumarolic activity in the N crater was strong, especially along the N rim. It was also observed within the upper part of the N flank.
According to Keller and Klaudius, the 4 September paroxysm complicated access to the summit. With the help of Maasai guides, they used a newly opened route on 7 December that follows a prominent steep ridge and ends at the SE edge of the S crater. They reported that the track was quite strenuous and, while being rather direct, took much longer (7 hours) than the old trail from the W. They found that, with ongoing explosive activity, the S crater was the only safe arrival place. An attempt to use the old W route during their descent was unsuccessful because the very cemented surface of the lapilli beds provided no grip on the steep entrance from above to the ascent chasm.
While at the crater, Keller and Klaudius collected fresh samples of black lapilli, ash, and bombs from the active cone. The large intra-crater cinder-and-ash cone (figure 102) occupied more than half of the former crater platform, with a crater diameter of ~200 m. Its location coincided with the large collapse structure formed during the March/April 2006 natrocarbonatite effusive activity (BGVN 32:02) (Kervyn and others, 2008), which has also been the area of strong lava emission before the explosive eruption of 4 September 2007. It had a slightly N-S elongation, oval shape and, despite the heavy fumes filling the crater, it appeared that two vents, a more northerly one and a more southerly one, were erupting.
The cone was formed by and covered by ash, black-to-brown lapilli, cinders, angular blocks, and cored oval bombs. The magmatic lapilli contained macroscopic phenocrysts of nepheline, garnet, and wollastonite. With time, the black lapilli and bombs on the slopes of the cone and in the ring plain around it turned white by weathering of their components. Products of the active cone have covered almost all the old natrocarbonatite structures. Only the spiny remnant of the T49B hornito still stands out at the northern crater rim of the cone. The surface of a blocky flow was also still recognizable at the foot of the N wall.
Analyses of the magmatic material were in harmony with the recent observations of Roger Mitchell and Barry Dawson (reported in BGVN 32:11), who analyzed the mineralogy after the 24 September 2007 eruption, and their suggestion that at the onset of the explosive eruptive period on 4 September 2007 a silicate component became involved in the eruptive activity. Mitchell and Dawson concluded that "in lacking clinopyroxene, the mantling ash is not nephelinite or melilitite and is unlike any other magma type previously recorded from the volcano."
During the December fieldwork, Keller and Klaudius collected samples and examined cross-sections of the 4 September 2007 ash. Proximal (near-source) accumulations of tephra in the S crater occurred to a thickness of ~ 20 cm in the depression and on the upper slopes of the S flank, decreasing to a thickness of 1 cm at the E starting point of the new trail. This compared with a thickness of ~ 5 cm at the upper parking site of the old W trail and the abandoned Maasai home closest to the volcano, 4.2 km away (figure 103). Towards Engare Sero village, relics of the ashfall were still locally preserved and indicated an original thickness of ~ 1 cm, consistent with eyewitness reports of ashfall over the village during 4 September.
Other observations. Jens Fissenebert's visit on 25 December 2007 to the summit by helicopter again confirmed that the ash cone had grown. He estimated that it covered nearly the northern two-thirds of the crater floor. The N and W parts of the crater rim were indistinct, having been mostly covered by the growing flank of the new cone. Newly erupted ash and lapilli had filled in the flank area below the former crater rim and down through the "Pearly Gates" through which the former W climbing route passed.
Several eruptions were noted by Paul Johns when landing by helicopter on 6 January 2008. During early 2008, there were also occasional thermal anomalies measured by MODIS (table 17).
Table 17. MODIS/MODVOLC thermal anomalies measured at Ol Doinyo Lengai during January through early April 2008. Anomalies measured during 2007 were reported in BGVN 32:11. Courtesy of the Hawai'i Institute of Geophysics and Planetology (HIGP) Thermal Alerts System.
| Date |
Time (UTC) |
Number of pixels |
Satellite |
| 08 Jan 2008 |
2030 |
2 |
Terra |
| 17 Jan 2008 |
2025 |
2 |
Terra |
| 17 Feb 2008 |
2240 |
3 |
Aqua |
| 22 Feb 2008 |
2300 |
1 |
Aqua |
| 28 Feb 2008 |
1135 |
1 |
Aqua |
| 29 Feb 2008 |
2305 |
1 |
Aqua |
| 07 Mar 2008 |
2310 |
1 |
Aqua |
| 10 Mar 2008 |
2045 |
4 |
Terra |
| 03 Apr 2008 |
1955 |
1 |
Terra |
Vegard Laukhammer climbed the volcano with several others on 14 January 2008. Laukhammer reported arriving at the summit at 0652 (local time). "The visibility was so poor and there was so much smoke that we decided to try to climb down again after 10 minutes. . . . About 10 minutes later (0715), when we had been able to climb about 50 meters down from the summit, a thundering, ear-breaking sound came from the volcano. A large shower of rocks (many the size of a football) were thrown out from the volcano directly towards us 4 on the top" (translation from Norwegian by Sven Dahlgren, found on Belton's website). The climbers managed to descend without serious injury.
Tom Pfeiffer and a VolcanoDiscovery group stayed near and on Ol Doinyo Lengai during 17-21 January 2008. During this period episodic ash eruptions lasted several hours. These phases alternated with quiet intervals when there was only a weak plume of very fine gray ash and gas. After sunset on 17 January, strong ash eruptions started with plumes reaching about 500-1,000 m high, accompanied by strong lightning. After around 2130, Randle Robertson observed a fountain that appeared as a bright red-orange "blow-torch" rising from the summit crater to an estimated height of 500 m above the crater. The light was steady in appearance and lasted for at least 5 minutes. When the fountain died, a dark ash cloud emerged from the crater, which did not reach a great height. The volcano was more or less quiet during most of 18 January (figure 104).
At around 1600 on 19 January, weak explosions set in, increasing in intensity until the ash plumes reached about 500 m above the crater at around 1730 (figure 105). Blocks were ejected 300-400 m above the crater, and all explosions were near-vertical jets from two vents in the crater's W and central portions. Activity decreased after sunset. No incandescence was observed during the night. Activity intensified during the night, with loud-explosion sounds, and the hissing sound of gas-and-ash jets. During their descent on 20 January, ash eruptions continued until early afternoon.
Michael Dalton-Smith observed a fairly large eruption at 1200 on 3 February 2008 from the Gol mountains just E of Sanjan gorge. He saw a cloud that rose about ~1 km above the summit. Activity was present all day, ceasing around 1600, followed by renewed activity with ash rising 0.3-0.5 km above the crater.
At about 0600 on 4 February there was a larger eruption with the ash rising about 1.4 km. It was a fairly dense cloud that flattened out at the top. The camp manger of Asilia (where Dalton-Smith was staying) also said that there had been several large explosive eruptions three days before (on 1 February). Two explosions were heard, one in the morning and one in the evening.
On 6 February, Dalton-Smith opted to not climb because of strong eruptions. When he drove past the volcano he reported that "it was having some of the biggest eruptions in a long time" with continuous activity from sunrise to about 1400.
During 3-5 March 2008, Tony Drummond-Murray and his wife observed very strong eruptions (figure 106). Figure 107 shows pyroclastic flows from what appeared to be a collapsing ash column. The valley between Lengai and the escarpment itself was covered with a highly visible layer of light ash after the eruption on 4 March. On 5 March the plume appeared even larger than the one seen on 4 March.
At 1010 on 5 March 2008, pilot Benoît Wilhelmi observed a plume rising to ~15 km altitude. On 12 March, he also saw a strong ash eruption; weaker activity was also seen that day (figure 108). That photo indicates that the powerful eruptions of 3-5 March did not significantly alter the ash cone or crater rim. Large amounts of ash and cinders had piled up against the northward facing ridge below the summit. The S crater was covered in ash and cinder layers so deep that previously prominent erosion gullies were becoming indistinct. It appeared that all vegetation had either died or been buried.
Wilhelmi photographed the summit cone on 18 March at 1530 (figure 109). On 22 March, Wilhelmi photographed directly into the crater (figure 110). At that time there had been no reports of activity for three days, but the smell of hydrogen sulfide returned after being gone for days.
Table 18 lists a number of volcanic ash advisories (VAAs) issued in March 2008 by the Toulouse Volcanic Ash Advisory Center (VAAC).
Table 18. March 2008 Volcanic Ash Advisories (VAAs) relating to Ol Doinyo Lengai issued by Toulouse Volcanic Ash Advisory Center (VAAC).
| Date |
Time (UTC) |
Information Source |
Observed Details |
| 04 Mar 2008 |
0900 |
Satellite |
Eruption occurred at 0630 (UTC), cloud rising to 12.2 km may contain some ash; stopped by 0900. |
| 05 Mar 2008 |
0854 |
Meterological watch office (MWO) Dar-Es-Salaam |
Eruption of very short duration; "simple puff", ash cloud to 10.7 km altitude. |
| 06 Mar 2008 |
1730 |
MWO Dar-Es-Salaam |
Eruption occurred at 0830 (UTC); cloud top at 9.1 km altitude, ash not identified from satellite. |
| 09 Mar 2008 |
0845 |
MartinAir |
Current eruption; ash plume to 8.8 km altitude, ash not identified from satellite. |
| 10 Mar 2008 |
0711 |
Satellite |
Cloud to 7.3 km altitude. |
| 11 Mar 2008 |
1800 |
Infrared satellite |
Possible brief eruption at about 1700 (UTC); cloud up to 12.2 km altitude, moving S. |
| 13 Mar 2008 |
1800 |
KLM pilot, MartinAir |
Volcanism with ash cloud rising to 12.2 km altitude. |
| 16 Mar 2008 |
0450 |
Satellite |
Short eruption at ~0330 (UTC); plume reached 13.7 km altitude. |
| 16 Mar 2008 |
2148 |
Satellite |
Ash cloud to 12.2 km altitude. |
Thomas Holden reported that as of 29 March 2008 there had been no activity at Lengai for 10 days. Chris Daborn (Tropical Veterinary Services Ltd.) reported on 2 April 2008 the following: "Lengai has of late quieted down significantly-first in changing ash colour from a 'salty' white to a more inert black and now with much smaller eruptions that barely extend above the mountain. We have heavy rains on at present which makes movement in the area difficult-but are also washing ash residue away." Jurgis Klaudius reported that he checked MODIS data and found a thermal anomaly in the N crater on 3 April 2008, indicating on-going eruptions then (table 17).
Warnings of hazards. Celia Nyamweru posted the following warning on her web site: "A team of Tanzanian, US, and French scientists visited the region around the volcano in January 2008, and interviewed local porters who routinely climb Ol Doinyo Lengai with tourists. Our observations and photos indicate continuing eruptive activity, and a growing threat to the region, as outlined below.
"Almost daily eruptions from the central caldera have filled the crater, and produced a steep lapilli-ash cone around the crater rim. A film clip of the crater made by a Medecins Sans Frontieres pilot confirms that the loose lapilli is near collapse. These conditions mean that there are very high risks of one or more of the following: 1) a debris flow or lahar (mix of hot ash, water/mud) down the existing channels around the volcano; 2) burns from hot lapilli and ash; and 3) catastrophic collapse of the steep lapilli cones around the crater. The risks increase with increasing rainfall during the March-May rains.
"We also urge extreme caution to anyone driving in the river channels on the eastern and northern slopes of Lengai between Engaruka and Ngare Sero. There are scars of immense debris flows on the flanks of Kerimasi, and smaller scars on Ol Doinyo Lengai. These scars attest to catastrophic flows in the past, some of which carried rock fragments up to 50 cm in diameter for distances extending up to 10 km from Ol Doinyo Lengai. Even smaller debris flows could do great damage to vehicles and people moving along the eastern and northern slopes of the volcano."
Reference. Kervyn, M., Ernst, G.G.J., Klaudius, J., Keller, J., Kervyn, F., Mattsson, H.B., Belton, F., Mbede, E., and Jacobs, P., 2008, Voluminous lava flows at Ol Doinyo Lengai in 2006: chronology of events and insights into the shallow magmatic system: Bulletin of Volcanology, DOI 10.1007/s00445-007-0190-x.
Geologic Background. The symmetrical Ol Doinyo Lengai is the only volcano known to have erupted carbonatite tephras and lavas in historical time. The prominent stratovolcano, known to the Maasai as "The Mountain of God," rises abruptly above the broad plain south of Lake Natron in the Gregory Rift Valley. The cone-building stage ended about 15,000 years ago and was followed by periodic ejection of natrocarbonatitic and nephelinite tephra during the Holocene. Historical eruptions have consisted of smaller tephra ejections and emission of numerous natrocarbonatitic lava flows on the floor of the summit crater and occasionally down the upper flanks. The depth and morphology of the northern crater have changed dramatically during the course of historical eruptions, ranging from steep crater walls about 200 m deep in the mid-20th century to shallow platforms mostly filling the crater. Long-term lava effusion in the summit crater beginning in 1983 had by the turn of the century mostly filled the northern crater; by late 1998 lava had begun overflowing the crater rim.
Information Contacts: Joerg Keller and Jurgis Klaudius, Mineralogisch-geochemisches Institut, Albertstr. 23B D-79104 Freiburg, Germany; Jens Fissenebert, Molvaro-Lake Natron Tented Camp and Campsite; Vegard Laukhammer, Norway; Frederick Belton, Developmental Studies Department, PO Box 16, Middle Tennessee State University, Murfreesboro, TN 37132, USA (URL: http://oldoinyolengai.pbworks.com/); J. Barry Dawson, Grant Institute of Earth Science, University of Edinburgh, King's Building, Edinburgh EH9 3JW, U.K.; Roger Mitchell, Lakehead University, 955 Oliver Road, Thunder Bay, Ontario, Canada P7B 5EI; Hawai'i Institute of Geophysics and Planetology (HIGP) Thermal Alerts System, School of Ocean and Earth Science and Technology (SOEST), Univ. of Hawai'i, 2525 Correa Road, Honolulu, HI 96822, USA (URL: http://modis.higp.hawaii.edu/); Celia Nyamweru, Department of Anthropology, St. Lawrence University, Canton, NY 13617 USA (URL: http://blogs.stlawu.edu/lengai/); Toulouse Volcanic Ash Advisory Center (VAAC) (URL: http://www.meteo.fr/vaac/); Michael Dalton-Smith (URL: http://digitalcrossing.ca/); Lake Natron Camp (URL: http://www.ngare-sero-lodge.com/); Chris Weber, Volcano Expeditions International (VEI) (URL: http://www.v-e-i.de/).
Lokon-Empung (Indonesia) — February 2008 Cite this Report
Lokon-Empung
Indonesia
1.358°N, 124.792°E; summit elev. 1580 m
All times are local (unless otherwise noted)
June 2007-March 2008, variable seismicity and minor white plumes
Our most recent report on Lokon-Empung discussed low seismicity and plume emissions between January-October 2005 (BGVN 31:03). Since then, available reports from the Center of Volcanology and Geological Hazard Mitigation (CVGHM) discussed seismic events in June and December 2007, and January 2008. Plumes mentioned in these reports were small, white in color, and only rose 15-40 m, occasionally up to 125 m, above the rim of the active vent area (Tompaluan crater), in the saddle between the peaks of Lokon and Empung.
During 11-24 June 2007 CVGHM reported 52 A-type and 156 B-type earthquakes, but no tremor. Only one earthquake was felt by residents. The Alert Level remained at 2 (on a scale of 1-4).
On 9 December 2007, CVGHM raised the Alert Level from 2 to 3 based on visual observations, inflation detected by deformation instruments, and an increase in seismicity. The water in the Tompaluan crater changed color from green to gray and noises from degassing became stronger. Visitors were advised not to go within 2 km of the crater.
After a short period of decline, seismicity began to increase again on 22 January 2008, peaking on 3 February. Visitors were prohibited from going within 1 km of the crater.
Geologic Background. The Lokong-Empung volcanic complex, rising above the plain of Tondano in North Sulawesi, includes four peaks and an active crater. Lokon, the highest peak, has a flat craterless top. The morphologically younger Empung cone 2 km NE has a 400-m-wide, 150-m-deep crater that erupted last in the 18th century. A ridge extending 3 km WNW from Lokon includes the Tatawiran and Tetempangan peaks. All eruptions since 1829 have originated from Tompaluan, a 150 x 250 m crater in the saddle between Lokon and Empung. These eruptions have primarily produced small-to-moderate ash plumes that sometimes damaged croplands and houses, but lava-dome growth and pyroclastic flows have also occurred.
Information Contacts: Dali Ahmad, Hetty Triastuty, Nia Haerani and Suswati, Center of Volcanology and Geological Hazard Mitigation (CVGHM), Jalan Diponegoro 57, Bandung 40122, Indonesia (URL: http://www.vsi.esdm.go.id/).
NW Rota-1 (United States) — February 2008 Cite this Report
NW Rota-1
United States
14.601°N, 144.775°E; summit elev. -517 m
All times are local (unless otherwise noted)
Visit on 24 February 2008 found eruption plume and acoustic signals
During an April 2006 expedition (BGVN 31:05), scientists from the National Oceanic and Atmospheric Agency (NOAA) and Oregon State University aboard the research vessel Melville witnessed the volcano ejecting lava, bombs, and sulfur-rich (SO2 and H2S) plumes. This is the first site where explosive submarine eruptions have been directly observed from a submersible (see Videos, below).
According to William Chadwick, a brief visit to NW Rota-1 was made on 24 February 2008. With support from the NOAA Ocean Exploration Program and the U.S. Coast Guard, the scientists deployed a hydrophone and plume sensor. While on site, scientists found that the volcano was still erupting. There were no instruments left after the April 2006 visit, so the observational record was discontinuous. On the other hand, scientists visited the site four times in four years and consistently found that it was active. Moreover, Chadwick and colleagues had collected multibeam bathymetry in 2003 and 2006 (Walker and others, in press). Depth changes between those surveys were up to +40 m and extended from the eruptive vent at 550 m directly downslope to at least 2,000 m. They were consistent with volcaniclastic deposits from ongoing eruptions. The suggestion is that NW Rota-1 has been very active, if not continuously active.
On 24 February 2008 the Melville crew made a vertical cast over the eruptive vent with a light-scattering sensor and detected an eruption plume below 500 m depth. Hydrophone data also indicated eruptions with cyclic bursts about once a minute. These appear very similar to the explosions observed by ROV and hydrophone in 2006 (Chadwick and others, 2008). The explosion sounds were louder and more frequent in 2008 than in 2006. During the 2008 visit, explosion signals filled the 24-hour acoustic record. Before departure, the crew installed a hydrophone and plume sensor to record activity over the next year.
Resing and others (2007) described two types of venting at NW Rota-1. The first was a focused plume rich in Al, S, Si, CO2, Fe, Mn, and 3He. The second was a plume with diffuse flow, rich in Fe, Mn, CO2, and 3He, but without Al, S, and Si. Data suggested that the pH of these plumes were less than 1.0, primarily due to SO2 and possibly HCl. The authors claimed that the volcano is producing some of the greatest chemical anomalies ever observed in non-buoyant hydrothermal plumes and greatly different from that observed in any other hydrothermal setting.
Videos. Eruption videos taken from an unmanned submersible on 29 April 2006 can be found at http://www.oceanexplorer.noaa.gov/explorations/06fire/logs/april29/april29.html website. The five videos are titled as follows: (1) The extremely dynamic Brimstone Pit, (2) Brimstone Pit erupting with glowing red lava jetting out of the vent, (3) Brimstone Pit erupting with glowing red lava and gas bubbles, (4) Brimstone Pit sulfur plume envelopes the Jason ROV [remotely operated vehicle], and (5) The pulse and shake of the Brimstone Pit during another eruption.
References. Chadwick, W.W., Jr., Cashman, K.V., Embley, R.W., Matsumoto, H., Dziak, R.P., de Ronde, C.E.J., Lau, T.-K., Deardorff, N., and Merle, S.G., 2008, Direct video and hydrophone observations of submarine explosive eruptions at NW Rota-1 volcano, Mariana Arc: J. Geophys. Res.-Solid Earth, doi:10.1029/2007JB005215 (in press).
Resing, J.A., Lebon, G., Baker, E.T., Lupton, J.E., Embley, R.W., Massoth, G.J., Chadwick, Jr., W.W., and de Ronde, C.E.J., 2007, Venting of acid-sulfate fluids in a high-sulfidation setting at NW Rota-1 submarine volcano on the Mariana Arc: Economic Geology, v. 102, no. 6, p. 1047-1061.
Walker, S.L., Baker, E.T., Chadwick, Jr., W.W., Resing, J.A., Lebon, G.T., Lupton, J.E., and Merle S.G., (in press), Eruption-fed particle plumes and volcaniclastic deposits at a submarine volcano: NW-Rota-1, Mariana Arc: J. Geophys. Res.
Geologic Background. A submarine volcano detected during a 2003 NOAA bathymetric survey of the Mariana Island arc was found to be hydrothermally active and named NW Rota-1. The basaltic to basaltic-andesite seamount rises to within 517 m of the ocean surface SW of Esmeralda Bank, 64 km NW of Rota Island and ~100 km N of Guam. When Northwest Rota-1 was revisited in 2004, a minor submarine eruption from a vent named Brimstone Pit on the upper south flank about 40 m below the summit intermittently ejected a plume several hundred meters high containing ash, rock particles, and molten sulfur droplets that adhered to the surface of the remotely operated submersible vehicle. The active vent was funnel-shaped, about 20 m wide and 12 m deep. Prominent structural lineaments about a kilometer apart cut across the summit of the edifice and down the NE and SW flanks.
Information Contacts: William Chadwick and Robert Dziak, Oregon State University and NOAA Vents Program, Newport, Oregon; 2115 SE OSU Drive, Newport, OR 97365 USA (URL: http://oceanexplorer.noaa.gov/explorations/06fire/welcome.html).
Suwanosejima (Japan) — February 2008 Cite this Report
Suwanosejima
Japan
29.638°N, 129.714°E; summit elev. 796 m
All times are local (unless otherwise noted)
Small (~1 km) plumes noted during late 2007-early 2008
Our last Bulletin (BGVN 3211) covered eruptive activity during July 2005 to December 2007. This issue covers eruptions recorded by the Tokyo Volcanic Ash Advisory Center (VAAC) from December 2007 to March 2008. Kinoshita and others (2003) noted that Sakura-jima "has been the most eruptive in Japan, with the eruption columns a few kilometers above the crater occasionally."
Table 5 summarizes information gathered by the Tokyo VAAC from observers between 9 December 2007 and 21 March 2008. In all cases the VAAC could not detect plumes using satellite data. An overview of satellite and image monitoring of Suwanose-jima appears in an article by Kinoshita and others (2003).
Table 5. A summary of Tokyo VAAC reports on ash plumes from Suwanose-jima during 9 December 2007 to 21 March 2008. Cases with only dashes in the data fields were when observers detected an explosion but they were unable to say more about a resulting plume. In many of the examples given, there were multiple Volcanic Ash Advisories issued, but no new data came to light. Courtesy of the Tokyo VAAC.
| Date |
Time (UTC) |
Plume Altitude (km) |
Drift Direction |
| 09 Dec 2007 |
2340 |
1.5 |
W |
| 10 Dec 2007 |
0734 |
1.8 |
W |
| 14 Dec 2007 |
0914 |
-- |
-- |
| 15 Dec 2007 |
0016 |
1.8 |
E |
| 16 Dec 2007 |
0353 |
1.5 |
E |
| 16 Dec 2007 |
2310 |
1.5 |
E |
| 08 Feb 2008 |
0248 |
1.8 |
E |
| 13 Feb 2008 |
0208 |
-- |
-- |
| 21 Mar 2008 |
1622 |
-- |
-- |
Reference. Kinoshita, K., Kanagaki, C., Minaka, A., Tsuchida, S., Matsui, T., Tupper, A., Yakiwara, H., and Iino, N., 2003, Ground and Satellite Monitoring of Volcanic Aerosols in Visible and Infrared Bands: The CEReS International Symposium on Remote Sensing - Monitoring of Environmental Change in Asia, Chiba, Japan, 16-17 December 2003, 10 p.
Geologic Background. The 8-km-long island of Suwanosejima in the northern Ryukyu Islands consists of an andesitic stratovolcano with two active summit craters. The summit is truncated by a large breached crater extending to the sea on the E flank that was formed by edifice collapse. One of Japan's most frequently active volcanoes, it was in a state of intermittent Strombolian activity from Otake, the NE summit crater, between 1949 and 1996, after which periods of inactivity lengthened. The largest recorded eruption took place in 1813-14, when thick scoria deposits covered residential areas, and the SW crater produced two lava flows that reached the western coast. At the end of the eruption the summit of Otake collapsed, forming a large debris avalanche and creating an open collapse scarp extending to the eastern coast. The island remained uninhabited for about 70 years after the 1813-1814 eruption. Lava flows reached the eastern coast of the island in 1884. Only about 50 people live on the island.
Information Contacts: Tokyo Volcanic Ash Advisory Center (VAAC), Tokyo, Japan (URL: https://ds.data.jma.go.jp/svd/vaac/data/).
Talang (Indonesia) — February 2008 Cite this Report
Talang
Indonesia
0.979°S, 100.681°E; summit elev. 2575 m
All times are local (unless otherwise noted)
Ash emissions in March, June, and November 2007
The Center of Volcanology and Geological Hazard Mitigation (CVGHM) lowered the Alert Level of Talang to 2 (on a scale of 1-4) on 27 January 2007 due to a reduced seismicity between 23 November 2006 and 24 January 2007, although gas plumes originated from South and Main craters. There had been eruptive episodes in April 2005 and elevated activity during late 2006 (BGVN 32:01).
On 17 March 2007, CVGHM raised the Alert Level based on increased "smoke" and tremors to 3 (on a scale of 1-4). The Darwin Volcanic Ash Advisory Centre (VAAC) reported that, based on information from CVGHM, ash plumes rose to altitudes of 3.4-3.9 km on 19-20 March. Local authorities and residents were advised to prepare for a possible evacuation. On 23 April 2007 the Alert Level was reduced to 2. During 18-25 June, thick brown ash plumes rose from Main crater to an altitude of 3.1 km. Diffuse "white ash" plumes rose from South crater to an altitude of 3 km.
On 29 November CVGHM raised the Alert Level to 3 (on a scale of 1-4) based on visual observations and seismicity. During 27-29 November, ash and steam plumes from multiple craters rose to altitudes of 3.1-4.1 km. A strong smell of sulfur dioxide gas was reported. Visitors were advised not to go within 3 km of the summit.
During 7-10 December, observations were limited by inclement weather. On 11 December, "smoke" rose from the Main crater to a maximum altitude of 3.3 km. Plumes were also observed from the South crater and Gabuo Atas solfatara field. On 14 December visual observations and a decrease in the number of earthquakes prompted a lowering of the Alert Level back to 2.
Geologic Background. Talang, which forms a twin volcano with the extinct Pasar Arbaa volcano, lies ESE of the major city of Padang and rises NW of Dibawah Lake. Talang has two crater lakes on its flanks; the largest of these is 1 x 2 km wide Danau Talang. The summit exhibits fumarolic activity, but which lacks a crater. Historical eruptions have mostly involved small-to-moderate explosive activity first documented in the 19th century that originated from a series of small craters in a valley on the upper NE flank.
Information Contacts: Darwin Volcanic Ash Advisory Centre, Bureau of Meteorology, Commonwealth of Australia (URL: http://www.bom.gov.au/info/vaac); Center of Volcanology and Geological Hazard Mitigation (CVGHM), Jalan Diponegoro 57, Bandung 40122, Indonesia (URL: http://www.vsi.esdm.go.id/).
Batu Tara (Indonesia) — February 2008 Cite this Report
Batu Tara
Indonesia
7.791°S, 123.585°E; summit elev. 633 m
All times are local (unless otherwise noted)
Satellite thermal anomalies indicate that near-daily eruptions continue
Our last report (the first ever for this volcano) covered eruptive activity through 13 October 2007 (BGVN 32:12). This report continues coverage through early April 2008.
Thermal anomalies were first measured by the MODIS satellites on 17 January 2007 (1420 UTC). According to the Hawai'i Institute of Geophysics and Planetology (HIGP) Thermal Alerts System, through the end of 2007 anomalies were measured every 1 to 7 days. This trend of nearly daily anomalies continued up to 9 April 2008, with the following exceptions: a 10-day gap beginning 21 December 2007, a 10-day gap beginning 8 January 2008, and a 21-day gap beginning 2 February 2008.
The regularity and repeating character of the thermal anomalies suggest ongoing venting of hot fragmental material or lava flows, similar to March and April 2007 (BGVN 32:12). However, the late 2007 and early 2008 behavior and deposits have not been observed.
On 4 February 2008, the Center of Volcanology and Geological Hazard Mitigation (CVGHM) reported that since 9 October 2007, white plumes were a daily occurrence. On 8 January 2008, gray plumes rose to 1.5 km altitude and drifted E. On 26 January, white plumes rose to altitudes of 1.7 km and drifted E. On 30 January, white plumes rose to altitudes of 1.5 km. and drifted E. The Darwin VAAC reported that eruption plumes were observed from a ship on 31 January, but ash was not seen in satellite imagery. The Alert level remained at 1 (on a scale of 1-4).
On 11 March the Darwin VAAC reported that satellite imagery that day revealed an ash-and-steam plume from Batu Tara that rose to an altitude of 3 km and drifted SW. On 12 March satellite imagery revealed an ash-and-steam plume at an altitude of 2.1 km moving SE.
Geologic Background. The small isolated island of Batu Tara in the Flores Sea about 50 km N of Lembata (fomerly Lomblen) Island contains a scarp on the eastern side similar to the Sciara del Fuoco of Italy's Stromboli volcano. Vegetation covers the flanks to within 50 m of the summit. Batu Tara lies north of the main volcanic arc and is noted for its potassic leucite-bearing basanitic and tephritic rocks. The first historical eruption, during 1847-52, produced explosions and a lava flow.
Information Contacts: Darwin Volcanic Ash Advisory Centre, Bureau of Meteorology, Commonwealth of Australia (URL: http://www.bom.gov.au/info/vaac); Center of Volcanology and Geological Hazard Mitigation (CVGHM), Jalan Diponegoro 57, Bandung 40122, Indonesia (URL: http://www.vsi.esdm.go.id/); Hawai'i Institute of Geophysics and Planetology (HIGP) Thermal Alerts System, School of Ocean and Earth Science and Technology (SOEST), Univ. of Hawai'i, 2525 Correa Road, Honolulu, HI 96822, USA (URL: http://modis.higp.hawaii.edu/).