Recently Published Bulletin Reports
Kadovar (Papua New Guinea) An ash plume and weak thermal anomaly during May 2023
San Miguel (El Salvador) Small gas-and-ash explosions during March and May 2023
Ebeko (Russia) Continued explosions, ash plumes, and ashfall during October 2022-May 2023
Home Reef (Tonga) Discolored plumes continued during November 2022-April 2023
Semisopochnoi (United States) Occasional explosions, ash deposits, and gas-and-steam plumes during December 2022-May 2023
Ambae (Vanuatu) New lava flow, ash plumes, and sulfur dioxide plumes during February-May 2023
Ibu (Indonesia) Daily ash explosions continue, along with thermal anomalies in the crater, October 2022-May 2023
Dukono (Indonesia) Continuing ash emissions, SO2 plumes, and thermal signals during October 2022-May 2023
Sabancaya (Peru) Explosions, gas-and-ash plumes, and thermal activity persist during November 2022-April 2023
Sheveluch (Russia) Significant explosions destroyed part of the lava-dome complex during April 2023
Bezymianny (Russia) Explosions, ash plumes, lava flows, and avalanches during November 2022-April 2023
Chikurachki (Russia) New explosive eruption during late January-early February 2023
Kadovar (Papua New Guinea) — June 2023  Cite this Report
Kadovar
Papua New Guinea
3.608°S, 144.588°E; summit elev. 365 m
All times are local (unless otherwise noted)
An ash plume and weak thermal anomaly during May 2023
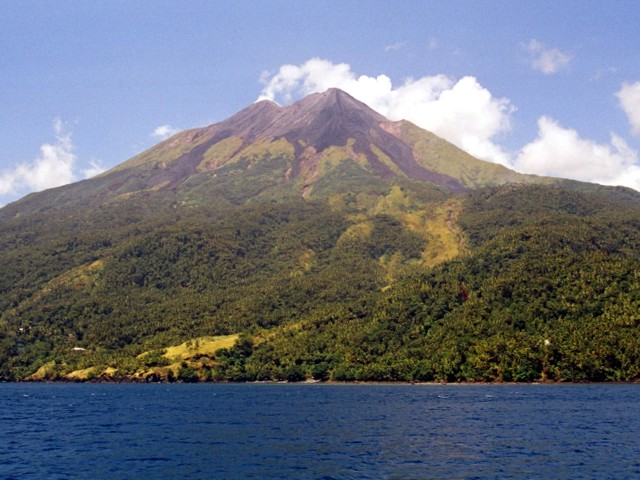
Kadovar is a 2-km-wide island that is the emergent summit of a Bismarck Sea stratovolcano. It lies off the coast of New Guinea, about 25 km N of the mouth of the Sepik River. Prior to an eruption that began in 2018, a lava dome formed the high point of the volcano, filling an arcuate landslide scarp open to the S. Submarine debris-avalanche deposits occur to the S of the island. The current eruption began in January 2018 and has comprised lava effusion from vents at the summit and at the E coast; more recent activity has consisted of ash plumes, weak thermal activity, and gas-and-steam plumes (BGVN 48:02). This report covers activity during February through May 2023 using information from the Darwin Volcanic Ash Advisory Center (VAAC) and satellite data.
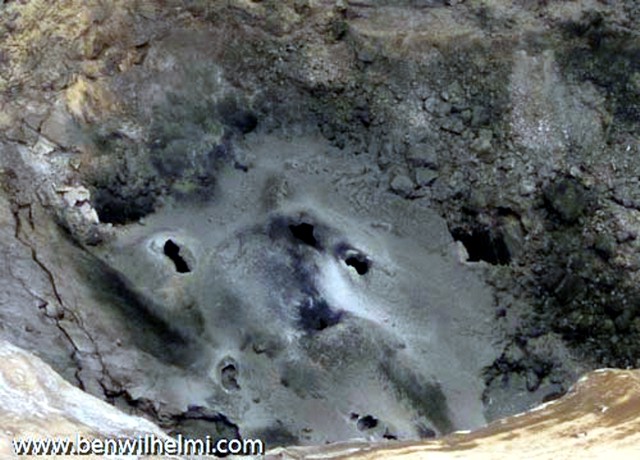
Activity during the reporting period was relatively low and mainly consisted of white gas-and-steam plumes that were visible in natural color satellite images on clear weather days (figure 67). According to a Darwin VAAC report, at 2040 on 6 May an ash plume rose to 4.6 km altitude and drifted W; by 2300 the plume had dissipated. MODIS satellite instruments using the MODVOLC thermal algorithm detected a single thermal hotspot on the SE side of the island on 7 May. Weak thermal activity was also detected in a satellite image on the E side of the island on 14 May, accompanied by a white gas-and-steam plume that drifted SE (figure 68).
Geologic Background. The 2-km-wide island of Kadovar is the emergent summit of a Bismarck Sea stratovolcano of Holocene age. It is part of the Schouten Islands, and lies off the coast of New Guinea, about 25 km N of the mouth of the Sepik River. Prior to an eruption that began in 2018, a lava dome formed the high point of the andesitic volcano, filling an arcuate landslide scarp open to the south; submarine debris-avalanche deposits occur in that direction. Thick lava flows with columnar jointing forms low cliffs along the coast. The youthful island lacks fringing or offshore reefs. A period of heightened thermal phenomena took place in 1976. An eruption began in January 2018 that included lava effusion from vents at the summit and at the E coast.
Information Contacts: Darwin Volcanic Ash Advisory Centre (VAAC), Bureau of Meteorology, Northern Territory Regional Office, PO Box 40050, Casuarina, NT 0811, Australia (URL: http://www.bom.gov.au/info/vaac/); Hawai'i Institute of Geophysics and Planetology (HIGP) - MODVOLC Thermal Alerts System, School of Ocean and Earth Science and Technology (SOEST), Univ. of Hawai'i, 2525 Correa Road, Honolulu, HI 96822, USA (URL: http://modis.higp.hawaii.edu/); Copernicus Browser, Copernicus Data Space Ecosystem, European Space Agency (URL: https://dataspace.copernicus.eu/browser/).
San Miguel (El Salvador) — June 2023 Cite this Report
San Miguel
El Salvador
13.434°N, 88.269°W; summit elev. 2130 m
All times are local (unless otherwise noted)
Small gas-and-ash explosions during March and May 2023
San Miguel in El Salvador is a broad, deep crater complex that has been frequently modified by eruptions recorded since the early 16th century and consists of the summit known locally as Chaparrastique. Flank eruptions have produced lava flows that extended to the N, NE, and SE during the 17-19th centuries. The most recent activity has consisted of minor ash eruptions from the summit crater. The current eruption period began in November 2022 and has been characterized by frequent phreatic explosions, gas-and-ash emissions, and sulfur dioxide plumes (BGVN 47:12). This report describes small gas-and-ash explosions during December 2022 through May 2023 based on special reports from the Ministero de Medio Ambiente y Recursos Naturales (MARN).
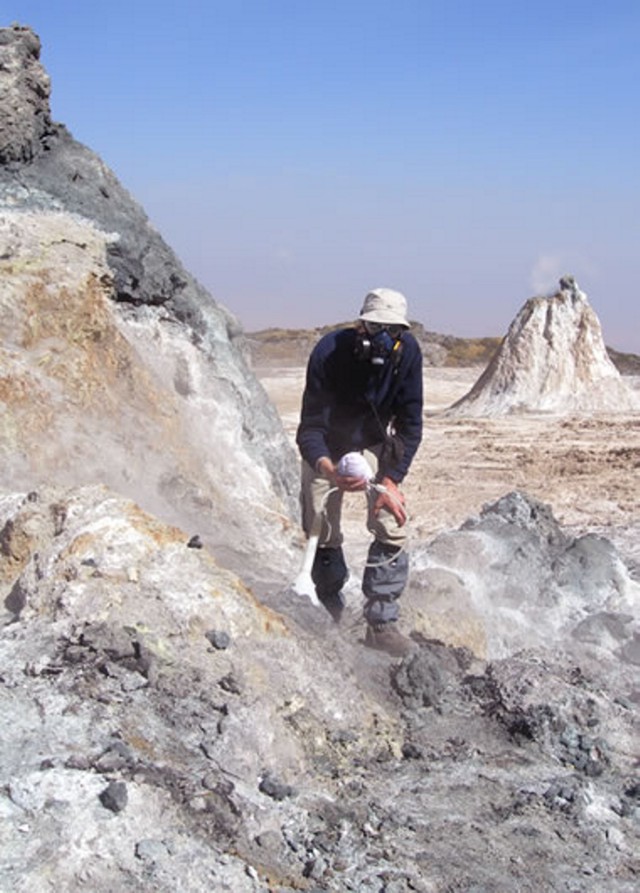
Activity has been relatively low since the last recorded explosions on 29 November 2022. Seismicity recorded by the San Miguel Volcano Station (VSM) located on the N flank at 1.7 km elevation had decreased by 7 December. Sulfur dioxide gas measurements taken with DOAS (Differential Optical Absorption Spectroscopy) mobile equipment were below typical previously recorded values: 300 tons per day (t/d). During December, small explosions were recorded by the seismic network and manifested as gas-and-steam emissions.
Gas-and-ash explosions in the crater occurred during January 2023, which were recorded by the seismic network. Sulfur dioxide values remained low, between 300-400 t/d through 10 March. At 0817 on 14 January a gas-and-ash emission was visible in webcam images, rising just above the crater rim. Some mornings during February, small gas-and-steam plumes were visible in the crater. On 7 March at 2252 MARN noted an increase in degassing from the central crater; gas emissions were constantly observed through the early morning hours on 8 March. During the early morning of 8 March through the afternoon on 9 March, 12 emissions were registered, some accompanied by ash. The last gas-and-ash emission was recorded at 1210 on 9 March; very fine ashfall was reported in El Tránsito (10 km S), La Morita (6 km W), and La Piedrita (3 km W). The smell of sulfur was reported in Piedra Azul (5 km SW). On 16 March MARN reported that gas-and-steam emissions decreased.
Low degassing and very low seismicity were reported during April; no explosions have been detected between 9 March and 27 May. The sulfur dioxide emissions remained between 350-400 t/d; during 13-20 April sulfur dioxide values fluctuated between 30-300 t/d. Activity remained low through most of May; on 23 May seismicity increased. An explosion was detected at 1647 on 27 May generated a gas-and-ash plume that rose 700 m high (figure 32); a decrease in seismicity and gas emissions followed. The DOAS station installed on the W flank recorded sulfur dioxide values that reached 400 t/d on 27 May; subsequent measurements showed a decrease to 268 t/d on 28 May and 100 t/d on 29 May.
Geologic Background. The symmetrical cone of San Miguel, one of the most active volcanoes in El Salvador, rises from near sea level to form one of the country's most prominent landmarks. A broad, deep, crater complex that has been frequently modified by eruptions recorded since the early 16th century caps the truncated unvegetated summit, also known locally as Chaparrastique. Flanks eruptions of the basaltic-andesitic volcano have produced many lava flows, including several during the 17th-19th centuries that extended to the N, NE, and SE. The SE-flank flows are the largest and form broad, sparsely vegetated lava fields crossed by highways and a railroad skirting the base of the volcano. Flank vent locations have migrated higher on the edifice during historical time, and the most recent activity has consisted of minor ash eruptions from the summit crater.
Information Contacts: Ministero de Medio Ambiente y Recursos Naturales (MARN), Km. 5½ Carretera a Nueva San Salvador, Avenida las Mercedes, San Salvador, El Salvador (URL: http://www.snet.gob.sv/ver/vulcanologia).
Ebeko
Russia
50.686°N, 156.014°E; summit elev. 1103 m
All times are local (unless otherwise noted)
Continued explosions, ash plumes, and ashfall during October 2022-May 2023
Ebeko, located on the N end of Paramushir Island in the Kuril Islands, consists of three summit craters along a SSW-NNE line at the northern end of a complex of five volcanic cones. Eruptions date back to the late 18th century and have been characterized as small-to-moderate explosions from the summit crater, accompanied by intense fumarolic activity. The current eruption period began in June 2022 and has recently consisted of frequent explosions, ash plumes, and thermal activity (BGVN 47:10). This report covers similar activity during October 2022 through May 2023, based on information from the Kamchatka Volcanic Eruptions Response Team (KVERT) and satellite data.
Activity during October consisted of explosive activity, ash plumes, and occasional thermal anomalies. Visual data by volcanologists from Severo-Kurilsk showed explosions producing ash clouds up to 2.1-3 km altitude which drifted E, N, NE, and SE during 1-8, 10, 16, and 18 October. KVERT issued several Volcano Observatory Notices for Aviation (VONA) on 7, 13-15, and 27 October 2022, stating that explosions generated ash plumes that rose to 2.3-4 km altitude and drifted 5 km E, NE, and SE. Ashfall was reported in Severo-Kurilsk (Paramushir Island, about 7 km E) on 7 and 13 October. Satellite data showed a thermal anomaly over the volcano on 15-16 October. Visual data showed ash plumes rising to 2.5-3.6 km altitude on 22, 25-29, and 31 October and moving NE due to constant explosions.
Similar activity continued during November, with explosions, ash plumes, and ashfall occurring. KVERT issued VONAs on 1-2, 4, 6-7, 9, 13, and 16 November that reported explosions and resulting ash plumes that rose to 1.7-3.6 km altitude and drifted 3-5 km SE, ESE, E, and NE. On 1 November ash plumes extended as far as 110 km SE. On 5, 8, 12, and 24-25 November explosions and ash plumes rose to 2-3.1 km altitude and drifted N and E. Ashfall was observed in Severo-Kurilsk on 7 and 16 November. A thermal anomaly was visible during 1-4, 16, and 20 November. Explosions during 26 November rose as high as 2.7 km altitude and drifted NE (figure 45).
Explosions and ash plumes continued to occur in December. During 1-2 and 4 December volcanologists from Severo-Kurilsk observed explosions that sent ash to 1.9-2.5 km altitude and drifted NE and SE (figure 46). VONAs were issued on 5, 9, and 16 December reporting that explosions generated ash plumes rising to 1.9 km, 2.6 km, and 2.4 km altitude and drifted 5 km SE, E, and NE, respectively. A thermal anomaly was visible in satellite imagery on 16 December. On 18 and 27-28 December explosions produced ash plumes that rose to 2.5 km altitude and drifted NE and SE. On 31 December an ash plume rose to 2 km altitude and drifted NE.
Explosions continued during January 2023, based on visual observations by volcanologists from Severo-Kurilsk. During 1-7 January explosions generated ash plumes that rose to 4 km altitude and drifted NE, E, W, and SE. According to VONAs issued by KVERT on 2, 4, 10, and 23 January, explosions produced ash plumes that rose to 2-4 km altitude and drifted 5 km N, NE, E, and ENE; the ash plume that rose to 4 km altitude occurred on 10 January (figure 47). Satellite data showed a thermal anomaly during 3-4, 10, 13, 16, 21, 22, and 31 January. KVERT reported that an ash cloud on 4 January moved 12 km NE. On 6 and 9-11 January explosions sent ash plumes to 4.5 km altitude and drifted W and ESE. On 13 January an ash plume rose to 3 km altitude and drifted SE. During 20-24 January ash plumes from explosions rose to 3.7 km altitude and drifted SE, N, and NE. On 21 January the ash plume drifted as far as 40 km NE. During 28-29 and 31 January and 1 February ash plumes rose to 4 km altitude and drifted NE.
During February, explosions, ash plumes, and ashfall were reported. During 1, 4-5 and 7-8 February explosions generated ash plumes that rose to 4.5 km altitude and drifted E and NE; ashfall was observed on 5 and 8 February. On 6 February an explosion produced an ash plume that rose to 3 km altitude and drifted 7 km E, causing ashfall in Severo-Kurilsk. A thermal anomaly was visible in satellite data on 8, 9, 13, and 21 February. Explosions on 9 and 12-13 February produced ash plumes that rose to 4 km altitude and drifted E and NE; the ash cloud on 12 February extended as far as 45 km E. On 22 February explosions sent ash to 3 km altitude that drifted E. During 24 and 26-27 February ash plumes rose to 4 km altitude and drifted E. On 28 February an explosion sent ash to 2.5-3 km altitude and drifted 5 km E; ashfall was observed in Severo-Kurilsk.
Activity continued during March; visual observations showed that explosions generated ash plumes that rose to 3.6 km altitude on 3, 5-7, and 9-12 March and drifted E, NE, and NW. Thermal anomalies were visible on 10, 13, and 29-30 March in satellite imagery. On 18, 21-23, 26, and 29-30 March explosions produced ash plumes that rose to 2.8 km altitude and drifted NE and E; the ash plumes during 22-23 March extended up to 76 km E. A VONA issued on 21 March reported an explosion that produced an ash plume that rose to 2.8 km altitude and drifted 5 km E. Another VONA issued on 23 March reported that satellite data showed an ash plume rising to 3 km altitude and drifted 14 km E.
Explosions during April continued to generate ash plumes. On 1 and 4 April an ash plume rose to 2.8-3.5 km altitude and drifted SE and NE. A thermal anomaly was visible in satellite imagery during 1-6 April. Satellite data showed ash plumes and clouds rising to 2-3 km altitude and drifting up to 12 km SW and E on 3 and 6 April (figure 48). KVERT issued VONAs on 3, 5, 14, 16 April describing explosions that produced ash plumes rising to 3 km, 3.5 km, 3.5 km, and 3 km altitude and drifting 5 km S, 5 km NE and SE, 72 km NNE, and 5 km NE, respectively. According to satellite data, the resulting ash cloud from the explosion on 14 April was 25 x 7 km in size and drifted 72-104 km NNE during 14-15 April. According to visual data by volcanologists from Severo-Kurilsk explosions sent ash up to 3.5 km altitude that drifted NE and E during 15-16, 22, 25-26, and 29 April.
The explosive eruption continued during May. Explosions during 3-4, 6-7, and 9-10 May generated ash plumes that rose to 4 km altitude and drifted SW and E. Satellite data showed a thermal anomaly on 3, 9, 13-14, and 24 May. During 12-16, 23-25, and 27-28 May ash plumes rose to 3.5 km altitude and drifted in different directions due to explosions. Two VONA notices were issued on 16 and 25 May, describing explosions that generated ash plumes rising to 3 km and 3.5 km altitude, respectively and extending 5 km E. The ash cloud on 25 May drifted 75 km SE.
Thermal activity in the summit crater, occasionally accompanied by ash plumes and ash deposits on the SE and E flanks due to frequent explosions, were visible in infrared and true color satellite images (figure 49).
Geologic Background. The flat-topped summit of the central cone of Ebeko volcano, one of the most active in the Kuril Islands, occupies the northern end of Paramushir Island. Three summit craters located along a SSW-NNE line form Ebeko volcano proper, at the northern end of a complex of five volcanic cones. Blocky lava flows extend west from Ebeko and SE from the neighboring Nezametnyi cone. The eastern part of the southern crater contains strong solfataras and a large boiling spring. The central crater is filled by a lake about 20 m deep whose shores are lined with steaming solfataras; the northern crater lies across a narrow, low barrier from the central crater and contains a small, cold crescentic lake. Historical activity, recorded since the late-18th century, has been restricted to small-to-moderate explosive eruptions from the summit craters. Intense fumarolic activity occurs in the summit craters, on the outer flanks of the cone, and in lateral explosion craters.
Information Contacts: Kamchatka Volcanic Eruptions Response Team (KVERT), Far Eastern Branch, Russian Academy of Sciences, 9 Piip Blvd., Petropavlovsk-Kamchatsky, 683006, Russia (URL: http://www.kscnet.ru/ivs/kvert/); MIROVA (Middle InfraRed Observation of Volcanic Activity), a collaborative project between the Universities of Turin and Florence (Italy) supported by the Centre for Volcanic Risk of the Italian Civil Protection Department (URL: http://www.mirovaweb.it/); Copernicus Browser, Copernicus Data Space Ecosystem, European Space Agency (URL: https://dataspace.copernicus.eu/browser/).
Home Reef
Tonga
18.992°S, 174.775°W; summit elev. -10 m
All times are local (unless otherwise noted)
Discolored plumes continued during November 2022-April 2023
Home Reef is a submarine volcano located in the central Tonga islands between Lateiki (Metis Shoal) and Late Island. The first recorded eruption occurred in the mid-19th century, when an ephemeral island formed. An eruption in 1984 produced a 12-km-high eruption plume, a large volume of floating pumice, and an ephemeral island 500 x 1,500 m wide, with cliffs 30-50 m high that enclosed a water-filled crater. Another island-forming eruption in 2006 produced widespread pumice rafts that drifted as far as Australia; by 2008 the island had eroded below sea level. The previous eruption occurred during October 2022 and was characterized by a new island-forming eruption, lava effusion, ash plumes, discolored water, and gas-and-steam plumes (BGVN 47:11). This report covers discolored water plumes during November 2022 through April 2023 using satellite data.
Discolored plumes continued during the reporting period and were observed in true color satellite images on clear weather days. Satellite images show light green-yellow discolored water extending W on 8 and 28 November 2022 (figure 31), and SW on 18 November. Light green-yellow plumes extended W on 3 December, S on 13 December, SW on 18 December, and W and S on 23 December (figure 31). On 12 January 2023 discolored green-yellow plumes extended to the NE, E, SE, and N. The plume moved SE on 17 January and NW on 22 January. Faint discolored water in February was visible moving NE on 1 February. A discolored plume extended NW on 8 and 28 March and NW on 13 March (figure 31). During April, clear weather showed green-blue discolored plumes moving S on 2 April, W on 7 April, and NE and S on 12 April. A strong green-yellow discolored plume extended E and NE on 22 April for several kilometers (figure 31).
Geologic Background. Home Reef, a submarine volcano midway between Metis Shoal and Late Island in the central Tonga islands, was first reported active in the mid-19th century, when an ephemeral island formed. An eruption in 1984 produced a 12-km-high eruption plume, large amounts of floating pumice, and an ephemeral 500 x 1,500 m island, with cliffs 30-50 m high that enclosed a water-filled crater. In 2006 an island-forming eruption produced widespread dacitic pumice rafts that drifted as far as Australia. Another island was built during a September-October 2022 eruption.
Information Contacts: Copernicus Browser, Copernicus Data Space Ecosystem, European Space Agency (URL: https://dataspace.copernicus.eu/browser/).
Semisopochnoi (United States) — June 2023 Cite this Report
Semisopochnoi
United States
51.93°N, 179.58°E; summit elev. 1221 m
All times are local (unless otherwise noted)
Occasional explosions, ash deposits, and gas-and-steam plumes during December 2022-May 2023
Semisopochnoi is located in the western Aleutians, is 20-km-wide at sea level, and contains an 8-km-wide caldera. The three-peaked Mount Young (formerly Cerberus) was constructed within the caldera during the Holocene. Each of these peaks contains a summit crater; the lava flows on the N flank appear younger than those on the S side. The current eruption period began in early February 2021 and has more recently consisted of intermittent explosions and ash emissions (BGVN 47:12). This report updates activity during December 2022 through May 2023 using daily, weekly, and special reports from the Alaska Volcano Observatory (AVO). AVO monitors the volcano using local seismic and infrasound sensors, satellite data, web cameras, and remote infrasound and lightning networks.
Activity during most of December 2022 was relatively quiet; according to AVO no eruptive or explosive activity was observed since 7 November 2022. Intermittent tremor and occasional small earthquakes were observed in geophysical data. Continuous gas-and-steam emissions were observed from the N crater of Mount Young in webcam images on clear weather days (figure 25). On 24 December, there was a slight increase in earthquake activity and several small possible explosion signals were detected in infrasound data. Eruptive activity resumed on 27 December at the N crater of Mount Young; AVO issued a Volcano Activity Notice (VAN) that reported minor ash deposits on the flanks of Mount Young that extended as far as 1 km from the vent, according to webcam images taken during 27-28 December (figure 26). No ash plumes were observed in webcam or satellite imagery, but a persistent gas-and-steam plume that might have contained some ash rose to 1.5 km altitude. As a result, AVO raised the Aviation Color Code (ACC) to Orange (the second highest level on a four-color scale) and the Volcano Alert Level (VAL) to Watch (the second highest level on a four-level scale). Possible explosions were detected during 21 December 2022 through 1 January 2023 and seismic tremor was recorded during 30-31 December.
During January 2023 eruptive activity continued at the active N crater of Mount Young. Minor ash deposits were observed on the flanks, extending about 2 km SSW, based on webcam images from 1 and 3 January. A possible explosion occurred during 1-2 January based on elevated seismicity recorded on local seismometers and an infrasound signal recorded minutes later by an array at Adak. Though no ash plumes were observed in webcam or satellite imagery, a persistent gas-and-steam plume rose to 1.5 km altitude that might have carried minor traces of ash. Ash deposits were accompanied by periods of elevated seismicity and infrasound signals from the local geophysical network, which AVO reported were likely due to weak explosive activity. Low-level explosive activity was also detected during 2-3 January, with minor gas-and-steam emissions and a new ash deposit that was visible in webcam images. Low-level explosive activity was detected in geophysical data during 4-5 January, with elevated seismicity and infrasound signals observed on local stations. Volcanic tremor was detected during 7-9 January and very weak explosive activity was detected in seismic and infrasound data on 9 January. Weak seismic and infrasound signals were recorded on 17 January, which indicated minor explosive activity, but no ash emissions were observed in clear webcam images; a gas-and-steam plume continued to rise to 1.5 km altitude. During 29-30 January, ash deposits near the summit were observed on fresh snow, according to webcam images.
The active N cone at Mount Young continued to produce a gas-and-steam plume during February, but no ash emissions or explosive events were detected. Seismicity remained elevated with faint tremor during early February. Gas-and-steam emissions from the N crater were observed in clear webcam images on 11-13 and 16 February; no explosive activity was detected in seismic, infrasound, or satellite data. Seismicity has also decreased, with no significant seismic tremor observed since 25 January. Therefore, the ACC was lowered to Yellow (the second lowest level on a four-color scale) and the VAL was lowered to Advisory (the second lowest level on a four-color scale) on 22 February.
Gas-and-steam emissions persisted during March from the N cone of Mount Young, based on clear webcam images. A few brief episodes of weak tremor were detected in seismic data, although seismicity decreased over the month. A gas-and-steam plume detected in satellite data extended 150 km on 18 March. Low-level ash emissions from the N cone at Mount Young were observed in several webcam images during 18-19 March, in addition to small explosions and volcanic tremor. The ACC was raised to Orange and the VAL increased to Watch on 19 March. A small explosion was detected in seismic and infrasound data on 21 March.
Low-level unrest continued during April, although cloudy weather often obscured views of the summit; periods of seismic tremor and local earthquakes were recorded. During 3-4 April a gas-and-steam plume was visible traveling more than 200 km overnight; no ash was evident in the plume, according to AVO. A gas-and-steam plume was observed during 4-6 April that extended 400 km but did not seem to contain ash. Small explosions were detected in seismic and infrasound data on 5 April. Occasional clear webcam images showed continuing gas-and-steam emissions rose from Mount Young, but no ash deposits were observed on the snow. On 19 April small explosions and tremor were detected in seismic and infrasound data. A period of seismic tremor was detected during 22-25 April, with possible weak explosions on 25 April. Ash deposits were visible near the crater rim, but it was unclear if these deposits were recent or due to older deposits.
Occasional small earthquakes were recorded during May, but there were no signs of explosive activity seen in geophysical data. Gas-and-steam emissions continued from the N crater of Mount Young, based on webcam images, and seismicity remained slightly elevated. A new, light ash deposit was visible during the morning of 5 May on fresh snow on the NW flank of Mount Young. During 10 May periods of volcanic tremor were observed. The ACC was lowered to Yellow and the VAL to Advisory on 17 May due to no additional evidence of activity.
Geologic Background. Semisopochnoi, the largest subaerial volcano of the western Aleutians, is 20 km wide at sea level and contains an 8-km-wide caldera. It formed as a result of collapse of a low-angle, dominantly basaltic volcano following the eruption of a large volume of dacitic pumice. The high point of the island is Anvil Peak, a double-peaked late-Pleistocene cone that forms much of the island's northern part. The three-peaked Mount Cerberus (renamed Mount Young in 2023) was constructed within the caldera during the Holocene. Each of the peaks contains a summit crater; lava flows on the N flank appear younger than those on the south side. Other post-caldera volcanoes include the symmetrical Sugarloaf Peak SSE of the caldera and Lakeshore Cone, a small cinder cone at the edge of Fenner Lake in the NE part of the caldera. Most documented eruptions have originated from Young, although Coats (1950) considered that both Sugarloaf and Lakeshore Cone could have been recently active.
Information Contacts: Alaska Volcano Observatory (AVO), a cooperative program of a) U.S. Geological Survey, 4200 University Drive, Anchorage, AK 99508-4667 USA (URL: https://avo.alaska.edu/), b) Geophysical Institute, University of Alaska, PO Box 757320, Fairbanks, AK 99775-7320, USA, and c) Alaska Division of Geological & Geophysical Surveys, 794 University Ave., Suite 200, Fairbanks, AK 99709, USA (URL: http://dggs.alaska.gov/).
Ambae
Vanuatu
15.389°S, 167.835°E; summit elev. 1496 m
All times are local (unless otherwise noted)
New lava flow, ash plumes, and sulfur dioxide plumes during February-May 2023
Ambae, also known as Aoba, is a large basaltic shield volcano in Vanuatu. A broad pyroclastic cone containing three crater lakes (Manaro Ngoru, Voui, and Manaro Lakua) is located at the summit within the youngest of at least two nested calderas. Periodic phreatic and pyroclastic explosions have been reported since the 16th century. A large eruption more than 400 years ago resulted in a volcanic cone within the summit crater that is now filled by Lake Voui; the similarly sized Lake Manaro fills the western third of the caldera. The previous eruption ended in August 2022 that was characterized by gas-and-steam and ash emissions and explosions of wet tephra (BGVN 47:10). This report covers a new eruption during February through May 2023 that consisted of a new lava flow, ash plumes, and sulfur dioxide emissions, using information from the Vanuatu Meteorology and Geo-Hazards Department (VMGD) and satellite data.
During the reporting period, the Alert Level remained at a 2 (on a scale of 0-5), which has been in place since December 2021. Activity during October 2022 through March 2023 remained relatively low and mostly consisted of gas-and-steam emissions in Lake Voui. VMGD reported that at 1300 on 15 November a satellite image captured a strong amount of sulfur dioxide rising above the volcano (figure 99), and that seismicity slightly increased. The southern and northern part of the island reported a strong sulfur dioxide smell and heard explosions. On 20 February 2023 a gas-and-ash plume rose 1.3 km above the summit and drifted SSW, according to a webcam image (figure 100). Gas-and-steam and possibly ash emissions continued on 23 February and volcanic earthquakes were recorded by the seismic network.
During April, volcanic earthquakes and gas-and-steam and ash emissions were reported from the cone in Lake Voui. VMGD reported that activity increased during 5-7 April; high gas-and-steam and ash plumes were visible, accompanied by nighttime incandescence. According to a Wellington VAAC report, a low-level ash plume rose as high as 2.5 km above the summit and drifted W and SW on 5 April, based on satellite imagery. Reports in Saratamata stated that a dark ash plume drifted to the WSW, but no loud explosion was heard. Webcam images from 2100 showed incandescence above the crater and reflected in the clouds. According to an aerial survey, field observations, and satellite data, water was no longer present in the lake. A lava flow was reported effusing from the vent and traveling N into the dry Lake Voui, which lasted three days. The next morning at 0745 on 6 April a gas-and-steam and ash plume rose 5.4 km above the summit and drifted ESE, based on information from VMGD (figure 101). The Wellington VAAC also reported that light ashfall was observed on the island. Intermittent gas-and-steam and ash emissions were visible on 7 April, some of which rose to an estimated 3 km above the summit and drifted E. Webcam images during 0107-0730 on 7 April showed continuing ash emissions. A gas-and-steam and ash plume rose 695 m above the summit crater at 0730 on 19 April and drifted ESE, based on a webcam image (figure 102).
According to visual and infrared satellite data, water was visible in Lake Voui as late as 24 March 2023 (figure 103). The vent in the caldera showed a gas-and-steam plume drifted SE. On 3 April thermal activity was first detected, accompanied by a gas-and-ash plume that drifted W (figure 103). The lava flow moved N within the dry lake and was shown cooling by 8 April. By 23 April much of the water in the lake had returned. Occasional sulfur dioxide plumes were detected by the TROPOMI instrument on the Sentinel-5P satellite that exceeded 2 Dobson Units (DU) and drifted in different directions (figure 104).
Geologic Background. The island of Ambae, also known as Aoba, is a massive 2,500 km3 basaltic shield that is the most voluminous volcano of the New Hebrides archipelago. A pronounced NE-SW-trending rift zone with numerous scoria cones gives the 16 x 38 km island an elongated form. A broad pyroclastic cone containing three crater lakes (Manaro Ngoru, Voui, and Manaro Lakua) is located at the summit within the youngest of at least two nested calderas, the largest of which is 6 km in diameter. That large central edifice is also called Manaro Voui or Lombenben volcano. Post-caldera explosive eruptions formed the summit craters about 360 years ago. A tuff cone was constructed within Lake Voui (or Vui) about 60 years later. The latest known flank eruption, about 300 years ago, destroyed the population of the Nduindui area near the western coast.
Information Contacts: Geo-Hazards Division, Vanuatu Meteorology and Geo-Hazards Department (VMGD), Ministry of Climate Change Adaptation, Meteorology, Geo-Hazards, Energy, Environment and Disaster Management, Private Mail Bag 9054, Lini Highway, Port Vila, Vanuatu (URL: http://www.vmgd.gov.vu/, https://www.facebook.com/VanuatuGeohazardsObservatory/); Wellington Volcanic Ash Advisory Centre (VAAC), Meteorological Service of New Zealand Ltd (MetService), PO Box 722, Wellington, New Zealand (URL: http://www.metservice.com/vaac/, http://www.ssd.noaa.gov/VAAC/OTH/NZ/messages.html); MIROVA (Middle InfraRed Observation of Volcanic Activity), a collaborative project between the Universities of Turin and Florence (Italy) supported by the Centre for Volcanic Risk of the Italian Civil Protection Department (URL: http://www.mirovaweb.it/); Global Sulfur Dioxide Monitoring Page, Atmospheric Chemistry and Dynamics Laboratory, NASA Goddard Space Flight Center (NASA/GSFC), 8800 Greenbelt Road, Goddard, Maryland, USA (URL: https://so2.gsfc.nasa.gov/); Copernicus Browser, Copernicus Data Space Ecosystem, European Space Agency (URL: https://dataspace.copernicus.eu/browser/).
Ibu
Indonesia
1.488°N, 127.63°E; summit elev. 1325 m
All times are local (unless otherwise noted)
Daily ash explosions continue, along with thermal anomalies in the crater, October 2022-May 2023
Persistent eruptive activity since April 2008 at Ibu, a stratovolcano on Indonesian’s Halmahera Island, has consisted of daily explosive ash emissions and plumes, along with observations of thermal anomalies (BGVN 47:04). The current eruption continued during October 2022-May 2023, described below, based on advisories issued by the Pusat Vulkanologi dan Mitigasi Bencana Geologi (PVMBG, also known as Indonesian Center for Volcanology and Geological Hazard Mitigation, CVGHM), daily reports by MAGMA Indonesia (a PVMBG platform), and the Darwin Volcanic Ash Advisory Centre (VAAC), and various satellite data. The Alert Level during the reporting period remained at 2 (on a scale of 1-4), except raised briefly to 3 on 27 May, and the public was warned to stay at least 2 km away from the active crater and 3.5 km away on the N side of the volcano.
According to MAGMA Indonesia, during October 2022-May 2023, daily gray-and-white ash plumes of variable densities rose 200-1,000 m above the summit and drifted in multiple directions. On 30 October and 11 November, plumes rose a maximum of 2 km and 1.5 km above the summit, respectively (figures 42 and 43). According to the Darwin VAAC, discrete ash emissions on 13 November rose to 2.1 km altitude, or 800 m above the summit, and drifted W, and multiple ash emissions on 15 November rose 1.4 km above the summit and drifted NE. Occasional larger ash explosions through May 2023 prompted PVMBG to issue Volcano Observatory Notice for Aviation (VONA) alerts (table 6); the Aviation Color Code remained at Orange throughout this period.
Table 6. Volcano Observatory Notice for Aviation (VONA) ash plume alerts for Ibu issued by PVMBG during October 2022-May 2023. Maximum height above the summit was estimated by a ground observer. VONAs in January-May 2023 all described the ash plumes as dense.
| Date |
Time (local) |
Max height above summit |
Direction |
| 17 Oct 2022 |
0858 |
800 m |
SW |
| 18 Oct 2022 |
1425 |
800 m |
S |
| 19 Oct 2022 |
2017 |
600 m |
SW |
| 21 Oct 2022 |
0916 |
800 m |
NW |
| 16 Jan 2023 |
1959 |
600 m |
NE |
| 22 Jan 2023 |
0942 |
1,000 m |
E |
| 29 Jan 2023 |
2138 |
1,000 m |
E |
| 10 May 2023 |
0940 |
800 m |
NW |
| 10 May 2023 |
2035 |
600 m |
E |
| 21 May 2023 |
2021 |
600 m |
W |
| 21 May 2023 |
2140 |
1,000 m |
W |
| 29 May 2023 |
1342 |
800 m |
N |
| 31 May 2023 |
1011 |
1,000 m |
SW |
Sentinel-2 L1C satellite images throughout the reporting period show two, sometimes three persistent thermal anomalies in the summit crater, with the most prominent hotspot from the top of a cone within the crater. Clear views were more common during March-April 2023, when a vent and lava flows on the NE flank of the intra-crater cone could be distinguished (figure 44). White-to-grayish emissions were also observed during brief periods when weather clouds allowed clear views.
The MIROVA space-based volcano hotspot detection system recorded almost daily thermal anomalies throughout the reporting period, though cloud cover often interfered with detections. Data from imaging spectroradiometers aboard NASA’s Aqua and Terra satellites and processed using the MODVOLC algorithm (MODIS-MODVOLC) recorded hotspots on one day during October 2022 and December 2022, two days in April 2023, three days in November 2022 and May 2023, and four days in March 2023.
Geologic Background. The truncated summit of Gunung Ibu stratovolcano along the NW coast of Halmahera Island has large nested summit craters. The inner crater, 1 km wide and 400 m deep, has contained several small crater lakes. The 1.2-km-wide outer crater is breached on the N, creating a steep-walled valley. A large cone grew ENE of the summit, and a smaller one to the WSW has fed a lava flow down the W flank. A group of maars is located below the N and W flanks. The first observed and recorded eruption was a small explosion from the summit crater in 1911. Eruptive activity began again in December 1998, producing a lava dome that eventually covered much of the floor of the inner summit crater along with ongoing explosive ash emissions.
Information Contacts: Pusat Vulkanologi dan Mitigasi Bencana Geologi (PVMBG, also known as Indonesian Center for Volcanology and Geological Hazard Mitigation, CVGHM), Jalan Diponegoro 57, Bandung 40122, Indonesia (URL: http://www.vsi.esdm.go.id/); MAGMA Indonesia (Multiplatform Application for Geohazard Mitigation and Assessment in Indonesia), Kementerian Energi dan Sumber Daya Mineral (URL: https://magma.esdm.go.id/v1); Copernicus Browser, Copernicus Data Space Ecosystem, European Space Agency (URL: https://dataspace.copernicus.eu/browser/); MIROVA (Middle InfraRed Observation of Volcanic Activity), a collaborative project between the Universities of Turin and Florence (Italy) supported by the Centre for Volcanic Risk of the Italian Civil Protection Department (URL: http://www.mirovaweb.it/); Hawai'i Institute of Geophysics and Planetology (HIGP) - MODVOLC Thermal Alerts System, School of Ocean and Earth Science and Technology (SOEST), Univ. of Hawai'i, 2525 Correa Road, Honolulu, HI 96822, USA (URL: http://modis.higp.hawaii.edu/).
Dukono
Indonesia
1.6992°N, 127.8783°E; summit elev. 1273 m
All times are local (unless otherwise noted)
Continuing ash emissions, SO2 plumes, and thermal signals during October 2022-May 2023
Dukono, a remote volcano on Indonesia’s Halmahera Island, has been erupting continuously since 1933, with frequent ash explosions and sulfur dioxide plumes (BGVN 46:11, 47:10). This activity continued during October 2022 through May 2023, based on reports from the Pusat Vulkanologi dan Mitigasi Bencana Geologi (PVMBG; also known as Indonesian Center for Volcanology and Geological Hazard Mitigation, CVGHM), the Darwin Volcanic Ash Advisory Centre (VAAC), and satellite data. During this period, the Alert Level remained at 2 (on a scale of 1-4) and the public was warned to remain outside of the 2-km exclusion zone. The highest reported plume of the period reached 9.4 km above the summit on 14 November 2022.
According to MAGMA Indonesia (a platform developed by PVMBG), white, gray, or dark plumes of variable densities were observed almost every day during the reporting period, except when fog obscured the volcano (figure 33). Plumes generally rose 25-450 m above the summit, but rose as high as 700-800 m on several days, somewhat lower than the maximum heights reached earlier in 2022 when plumes reached as high as 1 km. However, the Darwin VAAC reported that on 14 November 2022, a discrete ash plume rose 9.4 km above the summit (10.7 km altitude), accompanied by a strong hotspot and a sulfur dioxide signal observed in satellite imagery; a continuous ash plume that day and through the 15th rose to 2.1-2.4 km altitude and drifted NE.
Sentinel-2 images were obscured by weather clouds almost every viewing day during the reporting period. However, the few reasonably clear images showed a hotspot and white or gray emissions and plumes. Strong SO2 plumes from Dukono were present on many days during October 2022-May 2023, as detected using the TROPOMI instrument on the Sentinel-5P satellite (figure 34).
Geologic Background. Reports from this remote volcano in northernmost Halmahera are rare, but Dukono has been one of Indonesia's most active volcanoes. More-or-less continuous explosive eruptions, sometimes accompanied by lava flows, have occurred since 1933. During a major eruption in 1550 CE, a lava flow filled in the strait between Halmahera and the N-flank Gunung Mamuya cone. This complex volcano presents a broad, low profile with multiple summit peaks and overlapping craters. Malupang Wariang, 1 km SW of the summit crater complex, contains a 700 x 570 m crater that has also been active during historical time.
Information Contacts: Pusat Vulkanologi dan Mitigasi Bencana Geologi (PVMBG, also known as Indonesian Center for Volcanology and Geological Hazard Mitigation, CVGHM), Jalan Diponegoro 57, Bandung 40122, Indonesia (URL: http://www.vsi.esdm.go.id/); MAGMA Indonesia (Multiplatform Application for Geohazard Mitigation and Assessment in Indonesia), Kementerian Energi dan Sumber Daya Mineral (URL: https://magma.esdm.go.id/v1); Darwin Volcanic Ash Advisory Centre (VAAC), Bureau of Meteorology, Northern Territory Regional Office, PO Box 40050, Casuarina, NT 0811, Australia (URL: http://www.bom.gov.au/info/vaac/); NASA Global Sulfur Dioxide Monitoring Page, Atmospheric Chemistry and Dynamics Laboratory, NASA Goddard Space Flight Center (NASA/GSFC), 8800 Greenbelt Road, Goddard, Maryland, USA (URL: https://so2.gsfc.nasa.gov/); Sentinel Hub Playground (URL: https://www.sentinel-hub.com/explore/sentinel-playground).
Sabancaya
Peru
15.787°S, 71.857°W; summit elev. 5960 m
All times are local (unless otherwise noted)
Explosions, gas-and-ash plumes, and thermal activity persist during November 2022-April 2023
Sabancaya is located in Peru, NE of Ampato and SE of Hualca Hualca. Eruptions date back to 1750 and have been characterized by explosions, phreatic activity, ash plumes, and ashfall. The current eruption period began in November 2016 and has more recently consisted of daily explosions, gas-and-ash plumes, and thermal activity (BGVN 47:11). This report updates activity during November 2022 through April 2023 using information from Instituto Geophysico del Peru (IGP) that use weekly activity reports and various satellite data.
Intermittent low-to-moderate power thermal anomalies were reported by the MIROVA project during November 2022 through April 2023 (figure 119). There were few short gaps in thermal activity during mid-December 2022, late December-to-early January 2023, late January to mid-February, and late February. According to data recorded by the MODVOLC thermal algorithm, there were a total of eight thermal hotspots: three in November 2022, three in February 2023, one in March, and one in April. On clear weather days, some of this thermal anomaly was visible in infrared satellite imagery showing the active lava dome in the summit crater (figure 120). Almost daily moderate-to-strong sulfur dioxide plumes were recorded during the reporting period by the TROPOMI instrument on the Sentinel-5P satellite (figure 121). Many of these plumes exceeded 2 Dobson Units (DU) and drifted in multiple directions.
IGP reported that moderate activity during November and December 2022 continued; during November, an average number of explosions were reported each week: 30, 33, 36, and 35, and during December, it was 32, 40, 47, 52, and 67. Gas-and-ash plumes in November rose 3-3.5 km above the summit and drifted E, NE, SE, S, N, W, and SW. During December the gas-and-ash plumes rose 2-4 km above the summit and drifted in different directions. There were 1,259 volcanic earthquakes recorded during November and 1,693 during December. Seismicity also included volcano-tectonic-type events that indicate rock fracturing events. Slight inflation was observed in the N part of the volcano near Hualca Hualca (4 km N). Thermal activity was frequently reported in the crater at the active lava dome (figure 120).
Explosive activity continued during January and February 2023. The average number of explosions were reported each week during January (51, 50, 60, and 59) and February (43, 54, 51, and 50). Gas-and-ash plumes rose 1.6-2.9 km above the summit and drifted NW, SW, and W during January and rose 1.4-2.8 above the summit and drifted W, SW, E, SE, N, S, NW, and NE during February. IGP also detected 1,881 volcanic earthquakes during January and 1,661 during February. VT-type earthquakes were also reported. Minor inflation persisted near Hualca Hualca. Satellite imagery showed continuous thermal activity in the crater at the lava dome (figure 120).
During March, the average number of explosions each week was 46, 48, 31, 35, and 22 and during April, it was 29, 41, 31, and 27. Accompanying gas-and-ash plumes rose 1.7-2.6 km above the summit crater and drifted W, SW, NW, S, and SE during March. According to a Buenos Aires Volcano Ash Advisory Center (VAAC) notice, on 22 March at 1800 through 23 March an ash plume rose to 7 km altitude and drifted NW. By 0430 an ash plume rose to 7.6 km altitude and drifted W. On 24 and 26 March continuous ash emissions rose to 7.3 km altitude and drifted SW and on 28 March ash emissions rose to 7.6 km altitude. During April, gas-and-ash plumes rose 1.6-2.5 km above the summit and drifted W, SW, S, NW, NE, and E. Frequent volcanic earthquakes were recorded, with 1,828 in March and 1,077 in April, in addition to VT-type events. Thermal activity continued to be reported in the summit crater at the lava dome (figure 120).
Geologic Background. Sabancaya, located in the saddle NE of Ampato and SE of Hualca Hualca volcanoes, is the youngest of these volcanic centers and the only one to have erupted in historical time. The oldest of the three, Nevado Hualca Hualca, is of probable late-Pliocene to early Pleistocene age. The name Sabancaya (meaning "tongue of fire" in the Quechua language) first appeared in records in 1595 CE, suggesting activity prior to that date. Holocene activity has consisted of Plinian eruptions followed by emission of voluminous andesitic and dacitic lava flows, which form an extensive apron around the volcano on all sides but the south. Records of historical eruptions date back to 1750.
Information Contacts: Instituto Geofisico del Peru (IGP), Centro Vulcanológico Nacional (CENVUL), Calle Badajoz N° 169 Urb. Mayorazgo IV Etapa, Ate, Lima 15012, Perú (URL: https://www.igp.gob.pe/servicios/centro-vulcanologico-nacional/inicio); Buenos Aires Volcanic Ash Advisory Center (VAAC), Servicio Meteorológico Nacional-Fuerza Aérea Argentina, 25 de mayo 658, Buenos Aires, Argentina (URL: http://www.smn.gov.ar/vaac/buenosaires/inicio.php); MIROVA (Middle InfraRed Observation of Volcanic Activity), a collaborative project between the Universities of Turin and Florence (Italy) supported by the Centre for Volcanic Risk of the Italian Civil Protection Department (URL: http://www.mirovaweb.it/); Hawai'i Institute of Geophysics and Planetology (HIGP) - MODVOLC Thermal Alerts System, School of Ocean and Earth Science and Technology (SOEST), Univ. of Hawai'i, 2525 Correa Road, Honolulu, HI 96822, USA (URL: http://modis.higp.hawaii.edu/); NASA Global Sulfur Dioxide Monitoring Page, Atmospheric Chemistry and Dynamics Laboratory, NASA Goddard Space Flight Center (NASA/GSFC), 8800 Greenbelt Road, Goddard MD 20771, USA (URL: https://so2.gsfc.nasa.gov/); Copernicus Browser, Copernicus Data Space Ecosystem, European Space Agency (URL: https://dataspace.copernicus.eu/browser/).
Sheveluch
Russia
56.653°N, 161.36°E; summit elev. 3283 m
All times are local (unless otherwise noted)
Significant explosions destroyed part of the lava-dome complex during April 2023
Sheveluch (also spelled Shiveluch) in Kamchatka, has had at least 60 large eruptions during the last 10,000 years. The summit is truncated by a broad 9-km-wide caldera that is breached to the S, and many lava domes occur on the outer flanks. The lava dome complex was constructed within the large open caldera. Frequent collapses of the dome complex have produced debris avalanches; the resulting deposits cover much of the caldera floor. A major south-flank collapse during a 1964 Plinian explosion produced a scarp in which a “Young Sheveluch” dome began to form in 1980. Repeated episodes of dome formation and destruction since then have produced major and minor ash plumes, pyroclastic flows, block-and-ash flows, and “whaleback domes” of spine-like extrusions in 1993 and 2020 (BGVN 45:11). The current eruption period began in August 1999 and has more recently consisted of lava dome growth, explosions, ash plumes, and avalanches (BGVN 48:01). This report covers a significant explosive eruption during early-to-mid-April 2023 that generated a 20 km altitude ash plume, produced a strong sulfur dioxide plume, and destroyed part of the lava-dome complex; activity described during January through April 2023 use information primarily from the Kamchatka Volcanic Eruptions Response Team (KVERT) and various satellite data.
Satellite data. Activity during the majority of this reporting period was characterized by continued lava dome growth, strong fumarole activity, explosions, and hot avalanches. According to the MODVOLC Thermal Alerts System, 140 hotspots were detected through the reporting period, with 33 recorded in January 2023, 29 in February, 44 in March, and 34 in April. Frequent strong thermal activity was recorded during January 2023 through April, according to the MIROVA (Middle InfraRed Observation of Volcanic Activity) graph and resulted from the continuously growing lava dome (figure 94). A slightly stronger pulse in thermal activity was detected in early-to-mid-April, which represented the significant eruption that destroyed part of the lava-dome complex. Thermal anomalies were also visible in infrared satellite imagery at the summit crater (figure 95).
During January 2023 KVERT reported continued growth of the lava dome, accompanied by strong fumarolic activity, incandescence from the lava dome, explosions, ash plumes, and avalanches. Satellite data showed a daily thermal anomaly over the volcano. Video data showed ash plumes associated with collapses at the dome that generated avalanches that in turn produced ash plumes rising to 3.5 km altitude and drifting 40 km W on 4 January and rising to 7-7.5 km altitude and drifting 15 km SW on 5 January. A gas-and-steam plume containing some ash that was associated with avalanches rose to 5-6 km altitude and extended 52-92 km W on 7 January. Explosions that same day produced ash plumes that rose to 7-7.5 km altitude and drifted 10 km W. According to a Volcano Observatory Notice for Aviation (VONA) issued at 1344 on 19 January, explosions produced an ash cloud that was 15 x 25 km in size and rose to 9.6-10 km altitude, drifting 21-25 km W; as a result, the Aviation Color Code (ACC) was raised to Red (the highest level on a four-color scale). Another VONA issued at 1635 reported that no more ash plumes were observed, and the ACC was lowered to Orange (the second highest level on a four-color scale). On 22 January an ash plume from collapses and avalanches rose to 5 km altitude and drifted 25 km NE and SW; ash plumes associated with collapses extended 70 km NE on 27 and 31 January.
Lava dome growth, fumarolic activity, dome incandescence, and occasional explosions and avalanches continued during February and March. A daily thermal anomaly was visible in satellite data. Explosions on 1 February generated ash plumes that rose to 6.3-6.5 km altitude and extended 15 km NE. Video data showed an ash cloud from avalanches rising to 5.5 km altitude and drifting 5 km SE on 2 February. Satellite data showed gas-and-steam plumes containing some ash rose to 5-5.5 km altitude and drifted 68-110 km ENE and NE on 6 February, to 4.5-5 km altitude and drifted 35 km WNW on 22 February, and to 3.7-4 km altitude and drifted 47 km NE on 28 February. Scientists from the Kamchatka Volcanological Station (KVS) went on a field excursion on 25 February to document the growing lava dome, and although it was cloudy most of the day, nighttime incandescence was visible. Satellite data showed an ash plume extending up to 118 km E during 4-5 March. Video data from 1150 showed an ash cloud from avalanches rose to 3.7-5.5 km altitude and drifted 5-10 km ENE and E on 5 March. On 11 March an ash plume drifted 62 km E. On 27 March ash plumes rose to 3.5 km altitude and drifted 100 km E. Avalanches and constant incandescence at the lava dome was focused on the E and NE slopes on 28 March. A gas-and-steam plume containing some ash rose to 3.5 km altitude and moved 40 km E on 29 March. Ash plumes on 30 March rose to 3.5-3.7 km altitude and drifted 70 km NE.
Similar activity continued during April, with lava dome growth, strong fumarolic activity, incandescence in the dome, occasional explosions, and avalanches. A thermal anomaly persisted throughout the month. During 1-4 April weak ash plumes rose to 2.5-3 km altitude and extended 13-65 km SE and E.
Activity during 11 April 2023. The Institute of Volcanology and Seismology, Far Eastern Branch, Russian Academy of Sciences (IVS FEB RAS) reported a significant increase in seismicity around 0054 on 11 April, as reported by strong explosions detected on 11 April beginning at 0110 that sent ash plumes up to 7-10 km altitude and extended 100-435 km W, WNW, NNW, WSW, and SW. According to a Tokyo VAAC report the ash plume rose to 15.8 km altitude. By 0158 the plume extended over a 75 x 100 km area. According to an IVS FEB RAS report, the eruptive column was not vertical: the initial plume at 0120 on 11 April deviated to the NNE, at 0000 on 12 April, it drifted NW, and by 1900 it drifted SW. KVS reported that significant pulses of activity occurred at around 0200, 0320, and then a stronger phase around 0600. Levin Dmitry took a video from near Békés (3 km away) at around 0600 showing a rising plume; he also reported that a pyroclastic flow traveled across the road behind him as he left the area. According to IVS FEB RAS, the pyroclastic flow traveled several kilometers SSE, stopping a few hundred meters from a bridge on the road between Klyuchi and Petropavlovsk-Kamchatsky.
Ashfall was first observed in Klyuchi (45 km SW) at 0630, and a large, black ash plume blocked light by 0700. At 0729 KVERT issued a Volcano Observatory Notice for Aviation (VONA) raising the Aviation Color Code to Red (the highest level on a four-color scale). It also stated that a large ash plume had risen to 10 km altitude and drifted 100 km W. Near-constant lightning strikes were reported in the plume and sounds like thunderclaps were heard until about 1000. According to IVS FEB RAS the cloud was 200 km long and 76 km wide by 0830, and was spreading W at altitudes of 6-12 km. In the Klyuchi Village, the layer of both ash and snow reached 8.5 cm (figure 96); ashfall was also reported in Kozyrevsk (112 km SW) at 0930, Mayskoye, Anavgay, Atlasovo, Lazo, and Esso. Residents in Klyuchi reported continued darkness and ashfall at 1100. In some areas, ashfall was 6 cm deep and some residents reported dirty water coming from their plumbing. According to IVS FEB RAS, an ash cloud at 1150 rose to 5-20 km altitude and was 400 km long and 250 km wide, extending W. A VONA issued at 1155 reported that ash had risen to 10 km and drifted 340 km NNW and 240 km WSW. According to Simon Carn (Michigan Technological University), about 0.2 Tg of sulfur dioxide in the plume was measured in a satellite image from the TROPOMI instrument on the Sentinel-5P satellite acquired at 1343 that covered an area of about 189,000 km2 (figure 97). Satellite data at 1748 showed an ash plume that rose to 8 km altitude and drifted 430 km WSW and S, according to a VONA.
Activity during 12-15 April 2023. On 12 April at 0730 satellite images showed ash plumes rose to 7-8 km altitude and extended 600 km SW, 1,050 km ESE, and 1,300-3,000 km E. By 1710 that day, the explosions weakened. According to news sources, the ash-and-gas plumes drifted E toward the Aleutian Islands and reached the Gulf of Alaska by 13 April, causing flight disruptions. More than 100 flights involving Alaska airspace were cancelled due to the plume. Satellite data showed ash plumes rising to 4-5.5 km altitude and drifted 400-415 km SE and ESE on 13 April. KVS volcanologists observed the pyroclastic flow deposits and noted that steam rose from downed, smoldering trees. They also noted that the deposits were thin with very few large fragments, which differed from previous flows. The ash clouds traveled across the Pacific Ocean. Flight cancellations were also reported in NW Canada (British Columbia) during 13-14 April. During 14-15 April ash plumes rose to 6 km altitude and drifted 700 km NW.
Alaskan flight schedules were mostly back to normal by 15 April, with only minor delays and far less cancellations; a few cancellations continued to be reported in Canada. Clear weather on 15 April showed that most of the previous lava-dome complex was gone and a new crater roughly 1 km in diameter was observed (figure 98); gas-and-steam emissions were rising from this crater. Evidence suggested that there had been a directed blast to the SE, and pyroclastic flows traveled more than 20 km. An ash plume rose to 4.5-5.2 km altitude and drifted 93-870 km NW on 15 April.
Activity during 16-30 April 2023. Resuspended ash was lifted by the wind from the slopes and rose to 4 km altitude and drifted 224 km NW on 17 April. KVERT reported a plume of resuspended ash from the activity during 10-13 April on 19 April that rose to 3.5-4 km altitude and drifted 146-204 km WNW. During 21-22 April a plume stretched over the Scandinavian Peninsula. A gas-and-steam plume containing some ash rose to 3-3.5 km altitude and drifted 60 km SE on 30 April. A possible new lava dome was visible on the W slope of the volcano on 29-30 April (figure 99); satellite data showed two thermal anomalies, a bright one over the existing lava dome and a weaker one over the possible new one.
References. Girina, O., Loupian, E., Horvath, A., Melnikov, D., Manevich, A., Nuzhdaev, A., Bril, A., Ozerov, A., Kramareva, L., Sorokin, A., 2023, Analysis of the development of the paroxysmal eruption of Sheveluch volcano on April 10–13, 2023, based on data from various satellite systems, ??????????? ???????? ??? ?? ???????, 20(2).
Geologic Background. The high, isolated massif of Sheveluch volcano (also spelled Shiveluch) rises above the lowlands NNE of the Kliuchevskaya volcano group. The 1,300 km3 andesitic volcano is one of Kamchatka's largest and most active volcanic structures, with at least 60 large eruptions during the Holocene. The summit of roughly 65,000-year-old Stary Shiveluch is truncated by a broad 9-km-wide late-Pleistocene caldera breached to the south. Many lava domes occur on its outer flanks. The Molodoy Shiveluch lava dome complex was constructed during the Holocene within the large open caldera; Holocene lava dome extrusion also took place on the flanks of Stary Shiveluch. Widespread tephra layers from these eruptions have provided valuable time markers for dating volcanic events in Kamchatka. Frequent collapses of dome complexes, most recently in 1964, have produced debris avalanches whose deposits cover much of the floor of the breached caldera.
Information Contacts: Kamchatka Volcanic Eruptions Response Team (KVERT), Far Eastern Branch, Russian Academy of Sciences, 9 Piip Blvd., Petropavlovsk-Kamchatsky, 683006, Russia (URL: http://www.kscnet.ru/ivs/kvert/); Institute of Volcanology and Seismology, Far Eastern Branch, Russian Academy of Sciences (IVS FEB RAS), 9 Piip Blvd., Petropavlovsk-Kamchatsky 683006, Russia (URL: http://www.kscnet.ru/ivs/eng/); Kamchatka Volcanological Station, Kamchatka Branch of Geophysical Survey, (KB GS RAS), Klyuchi, Kamchatka Krai, Russia (URL: http://volkstat.ru/); Hawai'i Institute of Geophysics and Planetology (HIGP) - MODVOLC Thermal Alerts System, School of Ocean and Earth Science and Technology (SOEST), Univ. of Hawai'i, 2525 Correa Road, Honolulu, HI 96822, USA (URL: http://modis.higp.hawaii.edu/); MIROVA (Middle InfraRed Observation of Volcanic Activity), a collaborative project between the Universities of Turin and Florence (Italy) supported by the Centre for Volcanic Risk of the Italian Civil Protection Department (URL: http://www.mirovaweb.it/); Copernicus Browser, Copernicus Data Space Ecosystem, European Space Agency (URL: https://dataspace.copernicus.eu/browser/); Kam 24 News Agency, 683032, Kamchatka Territory, Petropavlovsk-Kamchatsky, Vysotnaya St., 2A (URL: https://kam24.ru/news/main/20230411/96657.html#.Cj5Jrky6.dpuf); Simon Carn, Geological and Mining Engineering and Sciences, Michigan Technological University, 1400 Townsend Drive, Houghton, MI 49931, USA (URL: http://www.volcarno.com/, Twitter: @simoncarn).
Bezymianny
Russia
55.972°N, 160.595°E; summit elev. 2882 m
All times are local (unless otherwise noted)
Explosions, ash plumes, lava flows, and avalanches during November 2022-April 2023
Bezymianny is located on the Kamchatka Peninsula of Russia as part of the Klyuchevskoy volcano group. Historic eruptions began in 1955 and have been characterized by dome growth, explosions, pyroclastic flows, ash plumes, and ashfall. During the 1955-56 eruption a large open crater was formed by collapse of the summit and an associated lateral blast. Subsequent episodic but ongoing lava-dome growth, accompanied by intermittent explosive activity and pyroclastic flows, has largely filled the 1956 crater. The current eruption period began in December 2016 and more recent activity has consisted of strong explosions, ash plumes, and thermal activity (BGVN 47:11). This report covers activity during November 2022 through April 2023, based on weekly and daily reports from the Kamchatka Volcano Eruptions Response Team (KVERT) and satellite data.
Activity during November and March 2023 was relatively low and mostly consisted of gas-and-steam emissions, occasional small collapses that generated avalanches along the lava dome slopes, and a persistent thermal anomaly over the volcano that was observed in satellite data on clear weather days. According to the Tokyo VAAC and KVERT, an explosion produced an ash plume that rose to 6 km altitude and drifted 25 km NE at 1825 on 29 March.
Gas-and-steam emissions, collapses generating avalanches, and thermal activity continued during April. According to two Volcano Observatory Notice for Aviation (VONA) issued on 2 and 6 April (local time) ash plumes rose to 3 km and 3.5-3.8 km altitude and drifted 35 km E and 140 km E, respectively. Satellite data from KVERT showed weak ash plumes extending up to 550 km E on 2 and 5-6 April.
A VONA issued at 0843 on 7 April described an ash plume that rose to 4.5-5 km altitude and drifted 250 km ESE. Later that day at 1326 satellite data showed an ash plume that rose to 5.5-6 km altitude and drifted 150 km ESE. A satellite image from 1600 showed an ash plume extending as far as 230 km ESE; KVERT noted that ash emissions were intensifying, likely due to avalanches from the growing lava dome. The Aviation Color Code (ACC) was raised to Red (the highest level on a four-color scale). At 1520 satellite data showed an ash plume rising to 5-5.5 km altitude and drifting 230 km ESE. That same day, Kamchatka Volcanological Station (KVS) volcanologists traveled to Ambon to collect ash; they reported that a notable eruption began at 1730, and within 20 minutes a large ash plume rose to 10 km altitude and drifted NW. KVERT reported that the strong explosive phase began at 1738. Video and satellite data taken at 1738 showed an ash plume that rose to 10-12 km altitude and drifted up to 2,800 km SE and E. Explosions were clearly audible 20 km away for 90 minutes, according to KVS. Significant amounts of ash fell at the Apakhonchich station, which turned the snow gray; ash continued to fall until the morning of 8 April. In a VONA issued at 0906 on 8 April, KVERT stated that the explosive eruption had ended; ash plumes had drifted 2,000 km E. The ACC was lowered to Orange (the third highest level on a four-color scale). The KVS team saw a lava flow on the active dome once the conditions were clear that same day (figure 53). On 20 April lava dome extrusion was reported; lava flows were noted on the flanks of the dome, and according to KVERT satellite data, a thermal anomaly was observed in the area. The ACC was lowered to Yellow (the second lowest on a four-color scale).
Satellite data showed an increase in thermal activity beginning in early April 2023. A total of 31 thermal hotspots were detected by the MODVOLC thermal algorithm on 4, 5, 7, and 12 April 2023. The elevated thermal activity resulted from an increase in explosive activity and the start of an active lava flow. The MIROVA (Middle InfraRed Observation of Volcanic Activity) volcano hotspot detection system based on the analysis of MODIS data also showed a pulse in thermal activity during the same time (figure 54). Infrared satellite imagery captured a continuous thermal anomaly at the summit crater, often accompanied by white gas-and-steam emissions (figure 55). On 4 April 2023 an active lava flow was observed descending the SE flank.
Geologic Background. The modern Bezymianny, much smaller than its massive neighbors Kamen and Kliuchevskoi on the Kamchatka Peninsula, was formed about 4,700 years ago over a late-Pleistocene lava-dome complex and an edifice built about 11,000-7,000 years ago. Three periods of intensified activity have occurred during the past 3,000 years. The latest period, which was preceded by a 1,000-year quiescence, began with the dramatic 1955-56 eruption. This eruption, similar to that of St. Helens in 1980, produced a large open crater that was formed by collapse of the summit and an associated lateral blast. Subsequent episodic but ongoing lava-dome growth, accompanied by intermittent explosive activity and pyroclastic flows, has largely filled the 1956 crater.
Information Contacts: Kamchatka Volcanic Eruptions Response Team (KVERT), Far Eastern Branch, Russian Academy of Sciences, 9 Piip Blvd., Petropavlovsk-Kamchatsky, 683006, Russia (URL: http://www.kscnet.ru/ivs/kvert/); Kamchatka Volcanological Station, Kamchatka Branch of Geophysical Survey, (KB GS RAS), Klyuchi, Kamchatka Krai, Russia (URL: http://volkstat.ru/); Hawai'i Institute of Geophysics and Planetology (HIGP) - MODVOLC Thermal Alerts System, School of Ocean and Earth Science and Technology (SOEST), Univ. of Hawai'i, 2525 Correa Road, Honolulu, HI 96822, USA (URL: http://modis.higp.hawaii.edu/); MIROVA (Middle InfraRed Observation of Volcanic Activity), a collaborative project between the Universities of Turin and Florence (Italy) supported by the Centre for Volcanic Risk of the Italian Civil Protection Department (URL: http://www.mirovaweb.it/); Copernicus Browser, Copernicus Data Space Ecosystem, European Space Agency (URL: https://dataspace.copernicus.eu/browser/).
Chikurachki
Russia
50.324°N, 155.461°E; summit elev. 1781 m
All times are local (unless otherwise noted)
New explosive eruption during late January-early February 2023
Chikurachki, located on Paramushir Island in the northern Kuriles, has had Plinian eruptions during the Holocene. Lava flows have reached the sea and formed capes on the NW coast; several young lava flows are also present on the E flank beneath a scoria deposit. Reported eruptions date back to 1690, with the most recent eruption period occurring during January through October 2022, characterized by occasional explosions, ash plumes, and thermal activity (BGVN 47:11). This report covers a new eruptive period during January through February 2023 that consisted of ash explosions and ash plumes, based on information from the Kamchatka Volcanic Eruptions Response Team (KVERT) and satellite data.
According to reports from KVERT, an explosive eruption began around 0630 on 29 January. Explosions generated ash plumes that rose to 3-3.5 km altitude and drifted 6-75 km SE and E, based on satellite data. As a result, the Aviation Color Code (ACC) was raised to Orange (the second highest level on a four-color scale). At 1406 and 1720 ash plumes were identified in satellite images that rose to 4.3 km altitude and extended 70 km E. By 2320 the ash plume had dissipated. A thermal anomaly was visible at the volcano on 31 January, according to a satellite image, and an ash plume was observed drifting 66 km NE.
Occasional explosions and ash plumes continued during early February. At 0850 on 1 February an ash plume rose to 3.5 km altitude and drifted 35 km NE. Satellite data showed an ash plume that rose to 3.2-3.5 km altitude and drifted 50 km NE at 1222 later that day (figure 22). A thermal anomaly was detected over the volcano during 5-6 February and ash plumes drifted as far as 125 km SE, E, and NE. Explosive events were reported at 0330 on 6 February that produced ash plumes rising to 4-4.5 km altitude and drifting 72-90 km N, NE, and ENE. KVERT noted that the last gas-and steam plume that contained some ash was observed on 8 February and drifted 55 km NE before the explosive eruption ended. The ACC was lowered to Yellow and then Green (the lowest level on a four-color scale) on 18 February.
Geologic Background. Chikurachki, the highest volcano on Paramushir Island in the northern Kuriles, is a relatively small cone constructed on a high Pleistocene edifice. Oxidized basaltic-to-andesitic scoria deposits covering the upper part of the young cone give it a distinctive red color. Frequent basaltic Plinian eruptions have occurred during the Holocene. Lava flows have reached the sea and formed capes on the NW coast; several young lava flows are also present on the E flank beneath a scoria deposit. The Tatarinov group of six volcanic centers is located immediately to the south, and the Lomonosov cinder cone group, the source of an early Holocene lava flow that reached the saddle between it and Fuss Peak to the west, lies at the southern end of the N-S-trending Chikurachki-Tatarinov complex. In contrast to the frequently active Chikurachki, the Tatarinov centers are extensively modified by erosion and have a more complex structure. Tephrochronology gives evidence of an eruption around 1690 CE from Tatarinov, although its southern cone contains a sulfur-encrusted crater with fumaroles that were active along the margin of a crater lake until 1959.
Information Contacts: Kamchatka Volcanic Eruptions Response Team (KVERT), Far East Division, Russian Academy of Sciences, 9 Piip Blvd., Petropavlovsk-Kamchatsky, 683006, Russia (URL: http://www.kscnet.ru/ivs/); Copernicus Browser, Copernicus Data Space Ecosystem, European Space Agency (URL: https://dataspace.copernicus.eu/browser/).
Search Bulletin Archive by Publication Date
Select a month and year from the drop-downs and click "Show Issue" to have that issue displayed in this tab.
The default month and year is the latest issue available.
Bulletin of the Global Volcanism Network - Volume 34, Number 05 (May 2009)
Managing Editor: Richard Wunderman
East Gakkel Ridge at 85°E (Undersea Features)
Undated explosive volcanism at depth on Arctic mid-ocean ridge
Ibu (Indonesia)
Thermal data suggest dome growth continued into mid-2009
Karangetang (Indonesia)
Elevated seismicity, lava flows in May 2009; high alert, evacuations
Krakatau (Indonesia)
Variable eruptive activity from late 2007 to mid-2009; plumes to 3 km altitude
Lengai, Ol Doinyo (Tanzania)
Minor spattering, explosions, ash falls, and lava flows through April 2009
Semeru (Indonesia)
Many ash plumes and some pyroclastic flows during February 2007-March 2009
Slamet (Indonesia)
During April-June 2009, minor explosive eruptions with occasional lava fountains
Telica (Nicaragua)
Intermittent ash explosions and incandescence during 2000-2002
East Gakkel Ridge at 85°E (Undersea Features) — May 2009 Cite this Report
East Gakkel Ridge at 85°E
Undersea Features
85.608°N, 85.25°E; summit elev. -3800 m
All times are local (unless otherwise noted)
Undated explosive volcanism at depth on Arctic mid-ocean ridge
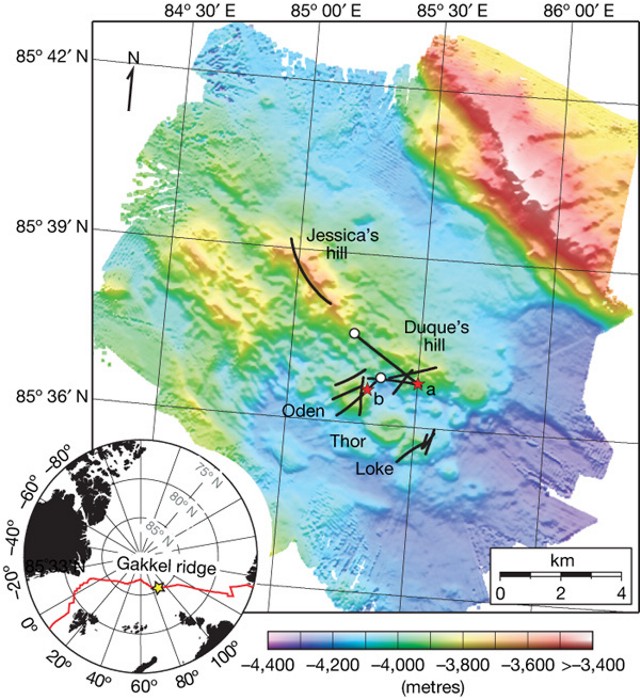
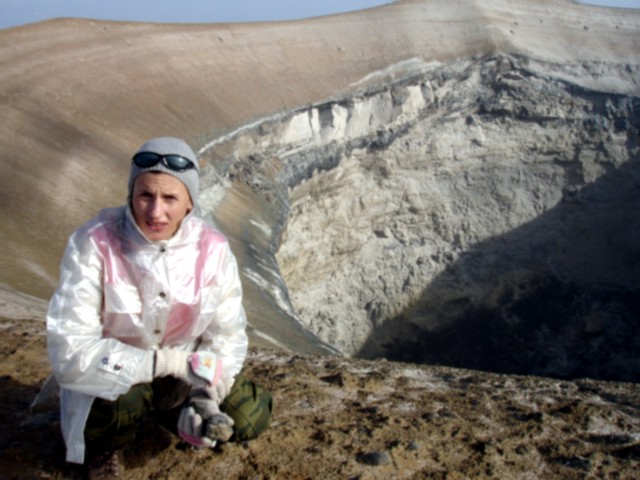
A sonar survey in 2001 along the ultraslow-spreading Gakkel Ridge (formerly known as the Nansen Cordillera and Arctic Mid-Ocean Ridge) by the USS Hawkbill submarine and the U.S. Coast Guard icebreaker Healy revealed two previously undiscovered volcanoes beneath the pack ice of the Arctic Ocean (BGVN 26:03). In July 2007, a research team led by Woods Hole Oceanographic Institution (WHOI) uncovered evidence of explosive volcanic eruptions in the same area of the seafloor.
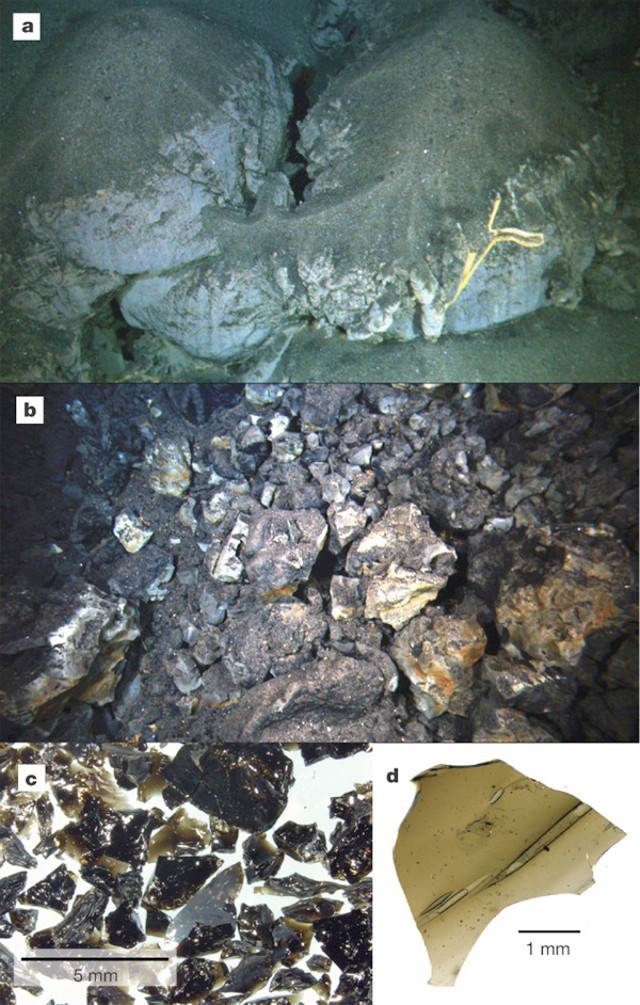
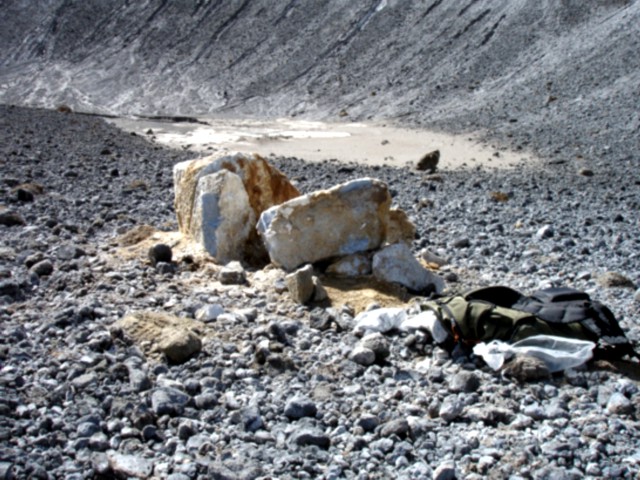
At a depth of ~4 km, researchers found fresh, unweathered, jagged, glassy fragments of rock (pyroclastic deposits) spread out over an area of ~10 km2 around a series of small volcanic craters on the Gakkel Ridge (figure 1). According to WHOI geophysicist Rob Reves-Sohn, chief scientist of the expedition, as quoted in the 14 August 2008 issue of Oceanus, "These are the first pyroclastic deposits we've ever found in such deep water, at oppressive pressures that inhibit the formation of steam, and many people thought this was not possible. This means that a tremendous blast of carbon dioxide was released into the water column during the explosive eruption." Although no speculation was made by the scientists as to the age of the eruption(s) that caused these pyroclastics, the fresh nature of these surficial materials argue to their recency.
According to Cochran (2008), the Gakkel Ridge is the slowest spreading portion of the global system of mid-ocean ridges. Total spreading rates vary from 12.8 mm/year near Greenland to 6.5 mm/year at the Siberian margin.
A recent article by Sohn and others (2008) concerning the July 2007 expedition noted that roughly 60% of the Earth's outer surface is composed of oceanic crust formed by volcanic processes at mid-ocean ridges. Although only a small fraction of this vast volcanic terrain has been visually surveyed or sampled, the available evidence suggests that explosive eruptions are rare on mid-ocean ridges, particularly at depths below the critical point for seawater (a depth of ~ 3,000 m). A pyroclastic deposit has never been observed on the sea floor below 3,000 m, presumably because the volatile content of mid-ocean-ridge basalts is generally too low to produce the gas fractions required for fragmenting a magma at such high hydrostatic pressure. Liu and others (2008) reported on recent analyses of many major and trace element collected from Gakkel Ridge.
The July 2007 expedition acquired photographs and video images of 'zero-age' volcanic terrain along the ridge and beneath the ice-cover ocean's surface. The axial valley at 4,000 m water depth was blanketed with unconsolidated pyroclastic deposits. Those included bubble-wall fragments (limu o Pele, also know as Pele's seaweed?fragments of large glass bubbles that shatter into pieces of curved, paper-thin, bubble walls), covering a large (greater than 10 km2) area (figure 2). At least 13.5 weight percent CO2 is necessary to fragment magma at these depths, which is about tenfold above the highest values previously measured in a mid-ocean-ridge basalt.
Sohn and others (2008) note that these observations raise important questions about the accumulation and discharge of magmatic volatiles at ultraslow spreading rates on the Gakkel ridge. They also demonstrate that large-scale pyroclastic activity is possible along even the deepest portions of the global mid-ocean ridge volcanic system.
References. Sohn, R.A., Willis, C., Humphris, S., Shank, T.M., Singh, H., Edmonds, H.N., Kunz, C., Hedman, U., Helmke, E., Jakuba, M., Liljebladh, B., Linder, J., Murphy, C., Nakamura, K., Sato, T., Schlindwein, V., Stranne, C., Tausenfreund, M., Upchurch, L., Winsor, P., Jakobsson., M., and Soule, A., 2008, Explosive volcanism on the ultraslow-spreading Gakkel ridge, Arctic Ocean: Nature, v. 453, p. 1236-1238 (doi:10.1038/nature07075).
Cochran, J.R., 2008, Seamount volcanism along the Gakkel Ridge, Arctic Ocean, Geophysical Journal International, v. 174, no. 3, p. 1153-1173.
Liu,C-Z, Snow, J.E., Hellebrand, E., Br?gmann, G., von der Handt, A., B?chl, A., and Hofmann, A.W., 2008, Ancient, highly heterogeneous mantle beneath Gakkel ridge, Arctic Ocean: Nature, v. 452, p. 311-316 (doi:10.1038/nature06688).
Carlowicz, M., 2008, Deeply submerged volcanoes blow their tops: Telltale rocks reveal evidence of a phenomenon scientists thought was impossible: Oceanus, 14 August 2008.
Geologic Background. During January-September 1999 global seismic networks detected an earthquake swarm along the East Gakkel Ridge (near 86°N, 85°E). Sonar mapping in May 1999 identified a cone at the western end of a line of volcanoes that corresponded to the average location of the epicenters (Edwards et al., 2001). A survey in July 2007 (Sohn et al., 2008) provided detailed bathymetry and named selected features, including the Oden (location of the 1999 seismicity), Thor, and Loke cones. Both Oden and Loke were covered with a light dusting of pyroclastic material, which was also found throughout the survey area, thought to be products of an eruption during the 1999 swarm.
Information Contacts: Oceanus: The Online Magazine of Research from Woods Hole Oceanographic Institution (URL: http://www.whoi.edu/oceanus/).
Ibu
Indonesia
1.488°N, 127.63°E; summit elev. 1325 m
All times are local (unless otherwise noted)
Thermal data suggest dome growth continued into mid-2009
Our last report on Ibu summarized MODVOLC thermal alerts (satellite thermal anomalies) from mid-May through late October 2008 (BGVN 33:09); those anomalies continued to be recorded almost monthly through June 2009. The anomalies suggest continued growth of a lava dome in the crater, an event previously documented by a photograph taken May 2000 and mentioned in BGVN 28:03. Authorities raised the hazard alert to Level 3 during June 2008. Several photos of Ibu in 2007 were taken by Arnold Binas (figure 2).
Geologic Background. The truncated summit of Gunung Ibu stratovolcano along the NW coast of Halmahera Island has large nested summit craters. The inner crater, 1 km wide and 400 m deep, has contained several small crater lakes. The 1.2-km-wide outer crater is breached on the N, creating a steep-walled valley. A large cone grew ENE of the summit, and a smaller one to the WSW has fed a lava flow down the W flank. A group of maars is located below the N and W flanks. The first observed and recorded eruption was a small explosion from the summit crater in 1911. Eruptive activity began again in December 1998, producing a lava dome that eventually covered much of the floor of the inner summit crater along with ongoing explosive ash emissions.
Information Contacts: Center of Volcanology and Geological Hazard Mitigation (CVGHM), Saut Simatupang, 57, Bandung 40122, Indonesia (URL: http://vsi.esdm.go.id/); Hawai'i Institute of Geophysics and Planetology (HIGP) Thermal Alerts System, School of Ocean and Earth Science and Technology (SOEST), Univ. of Hawai'i, 2525 Correa Road, Honolulu, HI 96822, USA (URL: http://modis.higp.hawaii.edu/); Arnold Binas, Toronto, Canada (URL: http://www.summitpost.org/user_page.php?user_id=42443, http://www.flickr.com/photos/hshdude/collections/72157600584144439/).
Karangetang (Indonesia) — May 2009 Cite this Report
Karangetang
Indonesia
2.781°N, 125.407°E; summit elev. 1797 m
All times are local (unless otherwise noted)
Elevated seismicity, lava flows in May 2009; high alert, evacuations
Lava flows from Karangetang (figure 7) reached several kilometers in length by the end of May 2009, and some residents evacuated. Witnessed plumes were minor, many below 100 m above the summit, the tallest 700 m above the summit. Intermittent minor activity, including explosions, ashfall, and thermal anomalies, has continued in the last few years (BGVN 32:05, 32:08, 34:01), with no significant changes since 2007 (figures 8 and 9).
Based on a pilot observation, the Darwin VAAC reported that on 24 May an ash plume from Karangetang rose to an altitude of 3.7 km and drifted 75 km S. This was the tallest plume of the reporting interval.
On 31 May, based on seismicity, an increase in both volcanic tremor, and continuous air blasts (accompanied by rumbling sounds), the Center of Volcanology and Geological Hazard Mitigation (CVGHM) upgraded Karangetang's hazard status from Alert Level 3 (Siaga) to 4 (Awas) the highest level (figure 10). According to the website "Natural Disasters in Indonesia," hundreds of people were evacuated from near the volcano and the total number of vulnerable residents was 3,000. The Alert Level fell back to 3 on 9 June.
Tremor was reported on 30 May and became continuous at times during the morning of 31 May (0600-1200). That same time interval saw the largest number of earthquakes. Craters I and II initially produced white plumes to heights of ~ 10-25 m and visible incandescence.
Beginning at 0630 a dense white to brownish plume from the principal crater reached a height of ~ 100 m above the peak. At 0824 there was a continuous expulsion of lava which flowed S, traveling ~ 2.3 km down the Kali Batuawang river. Lava also flowed ~ 1.5 km into the Kali Kahetang and Kali Keting rivers. Lava flows periodically traveled ~ 1 km down the Kali Nanitu and Batang rivers. At 0828 a thick grayish to plume was continuously ejected to a height of ~ 25-700 m accompanied by a rumbling sound of low to medium intensity.
In connection with the upgrading of the hazard status to Alert Level 4, CVGHM stepped up its monitoring and sent a team to the field. The regional government was alerted to the possible fallout of hot ash and the expulsion of lava flows. Numerous threatened towns and sub-districts were mentioned. These included Siau Timur, Kampung Kola-Kola (Bebali village); Kampung Bolo and Kampung Kopi, (Tarorane village); Kampung Hekang, Tatahadeng village, the village of Dame 1, the village of Karalung along the Kali Beha Timur river and, Kampung Dompase, along the banks of the Kali Nanitu and Kali Kinali rivers. There was the constant threat of lahar (mud flows) along the length of the rivers that originate from the active crater, including the Batu Awang, Kahetang, Keting, Batang, Beha Timur, and Nanitu rivers.
People were cautioned not to approach Karangetang closer than 3 km from the summit, particularly under conditions of heavy rain. Residents of the village of Dame and part of the population of the township of Tatahadeng were advised to maintain a high level of alertness to the dangers of pyroclastic flows and lava flows. In the case of sudden tephra falls, authorities recommended the public don face masks. As previously mentioned, on 9 June 2009 the alert level was reduce from 4 to 3.
MODVOLC. There were numerous MODVOLC thermal alerts during 2 December 2008-25 February 2009 (BGVN 34:01). As of late June 2009, dates of subsequent MODVOLC alerts for Karangetang were 18 and 29 March; 25, 26, 28, and 30 April; and 7, 14, and 31 May; and 3 June. In effect, the alerts were broadly spread for more than a year and showed little if any response to the elevated activity seen during the crisis.
Geologic Background. Karangetang (Api Siau) volcano lies at the northern end of the island of Siau, about 125 km NNE of the NE-most point of Sulawesi. The stratovolcano contains five summit craters along a N-S line. It is one of Indonesia's most active volcanoes, with more than 40 eruptions recorded since 1675 and many additional small eruptions that were not documented (Neumann van Padang, 1951). Twentieth-century eruptions have included frequent explosive activity sometimes accompanied by pyroclastic flows and lahars. Lava dome growth has occurred in the summit craters; collapse of lava flow fronts have produced pyroclastic flows.
Information Contacts: Center of Volcanology and Geological Hazard Mitigation (CVGHM), Jalan Diponegoro 57, Bandung 40122, Indonesia (URL: http://vsi.esdm.go.id/); Hawai'i Institute of Geophysics and Planetology (HIGP) Thermal Alerts System, School of Ocean and Earth Science and Technology (SOEST), Univ. of Hawai'i, 2525 Correa Road, Honolulu, HI 96822, USA (URL: http://modis.higp.hawaii.edu/); Darwin Volcanic Ash Advisory Centre (VAAC), Bureau of Meteorology, Northern Territory Regional Office, PO Box 40050, Casuarina, NT 0811, Australia (URL: http://www.bom.gov.au/info/vaac/); Agence France-Presse (URL: http://www.afp.com/); Arnold Binas, Toronto, Canada (URL: http://www.summitpost.org/user_page.php?user_id=42443, http://www.flickr.com/photos/hshdude/collections/72157600584144439/).
Krakatau
Indonesia
6.1009°S, 105.4233°E; summit elev. 285 m
All times are local (unless otherwise noted)
Variable eruptive activity from late 2007 to mid-2009; plumes to 3 km altitude
Renewed eruptive activity from Anak Krakatau began in October 2007 (BGVN 32:09), with minor eruptions through that November (BGVN 33:01). This small but growing post-caldera cone first gained attention with a 1927 eruption (Simkin and Fiske, 1983). During October-November 2007 several eruptions were Vulcanian in nature (BGVN 33:01). The detailed chronology of behavior during October 2007 to 3 July 2009 is sometimes sketchy, but activity was apparently quite variable. Although one or more lulls may have occurred, eruptions clearly continued into 2009.
Many of these eruptions were minor, but some were large enough to cause the Center of Volcanology and Geological Hazard Mitigation (CVGHM) to raise the Alert Level to 3 (on a scale with 4 as the highest). The Alert Level was lowered and raised again throughout 2008 and into 2009 as activity warranted. People were advised not to go within 1.5 km of the summit.
During April 2009 some residents in neighboring Sumatra allegedly evacuated when they saw more intense activity (including plumes up to ~ 1 km above the crater). Some of the taller plumes during the reporting interval rose to ~ 3 km.
Activity through August 2008. According to a news article, by 22 November 2007, seismicity had declined in frequency. Based on an Antara News article, this decline in seismic activity was interrupted by incandescent rock ejections on 20 January 2008 accompanied by plumes that rose to altitudes of 2.8-3.3 km. Eruptions reportedly had a "deafening sound" and could be seen from Sertung and Rakata islands. Seismicity again declined in early February 2008, and eruption plumes and ejected incandescent material were not seen during 4 February to mid-April 2008.
Seismicity increased during 14-21 April 2008, with the number of events per day peaking on 20 April. Ash plumes accompanied by ejected incandescent rocks were noted during CVGHM field observations on 16, 17, and 18 April. The eruption affected the summit and the E and S flanks. Booming noises were reported and occasionally heard at an observation post 42 km away.
Based on observations of satellite imagery and pilot reports, the Darwin Volcanic Ash Advisory Center (VAAC) reported that a low-level ash plume on 20 June 2008 rose to an altitude of 3 km and drifted NW.
During 22 June-1 July 2008, the number of seismic events decreased significantly and booming noises were less frequently heard. On 1-3 July ash emissions declined, although on 1 and 2 July low level ash plumes rose to an altitude less than 3 km and drifted NW.
Based on observations of satellite imagery, the Darwin VAAC reported that ash plumes from Anak Krakatau rose to an altitude of 3 km on 27 July 2008 and drifted NW.
According to an article in Antara News, eruptions increased in frequency during 10-11 August 2008. On 12 August, monitoring personnel reported that active lava flows and dense emissions of "smoke" continued, but that the frequency of earthquakes and eruptions had declined. Another news article indicated that explosions and earthquakes averaged ~ 120 per day during 11-17 August 2008. Monitoring personnel during that period observed plumes, active lava flows, and rock ejections.
Activity during March-May 2009. No additional reports by CVGHM were available during September 2008 through February 2009. Alerts based on thermal anomalies (see MODVOLC section, below) were not present during 31 August 2008 to 30 March 2009.
Seismicity increased significantly during 19-25 March 2009 and remained high through 5 May. During periods of clear weather on 25 March, white-to-gray plumes rose 400 m above the volcano. During 27-30 March and 1 April 2009 clear weather revealed ash plumes rising 200-800 m. On 2 April an ash eruption was seen on satellite imagery and reported by a pilot. A resultant ash plume drifted more than 60 km S.
During March through 25 April 2009, an episode of heightened seismicity produced thousands of eruptive signals (table 6); however, the seismic station shut down overnight during 1-26 April, and completely shut down during 27-29 April. CVGHM believed that this shutdown was the result of either blockage of sunlight from reaching the solar panels by tephra collecting there or because of impact-induced damage to the panels. On 29 April CVGHM installed a seismometer on Anak Krakatau at a location thought to be reasonably safe.
Table 6. Type and number of earthquakes and tremor recorded at Krakatau during 27 March-6 May 2009. Values shown are daily averages except the following: 1) 01-24 and 25-26 April: during 12-hour period (daylight); 2) 30 April: starting at 0830 local time from a new, safer location; 3) 06 May: during 0000 to 1200 local time. No data was recorded during 27-29 April. Courtesy of CVGHM.
| Date |
Eruptive |
Air-blast |
Deep volcanic |
Shallow volcanic |
Tremor |
Harmonic tremor |
| 27-30 Mar 2009 |
175 |
102 |
3 |
68 |
-- |
-- |
| 31 Mar 2009 |
152 |
72 |
5 |
32 |
-- |
-- |
| 01-24 Apr 2009 |
168 |
109 |
12 |
62 |
-- |
-- |
| 25-26 Apr 2009 |
116 |
-- |
2 |
51 |
-- |
-- |
| 27-29 Apr 2009 |
-- |
-- |
-- |
-- |
-- |
-- |
| 30 Apr 2009 |
229 |
142 |
-- |
12 |
44 |
1 |
| 01 May 2009 |
324 |
248 |
-- |
98 |
80 |
4 |
| 02 May 2009 |
318 |
270 |
-- |
131 |
126 |
24 |
| 03 May 2009 |
250 |
273 |
-- |
71 |
114 |
23 |
| 04 May 2009 |
403 |
230 |
-- |
36 |
183 |
38 |
| 05 May 2009 |
371 |
339 |
-- |
58 |
127 |
41 |
| 06 May 2009 |
132 |
127 |
-- |
44 |
82 |
23 |
During April 2009 observers reported grayish-white to black plumes that rose to 50-1,000 m above the crater. They heard many loud booms. CVGHM observations carried out on 24-25 and 29 April found the eruption venting from a crater near the volcano's peak on its SW slope. Eruptions generally sent incandescent blocks and ash ~ 500 m from the center in all directions. Some of the lofted ash blew E to SE and caused fallout up to 5 km away.
According to a news article on 29 April 2009, some residents in southern Sumatra near Krakatau evacuated because they had observed increased volcanism during the previous week. For example, observers reported loud blasts, lava flows, and ash plumes. In clear weather on 5 May "smoke" rose 500 m above the crater.
An Antara News article published on 18 June 2009 indicated that in the previous several days the number of small eruptions increased tremendously. It said that, according to Anto Prambudi, head of the monitoring post in Pasauran village, at least 828 small eruptions were recorded during 11-17 June 2009.
MODVOLC. MODVOLC thermal alerts were triggered through 9 December 2007 (BGVN 33:01). In later 2007, comparatively few alerts occurred, but became more prevalent again during mid-January 2008. After that, they were few or absent until mid-April; alerts were common and strong during the week ending 4 May. Consistent alerts were the pattern until the week ending 7 June, which had no alerts, but some continued in the next few weeks.
A seven-month gap in MODVOLC thermal alerts occurred during the interval 31 August 2008 to 30 March 2009. After that, alerts again became common again, particularly abundant during April 2009 (an episode of eruptions and heightened seismicity) and continued regularly through at least 3 July 2008.
The gap in alerts may have been influenced by downward biasing from poor weather conditions. On the other hand, for the cases with high numbers of alerts, false positives (due to fires for example) were unlikely on the desolate landscape of Anak Krakatau.
Reference. Simkin, T., and Fiske, R.S., 1983, Krakatau 1883-the volcanic eruption and its effects: Smithsonian Institution Press, Washington, DC, 464 p. [ISBN 0-87474-841-0]
Geologic Background. The renowned Krakatau (frequently mis-named as Krakatoa) volcano lies in the Sunda Strait between Java and Sumatra. Collapse of an older edifice, perhaps in 416 or 535 CE, formed a 7-km-wide caldera. Remnants of that volcano are preserved in Verlaten and Lang Islands; subsequently the Rakata, Danan, and Perbuwatan cones were formed, coalescing to create the pre-1883 Krakatau Island. Caldera collapse during the catastrophic 1883 eruption destroyed Danan and Perbuwatan, and left only a remnant of Rakata. This eruption caused more than 36,000 fatalities, most as a result of tsunamis that swept the adjacent coastlines of Sumatra and Java. Pyroclastic surges traveled 40 km across the Sunda Strait and reached the Sumatra coast. After a quiescence of less than a half century, the post-collapse cone of Anak Krakatau (Child of Krakatau) was constructed within the 1883 caldera at a point between the former Danan and Perbuwatan cones. Anak Krakatau has been the site of frequent eruptions since 1927.
Information Contacts: Center of Volcanology and Geological Hazard Mitigation (CVGHM), Jalan Diponegoro 57, Bandung 40122, Indonesia (URL: http://vsi.esdm.go.id/); Darwin Volcanic Ash Advisory Centre (VAAC), Bureau of Meteorology, Northern Territory Regional Office, PO Box 40050, Casuarina, NT 0811, Australia (URL: http://www.bom.gov.au/info/vaac/); Antara News (URL: http://www.antara.co.id/en/); Jakarta Post (URL: http://www.thejakartapost.com/).
Ol Doinyo Lengai (Tanzania) — May 2009 Cite this Report
Ol Doinyo Lengai
Tanzania
2.764°S, 35.914°E; summit elev. 2962 m
All times are local (unless otherwise noted)
Minor spattering, explosions, ash falls, and lava flows through April 2009
This report chiefly discusses observations made at Ol Doinyo Lengai (hereafter called Lengai) in the first half of 2009. Broadly speaking, the active N crater continued to be the scene of venting. More specifically, the cone that covers much of what was the N crater contained a steep-sided crater with a tight cluster of active hornitos and spatter cones on its floor. Conditions during 2009 visits were generally calm, although minor eruptions on the crater floor continued. This is in contrast to explosive eruptions during September 2007-March 2008 (BGVN 32:11, 33:02, 33:06, 33:08, 34:02).
In the late stages of preparing this issue we received a report from Tobias Fischer stating that when he and his team visited on 11-12 June 2009, one side of the crater contained a convecting lava lake. That report will appear in our next issue.
Most of the groups that arrived at Lengai in 2009 did not ascend to the active crater and the SE route remained difficult. Gas samples collected here in 2005 were published and interpreted in Fischer and others (2009). The next subsection confirms original interpretations of a 2007 satellite image.
September 2007 ASTER image. David Sherrod was among USGS visitors during January 2009, working with local government officials and studying tephra deposits from explosive eruptions during September 2007-March 2008 that were distributed well out from the volcano (BGVN 34:02). When commenting about the cause of the large lobate black areas on Lengai's NW, W, and E sides seen in ASTER imagery from 4 September 2007 (BGVN 32:11) he noted, "the lava flows of late 2007-early 2008 are far more restricted than the blackened areas visible on the photos."
This is in agreement with the statement by Roger Mitchel in the original discussion (and the original figure caption). Sherrod also said, "I'm fairly certain [the dark lobes] are burn areas. The fires can be natural, but they are also set by herdsman to improve access and grass quality. The dark areas show on many past images, including those from times in the absence of eruptions. They commonly have well-defined margins and thorough coverage within. Lava flows have well defined margins but more erratic coverage within the bounds, creating digitate lobes."
Comments on aviation hazards during 2007-2008. Comparatively few pictures or comments on aviation hazards have emerged from the recent episode of Plinian eruptions during 2007-2008. Ben Wilhelmi took a series of photos of the ground surface at distance from the volcano during a week in November 2007. From the air he saw ash as far away as 70 km from the volcano, including in many cases, over Masai villages that dot the landscape.
Wilhelmi's discussion and photos follows. "[During] 2007 and 2008 ... smoke and ashes sometimes [rose] up to 50,000 ft, 15 km high. It looked like a Hiroshima mushroom [cloud (figure 122)]. Here is ash deposit on my aircraft [(figure 123)]. Often the ash was invisible in the air though. [Three] turbine engines died in different companies because of ash intakes. It happened one of these engines [died] on me. Luckily I could finish the flight, but I didn't like the feeling to see the engine temperature in the red and [flying] on reduced power.
"In other countries, such an activity [as seen in figure 122] would have imposed the area to be closed within 200 miles [~320 km], that would have included Arusha and all the Serengeti [and] Ngorongoro [park and conservation areas]. "Competent" authorities were asleep, the regional companies happily kept on flying ... and subsequently lost 3 engines as I've said earlier. Costs could go up to $350,000 for a new turbine engine ... I certainly didn't complain as I could shoot [photos at will and] got to see incredible spectacles like this day with a 55,000 ft or 17 km high plume of smoke with an electric thunderstorm inside!"
February 2009 visit. Anatoly Zaitsev and Gregor Markl reported that in mid-February 2009 a group from St. Petersburg, Russia (A.N. Zaitsev, S.V. Petrov, T.A. Golovina, and E.O. Zaitseva) and Tuebingen, Germany (G. Markl and T. Wenzel) climbed the volcano. There were no ash or gas emissions during the visit, although on the crater floor lava bubbled and spattered.
The group reached the summit around 0830 on 18 February after ~ 4.5 hours of climbing. They ascended along the traditional W route (an approach enabling rapid access but potentially exposing climbers to eruptive debris). They stayed on the summit and in the N crater for ~ 5 hours. On the large cone in the N crater they walked around the active crater's rim on the W, S, and E sides (figure 124). They crossed the depression between the two rims on the S side of the cone, the outer rim belonging to an earlier stage of development, the inner rim lying along the margin of the current crater. In that depression they found meter-sized blocks (figure 125).
Three hornitos (spatter cones) were observed deep in the crater floor. One, with a broken upper part, was active throughout the visit. Inside that hornito they saw bubbling lava, and several times black spatter was ejected.
The surface of the cone around the deep pit crater's rim consisted of gray fine-grained ash with rare blocks of ejected silicate rocks. Later analysis of a sample taken from the surface of the cone using X-ray diffraction indicated significant amounts of calcite in addition to silicate minerals. The depression between the rims of a new and old craters was covered by numerous blocks and bombs of silicate rocks (nephelinites, wollastonite nephelinites, and ijolites) and partly altered natrocarbonatites.
Fumarolic activity in the northern crater was weak. The group observed just a few small cracks emitting gases that were relatively cold-probably less than 100°C.
Summary of 2009 visits. Table 22 shows a list of observers known to have visited or flown over Lengai since 2009 began. Available photos and text indicate that on the crater floor, hornitos continued to spatter lava. Otherwise, relative calm was seen, typically even devoid of steam, during much of the interval 1 October 2008 through 25 April 2009.
Table 22. Summary of selected observations of Ol Doinyo Lengai (from a climb, aerial overflight, flank, or satellite) during January-April 2009. Courtesy of Ben Wilhelmi and Frederick Belton.
| Date |
Observer |
Observation Location |
Brief Observations |
| 18-22 Jan 2009 |
Representatives from the U.S. Geological Survey, U.S. Agency for International Development, Geological Survey of Tanzania, and Tanzania Prime Minister's Office. |
Flank |
See BGVN 34:02. |
| 18 Feb 2009 |
A.N. Zaitsev, S.V. Petrov, T.A. Golovina, E.O. Zaitseva, G. Markl, and T. Wenzel |
Climb |
See text above. |
| 14 Mar 2009 |
Stefan Lubben |
Climb |
Climbed through the Pearly Gates without difficulty. At summit, they smelled sulfur but heard nothing from the volcano. |
| 07 Apr 2009 |
Alexander Daneel |
Aerial |
Photos indicate small cones on the crater floor in similar spots to those seen active by H. Loubieres and F. Vignes on 1 September 2008 (BGVN 33:08) (see figure 126). This lack of change suggests only minor volcanism from the crater during 1 September 2008 to 7 April 2009. |
| 25 Apr 2009 |
Ben Wilhelmi |
Aerial |
Photos showing numerous hornitos with spatter widespread on the crater floor and in places on the crater walls (see figure 127). |
Regarding his March visit to the summit, Stefan L?bben reported that amid wet and windy weather they could smell sulfur. But they heard nothing from the volcano.
On 7 April 2009 Alexander Daneel photographed the summit crater from the air (figure 126). Some of the same small lava cones inside the crater were seen to be active by Hervé Loubieres and Fran?oise Vignes on 1 September 2008. An aerial view on 25 April showed numerous hornitos that had formed in the previous 4-5 months (figure 127).
Gas chemistry. Based on chemical analyses of gas samples collected by Bernard Marty in July 2005 (BGVN 30:10) (figure 128), Fischer and others (2009) reported that a very small amount of melting of Earth's mantle, akin to that beneath mid-ocean ridges, can produce carbonatites. Their gas samples, containing minimal air contamination, revealed that the carbon dioxide came from the upper mantle below the East African Rift.
Fischer and others (2009) state, "On a global scale, our results imply that the regions of upper mantle beneath mid-ocean ridges, continental North America, and the East African Rift were identical in their volatile abundances and isotopic compositions. Despite small differences in some trace gases (for example Xe isotopes in MORBs-mid-ocean ridge basalts-versus [gases from continental wells]), the upper mantle appears to be a uniform and homogenous geochemical reservoir of CO2 and other gases (N2, He, and Ar) below both continent[s] and oceans."
Reference. Fischer, T.P., Burnard, P., Marty, B., Hilton, D.R., F?ri, E., Palhol, F., Sharp, Z.D., and Mangasini, F., 2009, Upper-mantle volatile chemistry at Oldoinyo Lengai volcano and the origin of carbonatites, Nature, v. 459, p. 77-80 (doi:10.1038/nature07977).
Geologic Background. The symmetrical Ol Doinyo Lengai is the only volcano known to have erupted carbonatite tephras and lavas in historical time. The prominent stratovolcano, known to the Maasai as "The Mountain of God," rises abruptly above the broad plain south of Lake Natron in the Gregory Rift Valley. The cone-building stage ended about 15,000 years ago and was followed by periodic ejection of natrocarbonatitic and nephelinite tephra during the Holocene. Historical eruptions have consisted of smaller tephra ejections and emission of numerous natrocarbonatitic lava flows on the floor of the summit crater and occasionally down the upper flanks. The depth and morphology of the northern crater have changed dramatically during the course of historical eruptions, ranging from steep crater walls about 200 m deep in the mid-20th century to shallow platforms mostly filling the crater. Long-term lava effusion in the summit crater beginning in 1983 had by the turn of the century mostly filled the northern crater; by late 1998 lava had begun overflowing the crater rim.
Information Contacts: David Sherrod, Cascades Volcano Observatory, USGS, Vancouver, WA, USA; Anatoly Zaitsev, St. Petersburg State University, Saint Petersburg, Russia; Gregor Markl, Tuebingen, Germany; Frederick Belton, Developmental Studies Department, PO Box 16, Middle Tennessee State University, Murfreesboro, TN 37132, USA (URL: http://oldoinyolengai.pbworks.com/); Ben Wilhelmi (URL: http://benwilhelmi.typepad.com/benwilhelmi/).
Semeru
Indonesia
8.108°S, 112.922°E; summit elev. 3657 m
All times are local (unless otherwise noted)
Many ash plumes and some pyroclastic flows during February 2007-March 2009
Our last report (BGVN 32:03) covered through October 2006 in terms of CVGHM reporting and through February 2007 in terms of Darwin VAAC reporting. As has been the case for decades, Semeru's eruptions continued and were ongoing through this reporting interval, February 2007-March 2009. During the reporting interval, ash plumes were periodically observed over the summit at low altitudes of 3.7-4.6 km. Taller plumes, when they occurred, are noted below. There were several cases of plumes over 6 km altitude and as tall as ~ 7.6 km altitude. Pyroclastic flows ran out to distances as great as 3 km (table 18).
Table 18. Compilation of data on Semeru during February 2007-March 2009. Courtesy of CVGHM.
| Date |
Plume height and drift direction |
Seismicity and Observations |
| 10-11 Feb 2007 |
E |
-- |
| 03-05 May 2007 |
4.6 km; SW |
-- |
| 25 May 2007 |
4.6 km; W |
-- |
| 18-25 Jun 2007 |
4.2 km |
-- |
| 06 Aug 2007 |
6.1 km |
-- |
| 22 Sep 2007 |
7.3 km |
-- |
| 31 Oct 2007 |
-- |
Eruption heard 17 km away. |
| 21 Apr 2008 |
6.1 km |
-- |
| 15, 17-19, 21 May 2008 |
-- |
Increased seismicity. Pyroclastic flows up to 500-3000 m from the crater. On 21 May, incandescent ejections. |
| 22 May 2008 |
-- |
Fewer pyroclastic flows and rockfalls; four up to 2.5 km from crater. |
| 05 Jun 2008 |
-- |
Decline in seismicity. |
| 07-09 Jul 2008 |
4.9-7.6 km; SSW |
-- |
| 27 Jul 2008 |
4.3 km |
-- |
| 05 Aug 2008 |
4.0-4.3 km |
Plumes sometimes with incandescent tephra. |
| 07 Aug 2008 |
4.3 km |
Incandescent material ejected from the crater. |
| 21-22 Aug 2008 |
3.7 km; W |
-- |
| 28 Aug 2008 |
Low-level |
-- |
| 31 Aug 2008 |
4.6 km; SW |
-- |
| 09 Sep 2008 |
4.3 km; SSW |
-- |
| 10 Sep 2008 |
4.3 km |
-- |
| 22 Oct 2008 |
4.3 km |
-- |
| Jan 2009 |
-- |
Average over 100 daily eruptive earthquakes. Four deep volcanic earthquakes on the 24th. |
| Feb 2009 |
-- |
Average of less than 50 eruptive earthquakes/day. |
| 01 Feb 2009 |
4.0 km |
-- |
| 21 Feb 2009 |
-- |
18 deep volcanic earthquakes. |
| 03 Mar 2009 |
-- |
5 eruptive earthquakes. |
| 06 Mar 2009 |
3.7 km |
0010 local time (see text). |
| 06, 12 Mar 2009 |
-- |
Volcanic seismicity had a maximum amplitude reached ± 34 mm. |
| 12 Mar 2009 |
4.5 km |
Ash/cinder eruption accompanied by rumbling sounds lasting ~6 minutes. |
| 15 Mar 2009 |
4.3 km |
Eruptive earthquake amplitude ±18 mm. Dense low-pressure ash-cinder eruption; changing to white air-blasts, then gradually diminishing. |
| 16-22 Mar 2009 |
-- |
Averaged eruptive earthquakes around 1-30 daily; max. amplitudes less than 10 mm. |
October 2007. Based on reports from CVGHM, the Darwin VAAC reported that an unconfirmed eruption was heard 17 km away on 31 October 2007 (table 18). No plume was seen in MTSAT-IR satellite imagery. A news report from Antara News on 5 November 2007 ("Ash blankets town near Indonesian volcano") noted that scientists monitoring the volcanoes confirmed Semeru as the source. The news report stated that initially residents thought the thin layer of ash had come from Kelut, a volcano that went to Alert Level 4 (the highest status) on 16 October. The eruption of Kelut, while emitting a large dome into a crater lake, triggered few if any sustained explosions (BGVN 33:03). Ash fell in Blitar, outside a 10 km danger zone around Kelut; Semeru is ~ 90 km away.
On 15, 17-19, and 21 May 2008 ash plumes, rockfall avalanches, and multiple pyroclastic flows were observed, as well as increased seismic activity. At that time, the alert level was raised from 2 to 3. By 22 May pyroclastic flows and rockfall avalanches had declined in frequency, and consequently on 5 June the hazard was lowered to Level 2. During 7-9 July 2008, ash plumes rose to altitudes of 4.9-7.6 km, the tallest of the reporting interval.
From January to mid-February 2009, explosion earthquakes occurred on average 100-150 times a day (table 18). Ash and cinder eruptions from Jonggring Saloko crater took place daily every 15-20 minutes, with plumes reaching altitudes of 3.7-4.3 km. During a ~ 5 minute interval on 6 March 2009 at 0010, a loud boom was followed by a bluish flash of lightning 5-7 seconds in duration.
Geologic Background. Semeru, the highest volcano on Java, and one of its most active, lies at the southern end of a volcanic massif extending north to the Tengger caldera. The steep-sided volcano, also referred to as Mahameru (Great Mountain), rises above coastal plains to the south. Gunung Semeru was constructed south of the overlapping Ajek-ajek and Jambangan calderas. A line of lake-filled maars was constructed along a N-S trend cutting through the summit, and cinder cones and lava domes occupy the eastern and NE flanks. Summit topography is complicated by the shifting of craters from NW to SE. Frequent 19th and 20th century eruptions were dominated by small-to-moderate explosions from the summit crater, with occasional lava flows and larger explosive eruptions accompanied by pyroclastic flows that have reached the lower flanks of the volcano.
Information Contacts: Center of Volcanology and Geological Hazard Mitigation (CVGHM), Saut Simatupang, 57, Bandung 40122, Indonesia (URL: http://vsi.esdm.go.id/); Antara News (URL: http://www.antara.co.id/en/).
Slamet
Indonesia
7.242°S, 109.208°E; summit elev. 3428 m
All times are local (unless otherwise noted)
During April-June 2009, minor explosive eruptions with occasional lava fountains
Minor eruptions were reported at the active crater during April-June 2009. Small amounts of ash fell several times during May. Witnesses saw lava fountains on 12 and 21-23 May. Previously, steam plumes were associated with heavy rains during 28 March-3 April 2007 (BGVN 33:04).
During 19-23 April 2009 Slamet's seismicity increased. On 20 April, diffuse white plumes rose ~ 50 m above the crater. During 21-23 April, the number of eruption tremors increased steadily, and dense, white-to-brownish plumes rose 50-800 m above the crater rim. The Alert Level was raised to 2 (on a scale of 1-4).
On 23 April, the Alert Level was raised to 3; people were advised not to climb the summit. According to a news article in the Jakarta Globe, a volcanologist from the Center of Volcanology and Geological Hazard Mitigation (CVGHM) stated that lava was ejected 600 m high and ash bursts occurred up to 112 times within a 6-hour period.
According to CVGHM, seismicity continued to increase or remain elevated during 23 April-17 May, peaking on 17 May. During this period, continuous eruptive quakes/tremors were recorded, together with an increase in amplitude (3-46 mm on 12-13 May, rising to about 20-32 mm between 17-24 May). Eruptions from the western part of the crater continued, and inflation was noted. During times of clear weather, observers reported that incandescent lava was ejected 25-100 m above the crater, and then fell back into and around the active crater. Gray and white "smoke" rose 100-800 m from the crater. Occasionally a thunderous noise accompanying eruptions of ash occurred, and ashfall was detected in areas 5-9 km away. The temperature of water in several locations on the flanks increased.
During 12 May and 21-23 May, lava fountains rose 100-400 m above the crater rim. During several eruptions, ejected incandescent material traveled down the W flank. White-to-gray "smoke" rose 150 m above the crater. On 22 May, ashfall was reported in Sawangan village, 5 km W. On 23 May, an ash plume rose 1 km above the crater and ash fell on the N flank. Ash accumulated to 1 mm depth near the observation post. The next day an ash plume rose 700 m above the crater.
Based on ground information from CVGHM, the Darwin Volcanic Ash Advisory Centre (VAAC) reported that on 27 May an ash plume from Slamet rose to an altitude of 4.3 km. Analysis of satellite imagery also indicated that a possible plume rose to an altitude of 6.1 km, but ash was not conclusively detected.
CVGHM reported that during 26 May-4 June activity from Slamet fluctuated, but decreased overall. They found decreases in both the number of earthquakes and the temperature of water in areas around the volcano. Inflation and deflation fluctuated within a range of 2 cm. White plumes rose 100-750. During 5-7 June, activity was characterized by inflation and an increased number of earthquakes. During that time, white plumes were accompanied by ash emissions that rose 200-800 m from the crater, incandescent material was ejected 50-200 m above the crater, and booming noises were reported.
As of 4 June 2009, the Alert Level remained at 3, based on visual data, deformation, earthquakes, and tremor. CVGHM urged the public to don face masks during heavy ashfalls, and to cover water sources to prevent contamination by volcanic ash.
Geologic Background. Slamet, Java's second highest volcano at 3428 m and one of its most active, has a cluster of about three dozen cinder cones on its lower SE-NE flanks and a single cinder cone on the western flank. It is composed of two overlapping edifices, an older basaltic-andesite to andesitic volcano on the west and a younger basaltic to basaltic-andesite one on the east. Gunung Malang II cinder cone on the upper E flank on the younger edifice fed a lava flow that extends 6 km E. Four craters occur at the summit of Gunung Slamet, with activity migrating to the SW over time. Historical eruptions, recorded since the 18th century, have originated from a 150-m-deep, 450-m-wide, steep-walled crater at the western part of the summit and have consisted of explosive eruptions generally lasting a few days to a few weeks.
Information Contacts: Center of Volcanology and Geological Hazard Mitigation (CVGHM), Jalan Diponegoro 57, Bandung 40122, Indonesia (URL: http://vsi.esdm.go.id/); Darwin Volcanic Ash Advisory Centre (VAAC), Bureau of Meteorology, Northern Territory Regional Office, PO Box 40050, Casuarina, NT 0811, Australia (URL: http://www.bom.gov.au/info/vaac/); Jakarta Globe (URL: http://www.thejakartaglobe.com).
Telica
Nicaragua
12.606°N, 86.84°W; summit elev. 1036 m
All times are local (unless otherwise noted)
Intermittent ash explosions and incandescence during 2000-2002
Explosions occurred at Telica during January and through February 2000, after which the activity began to gradually decline (BGVN 25:03 and 25:09). Intermittent ash explosions and crater incandescence were seen through 2002, along with high levels of seismicity related to degassing and constant low tremor. The Geophysics Department of the Nicaraguan Territorial Studies Institute (INETER) monitors activity; visits to the crater described below are by INETER staff unless otherwise noted. Many observations were also made by a local resident who maintains the local seismic station.
Activity during 2000. Tremor remained constant during April-June 2000, with no ash emissions. Visiting geologists reported incandescence in the crater on 5 July 2000. INETER workers who reached the crater on 14 July heard a noise like an airplane turbine coming from the crater and saw glow. They also noted that there had been a widening of the crater due to wall collapses, and an increase in its depth, although the crater floor could not bee seen. On 8 August a crater visit revealed strong fumarolic activity, and sounds resembling gun detonations from the bottom of a new opening.
Residents living near the crater reported on 6 September that ash explosions occurred during the evening and plumes drifted NE. Unfortunately INETER technicians found no traces of ash on 12 September, following rainfall. Small landslides inside the crater were observed. A characteristic strong smell of sulfur was detected in the crater area. Due to the change in wind direction that occurs during September and October, gases and acid rain affected areas to the N, NE, and E. Intense rainfall caused a mudflow down a W-flank drainage.
In the visit on 27 October there was no exhalation of gases, but landslides along the south wall sent material onto the crater floor. Crater visits on 5 and 22 November showed abundant gas output. Jet-like sounds came from fumaroles on the NE wall. Gas emissions were low during December. There were minor landslides in the crater, heard in the last days of November and beginning of December.
Activity during 2001. On the afternoon of 17 January 2001 there were rumbles and a plume of ash and gases 200 m high. On 19 January a visit to the crater found ashfall, to a depth of 1 mm, deposited within a radius of 500 m. The vicinity of the seismic station and SW from the crater had been affected by acid rain. On 22 January visiting scientists observed another small explosion. Activity was low during field visits on 20 and 26 February.
A visit on 3 and 16 March found variable levels of gas emissions. Incandescence was observed within the new crater early on 21 March along with increased output gases. Shortly thereafter a loud explosion was heard, followed by a dark plume about 30 m high and increased glow, but no ashfall. Activity remained low in April.
INETER staff visited the volcano on 6 June and heard a strong jet-like sound, but fumarolic emissions were not abundant. Another visit on the night of 26 June revealed incandescence and landslides inside the crater. Visits to the volcano were made on 13, 16, and 25 July, but no volcanic activity was noted. On 15 July the Civil Defense in Leon informed INETER of sporadic gray ash columns that began the previous day. A local resident reported hearing an explosion at 0315 on 14 July, and saw five emissions of gas-and-ash later that day. This activity lasted until 15 July.
A visit on 15 September revealed little gas emission from the crater, but explosion noises were heard. On 25 October Civil Defense Leon was informed by several farmers that between approximately 0600 and 1000 local time they had observed a column of ash that drifted NW. INETER staff working in the area that day observed strong ash accompanied by expulsion of gas. Rumbling noises and explosions continued until 1430. On 22 November a visitor observed no change in the volcano. Minor ashfall was reported on the morning of 18 December, and the next day explosions were heard coming from the crater.
Activity during 2002. On 17 January 2002 visitors observed strong gas fumes. Observations on 7 March indicated that the crater was wider and deeper than in February. On a 10 July visit there were abundant gas emissions from the crater, a strong smell of sulfur, jet sounds, and noises of breaking rocks. Gas emissions were abundant on 23 August, with columns up to 300 m high, but no landslides, noises, sulfur odor, or incandescence was noted. Rockslides on the N wall of the crater and sulfur odors, along with typical fumarolic activity, were seen during September.
Visitors on 17 October reported abundant gas emissions and strong sulfur odors; noises similar to the movement of waves came from the crater bottom, and some incandescent points were seen. From 7 to 11 October large quantities of gases blew SE, damaging vegetation. Landslides were observed SW of the old crater. Fumarole temperatures were the highest recorded since 1999. Incandescence inside the crater was also observed over several days. Webcam observations in November and December showed intermittent small gas emissions.
Geologic Background. Telica, one of Nicaragua's most active volcanoes, has erupted frequently since the beginning of the Spanish era. This volcano group consists of several interlocking cones and vents with a general NW alignment. Sixteenth-century eruptions were reported at symmetrical Santa Clara volcano at the SW end of the group. However, its eroded and breached crater has been covered by forests throughout historical time, and these eruptions may have originated from Telica, whose upper slopes in contrast are unvegetated. The steep-sided cone of Telica is truncated by a 700-m-wide double crater; the southern crater, the source of recent eruptions, is 120 m deep. El Liston, immediately E, has several nested craters. The fumaroles and boiling mudpots of Hervideros de San Jacinto, SE of Telica, form a prominent geothermal area frequented by tourists, and geothermal exploration has occurred nearby.
Information Contacts: Dirección General de Geofísica, Instituto Nicaraguense de Estudios Territoriales (INETER), Apartado Postal 2110, Managua, Nicaragua (URL: http://www.ineter.gob.ni//geofisica.html).