Recently Published Bulletin Reports
Kadovar (Papua New Guinea) An ash plume and weak thermal anomaly during May 2023
San Miguel (El Salvador) Small gas-and-ash explosions during March and May 2023
Ebeko (Russia) Continued explosions, ash plumes, and ashfall during October 2022-May 2023
Home Reef (Tonga) Discolored plumes continued during November 2022-April 2023
Semisopochnoi (United States) Occasional explosions, ash deposits, and gas-and-steam plumes during December 2022-May 2023
Ambae (Vanuatu) New lava flow, ash plumes, and sulfur dioxide plumes during February-May 2023
Ibu (Indonesia) Daily ash explosions continue, along with thermal anomalies in the crater, October 2022-May 2023
Dukono (Indonesia) Continuing ash emissions, SO2 plumes, and thermal signals during October 2022-May 2023
Sabancaya (Peru) Explosions, gas-and-ash plumes, and thermal activity persist during November 2022-April 2023
Sheveluch (Russia) Significant explosions destroyed part of the lava-dome complex during April 2023
Bezymianny (Russia) Explosions, ash plumes, lava flows, and avalanches during November 2022-April 2023
Chikurachki (Russia) New explosive eruption during late January-early February 2023
Kadovar (Papua New Guinea) — June 2023  Cite this Report
Kadovar
Papua New Guinea
3.608°S, 144.588°E; summit elev. 365 m
All times are local (unless otherwise noted)
An ash plume and weak thermal anomaly during May 2023
Kadovar is a 2-km-wide island that is the emergent summit of a Bismarck Sea stratovolcano. It lies off the coast of New Guinea, about 25 km N of the mouth of the Sepik River. Prior to an eruption that began in 2018, a lava dome formed the high point of the volcano, filling an arcuate landslide scarp open to the S. Submarine debris-avalanche deposits occur to the S of the island. The current eruption began in January 2018 and has comprised lava effusion from vents at the summit and at the E coast; more recent activity has consisted of ash plumes, weak thermal activity, and gas-and-steam plumes (BGVN 48:02). This report covers activity during February through May 2023 using information from the Darwin Volcanic Ash Advisory Center (VAAC) and satellite data.
Activity during the reporting period was relatively low and mainly consisted of white gas-and-steam plumes that were visible in natural color satellite images on clear weather days (figure 67). According to a Darwin VAAC report, at 2040 on 6 May an ash plume rose to 4.6 km altitude and drifted W; by 2300 the plume had dissipated. MODIS satellite instruments using the MODVOLC thermal algorithm detected a single thermal hotspot on the SE side of the island on 7 May. Weak thermal activity was also detected in a satellite image on the E side of the island on 14 May, accompanied by a white gas-and-steam plume that drifted SE (figure 68).
Geologic Background. The 2-km-wide island of Kadovar is the emergent summit of a Bismarck Sea stratovolcano of Holocene age. It is part of the Schouten Islands, and lies off the coast of New Guinea, about 25 km N of the mouth of the Sepik River. Prior to an eruption that began in 2018, a lava dome formed the high point of the andesitic volcano, filling an arcuate landslide scarp open to the south; submarine debris-avalanche deposits occur in that direction. Thick lava flows with columnar jointing forms low cliffs along the coast. The youthful island lacks fringing or offshore reefs. A period of heightened thermal phenomena took place in 1976. An eruption began in January 2018 that included lava effusion from vents at the summit and at the E coast.
Information Contacts: Darwin Volcanic Ash Advisory Centre (VAAC), Bureau of Meteorology, Northern Territory Regional Office, PO Box 40050, Casuarina, NT 0811, Australia (URL: http://www.bom.gov.au/info/vaac/); Hawai'i Institute of Geophysics and Planetology (HIGP) - MODVOLC Thermal Alerts System, School of Ocean and Earth Science and Technology (SOEST), Univ. of Hawai'i, 2525 Correa Road, Honolulu, HI 96822, USA (URL: http://modis.higp.hawaii.edu/); Copernicus Browser, Copernicus Data Space Ecosystem, European Space Agency (URL: https://dataspace.copernicus.eu/browser/).
San Miguel (El Salvador) — June 2023 Cite this Report
San Miguel
El Salvador
13.434°N, 88.269°W; summit elev. 2130 m
All times are local (unless otherwise noted)
Small gas-and-ash explosions during March and May 2023
San Miguel in El Salvador is a broad, deep crater complex that has been frequently modified by eruptions recorded since the early 16th century and consists of the summit known locally as Chaparrastique. Flank eruptions have produced lava flows that extended to the N, NE, and SE during the 17-19th centuries. The most recent activity has consisted of minor ash eruptions from the summit crater. The current eruption period began in November 2022 and has been characterized by frequent phreatic explosions, gas-and-ash emissions, and sulfur dioxide plumes (BGVN 47:12). This report describes small gas-and-ash explosions during December 2022 through May 2023 based on special reports from the Ministero de Medio Ambiente y Recursos Naturales (MARN).
Activity has been relatively low since the last recorded explosions on 29 November 2022. Seismicity recorded by the San Miguel Volcano Station (VSM) located on the N flank at 1.7 km elevation had decreased by 7 December. Sulfur dioxide gas measurements taken with DOAS (Differential Optical Absorption Spectroscopy) mobile equipment were below typical previously recorded values: 300 tons per day (t/d). During December, small explosions were recorded by the seismic network and manifested as gas-and-steam emissions.
Gas-and-ash explosions in the crater occurred during January 2023, which were recorded by the seismic network. Sulfur dioxide values remained low, between 300-400 t/d through 10 March. At 0817 on 14 January a gas-and-ash emission was visible in webcam images, rising just above the crater rim. Some mornings during February, small gas-and-steam plumes were visible in the crater. On 7 March at 2252 MARN noted an increase in degassing from the central crater; gas emissions were constantly observed through the early morning hours on 8 March. During the early morning of 8 March through the afternoon on 9 March, 12 emissions were registered, some accompanied by ash. The last gas-and-ash emission was recorded at 1210 on 9 March; very fine ashfall was reported in El Tránsito (10 km S), La Morita (6 km W), and La Piedrita (3 km W). The smell of sulfur was reported in Piedra Azul (5 km SW). On 16 March MARN reported that gas-and-steam emissions decreased.
Low degassing and very low seismicity were reported during April; no explosions have been detected between 9 March and 27 May. The sulfur dioxide emissions remained between 350-400 t/d; during 13-20 April sulfur dioxide values fluctuated between 30-300 t/d. Activity remained low through most of May; on 23 May seismicity increased. An explosion was detected at 1647 on 27 May generated a gas-and-ash plume that rose 700 m high (figure 32); a decrease in seismicity and gas emissions followed. The DOAS station installed on the W flank recorded sulfur dioxide values that reached 400 t/d on 27 May; subsequent measurements showed a decrease to 268 t/d on 28 May and 100 t/d on 29 May.
Geologic Background. The symmetrical cone of San Miguel, one of the most active volcanoes in El Salvador, rises from near sea level to form one of the country's most prominent landmarks. A broad, deep, crater complex that has been frequently modified by eruptions recorded since the early 16th century caps the truncated unvegetated summit, also known locally as Chaparrastique. Flanks eruptions of the basaltic-andesitic volcano have produced many lava flows, including several during the 17th-19th centuries that extended to the N, NE, and SE. The SE-flank flows are the largest and form broad, sparsely vegetated lava fields crossed by highways and a railroad skirting the base of the volcano. Flank vent locations have migrated higher on the edifice during historical time, and the most recent activity has consisted of minor ash eruptions from the summit crater.
Information Contacts: Ministero de Medio Ambiente y Recursos Naturales (MARN), Km. 5½ Carretera a Nueva San Salvador, Avenida las Mercedes, San Salvador, El Salvador (URL: http://www.snet.gob.sv/ver/vulcanologia).
Ebeko
Russia
50.686°N, 156.014°E; summit elev. 1103 m
All times are local (unless otherwise noted)
Continued explosions, ash plumes, and ashfall during October 2022-May 2023
Ebeko, located on the N end of Paramushir Island in the Kuril Islands, consists of three summit craters along a SSW-NNE line at the northern end of a complex of five volcanic cones. Eruptions date back to the late 18th century and have been characterized as small-to-moderate explosions from the summit crater, accompanied by intense fumarolic activity. The current eruption period began in June 2022 and has recently consisted of frequent explosions, ash plumes, and thermal activity (BGVN 47:10). This report covers similar activity during October 2022 through May 2023, based on information from the Kamchatka Volcanic Eruptions Response Team (KVERT) and satellite data.
Activity during October consisted of explosive activity, ash plumes, and occasional thermal anomalies. Visual data by volcanologists from Severo-Kurilsk showed explosions producing ash clouds up to 2.1-3 km altitude which drifted E, N, NE, and SE during 1-8, 10, 16, and 18 October. KVERT issued several Volcano Observatory Notices for Aviation (VONA) on 7, 13-15, and 27 October 2022, stating that explosions generated ash plumes that rose to 2.3-4 km altitude and drifted 5 km E, NE, and SE. Ashfall was reported in Severo-Kurilsk (Paramushir Island, about 7 km E) on 7 and 13 October. Satellite data showed a thermal anomaly over the volcano on 15-16 October. Visual data showed ash plumes rising to 2.5-3.6 km altitude on 22, 25-29, and 31 October and moving NE due to constant explosions.
Similar activity continued during November, with explosions, ash plumes, and ashfall occurring. KVERT issued VONAs on 1-2, 4, 6-7, 9, 13, and 16 November that reported explosions and resulting ash plumes that rose to 1.7-3.6 km altitude and drifted 3-5 km SE, ESE, E, and NE. On 1 November ash plumes extended as far as 110 km SE. On 5, 8, 12, and 24-25 November explosions and ash plumes rose to 2-3.1 km altitude and drifted N and E. Ashfall was observed in Severo-Kurilsk on 7 and 16 November. A thermal anomaly was visible during 1-4, 16, and 20 November. Explosions during 26 November rose as high as 2.7 km altitude and drifted NE (figure 45).
Explosions and ash plumes continued to occur in December. During 1-2 and 4 December volcanologists from Severo-Kurilsk observed explosions that sent ash to 1.9-2.5 km altitude and drifted NE and SE (figure 46). VONAs were issued on 5, 9, and 16 December reporting that explosions generated ash plumes rising to 1.9 km, 2.6 km, and 2.4 km altitude and drifted 5 km SE, E, and NE, respectively. A thermal anomaly was visible in satellite imagery on 16 December. On 18 and 27-28 December explosions produced ash plumes that rose to 2.5 km altitude and drifted NE and SE. On 31 December an ash plume rose to 2 km altitude and drifted NE.
Explosions continued during January 2023, based on visual observations by volcanologists from Severo-Kurilsk. During 1-7 January explosions generated ash plumes that rose to 4 km altitude and drifted NE, E, W, and SE. According to VONAs issued by KVERT on 2, 4, 10, and 23 January, explosions produced ash plumes that rose to 2-4 km altitude and drifted 5 km N, NE, E, and ENE; the ash plume that rose to 4 km altitude occurred on 10 January (figure 47). Satellite data showed a thermal anomaly during 3-4, 10, 13, 16, 21, 22, and 31 January. KVERT reported that an ash cloud on 4 January moved 12 km NE. On 6 and 9-11 January explosions sent ash plumes to 4.5 km altitude and drifted W and ESE. On 13 January an ash plume rose to 3 km altitude and drifted SE. During 20-24 January ash plumes from explosions rose to 3.7 km altitude and drifted SE, N, and NE. On 21 January the ash plume drifted as far as 40 km NE. During 28-29 and 31 January and 1 February ash plumes rose to 4 km altitude and drifted NE.
During February, explosions, ash plumes, and ashfall were reported. During 1, 4-5 and 7-8 February explosions generated ash plumes that rose to 4.5 km altitude and drifted E and NE; ashfall was observed on 5 and 8 February. On 6 February an explosion produced an ash plume that rose to 3 km altitude and drifted 7 km E, causing ashfall in Severo-Kurilsk. A thermal anomaly was visible in satellite data on 8, 9, 13, and 21 February. Explosions on 9 and 12-13 February produced ash plumes that rose to 4 km altitude and drifted E and NE; the ash cloud on 12 February extended as far as 45 km E. On 22 February explosions sent ash to 3 km altitude that drifted E. During 24 and 26-27 February ash plumes rose to 4 km altitude and drifted E. On 28 February an explosion sent ash to 2.5-3 km altitude and drifted 5 km E; ashfall was observed in Severo-Kurilsk.
Activity continued during March; visual observations showed that explosions generated ash plumes that rose to 3.6 km altitude on 3, 5-7, and 9-12 March and drifted E, NE, and NW. Thermal anomalies were visible on 10, 13, and 29-30 March in satellite imagery. On 18, 21-23, 26, and 29-30 March explosions produced ash plumes that rose to 2.8 km altitude and drifted NE and E; the ash plumes during 22-23 March extended up to 76 km E. A VONA issued on 21 March reported an explosion that produced an ash plume that rose to 2.8 km altitude and drifted 5 km E. Another VONA issued on 23 March reported that satellite data showed an ash plume rising to 3 km altitude and drifted 14 km E.
Explosions during April continued to generate ash plumes. On 1 and 4 April an ash plume rose to 2.8-3.5 km altitude and drifted SE and NE. A thermal anomaly was visible in satellite imagery during 1-6 April. Satellite data showed ash plumes and clouds rising to 2-3 km altitude and drifting up to 12 km SW and E on 3 and 6 April (figure 48). KVERT issued VONAs on 3, 5, 14, 16 April describing explosions that produced ash plumes rising to 3 km, 3.5 km, 3.5 km, and 3 km altitude and drifting 5 km S, 5 km NE and SE, 72 km NNE, and 5 km NE, respectively. According to satellite data, the resulting ash cloud from the explosion on 14 April was 25 x 7 km in size and drifted 72-104 km NNE during 14-15 April. According to visual data by volcanologists from Severo-Kurilsk explosions sent ash up to 3.5 km altitude that drifted NE and E during 15-16, 22, 25-26, and 29 April.
The explosive eruption continued during May. Explosions during 3-4, 6-7, and 9-10 May generated ash plumes that rose to 4 km altitude and drifted SW and E. Satellite data showed a thermal anomaly on 3, 9, 13-14, and 24 May. During 12-16, 23-25, and 27-28 May ash plumes rose to 3.5 km altitude and drifted in different directions due to explosions. Two VONA notices were issued on 16 and 25 May, describing explosions that generated ash plumes rising to 3 km and 3.5 km altitude, respectively and extending 5 km E. The ash cloud on 25 May drifted 75 km SE.
Thermal activity in the summit crater, occasionally accompanied by ash plumes and ash deposits on the SE and E flanks due to frequent explosions, were visible in infrared and true color satellite images (figure 49).
Geologic Background. The flat-topped summit of the central cone of Ebeko volcano, one of the most active in the Kuril Islands, occupies the northern end of Paramushir Island. Three summit craters located along a SSW-NNE line form Ebeko volcano proper, at the northern end of a complex of five volcanic cones. Blocky lava flows extend west from Ebeko and SE from the neighboring Nezametnyi cone. The eastern part of the southern crater contains strong solfataras and a large boiling spring. The central crater is filled by a lake about 20 m deep whose shores are lined with steaming solfataras; the northern crater lies across a narrow, low barrier from the central crater and contains a small, cold crescentic lake. Historical activity, recorded since the late-18th century, has been restricted to small-to-moderate explosive eruptions from the summit craters. Intense fumarolic activity occurs in the summit craters, on the outer flanks of the cone, and in lateral explosion craters.
Information Contacts: Kamchatka Volcanic Eruptions Response Team (KVERT), Far Eastern Branch, Russian Academy of Sciences, 9 Piip Blvd., Petropavlovsk-Kamchatsky, 683006, Russia (URL: http://www.kscnet.ru/ivs/kvert/); MIROVA (Middle InfraRed Observation of Volcanic Activity), a collaborative project between the Universities of Turin and Florence (Italy) supported by the Centre for Volcanic Risk of the Italian Civil Protection Department (URL: http://www.mirovaweb.it/); Copernicus Browser, Copernicus Data Space Ecosystem, European Space Agency (URL: https://dataspace.copernicus.eu/browser/).
Home Reef
Tonga
18.992°S, 174.775°W; summit elev. -10 m
All times are local (unless otherwise noted)
Discolored plumes continued during November 2022-April 2023
Home Reef is a submarine volcano located in the central Tonga islands between Lateiki (Metis Shoal) and Late Island. The first recorded eruption occurred in the mid-19th century, when an ephemeral island formed. An eruption in 1984 produced a 12-km-high eruption plume, a large volume of floating pumice, and an ephemeral island 500 x 1,500 m wide, with cliffs 30-50 m high that enclosed a water-filled crater. Another island-forming eruption in 2006 produced widespread pumice rafts that drifted as far as Australia; by 2008 the island had eroded below sea level. The previous eruption occurred during October 2022 and was characterized by a new island-forming eruption, lava effusion, ash plumes, discolored water, and gas-and-steam plumes (BGVN 47:11). This report covers discolored water plumes during November 2022 through April 2023 using satellite data.
Discolored plumes continued during the reporting period and were observed in true color satellite images on clear weather days. Satellite images show light green-yellow discolored water extending W on 8 and 28 November 2022 (figure 31), and SW on 18 November. Light green-yellow plumes extended W on 3 December, S on 13 December, SW on 18 December, and W and S on 23 December (figure 31). On 12 January 2023 discolored green-yellow plumes extended to the NE, E, SE, and N. The plume moved SE on 17 January and NW on 22 January. Faint discolored water in February was visible moving NE on 1 February. A discolored plume extended NW on 8 and 28 March and NW on 13 March (figure 31). During April, clear weather showed green-blue discolored plumes moving S on 2 April, W on 7 April, and NE and S on 12 April. A strong green-yellow discolored plume extended E and NE on 22 April for several kilometers (figure 31).
Geologic Background. Home Reef, a submarine volcano midway between Metis Shoal and Late Island in the central Tonga islands, was first reported active in the mid-19th century, when an ephemeral island formed. An eruption in 1984 produced a 12-km-high eruption plume, large amounts of floating pumice, and an ephemeral 500 x 1,500 m island, with cliffs 30-50 m high that enclosed a water-filled crater. In 2006 an island-forming eruption produced widespread dacitic pumice rafts that drifted as far as Australia. Another island was built during a September-October 2022 eruption.
Information Contacts: Copernicus Browser, Copernicus Data Space Ecosystem, European Space Agency (URL: https://dataspace.copernicus.eu/browser/).
Semisopochnoi (United States) — June 2023 Cite this Report
Semisopochnoi
United States
51.93°N, 179.58°E; summit elev. 1221 m
All times are local (unless otherwise noted)
Occasional explosions, ash deposits, and gas-and-steam plumes during December 2022-May 2023
Semisopochnoi is located in the western Aleutians, is 20-km-wide at sea level, and contains an 8-km-wide caldera. The three-peaked Mount Young (formerly Cerberus) was constructed within the caldera during the Holocene. Each of these peaks contains a summit crater; the lava flows on the N flank appear younger than those on the S side. The current eruption period began in early February 2021 and has more recently consisted of intermittent explosions and ash emissions (BGVN 47:12). This report updates activity during December 2022 through May 2023 using daily, weekly, and special reports from the Alaska Volcano Observatory (AVO). AVO monitors the volcano using local seismic and infrasound sensors, satellite data, web cameras, and remote infrasound and lightning networks.
Activity during most of December 2022 was relatively quiet; according to AVO no eruptive or explosive activity was observed since 7 November 2022. Intermittent tremor and occasional small earthquakes were observed in geophysical data. Continuous gas-and-steam emissions were observed from the N crater of Mount Young in webcam images on clear weather days (figure 25). On 24 December, there was a slight increase in earthquake activity and several small possible explosion signals were detected in infrasound data. Eruptive activity resumed on 27 December at the N crater of Mount Young; AVO issued a Volcano Activity Notice (VAN) that reported minor ash deposits on the flanks of Mount Young that extended as far as 1 km from the vent, according to webcam images taken during 27-28 December (figure 26). No ash plumes were observed in webcam or satellite imagery, but a persistent gas-and-steam plume that might have contained some ash rose to 1.5 km altitude. As a result, AVO raised the Aviation Color Code (ACC) to Orange (the second highest level on a four-color scale) and the Volcano Alert Level (VAL) to Watch (the second highest level on a four-level scale). Possible explosions were detected during 21 December 2022 through 1 January 2023 and seismic tremor was recorded during 30-31 December.
During January 2023 eruptive activity continued at the active N crater of Mount Young. Minor ash deposits were observed on the flanks, extending about 2 km SSW, based on webcam images from 1 and 3 January. A possible explosion occurred during 1-2 January based on elevated seismicity recorded on local seismometers and an infrasound signal recorded minutes later by an array at Adak. Though no ash plumes were observed in webcam or satellite imagery, a persistent gas-and-steam plume rose to 1.5 km altitude that might have carried minor traces of ash. Ash deposits were accompanied by periods of elevated seismicity and infrasound signals from the local geophysical network, which AVO reported were likely due to weak explosive activity. Low-level explosive activity was also detected during 2-3 January, with minor gas-and-steam emissions and a new ash deposit that was visible in webcam images. Low-level explosive activity was detected in geophysical data during 4-5 January, with elevated seismicity and infrasound signals observed on local stations. Volcanic tremor was detected during 7-9 January and very weak explosive activity was detected in seismic and infrasound data on 9 January. Weak seismic and infrasound signals were recorded on 17 January, which indicated minor explosive activity, but no ash emissions were observed in clear webcam images; a gas-and-steam plume continued to rise to 1.5 km altitude. During 29-30 January, ash deposits near the summit were observed on fresh snow, according to webcam images.
The active N cone at Mount Young continued to produce a gas-and-steam plume during February, but no ash emissions or explosive events were detected. Seismicity remained elevated with faint tremor during early February. Gas-and-steam emissions from the N crater were observed in clear webcam images on 11-13 and 16 February; no explosive activity was detected in seismic, infrasound, or satellite data. Seismicity has also decreased, with no significant seismic tremor observed since 25 January. Therefore, the ACC was lowered to Yellow (the second lowest level on a four-color scale) and the VAL was lowered to Advisory (the second lowest level on a four-color scale) on 22 February.
Gas-and-steam emissions persisted during March from the N cone of Mount Young, based on clear webcam images. A few brief episodes of weak tremor were detected in seismic data, although seismicity decreased over the month. A gas-and-steam plume detected in satellite data extended 150 km on 18 March. Low-level ash emissions from the N cone at Mount Young were observed in several webcam images during 18-19 March, in addition to small explosions and volcanic tremor. The ACC was raised to Orange and the VAL increased to Watch on 19 March. A small explosion was detected in seismic and infrasound data on 21 March.
Low-level unrest continued during April, although cloudy weather often obscured views of the summit; periods of seismic tremor and local earthquakes were recorded. During 3-4 April a gas-and-steam plume was visible traveling more than 200 km overnight; no ash was evident in the plume, according to AVO. A gas-and-steam plume was observed during 4-6 April that extended 400 km but did not seem to contain ash. Small explosions were detected in seismic and infrasound data on 5 April. Occasional clear webcam images showed continuing gas-and-steam emissions rose from Mount Young, but no ash deposits were observed on the snow. On 19 April small explosions and tremor were detected in seismic and infrasound data. A period of seismic tremor was detected during 22-25 April, with possible weak explosions on 25 April. Ash deposits were visible near the crater rim, but it was unclear if these deposits were recent or due to older deposits.
Occasional small earthquakes were recorded during May, but there were no signs of explosive activity seen in geophysical data. Gas-and-steam emissions continued from the N crater of Mount Young, based on webcam images, and seismicity remained slightly elevated. A new, light ash deposit was visible during the morning of 5 May on fresh snow on the NW flank of Mount Young. During 10 May periods of volcanic tremor were observed. The ACC was lowered to Yellow and the VAL to Advisory on 17 May due to no additional evidence of activity.
Geologic Background. Semisopochnoi, the largest subaerial volcano of the western Aleutians, is 20 km wide at sea level and contains an 8-km-wide caldera. It formed as a result of collapse of a low-angle, dominantly basaltic volcano following the eruption of a large volume of dacitic pumice. The high point of the island is Anvil Peak, a double-peaked late-Pleistocene cone that forms much of the island's northern part. The three-peaked Mount Cerberus (renamed Mount Young in 2023) was constructed within the caldera during the Holocene. Each of the peaks contains a summit crater; lava flows on the N flank appear younger than those on the south side. Other post-caldera volcanoes include the symmetrical Sugarloaf Peak SSE of the caldera and Lakeshore Cone, a small cinder cone at the edge of Fenner Lake in the NE part of the caldera. Most documented eruptions have originated from Young, although Coats (1950) considered that both Sugarloaf and Lakeshore Cone could have been recently active.
Information Contacts: Alaska Volcano Observatory (AVO), a cooperative program of a) U.S. Geological Survey, 4200 University Drive, Anchorage, AK 99508-4667 USA (URL: https://avo.alaska.edu/), b) Geophysical Institute, University of Alaska, PO Box 757320, Fairbanks, AK 99775-7320, USA, and c) Alaska Division of Geological & Geophysical Surveys, 794 University Ave., Suite 200, Fairbanks, AK 99709, USA (URL: http://dggs.alaska.gov/).
Ambae
Vanuatu
15.389°S, 167.835°E; summit elev. 1496 m
All times are local (unless otherwise noted)
New lava flow, ash plumes, and sulfur dioxide plumes during February-May 2023
Ambae, also known as Aoba, is a large basaltic shield volcano in Vanuatu. A broad pyroclastic cone containing three crater lakes (Manaro Ngoru, Voui, and Manaro Lakua) is located at the summit within the youngest of at least two nested calderas. Periodic phreatic and pyroclastic explosions have been reported since the 16th century. A large eruption more than 400 years ago resulted in a volcanic cone within the summit crater that is now filled by Lake Voui; the similarly sized Lake Manaro fills the western third of the caldera. The previous eruption ended in August 2022 that was characterized by gas-and-steam and ash emissions and explosions of wet tephra (BGVN 47:10). This report covers a new eruption during February through May 2023 that consisted of a new lava flow, ash plumes, and sulfur dioxide emissions, using information from the Vanuatu Meteorology and Geo-Hazards Department (VMGD) and satellite data.
During the reporting period, the Alert Level remained at a 2 (on a scale of 0-5), which has been in place since December 2021. Activity during October 2022 through March 2023 remained relatively low and mostly consisted of gas-and-steam emissions in Lake Voui. VMGD reported that at 1300 on 15 November a satellite image captured a strong amount of sulfur dioxide rising above the volcano (figure 99), and that seismicity slightly increased. The southern and northern part of the island reported a strong sulfur dioxide smell and heard explosions. On 20 February 2023 a gas-and-ash plume rose 1.3 km above the summit and drifted SSW, according to a webcam image (figure 100). Gas-and-steam and possibly ash emissions continued on 23 February and volcanic earthquakes were recorded by the seismic network.
During April, volcanic earthquakes and gas-and-steam and ash emissions were reported from the cone in Lake Voui. VMGD reported that activity increased during 5-7 April; high gas-and-steam and ash plumes were visible, accompanied by nighttime incandescence. According to a Wellington VAAC report, a low-level ash plume rose as high as 2.5 km above the summit and drifted W and SW on 5 April, based on satellite imagery. Reports in Saratamata stated that a dark ash plume drifted to the WSW, but no loud explosion was heard. Webcam images from 2100 showed incandescence above the crater and reflected in the clouds. According to an aerial survey, field observations, and satellite data, water was no longer present in the lake. A lava flow was reported effusing from the vent and traveling N into the dry Lake Voui, which lasted three days. The next morning at 0745 on 6 April a gas-and-steam and ash plume rose 5.4 km above the summit and drifted ESE, based on information from VMGD (figure 101). The Wellington VAAC also reported that light ashfall was observed on the island. Intermittent gas-and-steam and ash emissions were visible on 7 April, some of which rose to an estimated 3 km above the summit and drifted E. Webcam images during 0107-0730 on 7 April showed continuing ash emissions. A gas-and-steam and ash plume rose 695 m above the summit crater at 0730 on 19 April and drifted ESE, based on a webcam image (figure 102).
According to visual and infrared satellite data, water was visible in Lake Voui as late as 24 March 2023 (figure 103). The vent in the caldera showed a gas-and-steam plume drifted SE. On 3 April thermal activity was first detected, accompanied by a gas-and-ash plume that drifted W (figure 103). The lava flow moved N within the dry lake and was shown cooling by 8 April. By 23 April much of the water in the lake had returned. Occasional sulfur dioxide plumes were detected by the TROPOMI instrument on the Sentinel-5P satellite that exceeded 2 Dobson Units (DU) and drifted in different directions (figure 104).
Geologic Background. The island of Ambae, also known as Aoba, is a massive 2,500 km3 basaltic shield that is the most voluminous volcano of the New Hebrides archipelago. A pronounced NE-SW-trending rift zone with numerous scoria cones gives the 16 x 38 km island an elongated form. A broad pyroclastic cone containing three crater lakes (Manaro Ngoru, Voui, and Manaro Lakua) is located at the summit within the youngest of at least two nested calderas, the largest of which is 6 km in diameter. That large central edifice is also called Manaro Voui or Lombenben volcano. Post-caldera explosive eruptions formed the summit craters about 360 years ago. A tuff cone was constructed within Lake Voui (or Vui) about 60 years later. The latest known flank eruption, about 300 years ago, destroyed the population of the Nduindui area near the western coast.
Information Contacts: Geo-Hazards Division, Vanuatu Meteorology and Geo-Hazards Department (VMGD), Ministry of Climate Change Adaptation, Meteorology, Geo-Hazards, Energy, Environment and Disaster Management, Private Mail Bag 9054, Lini Highway, Port Vila, Vanuatu (URL: http://www.vmgd.gov.vu/, https://www.facebook.com/VanuatuGeohazardsObservatory/); Wellington Volcanic Ash Advisory Centre (VAAC), Meteorological Service of New Zealand Ltd (MetService), PO Box 722, Wellington, New Zealand (URL: http://www.metservice.com/vaac/, http://www.ssd.noaa.gov/VAAC/OTH/NZ/messages.html); MIROVA (Middle InfraRed Observation of Volcanic Activity), a collaborative project between the Universities of Turin and Florence (Italy) supported by the Centre for Volcanic Risk of the Italian Civil Protection Department (URL: http://www.mirovaweb.it/); Global Sulfur Dioxide Monitoring Page, Atmospheric Chemistry and Dynamics Laboratory, NASA Goddard Space Flight Center (NASA/GSFC), 8800 Greenbelt Road, Goddard, Maryland, USA (URL: https://so2.gsfc.nasa.gov/); Copernicus Browser, Copernicus Data Space Ecosystem, European Space Agency (URL: https://dataspace.copernicus.eu/browser/).
Ibu
Indonesia
1.488°N, 127.63°E; summit elev. 1325 m
All times are local (unless otherwise noted)
Daily ash explosions continue, along with thermal anomalies in the crater, October 2022-May 2023
Persistent eruptive activity since April 2008 at Ibu, a stratovolcano on Indonesian’s Halmahera Island, has consisted of daily explosive ash emissions and plumes, along with observations of thermal anomalies (BGVN 47:04). The current eruption continued during October 2022-May 2023, described below, based on advisories issued by the Pusat Vulkanologi dan Mitigasi Bencana Geologi (PVMBG, also known as Indonesian Center for Volcanology and Geological Hazard Mitigation, CVGHM), daily reports by MAGMA Indonesia (a PVMBG platform), and the Darwin Volcanic Ash Advisory Centre (VAAC), and various satellite data. The Alert Level during the reporting period remained at 2 (on a scale of 1-4), except raised briefly to 3 on 27 May, and the public was warned to stay at least 2 km away from the active crater and 3.5 km away on the N side of the volcano.
According to MAGMA Indonesia, during October 2022-May 2023, daily gray-and-white ash plumes of variable densities rose 200-1,000 m above the summit and drifted in multiple directions. On 30 October and 11 November, plumes rose a maximum of 2 km and 1.5 km above the summit, respectively (figures 42 and 43). According to the Darwin VAAC, discrete ash emissions on 13 November rose to 2.1 km altitude, or 800 m above the summit, and drifted W, and multiple ash emissions on 15 November rose 1.4 km above the summit and drifted NE. Occasional larger ash explosions through May 2023 prompted PVMBG to issue Volcano Observatory Notice for Aviation (VONA) alerts (table 6); the Aviation Color Code remained at Orange throughout this period.
Table 6. Volcano Observatory Notice for Aviation (VONA) ash plume alerts for Ibu issued by PVMBG during October 2022-May 2023. Maximum height above the summit was estimated by a ground observer. VONAs in January-May 2023 all described the ash plumes as dense.
| Date |
Time (local) |
Max height above summit |
Direction |
| 17 Oct 2022 |
0858 |
800 m |
SW |
| 18 Oct 2022 |
1425 |
800 m |
S |
| 19 Oct 2022 |
2017 |
600 m |
SW |
| 21 Oct 2022 |
0916 |
800 m |
NW |
| 16 Jan 2023 |
1959 |
600 m |
NE |
| 22 Jan 2023 |
0942 |
1,000 m |
E |
| 29 Jan 2023 |
2138 |
1,000 m |
E |
| 10 May 2023 |
0940 |
800 m |
NW |
| 10 May 2023 |
2035 |
600 m |
E |
| 21 May 2023 |
2021 |
600 m |
W |
| 21 May 2023 |
2140 |
1,000 m |
W |
| 29 May 2023 |
1342 |
800 m |
N |
| 31 May 2023 |
1011 |
1,000 m |
SW |
Sentinel-2 L1C satellite images throughout the reporting period show two, sometimes three persistent thermal anomalies in the summit crater, with the most prominent hotspot from the top of a cone within the crater. Clear views were more common during March-April 2023, when a vent and lava flows on the NE flank of the intra-crater cone could be distinguished (figure 44). White-to-grayish emissions were also observed during brief periods when weather clouds allowed clear views.
The MIROVA space-based volcano hotspot detection system recorded almost daily thermal anomalies throughout the reporting period, though cloud cover often interfered with detections. Data from imaging spectroradiometers aboard NASA’s Aqua and Terra satellites and processed using the MODVOLC algorithm (MODIS-MODVOLC) recorded hotspots on one day during October 2022 and December 2022, two days in April 2023, three days in November 2022 and May 2023, and four days in March 2023.
Geologic Background. The truncated summit of Gunung Ibu stratovolcano along the NW coast of Halmahera Island has large nested summit craters. The inner crater, 1 km wide and 400 m deep, has contained several small crater lakes. The 1.2-km-wide outer crater is breached on the N, creating a steep-walled valley. A large cone grew ENE of the summit, and a smaller one to the WSW has fed a lava flow down the W flank. A group of maars is located below the N and W flanks. The first observed and recorded eruption was a small explosion from the summit crater in 1911. Eruptive activity began again in December 1998, producing a lava dome that eventually covered much of the floor of the inner summit crater along with ongoing explosive ash emissions.
Information Contacts: Pusat Vulkanologi dan Mitigasi Bencana Geologi (PVMBG, also known as Indonesian Center for Volcanology and Geological Hazard Mitigation, CVGHM), Jalan Diponegoro 57, Bandung 40122, Indonesia (URL: http://www.vsi.esdm.go.id/); MAGMA Indonesia (Multiplatform Application for Geohazard Mitigation and Assessment in Indonesia), Kementerian Energi dan Sumber Daya Mineral (URL: https://magma.esdm.go.id/v1); Copernicus Browser, Copernicus Data Space Ecosystem, European Space Agency (URL: https://dataspace.copernicus.eu/browser/); MIROVA (Middle InfraRed Observation of Volcanic Activity), a collaborative project between the Universities of Turin and Florence (Italy) supported by the Centre for Volcanic Risk of the Italian Civil Protection Department (URL: http://www.mirovaweb.it/); Hawai'i Institute of Geophysics and Planetology (HIGP) - MODVOLC Thermal Alerts System, School of Ocean and Earth Science and Technology (SOEST), Univ. of Hawai'i, 2525 Correa Road, Honolulu, HI 96822, USA (URL: http://modis.higp.hawaii.edu/).
Dukono
Indonesia
1.6992°N, 127.8783°E; summit elev. 1273 m
All times are local (unless otherwise noted)
Continuing ash emissions, SO2 plumes, and thermal signals during October 2022-May 2023
Dukono, a remote volcano on Indonesia’s Halmahera Island, has been erupting continuously since 1933, with frequent ash explosions and sulfur dioxide plumes (BGVN 46:11, 47:10). This activity continued during October 2022 through May 2023, based on reports from the Pusat Vulkanologi dan Mitigasi Bencana Geologi (PVMBG; also known as Indonesian Center for Volcanology and Geological Hazard Mitigation, CVGHM), the Darwin Volcanic Ash Advisory Centre (VAAC), and satellite data. During this period, the Alert Level remained at 2 (on a scale of 1-4) and the public was warned to remain outside of the 2-km exclusion zone. The highest reported plume of the period reached 9.4 km above the summit on 14 November 2022.
According to MAGMA Indonesia (a platform developed by PVMBG), white, gray, or dark plumes of variable densities were observed almost every day during the reporting period, except when fog obscured the volcano (figure 33). Plumes generally rose 25-450 m above the summit, but rose as high as 700-800 m on several days, somewhat lower than the maximum heights reached earlier in 2022 when plumes reached as high as 1 km. However, the Darwin VAAC reported that on 14 November 2022, a discrete ash plume rose 9.4 km above the summit (10.7 km altitude), accompanied by a strong hotspot and a sulfur dioxide signal observed in satellite imagery; a continuous ash plume that day and through the 15th rose to 2.1-2.4 km altitude and drifted NE.
Sentinel-2 images were obscured by weather clouds almost every viewing day during the reporting period. However, the few reasonably clear images showed a hotspot and white or gray emissions and plumes. Strong SO2 plumes from Dukono were present on many days during October 2022-May 2023, as detected using the TROPOMI instrument on the Sentinel-5P satellite (figure 34).
Geologic Background. Reports from this remote volcano in northernmost Halmahera are rare, but Dukono has been one of Indonesia's most active volcanoes. More-or-less continuous explosive eruptions, sometimes accompanied by lava flows, have occurred since 1933. During a major eruption in 1550 CE, a lava flow filled in the strait between Halmahera and the N-flank Gunung Mamuya cone. This complex volcano presents a broad, low profile with multiple summit peaks and overlapping craters. Malupang Wariang, 1 km SW of the summit crater complex, contains a 700 x 570 m crater that has also been active during historical time.
Information Contacts: Pusat Vulkanologi dan Mitigasi Bencana Geologi (PVMBG, also known as Indonesian Center for Volcanology and Geological Hazard Mitigation, CVGHM), Jalan Diponegoro 57, Bandung 40122, Indonesia (URL: http://www.vsi.esdm.go.id/); MAGMA Indonesia (Multiplatform Application for Geohazard Mitigation and Assessment in Indonesia), Kementerian Energi dan Sumber Daya Mineral (URL: https://magma.esdm.go.id/v1); Darwin Volcanic Ash Advisory Centre (VAAC), Bureau of Meteorology, Northern Territory Regional Office, PO Box 40050, Casuarina, NT 0811, Australia (URL: http://www.bom.gov.au/info/vaac/); NASA Global Sulfur Dioxide Monitoring Page, Atmospheric Chemistry and Dynamics Laboratory, NASA Goddard Space Flight Center (NASA/GSFC), 8800 Greenbelt Road, Goddard, Maryland, USA (URL: https://so2.gsfc.nasa.gov/); Sentinel Hub Playground (URL: https://www.sentinel-hub.com/explore/sentinel-playground).
Sabancaya
Peru
15.787°S, 71.857°W; summit elev. 5960 m
All times are local (unless otherwise noted)
Explosions, gas-and-ash plumes, and thermal activity persist during November 2022-April 2023
Sabancaya is located in Peru, NE of Ampato and SE of Hualca Hualca. Eruptions date back to 1750 and have been characterized by explosions, phreatic activity, ash plumes, and ashfall. The current eruption period began in November 2016 and has more recently consisted of daily explosions, gas-and-ash plumes, and thermal activity (BGVN 47:11). This report updates activity during November 2022 through April 2023 using information from Instituto Geophysico del Peru (IGP) that use weekly activity reports and various satellite data.
Intermittent low-to-moderate power thermal anomalies were reported by the MIROVA project during November 2022 through April 2023 (figure 119). There were few short gaps in thermal activity during mid-December 2022, late December-to-early January 2023, late January to mid-February, and late February. According to data recorded by the MODVOLC thermal algorithm, there were a total of eight thermal hotspots: three in November 2022, three in February 2023, one in March, and one in April. On clear weather days, some of this thermal anomaly was visible in infrared satellite imagery showing the active lava dome in the summit crater (figure 120). Almost daily moderate-to-strong sulfur dioxide plumes were recorded during the reporting period by the TROPOMI instrument on the Sentinel-5P satellite (figure 121). Many of these plumes exceeded 2 Dobson Units (DU) and drifted in multiple directions.
IGP reported that moderate activity during November and December 2022 continued; during November, an average number of explosions were reported each week: 30, 33, 36, and 35, and during December, it was 32, 40, 47, 52, and 67. Gas-and-ash plumes in November rose 3-3.5 km above the summit and drifted E, NE, SE, S, N, W, and SW. During December the gas-and-ash plumes rose 2-4 km above the summit and drifted in different directions. There were 1,259 volcanic earthquakes recorded during November and 1,693 during December. Seismicity also included volcano-tectonic-type events that indicate rock fracturing events. Slight inflation was observed in the N part of the volcano near Hualca Hualca (4 km N). Thermal activity was frequently reported in the crater at the active lava dome (figure 120).
Explosive activity continued during January and February 2023. The average number of explosions were reported each week during January (51, 50, 60, and 59) and February (43, 54, 51, and 50). Gas-and-ash plumes rose 1.6-2.9 km above the summit and drifted NW, SW, and W during January and rose 1.4-2.8 above the summit and drifted W, SW, E, SE, N, S, NW, and NE during February. IGP also detected 1,881 volcanic earthquakes during January and 1,661 during February. VT-type earthquakes were also reported. Minor inflation persisted near Hualca Hualca. Satellite imagery showed continuous thermal activity in the crater at the lava dome (figure 120).
During March, the average number of explosions each week was 46, 48, 31, 35, and 22 and during April, it was 29, 41, 31, and 27. Accompanying gas-and-ash plumes rose 1.7-2.6 km above the summit crater and drifted W, SW, NW, S, and SE during March. According to a Buenos Aires Volcano Ash Advisory Center (VAAC) notice, on 22 March at 1800 through 23 March an ash plume rose to 7 km altitude and drifted NW. By 0430 an ash plume rose to 7.6 km altitude and drifted W. On 24 and 26 March continuous ash emissions rose to 7.3 km altitude and drifted SW and on 28 March ash emissions rose to 7.6 km altitude. During April, gas-and-ash plumes rose 1.6-2.5 km above the summit and drifted W, SW, S, NW, NE, and E. Frequent volcanic earthquakes were recorded, with 1,828 in March and 1,077 in April, in addition to VT-type events. Thermal activity continued to be reported in the summit crater at the lava dome (figure 120).
Geologic Background. Sabancaya, located in the saddle NE of Ampato and SE of Hualca Hualca volcanoes, is the youngest of these volcanic centers and the only one to have erupted in historical time. The oldest of the three, Nevado Hualca Hualca, is of probable late-Pliocene to early Pleistocene age. The name Sabancaya (meaning "tongue of fire" in the Quechua language) first appeared in records in 1595 CE, suggesting activity prior to that date. Holocene activity has consisted of Plinian eruptions followed by emission of voluminous andesitic and dacitic lava flows, which form an extensive apron around the volcano on all sides but the south. Records of historical eruptions date back to 1750.
Information Contacts: Instituto Geofisico del Peru (IGP), Centro Vulcanológico Nacional (CENVUL), Calle Badajoz N° 169 Urb. Mayorazgo IV Etapa, Ate, Lima 15012, Perú (URL: https://www.igp.gob.pe/servicios/centro-vulcanologico-nacional/inicio); Buenos Aires Volcanic Ash Advisory Center (VAAC), Servicio Meteorológico Nacional-Fuerza Aérea Argentina, 25 de mayo 658, Buenos Aires, Argentina (URL: http://www.smn.gov.ar/vaac/buenosaires/inicio.php); MIROVA (Middle InfraRed Observation of Volcanic Activity), a collaborative project between the Universities of Turin and Florence (Italy) supported by the Centre for Volcanic Risk of the Italian Civil Protection Department (URL: http://www.mirovaweb.it/); Hawai'i Institute of Geophysics and Planetology (HIGP) - MODVOLC Thermal Alerts System, School of Ocean and Earth Science and Technology (SOEST), Univ. of Hawai'i, 2525 Correa Road, Honolulu, HI 96822, USA (URL: http://modis.higp.hawaii.edu/); NASA Global Sulfur Dioxide Monitoring Page, Atmospheric Chemistry and Dynamics Laboratory, NASA Goddard Space Flight Center (NASA/GSFC), 8800 Greenbelt Road, Goddard MD 20771, USA (URL: https://so2.gsfc.nasa.gov/); Copernicus Browser, Copernicus Data Space Ecosystem, European Space Agency (URL: https://dataspace.copernicus.eu/browser/).
Sheveluch
Russia
56.653°N, 161.36°E; summit elev. 3283 m
All times are local (unless otherwise noted)
Significant explosions destroyed part of the lava-dome complex during April 2023
Sheveluch (also spelled Shiveluch) in Kamchatka, has had at least 60 large eruptions during the last 10,000 years. The summit is truncated by a broad 9-km-wide caldera that is breached to the S, and many lava domes occur on the outer flanks. The lava dome complex was constructed within the large open caldera. Frequent collapses of the dome complex have produced debris avalanches; the resulting deposits cover much of the caldera floor. A major south-flank collapse during a 1964 Plinian explosion produced a scarp in which a “Young Sheveluch” dome began to form in 1980. Repeated episodes of dome formation and destruction since then have produced major and minor ash plumes, pyroclastic flows, block-and-ash flows, and “whaleback domes” of spine-like extrusions in 1993 and 2020 (BGVN 45:11). The current eruption period began in August 1999 and has more recently consisted of lava dome growth, explosions, ash plumes, and avalanches (BGVN 48:01). This report covers a significant explosive eruption during early-to-mid-April 2023 that generated a 20 km altitude ash plume, produced a strong sulfur dioxide plume, and destroyed part of the lava-dome complex; activity described during January through April 2023 use information primarily from the Kamchatka Volcanic Eruptions Response Team (KVERT) and various satellite data.
Satellite data. Activity during the majority of this reporting period was characterized by continued lava dome growth, strong fumarole activity, explosions, and hot avalanches. According to the MODVOLC Thermal Alerts System, 140 hotspots were detected through the reporting period, with 33 recorded in January 2023, 29 in February, 44 in March, and 34 in April. Frequent strong thermal activity was recorded during January 2023 through April, according to the MIROVA (Middle InfraRed Observation of Volcanic Activity) graph and resulted from the continuously growing lava dome (figure 94). A slightly stronger pulse in thermal activity was detected in early-to-mid-April, which represented the significant eruption that destroyed part of the lava-dome complex. Thermal anomalies were also visible in infrared satellite imagery at the summit crater (figure 95).
During January 2023 KVERT reported continued growth of the lava dome, accompanied by strong fumarolic activity, incandescence from the lava dome, explosions, ash plumes, and avalanches. Satellite data showed a daily thermal anomaly over the volcano. Video data showed ash plumes associated with collapses at the dome that generated avalanches that in turn produced ash plumes rising to 3.5 km altitude and drifting 40 km W on 4 January and rising to 7-7.5 km altitude and drifting 15 km SW on 5 January. A gas-and-steam plume containing some ash that was associated with avalanches rose to 5-6 km altitude and extended 52-92 km W on 7 January. Explosions that same day produced ash plumes that rose to 7-7.5 km altitude and drifted 10 km W. According to a Volcano Observatory Notice for Aviation (VONA) issued at 1344 on 19 January, explosions produced an ash cloud that was 15 x 25 km in size and rose to 9.6-10 km altitude, drifting 21-25 km W; as a result, the Aviation Color Code (ACC) was raised to Red (the highest level on a four-color scale). Another VONA issued at 1635 reported that no more ash plumes were observed, and the ACC was lowered to Orange (the second highest level on a four-color scale). On 22 January an ash plume from collapses and avalanches rose to 5 km altitude and drifted 25 km NE and SW; ash plumes associated with collapses extended 70 km NE on 27 and 31 January.
Lava dome growth, fumarolic activity, dome incandescence, and occasional explosions and avalanches continued during February and March. A daily thermal anomaly was visible in satellite data. Explosions on 1 February generated ash plumes that rose to 6.3-6.5 km altitude and extended 15 km NE. Video data showed an ash cloud from avalanches rising to 5.5 km altitude and drifting 5 km SE on 2 February. Satellite data showed gas-and-steam plumes containing some ash rose to 5-5.5 km altitude and drifted 68-110 km ENE and NE on 6 February, to 4.5-5 km altitude and drifted 35 km WNW on 22 February, and to 3.7-4 km altitude and drifted 47 km NE on 28 February. Scientists from the Kamchatka Volcanological Station (KVS) went on a field excursion on 25 February to document the growing lava dome, and although it was cloudy most of the day, nighttime incandescence was visible. Satellite data showed an ash plume extending up to 118 km E during 4-5 March. Video data from 1150 showed an ash cloud from avalanches rose to 3.7-5.5 km altitude and drifted 5-10 km ENE and E on 5 March. On 11 March an ash plume drifted 62 km E. On 27 March ash plumes rose to 3.5 km altitude and drifted 100 km E. Avalanches and constant incandescence at the lava dome was focused on the E and NE slopes on 28 March. A gas-and-steam plume containing some ash rose to 3.5 km altitude and moved 40 km E on 29 March. Ash plumes on 30 March rose to 3.5-3.7 km altitude and drifted 70 km NE.
Similar activity continued during April, with lava dome growth, strong fumarolic activity, incandescence in the dome, occasional explosions, and avalanches. A thermal anomaly persisted throughout the month. During 1-4 April weak ash plumes rose to 2.5-3 km altitude and extended 13-65 km SE and E.
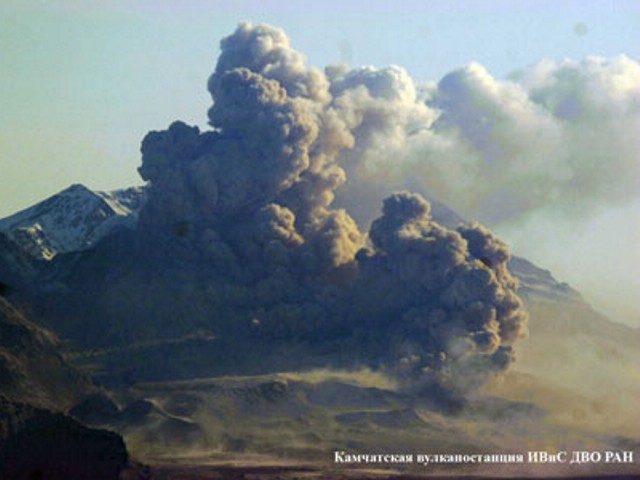
Activity during 11 April 2023. The Institute of Volcanology and Seismology, Far Eastern Branch, Russian Academy of Sciences (IVS FEB RAS) reported a significant increase in seismicity around 0054 on 11 April, as reported by strong explosions detected on 11 April beginning at 0110 that sent ash plumes up to 7-10 km altitude and extended 100-435 km W, WNW, NNW, WSW, and SW. According to a Tokyo VAAC report the ash plume rose to 15.8 km altitude. By 0158 the plume extended over a 75 x 100 km area. According to an IVS FEB RAS report, the eruptive column was not vertical: the initial plume at 0120 on 11 April deviated to the NNE, at 0000 on 12 April, it drifted NW, and by 1900 it drifted SW. KVS reported that significant pulses of activity occurred at around 0200, 0320, and then a stronger phase around 0600. Levin Dmitry took a video from near Békés (3 km away) at around 0600 showing a rising plume; he also reported that a pyroclastic flow traveled across the road behind him as he left the area. According to IVS FEB RAS, the pyroclastic flow traveled several kilometers SSE, stopping a few hundred meters from a bridge on the road between Klyuchi and Petropavlovsk-Kamchatsky.
Ashfall was first observed in Klyuchi (45 km SW) at 0630, and a large, black ash plume blocked light by 0700. At 0729 KVERT issued a Volcano Observatory Notice for Aviation (VONA) raising the Aviation Color Code to Red (the highest level on a four-color scale). It also stated that a large ash plume had risen to 10 km altitude and drifted 100 km W. Near-constant lightning strikes were reported in the plume and sounds like thunderclaps were heard until about 1000. According to IVS FEB RAS the cloud was 200 km long and 76 km wide by 0830, and was spreading W at altitudes of 6-12 km. In the Klyuchi Village, the layer of both ash and snow reached 8.5 cm (figure 96); ashfall was also reported in Kozyrevsk (112 km SW) at 0930, Mayskoye, Anavgay, Atlasovo, Lazo, and Esso. Residents in Klyuchi reported continued darkness and ashfall at 1100. In some areas, ashfall was 6 cm deep and some residents reported dirty water coming from their plumbing. According to IVS FEB RAS, an ash cloud at 1150 rose to 5-20 km altitude and was 400 km long and 250 km wide, extending W. A VONA issued at 1155 reported that ash had risen to 10 km and drifted 340 km NNW and 240 km WSW. According to Simon Carn (Michigan Technological University), about 0.2 Tg of sulfur dioxide in the plume was measured in a satellite image from the TROPOMI instrument on the Sentinel-5P satellite acquired at 1343 that covered an area of about 189,000 km2 (figure 97). Satellite data at 1748 showed an ash plume that rose to 8 km altitude and drifted 430 km WSW and S, according to a VONA.
Activity during 12-15 April 2023. On 12 April at 0730 satellite images showed ash plumes rose to 7-8 km altitude and extended 600 km SW, 1,050 km ESE, and 1,300-3,000 km E. By 1710 that day, the explosions weakened. According to news sources, the ash-and-gas plumes drifted E toward the Aleutian Islands and reached the Gulf of Alaska by 13 April, causing flight disruptions. More than 100 flights involving Alaska airspace were cancelled due to the plume. Satellite data showed ash plumes rising to 4-5.5 km altitude and drifted 400-415 km SE and ESE on 13 April. KVS volcanologists observed the pyroclastic flow deposits and noted that steam rose from downed, smoldering trees. They also noted that the deposits were thin with very few large fragments, which differed from previous flows. The ash clouds traveled across the Pacific Ocean. Flight cancellations were also reported in NW Canada (British Columbia) during 13-14 April. During 14-15 April ash plumes rose to 6 km altitude and drifted 700 km NW.
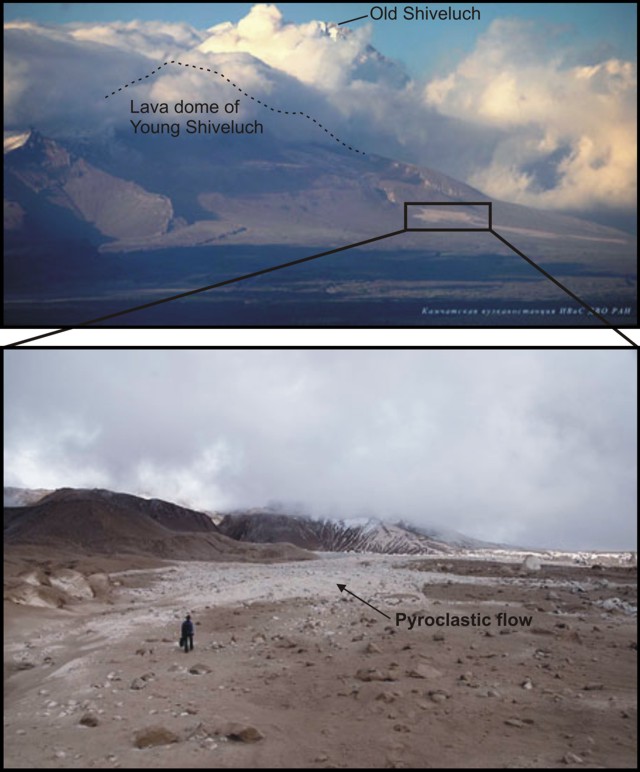
Alaskan flight schedules were mostly back to normal by 15 April, with only minor delays and far less cancellations; a few cancellations continued to be reported in Canada. Clear weather on 15 April showed that most of the previous lava-dome complex was gone and a new crater roughly 1 km in diameter was observed (figure 98); gas-and-steam emissions were rising from this crater. Evidence suggested that there had been a directed blast to the SE, and pyroclastic flows traveled more than 20 km. An ash plume rose to 4.5-5.2 km altitude and drifted 93-870 km NW on 15 April.
Activity during 16-30 April 2023. Resuspended ash was lifted by the wind from the slopes and rose to 4 km altitude and drifted 224 km NW on 17 April. KVERT reported a plume of resuspended ash from the activity during 10-13 April on 19 April that rose to 3.5-4 km altitude and drifted 146-204 km WNW. During 21-22 April a plume stretched over the Scandinavian Peninsula. A gas-and-steam plume containing some ash rose to 3-3.5 km altitude and drifted 60 km SE on 30 April. A possible new lava dome was visible on the W slope of the volcano on 29-30 April (figure 99); satellite data showed two thermal anomalies, a bright one over the existing lava dome and a weaker one over the possible new one.
References. Girina, O., Loupian, E., Horvath, A., Melnikov, D., Manevich, A., Nuzhdaev, A., Bril, A., Ozerov, A., Kramareva, L., Sorokin, A., 2023, Analysis of the development of the paroxysmal eruption of Sheveluch volcano on April 10–13, 2023, based on data from various satellite systems, ??????????? ???????? ??? ?? ???????, 20(2).
Geologic Background. The high, isolated massif of Sheveluch volcano (also spelled Shiveluch) rises above the lowlands NNE of the Kliuchevskaya volcano group. The 1,300 km3 andesitic volcano is one of Kamchatka's largest and most active volcanic structures, with at least 60 large eruptions during the Holocene. The summit of roughly 65,000-year-old Stary Shiveluch is truncated by a broad 9-km-wide late-Pleistocene caldera breached to the south. Many lava domes occur on its outer flanks. The Molodoy Shiveluch lava dome complex was constructed during the Holocene within the large open caldera; Holocene lava dome extrusion also took place on the flanks of Stary Shiveluch. Widespread tephra layers from these eruptions have provided valuable time markers for dating volcanic events in Kamchatka. Frequent collapses of dome complexes, most recently in 1964, have produced debris avalanches whose deposits cover much of the floor of the breached caldera.
Information Contacts: Kamchatka Volcanic Eruptions Response Team (KVERT), Far Eastern Branch, Russian Academy of Sciences, 9 Piip Blvd., Petropavlovsk-Kamchatsky, 683006, Russia (URL: http://www.kscnet.ru/ivs/kvert/); Institute of Volcanology and Seismology, Far Eastern Branch, Russian Academy of Sciences (IVS FEB RAS), 9 Piip Blvd., Petropavlovsk-Kamchatsky 683006, Russia (URL: http://www.kscnet.ru/ivs/eng/); Kamchatka Volcanological Station, Kamchatka Branch of Geophysical Survey, (KB GS RAS), Klyuchi, Kamchatka Krai, Russia (URL: http://volkstat.ru/); Hawai'i Institute of Geophysics and Planetology (HIGP) - MODVOLC Thermal Alerts System, School of Ocean and Earth Science and Technology (SOEST), Univ. of Hawai'i, 2525 Correa Road, Honolulu, HI 96822, USA (URL: http://modis.higp.hawaii.edu/); MIROVA (Middle InfraRed Observation of Volcanic Activity), a collaborative project between the Universities of Turin and Florence (Italy) supported by the Centre for Volcanic Risk of the Italian Civil Protection Department (URL: http://www.mirovaweb.it/); Copernicus Browser, Copernicus Data Space Ecosystem, European Space Agency (URL: https://dataspace.copernicus.eu/browser/); Kam 24 News Agency, 683032, Kamchatka Territory, Petropavlovsk-Kamchatsky, Vysotnaya St., 2A (URL: https://kam24.ru/news/main/20230411/96657.html#.Cj5Jrky6.dpuf); Simon Carn, Geological and Mining Engineering and Sciences, Michigan Technological University, 1400 Townsend Drive, Houghton, MI 49931, USA (URL: http://www.volcarno.com/, Twitter: @simoncarn).
Bezymianny
Russia
55.972°N, 160.595°E; summit elev. 2882 m
All times are local (unless otherwise noted)
Explosions, ash plumes, lava flows, and avalanches during November 2022-April 2023
Bezymianny is located on the Kamchatka Peninsula of Russia as part of the Klyuchevskoy volcano group. Historic eruptions began in 1955 and have been characterized by dome growth, explosions, pyroclastic flows, ash plumes, and ashfall. During the 1955-56 eruption a large open crater was formed by collapse of the summit and an associated lateral blast. Subsequent episodic but ongoing lava-dome growth, accompanied by intermittent explosive activity and pyroclastic flows, has largely filled the 1956 crater. The current eruption period began in December 2016 and more recent activity has consisted of strong explosions, ash plumes, and thermal activity (BGVN 47:11). This report covers activity during November 2022 through April 2023, based on weekly and daily reports from the Kamchatka Volcano Eruptions Response Team (KVERT) and satellite data.
Activity during November and March 2023 was relatively low and mostly consisted of gas-and-steam emissions, occasional small collapses that generated avalanches along the lava dome slopes, and a persistent thermal anomaly over the volcano that was observed in satellite data on clear weather days. According to the Tokyo VAAC and KVERT, an explosion produced an ash plume that rose to 6 km altitude and drifted 25 km NE at 1825 on 29 March.
Gas-and-steam emissions, collapses generating avalanches, and thermal activity continued during April. According to two Volcano Observatory Notice for Aviation (VONA) issued on 2 and 6 April (local time) ash plumes rose to 3 km and 3.5-3.8 km altitude and drifted 35 km E and 140 km E, respectively. Satellite data from KVERT showed weak ash plumes extending up to 550 km E on 2 and 5-6 April.
A VONA issued at 0843 on 7 April described an ash plume that rose to 4.5-5 km altitude and drifted 250 km ESE. Later that day at 1326 satellite data showed an ash plume that rose to 5.5-6 km altitude and drifted 150 km ESE. A satellite image from 1600 showed an ash plume extending as far as 230 km ESE; KVERT noted that ash emissions were intensifying, likely due to avalanches from the growing lava dome. The Aviation Color Code (ACC) was raised to Red (the highest level on a four-color scale). At 1520 satellite data showed an ash plume rising to 5-5.5 km altitude and drifting 230 km ESE. That same day, Kamchatka Volcanological Station (KVS) volcanologists traveled to Ambon to collect ash; they reported that a notable eruption began at 1730, and within 20 minutes a large ash plume rose to 10 km altitude and drifted NW. KVERT reported that the strong explosive phase began at 1738. Video and satellite data taken at 1738 showed an ash plume that rose to 10-12 km altitude and drifted up to 2,800 km SE and E. Explosions were clearly audible 20 km away for 90 minutes, according to KVS. Significant amounts of ash fell at the Apakhonchich station, which turned the snow gray; ash continued to fall until the morning of 8 April. In a VONA issued at 0906 on 8 April, KVERT stated that the explosive eruption had ended; ash plumes had drifted 2,000 km E. The ACC was lowered to Orange (the third highest level on a four-color scale). The KVS team saw a lava flow on the active dome once the conditions were clear that same day (figure 53). On 20 April lava dome extrusion was reported; lava flows were noted on the flanks of the dome, and according to KVERT satellite data, a thermal anomaly was observed in the area. The ACC was lowered to Yellow (the second lowest on a four-color scale).
Satellite data showed an increase in thermal activity beginning in early April 2023. A total of 31 thermal hotspots were detected by the MODVOLC thermal algorithm on 4, 5, 7, and 12 April 2023. The elevated thermal activity resulted from an increase in explosive activity and the start of an active lava flow. The MIROVA (Middle InfraRed Observation of Volcanic Activity) volcano hotspot detection system based on the analysis of MODIS data also showed a pulse in thermal activity during the same time (figure 54). Infrared satellite imagery captured a continuous thermal anomaly at the summit crater, often accompanied by white gas-and-steam emissions (figure 55). On 4 April 2023 an active lava flow was observed descending the SE flank.
Geologic Background. The modern Bezymianny, much smaller than its massive neighbors Kamen and Kliuchevskoi on the Kamchatka Peninsula, was formed about 4,700 years ago over a late-Pleistocene lava-dome complex and an edifice built about 11,000-7,000 years ago. Three periods of intensified activity have occurred during the past 3,000 years. The latest period, which was preceded by a 1,000-year quiescence, began with the dramatic 1955-56 eruption. This eruption, similar to that of St. Helens in 1980, produced a large open crater that was formed by collapse of the summit and an associated lateral blast. Subsequent episodic but ongoing lava-dome growth, accompanied by intermittent explosive activity and pyroclastic flows, has largely filled the 1956 crater.
Information Contacts: Kamchatka Volcanic Eruptions Response Team (KVERT), Far Eastern Branch, Russian Academy of Sciences, 9 Piip Blvd., Petropavlovsk-Kamchatsky, 683006, Russia (URL: http://www.kscnet.ru/ivs/kvert/); Kamchatka Volcanological Station, Kamchatka Branch of Geophysical Survey, (KB GS RAS), Klyuchi, Kamchatka Krai, Russia (URL: http://volkstat.ru/); Hawai'i Institute of Geophysics and Planetology (HIGP) - MODVOLC Thermal Alerts System, School of Ocean and Earth Science and Technology (SOEST), Univ. of Hawai'i, 2525 Correa Road, Honolulu, HI 96822, USA (URL: http://modis.higp.hawaii.edu/); MIROVA (Middle InfraRed Observation of Volcanic Activity), a collaborative project between the Universities of Turin and Florence (Italy) supported by the Centre for Volcanic Risk of the Italian Civil Protection Department (URL: http://www.mirovaweb.it/); Copernicus Browser, Copernicus Data Space Ecosystem, European Space Agency (URL: https://dataspace.copernicus.eu/browser/).
Chikurachki
Russia
50.324°N, 155.461°E; summit elev. 1781 m
All times are local (unless otherwise noted)
New explosive eruption during late January-early February 2023
Chikurachki, located on Paramushir Island in the northern Kuriles, has had Plinian eruptions during the Holocene. Lava flows have reached the sea and formed capes on the NW coast; several young lava flows are also present on the E flank beneath a scoria deposit. Reported eruptions date back to 1690, with the most recent eruption period occurring during January through October 2022, characterized by occasional explosions, ash plumes, and thermal activity (BGVN 47:11). This report covers a new eruptive period during January through February 2023 that consisted of ash explosions and ash plumes, based on information from the Kamchatka Volcanic Eruptions Response Team (KVERT) and satellite data.
According to reports from KVERT, an explosive eruption began around 0630 on 29 January. Explosions generated ash plumes that rose to 3-3.5 km altitude and drifted 6-75 km SE and E, based on satellite data. As a result, the Aviation Color Code (ACC) was raised to Orange (the second highest level on a four-color scale). At 1406 and 1720 ash plumes were identified in satellite images that rose to 4.3 km altitude and extended 70 km E. By 2320 the ash plume had dissipated. A thermal anomaly was visible at the volcano on 31 January, according to a satellite image, and an ash plume was observed drifting 66 km NE.
Occasional explosions and ash plumes continued during early February. At 0850 on 1 February an ash plume rose to 3.5 km altitude and drifted 35 km NE. Satellite data showed an ash plume that rose to 3.2-3.5 km altitude and drifted 50 km NE at 1222 later that day (figure 22). A thermal anomaly was detected over the volcano during 5-6 February and ash plumes drifted as far as 125 km SE, E, and NE. Explosive events were reported at 0330 on 6 February that produced ash plumes rising to 4-4.5 km altitude and drifting 72-90 km N, NE, and ENE. KVERT noted that the last gas-and steam plume that contained some ash was observed on 8 February and drifted 55 km NE before the explosive eruption ended. The ACC was lowered to Yellow and then Green (the lowest level on a four-color scale) on 18 February.
Geologic Background. Chikurachki, the highest volcano on Paramushir Island in the northern Kuriles, is a relatively small cone constructed on a high Pleistocene edifice. Oxidized basaltic-to-andesitic scoria deposits covering the upper part of the young cone give it a distinctive red color. Frequent basaltic Plinian eruptions have occurred during the Holocene. Lava flows have reached the sea and formed capes on the NW coast; several young lava flows are also present on the E flank beneath a scoria deposit. The Tatarinov group of six volcanic centers is located immediately to the south, and the Lomonosov cinder cone group, the source of an early Holocene lava flow that reached the saddle between it and Fuss Peak to the west, lies at the southern end of the N-S-trending Chikurachki-Tatarinov complex. In contrast to the frequently active Chikurachki, the Tatarinov centers are extensively modified by erosion and have a more complex structure. Tephrochronology gives evidence of an eruption around 1690 CE from Tatarinov, although its southern cone contains a sulfur-encrusted crater with fumaroles that were active along the margin of a crater lake until 1959.
Information Contacts: Kamchatka Volcanic Eruptions Response Team (KVERT), Far East Division, Russian Academy of Sciences, 9 Piip Blvd., Petropavlovsk-Kamchatsky, 683006, Russia (URL: http://www.kscnet.ru/ivs/); Copernicus Browser, Copernicus Data Space Ecosystem, European Space Agency (URL: https://dataspace.copernicus.eu/browser/).
Search Bulletin Archive by Publication Date
Select a month and year from the drop-downs and click "Show Issue" to have that issue displayed in this tab.
The default month and year is the latest issue available.
Bulletin of the Global Volcanism Network - Volume 35, Number 03 (March 2010)
Managing Editor: Richard Wunderman
Eyjafjallajokull (Iceland)
Fissure eruption and lava flows from E flank on 20 March
Fournaise, Piton de la (France)
Seismicity and eruptions January 2009 and November 2009-January 2010
Santa Maria (Guatemala)
Continuing frequent ash explosions through 2008-2009
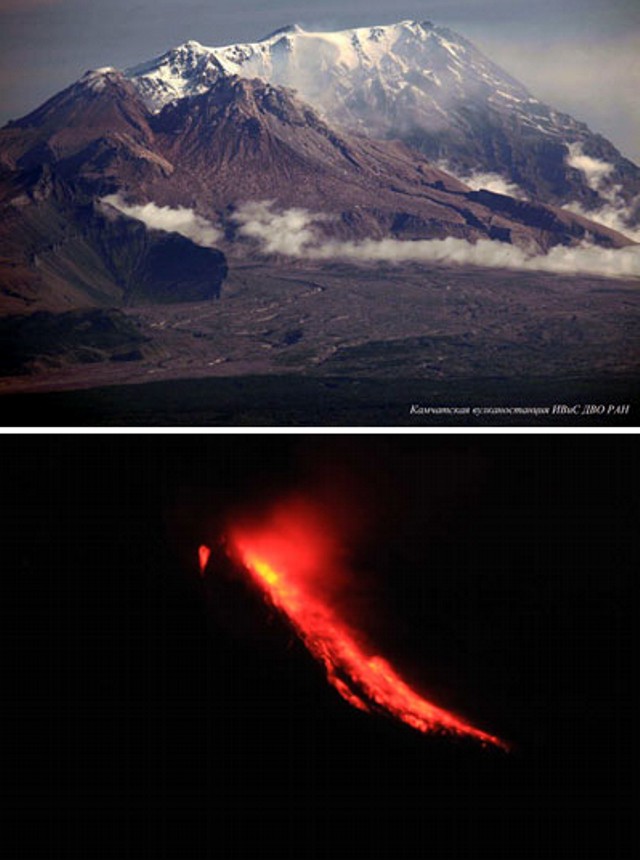
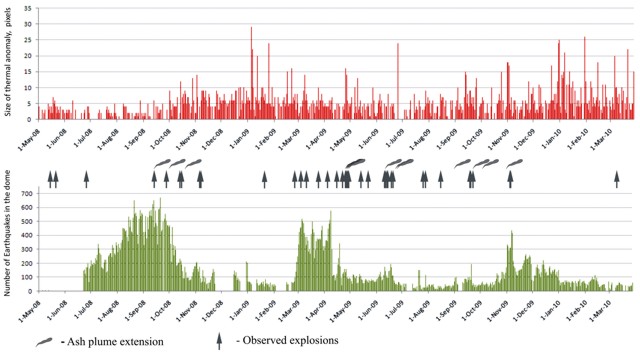
Sheveluch (Russia)
Near-constant dome growth during May 2008 through March 2010
Soufriere Hills (United Kingdom)
Lava dome growth continuing; pyroclastic flows reached the ocean
Stromboli (Italy)
Explosions and lava flows in 2009; recent reports on 2007 eruption
Telica (Nicaragua)
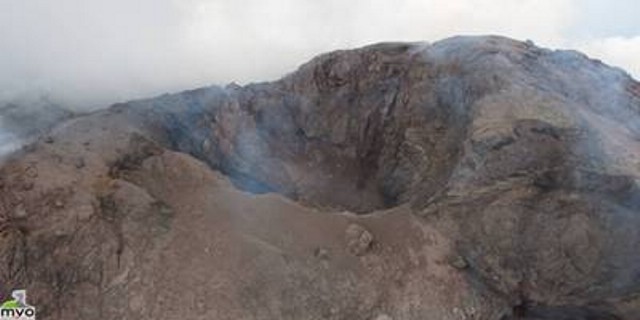
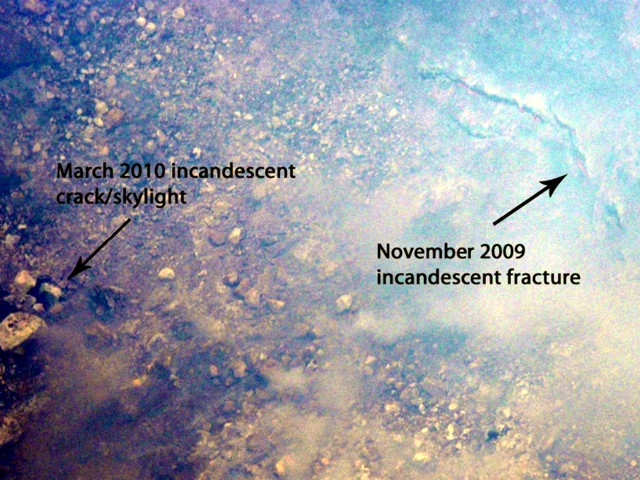
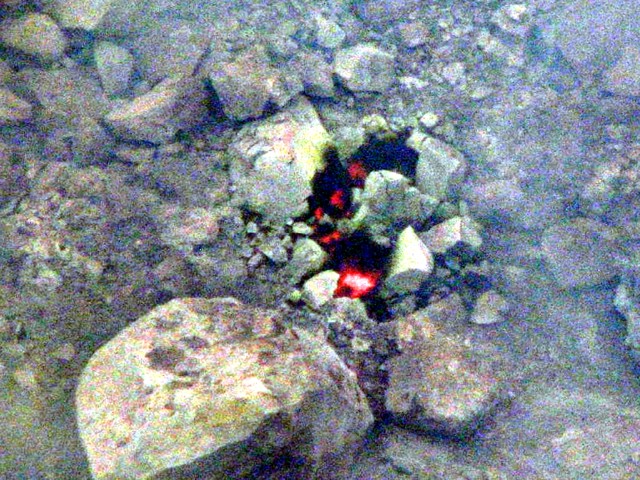
Incandescent crater floor areas seen in November 2009 and March 2010
Eyjafjallajokull (Iceland) — March 2010 Cite this Report
Eyjafjallajokull
Iceland
63.633°N, 19.633°W; summit elev. 1651 m
All times are local (unless otherwise noted)
Fissure eruption and lava flows from E flank on 20 March
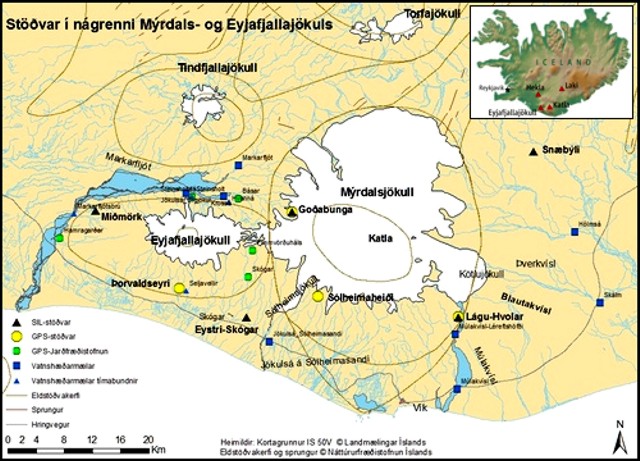
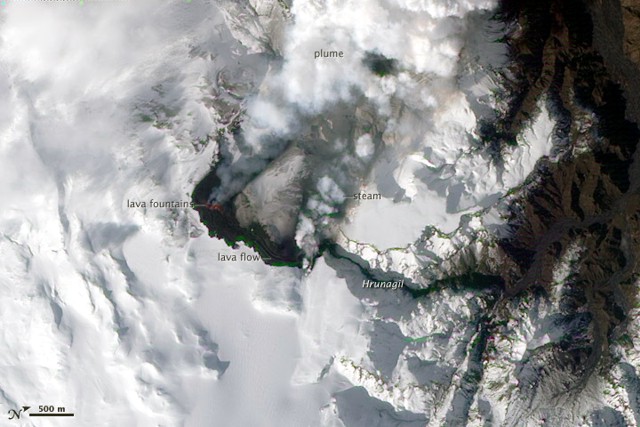
During March 2010, the Icelandic Meteorological Office (IMO) and the Nordic Volcanological Center of the University of Iceland's Institute of Earth Sciences (IES) reported the first eruption of Eyjafjallajökull volcano in southern Iceland since 1823. The following was mostly condensed from a multitude of reports on the EIS and IMO websites, and only discusses activity through the start of the explosive summit phase. Many of the satellite images featured here came from the NASA Earth Observatory.
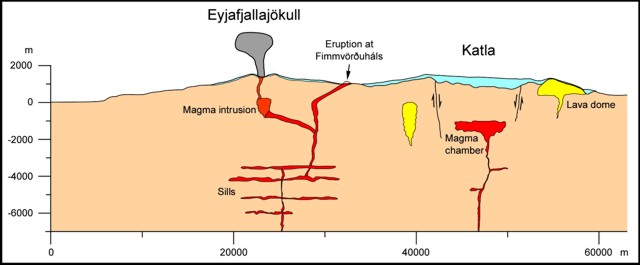
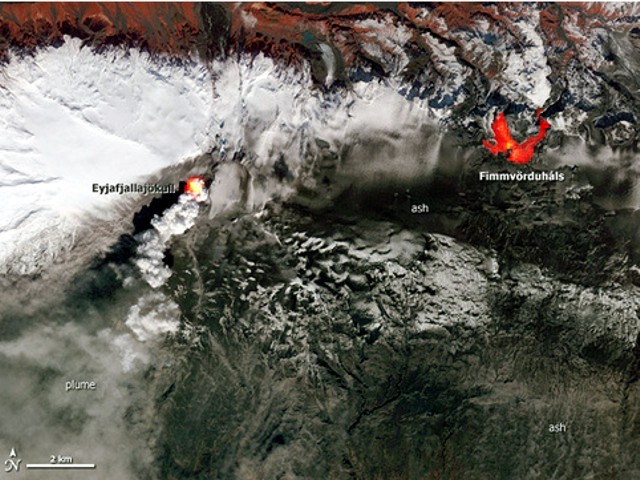
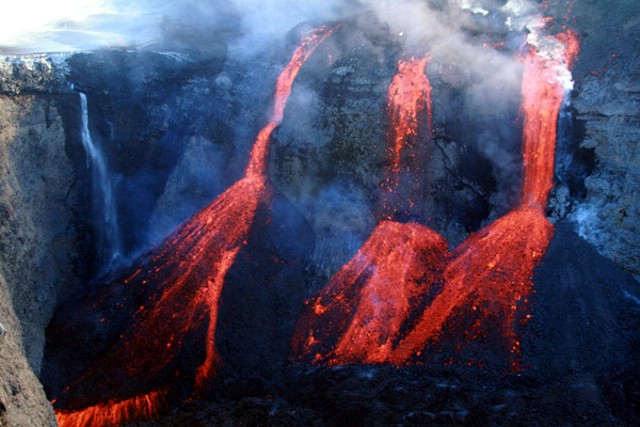
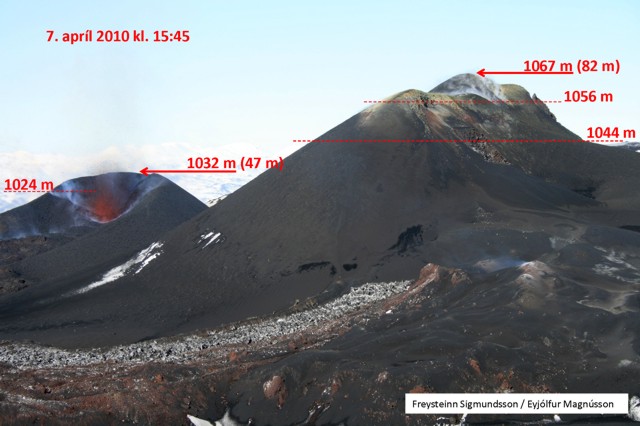
From 20 March to 12 April 2010 the eruption's first phase occurred from a fissure 9 km ENE of the summit, an area named Fimmvörðuháls, located between the Eyjafjallajökull and Mýrdalsjökull icecaps (figure 1). These vents on the lower E slopes were snow-covered but not under the year-round icecap found at higher elevations. Lava flows filled gullies, and quickly melted adjacent winter snow, creating small steam plumes. After apparent cessation of the fissure activity on or about 12 April, a second phase of the eruption began on 14 April (figures 2 and 3, table 1), generating ash plumes that blew E to Europe and resulted in a 20-80% decrease of airline flights for as much as a week (Wall and Flottau, 2010). As of late May the eruption continued, with occasional plumes that restricted air travel in parts of Europe.
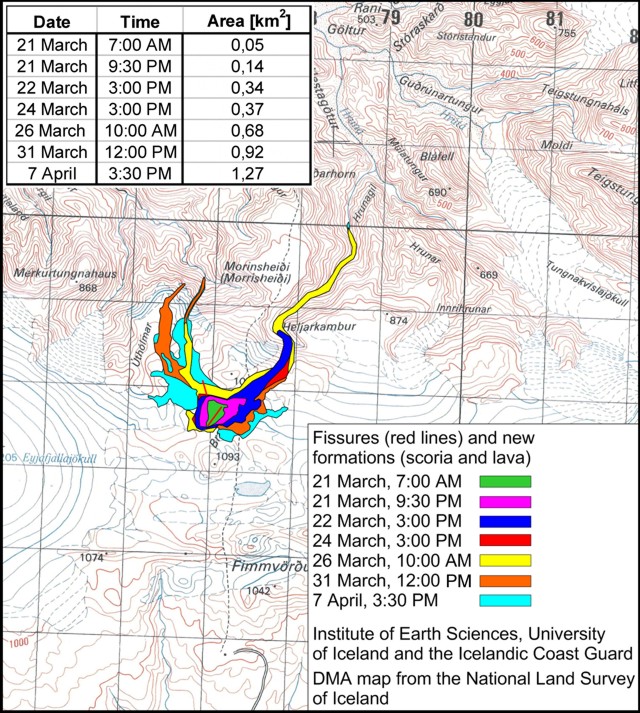
Table 1. Preliminary data regarding the 2010 eruption of Eyjafjallajökull, which started at an E-flank vent (Fimmvörðuháls) and then later shifted to the ice-covered summit caldera. The grain sizes of the second phase of the eruption were quantified by The Environment Agency of Iceland; other data courtesy of IMO and IES.
| Dates |
Activity |
Rock type and description |
| 20 Mar-12 Apr 2010 |
Fissure eruptions of lava flows at Fimmvörðuháls. |
Alkali-olivine basalt (~47.7 wt % SiO2). Euhedral plagiclase, olivine, and clinopyroxene phenocrysts seem to be in equilibrium with magma. |
| 14 Apr 2010 and later |
Explosions from the summit caldera of Eyjafjallajökull. Ash clouds, initially up to ~11 km altitude. |
Trachyandesite (56.7-59.6 wt % SiO2). Grain size from sample at Mýrdalssandur (50 km from vent): 24%, under 10 ?m (as aerosol); 33% , 10-50 ?m; 20% , 50-146 ?m; 23%, 146-294 ?m. Fluorine: 850 mg/kg (19 April). |
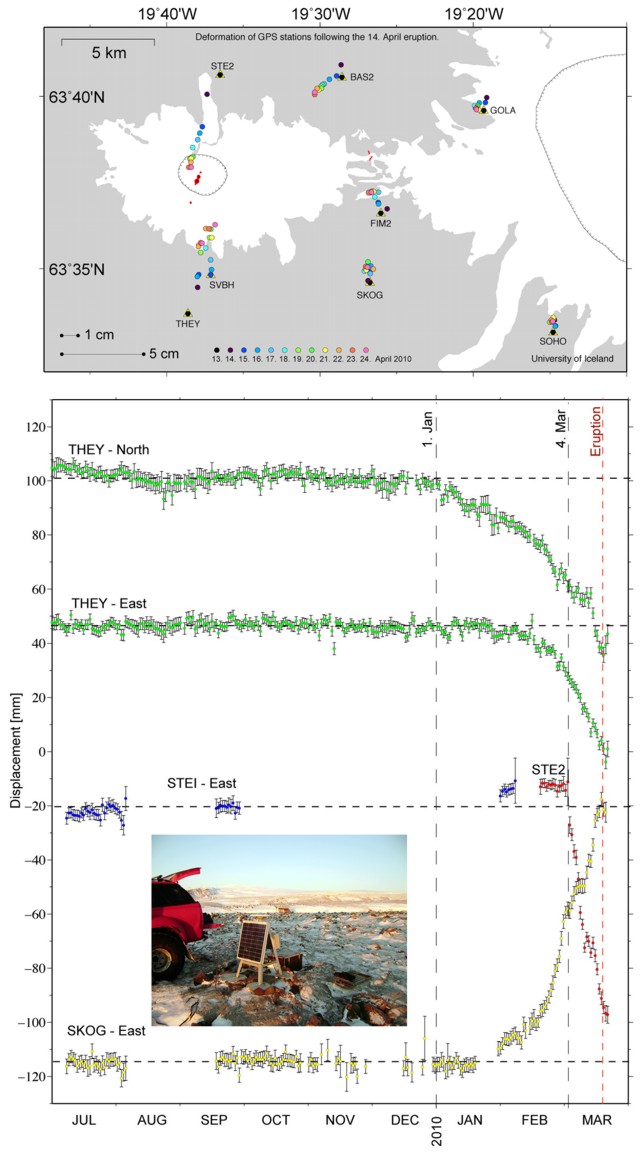
Precursory observations. The IES website contained a list of scientific papers and publications including several noting restlessness at Fimmvörðuhálsat in recent years (see Further References below). The IES reports noted that the Fimmvörðuháls eruption followed weeks of high seismicity and deformation (figure 4).
In general terms, GPS data indicated that permanent station Thorvaldseyri (THEY; S of the volcano, figure 4) started moving S in late December 2009. In the weeks prior to the eruption, there was rapid deformation at Skogaheidi (SKOG; S of the volcano) and Steinsholt (STE1 and STE2; N of the volcano). IES identified three distinct phases in the GPS data. First, at the end of December, the southward motion of THEY. Second, at the beginning of February 2010, displacement at THEY changed to SW as SKOG began E displacement. Third, after 5 March, STE2 displaced rapidly NW and up. Scientists noticed a trend after 4 March at continuous GPS sites installed within 12 km of the eruptive site; all showed deformation at rates of up to a centimeter a day.
Seismic tremor began around 2230 on 4 March, and around that time, signal sources rose slowly towards the surface. Compared to the weeks prior to the eruption, seismicity increased rather slowly immediately prior to the eruption. However, as the eruption onset neared, geophysicists saw both the depth of earthquakes decrease and the locations of earthquakes move from the area under the summit towards the Fimmvörðuháls site.
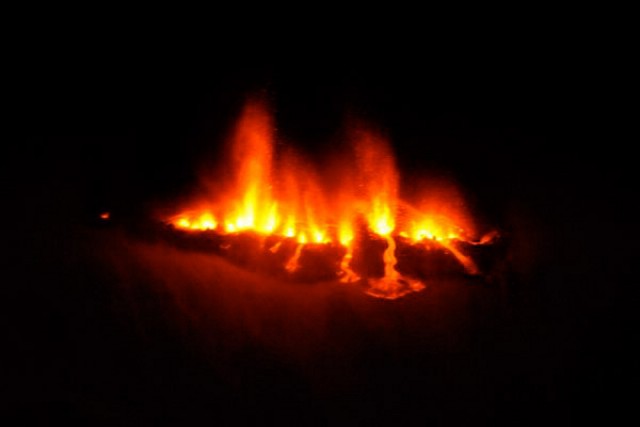
According to Laursen (2010) "Eyjafjallajökull's so-far-unpredictable behavior offers a perfect example of the challenge facing volcanologists. Before this spring's first eruption...GPS stations on the volcano had wandered several centimeters in May of 2009 and again in December, signs that rising magma was stretching the skin of the volcano in advance of an eruption. In mid-February...Steinunn Jakobsdóttir, a geophysicist at IMO, was tracking tremors ~ 5 kilometers below Eyjafjallajökull's surface. But officials didn't order evacuations because the seismic hints weren't that dire. 'Usually when an eruption starts, a low-frequency [seismic signal] is rising when the magma is coming to the surface,' says Jakobsdóttir. Although seismic tracking placed magma closer to the surface on 19 March, this low-frequency signal was absent, so civil authorities kept the alert level at its lowest setting. But the next night, southern Icelanders reported a dark cloud glowing red above the mountain: The volcano had experienced a small eruption, one that led authorities to evacuate farmers living in its floodplains."
Eruption from Fimmvörðuháls. Late on 20 March 2010 an eruption began at Fimmvörðuháls, an area around 1,000 m elevation in a ~ 2-km-wide pass of ice-free land between Eyjafjallajökull and Mýrdalsjökull. Initially detected visually, the eruption was seen at 2352 that day as a red cloud above the site.
The eruption broke out with Hawaiian-style fire fountains (figure 5) on a ~ 500-m-long, NE-oriented fissure (at 63° 38.1' N, 19° 26.4' W). Lava flowed a short distance from the eruptive site and a minor eruption plume rose to less than 1 km altitude and blew W. Tephra fall was minor or insignificant.
Airborne observers during 0400-0700 on 21 March described a short eruptive fissure with fire fountaining from 10-12 vents reaching up to ~ 100 m height. Eruption tremor rose slowly until reaching a maximum at around 0700-0800 that day. No further lengthening of the fissure was detected. Lava was still limited to the immediate surroundings of the eruptive craters (runouts of less than few hundred meters). Minor ashfall occurred within a few kilometers W.
On 22 March, observations made from the ground showed lava extrusion from a series of closely-spaced vents. Prevailing E winds led to maximum scoria accumulation on a linear rim W of the NE-trending fissure. A'a lava flowed over the steep Hrunagil canyon rim creating spectacular 'lava falls.'
During 23-31 March, lava steadily issued at the initial craters, with gradual focusing towards fewer vents. Lava advanced N into the Hrunagil and Hvannárgil valleys, with continuation of intermittent lava falls (figures 6-8). Lava descending gullies generated zones of frothy rock. Extensive steam plumes occurred when advancing lava encountered water and snow. Two or three plumes were observed (one at the eruptive craters, others more pronounced in front of the advancing lava). Meltwater descended in batches into rivers valleys, and seismometers recorded relatively steady eruption tremor.
On the evening of 31 March, scientists noted the opening of a new short fissure immediately N of the previous one. This change may have been a response to changes at shallow depth in the feeder channel. Eruption tremor remained unchanged. During 31 March-6 April, lava discharged in both the old and new eruptive craters in a manner similar to before. Pronounced 'lava falls' returned to Hvannárgil valley.
During 1-2 April 2010 a team from the Italian Instituto Nazionale di Geofisica e Vulcanologia (INGV) working in collaboration with the scientists from IES conducted gas measurements at Fimmvörðuháls (Burton and others, 2010). Three measurement techniques were used: open-path FTIR (Fourier transform infrared spectroscopy), DOAS (differential optical absorption spectroscopy), and a sulfur dioxide (SO2) imaging system. The FTIR spectrometer uses infrared radiation emitted from the erupting lavas as a source for absorption spectrometry of gases emitted from the explosive vents. Spectra are analyzed using a single-beam retrieval, which allows pathlength estimates of H2O, CO2, SO2, HCl, and HF. Favorable wind conditions allowed traverse measurements under the gas plume with a DOAS spectrometer for SO2 flux estimates.
The investigators found that the SO2 gas flux was ~ 3,000 metric tons per day. Approximately 70% of the SO2 flux was produced by the fissure that opened 31 March, with ~ 30% emitted by the fissure that had opened on 21 March. The overall HF flux was ~ 30 tons per day. Gas compositions emitted from the two fissures were broadly similar and rich in H2O (over 80% by mole), less than 15% CO2, and less than 3% SO2. The SO2/HCl ratio varied at the 31 March fissure on 1 and 2 April (25% and 5%, respectively).
On 5 April, eruption tremor (at 1-2 Hz recorded at the nearest seismic station, Godabunga) began to gradually decline. By 7 April lava emissions had stopped from the original craters, but continued at the 31 March fissure.
When IES surveyed the new landscape on 7 April (figure 9), they found 1.3 km2 of new lava, an average thickness of new lava there of 10-12 m, and an estimated volume of eruptive material of 22-24 x 106 m3. From this they computed an average emission rate of ~ 15 m3/s. The tallest new cone reached an elevation 1,067 m, ~ 82 m above the previous ground surface. Another cone with a rim at 1,032 m elevation was 47 m above the previous surface and the vent area glowed red.
By 9 April, after little change in deformation rates during the eruption, time series at continuous GPS stations N of the volcano showed sudden change, partly jumping back to pre-eruptive levels. On 11 April, eruption tremor also approached pre-eruptive levels, but visual observation revealed eruptive activity in late afternoon. Seismic tremor on 12 April reached a minimum.
Eruption from the summit caldera. The second, more explosive eruptive phase, began on 14 April 2010 at the subglacial, central summit caldera. This phase was preceded by an earthquake swarm from around 2300 on 13 April to 0100 on 14 April. Meltwater started to emanate from the icecap around 0700 on 14 April and an eruption plume was observed later that morning. The exact conditions at the summit were unknown due to cloud cover obscuring the volcano, but on 15 April an overflight imaged the erupting caldera using radar (figure 10).
The 15 April radar image helped depict a series of vents along a 2-km-long, N-oriented fissure. Both on top of and from below, meltwater flowed down the N and S slopes. Jokulhlaups (floods of meltwater also carrying considerable debris) reached the lowlands around the volcano with peak flow around noon on 14 April, causing destruction of roads, infrastructure, and farmlands. Residents had earlier been evacuated from hazardous areas. Tephra fall began in SE Iceland. That evening, a second jokulhlaup emanated from the icecap down the Markarfljot valley, which trends E-W along the N margin of the volcano and contains extensive outwash from surrounding glaciers.
On 15 April the ash plume reached a maximum altitude of over 8 km. E-blown ash began to arrive over mainland Europe closing airspace over the British Isles and large parts of Northern Europe. Ash generation continued at a similar level. Meltwater emerged from the glacier in pulses. Debris-charged jokulhlaups were seen in the evening.
Chemical analyses of mid-April ash samples revealed fluorine-rich intermediate eruptive products with silica content of ~ 58%. The initial lavas erupted at Fimmvörðuháls had silica contents of ~ 48% (table 1).
References. Burton, M., Salerno, G., La Spina, A., Stefansson, A., and Kaasalainen, H., 2010, Gas composition and flux report, IES web site.
Laursen, L., 2010, Iceland eruptions fuel interest in volcanic gas monitoring: Science, v. 328, no. 5977, p. 410-411.
Sigmarsson, O., Óskarsson, N., Þórðarson, Þ., Larsen, and G., Höskuldsson, Á, 2010, Preliminary interpretations of chemical analysis of tephra from Eyjafjallajökull volcano (report on the IES website).
Wall, R., and Flottau, J., 2010. Out of the ashes: Rising losses and recriminations rile Europe's air transport sector: Aviation Week & Space Technology, v. 172, no. 16, p.23-25.
Further References. Dahm, T., and Brandsdóttir, B., 1997, Moment tensors of micro-earthquakes from the Eyjafjallajökull volcano in South Iceland: Geophysical Journal International, v. 130, no.1, p. 183-192, DOI:10.1111/j.1365-246X.1997.tb00997.x.
Guðmundsson, M.T., and Gylfason, A.G., 2004, H?ttumat vegna eldgosa og hlaupa frá vestanverðum Mýrdalsjökli og Eyjafjallajökli. Háskólaútgáfan og Ríkislögreglustjórinn [Volcanic risk assessment run from Mýrdalsjökli and Eyjafjallajökull measurements]: University of Iceland and the National Police, 230 p.
Hjaltadottir, S., K. S. Vogfjord and R. Slunga, 2009, Seismic signs of magma pathways through the crust at Eyjafjallajokull volcanoe, South Iceland: Icelandic Meteorological Office report, VI 2009-013 (http://www.vedur.is/media/vedurstofan/utgafa/skyrslur/2009/VI_2009_013.pdf).
Hooper, A., Pedersen, R., and Sigmundsson, F., 2009, Constraints on magma intrusion at Eyjafjallajökull and Katla volcanoes in Iceland, from time series SAR interferometry, p. 13-24 in Bean, C.J., Braiden, A.K., Lokmer, I., Martini, F., and O'Brien, G.S., eds., The VOLUME project - Volcanoes: Understanding subsurface mass movement: School of Geological Sciences, University College Dublin.
Larsen, G., 1999, Gosi í Eyjafjallajökli 1821-1823 [The eruption of the Eyjafjallajökull volcano in 1821-1823]: Science Institute Research Report RH-28-99, Reykjavík, 13 p.
Pedersen, R., Sigmundsson, F., and Einarsson, P., 2007, Controlling factors on earthquake swarms associated with magmatic intrusions; Constraints from Iceland: Journal of Volcanology and Geothermal Research, v. 162, p. 73-80.
Pedersen, R., and Sigmundsson, F., 2004, InSAR based sill model links spatially offset areas of deformation and seismicity for the 1994 unrest episode at Eyjafjallajökull volcano, Iceland: Geophysical Research Letters, v. 31, L14610 doi: 10.1029/2004GL020368.
Pedersen, R., and Sigmundsson, F., 2006, Temporal development of the 1999 intrusive episode in the Eyjafjallajökull volcano, Iceland, derived from InSAR images: Bulletin Volcanology, v. 68, p. 377-393.
Sigmundsson, F., Geirsson, H., Hooper, A. J., Hjaltadottir, S., Vogfjord, K. S., Sturkell, E. C., Pedersen, R., Pinel, V., Fabien, A., Einarsson, P., Gudmundsson, M. T., Ofeigsson, B., and Feigl, K., 2009, Magma ascent at coupled volcanoes: Episodic magma injection at Katla and Eyjafjallajökull ice-covered volcanoes in Iceland and the onset of a new unrest episode in 2009: Eos (Transactions of the American Geophysical Union), v. 90, no. 52, Fall Meeting Supplement, Abstract V32B-03.
Sturkell, E., Einarsson, P., Sigmundsson, F., Hooper, A., Ófeigsson, B.G., Geirsson, H., and Ólafsson, H., 2009, Katla and Eyjafjallajökull volcanoes, p. 5-12 in Schomacker, A., Krüger. J., and Kjr, K.H., eds., The Mrdalsjökull Ice cap, Iceland - Glacial processes, sediments and landforms on an active volcano: Developments in Quaternary Sciences, v. 13.
Geologic Background. Eyjafjallajökull (also known as Eyjafjöll) is located west of Katla volcano. It consists of an elongated ice-covered stratovolcano with a 2.5-km-wide summit caldera. Fissure-fed lava flows occur on both the E and W flanks, but are more prominent on the western side. Although the volcano has erupted during historical time, it has been less active than other volcanoes of Iceland's eastern volcanic zone, and relatively few Holocene lava flows are known. An intrusion beneath the S flank from July-December 1999 was accompanied by increased seismic activity. The last historical activity prior to an eruption in 2010 produced intermediate-to-silicic tephra from the central caldera during December 1821 to January 1823.
Information Contacts: Nordic Volcanological Center, Institute of Earth Sciences, University of Iceland, Sturlugata 7, Askja, 101 Reykjavík, Iceland (URL: http://www.earthice.hi.is/page/ies_volcanoes) [contributors:Páll Einarsson, ásta Rut Hjartardóttir, Magnus Tumi Gudmundsson, Freysteinn Sigmundsson, Niels Oskarsson, Gudrun Larsen, Sigrun Hreinsdottir, Rikke Pedersen, Ingibjörg Jónsdóttir]; Icelandic Meteorological Office (IMO), Bústaðavegur 9, 150 Reykjavík, Iceland (URL: http://en.vedur.is/) [contributors:Steinunn Jakobsdóttir, Kristin S. Vogfjord, Sigurlaug Hjaltadottir, Gunnar B. Gudmundsson, Matthew J. Roberts]; The Environment Agency of Iceland, Sudurlandsbraut 24, 108 Reykjavik, Iceland (URL: http://english.ust.is/); NASA Earth Observatory (URL: http://earthobservatory.nasa.gov/); London Volcanic Ash Advisory Centre, Met Office, FitzRoy Road, Exeter, Devon EX1 3PB, United Kingdom (URL: http://www.metoffice.gov.uk/aviation/vaac/).
Piton de la Fournaise (France) — March 2010 Cite this Report
Piton de la Fournaise
France
21.244°S, 55.708°E; summit elev. 2632 m
All times are local (unless otherwise noted)
Seismicity and eruptions January 2009 and November 2009-January 2010
Eruptions from Piton de la Fournaise resumed in September 2008 after more than 16 months of quiet (BGVN 34:02). Eruptive episodes inside Dolomeiu crater, as reported by the Observatoire Volcanologique du Piton de la Fournaise (OVPDLF), took during 21 September-2 October and on 28 November 2008, with a third that began on 15 December and continued into January 2009. This report presents observations from January 2009 through January 2010.
Eruptions during 21 September 2008-4 February 2009. Eruptive phases in September, November, and December 2008 were previously described (BGVN 34:02). OVPDLF reported that the episode that began on 14 December 2008 ended on 4 February 2009. During that eruption two vents were active; lava flowed to the bottom of Dolomieu crater through lava tubes and caused the crust over the pooled area to rise. Some incandescence was noted at night and at dawn. Eruption tremor was irregular until 1 January, when it suddenly stopped. Tremor gradually rose over the next few days, but to a relatively low level, where it remained steady until slowly dropping again in early February (figure 79). Lava flows from this eruption covered an area of approximately 420 x 220 m, with a thickness of 75 m (figure 80).
Activity during October 2009-January 2010. The OVPDLF reported three eruptions from the summit region at the Dolomieu crater's W wall adjacent to Bory crater between November 2009 and January 2010. The flows traveled to the E down the steep cliff toward the crater floor. These eruptions began on 5 November 2009, lasting about two days; on 14 December 2009, lasting 6 hours; and on 2 January 2010, lasting 10 days.
During 5-13 October 2009, OVPDLF reported increased seismicity (figure 81). Seismicity from 14 to 17 October indicated deformation on the N side of, and rockfalls within, the Dolomieu crater. On 18 October another seismic crisis was noted along with deformation on the N and S sides of the Dolomieu crater. Aerial observations on 19 October revealed a small new fumarole in the crater. Unspecified changes in the chemical composition of the gases were also noted. On 20 October rockfalls occured in greater number and longer duration than in previous days.
On 4 November 2009 a magnitude 3 earthquake at 0604 was felt by some residents of the southern part of the island. Such a magnitude is uncommon at this volcano. Seismologists at the Observatory located the earthquake at 750 m below sea level, under the southwestern edge of the Dolomieu crater. Later that day, 167 earthquakes of lesser magnitude followed. The focal depths rose to ~ 1 km above sea level with epicenters below the summit.
OVPDLF reported that 30 minutes after an intense seismic event on 5 November, a tremor signal characteristic of the beginning of an eruption occurred, and a vent opened inside the southern part of the Dolomieu crater. Within another 30 minutes, a fissure on the upper SE flank propagated E, and a second fissure opened on the E flank.
Lava fountains ~ 20 m high and flows were emitted from both fissures. The glowing lava was visible from the edge of the Enclos Fouqué and from the road in the Grand Brulé. Beginning around 1500, there was a gradual decrease in the intensity of the eruption. At 0645 on 6 November, a reconnaissance was conducted by a helicopter supplied by the National Gendarmerie, which confirmed that two fissures were open in the S side, S and E of the Dolomieu summit crater. Each emitted a lava flow descending to ~ 1,970 m elevation. As of 0730 that day, the lava ceased flowing, with a gradual decrease in the intensity of the eruption tremor.
At 1730 on 14 December a seismic event preceded a rise in summit deformation (8 cm horizontal). Eruptive tremor began at 1830, and an eruption began at 1845. A system of sub-parallel fissures along the summit of Dolomieu crater fed lava flows on the S slope of the volcano, inside the Enclos Fouqué. A second fissure system opened on the E flank of the Dolomieu summit crater at 2025, and lava flows advanced down the eastern slope. This eruption ended at 0040 after a gradual decrease in magma supply. On 15 December, a visible degassing in the S and SE fissures was associated with low-intensity eruptive tremor. All of the lava flows were confined to high portions of the S and SE slopes.
Fissure-fed fountaining sent lava flows down the S flank on 14 December 2009. Another seismic event on 29 December was characterized by numerous earthquakes up to M 3 in the area W and NW of Dolomieu crater at depths of 1.1-2.2 km below the summit. Deformation was also detected. OVPDLF reported decreased seismicity and fewer landslides within Dolomieu crater on 30 and 31 December.
On 2 January 2010 a fissure eruption near the top of the W crater rim (figure 82) was preceded by a seismic event and another 3 cm of horizontal deformation. Lava fountains rose a few tens of meters high and sent lava flows into Dolomieu crater, and ash and gas plumes rose above Piton de la Fournaise. Large landslides also occurred in Bory crater (W). During 2-3 January, seismicity and the number of landslides decreased. A series of ash plumes was noted through 12 January.
As of 4 January, the lava flows covered about 80% of the crater floor. Lava fountaining was still visible during 5-7 January and continued to erupt from a vent along a fissure high on the SW Dolomieu crater wall. The vent produced lava fountains and flows that pooled in the bottom of the crater. On 7 January the vent closed, but the previously erupted lava continued to flow for the next few days (figure 83). Seismicity decreased on 12 January and only minor gas emissions persisted. Figure 82 shows the lava flow along the axis where extensive glowing flows were visible. Some flows around this time were fed by lava tubes.
Geologic Background. Piton de la Fournaise is a massive basaltic shield volcano on the French island of Réunion in the western Indian Ocean. Much of its more than 530,000-year history overlapped with eruptions of the deeply dissected Piton des Neiges shield volcano to the NW. Three scarps formed at about 250,000, 65,000, and less than 5,000 years ago by progressive eastward slumping, leaving caldera-sized embayments open to the E and SE. Numerous pyroclastic cones are present on the floor of the scarps and their outer flanks. Most recorded eruptions have originated from the summit and flanks of Dolomieu, a 400-m-high lava shield that has grown within the youngest scarp, which is about 9 km wide and about 13 km from the western wall to the ocean on the E side. More than 150 eruptions, most of which have produced fluid basaltic lava flows, have occurred since the 17th century. Only six eruptions, in 1708, 1774, 1776, 1800, 1977, and 1986, have originated from fissures outside the scarps.
Information Contacts: Laurent Michon and Patrick Bachélery, Laboratoire GéoSciences Réunion, Institut de Physique du Globe de Paris, Université de La Réunion, CNRS, UMR 7154-Géologie des Systèmes Volcaniques, La Réunion, France; Guillaume Levieux, Thomas Staudacher, and Valérie Ferrazzini, Observatoire Volcanologique du Piton de la Fournaise (OVPDLF), Institut de Physique du Globe de Paris, 14 route nationale 3, 27ème km, 97418 La Plaine des Cafres, La Réunion, France (URL: http://www.ipgp.fr/fr/ovpf/actualites-ovpf/).
Santa Maria (Guatemala) — March 2010 Cite this Report
Santa Maria
Guatemala
14.757°N, 91.552°W; summit elev. 3745 m
All times are local (unless otherwise noted)
Continuing frequent ash explosions through 2008-2009
Ongoing volcanism, including ash explosions, pyroclastic flows, avalanches, and lahars had continued through November 2007 at Santa Maria (BGVN 32:10). Subsequent activity has been closely monitored by the Instituto Nacional de Sismologia, Vulcanologia, Meteorologia, e Hidrologia (INSIVUMEH), with input from the Washington Volcanic Ash Advisory Center (VAAC).
Activity during 2008. On 11 January 2008, INSIVUMEH reported constant avalanches of blocks from the lava flows on the W and SW flanks of Santa María's Santiaguito lava dome complex. Weak-to-moderate explosions produced ash plumes that rose to altitudes of 4.1-4.5 km and drifted SW. On 6 February, weak explosions generated white columns of water and steam and ash that rose ~ 200 m above the crater rim. There were also a few avalanches onto the W flank lava flow. Degassing on 8 February was characterized by steam and gray plumes of fine ash on the SW flank. A significant magmatic explosion that threw fine ash up to ~ 5 km altitude and drifted ~ 4 km to the SW was followed by weak explosions of steam and ash. Avalanches of blocks from the crater rim on 12 February reached the lava flows on the S and SW flanks. Two moderate explosions expelled gray ash up to ~ 4 km altitude that dispersed to the SW.
The Washington VAAC (based on satellite imagery) reported that ash "puffs" from the Santiaguito lava dome complex rose ~ 4.5 km and drifted SW on 1 April, and then rose ~ 4 km and drifted W on 2 April. During 3-7 April, small explosions produced ash plumes; ashfall was reported in surrounding areas. This was followed on 15 April by three explosions expelling ash 300-900 m above the volcano and dispersing 5 km to the SW. Constant avalanches occurred to the W and SW. On 18 April another volcanic ash emission was reported by the Washington VAAC which rose to ~ 4.8 km, drifted SW, and extended ~ 30 km. More weak to moderate explosions occurred on 21 April which expelled gray ash clouds 300-800 m above the crater rim that drifted E. This activity was repeated on 25 April; the Washington VAAC reported an ash emission which rose to ~ 4.8 km and drifted ~ 13 km SW. On 28 April explosions sent ash plumes to an altitude of 4.1 km that drifted W.
Based on observations of satellite imagery, the Washington VAAC reported that ash puffs from the Santiaguito complex drifted NW on 13 May. On 22 May, two explosions were heard and gray ash emissions rose ~ 300-600 m above the crater rim and drifted S and SW, depositing ash in the Palajunoj area. Avalanches of blocks on the SW flanks were seen and heard. A lahar descended the Nima I River to the S on 25 May.
On 3 June, a Special Bulletin was issued to warn of the potential high water conditions in the Nimá I, Nimá II, San Isidro, Drum, Samala, rivers as a result of heavy rains in the area. On 5 June, avalanches were heard on the flanks of the volcano and overflows into the Samal and Mulu Rivers were reported. A lahar on 9 June about 15 m wide and up to 2 m deep descended the Nima I River, carrying blocks up to 1 m in diameter, and smelling of sulfur.
During the morning of 19 June, six weak-to-moderate explosions produced ash plumes that rose to altitudes of 2.8-3.3 km and drifted SW and S. An incandescent lava flow accompanied by constant avalanches of blocks descended the SW flank. On 20 June, five weak-to-moderate explosions expelled gray ash up to ~ 600-800 m above the crater, spreading to the SW over the area of Palajunoj. The lava flow to the SW continued and incandescent lava could be seen at night, accompanied by constant avalanches of blocks and fine ash. A lahar traveled S down the Nima I river, carrying blocks up to 1 m in diameter. These conditions continued through 24 June.
On 4 July, an explosion produced an ash plume that rose to an altitude of 3.3 km and drifted SW. A lahar traveled S down the Nima I River, carrying tree limbs and blocks up to 50 cm in diameter. On 7-8 July, sounds resembling avalanches descending the flanks were reported; visual observations were hindered due to cloud cover. On 22 July seismic stations detected a lahar in the Nima I river. Explosions observed on 23, 28, and 29 July from the Caliente cone produced ash plumes that rose to altitudes of 2.8-3.3 km and drifted SW and W. Ashfall was reported in areas downwind. A lava flow and avalanches of blocks descended the SW flank. On 28 July, weak pyroclastic flows also traveled down the SW flank.
During 21-26 August, explosions from the Caliente cone, part of the Santiaguito complex, produced ash plumes that rose to altitudes of 2.8-3.3 km and drifted S, SW, and W. Constant degassing from the crater was noted.
On 10 September seismic stations detected a lahar in the Nima I River. The lahar, about 18 m wide and up to 2 m deep, carried blocks and smelled of sulfur. During 11-16 September, explosions produced ash plumes that rose to altitudes of 2.8-3.3 km and drifted SW; on 18 September, the Washington VAAC reported that an ash plume rose to an altitude of 4.3 km and drifted SSW. On 24 September explosions produced ash plumes that rose to altitudes of 2.8 km and drifted SW. Avalanches of material from lava flows descended the SW flank.
On 11 and 15 November, the Washington VAAC reported that ash puffs drifted SW. On 12 December, explosions from the Caliente dome produced an ash plume that rose to an altitude of 3.2 km and drifted SW; the Washington VAAC reported a plume to an altitude of 5.8 km. On 16 December, two ash puffs drifted W and WNW at altitudes of 4.3-4.6 km. The Washington VAAC again reported that during 17-20 and 22 December ash plumes drifted SW, W, and NW; plumes rose to an altitude of 5.8 km. On 22 December, white plumes drifted SW and avalanches occurred from the crater rim. On 23 December a small ash plume drifted NW and explosions resulted in pyroclastic flows. Ash plumes rose to an altitude of 3.3 km and drifted S and SW. On 25 December a puff of ash drifted WNW.
Activity during 2009. Activity continued into 2009 and the Washington VAAC reported that two small ash plumes drifted ESE on 1 January. During 4-5 January, gas and steam plumes possibly containing some ash drifted SW and WSW. On 5 and 6 January fumarolic plumes drifted 100 m above the crater. Five explosions produced ash plumes that rose to altitudes of 2.8-3 km and drifted W and SE. A few avalanches originating from a lava flow descended the W flank. Explosions during 30 January-3 February produced plumes that rose to altitudes of 2.6-3.2 km and drifted W, SW, and S. Avalanches that were periodically incandescent descended the S and W flanks of Caliente lava dome.
The Washington VAAC reported that on 4 February multiple ash puffs drifted W. Explosions on 6 February produced plumes that rose to altitudes of 2.8-3.1 km and also drifted SW. Ashfall was reported in areas downwind. Ash puffs on 12 February drifted WSW and W. On 16-17 February, explosions produced ash plumes that rose to altitudes of 2.7-3.3 km and drifted SW. Small pyroclastic flows on 16 February descended the SE flank and reached the Nima I River. Incandescent avalanches were noted on 17 February and fumarolic plumes drifted SW.
On 18 February, a dense ash plume drifted W, and on the 20th an explosion sent an ash plume to an altitude of 3.2 km that drifted E. On 24 February, an explosion produced a white plume that rose 500 m above the summit and drifted SW. Incandescence was seen SW of Caliente dome. On 26-27 February and 2 March, explosions produced ash plumes that rose to altitudes of 2.8-3.4 km and drifted SW. Ashfall was reported in nearby areas. Avalanches were seen SW of the Caliente dome.
Based on satellite imagery, the Washington VAAC reported that during 4-6 March ash plumes drifted W. On 6 and 10 March, ash plumes rose to 2.8-3.4 km and drifted SW, NW, and N. Ashfall was reported in areas downwind. On 12, 16, and 17 March, explosions produced ash plumes that rose to altitudes of 2.7-3.5 km and drifted E and SW. A few avalanches originated from an active lava flow and traveled down the SW flank. On 12 March an ash plume drifted S, and on 15 March, an ash plume rose to an altitude of 3 km and drifted SW and WSW.
During 24-28 April explosions produced ash plumes that drifted 5-8 km WSW, although the number of explosions had decreased during the previous few weeks. On 5, 8, and 9 June ash plumes rose to altitudes of 2.8-3.3 km and drifted SW. Gas plumes that were sometimes gray rose ~ 300-600 m above the Caliente dome, and avalanches descended the S and W flanks. On 26 and 29 June explosions produced ash plumes that rose to altitudes of 2.9-3.3 km and drifted W and SW.
On 26 June, the seismic network detected a lahar that traveled S down the Nima I River. Steam plumes and a sulfur odor rose from the deposits. The lahar was 15 m wide and 1 m thick at the toe, and carried blocks up to 1.5 m in diameter. On 2 July lahars descended both the Nimá I and Nimá II rivers, carrying tree branches and blocks 50-75 cm in diameter. The lahars were 15 and 20 m wide.
On 6 July, explosions produced ash plumes that rose to altitudes of 2.8-3.2 km and drifted W. On 31 July and 3 August, explosions produced ash plumes, and the Caliente lava dome was incandescent. On 3 August, ash plumes rose to an altitude of 3.1 km and drifted W. Fumarolic plumes rose 200 m above the dome and rumbling noises were occasionally heard.
On 28 August, another explosion was noted. On 1 September, fumarolic plumes rose 150 m above Caliente dome and drifted SW and avalanches descended the SW flank of the dome. On 14 September an explosion produced an ash plume that rose to an altitude of 3.3 km. The plume drifted SW and caused ashfall. Avalanches went to the SW.
The Washington VAAC reported that on 22 October multiple ash plumes drifted less than 20 km SW. On 23 and 26 October, explosions produced ash plumes that rose above Caliente dome to altitudes of 3-3.3 km. The plumes drifted W and SE and caused ashfall. Avalanches descended the SW flank of the dome. Degassing sounds resembling airplane engines were also heard.
On 6 November, an explosion produced a plume that rose 900 m and drifted SW. The Washington VAAC reported that on 8 November a small gas plume possibly containing ash drifted less than 10 km SSW. Another small plume was seen later that day. On 13 November, a plume drifted SW. Avalanches descended the SW flank of the dome and the Washington VAAC reported that on 16 November multiple ash plumes drifted WSW.
On 20 November, two explosions produced an ash plume that drifted SW. Avalanches descended the SW flank of the dome. An explosion on 24 November produced an ash plume the rose to an altitude of 3.3 km and drifted SE. Ashfall was reported in areas downwind.
On 11, 14, and 15 December, explosions produced ash plumes that rose to altitudes of 2.8-3.5 km and drifted W and SW. Avalanches occasionally descended the SE flank of the dome. On 15 December, explosions generated pyroclastic flows that descended the E and SW flanks. On 30 December explosions produced ash plumes that rose to altitudes of 3-3.4 km and drifted W and SW. The Washington VAAC reported that ash plumes seen on satellite imagery drifted more than 30 km WSW. Avalanches occasionally descended the SW flank of the dome.
Activity during January-April 2010. Incandescent avalanches traveled down the SW flanks on 8 January 2010. A few explosions on 5 and 11-12 January produced ash plumes that rose to altitudes of 3.1-3.4 km and drifted S, SE, and SW. Avalanches from a lava flow descended the W flank of the dome. On 21 January ashfall was reported in areas near the Santiaguito complex. The next day an explosion produced an ash plume that rose to an altitude of 3.2 km and drifted SW. An ash plume seen on satellite imagery drifted less than 10 km.
On 2 and 4 March, explosions produced ash plumes that rose to altitudes of 2.7-3.1 km and drifted E and NE. Ash fell in areas downwind. Ash fell in inhabited areas downwind. The Washington VAAC reported that on 8 March an ash plume was seen in satellite imagery drifting WNW. On 29 March, explosions produced ash plumes that rose to altitudes of 3-3.3 km and drifted W over inhabited areas. Avalanches from a lava flow descended the SW flank. On 30 March a diffuse ash plume was seen in satellite imagery.
On 20 April, explosions produced ash plumes that rose to altitudes of 2.8-3.4 km and drifted S and SE. On 26 April, ash explosions and pyroclastic flows generated ash plumes that rose to an altitude of 8.3 km and drifted NW and N. Ashfall was reported in Quetzaltenango (18 km WNW) and other areas to the W, NW, and N. According to news articles, schools in 10 communities were closed and flights were banned within a 20-km-radius of the volcano.
Geologic Background. Symmetrical, forest-covered Santa María volcano is part of a chain of large stratovolcanoes that rise above the Pacific coastal plain of Guatemala. The sharp-topped, conical profile is cut on the SW flank by a 1.5-km-wide crater. The oval-shaped crater extends from just below the summit to the lower flank, and was formed during a catastrophic eruption in 1902. The renowned Plinian eruption of 1902 that devastated much of SW Guatemala followed a long repose period after construction of the large basaltic-andesite stratovolcano. The massive dacitic Santiaguito lava-dome complex has been growing at the base of the 1902 crater since 1922. Compound dome growth at Santiaguito has occurred episodically from four vents, with activity progressing E towards the most recent, Caliente. Dome growth has been accompanied by almost continuous minor explosions, with periodic lava extrusion, larger explosions, pyroclastic flows, and lahars.
Information Contacts: Instituto Nacional de Sismologia, Vulcanología, Meteorología, e Hidrologia (INSIVUMEH), Unit of Volcanology, Geologic Department of Investigation and Services, 7a Av. 14-57, Zona 13, Guatemala City, Guatemala (URL: http://www.insivumeh.gob.gt/); Washington Volcanic Ash Advisory Center, Satellite Analysis Branch (SAB), NOAA/NESDIS E/SP23, NOAA Science Center Room 401, 5200 Auth Rd, Camp Springs, MD 20746, USA (URL: http://www.ospo.noaa.gov/Products/atmosphere/vaac/); Coordinadora Nacional para la Reducción de Desastres (CONRED), Av. Hincapié; 21-72, Zona 13, Guatemala City, Guatemala (URL: http://www.conred.org/).
Sheveluch
Russia
56.653°N, 161.36°E; summit elev. 3283 m
All times are local (unless otherwise noted)
Near-constant dome growth during May 2008 through March 2010
Volcanism at Shiveluch that has been almost continuous since 1980 remained so from May 2008 through March 2010. During that time the lava dome was active and frequently growing, and produced moderate and weak explosions (figure 18). The most active phases took place during July-October 2008, March-April 2009, and November-December 2009 (figure 19).
During the two years discussed, there were many short-lived ash plumes (1-3 km above the dome), ash clouds produced by rockfalls and avalanches, and strong explosions that generated long-distance plumes (those with 'ash cloud' symbols above the arrows, figure 19). The large explosive eruptions of 26 April and 23 June 2009 sent respective ash plumes to 510 km and 754 km distances (table 8). The day after the earlier event, there was clear visibility on 27 April (figure 20).
Table 8. Significant explosions and ash plumes recorded at Shiveluch from May 2008 to March 2010. Plumes lower than ~1.2 km above the dome and seen for less than 10 km from the vent were omitted. Data courtesy of KVERT.
| Date |
Plume altitude (m) |
Plume extension (km) |
| 14 May 2008 |
5800 |
-- |
| 20 May 2008 |
5500 |
-- |
| 27 May 2008 |
3600 |
-- |
| 25 Jun 2008 |
4200 |
-- |
| 13 Sep 2008 |
6500 |
100 km NE |
| 28 Sep 2008 |
5000 |
-- |
| 01 Oct 2008 |
-- |
70 km S, W |
| 14 Oct 2008 |
6000 |
-- |
| 16 Oct 2008 |
4500 |
-- |
| 19 Oct 2008 |
-- |
30 km E |
| 20 Oct 2008 |
-- |
62 km E |
| 05-06 Nov 2008 |
4000 |
-- |
| 04 Dec 2008 |
-- |
25 km NE |
| 17 Jan 2009 |
-- |
10 km E |
| 20 Jan 2009 |
4500 |
-- |
| 25 Feb 2009 |
5500 |
-- |
| 04 Mar 2009 |
4700 |
-- |
| 10 Mar 2009 |
6000 |
-- |
| 24 Mar 2009 |
7500 |
-- |
| 27-29 Mar 2009 |
-- |
10 km SE |
| 04 Apr 2009 |
4500 |
-- |
| 05 Apr 2009 |
-- |
10 km E |
| 15, 22 Apr 2009 |
4000 |
-- |
| 25 Apr 2009 |
6700 |
50 km SE |
| 26 Apr 2009 |
5000 |
510 km SE |
| 27-29 Apr 2009 |
5000 |
107-120 km NE |
| 13 May 2009 |
5000 |
-- |
| 22 May 2009 |
4000 |
-- |
| 10 Jun 2009 |
7700 |
-- |
| 11 Jun 2009 |
4500 |
140 km SW |
| 13-14 Jun 2009 |
5500-6100 |
-- |
| 18 Jun 2009 |
5700 |
-- |
| 20 Jun 2009 |
5000 |
-- |
| 23 Jun 2009 |
-- |
754 km S |
| 24 Jun 2009 |
-- |
28 km NW |
| 25 Jun 2009 |
-- |
95 km |
| 03 Jul 2009 |
-- |
20 km SE |
| 18 Jul 2009 |
-- |
34 km E |
| 24 Jul 2009 |
5000 |
-- |
| 27 Jul 2009 |
5000 |
10 km E |
| 02 Aug 2009 |
-- |
23 km E |
| 15 Aug 2009 |
4500 |
-- |
| 31 Aug 2009 |
-- |
107 km E |
| 02 Sep 2009 |
-- |
20 km S |
| 11 Sep 2009 |
15000 |
-- |
| 18-19 Sep 2009 |
5000-5500 |
-- |
| 20 Sep 2009 |
-- |
30 km NW |
| 22 Sep 2009 |
4500 |
70 km SW |
| 29 Sep 2009 |
-- |
45 km E |
| 02-03 Oct 2009 |
-- |
30-60 km SE |
| 30 Oct 2009 |
-- |
255 km E |
| 04-05 Nov 2009 |
4200-4500 |
-- |
| 10 Mar 2010 |
5500 |
-- |
| 11 Mar 2010 |
-- |
10 km E |
KVERT noted that on 11 September 2009 there were strong explosions. Based on interpretations of seismic data, the inferred ash plumes that day rose to an altitude greater than 15 km above sea level. The seismic network then detected 8 minutes of signals interpreted as pyroclastic flows from the lava dome; resulting plumes rose to an altitude of ~ 15 km. Cloud cover prevented visual observations. Ten more events characterized as ash explosions and either pyroclastic flows or avalanches were detected. Seismicity then decreased during 11-12 September. A visit during clear visibility on 13 September revealed fresh pyroclastic-flow deposits (figure 21).
Seismicity. Extended intervals of low-level seismicity were detected at the dome in May and June 2008, during May to October 2009, and to some extent from January through March 2010 (figure 19, bottom). A plot of regional seismicity during December 2009-5 April 2010 in a 70-km-diameter circle around Shiveluch (figure 22) indicates SW-dipping epicenters that rise to shallow depths under Shiveluch (and similarly for other volcanoes in the Kliuchevskoi group).
Geologic Background. The high, isolated massif of Sheveluch volcano (also spelled Shiveluch) rises above the lowlands NNE of the Kliuchevskaya volcano group. The 1,300 km3 andesitic volcano is one of Kamchatka's largest and most active volcanic structures, with at least 60 large eruptions during the Holocene. The summit of roughly 65,000-year-old Stary Shiveluch is truncated by a broad 9-km-wide late-Pleistocene caldera breached to the south. Many lava domes occur on its outer flanks. The Molodoy Shiveluch lava dome complex was constructed during the Holocene within the large open caldera; Holocene lava dome extrusion also took place on the flanks of Stary Shiveluch. Widespread tephra layers from these eruptions have provided valuable time markers for dating volcanic events in Kamchatka. Frequent collapses of dome complexes, most recently in 1964, have produced debris avalanches whose deposits cover much of the floor of the breached caldera.
Information Contacts: Kamchatka Volcanic Eruptions Response Team (KVERT), Institute of Volcanology and Seismology (IV&S) Far East Division, Russian Academy of Sciences (FED RAS), Kamchatka Branch of the Geophysical Service of the Russian Academy of Sciences (KB GS RAS), Piip Ave. 9, Petropavlovsk-Kamchatsky, 683006, Russia (URL: http://www.kscnet.ru/ivs, http://www.emsd.ru/~ssl/monitoring/main.htm); Yuri Demyanchuk, IV&S FED RAS; Alaska Volcano Observatory (AVO), a cooperative program of the U.S. Geological Survey, 4200 University Drive, Anchorage, AK 99508-4667, USA (URL: http://www.avo.alaska.edu/), the Geophysical Institute, University of Alaska, PO Box 757320, Fairbanks, AK 99775-7320, USA, and the Alaska Division of Geological and Geophysical Surveys, 794 University Ave., Suite 200, Fairbanks, AK 99709, USA.
Soufriere Hills (United Kingdom) — March 2010 Cite this Report
Soufriere Hills
United Kingdom
16.72°N, 62.18°W; summit elev. 915 m
All times are local (unless otherwise noted)
Lava dome growth continuing; pyroclastic flows reached the ocean
Montserrat Volcano Observatory (MVO) reported a strong increase in dome growth at Soufrière Hills (figure 82) and energetic explosive activity, including pyroclastic flows and substantial ash clouds, during the 6 months ending early April 2010 (the end of this reporting interval). Energetic extrusions were particularly noteworthy during January and February 2010 (table 69). From mid-December 2009 through early April 2010 there was continuing seismicity and gas emissions (table 70) as well as weekly ash emissions and pyroclsatic flows (table 71). Partial dome collapse on 11 February 2010 led to a plume that rose to ~15 km altitude.
Table 69. Key features of the five Vulcanian explosions that occurred at Soufriere Hills in January and February 2010. Units in valley columns are pyroclastic-f low runout distances in kilometers. From Cole and others (2010) with due credit to Washington Volcanic Ash Advisory Center (VAAC) for satellite and aviation-based plume altitude estimates.
| Date |
Time (local) |
Lapilli Fallout |
Plume |
White's Bottom Ghaut |
Tar River Valley |
Farrells Plain |
Tyers Ghaut/Belham Valley |
Gages |
Gingoes Ghaut |
White River |
| 08 Jan 2010 |
1449-1500 |
No: Ash from PFs |
7.6 km (25,000 ft) |
4.7 |
2 |
2 |
5.8 |
4 |
2.6 |
1.5 |
| 10 Jan 2010 |
0128-0135 |
Not known |
6.7 km (22,000 ft) |
>2 |
-- |
1.5 |
2.5 |
3 |
-- |
-- |
| 10 Jan 2010 |
2027-2031 |
Yes: pumice |
5.5 km (18,000 ft) |
1.5 |
2 |
-- |
-- |
-- |
-- |
-- |
| 05 Feb 2010 |
1349-1356 |
Yes: non-pumiceous |
6.7 km (22,000 ft) |
1.5 |
2 |
1.5 |
2 |
4 |
1.5 |
1.5 |
| 08 Feb 2010 |
1957-2003 |
Not known |
4.6 km (15,000 ft) |
-- |
-- |
-- |
-- |
3.5 |
-- |
-- |
Table 70. Soufrière Hills seismicity and gas measurements from weekly reports between 4 December 2009 and 19 March 2010. MVO seismicity terminology as follows: Rockfall signals (featureless, high-frequency events, which correlate to large rockfalls from the dome); Volcano-tectonic (high frequencies >5 Hz, often impulsive P-phases and usually clear S-phases); Long-period (generally phaseless events with predominant frequency ~1 Hz); Hybrid (repetitive transient events of intermediate frequency, 3-5 Hz, without discernible S-phases; initial high-frequency waveforms at some stations) (MVO, 1996). Numbers refer to the total over the period indicated. Hydrochloric acid/sulfur dioxide ratios (HCl/SO2) are derived from Fourier Transform Infrared (FTIR) gas measurements. Cycles of activity refer to rockfalls, ash venting, and pyroclastic flows. "--" indicates that data was not reported. Courtesy of MVO.
| Date |
Rockfall signals |
Long-period EQ's |
Volcano-tectonic EQ's |
Hybrid EQ's |
Observations |
| 04 Dec-11 Dec 2009 |
957 |
207 |
3 |
6 |
Activity (pyroclastic flow, ash venting, rock falls, etc.) continued in cycles more irregular in time in the last few days; 10 Dec-hazard level raised from 3 to 4. |
| 11 Dec-18 Dec 2009 |
977 |
134 |
3 |
58 |
Cycles of activity continue, varying between 5 and 6 hours; intensity of cycles decreased slightly through the week, however an increase in intensity occurred after about 1600 on 17 Dec. |
| 18 Dec-24 Dec 2009 |
594 |
154 |
3 |
25 |
Cycles of activity with periods between 6 and 7 hours; heavy ashfall NW Montserrat. |
| 24 Dec-31 Dec 2009 |
270 |
52 |
-- |
6 |
Cycles of activity with periods between 6 and 8 hours. |
| 31 Dec-08 Jan 2010 |
135 |
73 |
1 |
16 |
Cycles of activity with periods between 8 and 10 hours; ashfall in Old Towns, Salem, Olveston, Woodlands. |
| 08 Jan-15 Jan 2010 |
68 |
25 |
2 |
10 |
Three explosions occurred during the week (1449 on 8 Jan, and 0128 and 2027 on 10 Jan), each accompanied by seismic signals that lasted 11, 7, and 4 minutes, respectively; ash plumes reached altitudes of 7.6, 6.7, and 5.5 km, respectively. |
| 15 Jan-22 Jan 2010 |
196 |
38 |
-- |
18 |
Cycles of activity with 6-8-hour periods; several houses buried and set on fire in Kinsale; ash clouds associated with pyroclastic flows reached 3-km altitude. Hybrid swarm of seven larger quakes on 20 Jan. |
| 22 Jan-29 Jan 2010 |
565 |
113 |
2 |
18 |
Cycles of activity with periods between 5 and 7 hours; 25 Jan-heavy rain caused vigorous steaming of hot pyroclastic flows. |
| 29 Jan-05 Feb 2010 |
552 |
87 |
6 |
64 |
Cycles of activity with periods between 7 and 12 hours. On 5 Feb a 30-m-high pyramidal-shaped extrusion was first seen; although it temporarily put the summit elevation at 1,170 m, it was destroyed by an explosion at 1349 that day; resulting pyroclastic surges moved NW across the sea near Plymouth. |
| 05 Feb-12 Feb 2010 |
512 |
141 |
4 |
82 |
Two explosions on 5 and 8 Feb; 11 Feb-partial dome collapse, plume rose to altitude of ~15.2 km. |
| 12 Feb-19 Feb 2010 |
53 |
34 |
1 |
4 |
17 Feb data consistent with quite slow extrusion of lava; MVO not yet able to make observations into the deep crater at the dome summit. HCl/SO2 = 0.76 (17 Feb). |
| 19 Feb-26 Feb 2010 |
11 |
-- |
-- |
6 |
23 Feb-hazard level lowered from 4 to 3. HCl/SO2 = 0.74 (19 Feb); 0.7 (22 Feb). |
| 26 Feb-05 Mar 2010 |
7 |
1 |
-- |
9 |
Swarm of 7 hybrids on 4 Mar. HCl/SO2 = 0.81 (1 Mar); 0.71 (2 Mar); 0.98 (4 Mar). |
| 05 Mar-12 Mar 2010 |
47 |
9 |
2 |
7 |
Hybrid swarm of 6 on 11 Mar |
| 12 Mar-19 Mar 2010 |
41 |
3 |
-- |
7 |
17 Mar- SO2 flux 2,315 tons/day. HCl/SO2 = 0.6 |
| 19 Mar-26 Mar 2010 |
28 |
3 |
1 |
3 |
Avg. SO2 flux 342 tons/day |
| 26 Mar-02 Apr 2010 |
17 |
-- |
-- |
1 |
Avg. SO2 flux 194 tons/day |
| 02 Apr-09 Apr 2010 |
9 |
1 |
3 |
3 |
3-day avg. SO2 flux 376 tons/day |
Table 71. Brief summary of dome emissions compiled from MVO reports, 4 December 2009-1 April 2010. Date entries indicated with a * are discussed in the text. Courtesy of MVO.
| Date |
Dome Activity |
Location of pyroclastic flows (PF) and rockfalls (RF) (runout distance from dome) |
| 11 Dec-31 Dec 2009 |
Hottest and most active areas located on NW flank. |
Whites Ghaut to Whites Bottom Ghaut to the sea (4 km); Tyres Ghaut (~1-2 km); Gages valley (~2 km); Tar River valley; Gingoes Ghaut; Farrells plain, Dyers village (~2.5 km), Spring Ghaut. |
| 31 Dec-08 Jan 2010 |
Growth on N side; 2 January-40-m high, 150-m wide lobe of lava extruded onto dome. |
Whites Ghaut, Farrells plain, Tyers Ghaut. |
| 08 Jan-15 Jan 2010 * |
NE flank; 2 Jan-40-m high, 150-mwide lobe of lava extruded onto N summit of dome; 11 Jan-dome growth resumed on top, central part of dome. |
8 Jan-collapsing fountain of tephra generated PF down Whites Bottom Ghaut, Tuitts Ghaut (within several hundred meters of the sea), Tyers Ghaut, Belham valley, Tar River valley; 10 Jan-explosion produced PF down Whites Bottom and Tuitts Ghaut, Tyers Ghaut, Gages valley. |
| 15 Jan-22 Jan 2010 * |
18 Jan-partial dome collapse on W side of dome. |
18 Jan-PF reached sea down Aymers Ghaut (Gages valley to Spring Ghaut to Aymers Ghaut); houses inundated/burned in Kinsale. |
| 22 Jan-29 Jan 2010 |
Dome growth on SE side of summit; NE side of summit has steep, vertical walls; NW part more rounded. |
Increase in PF in Tar River valley (several reached sea); Whites Ghaut; heavy rain on 25 caused vigorous steaming of hot PF in Belham valley; some lahars formed. |
| 29 Jan-05 Feb 2010 |
5 Feb-central W part of lava dome grew to altitude of ~1,070 m. |
Gages valley to Spring Ghaut (~2-3 km; head of Springs Ghaut neearly full of PF deposits), Whites Ghaut. |
| 05 Feb-12 Feb 2010 * |
W side of dome; 9 Feb-activity shifted to N side of dome; 11 Feb-partial dome collapse, scar ~300 m wide on N flank of volcano (MVO-"largest event for volcano since May 2006"). |
5 Feb-volcanian explosion sent PF to Plymouth and into sea ~500 m, Tyers Ghaut (~2 km), Whites Ghaut, plume to ~8.4 km altitude; 8 Feb-small vulcanian explosion generated PF down Gages valley (over 2 km altitude), plume to ~5 km drifted E and ENE to Antigua; 11 Feb-PF reached on E side of island (coastline extended E ~650 meters at airport), Tyers Ghaut into Belham valley. |
| 12 Feb-19 Feb 2010 |
Low activity, some incandescence on dome. |
PF deposits ~15 m thick in Trant's region, PF razed many buildings in Harris and Streatham. |
| 19 Feb-26 Feb 2010 |
Low activity. |
-- |
| 26 Feb-05 Mar 2010 |
26 Feb-crater at summit of dome less than 100 m deep and ~200 m wide. |
4 Mar-Tar River valley. |
| 05 Mar-12 Mar 2010 * |
Moderate activity. |
8-9 Mar-rainfall caused degradation of dome; Gages valley (~2 km). |
| 12 Mar-19 Mar 2010 * |
Low activity; some incandescence on 14 Mar. |
-- |
| 19 Mar-26 Mar 2010 |
Low activity. |
25 Mar-Spring Ghaut (~2 km). |
| 26 Mar-02 Apr 2010 |
Low activity. |
-- |
| 02 Apr-09 Apr 2010 |
Low activity; some incandescence on dome. |
Lahars in Farm River and Trant's area. |
MVO issued a synthesis to the Scientific Advisory Committee (SAC) on volcanism between 15 August 2009 and 28 February 2010 (Cole and others, 2010). That report figures heavily in the following summary, but the included tables and comments also came from MVO reports, and there is a section on satellite thermal monitoring. Two similar earlier reports were published in 2009 (Robertson and others, 2009 and Stewart and others, 2009).
Since the dome remained active and at the same time represented the volcano's highest point, the summit elevation varied. The historical value of 915 m was a high point on the crater rim. Cole and others (2010) noted that the dome's summit was 1,050 m in September 2009, with the elevation being 1,130 m on 29 January 2010. Some taller heights involved blocky spines that did not last.
Extrusive Phase 5 activity. Extrusive Phase 4 finished on 3 January 2009 and was followed by 10 months of comparative inactivity with intermittent small pyroclastic flows and ash venting 5-7 October (BGVN 34:10). Phase 5 occurred from 4 October 2009 to 11 February 2010 (figure 83). Seismic records enabled MVO to subdivide this phase into three episodes of inferred dome growth as follows: 9 October-20 November 2009 (Episode 1); 20 November 2009-8 January 2010 (Episode 2); and 8 January-11 February 2010 (Episode 3). Cole and others (2010) noted that "A characteristic feature of Phase 5 dome growth has been the simultaneous occurrence of PFs in more than one direction, sometimes on the opposite side of the lava dome." Throughout Phase 5, ash often fell on inhabited areas.
Phase 5 began with a swarm of 24 volcano-tectonic (VT) earthquakes and ash venting. Gas fluxes had been low for two days prior to the onset of activity. The dome variously grew to the S, W, and N, and pyroclastic flows traveled in many directions. The eruptive style was described as "ash venting" rather than "explosions" due to the mild character of the associated seismic signals and the absence of ballistic fragments. Fallout deposits included comparatively coarse, well-sorted ash.
October dome growth mostly occurred on the S, with shed material filling the upper part of the SW flank's White River and covering what had stood as a protective wall for material traveling WSW. As a result, for the first time, substantial pyroclastic flows entered the WSW flank's Gingoes and Aymer's Ghauts, reaching the sea there with runout distances of over 4 km in those drainages.
Cyclic episodes of tremor occurred particularly during episode 2. On 23 November tremor occurred all day; it then waned and began to appear in cycles at 4-hour intervals, initially with signals of long-period and hybrid earthquakes. The tremor appeared associated with increased venting lasting 0.5-2 hours with plume heights to 5 km altitude. At 0640 on 10 December 2009, a large pyroclastic flow traveled down Tyers (Tyres) Ghaut and reached ~3.5 km from the lava dome.
Vigorous Vulcanian explosions occurred on five occasions during January-February 2010 (table 69), episode 3. All of these involved collapsing ash columns, producing fountain collapse pyroclastic flows that typically descended more than one ghaut. One explosion on 8 January, the largest by volume during January-February, sent a pyroclastic flow ~ 6 km down the Belham Valley. Two more Vulcanian explosions occurred during the night on 10 January.
Dome collapse of 11 February 2010. A large dome collapse took place in the early afternoon of 11 February, one day after a shift in dome-growth direction, and had several pulses. The collapse comprised 40-50 million cubic meters of material, and represented roughly 20% of the dome's total volume. A collapse scar ~ 300 m wide developed on the N flank of the dome. The collapse ended with vertically-directed explosions that created a new crater behind the collapsed part of the dome.
The collapse produced large pyroclastic flows and surges, mainly to the N and NE, that extended the E coastline (between Trants and Spanish Point), adding ~1 km2 of new land. Two smaller flows also traveled NW and entered the Belham Valley.
A large ash column resulted from the collapse that reached ~15 km altitude, causing extensive ashfall on Guadeloupe (~60 km SE) and other parts of the eastern Caribbean. After 11 February, both seismicity and surface activity quieted but deep deformation returned. Gas measurements also indicated that the system remained active.
Pyroclastic flows traveled N and NE toward the old airport. The extensive pyroclastic-flow deposits extended the coastline 300-400 m out to sea. The coastal area impacted extended from Whites Bottom Ghaut to Trants Bay, just N of the old Bramble airport (figures 84 and 85). The effects were clearly visible on the NE flanks. Some flows, ~ 15 m thick, reached the sea at Trant's Bay. These flows extended the island's coastline up to 650 m to the E.
Towards the end of the collapse there was an energetic pyroclastic flow directed N over Streatham and Harris. This sent flows over the Harris Ridge into Bugby Hole and down the Farm River (~3.5 km from the dome) for the first time. The flows razed many buildings in both Harris and Streatham down to their foundations, and trees were felled by pyroclastic surges in the Gun Hill area and at the head of Farm River in Bugby Hole.
It was unclear whether there was any new dome growth within the crater during the week after the collapse. Night-time views of the dome revealed several small points of incandescence. Observations of the crater at the summit of the dome on 26 February found that it was then 50-100 m deep and ~200 m wide (figure 86). There was no newly extruded lava visible inside the crater.
Heavy rain on 8-9 March caused vigorous steaming of the hot 11 February deposits (figure 87). Strong geysering was visible at Trants near the old Bramble airport, with ash and steam fountaining occurring. In addition, lahars traveled down several drainages, including the Belham valley. Small spots of incandescence on the dome were visible again on 14 March. Occasional small pyroclastic flows and rockfalls were still occurring mainly from the western and southern parts of the dome.
MODVOLC Thermal Alerts. According to the Hawai'i Institute of Geophysics and Planetology (HIGP) Thermal Alerts System, no satellite thermal alerts were measured over Soufrière Hills between 29 March 2007 and 3 December 2008. Satellite thermal alerts were measured almost daily during 11 October 2009 through 15 February 2010. An isolated thermal alert was measured on 10 March 2010. Previously shorter periods of thermal alerts were measured during 11-29 March 2007 and 3 December 2008-3 January 2009.
References. Cole, P., Bass, V., Christopher, C., Fergus, M., Gunn, L., Odbert, H., Simpson, R., Stewart, R., Stinton, A., Stone, J., Syers, R., Robertson, R., Watts, R., and Williams, P., 2010, Report to the Scientific Advisory Committee on Montserrat Volcanic Activity, Report on Activity between 15 August 2009 and 28 February 2010, Open File Report OFR 10-01a, Prepared for SAC 14: 22-24 March 2010. Montserrat Volcano Observatory (MVO).
Robertson, R., Babal, L., Bass, V., Christopher, T., Chardot, L., Fergus, M., Fournier, N., Higgins, M., Joseph, E., Komorowski, J.-C., Odbert, H., Simpson, R., Smith, P., Stewart, R., Stone, J., Syers, R., Tsaines, B., and Williams, P., 2009, Report for the Scientific Advisory Committee on Montserrat Volcanic Activity, Prepared for SAC 13: 7-9 September 2009, MVO Open File Report 09/03.
Stewart, R., Bass, V., Chardot, L., Christopher, T., Dondin, F., Finizola, A., Fournier, N., Joseph, E., Komorowski, J.-C., Legendre, Y., Peltier, A., Robertson, R., Syers, R., and Williams, P., 2009, Report for the Scientific Advisory Committee on Montserrat Volcanic Activity, Prepared for SAC12: 9-11 March 2009, MVO Open File Report 09/01.
Wadge, G., Macfarlane, D.G., Robertson, D.A., Hale, A.J., Pinkerton, H., Burrell, R.V., Norton, G.E., and James, M.R., 2005, AVTIS: a novel millimetre-wave ground based instrument for volcano remote sensing: J. Volcanology and Geothermal Research, v. 146, no. 4, p. 307-318.
MVO, 1996, MVO/VSC Open Scientific Meeting, 27 November 1996, Seismicity of Montserrat Soufrière Hills Volcano Eruption, July 1995-November 1996 (URL: http://www.geo.mtu.edu/volcanoes/west.indies/soufriere/govt/meetings/nov1996/02.html).
Geologic Background. The complex, dominantly andesitic Soufrière Hills volcano occupies the southern half of the island of Montserrat. The summit area consists primarily of a series of lava domes emplaced along an ESE-trending zone. The volcano is flanked by Pleistocene complexes to the north and south. English's Crater, a 1-km-wide crater breached widely to the east by edifice collapse, was formed about 2000 years ago as a result of the youngest of several collapse events producing submarine debris-avalanche deposits. Block-and-ash flow and surge deposits associated with dome growth predominate in flank deposits, including those from an eruption that likely preceded the 1632 CE settlement of the island, allowing cultivation on recently devegetated land to near the summit. Non-eruptive seismic swarms occurred at 30-year intervals in the 20th century, but no historical eruptions were recorded until 1995. Long-term small-to-moderate ash eruptions beginning in that year were later accompanied by lava-dome growth and pyroclastic flows that forced evacuation of the southern half of the island and ultimately destroyed the capital city of Plymouth, causing major social and economic disruption.
Information Contacts: Montserrat Volcano Observatory (MVO), Fleming, Montserrat, West Indies (URL: http://www.mvo.ms/); Washington Volcanic Ash Advisory Center (VAAC), Satellite Analysis Branch (SAB), NOAA/NESDIS E/SP23, NOAA Science Center Room 401, 5200 Auth Rd, Camp Springs, MD 20746, USA (URL: http://www.ospo.noaa.gov/Products/atmosphere/vaac/); NASA Earth Observatory (URL: http://earthobservatory.nasa.gov/); Hawai'i Institute of Geophysics and Planetology (HIGP) Thermal Alerts System, School of Ocean and Earth Science and Technology (SOEST), Univ. of Hawai'i, 2525 Correa Road, Honolulu, HI 96822, USA (URL: http://modis.higp.hawaii.edu/).
Stromboli
Italy
38.789°N, 15.213°E; summit elev. 924 m
All times are local (unless otherwise noted)
Explosions and lava flows in 2009; recent reports on 2007 eruption
Sonia Calvari of the Istituto Nazionale di Geofisica e Vulcanologia (INGV) reported that the 2007 eruptive episode at Stromboli started on 27 February and finished on 2 April (BGVN 32:04) Additional details about this eruption can be found in Barberi and others (2009) and Calvari and others (2010). Eruptions later in 2007 and during 2008 will be reported in a later issue; summaries of activity in 2009 and January 2010 are included below.
Activity during 2009. The summit activity in 2009 was very unusual, producing four or five intracrater lava flows. Lava within the crater depression was extruded on 22-25 April, 3 May, and 30 August 2009. On 8 November a major explosion from the vents in the central crater fragmented and destroyed part of the E flank of the cinder cone there. The explosion produced an eruptive column over 350 m high that drifted SE and was soon followed by a lava flow from the widened central vent. The lava flow spread within the crater depression for a few minutes and reached a maximum distance of ~ 60 m. After the 8 November explosion, activity returned to background levels.
Strong seismic activity was recorded on 24 November 2009. Observers saw an explosive eruption cloud and the emission of a lava flow. Ejecta fallout affected the summit area, particularly the Pizzo sopra la Fossa, where numerous volcanic bombs landed. Also affected was the eastern downwind flank, where a layer of pumice was deposited on the beach. The fallout of incandescent material caused some vegetation fires on the E flank. After this explosive activity, seismicity returned to the level previously observed.
Activity during January 2010. According to the INGV website, at 1912 UTC on 4 January 2010, the network of surveillance cameras recorded an explosion that affected the central vent area. During a first phase, coarse pink pyroclastic materials (bombs and possibly lithic particles) were erupted from the entire crater terrace. A second phase followed with the emission of a small ash plume. Beginning at 0757 UTC on 7 January, the IR camera located on the Pizzo sopra la Fossa showed spattering lava in the central portion of the crater, leading to a series of lava flows; the lava stopped around 0100 UTC on 8 January. At 1448 UTC on 10 January, the INGV network of surveillance cameras recorded a strong explosion that affected the N portion of the crater, causing a major fallout of volcanic bombs at Pizzo sopra la Fossa and high on the NE part of the volcano.
References. Barberi, F., Rosi, M., and Scendone, R. (eds), 2009, The 2007 eruption of Stromboli: Journal of Volcanology and Geothermal Research, v. 182, no. 3-4, p. 123-280.
Calvari, S., Lodato, L., Steffke, A., Cristaldi, A., Harris, A.J.L., Spampinato, L., and Boschi, E., 2010, The 2007 Stromboli eruption: Event chronology and effusion rates using thermal infrared data: Journal Geophysical Research, Solid Earth, 115, B4, B04201, doi:10.1029/2009JB006478.
Geologic Background. Spectacular incandescent nighttime explosions at Stromboli have long attracted visitors to the "Lighthouse of the Mediterranean" in the NE Aeolian Islands. This volcano has lent its name to the frequent mild explosive activity that has characterized its eruptions throughout much of historical time. The small island is the emergent summit of a volcano that grew in two main eruptive cycles, the last of which formed the western portion of the island. The Neostromboli eruptive period took place between about 13,000 and 5,000 years ago. The active summit vents are located at the head of the Sciara del Fuoco, a prominent scarp that formed about 5,000 years ago due to a series of slope failures which extends to below sea level. The modern volcano has been constructed within this scarp, which funnels pyroclastic ejecta and lava flows to the NW. Essentially continuous mild Strombolian explosions, sometimes accompanied by lava flows, have been recorded for more than a millennium.
Information Contacts: Sonia Calvari, Istituto Nazionale di Geofisica e Vulcanologia (INGV), Sezione di Catania, Piazza Roma 2, 95123 Catania, Italy (URL: http://www.ct.ingv.it/).
Telica
Nicaragua
12.606°N, 86.84°W; summit elev. 1036 m
All times are local (unless otherwise noted)
Incandescent crater floor areas seen in November 2009 and March 2010
Telica exhibited extensive degassing and sporadic ash explosions during 2006-2008 (BGVN 34:08). Activity since then had decreased to a relatively low level, but degassing was continuing. This report discusses activity in 2009 and January-February 2010 based on reports from the Instituto Nicarag?ense de Estudios Territoriales (INETER) and from fieldwork by Mel Rodgers (University of South Florida) in November 2009 and March 2010.
INETER publishes a monthly bulletin on earthquakes and volcanic activity in Nicaragua. For Telica, most of the monthly data consists of in-field temperature measurements. An observation camera situated 20 km from the crater has not been functional for more than a year. The seismic instrument at Telica was frequently out of order during 2009.
On 20 May 2009, the sulfur dioxide output in the crater ranged from 106-251 tons per day. The maximum temperature of the crater was about 90-112°C in April and May 2009, but rose to 201°C in July, 251°C in August, and 302-317°C during September through November 2009. The maximum temperature of four fumaroles was also measured, which generally ranged from 67-72°C. These temperatures decreased in June 2009 and increased in August 2009 (to 76-105°C). The temperature of fumarole 4 decreased to 59°C in October; gas emission at that fumarole ceased altogether in November.
Visits in November 2009 and March 2010. Mel Rodgers detailed observations during fieldwork at the volcano in November 2009 and March 2010 conducted with Diana Roman (University of South Florida), Peter La Femina and Halldor Geirsson (Pennsylvania State University), and Alain Morales (INETER). On 24-25 November 2009, the group observed a set of elongated fractures flanking the crater floor through which incandescence and/or lava were clearly visible. A high concentration of gas and a steady gas-and-vapor plume were also observed in the crater. Multiple vigorous fumaroles were observed on the W side of the crater close to the top of the crater wall, and an intermittent jetting noise that appeared to be coming from the crater floor was audible from their position at the crater rim. A broadband seismometer was installed and, during the 24-hour visit, a high rate of long-period (LP) seismicity was recorded.
On 15 March 2010, the researchers returned and again observed incandescence within the crater. Incandescence was clearly visible through a C-shaped crack or skylight, SE of the 25 November 2009 location (figures 17 and 18). A high concentration of gas and a steady gas-and-vapor plume in the crater continued and vigorous degassing of the fumaroles on the crater floor was observed (figure 19). Intermittent jetting noises and rockfalls were audible coming from the crater, and at 2202 UTC a loud, low popping noise from the crater was heard. Data retrieved from the single station installed in November 2009 showed a high rate of LP seismicity from November 2009-March 2010.
A successful installation of the TESAND (Telica Seismic and Deformation) network was completed in March 2010. This network, consisting of six broadband seismometers and eight high-rate (1 Hz) continuous global positioning system stations, will be deployed for 3 years to document background LP seismicity and magmatic processes associated with quiescent volcanism.
According to the Hawai'i Institute of Geophysics and Planetology (HIGP) Thermal Alerts System, no satellite thermal alerts were measured over Telica during 2008, 2009, and through 30 April 2010.
Geologic Background. Telica, one of Nicaragua's most active volcanoes, has erupted frequently since the beginning of the Spanish era. This volcano group consists of several interlocking cones and vents with a general NW alignment. Sixteenth-century eruptions were reported at symmetrical Santa Clara volcano at the SW end of the group. However, its eroded and breached crater has been covered by forests throughout historical time, and these eruptions may have originated from Telica, whose upper slopes in contrast are unvegetated. The steep-sided cone of Telica is truncated by a 700-m-wide double crater; the southern crater, the source of recent eruptions, is 120 m deep. El Liston, immediately E, has several nested craters. The fumaroles and boiling mudpots of Hervideros de San Jacinto, SE of Telica, form a prominent geothermal area frequented by tourists, and geothermal exploration has occurred nearby.
Information Contacts: Instituto Nicaraguense de Estudios Territoriales (INETER), Apartado Postal 2110, Managua, Nicaragua; Mel Rodgers, University of South Florida; Hawai'i Institute of Geophysics and Planetology (HIGP) Thermal Alerts System, School of Ocean and Earth Science and Technology (SOEST), Univ. of Hawai'i, 2525 Correa Road, Honolulu, HI 96822 (URL: http://modis.higp.hawaii.edu/).