Recently Published Bulletin Reports
Manam (Papua New Guinea) Few ash plumes during November-December 2022
Krakatau (Indonesia) Strombolian activity and ash plumes during November 2022-April 2023
Stromboli (Italy) Strombolian explosions and lava flows continue during January-April 2023
Nishinoshima (Japan) Small ash plumes and fumarolic activity during November 2022 through April 2023
Karangetang (Indonesia) Lava flows, incandescent avalanches, and ash plumes during January-June 2023
Ahyi (United States) Intermittent hydroacoustic signals and discolored plumes during November 2022-June 2023
Kadovar (Papua New Guinea) An ash plume and weak thermal anomaly during May 2023
San Miguel (El Salvador) Small gas-and-ash explosions during March and May 2023
Semisopochnoi (United States) Occasional explosions, ash deposits, and gas-and-steam plumes during December 2022-May 2023
Ebeko (Russia) Continued explosions, ash plumes, and ashfall during October 2022-May 2023
Home Reef (Tonga) Discolored plumes continued during November 2022-April 2023
Ambae (Vanuatu) New lava flow, ash plumes, and sulfur dioxide plumes during February-May 2023
Manam (Papua New Guinea) — July 2023  Cite this Report
Manam
Papua New Guinea
4.08°S, 145.037°E; summit elev. 1807 m
All times are local (unless otherwise noted)
Few ash plumes during November-December 2022
Manam is a 10-km-wide island that consists of two active summit craters: the Main summit crater and the South summit crater and is located 13 km off the northern coast of mainland Papua New Guinea. Frequent mild-to-moderate eruptions have been recorded since 1616. The current eruption period began during June 2014 and has more recently been characterized by intermittent ash plumes and thermal activity (BGVN 47:11). This report updates activity that occurred from November 2022 through May 2023 based on information from the Darwin Volcanic Ash Advisory Center (VAAC) and various satellite data.
Ash plumes were reported during November and December 2022 by the Darwin VAAC. On 7 November an ash plume rose to 2.1 km altitude and drifted NE based on satellite images and weather models. On 14 November an ash plume rose to 2.1 km altitude and drifted W based on RVO webcam images. On 20 November ash plumes rose to 1.8 km altitude and drifted NW. On 26 December an ash plume rose to 3 km altitude and drifted S and SSE.
Intermittent sulfur dioxide plumes were detected using the TROPOMI instrument on the Sentinel-5P satellite, some of which exceeded at least two Dobson Units (DU) and drifted in different directions (figure 93). Occasional low-to-moderate power thermal anomalies were recorded by the MIROVA (Middle InfraRed Observation of Volcanic Activity) system; less than five anomalies were recorded each month during November 2022 through May 2023 (figure 94). Two thermal hotspots were detected by the MODVOLC thermal alerts system on 10 December 2022. On clear weather days, thermal activity was also captured in infrared satellite imagery in both the Main and South summit craters, accompanied by gas-and-steam emissions (figure 95).
Geologic Background. The 10-km-wide island of Manam, lying 13 km off the northern coast of mainland Papua New Guinea, is one of the country's most active volcanoes. Four large radial valleys extend from the unvegetated summit of the conical basaltic-andesitic stratovolcano to its lower flanks. These valleys channel lava flows and pyroclastic avalanches that have sometimes reached the coast. Five small satellitic centers are located near the island's shoreline on the northern, southern, and western sides. Two summit craters are present; both are active, although most observed eruptions have originated from the southern crater, concentrating eruptive products during much of the past century into the SE valley. Frequent eruptions, typically of mild-to-moderate scale, have been recorded since 1616. Occasional larger eruptions have produced pyroclastic flows and lava flows that reached flat-lying coastal areas and entered the sea, sometimes impacting populated areas.
Information Contacts: Rabaul Volcano Observatory (RVO), Geohazards Management Division, Department of Mineral Policy and Geohazards Management (DMPGM), PO Box 3386, Kokopo, East New Britain Province, Papua New Guinea; Darwin Volcanic Ash Advisory Centre (VAAC), Bureau of Meteorology, Northern Territory Regional Office, PO Box 40050, Casuarina, NT 0811, Australia (URL: http://www.bom.gov.au/info/vaac/); MIROVA (Middle InfraRed Observation of Volcanic Activity), a collaborative project between the Universities of Turin and Florence (Italy) supported by the Centre for Volcanic Risk of the Italian Civil Protection Department (URL: http://www.mirovaweb.it/); Hawai'i Institute of Geophysics and Planetology (HIGP) - MODVOLC Thermal Alerts System, School of Ocean and Earth Science and Technology (SOEST), Univ. of Hawai'i, 2525 Correa Road, Honolulu, HI 96822, USA (URL: http://modis.higp.hawaii.edu/); NASA Global Sulfur Dioxide Monitoring Page, Atmospheric Chemistry and Dynamics Laboratory, NASA Goddard Space Flight Center (NASA/GSFC), 8800 Greenbelt Road, Goddard, Maryland, USA (URL: https://so2.gsfc.nasa.gov/); Copernicus Browser, Copernicus Data Space Ecosystem, European Space Agency (URL: https://dataspace.copernicus.eu/browser/).
Krakatau (Indonesia) — July 2023 Cite this Report
Krakatau
Indonesia
6.1009°S, 105.4233°E; summit elev. 285 m
All times are local (unless otherwise noted)
Strombolian activity and ash plumes during November 2022-April 2023
Krakatau is located in the Sunda Strait between Java and Sumatra, Indonesia. Caldera collapse during the catastrophic 1883 eruption destroyed Danan and Perbuwatan cones and left only a remnant of Rakata. The post-collapse cone of Anak Krakatau (Child of Krakatau) was constructed within the 1883 caldera at a point between the former Danan and Perbuwatan cones; it has been the site of frequent eruptions since 1927. The current eruption period began in May 2021 and has recently consisted of explosions, ash plumes, and thermal activity (BGVN 47:11). This report covers activity during November 2022 through April 2023 based on information provided by the Indonesian Center for Volcanology and Geological Hazard Mitigation, referred to as Pusat Vulkanologi dan Mitigasi Bencana Geologi (PVMBG), MAGMA Indonesia, the Darwin Volcanic Ash Advisory Center (VAAC), and several sources of satellite data.
Activity was relatively low during November and December 2022. Daily white gas-and-steam plumes rose 25-100 m above the summit and drifted in different directions. Gray ash plumes rose 200 m above the summit and drifted NE at 1047 and at 2343 on 11 November. On 14 November at 0933 ash plumes rose 300 m above the summit and drifted E. An ash plume was reported at 0935 on 15 December that rose 100 m above the summit and drifted NE. An eruptive event at 1031 later that day generated an ash plume that rose 700 m above the summit and drifted NE. A gray ash plume at 1910 rose 100 m above the summit and drifted E. Incandescent material was ejected above the vent based on an image taken at 1936.
During January 2023 daily white gas-and-steam plumes rose 25-300 m above the summit and drifted in multiple directions. Gray-to-brown ash plumes were reported at 1638 on 3 January, at 1410 and 1509 on 4 January, and at 0013 on 5 January that rose 100-750 m above the summit and drifted NE and E; the gray-to-black ash plume at 1509 on 4 January rose as high as 3 km above the summit and drifted E. Gray ash plumes were recorded at 1754, 2241, and 2325 on 11 January and at 0046 on 12 January and rose 200-300 m above the summit and drifted NE. Toward the end of January, PVMBG reported that activity had intensified; Strombolian activity was visible in webcam images taken at 0041, 0043, and 0450 on 23 January. Multiple gray ash plumes throughout the day rose 200-500 m above the summit and drifted E and SE (figure 135). Webcam images showed progressively intensifying Strombolian activity at 1919, 1958, and 2113 on 24 January; a gray ash plume at 1957 rose 300 m above the summit and drifted E (figure 135). Eruptive events at 0231 and 2256 on 25 January and at 0003 on 26 January ejected incandescent material from the vent, based on webcam images. Gray ash plumes observed during 26-27 January rose 300-500 m above the summit and drifted NE, E, and SE.
Low levels of activity were reported during February and March. Daily white gas-and-steam plumes rose 25-300 m above the summit and drifted in different directions. The Darwin VAAC reported that continuous ash emissions rose to 1.5-1.8 km altitude and drifted W and NW during 1240-1300 on 10 March, based on satellite images, weather models, and PVMBG webcams. White-and-gray ash plumes rose 500 m and 300 m above the summit and drifted SW at 1446 and 1846 on 18 March, respectively. An eruptive event was recorded at 2143, though it was not visible due to darkness. Multiple ash plumes were reported during 27-29 March that rose as high as 2.5 km above the summit and drifted NE, W, and SW (figure 136). Webcam images captured incandescent ejecta above the vent at 0415 and around the summit area at 2003 on 28 March and at 0047 above the vent on 29 March.
Daily white gas-and-steam plumes rose 25-300 m above the summit and drifted in multiple directions during April and May. White-and-gray and black plumes rose 50-300 m above the summit on 2 and 9 April. On 11 May at 1241 a gray ash plume rose 1-3 km above the summit and drifted SW. On 12 May at 0920 a gray ash plume rose 2.5 km above the summit and drifted SW and at 2320 an ash plume rose 1.5 km above the summit and drifted SW. An accompanying webcam image showed incandescent ejecta. On 13 May at 0710 a gray ash plume rose 2 km above the summit and drifted SW (figure 137).
The MIROVA (Middle InfraRed Observation of Volcanic Activity) graph of MODIS thermal anomaly data showed intermittent low-to-moderate power thermal anomalies during November 2022 through April 2023 (figure 138). Some of this thermal activity was also visible in infrared satellite imagery at the crater, accompanied by gas-and-steam and ash plumes that drifted in different directions (figure 139).
Geologic Background. The renowned Krakatau (frequently mis-named as Krakatoa) volcano lies in the Sunda Strait between Java and Sumatra. Collapse of an older edifice, perhaps in 416 or 535 CE, formed a 7-km-wide caldera. Remnants of that volcano are preserved in Verlaten and Lang Islands; subsequently the Rakata, Danan, and Perbuwatan cones were formed, coalescing to create the pre-1883 Krakatau Island. Caldera collapse during the catastrophic 1883 eruption destroyed Danan and Perbuwatan, and left only a remnant of Rakata. This eruption caused more than 36,000 fatalities, most as a result of tsunamis that swept the adjacent coastlines of Sumatra and Java. Pyroclastic surges traveled 40 km across the Sunda Strait and reached the Sumatra coast. After a quiescence of less than a half century, the post-collapse cone of Anak Krakatau (Child of Krakatau) was constructed within the 1883 caldera at a point between the former Danan and Perbuwatan cones. Anak Krakatau has been the site of frequent eruptions since 1927.
Information Contacts: Pusat Vulkanologi dan Mitigasi Bencana Geologi (PVMBG, also known as Indonesian Center for Volcanology and Geological Hazard Mitigation, CVGHM), Jalan Diponegoro 57, Bandung 40122, Indonesia (URL: http://www.vsi.esdm.go.id/); MAGMA Indonesia, Kementerian Energi dan Sumber Daya Mineral (URL: https://magma.esdm.go.id/v1); Darwin Volcanic Ash Advisory Centre (VAAC), Bureau of Meteorology, Northern Territory Regional Office, PO Box 40050, Casuarina, NT 0811, Australia (URL: http://www.bom.gov.au/info/vaac/); MIROVA (Middle InfraRed Observation of Volcanic Activity), a collaborative project between the Universities of Turin and Florence (Italy) supported by the Centre for Volcanic Risk of the Italian Civil Protection Department (URL: http://www.mirovaweb.it/); Copernicus Browser, Copernicus Data Space Ecosystem, European Space Agency (URL: https://dataspace.copernicus.eu/browser/).
Stromboli
Italy
38.789°N, 15.213°E; summit elev. 924 m
All times are local (unless otherwise noted)
Strombolian explosions and lava flows continue during January-April 2023
Stromboli, located in Italy, has exhibited nearly constant lava fountains for the past 2,000 years; recorded eruptions date back to 350 BCE. Eruptive activity occurs at the summit from multiple vents, which include a north crater area (N area) and a central-southern crater (CS area) on a terrace known as the ‘terrazza craterica’ at the head of the Sciara del Fuoco, a large scarp that runs from the summit down the NW side of the volcano-island. Activity typically consists of Strombolian explosions, incandescent ejecta, lava flows, and pyroclastic flows. Thermal and visual monitoring cameras are located on the nearby Pizzo Sopra La Fossa, above the terrazza craterica, and at multiple flank locations. The current eruption period has been ongoing since 1934 and recent activity has consisted of frequent Strombolian explosions and lava flows (BGVN 48:02). This report updates activity during January through April 2023 primarily characterized by Strombolian explosions and lava flows based on reports from Italy's Istituto Nazionale di Geofisica e Vulcanologia (INGV) and various satellite data.
Frequent explosive activity continued throughout the reporting period, generally in the low-to-medium range, based on the number of hourly explosions in the summit crater (figure 253, table 16). Intermittent thermal activity was recorded by the MIROVA (Middle InfraRed Observation of Volcanic Activity) analysis of MODIS satellite data (figure 254). According to data collected by the MODVOLC thermal algorithm, a total of 9 thermal alerts were detected: one on 2 January 2023, one on 1 February, five on 24 March, and two on 26 March. The stronger pulses of thermal activity likely reflected lava flow events. Infrared satellite imagery captured relatively strong thermal hotspots at the two active summit craters on clear weather days, showing an especially strong event on 8 March (figure 255).
Table 16. Summary of type, frequency, and intensity of explosive activity at Stromboli by month during January-April 2023; information from webcam observations. Courtesy of INGV weekly reports.
| Month |
Explosive Activity |
| Jan 2023 |
Typical Strombolian activity with spattering and lava overflows in the N crater area. Explosions were reported from 4 vents in the N area and 1-2 vents in the CS area. The average hourly frequency of explosions was low-to-medium (1-12 events/hour). The intensity of the explosions varied from low (less than 80 m high) to medium (less than 150 m high) in the N crater area and up to high (greater than 150 m high) in the CS crater area. |
| Feb 2023 |
Typical Strombolian activity with spattering in the N crater area. Explosions were reported from 2-3 vents in the N area and 1-4 vents in the CS area. The average hourly frequency of explosions was low-to-medium (1-14 events/hour). The intensity of the explosions varied from low (less than 80 m high) to medium (less than 150 m high) in the N crater area and up to high (greater than 150 m high) in the CS crater area. |
| Mar 2023 |
Typical Strombolian activity with spattering and lava overflows in the N crater area. Explosions were reported from 2-3 vents in the N area and 2-4 vents in the CS area. The average hourly frequency of explosions was low-to-medium (1-18 events/hour). The intensity of the explosions varied from low (less than 80 m high) to medium (less than 150 m high) in the N crater area and up to high (greater than 150 m high) in the CS crater area. |
| Apr 2023 |
Typical Strombolian activity. Explosions were reported from 2 vents in the N area and 2-3 vents in the CS area. The average hourly frequency of explosions was low-to-high (1-16 events/hour). The intensity of the explosions varied from low (less than 80 m high) to medium (less than 150 m high) in both the N and CS crater areas. |
Activity during January-February 2023. Strombolian explosions were reported in the N crater area, as well as lava effusion. Explosive activity in the N crater area ejected coarse material (bombs and lapilli). Intense spattering was observed in both the N1 and N2 craters. In the CS crater area, explosions generally ejected fine material (ash), sometimes to heights greater than 250 m. The intensity of the explosions was characterized as low-to-medium in the N crater and medium-to-high in the CS crater. After intense spattering activity from the N crater area, a lava overflow began at 2136 on 2 January that flowed part way down the Sciara del Fuoco, possibly moving down the drainage that formed in October, out of view from webcams. The flow remained active for a couple of hours before stopping and beginning to cool. A second lava flow was reported at 0224 on 4 January that similarly remained active for a few hours before stopping and cooling. Intense spattering was observed on 11 and 13 January from the N1 crater. After intense spattering activity at the N2 crater at 1052 on 17 January another lava flow started to flow into the upper part of the Sciara del Fuoco (figure 256), dividing into two: one that traveled in the direction of the drainage formed in October, and the other one moving parallel to the point of emission. By the afternoon, the rate of the flow began to decrease, and at 1900 it started to cool. A lava flow was reported at 1519 on 24 January following intense spattering in the N2 area, which began to flow into the upper part of the Sciara del Fuoco. By the morning of 25 January, the lava flow had begun to cool. During 27 January the frequency of eruption in the CS crater area increased to 6-7 events/hour compared to the typical 1-7 events/hour; the following two days showed a decrease in frequency to less than 1 event/hour. Starting at 1007 on 30 January a high-energy explosive sequence was produced by vents in the CS crater area. The sequence began with an initial energetic pulse that lasted 45 seconds, ejecting predominantly coarse products 300 m above the crater that fell in an ESE direction. Subsequent and less intense explosions ejected material 100 m above the crater. The total duration of this event lasted approximately two minutes. During 31 January through 6, 13, and 24 February spattering activity was particularly intense for short periods in the N2 crater.
An explosive sequence was reported on 16 February that was characterized by a major explosion in the CS crater area (figure 257). The sequence began at 1817 near the S2 crater that ejected material radially. A few seconds later, lava fountains were observed in the central part of the crater. Three explosions of medium intensity (material was ejected less than 150 m high) were recorded at the S2 crater. The first part of this sequence lasted approximately one minute, according to INGV, and material rose 300 m above the crater and then was deposited along the Sciara del Fuoco. The second phase began at 1818 at the S1 crater; it lasted seven seconds and material was ejected 150 m above the crater. Another event 20 seconds later lasted 12 seconds, also ejecting material 150 m above the crater. The sequence ended with at least three explosions of mostly fine material from the S1 crater. The total duration of this sequence was about two minutes.
Short, intense spattering activity was noted above the N1 crater on 27 and 28 February. A lava overflow was first reported at 0657 from the N2 crater on 27 February that flowed into the October 2022 drainage. By 1900 the flow had stopped. A second lava overflow also in the N crater area occurred at 2149, which overlapped the first flow and then stopped by 0150 on 28 February. Material detached from both the lava overflows rolled down the Sciara del Fuoco, some of which was visible in webcam images.
Activity during March-April 2023. Strombolian activity continued with spattering activity and lava overflows in the N crater area during March. Explosive activity at the N crater area varied from low (less than 80 m high) to medium (less than 150 m high) and ejected coarse material, such as bombs and lapilli. Spattering was observed above the N1 crater, while explosive activity at the CS crater area varied from medium to high (greater than 150 m high) and ejected coarse material. Intense spattering activity was observed for short periods on 6 March above the N1 crater. At approximately 0610 a lava overflow was reported around the N2 crater on 8 March, which then flowed into the October 2022 drainage. By 1700 the flow started to cool. A second overflow began at 1712 on 9 March and overlapped the previous flow. It had stopped by 2100. Material from both flows was deposited along the Sciara del Fuoco, though much of the activity was not visible in webcam images. On 11 March a lava overflow was observed at 0215 that overlapped the two previous flows in the October 2022 drainage. By late afternoon on 12 March, it had stopped.
During a field excursion on 16 March, scientists noted that a vent in the central crater area was degassing. Another vent showed occasional Strombolian activity that emitted ash and lapilli. During 1200-1430 low-to-medium intense activity was reported; the N1 crater emitted ash emissions and the N2 crater emitted both ash and coarse material. Some explosions also occurred in the CS crater area that ejected coarse material. The C crater in the CS crater area occasionally showed gas jetting and low intensity explosions on 17 and 22 March; no activity was observed at the S1 crater. Intense, longer periods of spattering were reported in the N1 crater on 19, 24, and 25 March. Around 2242 on 23 March a lava overflow began from the N1 crater that, after about an hour, began moving down the October 2022 drainage and flow along the Sciara del Fuoco (figure 258). Between 0200 and 0400 on 26 March the flow rate increased, which generated avalanches of material from collapses at the advancing flow front. By early afternoon, the flow began to cool. On 25 March at 1548 an explosive sequence began from one of the vents at S2 in the CS crater area (figure 258). Fine ash mixed with coarse material was ejected 300 m above the crater rim and drifted SSE. Some modest explosions around Vent C were detected at 1549 on 25 March, which included an explosion at 1551 that ejected coarse material. The entire explosive sequence lasted approximately three minutes.
During April explosions persisted in both the N and CS crater areas. Fine material was ejected less than 80 m above the N crater rim until 6 April, followed by ejection of coarser material. Fine material was also ejected less than 80 m above the CS crater rim. The C and S2 crater did not show significant eruptive activity. On 7 April an explosive sequence was detected in the CS crater area at 1203 (figure 259). The first explosion lasted approximately 18 seconds and ejected material 400 m above the crater rim, depositing pyroclastic material in the upper part of the Sciara del Fuoco. At 1204 a second, less intense explosion lasted approximately four seconds and deposited pyroclastic products outside the crater area and near Pizzo Sopra La Fossa. A third explosion at 1205 was mainly composed of ash that rose about 150 m above the crater and lasted roughly 20 seconds. A fourth explosion occurred at 1205 about 28 seconds after the third explosion and ejected a mixture of coarse and fine material about 200 m above the crater; the explosion lasted roughly seven seconds. Overall, the entire explosive sequence lasted about two minutes and 20 seconds. After the explosive sequence on 7 April, explosions in both the N and CS crater areas ejected material as high as 150 m above the crater.
On 21 April research scientists from INGV made field observations in the summit area of Stromboli, and some lapilli samples were collected. In the N crater area near the N1 crater, a small cone was observed with at least two active vents, one of which was characterized by Strombolian explosions. The other vent produced explosions that ejected ash and chunks of cooled lava. At the N2 crater at least one vent was active and frequently emitted ash. In the CS crater area, a small cone contained 2-3 degassing vents and a smaller, possible fissure area also showed signs of degassing close to the Pizzo Sopra La Fossa. In the S part of the crater, three vents were active: a small hornito was characterized by modest and rare explosions, a vent that intermittently produced weak Strombolian explosions, and a vent at the end of the terrace that produced frequent ash emissions. Near the S1 crater there was a hornito that generally emitted weak gas-and-steam emissions, sometimes associated with “gas rings”. On 22 April another field inspection was carried out that reported two large sliding surfaces on the Sciara del Fuoco that showed where blocks frequently descended toward the sea. A thermal anomaly was detected at 0150 on 29 April.
Geologic Background. Spectacular incandescent nighttime explosions at Stromboli have long attracted visitors to the "Lighthouse of the Mediterranean" in the NE Aeolian Islands. This volcano has lent its name to the frequent mild explosive activity that has characterized its eruptions throughout much of historical time. The small island is the emergent summit of a volcano that grew in two main eruptive cycles, the last of which formed the western portion of the island. The Neostromboli eruptive period took place between about 13,000 and 5,000 years ago. The active summit vents are located at the head of the Sciara del Fuoco, a prominent scarp that formed about 5,000 years ago due to a series of slope failures which extends to below sea level. The modern volcano has been constructed within this scarp, which funnels pyroclastic ejecta and lava flows to the NW. Essentially continuous mild Strombolian explosions, sometimes accompanied by lava flows, have been recorded for more than a millennium.
Information Contacts: Istituto Nazionale di Geofisica e Vulcanologia (INGV), Sezione di Catania, Piazza Roma 2, 95123 Catania, Italy, (URL: http://www.ct.ingv.it/en/); MIROVA (Middle InfraRed Observation of Volcanic Activity), a collaborative project between the Universities of Turin and Florence (Italy) supported by the Centre for Volcanic Risk of the Italian Civil Protection Department (URL: http://www.mirovaweb.it/); Hawai'i Institute of Geophysics and Planetology (HIGP) - MODVOLC Thermal Alerts System, School of Ocean and Earth Science and Technology (SOEST), Univ. of Hawai'i, 2525 Correa Road, Honolulu, HI 96822, USA (URL: http://modis.higp.hawaii.edu/); Copernicus Browser, Copernicus Data Space Ecosystem, European Space Agency (URL: https://dataspace.copernicus.eu/browser/).
Nishinoshima (Japan) — July 2023 Cite this Report
Nishinoshima
Japan
27.247°N, 140.874°E; summit elev. 100 m
All times are local (unless otherwise noted)
Small ash plumes and fumarolic activity during November 2022 through April 2023
Nishinoshima is a small island located about 1,000 km S of Tokyo in the Ogasawara Arc in Japan. The island is the summit of a massive submarine volcano that has prominent peaks to the S, W, and NE. Eruptions date back to 1973; the most recent eruption period began in October 2022 and was characterized by ash plumes and fumarolic activity (BGVN 47:12). This report describes ash plumes and fumarolic activity during November 2022 through April 2023 based on monthly reports from the Japan Meteorological Agency (JMA) monthly reports and satellite data.
The most recent eruptive activity prior to the reporting internal occurred on 12 October 2022, when an ash plume rose 3.5 km above the crater rim. An aerial observation conducted by the Japan Coast Guard (JCG) on 25 November reported that white fumaroles rose approximately 200 m above the central crater of a pyroclastic cone (figure 119), and multiple plumes were observed on the ESE flank of the cone. Discolored water ranging from reddish-brown to brown and yellowish-green were visible around the perimeter of the island (figure 119). No significant activity was reported in December.
During an overflight conducted by JCG on 25 January 2023 intermittent activity and small, blackish-gray plumes rose 900 m above the central part of the crater were observed (figure 120). The fumarolic zone of the E flank and base of the cone had expanded and emissions had intensified. Dark brown discolored water was visible around the perimeter of the island.
No significant activity was reported during February through March. Ash plumes at 1050 and 1420 on 11 April rose 1.9 km above the crater rim and drifted NW and N. These were the first ash plumes observed since 12 October 2022. On 14 April JCG carried out an overflight and reported that no further eruptive activity was visible, although white gas-and-steam plumes were visible from the central crater and rose 900 m high (figure 121). Brownish and yellow-green discolored water surrounded the island.
Intermittent low-to-moderate power thermal anomalies were recorded in the MIROVA graph (Middle InfraRed Observation of Volcanic Activity) during November 2022 through April 2023 (figure 123). A cluster of six to eight anomalies were detected during November while a smaller number were detected during the following months: two to three during December, one during mid-January 2023, one during February, five during March, and two during April. Thermal activity was also reflected in infrared satellite data at the summit crater, accompanied by occasional gas-and-steam plumes (figure 124).
Geologic Background. The small island of Nishinoshima was enlarged when several new islands coalesced during an eruption in 1973-74. Multiple eruptions that began in 2013 completely covered the previous exposed surface and continued to enlarge the island. The island is the summit of a massive submarine volcano that has prominent peaks to the S, W, and NE. The summit of the southern cone rises to within 214 m of the ocean surface 9 km SSE.
Information Contacts: Japan Meteorological Agency (JMA), 1-3-4 Otemachi, Chiyoda-ku, Tokyo 100-8122, Japan (URL: http://www.jma.go.jp/jma/indexe.html); MIROVA (Middle InfraRed Observation of Volcanic Activity), a collaborative project between the Universities of Turin and Florence (Italy) supported by the Centre for Volcanic Risk of the Italian Civil Protection Department (URL: http://www.mirovaweb.it/); Copernicus Browser, Copernicus Data Space Ecosystem, European Space Agency (URL: https://dataspace.copernicus.eu/browser/).
Karangetang (Indonesia) — July 2023 Cite this Report
Karangetang
Indonesia
2.781°N, 125.407°E; summit elev. 1797 m
All times are local (unless otherwise noted)
Lava flows, incandescent avalanches, and ash plumes during January-June 2023
Karangetang (also known as Api Siau), at the northern end of the island of Siau, Indonesia, contains five summit craters along a N-S line. More than 40 eruptions have been recorded since 1675; recent eruptions have included frequent explosive activity, sometimes accompanied by pyroclastic flows and lahars. Lava dome growth has occurred in the summit craters and collapses of lava flow fronts have produced pyroclastic flows. The two active summit craters are Kawah Dua (the N crater) and Kawah Utama (the S crater, also referred to as the “Main Crater”). The most recent eruption began in late November 2018 and has more recently consisted of weak thermal activity and gas-and-steam emissions (BGVN 48:01). This report updates activity characterized by lava flows, incandescent avalanches, and ash plumes during January through June 2023 using reports from Pusat Vulkanologi dan Mitigasi Bencana Geologi (PVMBG, also known as CVGHM, or the Center of Volcanology and Geological Hazard Mitigation), MAGMA Indonesia, the Darwin VAAC (Volcano Ash Advisory Center), and satellite data.
Activity during January was relatively low and mainly consisted of white gas-and-steam emissions that rose 25-150 m above Main Crater (S crater) and drifted in different directions. Incandescence was visible from the lava dome in Kawah Dua (the N crater). Weather conditions often prevented clear views of the summit. On 18 January the number of seismic signals that indicated avalanches of material began to increase. In addition, there were a total of 71 earthquakes detected during the month.
Activity continued to increase during the first week of February. Material from Main Crater traveled as far as 800 m down the Batuawang (S) and Batang (W) drainages and as far as 1 km W down the Beha (W) drainage on 4 February. On 6 February 43 earthquake events were recorded, and on 7 February, 62 events were recorded. White gas-and-steam emissions rose 25-250 m above both summit craters throughout the month. PVMBG reported an eruption began during the evening of 8 February around 1700. Photos showed incandescent material at Main Crater. Incandescent material had also descended the flank in at least two unconfirmed directions as far as 2 km from Main Crater, accompanied by ash plumes (figure 60). As a result, PVMBG increased the Volcano Alert Level (VAL) to 3 (the second highest level on a 1-4 scale).
Occasional nighttime webcam images showed three main incandescent lava flows of differing lengths traveling down the S, SW, and W flanks (figure 61). Incandescent rocks were visible on the upper flanks, possibly from ejected or collapsed material from the crater, and incandescence was the most intense at the summit. Based on analyses of satellite imagery and weather models, the Darwin VAAC reported that daily ash plumes during 16-20 February rose to 2.1-3 km altitude and drifted NNE, E, and SE. BNPB reported on 16 February that as many as 77 people were evacuated and relocated to the East Siau Museum. A webcam image taken at 2156 on 17 February possibly showed incandescent material descending the SE flank. Ash plumes rose to 2.1 km altitude and drifted SE during 22-23 February, according to the Darwin VAAC.
Incandescent avalanches of material and summit incandescence at Main Crater continued during March. White gas-and-steam emissions during March generally rose 25-150 m above the summit crater; on 31 March gas-and-steam emissions rose 200-400 m high. An ash plume rose to 2.4 km altitude and drifted S at 1710 on 9 March and a large thermal anomaly was visible in images taken at 0550 and 0930 on 10 March. Incandescent material was visible at the summit and on the flanks based on webcam images taken at 0007 and 2345 on 16 March, at 1828 on 17 March, at 1940 on 18 March, at 2311 on 19 March, and at 2351 on 20 March. Incandescence was most intense on 18 and 20 March and webcam images showed possible Strombolian explosions (figure 62). An ash plume rose to 2.4 km altitude and drifted SW on 18 March, accompanied by a thermal anomaly.
Summit crater incandescence at Main Crater and on the flanks persisted during April. Incandescent material at the S crater and on the flanks was reported at 0016 on 1 April. The lava flows had stopped by 1 April according to PVMBG, although incandescence was still visible up to 10 m high. Seismic signals indicating effusion decreased and by 6 April they were no longer detected. Incandescence was visible from both summit craters. On 26 April the VAL was lowered to 2 (the second lowest level on a 1-4 scale). White gas-and-steam emissions rose 25-200 m above the summit crater.
During May white gas-and-steam emissions generally rose 50-250 m above the summit, though it was often cloudy, which prevented clear views; on 21 May gas-and-steam emissions rose 50-400 m high. Nighttime N summit crater incandescence rose 10-25 m above the lava dome, and less intense incandescence was noted above Main Crater, which reached about 10 m above the dome. Sounds of falling rocks at Main Crater were heard on 15 May and the seismic network recorded 32 rockfall events in the crater on 17 May. Avalanches traveled as far as 1.5 km down the SW and S flanks, accompanied by rumbling sounds on 18 May. Incandescent material descending the flanks was captured in a webcam image at 2025 on 19 May (figure 63) and on 29 May; summit crater incandescence was observed in webcam images at 2332 on 26 May and at 2304 on 29 May. On 19 May the VAL was again raised to 3.
Occasional Main Crater incandescence was reported during June, as well as incandescent material on the flanks. White gas-and-steam emissions rose 10-200 m above the summit crater. Ash plumes rose to 2.1 km altitude and drifted SE and E during 2-4 June, according to the Darwin VAAC. Material on the flanks of Main Crater were observed at 2225 on 7 June, at 2051 on 9 June, at 0007 on 17 June, and at 0440 on 18 June. Webcam images taken on 21, 25, and 27 June showed incandescence at Main Crater and from material on the flanks.
MIROVA (Middle InfraRed Observation of Volcanic Activity) analysis of MODIS satellite data showed strong thermal activity during mid-February through March and mid-May through June, which represented incandescent avalanches and lava flows (figure 64). During April through mid-May the power of the anomalies decreased but frequent anomalies were still detected. Brief gaps in activity occurred during late March through early April and during mid-June. Infrared satellite images showed strong lava flows mainly affecting the SW and S flanks, accompanied by gas-and-steam emissions (figure 65). According to data recorded by the MODVOLC thermal algorithm, there were a total of 79 thermal hotspots detected: 28 during February, 24 during March, one during April, five during May, and 21 during June.
Geologic Background. Karangetang (Api Siau) volcano lies at the northern end of the island of Siau, about 125 km NNE of the NE-most point of Sulawesi. The stratovolcano contains five summit craters along a N-S line. It is one of Indonesia's most active volcanoes, with more than 40 eruptions recorded since 1675 and many additional small eruptions that were not documented (Neumann van Padang, 1951). Twentieth-century eruptions have included frequent explosive activity sometimes accompanied by pyroclastic flows and lahars. Lava dome growth has occurred in the summit craters; collapse of lava flow fronts have produced pyroclastic flows.
Information Contacts: Pusat Vulkanologi dan Mitigasi Bencana Geologi (PVMBG, also known as Indonesian Center for Volcanology and Geological Hazard Mitigation, CVGHM), Jalan Diponegoro 57, Bandung 40122, Indonesia (URL: http://www.vsi.esdm.go.id/); MAGMA Indonesia, Kementerian Energi dan Sumber Daya Mineral (URL: https://magma.esdm.go.id/v1); Badan Nasional Penanggulangan Bencana (BNPB), National Disaster Management Agency, Graha BNPB - Jl. Scout Kav.38, East Jakarta 13120, Indonesia (URL: http://www.bnpb.go.id/); Darwin Volcanic Ash Advisory Centre (VAAC), Bureau of Meteorology, Northern Territory Regional Office, PO Box 40050, Casuarina, NT 0811, Australia (URL: http://www.bom.gov.au/info/vaac/); MIROVA (Middle InfraRed Observation of Volcanic Activity), a collaborative project between the Universities of Turin and Florence (Italy) supported by the Centre for Volcanic Risk of the Italian Civil Protection Department (URL: http://www.mirovaweb.it/); Hawai'i Institute of Geophysics and Planetology (HIGP) - MODVOLC Thermal Alerts System, School of Ocean and Earth Science and Technology (SOEST), Univ. of Hawai'i, 2525 Correa Road, Honolulu, HI 96822, USA (URL: http://modis.higp.hawaii.edu/); Copernicus Browser, Copernicus Data Space Ecosystem, European Space Agency (URL: https://dataspace.copernicus.eu/browser/); IDN Times, Jl. Jend. Gatot Subroto Kav. 27 3rd Floor Kuningan, Jakarta, Indonesia 12950, Status of Karangetang Volcano in Sitaro Islands Increases (URL: https://sulsel.idntimes.com/news/indonesia/savi/status-gunung-api-karangetang-di-kepulauan-sitaro-meningkat?page=all).
Ahyi (United States) — July 2023 Cite this Report
Ahyi
United States
20.42°N, 145.03°E; summit elev. -75 m
All times are local (unless otherwise noted)
Intermittent hydroacoustic signals and discolored plumes during November 2022-June 2023
Ahyi seamount is a large, conical submarine volcano that rises to within 75 m of the ocean surface about 18 km SE of the island of Farallon de Pajaros in the Northern Marianas. The remote location of the seamount has made eruptions difficult to document, but seismic stations installed in the region confirmed an eruption in the vicinity in 2001. No new activity was detected until April-May 2014 when an eruption was detected by NOAA (National Oceanic and Atmospheric Administration) divers, hydroacoustic sensors, and seismic stations (BGVN 42:04). New activity was first detected on 15 November by hydroacoustic sensors that were consistent with submarine volcanic activity. This report covers activity during November 2022 through June 2023 based on daily and weekly reports from the US Geological Survey.
Starting in mid-October, hydroacoustic sensors at Wake Island (2.2 km E) recorded signals consistent with submarine volcanic activity, according to a report from the USGS issued on 15 November 2022. A combined analysis of the hydroacoustic signals and seismic stations located at Guam and Chichijima Island, Japan, suggested that the source of this activity was at or near the Ahyi seamount. After a re-analysis of a satellite image of the area that was captured on 6 November, USGS confirmed that there was no evidence of discoloration at the ocean surface. Few hydroacoustic and seismic signals continued through November, including on 18 November, which USGS suggested signified a decline or pause in unrest. A VONA (Volcano Observatory Notice for Aviation) reported that a discolored water plume was persistently visible in satellite data starting on 18 November (figure 6). Though clouds often obscured clear views of the volcano, another discolored water plume was captured in a satellite image on 26 November. The Aviation Color Code (ACC) was raised to Yellow (the second lowest level on a four-color scale) and the Volcano Alert Level (VAL) was raised to Advisory (the second lowest level on a four-level scale) on 29 November.
During December, occasional detections were recorded on the Wake Island hydrophone sensors and discolored water over the seamount remained visible. During 2-7, 10-12, and 16-31 December possible explosion signals were detected. A small area of discolored water was observed in high-resolution Sentinel-2 satellite images during 1-6 December (figure 7). High-resolution satellite images recorded discolored water plumes on 13 December that originated from the summit region; no observations indicated that activity breached the ocean surface. A possible underwater plume was visible in satellite images on 18 December, and during 19-20 December a definite but diffuse underwater plume located SSE from the main vent was reported. An underwater plume was visible in a satellite image taken on 26 December (figure 7).
Hydrophone sensors continued to detect signals consistent with possible explosions during 1-8 January 2023. USGS reported that the number of detections decreased during 4-5 January. The hydrophone sensors experienced a data outage that started at 0118 on 8 January and continued through 10 January, though according to USGS, possible explosions were recorded prior to the data outage and likely continued during the outage. A discolored water plume originating from the summit region was detected in a partly cloudy satellite image on 8 January. On 11-12 and 15-17 January possible explosion signals were recorded again. One small signal was detected during 22-23 January and several signals were recorded on 25 and 31 January. During 27-31 January a plume of discolored water was observed above the seamount in satellite imagery (figure 8).
Low levels of activity continued during February and March, based on data from pressure sensors on Wake Island. During 1 and 4-6 February activity was reported, and a submarine plume was observed on 4 February (figure 8). Possible explosion signals were detected during 7-8, 10, 13-14, and 24 February. During 1-2 and 3-5 March a plume of discolored water was observed in satellite imagery (figure 8). Almost continuous hydroacoustic signals were detected in remote pressure sensor data on Wake Island 2,270 km E from the volcano during 7-13 March. During 12-13 March water discoloration around the seamount was observed in satellite imagery, despite cloudy weather. By 14 March discolored water extended about 35 km, but no direction was noted. USGS reported that the continuous hydroacoustic signals detected during 13-14 March stopped abruptly on 14 March and no new detections were observed. Three 30 second hydroacoustic detections were reported during 17-19 March, but no activity was visible due to cloudy weather. A data outage was reported during 21-22 March, making pressure sensor data unavailable; a discolored water plume was, however, visible in satellite data. A possible underwater explosion signal was detected by pressure sensors at Wake Island on 26, 29, and 31 March, though the cause and origin of these events were unclear.
Similar low activity continued during April, May, and June. Several signals were detected during 1-3 April in pressure sensors at Wake Island. USGS suggested that these may be related to underwater explosions or earthquakes at the volcano, but no underwater plumes were visible in clear satellite images. The pressure sensors had data outages during 12-13 April and no data were recorded; no underwater plumes were visible in satellite images, although cloudy weather obscured most clear views. Eruptive activity was reported starting at 2210 on 21 May. On 22 May a discolored water plume that extended 4 km was visible in satellite images, though no direction was recorded. During 23-24 May some signals were detected by the underwater pressure sensors. Possible hydroacoustic signals were detected during 2-3 and 6-8 June. Multiple hydroacoustic signals were detected during 9-11 and 16-17 June, although no activity was visible in satellite images. One hydroacoustic signal was detected during 23-24 June, but there was some uncertainty about its association with volcanic activity. A single possible hydroacoustic signal was detected during 30 June to 1 July.
Geologic Background. Ahyi seamount is a large conical submarine volcano that rises to within 75 m of the ocean surface ~18 km SE of the island of Farallon de Pajaros in the northern Marianas. Water discoloration has been observed there, and in 1979 the crew of a fishing boat felt shocks over the summit area, followed by upwelling of sulfur-bearing water. On 24-25 April 2001 an explosive eruption was detected seismically by a station on Rangiroa Atoll, Tuamotu Archipelago. The event was well constrained (+/- 15 km) at a location near the southern base of Ahyi. An eruption in April-May 2014 was detected by NOAA divers, hydroacoustic sensors, and seismic stations.
Information Contacts: US Geological Survey, Volcano Hazards Program (USGS-VHP), 12201 Sunrise Valley Drive, Reston, VA, USA, https://volcanoes.usgs.gov/index.html; Copernicus Browser, Copernicus Data Space Ecosystem, European Space Agency (URL: https://dataspace.copernicus.eu/browser/).
Kadovar (Papua New Guinea) — June 2023 Cite this Report
Kadovar
Papua New Guinea
3.608°S, 144.588°E; summit elev. 365 m
All times are local (unless otherwise noted)
An ash plume and weak thermal anomaly during May 2023
Kadovar is a 2-km-wide island that is the emergent summit of a Bismarck Sea stratovolcano. It lies off the coast of New Guinea, about 25 km N of the mouth of the Sepik River. Prior to an eruption that began in 2018, a lava dome formed the high point of the volcano, filling an arcuate landslide scarp open to the S. Submarine debris-avalanche deposits occur to the S of the island. The current eruption began in January 2018 and has comprised lava effusion from vents at the summit and at the E coast; more recent activity has consisted of ash plumes, weak thermal activity, and gas-and-steam plumes (BGVN 48:02). This report covers activity during February through May 2023 using information from the Darwin Volcanic Ash Advisory Center (VAAC) and satellite data.
Activity during the reporting period was relatively low and mainly consisted of white gas-and-steam plumes that were visible in natural color satellite images on clear weather days (figure 67). According to a Darwin VAAC report, at 2040 on 6 May an ash plume rose to 4.6 km altitude and drifted W; by 2300 the plume had dissipated. MODIS satellite instruments using the MODVOLC thermal algorithm detected a single thermal hotspot on the SE side of the island on 7 May. Weak thermal activity was also detected in a satellite image on the E side of the island on 14 May, accompanied by a white gas-and-steam plume that drifted SE (figure 68).
Geologic Background. The 2-km-wide island of Kadovar is the emergent summit of a Bismarck Sea stratovolcano of Holocene age. It is part of the Schouten Islands, and lies off the coast of New Guinea, about 25 km N of the mouth of the Sepik River. Prior to an eruption that began in 2018, a lava dome formed the high point of the andesitic volcano, filling an arcuate landslide scarp open to the south; submarine debris-avalanche deposits occur in that direction. Thick lava flows with columnar jointing forms low cliffs along the coast. The youthful island lacks fringing or offshore reefs. A period of heightened thermal phenomena took place in 1976. An eruption began in January 2018 that included lava effusion from vents at the summit and at the E coast.
Information Contacts: Darwin Volcanic Ash Advisory Centre (VAAC), Bureau of Meteorology, Northern Territory Regional Office, PO Box 40050, Casuarina, NT 0811, Australia (URL: http://www.bom.gov.au/info/vaac/); Hawai'i Institute of Geophysics and Planetology (HIGP) - MODVOLC Thermal Alerts System, School of Ocean and Earth Science and Technology (SOEST), Univ. of Hawai'i, 2525 Correa Road, Honolulu, HI 96822, USA (URL: http://modis.higp.hawaii.edu/); Copernicus Browser, Copernicus Data Space Ecosystem, European Space Agency (URL: https://dataspace.copernicus.eu/browser/).
San Miguel (El Salvador) — June 2023 Cite this Report
San Miguel
El Salvador
13.434°N, 88.269°W; summit elev. 2130 m
All times are local (unless otherwise noted)
Small gas-and-ash explosions during March and May 2023
San Miguel in El Salvador is a broad, deep crater complex that has been frequently modified by eruptions recorded since the early 16th century and consists of the summit known locally as Chaparrastique. Flank eruptions have produced lava flows that extended to the N, NE, and SE during the 17-19th centuries. The most recent activity has consisted of minor ash eruptions from the summit crater. The current eruption period began in November 2022 and has been characterized by frequent phreatic explosions, gas-and-ash emissions, and sulfur dioxide plumes (BGVN 47:12). This report describes small gas-and-ash explosions during December 2022 through May 2023 based on special reports from the Ministero de Medio Ambiente y Recursos Naturales (MARN).
Activity has been relatively low since the last recorded explosions on 29 November 2022. Seismicity recorded by the San Miguel Volcano Station (VSM) located on the N flank at 1.7 km elevation had decreased by 7 December. Sulfur dioxide gas measurements taken with DOAS (Differential Optical Absorption Spectroscopy) mobile equipment were below typical previously recorded values: 300 tons per day (t/d). During December, small explosions were recorded by the seismic network and manifested as gas-and-steam emissions.
Gas-and-ash explosions in the crater occurred during January 2023, which were recorded by the seismic network. Sulfur dioxide values remained low, between 300-400 t/d through 10 March. At 0817 on 14 January a gas-and-ash emission was visible in webcam images, rising just above the crater rim. Some mornings during February, small gas-and-steam plumes were visible in the crater. On 7 March at 2252 MARN noted an increase in degassing from the central crater; gas emissions were constantly observed through the early morning hours on 8 March. During the early morning of 8 March through the afternoon on 9 March, 12 emissions were registered, some accompanied by ash. The last gas-and-ash emission was recorded at 1210 on 9 March; very fine ashfall was reported in El Tránsito (10 km S), La Morita (6 km W), and La Piedrita (3 km W). The smell of sulfur was reported in Piedra Azul (5 km SW). On 16 March MARN reported that gas-and-steam emissions decreased.
Low degassing and very low seismicity were reported during April; no explosions have been detected between 9 March and 27 May. The sulfur dioxide emissions remained between 350-400 t/d; during 13-20 April sulfur dioxide values fluctuated between 30-300 t/d. Activity remained low through most of May; on 23 May seismicity increased. An explosion was detected at 1647 on 27 May generated a gas-and-ash plume that rose 700 m high (figure 32); a decrease in seismicity and gas emissions followed. The DOAS station installed on the W flank recorded sulfur dioxide values that reached 400 t/d on 27 May; subsequent measurements showed a decrease to 268 t/d on 28 May and 100 t/d on 29 May.
Geologic Background. The symmetrical cone of San Miguel, one of the most active volcanoes in El Salvador, rises from near sea level to form one of the country's most prominent landmarks. A broad, deep, crater complex that has been frequently modified by eruptions recorded since the early 16th century caps the truncated unvegetated summit, also known locally as Chaparrastique. Flanks eruptions of the basaltic-andesitic volcano have produced many lava flows, including several during the 17th-19th centuries that extended to the N, NE, and SE. The SE-flank flows are the largest and form broad, sparsely vegetated lava fields crossed by highways and a railroad skirting the base of the volcano. Flank vent locations have migrated higher on the edifice during historical time, and the most recent activity has consisted of minor ash eruptions from the summit crater.
Information Contacts: Ministero de Medio Ambiente y Recursos Naturales (MARN), Km. 5½ Carretera a Nueva San Salvador, Avenida las Mercedes, San Salvador, El Salvador (URL: http://www.snet.gob.sv/ver/vulcanologia).
Semisopochnoi (United States) — June 2023 Cite this Report
Semisopochnoi
United States
51.93°N, 179.58°E; summit elev. 1221 m
All times are local (unless otherwise noted)
Occasional explosions, ash deposits, and gas-and-steam plumes during December 2022-May 2023
Semisopochnoi is located in the western Aleutians, is 20-km-wide at sea level, and contains an 8-km-wide caldera. The three-peaked Mount Young (formerly Cerberus) was constructed within the caldera during the Holocene. Each of these peaks contains a summit crater; the lava flows on the N flank appear younger than those on the S side. The current eruption period began in early February 2021 and has more recently consisted of intermittent explosions and ash emissions (BGVN 47:12). This report updates activity during December 2022 through May 2023 using daily, weekly, and special reports from the Alaska Volcano Observatory (AVO). AVO monitors the volcano using local seismic and infrasound sensors, satellite data, web cameras, and remote infrasound and lightning networks.
Activity during most of December 2022 was relatively quiet; according to AVO no eruptive or explosive activity was observed since 7 November 2022. Intermittent tremor and occasional small earthquakes were observed in geophysical data. Continuous gas-and-steam emissions were observed from the N crater of Mount Young in webcam images on clear weather days (figure 25). On 24 December, there was a slight increase in earthquake activity and several small possible explosion signals were detected in infrasound data. Eruptive activity resumed on 27 December at the N crater of Mount Young; AVO issued a Volcano Activity Notice (VAN) that reported minor ash deposits on the flanks of Mount Young that extended as far as 1 km from the vent, according to webcam images taken during 27-28 December (figure 26). No ash plumes were observed in webcam or satellite imagery, but a persistent gas-and-steam plume that might have contained some ash rose to 1.5 km altitude. As a result, AVO raised the Aviation Color Code (ACC) to Orange (the second highest level on a four-color scale) and the Volcano Alert Level (VAL) to Watch (the second highest level on a four-level scale). Possible explosions were detected during 21 December 2022 through 1 January 2023 and seismic tremor was recorded during 30-31 December.
During January 2023 eruptive activity continued at the active N crater of Mount Young. Minor ash deposits were observed on the flanks, extending about 2 km SSW, based on webcam images from 1 and 3 January. A possible explosion occurred during 1-2 January based on elevated seismicity recorded on local seismometers and an infrasound signal recorded minutes later by an array at Adak. Though no ash plumes were observed in webcam or satellite imagery, a persistent gas-and-steam plume rose to 1.5 km altitude that might have carried minor traces of ash. Ash deposits were accompanied by periods of elevated seismicity and infrasound signals from the local geophysical network, which AVO reported were likely due to weak explosive activity. Low-level explosive activity was also detected during 2-3 January, with minor gas-and-steam emissions and a new ash deposit that was visible in webcam images. Low-level explosive activity was detected in geophysical data during 4-5 January, with elevated seismicity and infrasound signals observed on local stations. Volcanic tremor was detected during 7-9 January and very weak explosive activity was detected in seismic and infrasound data on 9 January. Weak seismic and infrasound signals were recorded on 17 January, which indicated minor explosive activity, but no ash emissions were observed in clear webcam images; a gas-and-steam plume continued to rise to 1.5 km altitude. During 29-30 January, ash deposits near the summit were observed on fresh snow, according to webcam images.
The active N cone at Mount Young continued to produce a gas-and-steam plume during February, but no ash emissions or explosive events were detected. Seismicity remained elevated with faint tremor during early February. Gas-and-steam emissions from the N crater were observed in clear webcam images on 11-13 and 16 February; no explosive activity was detected in seismic, infrasound, or satellite data. Seismicity has also decreased, with no significant seismic tremor observed since 25 January. Therefore, the ACC was lowered to Yellow (the second lowest level on a four-color scale) and the VAL was lowered to Advisory (the second lowest level on a four-color scale) on 22 February.
Gas-and-steam emissions persisted during March from the N cone of Mount Young, based on clear webcam images. A few brief episodes of weak tremor were detected in seismic data, although seismicity decreased over the month. A gas-and-steam plume detected in satellite data extended 150 km on 18 March. Low-level ash emissions from the N cone at Mount Young were observed in several webcam images during 18-19 March, in addition to small explosions and volcanic tremor. The ACC was raised to Orange and the VAL increased to Watch on 19 March. A small explosion was detected in seismic and infrasound data on 21 March.
Low-level unrest continued during April, although cloudy weather often obscured views of the summit; periods of seismic tremor and local earthquakes were recorded. During 3-4 April a gas-and-steam plume was visible traveling more than 200 km overnight; no ash was evident in the plume, according to AVO. A gas-and-steam plume was observed during 4-6 April that extended 400 km but did not seem to contain ash. Small explosions were detected in seismic and infrasound data on 5 April. Occasional clear webcam images showed continuing gas-and-steam emissions rose from Mount Young, but no ash deposits were observed on the snow. On 19 April small explosions and tremor were detected in seismic and infrasound data. A period of seismic tremor was detected during 22-25 April, with possible weak explosions on 25 April. Ash deposits were visible near the crater rim, but it was unclear if these deposits were recent or due to older deposits.
Occasional small earthquakes were recorded during May, but there were no signs of explosive activity seen in geophysical data. Gas-and-steam emissions continued from the N crater of Mount Young, based on webcam images, and seismicity remained slightly elevated. A new, light ash deposit was visible during the morning of 5 May on fresh snow on the NW flank of Mount Young. During 10 May periods of volcanic tremor were observed. The ACC was lowered to Yellow and the VAL to Advisory on 17 May due to no additional evidence of activity.
Geologic Background. Semisopochnoi, the largest subaerial volcano of the western Aleutians, is 20 km wide at sea level and contains an 8-km-wide caldera. It formed as a result of collapse of a low-angle, dominantly basaltic volcano following the eruption of a large volume of dacitic pumice. The high point of the island is Anvil Peak, a double-peaked late-Pleistocene cone that forms much of the island's northern part. The three-peaked Mount Cerberus (renamed Mount Young in 2023) was constructed within the caldera during the Holocene. Each of the peaks contains a summit crater; lava flows on the N flank appear younger than those on the south side. Other post-caldera volcanoes include the symmetrical Sugarloaf Peak SSE of the caldera and Lakeshore Cone, a small cinder cone at the edge of Fenner Lake in the NE part of the caldera. Most documented eruptions have originated from Young, although Coats (1950) considered that both Sugarloaf and Lakeshore Cone could have been recently active.
Information Contacts: Alaska Volcano Observatory (AVO), a cooperative program of a) U.S. Geological Survey, 4200 University Drive, Anchorage, AK 99508-4667 USA (URL: https://avo.alaska.edu/), b) Geophysical Institute, University of Alaska, PO Box 757320, Fairbanks, AK 99775-7320, USA, and c) Alaska Division of Geological & Geophysical Surveys, 794 University Ave., Suite 200, Fairbanks, AK 99709, USA (URL: http://dggs.alaska.gov/).
Ebeko
Russia
50.686°N, 156.014°E; summit elev. 1103 m
All times are local (unless otherwise noted)
Continued explosions, ash plumes, and ashfall during October 2022-May 2023
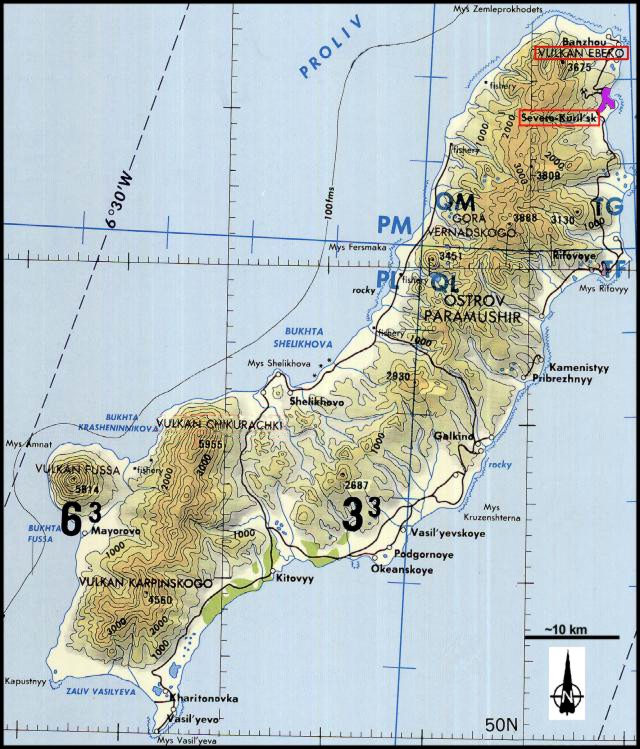
Ebeko, located on the N end of Paramushir Island in the Kuril Islands, consists of three summit craters along a SSW-NNE line at the northern end of a complex of five volcanic cones. Eruptions date back to the late 18th century and have been characterized as small-to-moderate explosions from the summit crater, accompanied by intense fumarolic activity. The current eruption period began in June 2022 and has recently consisted of frequent explosions, ash plumes, and thermal activity (BGVN 47:10). This report covers similar activity during October 2022 through May 2023, based on information from the Kamchatka Volcanic Eruptions Response Team (KVERT) and satellite data.
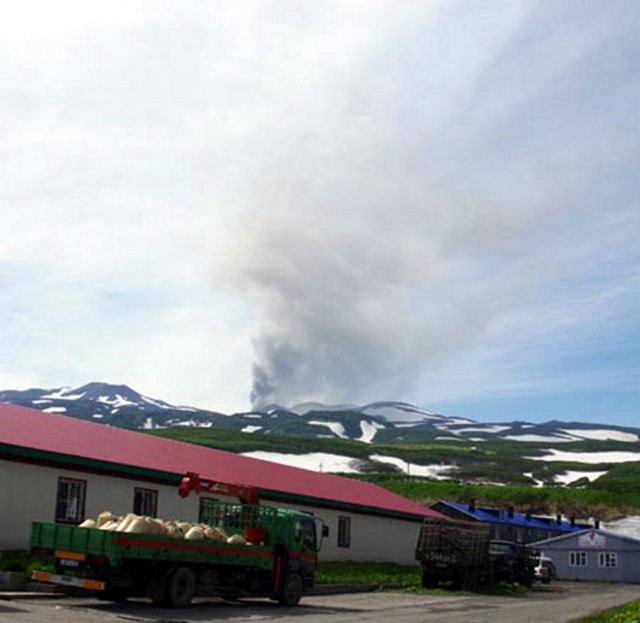
Activity during October consisted of explosive activity, ash plumes, and occasional thermal anomalies. Visual data by volcanologists from Severo-Kurilsk showed explosions producing ash clouds up to 2.1-3 km altitude which drifted E, N, NE, and SE during 1-8, 10, 16, and 18 October. KVERT issued several Volcano Observatory Notices for Aviation (VONA) on 7, 13-15, and 27 October 2022, stating that explosions generated ash plumes that rose to 2.3-4 km altitude and drifted 5 km E, NE, and SE. Ashfall was reported in Severo-Kurilsk (Paramushir Island, about 7 km E) on 7 and 13 October. Satellite data showed a thermal anomaly over the volcano on 15-16 October. Visual data showed ash plumes rising to 2.5-3.6 km altitude on 22, 25-29, and 31 October and moving NE due to constant explosions.
Similar activity continued during November, with explosions, ash plumes, and ashfall occurring. KVERT issued VONAs on 1-2, 4, 6-7, 9, 13, and 16 November that reported explosions and resulting ash plumes that rose to 1.7-3.6 km altitude and drifted 3-5 km SE, ESE, E, and NE. On 1 November ash plumes extended as far as 110 km SE. On 5, 8, 12, and 24-25 November explosions and ash plumes rose to 2-3.1 km altitude and drifted N and E. Ashfall was observed in Severo-Kurilsk on 7 and 16 November. A thermal anomaly was visible during 1-4, 16, and 20 November. Explosions during 26 November rose as high as 2.7 km altitude and drifted NE (figure 45).
Explosions and ash plumes continued to occur in December. During 1-2 and 4 December volcanologists from Severo-Kurilsk observed explosions that sent ash to 1.9-2.5 km altitude and drifted NE and SE (figure 46). VONAs were issued on 5, 9, and 16 December reporting that explosions generated ash plumes rising to 1.9 km, 2.6 km, and 2.4 km altitude and drifted 5 km SE, E, and NE, respectively. A thermal anomaly was visible in satellite imagery on 16 December. On 18 and 27-28 December explosions produced ash plumes that rose to 2.5 km altitude and drifted NE and SE. On 31 December an ash plume rose to 2 km altitude and drifted NE.
Explosions continued during January 2023, based on visual observations by volcanologists from Severo-Kurilsk. During 1-7 January explosions generated ash plumes that rose to 4 km altitude and drifted NE, E, W, and SE. According to VONAs issued by KVERT on 2, 4, 10, and 23 January, explosions produced ash plumes that rose to 2-4 km altitude and drifted 5 km N, NE, E, and ENE; the ash plume that rose to 4 km altitude occurred on 10 January (figure 47). Satellite data showed a thermal anomaly during 3-4, 10, 13, 16, 21, 22, and 31 January. KVERT reported that an ash cloud on 4 January moved 12 km NE. On 6 and 9-11 January explosions sent ash plumes to 4.5 km altitude and drifted W and ESE. On 13 January an ash plume rose to 3 km altitude and drifted SE. During 20-24 January ash plumes from explosions rose to 3.7 km altitude and drifted SE, N, and NE. On 21 January the ash plume drifted as far as 40 km NE. During 28-29 and 31 January and 1 February ash plumes rose to 4 km altitude and drifted NE.
During February, explosions, ash plumes, and ashfall were reported. During 1, 4-5 and 7-8 February explosions generated ash plumes that rose to 4.5 km altitude and drifted E and NE; ashfall was observed on 5 and 8 February. On 6 February an explosion produced an ash plume that rose to 3 km altitude and drifted 7 km E, causing ashfall in Severo-Kurilsk. A thermal anomaly was visible in satellite data on 8, 9, 13, and 21 February. Explosions on 9 and 12-13 February produced ash plumes that rose to 4 km altitude and drifted E and NE; the ash cloud on 12 February extended as far as 45 km E. On 22 February explosions sent ash to 3 km altitude that drifted E. During 24 and 26-27 February ash plumes rose to 4 km altitude and drifted E. On 28 February an explosion sent ash to 2.5-3 km altitude and drifted 5 km E; ashfall was observed in Severo-Kurilsk.
Activity continued during March; visual observations showed that explosions generated ash plumes that rose to 3.6 km altitude on 3, 5-7, and 9-12 March and drifted E, NE, and NW. Thermal anomalies were visible on 10, 13, and 29-30 March in satellite imagery. On 18, 21-23, 26, and 29-30 March explosions produced ash plumes that rose to 2.8 km altitude and drifted NE and E; the ash plumes during 22-23 March extended up to 76 km E. A VONA issued on 21 March reported an explosion that produced an ash plume that rose to 2.8 km altitude and drifted 5 km E. Another VONA issued on 23 March reported that satellite data showed an ash plume rising to 3 km altitude and drifted 14 km E.
Explosions during April continued to generate ash plumes. On 1 and 4 April an ash plume rose to 2.8-3.5 km altitude and drifted SE and NE. A thermal anomaly was visible in satellite imagery during 1-6 April. Satellite data showed ash plumes and clouds rising to 2-3 km altitude and drifting up to 12 km SW and E on 3 and 6 April (figure 48). KVERT issued VONAs on 3, 5, 14, 16 April describing explosions that produced ash plumes rising to 3 km, 3.5 km, 3.5 km, and 3 km altitude and drifting 5 km S, 5 km NE and SE, 72 km NNE, and 5 km NE, respectively. According to satellite data, the resulting ash cloud from the explosion on 14 April was 25 x 7 km in size and drifted 72-104 km NNE during 14-15 April. According to visual data by volcanologists from Severo-Kurilsk explosions sent ash up to 3.5 km altitude that drifted NE and E during 15-16, 22, 25-26, and 29 April.
The explosive eruption continued during May. Explosions during 3-4, 6-7, and 9-10 May generated ash plumes that rose to 4 km altitude and drifted SW and E. Satellite data showed a thermal anomaly on 3, 9, 13-14, and 24 May. During 12-16, 23-25, and 27-28 May ash plumes rose to 3.5 km altitude and drifted in different directions due to explosions. Two VONA notices were issued on 16 and 25 May, describing explosions that generated ash plumes rising to 3 km and 3.5 km altitude, respectively and extending 5 km E. The ash cloud on 25 May drifted 75 km SE.
Thermal activity in the summit crater, occasionally accompanied by ash plumes and ash deposits on the SE and E flanks due to frequent explosions, were visible in infrared and true color satellite images (figure 49).
Geologic Background. The flat-topped summit of the central cone of Ebeko volcano, one of the most active in the Kuril Islands, occupies the northern end of Paramushir Island. Three summit craters located along a SSW-NNE line form Ebeko volcano proper, at the northern end of a complex of five volcanic cones. Blocky lava flows extend west from Ebeko and SE from the neighboring Nezametnyi cone. The eastern part of the southern crater contains strong solfataras and a large boiling spring. The central crater is filled by a lake about 20 m deep whose shores are lined with steaming solfataras; the northern crater lies across a narrow, low barrier from the central crater and contains a small, cold crescentic lake. Historical activity, recorded since the late-18th century, has been restricted to small-to-moderate explosive eruptions from the summit craters. Intense fumarolic activity occurs in the summit craters, on the outer flanks of the cone, and in lateral explosion craters.
Information Contacts: Kamchatka Volcanic Eruptions Response Team (KVERT), Far Eastern Branch, Russian Academy of Sciences, 9 Piip Blvd., Petropavlovsk-Kamchatsky, 683006, Russia (URL: http://www.kscnet.ru/ivs/kvert/); MIROVA (Middle InfraRed Observation of Volcanic Activity), a collaborative project between the Universities of Turin and Florence (Italy) supported by the Centre for Volcanic Risk of the Italian Civil Protection Department (URL: http://www.mirovaweb.it/); Copernicus Browser, Copernicus Data Space Ecosystem, European Space Agency (URL: https://dataspace.copernicus.eu/browser/).
Home Reef
Tonga
18.992°S, 174.775°W; summit elev. -10 m
All times are local (unless otherwise noted)
Discolored plumes continued during November 2022-April 2023
Home Reef is a submarine volcano located in the central Tonga islands between Lateiki (Metis Shoal) and Late Island. The first recorded eruption occurred in the mid-19th century, when an ephemeral island formed. An eruption in 1984 produced a 12-km-high eruption plume, a large volume of floating pumice, and an ephemeral island 500 x 1,500 m wide, with cliffs 30-50 m high that enclosed a water-filled crater. Another island-forming eruption in 2006 produced widespread pumice rafts that drifted as far as Australia; by 2008 the island had eroded below sea level. The previous eruption occurred during October 2022 and was characterized by a new island-forming eruption, lava effusion, ash plumes, discolored water, and gas-and-steam plumes (BGVN 47:11). This report covers discolored water plumes during November 2022 through April 2023 using satellite data.
Discolored plumes continued during the reporting period and were observed in true color satellite images on clear weather days. Satellite images show light green-yellow discolored water extending W on 8 and 28 November 2022 (figure 31), and SW on 18 November. Light green-yellow plumes extended W on 3 December, S on 13 December, SW on 18 December, and W and S on 23 December (figure 31). On 12 January 2023 discolored green-yellow plumes extended to the NE, E, SE, and N. The plume moved SE on 17 January and NW on 22 January. Faint discolored water in February was visible moving NE on 1 February. A discolored plume extended NW on 8 and 28 March and NW on 13 March (figure 31). During April, clear weather showed green-blue discolored plumes moving S on 2 April, W on 7 April, and NE and S on 12 April. A strong green-yellow discolored plume extended E and NE on 22 April for several kilometers (figure 31).
Geologic Background. Home Reef, a submarine volcano midway between Metis Shoal and Late Island in the central Tonga islands, was first reported active in the mid-19th century, when an ephemeral island formed. An eruption in 1984 produced a 12-km-high eruption plume, large amounts of floating pumice, and an ephemeral 500 x 1,500 m island, with cliffs 30-50 m high that enclosed a water-filled crater. In 2006 an island-forming eruption produced widespread dacitic pumice rafts that drifted as far as Australia. Another island was built during a September-October 2022 eruption.
Information Contacts: Copernicus Browser, Copernicus Data Space Ecosystem, European Space Agency (URL: https://dataspace.copernicus.eu/browser/).
Ambae
Vanuatu
15.389°S, 167.835°E; summit elev. 1496 m
All times are local (unless otherwise noted)
New lava flow, ash plumes, and sulfur dioxide plumes during February-May 2023
Ambae, also known as Aoba, is a large basaltic shield volcano in Vanuatu. A broad pyroclastic cone containing three crater lakes (Manaro Ngoru, Voui, and Manaro Lakua) is located at the summit within the youngest of at least two nested calderas. Periodic phreatic and pyroclastic explosions have been reported since the 16th century. A large eruption more than 400 years ago resulted in a volcanic cone within the summit crater that is now filled by Lake Voui; the similarly sized Lake Manaro fills the western third of the caldera. The previous eruption ended in August 2022 that was characterized by gas-and-steam and ash emissions and explosions of wet tephra (BGVN 47:10). This report covers a new eruption during February through May 2023 that consisted of a new lava flow, ash plumes, and sulfur dioxide emissions, using information from the Vanuatu Meteorology and Geo-Hazards Department (VMGD) and satellite data.
During the reporting period, the Alert Level remained at a 2 (on a scale of 0-5), which has been in place since December 2021. Activity during October 2022 through March 2023 remained relatively low and mostly consisted of gas-and-steam emissions in Lake Voui. VMGD reported that at 1300 on 15 November a satellite image captured a strong amount of sulfur dioxide rising above the volcano (figure 99), and that seismicity slightly increased. The southern and northern part of the island reported a strong sulfur dioxide smell and heard explosions. On 20 February 2023 a gas-and-ash plume rose 1.3 km above the summit and drifted SSW, according to a webcam image (figure 100). Gas-and-steam and possibly ash emissions continued on 23 February and volcanic earthquakes were recorded by the seismic network.
During April, volcanic earthquakes and gas-and-steam and ash emissions were reported from the cone in Lake Voui. VMGD reported that activity increased during 5-7 April; high gas-and-steam and ash plumes were visible, accompanied by nighttime incandescence. According to a Wellington VAAC report, a low-level ash plume rose as high as 2.5 km above the summit and drifted W and SW on 5 April, based on satellite imagery. Reports in Saratamata stated that a dark ash plume drifted to the WSW, but no loud explosion was heard. Webcam images from 2100 showed incandescence above the crater and reflected in the clouds. According to an aerial survey, field observations, and satellite data, water was no longer present in the lake. A lava flow was reported effusing from the vent and traveling N into the dry Lake Voui, which lasted three days. The next morning at 0745 on 6 April a gas-and-steam and ash plume rose 5.4 km above the summit and drifted ESE, based on information from VMGD (figure 101). The Wellington VAAC also reported that light ashfall was observed on the island. Intermittent gas-and-steam and ash emissions were visible on 7 April, some of which rose to an estimated 3 km above the summit and drifted E. Webcam images during 0107-0730 on 7 April showed continuing ash emissions. A gas-and-steam and ash plume rose 695 m above the summit crater at 0730 on 19 April and drifted ESE, based on a webcam image (figure 102).
According to visual and infrared satellite data, water was visible in Lake Voui as late as 24 March 2023 (figure 103). The vent in the caldera showed a gas-and-steam plume drifted SE. On 3 April thermal activity was first detected, accompanied by a gas-and-ash plume that drifted W (figure 103). The lava flow moved N within the dry lake and was shown cooling by 8 April. By 23 April much of the water in the lake had returned. Occasional sulfur dioxide plumes were detected by the TROPOMI instrument on the Sentinel-5P satellite that exceeded 2 Dobson Units (DU) and drifted in different directions (figure 104).
Geologic Background. The island of Ambae, also known as Aoba, is a massive 2,500 km3 basaltic shield that is the most voluminous volcano of the New Hebrides archipelago. A pronounced NE-SW-trending rift zone with numerous scoria cones gives the 16 x 38 km island an elongated form. A broad pyroclastic cone containing three crater lakes (Manaro Ngoru, Voui, and Manaro Lakua) is located at the summit within the youngest of at least two nested calderas, the largest of which is 6 km in diameter. That large central edifice is also called Manaro Voui or Lombenben volcano. Post-caldera explosive eruptions formed the summit craters about 360 years ago. A tuff cone was constructed within Lake Voui (or Vui) about 60 years later. The latest known flank eruption, about 300 years ago, destroyed the population of the Nduindui area near the western coast.
Information Contacts: Geo-Hazards Division, Vanuatu Meteorology and Geo-Hazards Department (VMGD), Ministry of Climate Change Adaptation, Meteorology, Geo-Hazards, Energy, Environment and Disaster Management, Private Mail Bag 9054, Lini Highway, Port Vila, Vanuatu (URL: http://www.vmgd.gov.vu/, https://www.facebook.com/VanuatuGeohazardsObservatory/); Wellington Volcanic Ash Advisory Centre (VAAC), Meteorological Service of New Zealand Ltd (MetService), PO Box 722, Wellington, New Zealand (URL: http://www.metservice.com/vaac/, http://www.ssd.noaa.gov/VAAC/OTH/NZ/messages.html); MIROVA (Middle InfraRed Observation of Volcanic Activity), a collaborative project between the Universities of Turin and Florence (Italy) supported by the Centre for Volcanic Risk of the Italian Civil Protection Department (URL: http://www.mirovaweb.it/); Global Sulfur Dioxide Monitoring Page, Atmospheric Chemistry and Dynamics Laboratory, NASA Goddard Space Flight Center (NASA/GSFC), 8800 Greenbelt Road, Goddard, Maryland, USA (URL: https://so2.gsfc.nasa.gov/); Copernicus Browser, Copernicus Data Space Ecosystem, European Space Agency (URL: https://dataspace.copernicus.eu/browser/).
Search Bulletin Archive by Publication Date
Select a month and year from the drop-downs and click "Show Issue" to have that issue displayed in this tab.
The default month and year is the latest issue available.
Bulletin of the Global Volcanism Network - Volume 36, Number 07 (July 2011)
Managing Editor: Richard Wunderman
Axial Seamount (Undersea Features)
April 2011 eruption follows deformation-based forecast issued in 2006
Ebeko (Russia)
Gas-and-steam plumes and ash plumes in 2009 and 2010
Kirishimayama (Japan)
February 2011 explosions launching ballistics; evacuations
Marapi (Indonesia)
Increased seismicity in 2004; small ash-bearing eruptions in 2011
Rabaul (Papua New Guinea)
Two small eruptions since one in July 2010
Ruapehu (New Zealand)
2009-2011: Earthquake triggered shift in lake height; lake heating cycle
Suwanosejima (Japan)
Many small explosions up to 2 km altitude during mid-2009 to mid-2011
Tofua (Tonga)
Evidence of ongoing intermittent eruption into 2011
Axial Seamount (Undersea Features) — July 2011 Cite this Report
Axial Seamount
Undersea Features
45.95°N, 130°W; summit elev. -1410 m
All times are local (unless otherwise noted)
April 2011 eruption follows deformation-based forecast issued in 2006
According to a press release from Oregon State University on 9 August 2011, a team of scientists recently discovered a recent eruption of Axial Seamount, an undersea volcano located about 400 km off the Oregon coast (figure 7). Both fresh lava that disturbed and covered in-situ instruments and a small earthquake swarm detected by ocean-bottom hydrophones and land-based seismometers helped fix the eruption date at around 6 April 2011. The scientists had forecast this eruption about 5 years ago-touted as the first successful forecast of an undersea volcano erupting.
The Mogi (1958) model predicts deformation due to a small spherical zone of expansion at depth, thus modeling magma intrusion. For ease of computation, the zone is assumed to be embedded in a homogeneous, isotropic, elastic half-space. The modeling technique is widely used to reconcile surface deformation at active volcanoes with plausible intrusions at depth. In this case it modeled the deformation of the ocean floor (figure 7, see caption).
Bill Chadwick (National Oceanic and Atmospheric Administration (NOAA) and Oregon State University (OSU)), and Scott Nooner (Lamont-Doherty Earth Observatory (LDEO)) have been monitoring Axial Seamount for more than a decade. In Chadwick and others (2006) they forecast that Axial would erupt before the year 2014. Their forecast was based on a series of seafloor pressure measurements that indicated the volcano was inflating.
Axial last erupted in 1998 (BGVN 23:01 and 23:02) and Chadwick, Nooner, and colleagues have monitored it ever since. They used precise bottom pressure sensors to measure vertical movements of the floor of the caldera. They discovered that the volcano was gradually inflating at the rate of 15 cm/yr, indicating that magma was rising and accumulating under the volcano summit.When Axial erupted in 1998, the floor of the caldera suddenly subsided or deflated 3.2 m as magma was removed from underground to erupt at the surface. The scientists estimated that the volcano would be ready to erupt again when re-inflation pushed the caldera floor back up to its 1998 level.
As noted in Chadwick and others (2006), "If inflation continues at the current rate of 19 cm/yr at the caldera center, it will take another 9 years (16 years total) for the caldera to fully re-inflate to its January 1998 level (or in about 2014). If one assumes that Axial (seamount) would then be poised to erupt again, such a recurrence interval (~ 16 years), although admittedly speculative, would not be unreasonable since it is also the time necessary to accumulate ~ 1 m of extensional strain (the mean thickness of dikes seen in ophiolites (Kidd, 1977) and tectonic windows (Karson, 2002)) at the Juan de Fuca Ridge's spreading rate of 6 cm/yr (Riddihough, 1984)."
Nooner was reported to state that "We now have evidence, however, that Axial Seamount behaves in a more predictable way than many other volcanoes-likely due to its robust magma supply coupled with its thin crust, and its location on a mid-ocean ridge spreading center. It is now the only volcano on the seafloor whose surface deformation has been continuously monitored throughout an entire eruption cycle."
The discovery of the new eruption came on 28 July 2011 when Chadwick and Nooner, along with University of Washington colleagues Dave Butterfield and Marvin Lilley, led an expedition to Axial aboard the RV Atlantis (operated by the Woods Hole Oceanographic Institution). Using Jason, a remotely operated robotic vehicle (ROV), they discovered a new lava flow on the seafloor that was not present a year ago (figure 8).
Chadwick commented that "When we first arrived on the seafloor, we thought we were in the wrong place because it looked so completely different. We couldn't find our markers or monitoring instruments or other distinctive features on the bottom. When eruptions like this occur, a huge amount of heat comes out of the seafloor, the chemistry of seafloor hot springs is changed, and pre-existing vent biological communities are destroyed and new ones form. Some species are only found right after eruptions, so it is a unique opportunity to study them."
The first Jason ROV dive of the July 2011 expedition targeted a field of black smokers (dark, mineral laden hot springs) on the caldera's W side, an area beyond the reach of the new lava flows. Butterfield had been tracking the chemistry and microbiology of hot springs around the caldera since the 1998 eruption.
He noted that "The hot springs on the W side did not appear to be significantly disturbed, but the seawater within the caldera was much murkier than usual, and that meant something unusual was happening. When we saw the 'Snowblower' vents blasting out huge volumes of white floc and cloudy water on the next ROV dive, it was clear that the after-effects of the eruption were still going strong. This increased output seems to be associated with cooling of the lava flows and may last for a few months or up to a year."
The crew recovered seafloor instruments, including two bottom-pressure recorders and two ocean-bottom hydrophones, which showed that the eruption took place on 6 April 2011.
A third hydrophone was found buried in the new lava flows. According to Chadwick, "So far, it is hard to tell the full scope of the eruption because we discovered it near the end of the expedition. But it looks like it might be at least three times bigger than the 1998 eruption." The lava flow from the 6 April 2011 eruption was at least 2 km wide, the scientists noted.
The bottom-anchored instruments documented hundreds of tiny earthquakes during the volcanic eruption, but land-based seismic monitors and the Sound Surveillance System (SOSUS) hydrophone array operated by the U.S. Navy only detected a handful of them on the day of the eruption because many components of the hydrophone system were offline.
"Because the earthquakes detected back in April at a distance from the volcano were so few and relatively small, we did not believe there was an eruption," said Bob Dziak, an OSU marine geologist who monitors the SOSUS array. "That is why discovering the eruption at sea last week was such a surprise."
This latest Axial eruption caused the caldera floor to subside by more than 2 m. The scientists will be measuring the rate of magma inflation over the next few years to see if they can successfully forecast the next event.
References. Chadwick, W.W., Jr., Embley, R.W., Milburn, H.B., Meinig, C., and Stapp, M., 1999, Evidence for deformation associated with the 1998 eruption of Axial Volcano, Juan de Fuca Ridge, from acoustic extensometer measurements, Geophysical Research Letters, v. 26, no. 23, pp. 3441-3444 (doi:10.1029/1999GL900498).
Chadwick, W.W., Jr., Nooner, S.L., Zumberge, M.A., Embley, R.W., and Fox, C.G., 2006, Vertical deformation monitoring at Axial Seamount since its 1998 eruption using deep-sea pressure sensors, Journal of Volcanology and Geothermal Research, v. 150, issue 1-3, p. 313-327 (doi:10.1016/j.jvolgeores.2005.07.006).
Karson, J.A., 2002, Geologic structure of the uppermost oceanic crust created at fast- to intermediate-rate spreading centers, Annual Review of Earth and Planetary Science, v. 30, p. 347-384.
Kidd, R.G.W., 1977, A model for the process of formation of the upper oceanic crust, Geophysical Journal of the Royal Astronomical Society, v. 50, issue 1, p. 149-183.
Mogi, K., 1958, Relations between the eruptions of various volcanoes and the deformation of the ground surfaces around them. Bulletin of the Earthquake Research Institute, University of Tokyo, v. 36, p. 99-134.
Riddihough, R., 1984, Recent movements of the Juan de Fuca plate system, Journal of Geophysical Research, v. 89, p. 6980-6994.
Geologic Background. Axial Seamount rises 700 m above the mean level of the central Juan de Fuca Ridge crest about 480 km W of Cannon Beach, Oregon, to within about 1,400 m of the ocean surface. It is the most magmatically and seismically active site on the Juan de Fuca Ridge between the Blanco Fracture Zone and the Cobb offset. The summit is marked by an unusual rectangular-shaped caldera (3 x 8 km) that lies between two rift zones and is estimated to have formed about 31,000 years ago. The caldera is breached to the SE and is defined on three sides by boundary faults of up to 150 m relief. Hydrothermal vents with biological communities are located near the caldera fault and along the rift zones. Hydrothermal venting was discovered north of the caldera in 1983. Detailed mapping and sampling efforts have identified more than 50 lava flows emplaced since about 410 CE (Clague et al., 2013). Eruptions producing fissure-fed lava flows that buried previously installed seafloor instrumentation were detected seismically and geodetically in 1998 and 2011, and confirmed shortly after each eruption during submersible dives.
Information Contacts: Oregon State University, News and Research Communications, Corvalis, OR (URL: http://oregonstate.edu/ua/ncs/); Bill Chadwick and Bob Dziak, National Oceanic and Atmospheric Administration (NOAA) and Oregon State University (OSU); Scott Nooner.
Ebeko
Russia
50.686°N, 156.014°E; summit elev. 1103 m
All times are local (unless otherwise noted)
Gas-and-steam plumes and ash plumes in 2009 and 2010
Our most recent report on Ebeko (BGVN 34:08) described intermittent activity from mid-2005 to mid-2009, primarily plumes that sometimes deposited minor ash. Ebeko lacks a dedicated seismometer; therefore, the Kamchatkan Volcanic Eruption Response Team (KVERT) generally monitors the volcano with visual and satellite observations (figure 4). Intermittent plumes continued in 2009-2010.
Activity during October 2009. Based on analyses of satellite imagery, the Tokyo VAAC reported two possible eruption plumes from Ebeko in October 2009. The first plume, reported on 15 October 2009, rose to an altitude of 10.7 km and drifted NE. The second plume, on 26 October, rose to an altitude of 8.8 km and drifted E.
KVERT reported that on 26 October a gas-and-steam plume was seen by observers in Severo-Kurilsk (figure 4), a town about 7 km E of Ebeko. The plume rose about 300 m above the crater and drifted 1-2 km NNE. Gas-and-steam plumes rose 250 m above the crater and drifted 2 km E on 28 October and NNE on 29 October 2009.
Activity during June-July 2010. KVERT reported that activity increased on 2 July according to observers in Severo-Kurilsk (figure 5). Explosions produced ash plumes that rose to an altitude of 1.8 km and drifted SSE. The Aviation Color Code was raised to Yellow. On 23 July, KVERT reported that the Aviation Color Code was lowered to Green. Visual observations and satellite data indicated no activity from the volcano during 16-23 July.
Geologic Background. The flat-topped summit of the central cone of Ebeko volcano, one of the most active in the Kuril Islands, occupies the northern end of Paramushir Island. Three summit craters located along a SSW-NNE line form Ebeko volcano proper, at the northern end of a complex of five volcanic cones. Blocky lava flows extend west from Ebeko and SE from the neighboring Nezametnyi cone. The eastern part of the southern crater contains strong solfataras and a large boiling spring. The central crater is filled by a lake about 20 m deep whose shores are lined with steaming solfataras; the northern crater lies across a narrow, low barrier from the central crater and contains a small, cold crescentic lake. Historical activity, recorded since the late-18th century, has been restricted to small-to-moderate explosive eruptions from the summit craters. Intense fumarolic activity occurs in the summit craters, on the outer flanks of the cone, and in lateral explosion craters.
Information Contacts: Kamchatka Volcanic Eruptions Response Team (KVERT), Far East Division, Russian Academy of Sciences, 9 Piip Blvd., Petropavlovsk-Kamchatsky, 683006, Russia (URL: http://www.kscnet.ru/ivs/); Tokyo Volcanic Ash Advisory Center (VAAC), Tokyo, Japan (URL: http://ds.data.jma.go.jp/svd/vaac/data/).
Kirishimayama (Japan) — July 2011 Cite this Report
Kirishimayama
Japan
31.934°N, 130.862°E; summit elev. 1700 m
All times are local (unless otherwise noted)
February 2011 explosions launching ballistics; evacuations
Our last issue (BGVN 35:12) discussed the explosive eruptions and dome growth from early 2011 (19 January to about 4 February) from the summit crater of Kirishima's Shinmoe-dake. Vulcanian and Subplinian eruptions released enough ash to delay air traffic and prompt evacuations.
Regular ash plumes were observed above the volcano by pilots and with satellite imagery from January 2011 through March 2011 (table 2). More than 140 advisories were issued by the Tokyo Volcanic Ash Advisory Center (VAAC) since the eruption began in January, although only 14 were issued between April and July. Relying primarily on JMA data, this report presents a review of the monthly highlights, followed by a section with tilt, geodetic, and multi-year seismic data.
Table 2. Kirishima ash plumes reported from 22 January through 29 June 2011 based on JMA and VAAC reports with plume heights and drift directions. No plumes were reported for May or July.
| Date |
Altitude (km) |
Drift |
| 22 Jan 2011 |
1.8-2.1 |
SE |
| 26-27 Jan 2011 |
1.8-2.1 |
SE |
| 31 Jan 2011 |
2.1 |
SE |
| 02-08 Feb 2011 |
1.5-4.6 |
SE |
| 03 Feb 2011 |
9.1 |
NE |
| 09-11 Feb 2011 |
1.8-4.0 |
E, SE |
| 11, 14 Feb 2011 |
4.6-6.1 |
-- |
| 18 Feb 2011 |
4.6 |
S |
| 24, 28 Feb 2011 |
1.8-2.1 |
N, E, and SE |
| 01, 03 Mar 2011 |
3.7 |
NE |
| 03, 04, 08 Mar 2011 |
1.5-3.0 |
SE |
| 13 Mar 2011 |
5.5-6.1 |
E |
| 23 Mar 2011 |
2.4 |
SE |
| 29 Mar 2011 |
2.1 |
SE |
| 03, 04 Apr 2011 |
4.6-6.1 |
E |
| 18 Apr 2011 |
3.7 |
SE |
| 23 Jun 2011 |
1.8 |
E |
| 29 Jun 2011 |
1.8-2.4 |
N |
Peak of Kirishima's 2011 activity. The most dramatic events of the reporting interval took place on 1 and 14 February 2011. JMA field surveyors and local communities reported ballistics from Shinmoe-dake impacted areas up to 3.2 km SW from the crater; these volcanic bombs were from the 1 February eruption. Car windows, solar panels, and roofs were damaged from a shockwave and rock fragments that ranged from lapilli to bombs (up to 0.7 m) (figure 15).
The largest explosion, at 0754 on 1 February 2011, launched large blocks and juvenile material that impacted the forest to distances of 3.2 km from the crater. Kyushu University recorded oscillations from the impacts of some of these bombs. Investigators from the Earthquake Research Institute of the University of Tokyo visited an impact crater that was surrounded by broken trees; bomb fragments could be found more than 50 m from the crater. Charred wood was found beneath some of the bombs indicating that the material was still hot when it impacted the ground (personal communication, John Lyons, Michigan Technological University).
On 14 February, roofs were damaged when volcanic bombs traveled up to 16 km NE; JMA reported that strong winds that day contributed to these long dispersal distances. According to local news reports, bombs struck and damaged cars parked in the service area of Miyazaki Expressway and they shattered windows in Kobayashi, 13 km NE.
News reports relayed recommendations from civil authorities to evacuate 72,500 people from near Shinmoe-dake due to lahar hazards. Heavy rain had been falling since the previous day and in preparation for expected debris flows, authorities opened primary schools and community centers to shelter residents. At the time of the advisory, 63 people has already evacuated from Miyakonojo, 30 km SE of the crater region.
According to the JMA monthly report, incandescence was visible at night from 26 January to 10 February and also on 28 February. SO2 flux was 11,000-12,000 tons/day during January and averaged 600 tons/day on 25 February. There were 2,037 and 2,506 seismic events in January and February respectively. Tremor was continuous from 26 January to 7 February (a decrease occurred on 29 January). After 7 February, tremor was intermittent.
Activity during March 2011. On 1 March, ashfall was reported E of Shinmoe-dake and a shockwave was felt 3 km from the crater. Ash was deposited to the SW on 3 March and on 13 March ash was reported 60 km E over the Sea of Hyuga. As the intensity of ejections tapered off on 22 March, the restricted zone was reduced from 4 km to 3 km.
According to the monthly JMA report, a sensitive camera recorded night time glow from 1-14 March. SO2 flux averaged 1,300 tons/day on 2 March; however, on 8 March and six subsequent sampling days, the average was 200-500 tons/day. A total of 2,262 seismic events were recorded this month; continuous tremor was recorded from 28 February to 4 March.
Activity during April 2011. Ballistics on 3 April impacted areas as far as 600 m from the crater and ash traveled E to the Hyuga Sea. Ash from 9 April extended ENE and reached a town 60 km from the crater. Ballistics on 18 April impacted the local region as far as 1 km W and N; ash was reported 60 km E, and lapilli reached 9 km from the crater, damaging solar heaters and roof panels in the town of Takaharu.
According to JMA, the average SO2 flux on 2 and 21 April was 100-200 tons/day. A total of 3,840 seismic events were documented in the April report with hypocenters ~ 2 km below the crater; total tremor duration was 42 hours and 13 minutes.
Activity during May 2011. On 13 May, the average SO2 flux was measured at 200 tons/day according to JMA. Seismic stations detected 1,784 events with hypocenters between 0-2 km above sea level near Shinmoe-dake. Total duration of tremor was 1 hour 9 minutes.
Activity during June 2011. On 29 June, ash from an explosion was distributed N and reached the town of Itsuki ~ 50 km N from the crater. Ash from a 16 June eruption reached Takaharu and the city of Kobayashi, 15 km E of the crater. On the 23 June a smaller amount of ash was also observed in Kobayashi. No lapilli or ballistics were associated with these events. According to JMA, rainy weather (common in Japan during early summer) hampered direct observations of the crater. No gas or thermal data was collected. Seismic reports for June documented 4,096 events with hypocenters 0-2 km above sea level and the duration of tremor was 43 hours and 41 minutes.
Activity during July 2011. According to news reports, on 6 July advisories were issued throughout SE Kyushu for torrential rain hazards. Poor weather reduced direct observations of crater activity. JMA reported 3,764 seismic events during this period with 41 minutes of tremor. Earthquake hypocenters were in the same range as past months (0-2 km).
Tilt and geodetic data. Figure 16 plots multiple kinds of data collected during February-July 2011. During the reporting interval, tilt measurements typically indicated inflation on the flanks of Shinmoe-dake hours-to-several-days before explosive events occurred. Conversely, they recorded subsidence immediately after some eruptions. There were also cases of eruptions and explosive events not correlating with tilt. JMA interpreted tilt data as related to the intermittent ascent of magma moving from the chamber to the crater. GPS measurements since February 2011 by the Geospatial Information Authority of Japan suggested a deep magma supply centered several kilometers NW of Shinmoe-dake.
Multi-year seismic data. In the July report, JMA released continuous seismic data for Kirishima during June 2004 through July 2011. Epicenters were located for numerous earthquakes and appeared to concentrate within 2 km of the crater with depths less than 6 km (figure 17).
During the explosive activity beginning in January 2011, more than 1,000 high frequency earthquakes occurred each month. High frequency (HF) earthquakes are defined as signals greater than 5 Hz (Ishihara and others, 2005). The total number of earthquakes increased and appeared to peak in June with 4,096 high-frequency earthquakes.
Visible and thermal aerial observations. Rapid growth of a lava dome within the Shinmoe-dake crater began on 28 January and was closely monitored by aerial observations. Over the course of 3 days, the dome reached a volume of more than 107 m3 and sustained a diameter of ~ 600 m (BGVN 35:12). Collaboration between the Japan Ground and Air Self-Defense Force (JGSDF-JASDF) provided numerous thermal images as recent as 31 May. During four separate flights in May, white plumes were observed from the SE parts of the dome margin. These plumes reached 50-100 m above the crater rim. Infrared imagery taken during JGSDF-JASDF flights showed no major change since February regarding the heat distribution across the dome and within the crater region. The highest temperatures measured during these flights corresponded to the plume area and the size of the dome had not changed since emplacement.
The Tokyo VAAC reported that on 23 and 29 June, eruptions from Shinmoe-dake produced plumes that rose to an altitude of 1.8 km and 1.8-2.4 km respectively, the first drifted E and the second drifted N. The VAAC reported another eruption on 6 August.
Reference. Ishihara, K., Tameguri, T., Igushi, M., 2005, Automated Classification of Volcanic Earthquakes and Tremors-Outline of the system and preliminary experiment, Annuals of Disaster Prevention Research Institute, Kyoto University, No. 48C.
Geologic Background. Kirishimayama is a large group of more than 20 Quaternary volcanoes located north of Kagoshima Bay. The late-Pleistocene to Holocene dominantly andesitic group consists of stratovolcanoes, pyroclastic cones, maars, and underlying shield volcanoes located over an area of 20 x 30 km. The larger stratovolcanoes are scattered throughout the field, with the centrally located Karakunidake being the highest. Onamiike and Miike, the two largest maars, are located SW of Karakunidake and at its far eastern end, respectively. Holocene eruptions have been concentrated along an E-W line of vents from Miike to Ohachi, and at Shinmoedake to the NE. Frequent small-to-moderate explosive eruptions have been recorded since the 8th century.
Information Contacts: Volcano Research Center, Earthquake Research Institute (VRC-ERI), University of Tokyo, Yayoi 1-1-1, Bunkyo-ku, Tokyo 113, Japan (URL: http://www.eri.u-tokyo.ac.jp/topics/ASAMA2004/index-e.html); Japan Meteorological Agency (JMA), Otemachi, 1-3-4, Chiyoda-ku Tokyo 100-8122, Japan (URL: http://www.jma.go.jp/); Tokyo Volcanic Ash Advisory Center (VAAC), Tokyo, Japan (URL: http://ds.data.jma.go.jp/svd/vaac/data/); Yukio Hayakawa, Gunma University, Faculty of Education, Aramaki 4-2, Maebashi 371-8510, Japan; John Lyons, Michigan Technological University, Dept. of Geological and Mining Engineering and Sciences, 1400 Townsend Drive, Houghton MI, 49931, USA (URL: http://www.geo.mtu.edu/~jlyons/); News On Japan (URL: http://www.newsonjapan.com/); Japan Today (URL: http://www.japantoday.com/); Daily Mail (URL: http://www.dailymail.co.uk/).
Marapi
Indonesia
0.38°S, 100.474°E; summit elev. 2885 m
All times are local (unless otherwise noted)
Increased seismicity in 2004; small ash-bearing eruptions in 2011
This report first describes a 2005 increase in seismicity at Marapi, then presents a 2010 field map of Marapi's active crater area, and notes several plumes seen in 2011 to 1 km above the vent, some bearing ash. As previously noted, Marapi had generated explosions in 2000 and 2001, and a small ash-bearing eruption in 2004 (BGVN 25:11, 27:01, and 30:01).
Activity during 2005. During the week 8-14 July 2005, the number of earthquakes at Marapi increased dramatically. The seismic network recorded 112 deep volcanic earthquakes, compared to a normal average of 7 per week. Other changes were absent at the volcano, for example, fumarole temperatures were normal and gas emissions typically rose ~ 50 m above the summit. As a result of the increased seismicity, the Center of Volcanology and Geological Hazard Mitigation (CVGHM) raised the Alert Level from 1 to 2 (on a scale of 1-4).
Activity during 2010. During a 4-day visit to Marapi in July 2010, volcanologist Mary-Ann del Marmol created a sketch map of the area (figure 3). More detailed mapping and rock observations of the old crater side of the volcano were thwarted by dense vegetation there.
Activity during 2011. According to CVGHM, seismicity increased during 21 June-3 August 2011. Observers noted that during June, July, and the first day of August white plumes rose 15-75 m above the summit craters. On 3 August dense gray plumes rose 300-1,000 m above the crater on eight occasions. That same day CVGHM raised the Alert Level again to 2. Visitors and residents were prohibited from going within a 3 km radius of the summit.
According to a news article, two eruptions from Marapi occurred on 9 August 2011.
Geologic Background. Gunung Marapi, not to be confused with the better-known Merapi volcano on Java, is Sumatra's most active volcano. This massive complex stratovolcano rises 2,000 m above the Bukittinggi Plain in the Padang Highlands. A broad summit contains multiple partially overlapping summit craters constructed within the small 1.4-km-wide Bancah caldera. The summit craters are located along an ENE-WSW line, with volcanism migrating to the west. More than 50 eruptions, typically consisting of small-to-moderate explosive activity, have been recorded since the end of the 18th century; no lava flows outside the summit craters have been reported in historical time.
Information Contacts: Center of Volcanology and Geological Hazard Mitigation (CVGHM), Jalan Diponegoro 57, Bandung 40122, Indonesia (URL: http://vsi.esdm.go.id/); Mary-Ann del Marmol, Geology and Soil Science Department, University of Ghent, Krijgslaan, 281 S8/A.326, B-9000 Gent, Belgium (URL: http://www.volcanology.ugent.be/delmarmol.htm); Metro TV News (URL: http://www.metrotvnews.com/).
Rabaul (Papua New Guinea) — July 2011 Cite this Report
Rabaul
Papua New Guinea
4.2459°S, 152.1937°E; summit elev. 688 m
All times are local (unless otherwise noted)
Two small eruptions since one in July 2010
A significant volume of ash from the Tavurvur cone of Rabaul volcano fell in the surrounding region during an eruption on 23-24 July 2010 (BGVN 35:09). Moderate SE winds and moving vehicles raised dust and presented difficult conditions for residents. Similar conditions were reported by the Rabaul Volcano Observatory (RVO, a facility that sits 6.75 km NW of Tavurvur) through the rest of 2010 and early into 2011. This report discusses behavior as late as mid-2011. This report also draws attention to a comprehensive overview of the Rabaul volcano by Johnson and others (2010), the result of the Rabaul Volcano Workshop held in the town of Rabaul (about 6 km NW of Tavurvur), Papua New Guinea during 17-18 November 2009. Several of the maps and figures from that report appear below.
RVO reported that post-eruption processing of Global Positioning System (GPS) data showed slight deflation after the eruption of 23-25 July 2010. Sulfur dioxide (SO2) gas measurements on 28 July were low. RVO opined that the lack of seismicity suggested Tavurvur would remain quiet; however, changes in the status of the volcano can happen very rapidly as was the case on 23 July. For the period from 26 July to 12 August 2010 no ash emissions occurred from Tavurvur cone. Only very small volumes of white vapor were released. No audible noises were reported and no incandescence was observed. In addition, seismicity was very low.
GPS measurements on Matupit Island continued to show inflation; long-term information indicated further increase in the rate of uplift from mid-February 2011 onwards.
RVO had noted a swarm of high frequency volcano-tectonic earthquakes on 28 February 2011 in the caldera's NE sector. This swarm followed the occurrence of both small, discrete, high-frequency earthquakes and an emergence of low-frequency earthquakes. Previous observations during the past 16 years suggest strong connections between such NE-sector earthquakes and either renewed eruption or increased activity from Tavurvur. However, in this case RVO did not report increased activity following the 28 February seismic swarm.
RVO reported that Tavurvur remained quiet throughout the month of March 2011. Activity consisted mainly of very small volumes of thin white vapor, which became denser during rain and cool conditions. No audible noises were heard and no glow was observed at night. That said, based on analyses of satellite imagery, the Darwin VAAC reported that on 29 March an ash plume rose to an altitude of 3 km and drifted over 53 km NW.
During an on-site inspection in March 2011 steady dull glow was observed in three small vents on the floor of the crater, indicating the presence of magma near the surface. Incandescence on the crater floor was still present when the volcano was observed during another on-site inspection in April 2011, however the vent opening had become enlarged due to collapse of material surrounding the earlier vents.
During April and most of July 2011, RVO reported variable amounts of white vapor emissions, occasionally tinted blue, and no audible noises. About twelve earthquakes were recorded in July; the most notable events occurred on 12, 15, 19, 20, and 27 July. A new eruption characterized by emergent low-frequency tremors and slowly rising gray ash plumes occurred on 29 July 2011 at 1332. A single explosion occurred on 30 July at 0106 which probably produced light ashfall to the NW. The explosion produced a short explosion noise. A brief period of harmonic volcanic tremors was recorded between 0740 and 0758 hours on 1 August 2011, presumably caused by forceful vent degassing. There was no short-term anomalous seismicity prior to the start of the eruption.
GPS measurements on Matupit Island continued to show long-term inflation; about 10-11 cm of uplift was recorded since August 2010. There was a slight drop in the rate of the uplift in early-to mid-July 2011. The drop did not affect the long-term trend of uplift significantly.
RVO reported that white vapor plumes rose from the Tavurvur cone during 1-3 August 2011. An explosion on 3 August produced a gray ash plume that rose 1 km above the crater and drifted NNW. Sustained emissions of pale-gray ash continued for about an hour afterwards. In addition, ash deposited at the former airport was re-suspended and blown NW into the E part of Rabaul town (3-5 km NW) and towards Namanula hill (3 km W). Seismicity was very low, although two periods of harmonic tremor on 2 August and the explosion and ash emissions on 3 August were detected.
During 4-5 August 2011 gray ash emissions periodically continued, punctuated by a few large and notable explosions. Ash plumes from the explosions rose 1 km above the crater and drifted N and NW producing fine ashfall in the E part of Rabaul town, Namanula Hill, and further downwind towards Tavui Point. Moderate seismicity consisting of low-frequency earthquakes, explosions, and volcanic tremors with variable durations was detected. During 5-9 August activity increased, characterized by an increased frequency and duration of ash emissions and more explosions. About 34 explosions were recorded between 5 and 8 August. Ash-rich clouds that rose 1.5 km above the crater drifted NW, causing ashfall in most parts of Rabaul town and in areas between Toliap and Nonga (10 km NW).
With the resumption of ash emissions, the trend of uplift during the past year, discrete volcano-tectonic earthquakes detected during the past two months, and the magnitude of the earthquake swarm that occurred in the caldera's NE sector in late February 2011, RVO warned that possible sporadic ashfall may occur in the future.
Report of the 2009 Rabaul workshop. The Rabaul Volcano Workshop of 2009 was held to review, synthesize, and assess geoscientific information on the volcanoes of the NE Gazelle Peninsula and identify needed instrumental monitoring and scientific research directions. Several figures from the workshop report (Johnson and others, 2010) give current ideas about Rabaul and vicinity. This includes an array of volcanoes at the N end of the Gazelle Volcanic Zone (figure 51), New Britain volcanism (figure 52), the Nengmutka-to-Tavui volcanic centers (figure 53), and the spatial distribution of earthquakes (figure 54). In addition, two kinds of cross-sectional models of Rabaul are included (figures 55 and 56).
According to the workshop report, over the last 15 years Tavurvur has been erupting with a Volcanic Explosivity Index (VEI) of 3 to 4. The Rabaul caldera has produced a variety of products due to magma mixing.
The report noted that Tavurvur's eruption style differs from the other volcanoes in the caldera. It has two different styles of eruptions: phreatomagmatic and Vulcanian-Strombolian. Tavurvur's eruptions last significantly longer. These facts, in addition to Tavurvur's emission of sulfur dioxide (SO2), lead to the conclusion that Tavurvur is part of an active geothermal system. This geothermal system overlies a magma chamber that is in contact with basalt (leading to magma mixing). That magmatic system is actively degassing.
References. D'Addario, G.W., Dow, D.B., and Swoboda, R., 1976, Geology of Papua New Guinea, Bureau of Mineral Resources, Canberra, Australia.
Johnson, R.W., Itikarai, I., Patia, H., and McKee, C.O., 2010. Volcanic systems of the Northeastern Gazalle Peninsula, Papua New Guinea: Synopsis, evaluation, and a model for Rabaul volcano; Rabaul Volcano Workshop Report, Papua New Guinea Dept.of Mineral Policy and Geohazards Management and the Australian Agency for International Development, 84 p. [Copies available from Wally Johnson (wallyjohnson _at_ grapevine.com.au), and Rabaul Volcano Observatory, P.O. Box 3386, Kokopo, East New Britain Province, Papua New Guinea].
Geologic Background. The low-lying Rabaul caldera on the tip of the Gazelle Peninsula at the NE end of New Britain forms a broad sheltered harbor utilized by what was the island's largest city prior to a major eruption in 1994. The outer flanks of the asymmetrical shield volcano are formed by thick pyroclastic-flow deposits. The 8 x 14 km caldera is widely breached on the east, where its floor is flooded by Blanche Bay and was formed about 1,400 years ago. An earlier caldera-forming eruption about 7,100 years ago is thought to have originated from Tavui caldera, offshore to the north. Three small stratovolcanoes lie outside the N and NE caldera rims. Post-caldera eruptions built basaltic-to-dacitic pyroclastic cones on the caldera floor near the NE and W caldera walls. Several of these, including Vulcan cone, which was formed during a large eruption in 1878, have produced major explosive activity during historical time. A powerful explosive eruption in 1994 occurred simultaneously from Vulcan and Tavurvur volcanoes and forced the temporary abandonment of Rabaul city.
Information Contacts: R.W. Johnson, Rabaul Volcanological Observatory Twinning Program, Visiting Fellow, College of Asia and the Pacific, Australian National University, Canberra, Australia; Darwin Volcanic Ash Advisory Centre (VAAC) (URL: http://www.bom.gov.au/info/vaac/); Rabaul Volcano Observatory, Department of Mineral Policy and Geohazards Management, Volcanological Observatory Geohazards Management Division, P.O. Box 3386, Kokopo, East New Britain Province, Papua New Guinea.
Ruapehu (New Zealand) — July 2011 Cite this Report
Ruapehu
New Zealand
39.28°S, 175.57°E; summit elev. 2797 m
All times are local (unless otherwise noted)
2009-2011: Earthquake triggered shift in lake height; lake heating cycle
New Zealand's GeoNet, a combination of the country's Earthquake Commission and GNS Science, reported that at 1830 on 13 July 2009, there was a small (M 2) volcanic earthquake beneath Ruapehu's crater lake. As a result of a new research project measuring the temperature and level of the lake, instruments documented a sudden 15-cm jump in lake level following the earthquake. The lake temperature remained unchanged at 20°C.
The lake was examined from a helicopter on 14 July 2009. Viewing conditions were very poor, but no obvious changes had occurred since the last visit on 2 July 2009. No eruption had occurred and the lake was overflowing. The preliminary interpretation was that the volcanic earthquake was followed by about 20 x 106 liters of extra water moving into the lake from the hydrothermal system beneath it. A much larger rise in lake level had followed a very small eruption in October 2006, so lake-height adjustments were not unknown at Ruapehu. However, this was the first time that scientists had been able to correlate such a small rise with a single volcanic earthquake. The Volcanic Alert Level remained at Level 1 (a designation signifying a departure from typical background surface activity and signs of unrest).
In October 2010, GeoNet reported that the lake had began a heating cycle, the eighth since the lake was re-established in 2002 after the 1995-1996 eruptions (BGVN 20:09 and 20:10). Later, on 7 March 2011, GeoNet reported the lake temperature at 40°C, the third highest temperature recorded since the re-establishment of the lake (table 14).
Table 14. Summary of reported temperatures in Ruapehu's Crater Lake. Courtesy of GeoNet.
| Date |
Crater Lake Temperature |
Comments |
| May 2003 |
42.5°C |
Highest temperature since re-establishment of lake in 2002 |
| 13 Jul 2009 |
20°C |
Low temperature |
| Oct 2010 |
-- |
Onset of 2010-2011 heating cycle |
| 07 Mar 2011 |
40-41°C |
High temperatures |
| 05 Apr 2011 |
38-39°C |
Slightly decreased (but still high) temperatures around this time |
| 18 Apr 2011 |
33-34°C |
Decreased temperatures |
| 02 May 2011 |
30°C |
Further drop in temperature |
Other monitored indicators had shown variable trends in parts of March 2011. Those indicators included gas output, seismicity, lake chemistry, and ground deformation. Such variable trends were like those previously seen during lake heating cycles. GeoNet reported on 5 April 2011 that Ruapehu had undergone a sustained period of high Crater Lake water temperatures. In recent weeks changes also occurred in volcanic gas output, seismic activity and lake water chemistry. These changes suggested unrest above known background levels, hence authorities elevated the Aviation Color Code to Yellow but kept the Volcanic Alert Level at 1. After 4 April there was a general decrease in activity, with lower CO2 gas flux, less seismicity, little change in lake-water chemistry, and cessation of lake overflow accompanying the start of the cooling trend. On 18 April 2011 GeoNet reported decreased lake temperature; other monitored indicators in recent weeks also suggest a slow decrease of activity. On 2 May 2011 authorities lowered the Aviation Color Code to Green, the lowest hazard status. This followed a continued decrease in lake-water temperature and several weeks of slow decreases in other available indicators.
Geologic Background. Ruapehu, one of New Zealand's most active volcanoes, is a complex stratovolcano constructed during at least four cone-building episodes dating back to about 200,000 years ago. The dominantly andesitic 110 km3 volcanic massif is elongated in a NNE-SSW direction and surrounded by another 100 km3 ring plain of volcaniclastic debris, including the NW-flank Murimoto debris-avalanche deposit. A series of subplinian eruptions took place between about 22,600 and 10,000 years ago, but pyroclastic flows have been infrequent. The broad summait area and flank contain at least six vents active during the Holocene. Frequent mild-to-moderate explosive eruptions have been recorded from the Te Wai a-Moe (Crater Lake) vent, and tephra characteristics suggest that the crater lake may have formed as recently as 3,000 years ago. Lahars resulting from phreatic eruptions at the summit crater lake are a hazard to a ski area on the upper flanks and lower river valleys.
Information Contacts: GeoNet (URL: http://www.geonet.org.nz/).
Suwanosejima (Japan) — July 2011 Cite this Report
Suwanosejima
Japan
29.638°N, 129.714°E; summit elev. 796 m
All times are local (unless otherwise noted)
Many small explosions up to 2 km altitude during mid-2009 to mid-2011
In a previous report (BGVN 34:07) we discussed ash plume data from the Tokyo Volcanic Ash Advisory Center (VAAC) and reports from the Japan Meteorological Agency (JMA) that covered explosive activity based on infrasound measurements and seismicity during October 2008 to July 2009. Many explosions were heard and felt but cloud cover obscured direct observations. From 6 July 2009 to 14 July 2011 the Tokyo VAAC reported 234 explosions; 62 of which produced a measurable ash plume (table 9) from the summit crater, On-take (also called Otake).
Table 9. A summary of Tokyo Volcanic Ash Advisory Center (VAAC) reports on measured ash plumes from Suwanose-jima, 15 July 2009 to 14 July 2011. Courtesy of Tokyo VAAC, based on information from the JMA, pilot reports, and satellite imagery.
| Date (UTC) |
Plume Altitude (km) |
Drift Direction |
| 15-17 Jul 2009 |
1.5-2.1 |
NE, W |
| 16-17 Aug 2009 |
1.8 |
E |
| 28-29 Aug 2009 |
1.5-2.4 |
W |
| 17-18 Sep 2009 |
1.5 |
S |
| 01 Oct 2009 |
1.5 |
W |
| 10 Oct 2009 |
1.5 |
-- |
| 04-05 Nov 2009 |
1.2-1.8 |
SW, W, NE |
| 26 Nov 2009 |
3.0 |
E |
| 14 Dec 2009 |
1.2-1.5 |
E |
| 22 Dec 2009 |
1.5 |
-- |
| 02 Jan 2010 |
1.8 |
-- |
| 04-05 Jan 2010 |
1.5-1.8 |
NE, E |
| 09 Jan 2010 |
1.8 |
E |
| 26-27 Jan 2010 |
1.2-1.5 |
SE, W |
| 29 Jan 2010 |
1.8 |
-- |
| 17 Feb 2010 |
1.2-1.5 |
E, SE |
| 19 Feb 2010 |
1.5 |
SE |
| 21 Feb 2010 |
1.8 |
-- |
| 15-16 May 2010 |
1.5-1.8 |
NW |
| 23 Jul 2010 |
2.4 |
NW |
| 26 Jul 2010 |
1.5 |
W |
| 22 Sep 2010 |
1.5-2.1 |
SE |
| 25 Sep 2010 |
1.5 |
E |
| 05 Oct 2010 |
1.5 |
E |
| 17 Oct 2010 |
1.5 |
SE |
| 10-12 Nov 2010 |
1.5-2.1 |
SE, N, SW |
| 18 Nov 2010 |
1.8 |
-- |
| 21 Nov 2010 |
2.1 |
NE |
| 29 Nov 2010 |
1.2-1.5 |
-- |
| 04 Dec 2010 |
1.2 |
SE |
| 13 Jan 2011 |
1.2 |
SE |
| 22 Jan 2011 |
1.5 |
S |
| 05 Feb 2011 |
0.6 |
SW |
| 12 Apr 2011 |
1.8 |
-- |
| 14 Jul 2011 |
3.7 |
-- |
JMA stated that this volcano has erupted every year since 1956. The activity alert status for Suwanose-jima was Level 2 (on a 1 to 5 scale where 5 is the highest) from December 2007 to July 2011; this status indicates that the crater is too dangerous to visit.
Activity during late 2009. The Tokyo VAAC reported frequent plumes from mid-August through December 2009. The tallest plumes, above 1.5 km altitude, occurred on 16-17 and 29 August, and 5 and 26 November (table 9). According to JMA, a visitor during 29-30 December 2009 saw Strombolian eruptions.
Activity during 2010. Ash plumes up to ~ 2.4 km altitude were reported by the Tokyo VAAC on many days throughout the year (table 9).
Based on the seismic record, JMA was able to infer when explosions occurred within the crater. The number of these explosions decreased from 64 in January to 0 in June; from July to September there were less than 20 monthly explosions, but activity appeared to peak in November when 94 explosions were recorded.
Aerial observations were made in collaboration with the Japan Maritime Self Defense Force (JMSDF) on 14 December (figure 14). The flight confirmed high temperature areas at both the summit crater's center and at the lower, outer rim. Thes results were congruent with those obtained earlier, in December 2009, and JMA concluded that similar conditions prevailed in the crater during this interval.
Activity during 2011. Ash plumes were reported by the Tokyo VAAC for January, February, April, and July; the tallest occurred on July 14 and reached ~ 3.6 km altitude (table 9). From January to July 2011, volcanic earthquakes and tremor remained relatively high (figure 15).
A 2.9-magnitude earthquake centered below Suwanose-jima occurred on 3 February 2011 at 2206. That month, local inhabitants reportedly felt 17 earthquakes. No surface change was observed before or after the earthquakes. Surveillance in February 2011 included visual observations by the Coast Guard.
Immediately after the 11 March 2011 Tohoku Earthquake (M 9.0, located offshore of Honshu, Japan) instruments at Suwanose-jima recorded increases in high-frequency (A-type) earthquakes. A-type earthquakes are generally considered to have shallow focal depths; B-type earthquakes, deeper focal depths.
Ash explosions seemingly rarely occurred through March 2011, but reports from [the village 4 km SSW of the crater] stated that observers there had seen ballistics thrown from the summit crater. Due to prolonged poor weather, surveillance cameras did not record this activity. JMA reported that plume heights for April, May, and June 2011 remained at background levels, with maximum heights of 0.4?1.0 km. Intermittent incandescence was recorded with surveillance cameras when clear weather allowed observations at night from March through June.
Geologic Background. The 8-km-long island of Suwanosejima in the northern Ryukyu Islands consists of an andesitic stratovolcano with two active summit craters. The summit is truncated by a large breached crater extending to the sea on the E flank that was formed by edifice collapse. One of Japan's most frequently active volcanoes, it was in a state of intermittent Strombolian activity from Otake, the NE summit crater, between 1949 and 1996, after which periods of inactivity lengthened. The largest recorded eruption took place in 1813-14, when thick scoria deposits covered residential areas, and the SW crater produced two lava flows that reached the western coast. At the end of the eruption the summit of Otake collapsed, forming a large debris avalanche and creating an open collapse scarp extending to the eastern coast. The island remained uninhabited for about 70 years after the 1813-1814 eruption. Lava flows reached the eastern coast of the island in 1884. Only about 50 people live on the island.
Information Contacts: Tokyo Volcanic Ash Advisory Center (VAAC), Tokyo, Japan (URL: http://ds.data.jma.go.jp/svd/vaac/data/); Japan Meteorological Agency (JMA), Otemachi, 1-3-4, Chiyoda-ku Tokyo 100-8122, Japan (URL: http://www.jma.go.jp/); Yukio Hayakawa, Gunma University, Faculty of Education, Aramaki 4-2, Maebashi 371-8510, Japan.
Tofua
Tonga
19.75°S, 175.07°W; summit elev. 515 m
All times are local (unless otherwise noted)
Evidence of ongoing intermittent eruption into 2011
Tofua is a non-instrumented, remote, island volcano that is seldom the subject of reports; it continued to emit at least low-level eruptions well into 2011. This small volcanic island lies in southern Tonga (see map and other figures in BGVN 34:02), ~ 1,700 km NNE of New Zealand. In 1993 there were ~ 10 residents (BGVN 34:02).
Our previous report on Tofua (BGVN 34:02) gave a summary of MODVOLC thermal alert data through March 2009 and discussed data artifacts due to reflected sunlight over the ocean. Since that time, only a single-pixel thermal alert was measured, located at the vent on 4 March 2011.
Sailors visit in 2010. On 24 April 2010, sailors in a replica 7.6-m-long wooden boat landed on the island associated with a re-enactment of the landing made by Captain Bligh after he and his crew were cast off of the Bounty in 1789. A number of photos associated with announcements regarding the 2010 landing and activities on Tofua suggests that the volcano was still active in a manner similar to that previously discussed (BGVN 31:06 and 34:02), issuing spatter from a small vent that contained lava (figure 6).
Other photos confirmed that, seen from a distance, the active Lofia crater emitted either a substantial white plume or thin gaseous emissions. A down-dropped zone appears to have developed on part of the crater floor between March 2009 and early 2010 (figure 6). The floor itself is not horizontal; much of it slopes at ~45 degrees from the horizontal.
The original caption for the photo shown in figure 6 read "Mark Belvedere peers into Tofua's very active volcanic crater." Belvedere (president of the Kalia Foundation, an organization developed to preserve and extend the Polynesian seafaring tradition) participated in events associated with the re-enactment. The sailors traveled on a replica of the boat used by Bligh and the crew members loyal to him.
According to the expedition announcements, the re-enactment attempted to make the voyage under similar conditions with the same amount of food and water. The sailors went without charts, additional landfalls, and many modern luxuries. According to news accounts, the 2010 voyage took 7 weeks, ending in Kupang, West Timor.
VAAC report in 2011. July reports by the Tonga Meteorological Services and pilot observations described a cloud of unspecified color and dimension from Tofua that rose to an altitude of 1.3 km. This led the Wellington Volcanic Ash Advisory Centre (VAAC) to produce aviation reports (called Volcanic Ash Advisories) starting 13 July 2011. Follow-up reports (without new information) continued until 19 July 2011. Subsequent notices stated that the cloud was not detected in satellite imagery.
Bligh's comment. Following the 1789 mutiny on the Bounty, Captain William Bligh and 18 others were cast adrift on the small launch in which they completed a 6,700 km journey from near Tofua to West Timor. Bligh's small notebook formed the basis of In Bligh's Hand: Surviving the Mutiny on the Bounty (Gall, 2010). An entire chapter is devoted to Tofua ("We eat under great apprehension of the Natives, Tofua and indigenous relations") but the remarks describing the volcano's behavior are brief:
"When Bligh left the Bounty in the launch, he set course for Tofua, 30 miles away. Its location was marked by a smoke smudge on the skyline issuing from the island's active volcano."
That comment indicates the volcano was degassing when seen in 1789, but leaves the issue of the exact eruptive state ambiguous. The earliest witnessed eruption, the 1774 eruption seen by Captain Cook, was judged as explosive (a VEI 2 eruption; Siebert and others, 2010).
References. Gall, J., 2010, In Bligh's Hand: Surviving the Mutiny on the Bounty, National Library of Australia collection highlights, 234 pp. [ISBN: 9780642277053] (Selected portions, including those referred to here, available on Google books, URL: http://books.google.com/books?id=0TfjOmTv8bYC& )
Siebert, L., Simkin, T., and Kimberly, P., 2010, Volcanoes of the World, 3nd edition: University of California Press and Smithsonian Institution, 568 p.
Tonga Visitors Bureau, 2010, The 'Mutiny on the Bounty' crew visit the volcanic island of Tofua; Tonga Visitors Bureau (Ministry of Tourism), the National Tourist Office (NTO) for the Kingdom of Tonga, URL: http://www.tongaholiday.com/?p=4892; Posted 6 May 2010; accessed August 2011.
Geologic Background. The low, forested Tofua Island in the central part of the Tonga Islands group is the emergent summit of a large stratovolcano that was seen in eruption by Captain Cook in 1774. The summit contains a 5-km-wide caldera whose walls drop steeply about 500 m. Three post-caldera cones were constructed at the northern end of a cold fresh-water caldera lake, whose surface lies only 30 m above sea level. The easternmost cone has three craters and produced young basaltic-andesite lava flows, some of which traveled into the caldera lake. The largest and northernmost of the cones, Lofia, has a steep-sided crater that is 70 m wide and 120 m deep and has been the source of historical eruptions, first reported in the 18th century. The fumarolically active crater of Lofia has a flat floor formed by a ponded lava flow.
Information Contacts: Hawai'i Institute of Geophysics and Planetology (HIGP) MODVOLC Thermal Alerts System, School of Ocean and Earth Science and Technology (SOEST), Univ. of Hawai'i, 2525 Correa Road, Honolulu, HI 96822, USA (URL: http://modis.higp.hawaii.edu/); Kalia Foundation USA, 4515 SW Natchez Ct., Tualatin, Oregon 97062 USA; Mark Belvedere, Treasure Island Eueiki Eco Resort, Vava'u, Tonga; Stuart Kershaw, In the Dark Productions company (URL: http://inthedarkproductions.co.uk/); Wellington Volcanic Ash Advisory Center (VAAC), New Zealand (URL: http://vaac.metservice.com/).