Recently Published Bulletin Reports
Manam (Papua New Guinea) Few ash plumes during November-December 2022
Krakatau (Indonesia) Strombolian activity and ash plumes during November 2022-April 2023
Stromboli (Italy) Strombolian explosions and lava flows continue during January-April 2023
Nishinoshima (Japan) Small ash plumes and fumarolic activity during November 2022 through April 2023
Karangetang (Indonesia) Lava flows, incandescent avalanches, and ash plumes during January-June 2023
Ahyi (United States) Intermittent hydroacoustic signals and discolored plumes during November 2022-June 2023
Kadovar (Papua New Guinea) An ash plume and weak thermal anomaly during May 2023
San Miguel (El Salvador) Small gas-and-ash explosions during March and May 2023
Ebeko (Russia) Continued explosions, ash plumes, and ashfall during October 2022-May 2023
Home Reef (Tonga) Discolored plumes continued during November 2022-April 2023
Semisopochnoi (United States) Occasional explosions, ash deposits, and gas-and-steam plumes during December 2022-May 2023
Ambae (Vanuatu) New lava flow, ash plumes, and sulfur dioxide plumes during February-May 2023
Manam (Papua New Guinea) — July 2023  Cite this Report
Manam
Papua New Guinea
4.08°S, 145.037°E; summit elev. 1807 m
All times are local (unless otherwise noted)
Few ash plumes during November-December 2022
Manam is a 10-km-wide island that consists of two active summit craters: the Main summit crater and the South summit crater and is located 13 km off the northern coast of mainland Papua New Guinea. Frequent mild-to-moderate eruptions have been recorded since 1616. The current eruption period began during June 2014 and has more recently been characterized by intermittent ash plumes and thermal activity (BGVN 47:11). This report updates activity that occurred from November 2022 through May 2023 based on information from the Darwin Volcanic Ash Advisory Center (VAAC) and various satellite data.
Ash plumes were reported during November and December 2022 by the Darwin VAAC. On 7 November an ash plume rose to 2.1 km altitude and drifted NE based on satellite images and weather models. On 14 November an ash plume rose to 2.1 km altitude and drifted W based on RVO webcam images. On 20 November ash plumes rose to 1.8 km altitude and drifted NW. On 26 December an ash plume rose to 3 km altitude and drifted S and SSE.
Intermittent sulfur dioxide plumes were detected using the TROPOMI instrument on the Sentinel-5P satellite, some of which exceeded at least two Dobson Units (DU) and drifted in different directions (figure 93). Occasional low-to-moderate power thermal anomalies were recorded by the MIROVA (Middle InfraRed Observation of Volcanic Activity) system; less than five anomalies were recorded each month during November 2022 through May 2023 (figure 94). Two thermal hotspots were detected by the MODVOLC thermal alerts system on 10 December 2022. On clear weather days, thermal activity was also captured in infrared satellite imagery in both the Main and South summit craters, accompanied by gas-and-steam emissions (figure 95).
Geologic Background. The 10-km-wide island of Manam, lying 13 km off the northern coast of mainland Papua New Guinea, is one of the country's most active volcanoes. Four large radial valleys extend from the unvegetated summit of the conical basaltic-andesitic stratovolcano to its lower flanks. These valleys channel lava flows and pyroclastic avalanches that have sometimes reached the coast. Five small satellitic centers are located near the island's shoreline on the northern, southern, and western sides. Two summit craters are present; both are active, although most observed eruptions have originated from the southern crater, concentrating eruptive products during much of the past century into the SE valley. Frequent eruptions, typically of mild-to-moderate scale, have been recorded since 1616. Occasional larger eruptions have produced pyroclastic flows and lava flows that reached flat-lying coastal areas and entered the sea, sometimes impacting populated areas.
Information Contacts: Rabaul Volcano Observatory (RVO), Geohazards Management Division, Department of Mineral Policy and Geohazards Management (DMPGM), PO Box 3386, Kokopo, East New Britain Province, Papua New Guinea; Darwin Volcanic Ash Advisory Centre (VAAC), Bureau of Meteorology, Northern Territory Regional Office, PO Box 40050, Casuarina, NT 0811, Australia (URL: http://www.bom.gov.au/info/vaac/); MIROVA (Middle InfraRed Observation of Volcanic Activity), a collaborative project between the Universities of Turin and Florence (Italy) supported by the Centre for Volcanic Risk of the Italian Civil Protection Department (URL: http://www.mirovaweb.it/); Hawai'i Institute of Geophysics and Planetology (HIGP) - MODVOLC Thermal Alerts System, School of Ocean and Earth Science and Technology (SOEST), Univ. of Hawai'i, 2525 Correa Road, Honolulu, HI 96822, USA (URL: http://modis.higp.hawaii.edu/); NASA Global Sulfur Dioxide Monitoring Page, Atmospheric Chemistry and Dynamics Laboratory, NASA Goddard Space Flight Center (NASA/GSFC), 8800 Greenbelt Road, Goddard, Maryland, USA (URL: https://so2.gsfc.nasa.gov/); Copernicus Browser, Copernicus Data Space Ecosystem, European Space Agency (URL: https://dataspace.copernicus.eu/browser/).
Krakatau (Indonesia) — July 2023 Cite this Report
Krakatau
Indonesia
6.1009°S, 105.4233°E; summit elev. 285 m
All times are local (unless otherwise noted)
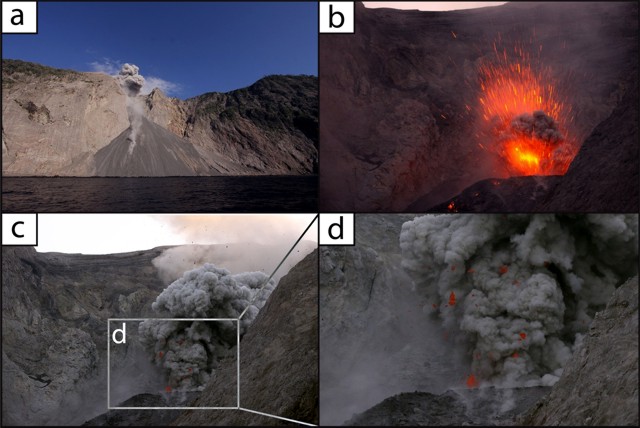
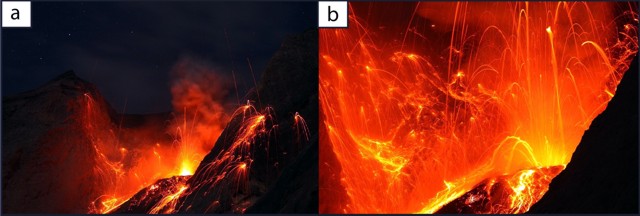
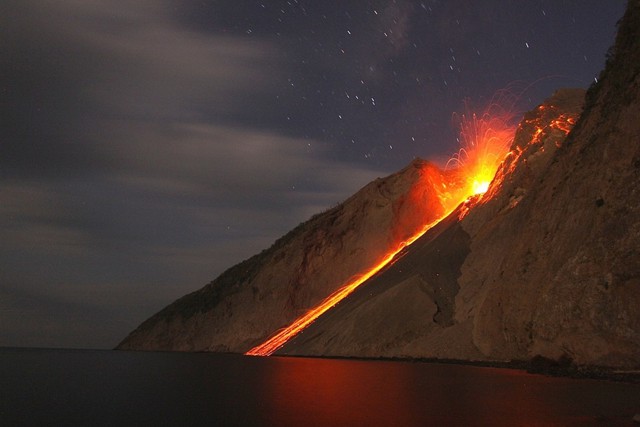
Strombolian activity and ash plumes during November 2022-April 2023
Krakatau is located in the Sunda Strait between Java and Sumatra, Indonesia. Caldera collapse during the catastrophic 1883 eruption destroyed Danan and Perbuwatan cones and left only a remnant of Rakata. The post-collapse cone of Anak Krakatau (Child of Krakatau) was constructed within the 1883 caldera at a point between the former Danan and Perbuwatan cones; it has been the site of frequent eruptions since 1927. The current eruption period began in May 2021 and has recently consisted of explosions, ash plumes, and thermal activity (BGVN 47:11). This report covers activity during November 2022 through April 2023 based on information provided by the Indonesian Center for Volcanology and Geological Hazard Mitigation, referred to as Pusat Vulkanologi dan Mitigasi Bencana Geologi (PVMBG), MAGMA Indonesia, the Darwin Volcanic Ash Advisory Center (VAAC), and several sources of satellite data.
Activity was relatively low during November and December 2022. Daily white gas-and-steam plumes rose 25-100 m above the summit and drifted in different directions. Gray ash plumes rose 200 m above the summit and drifted NE at 1047 and at 2343 on 11 November. On 14 November at 0933 ash plumes rose 300 m above the summit and drifted E. An ash plume was reported at 0935 on 15 December that rose 100 m above the summit and drifted NE. An eruptive event at 1031 later that day generated an ash plume that rose 700 m above the summit and drifted NE. A gray ash plume at 1910 rose 100 m above the summit and drifted E. Incandescent material was ejected above the vent based on an image taken at 1936.
During January 2023 daily white gas-and-steam plumes rose 25-300 m above the summit and drifted in multiple directions. Gray-to-brown ash plumes were reported at 1638 on 3 January, at 1410 and 1509 on 4 January, and at 0013 on 5 January that rose 100-750 m above the summit and drifted NE and E; the gray-to-black ash plume at 1509 on 4 January rose as high as 3 km above the summit and drifted E. Gray ash plumes were recorded at 1754, 2241, and 2325 on 11 January and at 0046 on 12 January and rose 200-300 m above the summit and drifted NE. Toward the end of January, PVMBG reported that activity had intensified; Strombolian activity was visible in webcam images taken at 0041, 0043, and 0450 on 23 January. Multiple gray ash plumes throughout the day rose 200-500 m above the summit and drifted E and SE (figure 135). Webcam images showed progressively intensifying Strombolian activity at 1919, 1958, and 2113 on 24 January; a gray ash plume at 1957 rose 300 m above the summit and drifted E (figure 135). Eruptive events at 0231 and 2256 on 25 January and at 0003 on 26 January ejected incandescent material from the vent, based on webcam images. Gray ash plumes observed during 26-27 January rose 300-500 m above the summit and drifted NE, E, and SE.
Low levels of activity were reported during February and March. Daily white gas-and-steam plumes rose 25-300 m above the summit and drifted in different directions. The Darwin VAAC reported that continuous ash emissions rose to 1.5-1.8 km altitude and drifted W and NW during 1240-1300 on 10 March, based on satellite images, weather models, and PVMBG webcams. White-and-gray ash plumes rose 500 m and 300 m above the summit and drifted SW at 1446 and 1846 on 18 March, respectively. An eruptive event was recorded at 2143, though it was not visible due to darkness. Multiple ash plumes were reported during 27-29 March that rose as high as 2.5 km above the summit and drifted NE, W, and SW (figure 136). Webcam images captured incandescent ejecta above the vent at 0415 and around the summit area at 2003 on 28 March and at 0047 above the vent on 29 March.
Daily white gas-and-steam plumes rose 25-300 m above the summit and drifted in multiple directions during April and May. White-and-gray and black plumes rose 50-300 m above the summit on 2 and 9 April. On 11 May at 1241 a gray ash plume rose 1-3 km above the summit and drifted SW. On 12 May at 0920 a gray ash plume rose 2.5 km above the summit and drifted SW and at 2320 an ash plume rose 1.5 km above the summit and drifted SW. An accompanying webcam image showed incandescent ejecta. On 13 May at 0710 a gray ash plume rose 2 km above the summit and drifted SW (figure 137).
The MIROVA (Middle InfraRed Observation of Volcanic Activity) graph of MODIS thermal anomaly data showed intermittent low-to-moderate power thermal anomalies during November 2022 through April 2023 (figure 138). Some of this thermal activity was also visible in infrared satellite imagery at the crater, accompanied by gas-and-steam and ash plumes that drifted in different directions (figure 139).
Geologic Background. The renowned Krakatau (frequently mis-named as Krakatoa) volcano lies in the Sunda Strait between Java and Sumatra. Collapse of an older edifice, perhaps in 416 or 535 CE, formed a 7-km-wide caldera. Remnants of that volcano are preserved in Verlaten and Lang Islands; subsequently the Rakata, Danan, and Perbuwatan cones were formed, coalescing to create the pre-1883 Krakatau Island. Caldera collapse during the catastrophic 1883 eruption destroyed Danan and Perbuwatan, and left only a remnant of Rakata. This eruption caused more than 36,000 fatalities, most as a result of tsunamis that swept the adjacent coastlines of Sumatra and Java. Pyroclastic surges traveled 40 km across the Sunda Strait and reached the Sumatra coast. After a quiescence of less than a half century, the post-collapse cone of Anak Krakatau (Child of Krakatau) was constructed within the 1883 caldera at a point between the former Danan and Perbuwatan cones. Anak Krakatau has been the site of frequent eruptions since 1927.
Information Contacts: Pusat Vulkanologi dan Mitigasi Bencana Geologi (PVMBG, also known as Indonesian Center for Volcanology and Geological Hazard Mitigation, CVGHM), Jalan Diponegoro 57, Bandung 40122, Indonesia (URL: http://www.vsi.esdm.go.id/); MAGMA Indonesia, Kementerian Energi dan Sumber Daya Mineral (URL: https://magma.esdm.go.id/v1); Darwin Volcanic Ash Advisory Centre (VAAC), Bureau of Meteorology, Northern Territory Regional Office, PO Box 40050, Casuarina, NT 0811, Australia (URL: http://www.bom.gov.au/info/vaac/); MIROVA (Middle InfraRed Observation of Volcanic Activity), a collaborative project between the Universities of Turin and Florence (Italy) supported by the Centre for Volcanic Risk of the Italian Civil Protection Department (URL: http://www.mirovaweb.it/); Copernicus Browser, Copernicus Data Space Ecosystem, European Space Agency (URL: https://dataspace.copernicus.eu/browser/).
Stromboli
Italy
38.789°N, 15.213°E; summit elev. 924 m
All times are local (unless otherwise noted)
Strombolian explosions and lava flows continue during January-April 2023
Stromboli, located in Italy, has exhibited nearly constant lava fountains for the past 2,000 years; recorded eruptions date back to 350 BCE. Eruptive activity occurs at the summit from multiple vents, which include a north crater area (N area) and a central-southern crater (CS area) on a terrace known as the ‘terrazza craterica’ at the head of the Sciara del Fuoco, a large scarp that runs from the summit down the NW side of the volcano-island. Activity typically consists of Strombolian explosions, incandescent ejecta, lava flows, and pyroclastic flows. Thermal and visual monitoring cameras are located on the nearby Pizzo Sopra La Fossa, above the terrazza craterica, and at multiple flank locations. The current eruption period has been ongoing since 1934 and recent activity has consisted of frequent Strombolian explosions and lava flows (BGVN 48:02). This report updates activity during January through April 2023 primarily characterized by Strombolian explosions and lava flows based on reports from Italy's Istituto Nazionale di Geofisica e Vulcanologia (INGV) and various satellite data.
Frequent explosive activity continued throughout the reporting period, generally in the low-to-medium range, based on the number of hourly explosions in the summit crater (figure 253, table 16). Intermittent thermal activity was recorded by the MIROVA (Middle InfraRed Observation of Volcanic Activity) analysis of MODIS satellite data (figure 254). According to data collected by the MODVOLC thermal algorithm, a total of 9 thermal alerts were detected: one on 2 January 2023, one on 1 February, five on 24 March, and two on 26 March. The stronger pulses of thermal activity likely reflected lava flow events. Infrared satellite imagery captured relatively strong thermal hotspots at the two active summit craters on clear weather days, showing an especially strong event on 8 March (figure 255).
Table 16. Summary of type, frequency, and intensity of explosive activity at Stromboli by month during January-April 2023; information from webcam observations. Courtesy of INGV weekly reports.
| Month |
Explosive Activity |
| Jan 2023 |
Typical Strombolian activity with spattering and lava overflows in the N crater area. Explosions were reported from 4 vents in the N area and 1-2 vents in the CS area. The average hourly frequency of explosions was low-to-medium (1-12 events/hour). The intensity of the explosions varied from low (less than 80 m high) to medium (less than 150 m high) in the N crater area and up to high (greater than 150 m high) in the CS crater area. |
| Feb 2023 |
Typical Strombolian activity with spattering in the N crater area. Explosions were reported from 2-3 vents in the N area and 1-4 vents in the CS area. The average hourly frequency of explosions was low-to-medium (1-14 events/hour). The intensity of the explosions varied from low (less than 80 m high) to medium (less than 150 m high) in the N crater area and up to high (greater than 150 m high) in the CS crater area. |
| Mar 2023 |
Typical Strombolian activity with spattering and lava overflows in the N crater area. Explosions were reported from 2-3 vents in the N area and 2-4 vents in the CS area. The average hourly frequency of explosions was low-to-medium (1-18 events/hour). The intensity of the explosions varied from low (less than 80 m high) to medium (less than 150 m high) in the N crater area and up to high (greater than 150 m high) in the CS crater area. |
| Apr 2023 |
Typical Strombolian activity. Explosions were reported from 2 vents in the N area and 2-3 vents in the CS area. The average hourly frequency of explosions was low-to-high (1-16 events/hour). The intensity of the explosions varied from low (less than 80 m high) to medium (less than 150 m high) in both the N and CS crater areas. |
Activity during January-February 2023. Strombolian explosions were reported in the N crater area, as well as lava effusion. Explosive activity in the N crater area ejected coarse material (bombs and lapilli). Intense spattering was observed in both the N1 and N2 craters. In the CS crater area, explosions generally ejected fine material (ash), sometimes to heights greater than 250 m. The intensity of the explosions was characterized as low-to-medium in the N crater and medium-to-high in the CS crater. After intense spattering activity from the N crater area, a lava overflow began at 2136 on 2 January that flowed part way down the Sciara del Fuoco, possibly moving down the drainage that formed in October, out of view from webcams. The flow remained active for a couple of hours before stopping and beginning to cool. A second lava flow was reported at 0224 on 4 January that similarly remained active for a few hours before stopping and cooling. Intense spattering was observed on 11 and 13 January from the N1 crater. After intense spattering activity at the N2 crater at 1052 on 17 January another lava flow started to flow into the upper part of the Sciara del Fuoco (figure 256), dividing into two: one that traveled in the direction of the drainage formed in October, and the other one moving parallel to the point of emission. By the afternoon, the rate of the flow began to decrease, and at 1900 it started to cool. A lava flow was reported at 1519 on 24 January following intense spattering in the N2 area, which began to flow into the upper part of the Sciara del Fuoco. By the morning of 25 January, the lava flow had begun to cool. During 27 January the frequency of eruption in the CS crater area increased to 6-7 events/hour compared to the typical 1-7 events/hour; the following two days showed a decrease in frequency to less than 1 event/hour. Starting at 1007 on 30 January a high-energy explosive sequence was produced by vents in the CS crater area. The sequence began with an initial energetic pulse that lasted 45 seconds, ejecting predominantly coarse products 300 m above the crater that fell in an ESE direction. Subsequent and less intense explosions ejected material 100 m above the crater. The total duration of this event lasted approximately two minutes. During 31 January through 6, 13, and 24 February spattering activity was particularly intense for short periods in the N2 crater.
An explosive sequence was reported on 16 February that was characterized by a major explosion in the CS crater area (figure 257). The sequence began at 1817 near the S2 crater that ejected material radially. A few seconds later, lava fountains were observed in the central part of the crater. Three explosions of medium intensity (material was ejected less than 150 m high) were recorded at the S2 crater. The first part of this sequence lasted approximately one minute, according to INGV, and material rose 300 m above the crater and then was deposited along the Sciara del Fuoco. The second phase began at 1818 at the S1 crater; it lasted seven seconds and material was ejected 150 m above the crater. Another event 20 seconds later lasted 12 seconds, also ejecting material 150 m above the crater. The sequence ended with at least three explosions of mostly fine material from the S1 crater. The total duration of this sequence was about two minutes.
Short, intense spattering activity was noted above the N1 crater on 27 and 28 February. A lava overflow was first reported at 0657 from the N2 crater on 27 February that flowed into the October 2022 drainage. By 1900 the flow had stopped. A second lava overflow also in the N crater area occurred at 2149, which overlapped the first flow and then stopped by 0150 on 28 February. Material detached from both the lava overflows rolled down the Sciara del Fuoco, some of which was visible in webcam images.
Activity during March-April 2023. Strombolian activity continued with spattering activity and lava overflows in the N crater area during March. Explosive activity at the N crater area varied from low (less than 80 m high) to medium (less than 150 m high) and ejected coarse material, such as bombs and lapilli. Spattering was observed above the N1 crater, while explosive activity at the CS crater area varied from medium to high (greater than 150 m high) and ejected coarse material. Intense spattering activity was observed for short periods on 6 March above the N1 crater. At approximately 0610 a lava overflow was reported around the N2 crater on 8 March, which then flowed into the October 2022 drainage. By 1700 the flow started to cool. A second overflow began at 1712 on 9 March and overlapped the previous flow. It had stopped by 2100. Material from both flows was deposited along the Sciara del Fuoco, though much of the activity was not visible in webcam images. On 11 March a lava overflow was observed at 0215 that overlapped the two previous flows in the October 2022 drainage. By late afternoon on 12 March, it had stopped.
During a field excursion on 16 March, scientists noted that a vent in the central crater area was degassing. Another vent showed occasional Strombolian activity that emitted ash and lapilli. During 1200-1430 low-to-medium intense activity was reported; the N1 crater emitted ash emissions and the N2 crater emitted both ash and coarse material. Some explosions also occurred in the CS crater area that ejected coarse material. The C crater in the CS crater area occasionally showed gas jetting and low intensity explosions on 17 and 22 March; no activity was observed at the S1 crater. Intense, longer periods of spattering were reported in the N1 crater on 19, 24, and 25 March. Around 2242 on 23 March a lava overflow began from the N1 crater that, after about an hour, began moving down the October 2022 drainage and flow along the Sciara del Fuoco (figure 258). Between 0200 and 0400 on 26 March the flow rate increased, which generated avalanches of material from collapses at the advancing flow front. By early afternoon, the flow began to cool. On 25 March at 1548 an explosive sequence began from one of the vents at S2 in the CS crater area (figure 258). Fine ash mixed with coarse material was ejected 300 m above the crater rim and drifted SSE. Some modest explosions around Vent C were detected at 1549 on 25 March, which included an explosion at 1551 that ejected coarse material. The entire explosive sequence lasted approximately three minutes.
During April explosions persisted in both the N and CS crater areas. Fine material was ejected less than 80 m above the N crater rim until 6 April, followed by ejection of coarser material. Fine material was also ejected less than 80 m above the CS crater rim. The C and S2 crater did not show significant eruptive activity. On 7 April an explosive sequence was detected in the CS crater area at 1203 (figure 259). The first explosion lasted approximately 18 seconds and ejected material 400 m above the crater rim, depositing pyroclastic material in the upper part of the Sciara del Fuoco. At 1204 a second, less intense explosion lasted approximately four seconds and deposited pyroclastic products outside the crater area and near Pizzo Sopra La Fossa. A third explosion at 1205 was mainly composed of ash that rose about 150 m above the crater and lasted roughly 20 seconds. A fourth explosion occurred at 1205 about 28 seconds after the third explosion and ejected a mixture of coarse and fine material about 200 m above the crater; the explosion lasted roughly seven seconds. Overall, the entire explosive sequence lasted about two minutes and 20 seconds. After the explosive sequence on 7 April, explosions in both the N and CS crater areas ejected material as high as 150 m above the crater.
On 21 April research scientists from INGV made field observations in the summit area of Stromboli, and some lapilli samples were collected. In the N crater area near the N1 crater, a small cone was observed with at least two active vents, one of which was characterized by Strombolian explosions. The other vent produced explosions that ejected ash and chunks of cooled lava. At the N2 crater at least one vent was active and frequently emitted ash. In the CS crater area, a small cone contained 2-3 degassing vents and a smaller, possible fissure area also showed signs of degassing close to the Pizzo Sopra La Fossa. In the S part of the crater, three vents were active: a small hornito was characterized by modest and rare explosions, a vent that intermittently produced weak Strombolian explosions, and a vent at the end of the terrace that produced frequent ash emissions. Near the S1 crater there was a hornito that generally emitted weak gas-and-steam emissions, sometimes associated with “gas rings”. On 22 April another field inspection was carried out that reported two large sliding surfaces on the Sciara del Fuoco that showed where blocks frequently descended toward the sea. A thermal anomaly was detected at 0150 on 29 April.
Geologic Background. Spectacular incandescent nighttime explosions at Stromboli have long attracted visitors to the "Lighthouse of the Mediterranean" in the NE Aeolian Islands. This volcano has lent its name to the frequent mild explosive activity that has characterized its eruptions throughout much of historical time. The small island is the emergent summit of a volcano that grew in two main eruptive cycles, the last of which formed the western portion of the island. The Neostromboli eruptive period took place between about 13,000 and 5,000 years ago. The active summit vents are located at the head of the Sciara del Fuoco, a prominent scarp that formed about 5,000 years ago due to a series of slope failures which extends to below sea level. The modern volcano has been constructed within this scarp, which funnels pyroclastic ejecta and lava flows to the NW. Essentially continuous mild Strombolian explosions, sometimes accompanied by lava flows, have been recorded for more than a millennium.
Information Contacts: Istituto Nazionale di Geofisica e Vulcanologia (INGV), Sezione di Catania, Piazza Roma 2, 95123 Catania, Italy, (URL: http://www.ct.ingv.it/en/); MIROVA (Middle InfraRed Observation of Volcanic Activity), a collaborative project between the Universities of Turin and Florence (Italy) supported by the Centre for Volcanic Risk of the Italian Civil Protection Department (URL: http://www.mirovaweb.it/); Hawai'i Institute of Geophysics and Planetology (HIGP) - MODVOLC Thermal Alerts System, School of Ocean and Earth Science and Technology (SOEST), Univ. of Hawai'i, 2525 Correa Road, Honolulu, HI 96822, USA (URL: http://modis.higp.hawaii.edu/); Copernicus Browser, Copernicus Data Space Ecosystem, European Space Agency (URL: https://dataspace.copernicus.eu/browser/).
Nishinoshima (Japan) — July 2023 Cite this Report
Nishinoshima
Japan
27.247°N, 140.874°E; summit elev. 100 m
All times are local (unless otherwise noted)
Small ash plumes and fumarolic activity during November 2022 through April 2023
Nishinoshima is a small island located about 1,000 km S of Tokyo in the Ogasawara Arc in Japan. The island is the summit of a massive submarine volcano that has prominent peaks to the S, W, and NE. Eruptions date back to 1973; the most recent eruption period began in October 2022 and was characterized by ash plumes and fumarolic activity (BGVN 47:12). This report describes ash plumes and fumarolic activity during November 2022 through April 2023 based on monthly reports from the Japan Meteorological Agency (JMA) monthly reports and satellite data.
The most recent eruptive activity prior to the reporting internal occurred on 12 October 2022, when an ash plume rose 3.5 km above the crater rim. An aerial observation conducted by the Japan Coast Guard (JCG) on 25 November reported that white fumaroles rose approximately 200 m above the central crater of a pyroclastic cone (figure 119), and multiple plumes were observed on the ESE flank of the cone. Discolored water ranging from reddish-brown to brown and yellowish-green were visible around the perimeter of the island (figure 119). No significant activity was reported in December.
During an overflight conducted by JCG on 25 January 2023 intermittent activity and small, blackish-gray plumes rose 900 m above the central part of the crater were observed (figure 120). The fumarolic zone of the E flank and base of the cone had expanded and emissions had intensified. Dark brown discolored water was visible around the perimeter of the island.
No significant activity was reported during February through March. Ash plumes at 1050 and 1420 on 11 April rose 1.9 km above the crater rim and drifted NW and N. These were the first ash plumes observed since 12 October 2022. On 14 April JCG carried out an overflight and reported that no further eruptive activity was visible, although white gas-and-steam plumes were visible from the central crater and rose 900 m high (figure 121). Brownish and yellow-green discolored water surrounded the island.
Intermittent low-to-moderate power thermal anomalies were recorded in the MIROVA graph (Middle InfraRed Observation of Volcanic Activity) during November 2022 through April 2023 (figure 123). A cluster of six to eight anomalies were detected during November while a smaller number were detected during the following months: two to three during December, one during mid-January 2023, one during February, five during March, and two during April. Thermal activity was also reflected in infrared satellite data at the summit crater, accompanied by occasional gas-and-steam plumes (figure 124).
Geologic Background. The small island of Nishinoshima was enlarged when several new islands coalesced during an eruption in 1973-74. Multiple eruptions that began in 2013 completely covered the previous exposed surface and continued to enlarge the island. The island is the summit of a massive submarine volcano that has prominent peaks to the S, W, and NE. The summit of the southern cone rises to within 214 m of the ocean surface 9 km SSE.
Information Contacts: Japan Meteorological Agency (JMA), 1-3-4 Otemachi, Chiyoda-ku, Tokyo 100-8122, Japan (URL: http://www.jma.go.jp/jma/indexe.html); MIROVA (Middle InfraRed Observation of Volcanic Activity), a collaborative project between the Universities of Turin and Florence (Italy) supported by the Centre for Volcanic Risk of the Italian Civil Protection Department (URL: http://www.mirovaweb.it/); Copernicus Browser, Copernicus Data Space Ecosystem, European Space Agency (URL: https://dataspace.copernicus.eu/browser/).
Karangetang (Indonesia) — July 2023 Cite this Report
Karangetang
Indonesia
2.781°N, 125.407°E; summit elev. 1797 m
All times are local (unless otherwise noted)
Lava flows, incandescent avalanches, and ash plumes during January-June 2023
Karangetang (also known as Api Siau), at the northern end of the island of Siau, Indonesia, contains five summit craters along a N-S line. More than 40 eruptions have been recorded since 1675; recent eruptions have included frequent explosive activity, sometimes accompanied by pyroclastic flows and lahars. Lava dome growth has occurred in the summit craters and collapses of lava flow fronts have produced pyroclastic flows. The two active summit craters are Kawah Dua (the N crater) and Kawah Utama (the S crater, also referred to as the “Main Crater”). The most recent eruption began in late November 2018 and has more recently consisted of weak thermal activity and gas-and-steam emissions (BGVN 48:01). This report updates activity characterized by lava flows, incandescent avalanches, and ash plumes during January through June 2023 using reports from Pusat Vulkanologi dan Mitigasi Bencana Geologi (PVMBG, also known as CVGHM, or the Center of Volcanology and Geological Hazard Mitigation), MAGMA Indonesia, the Darwin VAAC (Volcano Ash Advisory Center), and satellite data.
Activity during January was relatively low and mainly consisted of white gas-and-steam emissions that rose 25-150 m above Main Crater (S crater) and drifted in different directions. Incandescence was visible from the lava dome in Kawah Dua (the N crater). Weather conditions often prevented clear views of the summit. On 18 January the number of seismic signals that indicated avalanches of material began to increase. In addition, there were a total of 71 earthquakes detected during the month.
Activity continued to increase during the first week of February. Material from Main Crater traveled as far as 800 m down the Batuawang (S) and Batang (W) drainages and as far as 1 km W down the Beha (W) drainage on 4 February. On 6 February 43 earthquake events were recorded, and on 7 February, 62 events were recorded. White gas-and-steam emissions rose 25-250 m above both summit craters throughout the month. PVMBG reported an eruption began during the evening of 8 February around 1700. Photos showed incandescent material at Main Crater. Incandescent material had also descended the flank in at least two unconfirmed directions as far as 2 km from Main Crater, accompanied by ash plumes (figure 60). As a result, PVMBG increased the Volcano Alert Level (VAL) to 3 (the second highest level on a 1-4 scale).
Occasional nighttime webcam images showed three main incandescent lava flows of differing lengths traveling down the S, SW, and W flanks (figure 61). Incandescent rocks were visible on the upper flanks, possibly from ejected or collapsed material from the crater, and incandescence was the most intense at the summit. Based on analyses of satellite imagery and weather models, the Darwin VAAC reported that daily ash plumes during 16-20 February rose to 2.1-3 km altitude and drifted NNE, E, and SE. BNPB reported on 16 February that as many as 77 people were evacuated and relocated to the East Siau Museum. A webcam image taken at 2156 on 17 February possibly showed incandescent material descending the SE flank. Ash plumes rose to 2.1 km altitude and drifted SE during 22-23 February, according to the Darwin VAAC.
Incandescent avalanches of material and summit incandescence at Main Crater continued during March. White gas-and-steam emissions during March generally rose 25-150 m above the summit crater; on 31 March gas-and-steam emissions rose 200-400 m high. An ash plume rose to 2.4 km altitude and drifted S at 1710 on 9 March and a large thermal anomaly was visible in images taken at 0550 and 0930 on 10 March. Incandescent material was visible at the summit and on the flanks based on webcam images taken at 0007 and 2345 on 16 March, at 1828 on 17 March, at 1940 on 18 March, at 2311 on 19 March, and at 2351 on 20 March. Incandescence was most intense on 18 and 20 March and webcam images showed possible Strombolian explosions (figure 62). An ash plume rose to 2.4 km altitude and drifted SW on 18 March, accompanied by a thermal anomaly.
Summit crater incandescence at Main Crater and on the flanks persisted during April. Incandescent material at the S crater and on the flanks was reported at 0016 on 1 April. The lava flows had stopped by 1 April according to PVMBG, although incandescence was still visible up to 10 m high. Seismic signals indicating effusion decreased and by 6 April they were no longer detected. Incandescence was visible from both summit craters. On 26 April the VAL was lowered to 2 (the second lowest level on a 1-4 scale). White gas-and-steam emissions rose 25-200 m above the summit crater.
During May white gas-and-steam emissions generally rose 50-250 m above the summit, though it was often cloudy, which prevented clear views; on 21 May gas-and-steam emissions rose 50-400 m high. Nighttime N summit crater incandescence rose 10-25 m above the lava dome, and less intense incandescence was noted above Main Crater, which reached about 10 m above the dome. Sounds of falling rocks at Main Crater were heard on 15 May and the seismic network recorded 32 rockfall events in the crater on 17 May. Avalanches traveled as far as 1.5 km down the SW and S flanks, accompanied by rumbling sounds on 18 May. Incandescent material descending the flanks was captured in a webcam image at 2025 on 19 May (figure 63) and on 29 May; summit crater incandescence was observed in webcam images at 2332 on 26 May and at 2304 on 29 May. On 19 May the VAL was again raised to 3.
Occasional Main Crater incandescence was reported during June, as well as incandescent material on the flanks. White gas-and-steam emissions rose 10-200 m above the summit crater. Ash plumes rose to 2.1 km altitude and drifted SE and E during 2-4 June, according to the Darwin VAAC. Material on the flanks of Main Crater were observed at 2225 on 7 June, at 2051 on 9 June, at 0007 on 17 June, and at 0440 on 18 June. Webcam images taken on 21, 25, and 27 June showed incandescence at Main Crater and from material on the flanks.
MIROVA (Middle InfraRed Observation of Volcanic Activity) analysis of MODIS satellite data showed strong thermal activity during mid-February through March and mid-May through June, which represented incandescent avalanches and lava flows (figure 64). During April through mid-May the power of the anomalies decreased but frequent anomalies were still detected. Brief gaps in activity occurred during late March through early April and during mid-June. Infrared satellite images showed strong lava flows mainly affecting the SW and S flanks, accompanied by gas-and-steam emissions (figure 65). According to data recorded by the MODVOLC thermal algorithm, there were a total of 79 thermal hotspots detected: 28 during February, 24 during March, one during April, five during May, and 21 during June.
Geologic Background. Karangetang (Api Siau) volcano lies at the northern end of the island of Siau, about 125 km NNE of the NE-most point of Sulawesi. The stratovolcano contains five summit craters along a N-S line. It is one of Indonesia's most active volcanoes, with more than 40 eruptions recorded since 1675 and many additional small eruptions that were not documented (Neumann van Padang, 1951). Twentieth-century eruptions have included frequent explosive activity sometimes accompanied by pyroclastic flows and lahars. Lava dome growth has occurred in the summit craters; collapse of lava flow fronts have produced pyroclastic flows.
Information Contacts: Pusat Vulkanologi dan Mitigasi Bencana Geologi (PVMBG, also known as Indonesian Center for Volcanology and Geological Hazard Mitigation, CVGHM), Jalan Diponegoro 57, Bandung 40122, Indonesia (URL: http://www.vsi.esdm.go.id/); MAGMA Indonesia, Kementerian Energi dan Sumber Daya Mineral (URL: https://magma.esdm.go.id/v1); Badan Nasional Penanggulangan Bencana (BNPB), National Disaster Management Agency, Graha BNPB - Jl. Scout Kav.38, East Jakarta 13120, Indonesia (URL: http://www.bnpb.go.id/); Darwin Volcanic Ash Advisory Centre (VAAC), Bureau of Meteorology, Northern Territory Regional Office, PO Box 40050, Casuarina, NT 0811, Australia (URL: http://www.bom.gov.au/info/vaac/); MIROVA (Middle InfraRed Observation of Volcanic Activity), a collaborative project between the Universities of Turin and Florence (Italy) supported by the Centre for Volcanic Risk of the Italian Civil Protection Department (URL: http://www.mirovaweb.it/); Hawai'i Institute of Geophysics and Planetology (HIGP) - MODVOLC Thermal Alerts System, School of Ocean and Earth Science and Technology (SOEST), Univ. of Hawai'i, 2525 Correa Road, Honolulu, HI 96822, USA (URL: http://modis.higp.hawaii.edu/); Copernicus Browser, Copernicus Data Space Ecosystem, European Space Agency (URL: https://dataspace.copernicus.eu/browser/); IDN Times, Jl. Jend. Gatot Subroto Kav. 27 3rd Floor Kuningan, Jakarta, Indonesia 12950, Status of Karangetang Volcano in Sitaro Islands Increases (URL: https://sulsel.idntimes.com/news/indonesia/savi/status-gunung-api-karangetang-di-kepulauan-sitaro-meningkat?page=all).
Ahyi (United States) — July 2023 Cite this Report
Ahyi
United States
20.42°N, 145.03°E; summit elev. -75 m
All times are local (unless otherwise noted)
Intermittent hydroacoustic signals and discolored plumes during November 2022-June 2023
Ahyi seamount is a large, conical submarine volcano that rises to within 75 m of the ocean surface about 18 km SE of the island of Farallon de Pajaros in the Northern Marianas. The remote location of the seamount has made eruptions difficult to document, but seismic stations installed in the region confirmed an eruption in the vicinity in 2001. No new activity was detected until April-May 2014 when an eruption was detected by NOAA (National Oceanic and Atmospheric Administration) divers, hydroacoustic sensors, and seismic stations (BGVN 42:04). New activity was first detected on 15 November by hydroacoustic sensors that were consistent with submarine volcanic activity. This report covers activity during November 2022 through June 2023 based on daily and weekly reports from the US Geological Survey.
Starting in mid-October, hydroacoustic sensors at Wake Island (2.2 km E) recorded signals consistent with submarine volcanic activity, according to a report from the USGS issued on 15 November 2022. A combined analysis of the hydroacoustic signals and seismic stations located at Guam and Chichijima Island, Japan, suggested that the source of this activity was at or near the Ahyi seamount. After a re-analysis of a satellite image of the area that was captured on 6 November, USGS confirmed that there was no evidence of discoloration at the ocean surface. Few hydroacoustic and seismic signals continued through November, including on 18 November, which USGS suggested signified a decline or pause in unrest. A VONA (Volcano Observatory Notice for Aviation) reported that a discolored water plume was persistently visible in satellite data starting on 18 November (figure 6). Though clouds often obscured clear views of the volcano, another discolored water plume was captured in a satellite image on 26 November. The Aviation Color Code (ACC) was raised to Yellow (the second lowest level on a four-color scale) and the Volcano Alert Level (VAL) was raised to Advisory (the second lowest level on a four-level scale) on 29 November.
During December, occasional detections were recorded on the Wake Island hydrophone sensors and discolored water over the seamount remained visible. During 2-7, 10-12, and 16-31 December possible explosion signals were detected. A small area of discolored water was observed in high-resolution Sentinel-2 satellite images during 1-6 December (figure 7). High-resolution satellite images recorded discolored water plumes on 13 December that originated from the summit region; no observations indicated that activity breached the ocean surface. A possible underwater plume was visible in satellite images on 18 December, and during 19-20 December a definite but diffuse underwater plume located SSE from the main vent was reported. An underwater plume was visible in a satellite image taken on 26 December (figure 7).
Hydrophone sensors continued to detect signals consistent with possible explosions during 1-8 January 2023. USGS reported that the number of detections decreased during 4-5 January. The hydrophone sensors experienced a data outage that started at 0118 on 8 January and continued through 10 January, though according to USGS, possible explosions were recorded prior to the data outage and likely continued during the outage. A discolored water plume originating from the summit region was detected in a partly cloudy satellite image on 8 January. On 11-12 and 15-17 January possible explosion signals were recorded again. One small signal was detected during 22-23 January and several signals were recorded on 25 and 31 January. During 27-31 January a plume of discolored water was observed above the seamount in satellite imagery (figure 8).
Low levels of activity continued during February and March, based on data from pressure sensors on Wake Island. During 1 and 4-6 February activity was reported, and a submarine plume was observed on 4 February (figure 8). Possible explosion signals were detected during 7-8, 10, 13-14, and 24 February. During 1-2 and 3-5 March a plume of discolored water was observed in satellite imagery (figure 8). Almost continuous hydroacoustic signals were detected in remote pressure sensor data on Wake Island 2,270 km E from the volcano during 7-13 March. During 12-13 March water discoloration around the seamount was observed in satellite imagery, despite cloudy weather. By 14 March discolored water extended about 35 km, but no direction was noted. USGS reported that the continuous hydroacoustic signals detected during 13-14 March stopped abruptly on 14 March and no new detections were observed. Three 30 second hydroacoustic detections were reported during 17-19 March, but no activity was visible due to cloudy weather. A data outage was reported during 21-22 March, making pressure sensor data unavailable; a discolored water plume was, however, visible in satellite data. A possible underwater explosion signal was detected by pressure sensors at Wake Island on 26, 29, and 31 March, though the cause and origin of these events were unclear.
Similar low activity continued during April, May, and June. Several signals were detected during 1-3 April in pressure sensors at Wake Island. USGS suggested that these may be related to underwater explosions or earthquakes at the volcano, but no underwater plumes were visible in clear satellite images. The pressure sensors had data outages during 12-13 April and no data were recorded; no underwater plumes were visible in satellite images, although cloudy weather obscured most clear views. Eruptive activity was reported starting at 2210 on 21 May. On 22 May a discolored water plume that extended 4 km was visible in satellite images, though no direction was recorded. During 23-24 May some signals were detected by the underwater pressure sensors. Possible hydroacoustic signals were detected during 2-3 and 6-8 June. Multiple hydroacoustic signals were detected during 9-11 and 16-17 June, although no activity was visible in satellite images. One hydroacoustic signal was detected during 23-24 June, but there was some uncertainty about its association with volcanic activity. A single possible hydroacoustic signal was detected during 30 June to 1 July.
Geologic Background. Ahyi seamount is a large conical submarine volcano that rises to within 75 m of the ocean surface ~18 km SE of the island of Farallon de Pajaros in the northern Marianas. Water discoloration has been observed there, and in 1979 the crew of a fishing boat felt shocks over the summit area, followed by upwelling of sulfur-bearing water. On 24-25 April 2001 an explosive eruption was detected seismically by a station on Rangiroa Atoll, Tuamotu Archipelago. The event was well constrained (+/- 15 km) at a location near the southern base of Ahyi. An eruption in April-May 2014 was detected by NOAA divers, hydroacoustic sensors, and seismic stations.
Information Contacts: US Geological Survey, Volcano Hazards Program (USGS-VHP), 12201 Sunrise Valley Drive, Reston, VA, USA, https://volcanoes.usgs.gov/index.html; Copernicus Browser, Copernicus Data Space Ecosystem, European Space Agency (URL: https://dataspace.copernicus.eu/browser/).
Kadovar (Papua New Guinea) — June 2023 Cite this Report
Kadovar
Papua New Guinea
3.608°S, 144.588°E; summit elev. 365 m
All times are local (unless otherwise noted)
An ash plume and weak thermal anomaly during May 2023
Kadovar is a 2-km-wide island that is the emergent summit of a Bismarck Sea stratovolcano. It lies off the coast of New Guinea, about 25 km N of the mouth of the Sepik River. Prior to an eruption that began in 2018, a lava dome formed the high point of the volcano, filling an arcuate landslide scarp open to the S. Submarine debris-avalanche deposits occur to the S of the island. The current eruption began in January 2018 and has comprised lava effusion from vents at the summit and at the E coast; more recent activity has consisted of ash plumes, weak thermal activity, and gas-and-steam plumes (BGVN 48:02). This report covers activity during February through May 2023 using information from the Darwin Volcanic Ash Advisory Center (VAAC) and satellite data.
Activity during the reporting period was relatively low and mainly consisted of white gas-and-steam plumes that were visible in natural color satellite images on clear weather days (figure 67). According to a Darwin VAAC report, at 2040 on 6 May an ash plume rose to 4.6 km altitude and drifted W; by 2300 the plume had dissipated. MODIS satellite instruments using the MODVOLC thermal algorithm detected a single thermal hotspot on the SE side of the island on 7 May. Weak thermal activity was also detected in a satellite image on the E side of the island on 14 May, accompanied by a white gas-and-steam plume that drifted SE (figure 68).
Geologic Background. The 2-km-wide island of Kadovar is the emergent summit of a Bismarck Sea stratovolcano of Holocene age. It is part of the Schouten Islands, and lies off the coast of New Guinea, about 25 km N of the mouth of the Sepik River. Prior to an eruption that began in 2018, a lava dome formed the high point of the andesitic volcano, filling an arcuate landslide scarp open to the south; submarine debris-avalanche deposits occur in that direction. Thick lava flows with columnar jointing forms low cliffs along the coast. The youthful island lacks fringing or offshore reefs. A period of heightened thermal phenomena took place in 1976. An eruption began in January 2018 that included lava effusion from vents at the summit and at the E coast.
Information Contacts: Darwin Volcanic Ash Advisory Centre (VAAC), Bureau of Meteorology, Northern Territory Regional Office, PO Box 40050, Casuarina, NT 0811, Australia (URL: http://www.bom.gov.au/info/vaac/); Hawai'i Institute of Geophysics and Planetology (HIGP) - MODVOLC Thermal Alerts System, School of Ocean and Earth Science and Technology (SOEST), Univ. of Hawai'i, 2525 Correa Road, Honolulu, HI 96822, USA (URL: http://modis.higp.hawaii.edu/); Copernicus Browser, Copernicus Data Space Ecosystem, European Space Agency (URL: https://dataspace.copernicus.eu/browser/).
San Miguel (El Salvador) — June 2023 Cite this Report
San Miguel
El Salvador
13.434°N, 88.269°W; summit elev. 2130 m
All times are local (unless otherwise noted)
Small gas-and-ash explosions during March and May 2023
San Miguel in El Salvador is a broad, deep crater complex that has been frequently modified by eruptions recorded since the early 16th century and consists of the summit known locally as Chaparrastique. Flank eruptions have produced lava flows that extended to the N, NE, and SE during the 17-19th centuries. The most recent activity has consisted of minor ash eruptions from the summit crater. The current eruption period began in November 2022 and has been characterized by frequent phreatic explosions, gas-and-ash emissions, and sulfur dioxide plumes (BGVN 47:12). This report describes small gas-and-ash explosions during December 2022 through May 2023 based on special reports from the Ministero de Medio Ambiente y Recursos Naturales (MARN).
Activity has been relatively low since the last recorded explosions on 29 November 2022. Seismicity recorded by the San Miguel Volcano Station (VSM) located on the N flank at 1.7 km elevation had decreased by 7 December. Sulfur dioxide gas measurements taken with DOAS (Differential Optical Absorption Spectroscopy) mobile equipment were below typical previously recorded values: 300 tons per day (t/d). During December, small explosions were recorded by the seismic network and manifested as gas-and-steam emissions.
Gas-and-ash explosions in the crater occurred during January 2023, which were recorded by the seismic network. Sulfur dioxide values remained low, between 300-400 t/d through 10 March. At 0817 on 14 January a gas-and-ash emission was visible in webcam images, rising just above the crater rim. Some mornings during February, small gas-and-steam plumes were visible in the crater. On 7 March at 2252 MARN noted an increase in degassing from the central crater; gas emissions were constantly observed through the early morning hours on 8 March. During the early morning of 8 March through the afternoon on 9 March, 12 emissions were registered, some accompanied by ash. The last gas-and-ash emission was recorded at 1210 on 9 March; very fine ashfall was reported in El Tránsito (10 km S), La Morita (6 km W), and La Piedrita (3 km W). The smell of sulfur was reported in Piedra Azul (5 km SW). On 16 March MARN reported that gas-and-steam emissions decreased.
Low degassing and very low seismicity were reported during April; no explosions have been detected between 9 March and 27 May. The sulfur dioxide emissions remained between 350-400 t/d; during 13-20 April sulfur dioxide values fluctuated between 30-300 t/d. Activity remained low through most of May; on 23 May seismicity increased. An explosion was detected at 1647 on 27 May generated a gas-and-ash plume that rose 700 m high (figure 32); a decrease in seismicity and gas emissions followed. The DOAS station installed on the W flank recorded sulfur dioxide values that reached 400 t/d on 27 May; subsequent measurements showed a decrease to 268 t/d on 28 May and 100 t/d on 29 May.
Geologic Background. The symmetrical cone of San Miguel, one of the most active volcanoes in El Salvador, rises from near sea level to form one of the country's most prominent landmarks. A broad, deep, crater complex that has been frequently modified by eruptions recorded since the early 16th century caps the truncated unvegetated summit, also known locally as Chaparrastique. Flanks eruptions of the basaltic-andesitic volcano have produced many lava flows, including several during the 17th-19th centuries that extended to the N, NE, and SE. The SE-flank flows are the largest and form broad, sparsely vegetated lava fields crossed by highways and a railroad skirting the base of the volcano. Flank vent locations have migrated higher on the edifice during historical time, and the most recent activity has consisted of minor ash eruptions from the summit crater.
Information Contacts: Ministero de Medio Ambiente y Recursos Naturales (MARN), Km. 5½ Carretera a Nueva San Salvador, Avenida las Mercedes, San Salvador, El Salvador (URL: http://www.snet.gob.sv/ver/vulcanologia).
Ebeko
Russia
50.686°N, 156.014°E; summit elev. 1103 m
All times are local (unless otherwise noted)
Continued explosions, ash plumes, and ashfall during October 2022-May 2023
Ebeko, located on the N end of Paramushir Island in the Kuril Islands, consists of three summit craters along a SSW-NNE line at the northern end of a complex of five volcanic cones. Eruptions date back to the late 18th century and have been characterized as small-to-moderate explosions from the summit crater, accompanied by intense fumarolic activity. The current eruption period began in June 2022 and has recently consisted of frequent explosions, ash plumes, and thermal activity (BGVN 47:10). This report covers similar activity during October 2022 through May 2023, based on information from the Kamchatka Volcanic Eruptions Response Team (KVERT) and satellite data.
Activity during October consisted of explosive activity, ash plumes, and occasional thermal anomalies. Visual data by volcanologists from Severo-Kurilsk showed explosions producing ash clouds up to 2.1-3 km altitude which drifted E, N, NE, and SE during 1-8, 10, 16, and 18 October. KVERT issued several Volcano Observatory Notices for Aviation (VONA) on 7, 13-15, and 27 October 2022, stating that explosions generated ash plumes that rose to 2.3-4 km altitude and drifted 5 km E, NE, and SE. Ashfall was reported in Severo-Kurilsk (Paramushir Island, about 7 km E) on 7 and 13 October. Satellite data showed a thermal anomaly over the volcano on 15-16 October. Visual data showed ash plumes rising to 2.5-3.6 km altitude on 22, 25-29, and 31 October and moving NE due to constant explosions.
Similar activity continued during November, with explosions, ash plumes, and ashfall occurring. KVERT issued VONAs on 1-2, 4, 6-7, 9, 13, and 16 November that reported explosions and resulting ash plumes that rose to 1.7-3.6 km altitude and drifted 3-5 km SE, ESE, E, and NE. On 1 November ash plumes extended as far as 110 km SE. On 5, 8, 12, and 24-25 November explosions and ash plumes rose to 2-3.1 km altitude and drifted N and E. Ashfall was observed in Severo-Kurilsk on 7 and 16 November. A thermal anomaly was visible during 1-4, 16, and 20 November. Explosions during 26 November rose as high as 2.7 km altitude and drifted NE (figure 45).
Explosions and ash plumes continued to occur in December. During 1-2 and 4 December volcanologists from Severo-Kurilsk observed explosions that sent ash to 1.9-2.5 km altitude and drifted NE and SE (figure 46). VONAs were issued on 5, 9, and 16 December reporting that explosions generated ash plumes rising to 1.9 km, 2.6 km, and 2.4 km altitude and drifted 5 km SE, E, and NE, respectively. A thermal anomaly was visible in satellite imagery on 16 December. On 18 and 27-28 December explosions produced ash plumes that rose to 2.5 km altitude and drifted NE and SE. On 31 December an ash plume rose to 2 km altitude and drifted NE.
Explosions continued during January 2023, based on visual observations by volcanologists from Severo-Kurilsk. During 1-7 January explosions generated ash plumes that rose to 4 km altitude and drifted NE, E, W, and SE. According to VONAs issued by KVERT on 2, 4, 10, and 23 January, explosions produced ash plumes that rose to 2-4 km altitude and drifted 5 km N, NE, E, and ENE; the ash plume that rose to 4 km altitude occurred on 10 January (figure 47). Satellite data showed a thermal anomaly during 3-4, 10, 13, 16, 21, 22, and 31 January. KVERT reported that an ash cloud on 4 January moved 12 km NE. On 6 and 9-11 January explosions sent ash plumes to 4.5 km altitude and drifted W and ESE. On 13 January an ash plume rose to 3 km altitude and drifted SE. During 20-24 January ash plumes from explosions rose to 3.7 km altitude and drifted SE, N, and NE. On 21 January the ash plume drifted as far as 40 km NE. During 28-29 and 31 January and 1 February ash plumes rose to 4 km altitude and drifted NE.
During February, explosions, ash plumes, and ashfall were reported. During 1, 4-5 and 7-8 February explosions generated ash plumes that rose to 4.5 km altitude and drifted E and NE; ashfall was observed on 5 and 8 February. On 6 February an explosion produced an ash plume that rose to 3 km altitude and drifted 7 km E, causing ashfall in Severo-Kurilsk. A thermal anomaly was visible in satellite data on 8, 9, 13, and 21 February. Explosions on 9 and 12-13 February produced ash plumes that rose to 4 km altitude and drifted E and NE; the ash cloud on 12 February extended as far as 45 km E. On 22 February explosions sent ash to 3 km altitude that drifted E. During 24 and 26-27 February ash plumes rose to 4 km altitude and drifted E. On 28 February an explosion sent ash to 2.5-3 km altitude and drifted 5 km E; ashfall was observed in Severo-Kurilsk.
Activity continued during March; visual observations showed that explosions generated ash plumes that rose to 3.6 km altitude on 3, 5-7, and 9-12 March and drifted E, NE, and NW. Thermal anomalies were visible on 10, 13, and 29-30 March in satellite imagery. On 18, 21-23, 26, and 29-30 March explosions produced ash plumes that rose to 2.8 km altitude and drifted NE and E; the ash plumes during 22-23 March extended up to 76 km E. A VONA issued on 21 March reported an explosion that produced an ash plume that rose to 2.8 km altitude and drifted 5 km E. Another VONA issued on 23 March reported that satellite data showed an ash plume rising to 3 km altitude and drifted 14 km E.
Explosions during April continued to generate ash plumes. On 1 and 4 April an ash plume rose to 2.8-3.5 km altitude and drifted SE and NE. A thermal anomaly was visible in satellite imagery during 1-6 April. Satellite data showed ash plumes and clouds rising to 2-3 km altitude and drifting up to 12 km SW and E on 3 and 6 April (figure 48). KVERT issued VONAs on 3, 5, 14, 16 April describing explosions that produced ash plumes rising to 3 km, 3.5 km, 3.5 km, and 3 km altitude and drifting 5 km S, 5 km NE and SE, 72 km NNE, and 5 km NE, respectively. According to satellite data, the resulting ash cloud from the explosion on 14 April was 25 x 7 km in size and drifted 72-104 km NNE during 14-15 April. According to visual data by volcanologists from Severo-Kurilsk explosions sent ash up to 3.5 km altitude that drifted NE and E during 15-16, 22, 25-26, and 29 April.
The explosive eruption continued during May. Explosions during 3-4, 6-7, and 9-10 May generated ash plumes that rose to 4 km altitude and drifted SW and E. Satellite data showed a thermal anomaly on 3, 9, 13-14, and 24 May. During 12-16, 23-25, and 27-28 May ash plumes rose to 3.5 km altitude and drifted in different directions due to explosions. Two VONA notices were issued on 16 and 25 May, describing explosions that generated ash plumes rising to 3 km and 3.5 km altitude, respectively and extending 5 km E. The ash cloud on 25 May drifted 75 km SE.
Thermal activity in the summit crater, occasionally accompanied by ash plumes and ash deposits on the SE and E flanks due to frequent explosions, were visible in infrared and true color satellite images (figure 49).
Geologic Background. The flat-topped summit of the central cone of Ebeko volcano, one of the most active in the Kuril Islands, occupies the northern end of Paramushir Island. Three summit craters located along a SSW-NNE line form Ebeko volcano proper, at the northern end of a complex of five volcanic cones. Blocky lava flows extend west from Ebeko and SE from the neighboring Nezametnyi cone. The eastern part of the southern crater contains strong solfataras and a large boiling spring. The central crater is filled by a lake about 20 m deep whose shores are lined with steaming solfataras; the northern crater lies across a narrow, low barrier from the central crater and contains a small, cold crescentic lake. Historical activity, recorded since the late-18th century, has been restricted to small-to-moderate explosive eruptions from the summit craters. Intense fumarolic activity occurs in the summit craters, on the outer flanks of the cone, and in lateral explosion craters.
Information Contacts: Kamchatka Volcanic Eruptions Response Team (KVERT), Far Eastern Branch, Russian Academy of Sciences, 9 Piip Blvd., Petropavlovsk-Kamchatsky, 683006, Russia (URL: http://www.kscnet.ru/ivs/kvert/); MIROVA (Middle InfraRed Observation of Volcanic Activity), a collaborative project between the Universities of Turin and Florence (Italy) supported by the Centre for Volcanic Risk of the Italian Civil Protection Department (URL: http://www.mirovaweb.it/); Copernicus Browser, Copernicus Data Space Ecosystem, European Space Agency (URL: https://dataspace.copernicus.eu/browser/).
Home Reef
Tonga
18.992°S, 174.775°W; summit elev. -10 m
All times are local (unless otherwise noted)
Discolored plumes continued during November 2022-April 2023
Home Reef is a submarine volcano located in the central Tonga islands between Lateiki (Metis Shoal) and Late Island. The first recorded eruption occurred in the mid-19th century, when an ephemeral island formed. An eruption in 1984 produced a 12-km-high eruption plume, a large volume of floating pumice, and an ephemeral island 500 x 1,500 m wide, with cliffs 30-50 m high that enclosed a water-filled crater. Another island-forming eruption in 2006 produced widespread pumice rafts that drifted as far as Australia; by 2008 the island had eroded below sea level. The previous eruption occurred during October 2022 and was characterized by a new island-forming eruption, lava effusion, ash plumes, discolored water, and gas-and-steam plumes (BGVN 47:11). This report covers discolored water plumes during November 2022 through April 2023 using satellite data.
Discolored plumes continued during the reporting period and were observed in true color satellite images on clear weather days. Satellite images show light green-yellow discolored water extending W on 8 and 28 November 2022 (figure 31), and SW on 18 November. Light green-yellow plumes extended W on 3 December, S on 13 December, SW on 18 December, and W and S on 23 December (figure 31). On 12 January 2023 discolored green-yellow plumes extended to the NE, E, SE, and N. The plume moved SE on 17 January and NW on 22 January. Faint discolored water in February was visible moving NE on 1 February. A discolored plume extended NW on 8 and 28 March and NW on 13 March (figure 31). During April, clear weather showed green-blue discolored plumes moving S on 2 April, W on 7 April, and NE and S on 12 April. A strong green-yellow discolored plume extended E and NE on 22 April for several kilometers (figure 31).
Geologic Background. Home Reef, a submarine volcano midway between Metis Shoal and Late Island in the central Tonga islands, was first reported active in the mid-19th century, when an ephemeral island formed. An eruption in 1984 produced a 12-km-high eruption plume, large amounts of floating pumice, and an ephemeral 500 x 1,500 m island, with cliffs 30-50 m high that enclosed a water-filled crater. In 2006 an island-forming eruption produced widespread dacitic pumice rafts that drifted as far as Australia. Another island was built during a September-October 2022 eruption.
Information Contacts: Copernicus Browser, Copernicus Data Space Ecosystem, European Space Agency (URL: https://dataspace.copernicus.eu/browser/).
Semisopochnoi (United States) — June 2023 Cite this Report
Semisopochnoi
United States
51.93°N, 179.58°E; summit elev. 1221 m
All times are local (unless otherwise noted)
Occasional explosions, ash deposits, and gas-and-steam plumes during December 2022-May 2023
Semisopochnoi is located in the western Aleutians, is 20-km-wide at sea level, and contains an 8-km-wide caldera. The three-peaked Mount Young (formerly Cerberus) was constructed within the caldera during the Holocene. Each of these peaks contains a summit crater; the lava flows on the N flank appear younger than those on the S side. The current eruption period began in early February 2021 and has more recently consisted of intermittent explosions and ash emissions (BGVN 47:12). This report updates activity during December 2022 through May 2023 using daily, weekly, and special reports from the Alaska Volcano Observatory (AVO). AVO monitors the volcano using local seismic and infrasound sensors, satellite data, web cameras, and remote infrasound and lightning networks.
Activity during most of December 2022 was relatively quiet; according to AVO no eruptive or explosive activity was observed since 7 November 2022. Intermittent tremor and occasional small earthquakes were observed in geophysical data. Continuous gas-and-steam emissions were observed from the N crater of Mount Young in webcam images on clear weather days (figure 25). On 24 December, there was a slight increase in earthquake activity and several small possible explosion signals were detected in infrasound data. Eruptive activity resumed on 27 December at the N crater of Mount Young; AVO issued a Volcano Activity Notice (VAN) that reported minor ash deposits on the flanks of Mount Young that extended as far as 1 km from the vent, according to webcam images taken during 27-28 December (figure 26). No ash plumes were observed in webcam or satellite imagery, but a persistent gas-and-steam plume that might have contained some ash rose to 1.5 km altitude. As a result, AVO raised the Aviation Color Code (ACC) to Orange (the second highest level on a four-color scale) and the Volcano Alert Level (VAL) to Watch (the second highest level on a four-level scale). Possible explosions were detected during 21 December 2022 through 1 January 2023 and seismic tremor was recorded during 30-31 December.
During January 2023 eruptive activity continued at the active N crater of Mount Young. Minor ash deposits were observed on the flanks, extending about 2 km SSW, based on webcam images from 1 and 3 January. A possible explosion occurred during 1-2 January based on elevated seismicity recorded on local seismometers and an infrasound signal recorded minutes later by an array at Adak. Though no ash plumes were observed in webcam or satellite imagery, a persistent gas-and-steam plume rose to 1.5 km altitude that might have carried minor traces of ash. Ash deposits were accompanied by periods of elevated seismicity and infrasound signals from the local geophysical network, which AVO reported were likely due to weak explosive activity. Low-level explosive activity was also detected during 2-3 January, with minor gas-and-steam emissions and a new ash deposit that was visible in webcam images. Low-level explosive activity was detected in geophysical data during 4-5 January, with elevated seismicity and infrasound signals observed on local stations. Volcanic tremor was detected during 7-9 January and very weak explosive activity was detected in seismic and infrasound data on 9 January. Weak seismic and infrasound signals were recorded on 17 January, which indicated minor explosive activity, but no ash emissions were observed in clear webcam images; a gas-and-steam plume continued to rise to 1.5 km altitude. During 29-30 January, ash deposits near the summit were observed on fresh snow, according to webcam images.
The active N cone at Mount Young continued to produce a gas-and-steam plume during February, but no ash emissions or explosive events were detected. Seismicity remained elevated with faint tremor during early February. Gas-and-steam emissions from the N crater were observed in clear webcam images on 11-13 and 16 February; no explosive activity was detected in seismic, infrasound, or satellite data. Seismicity has also decreased, with no significant seismic tremor observed since 25 January. Therefore, the ACC was lowered to Yellow (the second lowest level on a four-color scale) and the VAL was lowered to Advisory (the second lowest level on a four-color scale) on 22 February.
Gas-and-steam emissions persisted during March from the N cone of Mount Young, based on clear webcam images. A few brief episodes of weak tremor were detected in seismic data, although seismicity decreased over the month. A gas-and-steam plume detected in satellite data extended 150 km on 18 March. Low-level ash emissions from the N cone at Mount Young were observed in several webcam images during 18-19 March, in addition to small explosions and volcanic tremor. The ACC was raised to Orange and the VAL increased to Watch on 19 March. A small explosion was detected in seismic and infrasound data on 21 March.
Low-level unrest continued during April, although cloudy weather often obscured views of the summit; periods of seismic tremor and local earthquakes were recorded. During 3-4 April a gas-and-steam plume was visible traveling more than 200 km overnight; no ash was evident in the plume, according to AVO. A gas-and-steam plume was observed during 4-6 April that extended 400 km but did not seem to contain ash. Small explosions were detected in seismic and infrasound data on 5 April. Occasional clear webcam images showed continuing gas-and-steam emissions rose from Mount Young, but no ash deposits were observed on the snow. On 19 April small explosions and tremor were detected in seismic and infrasound data. A period of seismic tremor was detected during 22-25 April, with possible weak explosions on 25 April. Ash deposits were visible near the crater rim, but it was unclear if these deposits were recent or due to older deposits.
Occasional small earthquakes were recorded during May, but there were no signs of explosive activity seen in geophysical data. Gas-and-steam emissions continued from the N crater of Mount Young, based on webcam images, and seismicity remained slightly elevated. A new, light ash deposit was visible during the morning of 5 May on fresh snow on the NW flank of Mount Young. During 10 May periods of volcanic tremor were observed. The ACC was lowered to Yellow and the VAL to Advisory on 17 May due to no additional evidence of activity.
Geologic Background. Semisopochnoi, the largest subaerial volcano of the western Aleutians, is 20 km wide at sea level and contains an 8-km-wide caldera. It formed as a result of collapse of a low-angle, dominantly basaltic volcano following the eruption of a large volume of dacitic pumice. The high point of the island is Anvil Peak, a double-peaked late-Pleistocene cone that forms much of the island's northern part. The three-peaked Mount Cerberus (renamed Mount Young in 2023) was constructed within the caldera during the Holocene. Each of the peaks contains a summit crater; lava flows on the N flank appear younger than those on the south side. Other post-caldera volcanoes include the symmetrical Sugarloaf Peak SSE of the caldera and Lakeshore Cone, a small cinder cone at the edge of Fenner Lake in the NE part of the caldera. Most documented eruptions have originated from Young, although Coats (1950) considered that both Sugarloaf and Lakeshore Cone could have been recently active.
Information Contacts: Alaska Volcano Observatory (AVO), a cooperative program of a) U.S. Geological Survey, 4200 University Drive, Anchorage, AK 99508-4667 USA (URL: https://avo.alaska.edu/), b) Geophysical Institute, University of Alaska, PO Box 757320, Fairbanks, AK 99775-7320, USA, and c) Alaska Division of Geological & Geophysical Surveys, 794 University Ave., Suite 200, Fairbanks, AK 99709, USA (URL: http://dggs.alaska.gov/).
Ambae
Vanuatu
15.389°S, 167.835°E; summit elev. 1496 m
All times are local (unless otherwise noted)
New lava flow, ash plumes, and sulfur dioxide plumes during February-May 2023
Ambae, also known as Aoba, is a large basaltic shield volcano in Vanuatu. A broad pyroclastic cone containing three crater lakes (Manaro Ngoru, Voui, and Manaro Lakua) is located at the summit within the youngest of at least two nested calderas. Periodic phreatic and pyroclastic explosions have been reported since the 16th century. A large eruption more than 400 years ago resulted in a volcanic cone within the summit crater that is now filled by Lake Voui; the similarly sized Lake Manaro fills the western third of the caldera. The previous eruption ended in August 2022 that was characterized by gas-and-steam and ash emissions and explosions of wet tephra (BGVN 47:10). This report covers a new eruption during February through May 2023 that consisted of a new lava flow, ash plumes, and sulfur dioxide emissions, using information from the Vanuatu Meteorology and Geo-Hazards Department (VMGD) and satellite data.
During the reporting period, the Alert Level remained at a 2 (on a scale of 0-5), which has been in place since December 2021. Activity during October 2022 through March 2023 remained relatively low and mostly consisted of gas-and-steam emissions in Lake Voui. VMGD reported that at 1300 on 15 November a satellite image captured a strong amount of sulfur dioxide rising above the volcano (figure 99), and that seismicity slightly increased. The southern and northern part of the island reported a strong sulfur dioxide smell and heard explosions. On 20 February 2023 a gas-and-ash plume rose 1.3 km above the summit and drifted SSW, according to a webcam image (figure 100). Gas-and-steam and possibly ash emissions continued on 23 February and volcanic earthquakes were recorded by the seismic network.
During April, volcanic earthquakes and gas-and-steam and ash emissions were reported from the cone in Lake Voui. VMGD reported that activity increased during 5-7 April; high gas-and-steam and ash plumes were visible, accompanied by nighttime incandescence. According to a Wellington VAAC report, a low-level ash plume rose as high as 2.5 km above the summit and drifted W and SW on 5 April, based on satellite imagery. Reports in Saratamata stated that a dark ash plume drifted to the WSW, but no loud explosion was heard. Webcam images from 2100 showed incandescence above the crater and reflected in the clouds. According to an aerial survey, field observations, and satellite data, water was no longer present in the lake. A lava flow was reported effusing from the vent and traveling N into the dry Lake Voui, which lasted three days. The next morning at 0745 on 6 April a gas-and-steam and ash plume rose 5.4 km above the summit and drifted ESE, based on information from VMGD (figure 101). The Wellington VAAC also reported that light ashfall was observed on the island. Intermittent gas-and-steam and ash emissions were visible on 7 April, some of which rose to an estimated 3 km above the summit and drifted E. Webcam images during 0107-0730 on 7 April showed continuing ash emissions. A gas-and-steam and ash plume rose 695 m above the summit crater at 0730 on 19 April and drifted ESE, based on a webcam image (figure 102).
According to visual and infrared satellite data, water was visible in Lake Voui as late as 24 March 2023 (figure 103). The vent in the caldera showed a gas-and-steam plume drifted SE. On 3 April thermal activity was first detected, accompanied by a gas-and-ash plume that drifted W (figure 103). The lava flow moved N within the dry lake and was shown cooling by 8 April. By 23 April much of the water in the lake had returned. Occasional sulfur dioxide plumes were detected by the TROPOMI instrument on the Sentinel-5P satellite that exceeded 2 Dobson Units (DU) and drifted in different directions (figure 104).
Geologic Background. The island of Ambae, also known as Aoba, is a massive 2,500 km3 basaltic shield that is the most voluminous volcano of the New Hebrides archipelago. A pronounced NE-SW-trending rift zone with numerous scoria cones gives the 16 x 38 km island an elongated form. A broad pyroclastic cone containing three crater lakes (Manaro Ngoru, Voui, and Manaro Lakua) is located at the summit within the youngest of at least two nested calderas, the largest of which is 6 km in diameter. That large central edifice is also called Manaro Voui or Lombenben volcano. Post-caldera explosive eruptions formed the summit craters about 360 years ago. A tuff cone was constructed within Lake Voui (or Vui) about 60 years later. The latest known flank eruption, about 300 years ago, destroyed the population of the Nduindui area near the western coast.
Information Contacts: Geo-Hazards Division, Vanuatu Meteorology and Geo-Hazards Department (VMGD), Ministry of Climate Change Adaptation, Meteorology, Geo-Hazards, Energy, Environment and Disaster Management, Private Mail Bag 9054, Lini Highway, Port Vila, Vanuatu (URL: http://www.vmgd.gov.vu/, https://www.facebook.com/VanuatuGeohazardsObservatory/); Wellington Volcanic Ash Advisory Centre (VAAC), Meteorological Service of New Zealand Ltd (MetService), PO Box 722, Wellington, New Zealand (URL: http://www.metservice.com/vaac/, http://www.ssd.noaa.gov/VAAC/OTH/NZ/messages.html); MIROVA (Middle InfraRed Observation of Volcanic Activity), a collaborative project between the Universities of Turin and Florence (Italy) supported by the Centre for Volcanic Risk of the Italian Civil Protection Department (URL: http://www.mirovaweb.it/); Global Sulfur Dioxide Monitoring Page, Atmospheric Chemistry and Dynamics Laboratory, NASA Goddard Space Flight Center (NASA/GSFC), 8800 Greenbelt Road, Goddard, Maryland, USA (URL: https://so2.gsfc.nasa.gov/); Copernicus Browser, Copernicus Data Space Ecosystem, European Space Agency (URL: https://dataspace.copernicus.eu/browser/).
Search Bulletin Archive by Publication Date
Select a month and year from the drop-downs and click "Show Issue" to have that issue displayed in this tab.
The default month and year is the latest issue available.
Bulletin of the Global Volcanism Network - Volume 36, Number 10 (October 2011)
Managing Editor: Richard Wunderman
Aira (Japan)
During 2011, pyroclastic flows, frequent ash plumes, and lava emission
Concepcion (Nicaragua)
Early 2010 ash explosions; new instrumentation and mitigation
Hierro (Spain)
Precursors leading to a shallow submarine eruption in 2011
Kizimen (Russia)
New lava and pyroclastic flows during February-September 2011
Tara, Batu (Indonesia)
Advisories and images in 2010-2011; airline routes; 2011 eruption
Aira
Japan
31.5772°N, 130.6589°E; summit elev. 1117 m
All times are local (unless otherwise noted)
During 2011, pyroclastic flows, frequent ash plumes, and lava emission
Our last report covered the explosive eruptions of 2-3 October 2009 from two of Sakura-jima's active vents: Minami-dake and Showa (BGVN 34:08) (figure 33). Minami-dake was last active on 22 February 2009. This report covers Sakura-jima's activity from October 2009 through October 2011; datasets may have various termination dates due to availability.
The ash plumes of October 2009 to October 2011 reported by the Tokyo Volcanic Ash Advisory Center (VAAC) were disclosed in pilot's reports and satellite observations. Plume heights had a maximum altitude range of 1.2 to 4.9 km. VAAC released regular advisories during this time period, often more than once each week.
For the next 11 months following the explosive 2-3 October 2009 events, the Japan Meteorological Agency (JMA) maintained Alert Level 3 status due to intense eruptions from Showa crater (figure 34). The five-tier alert system used by JMA assigns red alert to Level 5; a Level 3 status forbids anyone to approach the volcano. Activity was occasionally Strombolian and Vulcanian during this time period. Lava fountaining on 8 February 2010 reached 1,000 m above the crater; this activity was visible at night and lightning was observed within the ash plume.
On 30 May 2010 an ash plume rose 2.8 km from Showa crater. A small pyroclastic flow was documented on the E flank (figure 35). A camera located at the Ohsumi National Office of Rivers and Highways recorded the vertical plume and pyroclastic flow with both visible and thermal images. The pyroclastic flow traveled ~ 700 m and had temperatures up to 500°C above the background levels.
Explosions were numerous in 2010 and according to JMA, by 20 June a new record had been reached; 550 explosions had already occurred at Sakura-jima. The Japan Times reported that the previous record high in a single year was 548 in 2009. By September 2010, this activity was less vigorous; the plumes from Showa crater were frequently less than 1 km high and no additional activity was reported from Minami-dake. On 30 September, JMA reduced the Alert Level but maintained warnings that no one should approach the summit craters. Earthquakes and tremor had become rare and constant deflation was recorded by tiltmeter and GPS. By June 2010, the long trend of inflation recorded by the water-tube tiltmeter at Arimura station peaked and in early July, abruptly began measuring deflation (figure 36).
From 7 to 20 October 2010, explosive eruptions became more frequent and exceeded background levels from the previous month. A large explosion on 13 October produced ejecta that reached ~ 1.3 km from Showa crater. Earthquake activity was consistently low, but elevated levels of tremor were recorded prompting JMA to raise the Alert Level to 3. During the subsequent months, explosive, ash-rich plumes became more frequent, increasing from 59 in November, and 62 in December, to 102 in January.
Activity was concentrated within the Showa crater until February 2011 when renewed activity began simultaneously at Minami-dake. Last active on 3 October 2009, the summit crater of Minami-dake released two ash-rich plumes on 7 February 2011. Volcanic bombs from Showa crater landed 0.8-1.3 km from the crater. At 1908 on 19 February, a pyroclastic flow extended ~ 500 m down the SE flank. JMA recorded 144 explosions that month, 110 of these events produced ash.
Incandescence and pyroclastic flows from Showa crater. Explosive eruptions continued at a lower rate during the following months; observers however, noted incandescence from Sakura-jima's summit from March through September 2011. An explosive eruption at 2242 on 30 April was recorded from Showa crater and was accompanied by a pyroclastic flow that extended 600 m from the crater on the E flank. Smaller pyroclastic flows 200-400 m in length occurred on 5 June, 12 July, and 1 and 12 September. These events traveled E and SE from the Showa crater and were recorded by thermal cameras and observers.
Aerial surveillance. Aerial observations of Showa crater were made on 31 May 2011 by JMA in cooperation with the Japan Maritime Self Defense Force (JMSDF). Fresh lava was discovered covering part of the crater floor with a diameter of 50-60 m (figure 37). Thermal results determined that the hottest area was in the center of the lava with temperatures up to 500°C above the measured background.
During the 31 May overflight, two ponds of water were identified within the Minami-dake vent. Both craters, A and B, contained water (figure 38) that persisted through 11 July, and by August the volume of water appeared to have increased in crater A. Observations from an aerial survey on 30 August found the ponds differed in color: Crater A appeared light blue, and Crater B was red-brown. There was no apparent change in the amount of degassing from these craters.
Geologic Background. The Aira caldera in the northern half of Kagoshima Bay contains the post-caldera Sakurajima volcano, one of Japan's most active. Eruption of the voluminous Ito pyroclastic flow accompanied formation of the 17 x 23 km caldera about 22,000 years ago. The smaller Wakamiko caldera was formed during the early Holocene in the NE corner of the caldera, along with several post-caldera cones. The construction of Sakurajima began about 13,000 years ago on the southern rim and built an island that was joined to the Osumi Peninsula during the major explosive and effusive eruption of 1914. Activity at the Kitadake summit cone ended about 4,850 years ago, after which eruptions took place at Minamidake. Frequent eruptions since the 8th century have deposited ash on the city of Kagoshima, located across Kagoshima Bay only 8 km from the summit. The largest recorded eruption took place during 1471-76.
Information Contacts: Tokyo Volcanic Ash Advisory Center (VAAC), Tokyo, Japan (URL: http://ds.data.jma.go.jp/svd/vaac/data/); Japan Meteorological Agency (JMA), Otemachi, 1-3-4, Chiyoda-ku Tokyo 100-8122, Japan (URL: http://www.jma.go.jp/); JAXA (URL: http://www.eorc.jaxa.jp/en/earthview/2011/tp110223.html); MapsOf.Net (URL: http://mapsof.net/).
Concepcion (Nicaragua) — October 2011 Cite this Report
Concepcion
Nicaragua
11.538°N, 85.622°W; summit elev. 1700 m
All times are local (unless otherwise noted)
Early 2010 ash explosions; new instrumentation and mitigation
Volcanic activity at Concepción Volcano from 2007 through 2009 was characterized by intermittent, explosive eruptions of ash. Our last report, BGVN 34:11, highlighted the extent of ashfall from these eruptions and the declining frequency of explosions from 9 February through 11 December 2009. New activity reported below begins with a sequence of ash eruptions from January 2010 through early April 2010. Recent mitigation efforts are also discussed that include evacuation drills in January 2010, an international conference held in Managua with site visits to Ometepe Island in November 2010, and a new GPS network (called CONCEPTEPE).
Seismicity for the past five years from Concepción Volcano has been summarized by the Instituto Nicarag?ense de Estudios Territoriales (INETER). Low tremor (around 0.5 Hz) was frequently recorded during this time period and sporadic volcano-tectonic (VT) events occurred every 4-5 months. They also noted that intermittent summit explosions followed the same 4-5 month pattern.
Escalation and summit eruption. Volcanic unrest at Concepción Volcano from January through February 2010 was marked by few direct observations and isolated seismic events. On 27 January a small summit explosion was observed although there was no associated seismic signal; ash was not detected by weather satellites and no VAAC notices were released. Banded tremor was detected by INETER stations (2 installations are on Ometepe Island) on 11 February lasting for about 5 minutes, but there were no signs of degassing or explosions. Banded tremor is a term describing a pattern of regular increase and decrease in tremor appearing on a seismic drum (McNutt 1992), also known as intermittent volcanic tremor (IVT) (Gresta and others, 1996).
A series of explosions from Concepción's summit occurred suddenly on 7 March 2010. Low-level tremor appeared in the afternoon on 8 March and, in total, 14 ash-and-gas explosions were recorded that day (figure 5). Observers on Ometepe reported regular plume heights of ~ 1 km above the crater, and ash fell >10 km across the SW sector of the island reaching the communities Moyogalpa, Los Angeles, Esquipulas, and San José del Sur (ABC Digital). The Washington Volcanic Ash Advisory Center (VAAC) reported a 2.1 km-high plume drifting W.
By 9 March, episodes of banded tremor prevailed for over 5 minutes and the number of small explosions doubled.
On 11 March, tremor increased by 180 RSAM units (Real-time Seismic-Amplitude Measurement) and explosions were often recorded as impulsive with RSAM values of 300 (figure 6). The highest RSAM value occurred at 1440 reaching ~ 1,100. Throughout the day there were small gas-and-ash explosions and banded tremor increased slightly.
At 0759 on 12 March an M 4.6 earthquake occurred along the coast of San Juan del Sur, ~ 100 km W of the volcano. Forty minutes after this regional earthquake, INETER reported one of the strongest ash explosions from Concepción. Residents of La Sabana, Altagracia, and neighboring communities reported ashfall at 1940 that day (noticias.com). The resulting plume was detected by weather satellites and reported in a VAAC advisory. Ash reached an altitude of ~ 3 km and drifted SE. Tremor continued to be recorded during the day by INETER instruments.
In the March 2010 report, INETER highlighted seismic events and noted that, during the first 10 days of activity, no VT events were recorded. The last VT event in this region had occurred on 25 January 2010, an M 2.8 earthquake located near Ometepe Island.
Explosive activity from Concepción's summit had dropped after 17 March, and by 25 March, gas and ash emissions were no longer reported. Two ash explosions were recorded in April and seismic events were rare. INETER reported quiescence at the volcano through the end of the year except for occasional VT events in July and one M 3.4 earthquake on 6 August 2010. Heavy rain caused signal outages on Ometepe Island in September and resulted in data gaps.
Gas measurements. During the height of Concepción's explosive activity in March 2010, teams of scientists from INETER were deployed with mobile Mini-DOAS to measure SO2 flux. One team traversed the Ometepe circular road system and measured emissions on 10, 13, and 14 March at the base of the plumes, finding values of 83 to 1,057 tons/day over this time period. A second team collected data on 9, 13, 14, and 15 March and calculated average daily values as high as 507 tons/day (figure 7).
On 23 March a scientific team from Spain (Instituto Tecnológico de Energía Renovable) joined INETER to they investigate reports of thermal vents previously identified by local residents in the SW part of the island. Near the town of Pull in the Altagracia municipality, diffuse CO2 emissions were measured from small (sub-meter), rocky crevices that also had low thermal outputs (figure 8).
Various reports in March from residents on the S and SE side of Concepción described new openings along the upper flanks; these features are described as fumaroles in the reports. Photos and observations were collected by INETER and included reports from several communities and Civil Defense (figure 9). In places, these cavities are on the order of several of meters wide, some appearing in one location where a fresh-water spring broke to the surface in 2005 following summit eruptions. No additional information was available to explain the cause or characteristics of these features.
Evacuation drills on 27 January 2010. INETER and the Sistema Nacional para la Prevención, Mitigación y Atención de Desastres (SINAPRED) held evacuation drills on 27 January on Ometepe Island. More than 3,000 residents participated from Moyogalpa and Altagracia, the island's municipalities. Representatives from Civil Defense, Red Cross, and local government officials helped with search-and-rescue training. The event was planned with and supported by Nicaragua's national agencies as well as CARE International and the Swiss Agency for Development and Cooperation. Formal discussions regarding hazard maps, risk assessment, and analysis of precursory activity (seismicity in particular) were held between INETER, SINAPRED, and CARE officials. Evacuation routes and representative maps were discussed with local residents. The drills measured the response capabilities and exercised decision-making on the part of the residents and local emergency management officials.
GPS network. INETER's July 2010 report described the status of a long-term, collaborative program with the Universidad de Cádiz, Spain and the Consejo Superior de Investigación Científica de Madrid (CSIC). This program ("Metodologías de vigilancia desarrolladas en España, en el sistema de vigilancia de Nicaragua") focused on implementing new monitoring systems in Nicaragua with a strong focus on Ometepe Island. After assessments and field visits in February 2010, participants designed CONCEPTEPE, an island-wide GPS network. Installation of the network began in June and continued through July 2010 and included nine permanent stations across the island and one onshore at Rivas, a town just SW of the Pan-American Highway roughly 6 km from the shoreline of Lake Nicaragua (figure 10). Additional fieldwork and equipment testing were required before this system would be fully operational. This project expanded the long-term monitoring efforts on Ometepe Island that have included meteorological stations, a seismic network, and web cameras.
International conference and Ometepe site visits. A professional meeting of geoscientists was held in Managua on 23-30 November 2010 to discuss ash, lahar, and landslide modeling techniques: "Primera Taller de la Red Iberoamericana para el Monitoreo y Modelizacion de Cenizas y Aerosoles Volcanicos y Uso de TITAN2D para Modelizacion de Lahares y Deslizamientos" (First workshop of the Iberian-Latino-American network for monitoring and modeling volcanic ash and aerosols and the use of TITAN2D for modeling lahars and landslides). Presentations focused on numerical modeling programs TITAN 2D and FALL 3D, programs that investigate mass-flow behavior and forecasting based on geotechnical parameters. Representatives from Spain, Italy, Mexico, Colombia, and Central American countries discussed new techniques for hazards assessments as well as current mitigation efforts applied at different volcanic settings.
From 26-27 November participants from this international workshop visited Ometepe Island. Field activities included sampling of recent lahars as well as mapping in order to improve maps for lahar and landslide hazard mitigation. Participants of the workshop were also invited to speak at community meetings, addressing citizens of Moyogalpa and Altagracia municipalities. The themes of these meetings centered on local risk assessment and new techniques for volcanic hazard forecasting.
References. Gresta, S., Privitera, E., Leotta, A., Gasperini, P., 1996. Analysis of the intermittent volcanic tremor observed at Mount Etna (Sicily), 1987. Ann. Geofis. 39, 421-428.
McNutt, S.R., 1992. Volcanic tremor. In: Encyclopedia of Earth System Science, vol. 4. Academic Press, pp. 417-425.
Geologic Background. Volcán Concepción is one of Nicaragua's highest and most active volcanoes. The symmetrical basaltic-to-dacitic stratovolcano forms the NW half of the dumbbell-shaped island of Ometepe in Lake Nicaragua and is connected to neighboring Madera volcano by a narrow isthmus. A steep-walled summit crater is 250 m deep and has a higher western rim. N-S-trending fractures on the flanks have produced chains of spatter cones, cinder cones, lava domes, and maars located on the NW, NE, SE, and southern sides extending in some cases down to Lake Nicaragua. Concepción was constructed above a basement of lake sediments, and the modern cone grew above a largely buried caldera, a small remnant of which forms a break in slope about halfway up the N flank. Frequent explosive eruptions during the past half century have increased the height of the summit significantly above that shown on current topographic maps and have kept the upper part of the volcano unvegetated.
Information Contacts: Instituto Nicaraguense de Estudios Territoriales (INETER), Volcanology and Geophysics Departments (URL: http://www.ineter.gob.ni/); Washington Volcanic Ash Advisory Center (VAAC) (URL: http://www.ospo.noaa.gov/Products/atmosphere/vaac/); ABC Digital: Paraguay y El Mundo (URL: http://www.abc.com.py/); Noticias.com: Noticias de Guatemala (URL: http://noticias.com.gt/internacionales/); MapsOf.net (URL: http://mapsof.net/).
Hierro
Spain
27.73°N, 18.03°W; summit elev. 1500 m
All times are local (unless otherwise noted)
Precursors leading to a shallow submarine eruption in 2011
A submarine eruption at Hierro volcano, Canary Islands, Spain, represents the first documented historical activity, although a flank eruption may have occurred in 1793. A satellite photo shows El Hierro island and the sea surface expression of the submarine eruption on 26 October 2011 (figure 1). For clarification, the name "Hierro" refers to the volcano (as listed in the GVP database), while the name "El Hierro" refers to the island constructed by the volcano; this naming convention will be followed in this report. Unless otherwise noted, all data concerning the pre-eruptive and eruptive activity at Hierro was reported by Instituto Geográfico Nacional (IGN).
Pre-eruptive activity. Increased seismicity at El Hierro beginning 16 July 2011 marked the onset of pre-eruptive activity. More than 6,000 seismic events had occurred by the beginning of September; seismic events were less than M 3, and hypocenters were located at ~10 km depth beneath the area of the now-collapsed El Golfo volcano (El Golfo Bay, on the N side of the island; figure 1). The increased seismicity was accompanied by 2 cm of ground inflation and increased CO2 flux over the same time period. Following a significant increase in both seismic energy release rates (figure 2) and ground deformation rates, the Canarian Autonomous Government raised the Alert Level to Yellow on 23 September (on a 3 color scale; Green, Yellow, and Red).
In the first week of October, seismic hypocenters were located offshore SW of El Hierro island. The next week, an M 4.3 earthquake occurred on 8 October, 1.5 km offshore to the SW, at ~ 14 km depth. This was the largest magnitude precursory seismic event. During 8-9 October, following the 8 October earthquake, ground deformation trends changed, suggesting deflation. Coinciding low magnitude earthquakes occurred at 2 km depth to the SW of the island, and tremor commenced at about 0515 on 10 October, with the highest amplitudes measured at the S-most seismic station. IGN said, "data suggested a submarine eruption."
Red alert due to submarine eruption. At 0700 on 11 October, the amplitude of tremor increased; the same day, the Government of the Canary Islands raised the Alert Level to Red for La Restinga village (figure 1), and residents were evacuated. A maritime exclusion zone was extended to ~4 nautical miles from the coast on the S end of the island.
Within the next week, visual evidence of the eruption was observed. On 12 October, a large area of the ocean to the S of La Restinga village was discolored, and a small, intensely discolored area was identified as the emission area. On 15 October, viewers in a helicopter observed steaming lava fragments floating in the emission area (figures 3 and 4). Further emission episodes occurred as large, turbulent rings of gas or foam reached the sea surface. Contemporaneously, tremor amplitude and deformation decreased, but in the N part of the island, significant inflation-deflation episodes ensued. Seismic activity at the N of the island continued, highlighting a NNW-SSE trend extending ~13 km from the center of the island at 20-25 km depth.
Further emission episodes occurred during early November, with turbulent water, foam rings, and volcanic material again reaching the sea surface (figure 5). On 5 and 8 November, especially large bubbles rose to the surface, and they ejected sea water and volcanic material a few meters above the surface; video footage of this phenomenon was captured by Radio Televisión Canaria (RTVC) on 8 November and other dates.
Increasing seismicity included an M 4.4 earthquake on 5 November (the eruptive episode's largest as of 8 November). The "Plan de Protección Civil por Riesgo Volcánico" (PEVOLCA) required the evacuation of 51 residents from the settlement Frontera (figure 1) due to landslide risks, and the evacuation of about 200 residents from La Restinga. On 14 November, authorities allowed residents of La Restinga to return to their homes, but children were to attend school in another town, El Pinar. Two buses remained in La Restinga for re-evacuation use, if necessary.
Lava composition, eruption rate, sea-water acidity and gas flux; fish kills. The lava erupted by Hierro was reported by Gobierna de Canarias (analyzed by PEVOLCA) to be predominantly basalt with lesser amounts of trachyte (an approximate basalt-to-trachyte ratio of 10:1; figure 4). They reported that the pyroclasts formed from magma mixing at the time of the eruption. They inferred that the lavas were physical mixtures.
According to Gobierno de Canarias, researchers for the Instituto Español de Oceanografia (IEO) acquired underwater Digital Terrain Maps (DTM; figure 6) during 24-28 October, and estimated that, in that short time, the volcano erupted nearly 5.5 x 10⁶ m3 of material. IEO also measured a decrease in seawater pH from 7.97 to 5.45 within 5 m of the sea surface in the area of the eruption. Furthermore, Gobierno de Canarias reported that Instituto Tecnológico y de Energías Renovables (ITER) estimated the release of CO2 and H2S into the atmosphere at up to 54 and 36 tons/day, respectively.
RTVC reported the death of fish that could not escape the eruption. IGN stated that "Preliminary reports of analyses... suggest that the cause of fish kills is related to the ongoing volcanic processes."
Editor's note: As this issue went to press, the Instituto Volcanologico de Canarias (INVOLCAN) announced a new video channel (Youtube, 2011).
Reference: Instituto Volcanologico de Canarias (INVOLCAN), 2011, Submarine eruption at El Hierro, Canary Islands (Spain), YouTube Video Channel (URL: http://www.youtube.com/user/INVOLCAN).
Geologic Background. The triangular island of Hierro is the SW-most and least studied of the Canary Islands. The massive shield volcano is truncated by a large NW-facing escarpment formed as a result of gravitational collapse of El Golfo volcano about 130,000 years ago. The steep-sided scarp towers above a low lava platform bordering 12-km-wide El Golfo Bay, and three other large submarine landslide deposits occur to the SW and SE. Three prominent rifts oriented NW, NE, and S form prominent topographic ridges. The subaerial portion of the volcano consists of flat-lying Quaternary basaltic and trachybasaltic lava flows and tuffs capped by numerous young cinder cones and lava flows. Holocene cones and flows are found both on the outer flanks and in the El Golfo depression. Hierro contains the greatest concentration of young vents in the Canary Islands. Uncertainty surrounds the report of an eruption in 1793. A submarine eruption took place about 2 km SSW off the southern point of the island during 2011-12.
Information Contacts: Instituto Geográfico Nacional (IGN), C/ General Ibáñez de Ibero, 3. 28003, Madrid, España (URL: http://www. ign.es/); RapidEye, RapidEye AG, Molkenmarkt 30, 14776 Brandenburg an der Havel, Germany (URL: http://www.rapideye.de/); Mapsof.net (URL: http://mapsof.net/); Radio Televisión Canaria (URL: http://rtvc.es/); Gobierno de Canarias (URL: http://www.gobiernodecanarias.org/); Instituto Español de Oceanografia (IEO) (URL: http://www.ieo.es/).
Kizimen
Russia
55.131°N, 160.32°E; summit elev. 2334 m
All times are local (unless otherwise noted)
New lava and pyroclastic flows during February-September 2011
This report covers behavior at Kizimen (figure 9) during February-September 2011, an interval where the volcano emitted substantial ash plumes (often blowing towards major air traffic routes, in four cases with plumes 300-475 km long). Viscous block lava flows extended over 2 km from the vent. The progression of this eruption can be divided into three stages: increased seismicity, which began 1.5 years before the eruption (BGVN 35:02); gas-and-steam emissions starting on 11 November 2010, and the eruption, which began on 9 December 2010 (BGVN 36:01). The eruption continued through at least September 2011.
During February to September 2011, scientists continued to observe seismicity that consisted of a large number of weak, local surface earthquakes (sometimes accompanied by significant seismic noise) and weak volcanic tremor. The Kamchatka Branch of the Geophysical Service of the Russian Academy of Sciences (KB GS RAS) reported a substantial increase in the number of recorded earthquakes during August-September 2011 (figure 10a). KB GS RAS observers also noted a nearly continuous thermal anomaly (figure 10b) coupled with volcanic activity consisting of both pyroclastic flows and a steady stream of gas-and-ash plumes that drifted 20 to 475 km from the volcano (table 1).
Table 1. Summary of selected significant volcanic ash plumes during February-August 2011. This table records four days with plume lengths of greater than 300 km. One plume, on 2 April, extended 475 km SE. Data from KB GS RAS.
| Date |
Ash plume distance (km) |
Direction blown |
| 01 Feb 2011 |
350 |
NE |
| 02 Feb 2011 |
50 |
NE |
| 03 Feb 2011 |
150 |
ESE |
| 04 Feb 2011 |
260 |
ESE |
| 05 Feb 2011 |
65 |
NE |
| 06 Feb 2011 |
131 |
NNE |
| 07 Feb 2011 |
247 |
E |
| 14 Feb 2011 |
57 |
ESE |
| 01 Mar 2011 |
180 |
NW |
| 02 Mar 2011 |
100 |
NW |
| 04 Mar 2011 |
95 |
NW |
| 05 Mar 2011 |
142 |
NW |
| 11 Mar 2011 |
22 |
NE |
| 12 Mar 2011 |
90 |
NW |
| 17 Mar 2011 |
20 |
SW |
| 21 Mar 2011 |
200 |
NE |
| 22 Mar 2011 |
230 |
NE |
| 23 Mar 2011 |
65 |
NE |
| 27 Mar 2011 |
233 |
SE |
| 28 Mar 2011 |
182 |
SE |
| 29 Mar 2011 |
300 |
NE |
| 31 Mar 2011 |
33 |
E |
| 01 Apr 2011 |
160 |
SE |
| 02 Apr 2011 |
475 |
SE |
| 03 Apr 2011 |
125 |
NW |
| 05 Apr 2011 |
85 |
SE |
| 06 Apr 2011 |
260 |
SE |
| 07 Apr 2011 |
220 |
SE |
| 10 Apr 2011 |
225 |
SE |
| 15 Apr 2011 |
87 |
NW |
| 16 Apr 2011 |
245 |
NW |
| 17 Apr 2011 |
32 |
W |
| 18 Apr 2011 |
145 |
W |
| 02 May 2011 |
78 |
NW |
| 03 May 2011 |
280 |
SW |
| 04 May 2011 |
34 |
SE |
| 14 May 2011 |
23 |
S |
| 11 Jun 2011 |
65 |
SE |
| 12 Jun 2011 |
433 |
SE |
| 19 Aug 2011 |
60 |
SE |
A rose diagram created from the data in table 1 showed that plumes predominantly drifted SE (13 cases, figure 11). The longest plume (475 km on 2 April) also extended to the SE.
Ash dispersal from Kizimen has strong implications for aviation, as the routes of major aircraft lie to the E of the volcano and many of the plumes traveled in directions between NE and SE. Many plumes, most notably the farthest reaching plumes, drifted SE. Eastward components (between SE and NE) make up 25 cases, over half of the 40 total cases shown in table 1.
Several events occurred during April: explosive emissions ejected ash and rock, and effusive lava flows on the upper flanks originated from summit crater vents. On 16 April, lava flows appear to have melted snow, and meltwater drained into Lake Kronotskoe. On 26 July, lava on E slope flowed 1 km from a summit vent.
September 2011 fieldwork. During fieldwork to Kizimen in September 2011, volcanologists observed lava flow and pyroclastic-flow deposits (figure 12). According to Natalia Malik (2011), on 14 September 2011, the volcano erupted constantly, and earthquakes were felt. The lava flow front on the E slope reached 1,300 m elevation, extending ~ 2.3 km from the vent area. The thickness of the flow, based on a visual estimate, was ~ 50 m. The bottom of the flow produced hot avalanches that were incandescent at night.
In the valley of Poperechny Creek on the NE flank of the volcano, observers documented fresh, hot pyroclastic-flow deposits, which locally emitted steam and other gases (figure 12c). Surface water caused erosion of the pyroclastic flow deposit's surface (figure 12c). The thickness of the pyroclastic-flow deposits was estimated to be on the order of 3 m. During emplacement of the pyroclastic flows, trees and vegetation on the valley's lower slopes suffered extensive damage.
Several satellite images also helped to depict Kizimen's recent activity (figure 13). Notice the striking differences between the images from 6 September 2009 and 5 September 2011.
According to NASA Earth Observatory, the new volcanic deposits (appearing brown in figure 13b) have covered much of the vegetation (red) on the slopes of the volcano, especially to the E. Likewise, volcanic material has filled rivers and streams around the volcano. The same photograph shows a modest volcanic plume rising from Kizimen's summit, accompanied by a smaller plume from a fumarole to the NW. These images illustrate the growth of a stratovolcano: lava flows interbedded with layers of volcanic ash, cinders, blocks, and bombs. The lava flow on Kizimen is a viscous block lava (that forms the steep-sided flows seen in figure 12b). As the flow slowly advanced down the E side of the volcano, the surface collapsed, sending boulders, ash, and other material into the valley below.
Reference: Malik, Natalia, 2011, Current activity of Kizimen, September 2011 (in Russian): Institute of Volcanology and Seismology, Russian Academy of Sciences (http://www.kscnet.ru/ivs/volcanoes/inform_messages/2011/Kizimen_092011/Kizimen_092011.html).
Geologic Background. Kizimen is an isolated, conical stratovolcano that is morphologically similar to St. Helens prior to its 1980 eruption. The summit consists of overlapping lava domes, and blocky lava flows descend the flanks of the volcano, which is the westernmost of a volcanic chain north of Kronotsky volcano. The 2334-m-high edifice was formed during four eruptive cycles beginning about 12,000 years ago and lasting 2000-3500 years. The largest eruptions took place about 10,000 and 8300-8400 years ago, and three periods of long-term lava dome growth have occurred. The latest eruptive cycle began about 3000 years ago with a large explosion and was followed by intermittent lava dome growth lasting about 1000 years. An explosive eruption about 1100 years ago produced a lateral blast and created a 1.0 x 0.7 km wide crater breached to the NE, inside which a small lava dome (the fourth at Kizimen) has grown. Prior to 2010, only a single explosive eruption, during 1927-28, had been recorded in historical time.
Information Contacts: Kamchatka Branch of the Geophysical Service of the Russian Academy of Sciences (KB GS RAS), Piip Ave. 9, Petropavlovsk-Kamchatsky, 683006, Russia; Kamchatka Volcanic Eruptions Response Team (KVERT), Institute of Volcanology and Seismology, Russian Academy of Sciences, Far East Division, 9 Piip Blvd., Petropavlovsk-Kamchatsky 683006, Russia (URL: http://www.kscnet.ru/ivs/); Sergey Senukov, Kamchatka Branch of the Geophysical Service, Russian Academy of Sciences (KB GS RAS), (URL: http://www.emsd.ru/); Valery Droznin and Natalia Malik, Institute of Volcanology and Seismology Russian Academy of Sciences, Far Eastern Branch, 9 Piip Blvd., Petropavlovsk-Kamchatsky 683006, Russia; NASA Earth Observatory (URL: http://earthobservatory.nasa.gov/).
Batu Tara (Indonesia) — October 2011 Cite this Report
Batu Tara
Indonesia
7.791°S, 123.585°E; summit elev. 633 m
All times are local (unless otherwise noted)
Advisories and images in 2010-2011; airline routes; 2011 eruption
This report examines the tectonic setting of Batu Tara, Indonesia, and volcanic activity between February 2010 and October 2011. A map details the tectonics of portions of the Indonesian and Australian plates in the region (Elburg, 2005). Batu Tara lies along some critical air routes that link Asia to Australia. Sonnabend (2007) discussed alternate routes to avoid plumes from Batu Tara at a conference on volcanic ash in 2007. Satellite imagery from the NASA Earth Observing System (EOS) in 201 showed the islands volcanic features and complex plume dispersion.
The Darwin Volcano Ash Advisory Centre (VAAC) produced more than 40 ash plume advisories. The majority of the Darwin VAAC advisories stemmed from plume detection by the Japan Meteorological Agency's MTSAT-1 and two satellites. Lastly, during 17-19 August 2011, Thorsten Boeckel and others witnessed Batu Tara in eruption; they collected photos, videos and recorded the event.
Batu Tara (figure 6) lies 55 km from Timor, the nearest large island. Maumere, the largest town in the region (pop. 70,000; United Nations Department of Humanitarian Affairs, 1992), resides on the N coast of Flores Island, Indonesia, 175 km WSW from Batu Tara. Batu Tara sits 947 km NE of Darwin, Australia, 1,860 km W of Jakarta and 2,410 km SW of the Republic of Singapore.
Geologic setting and plate tectonics. Volcanism in Indonesia, as shown in figure 7, is characterized by the northward subduction of the Australian plate beneath the Indonesian plate. According to Elburg (2011), volcanoes in the area to the S of the Weber thrust (consisting of the islands Alor, Atauro, Wetar, and Romang) became extinct 3.5-1.8 million years ago. This tectonic region delineates a complex of thrusting, trough, trench, basin, ridge, crust, plateau and continental plate features forming a constellation of volcanoes. The principal geologic features relevant to Batu Tara are its proximity to the subduction zone and the local distribution of active volcanism. It has erupted potassic leucite-bearing basanitic and tephritic rocks intermittently since 1 July 2006, following a dormancy dating back to 1847-1852. Starting in January 2007, observers issued reports of ash plumes from explosive activity. Darwin VAAC recorded 7 to 10 months of plume descriptions per year during 2008 through October 2011.
Darwin VAAC Advisories. The Darwin VAAC advisories for this reporting period began on 8 March 2010 (table 4). From 8 March 2010 through 30 Oct 2011, 41 advisories were released. The reports specified ash plume altitude and dispersal direction. No reports were filed for February, November and December of 2010. After a pause in late October 2010, advisories began again in March 2011and continued through 30 October, the end of the reporting period. The most frequent and highest plumes occurred during approximately the same times of both years.
Table 4. Representative Darwin VAAC Advisories listing Batu Tara ash plumes during 2010-2011. Many plumes drifted N to SW, corresponding to the trade winds.
| Date |
Plume top altitude (km) |
Drift direction(s) and extent |
| 08-09 Mar 2010 |
1.5-2.4 |
45-120 km W and NW |
| 10-16 Mar 2010 |
2.1-2.4 |
20-150 km N, NW, W, SW, and SSE |
| 17-18, 22-23 Mar 2010 |
2.4 |
30-95 km NW |
| 24-26 Mar 2010 |
2.4 |
10-120 km W, NW, and NE |
| 05 Apr 2010 |
2.1 |
More than 35 km N |
| 06-11 Apr 2010 |
2.1 |
25-75 km NW, NE, E, and SE |
| 25-27 Apr 2010 |
2.1 |
45-85 km W and N |
| 28, 30 Apr 2010 |
2.1-2.4 |
35-95 km SW, W, and NW |
| 20 May 2010 |
2.4 |
65 km W |
| 02-07 Jun 2010 |
2.4 |
20-65 km W, NW, and N |
| 09, 11-15 Jun 2010 |
2.4 |
35-65 km W and NW |
| 19-20 Jun 2010 |
3.0 |
More than 35 km NW |
| 18-20 Jul 2010 |
1.5 |
More than 35 km NW |
| 21 Jul 2010 |
1.5 |
55 km NW |
| 30-31 Jul 2010 |
1.5 |
65 km NW |
| 09-10 Aug 2010 |
1.5 |
NW and SW |
| 13-17 Aug 2010 |
1.5-3 |
35-95 km NW and W |
| 20-23 Aug 2010 |
1.5 |
25-65 km NW and W |
| 26-28 Aug 2010 |
1.5 |
55-75 km W and 27-28 NW |
| 01-03 Sep 2010 |
1.5 |
45-65 km W and NW |
| 08 Sep 2010 |
2.4 |
55 km NW |
| 18-20 Sep 2010 |
1.5 |
35-95 km W and NW |
| 06 Oct 2010 |
1.5 |
55 km W |
| 20 Mar 2011 |
2.1 |
Less than 30 km NE |
| 28 Apr-03 May 2011 |
3 |
10-130 km N, NW, W, and SW |
| 04-07 May 2011 |
0.9-2.1 |
18-75 km NW, W, and SW |
| 15-17 May 2011 |
1.8 |
75-130 km W and NW |
| 18-23 May 2011 |
1.8-2.4 |
75-110 km W, NW, and N |
| 24-27 May 2011 |
2.4 |
40 km W, NW, and N |
| 01-07 Jun 2011 |
1.8 |
40-130 km NW, W, and SW |
| 08-13 Jun 2011 |
2.4 |
55-75 km NW, N, and E |
| 16-20 Jun 2011 |
2.4 |
55-75 km W, NW, and N |
| 22-25 Jun 2011 |
2.4 |
35-75 km W and NW |
| 01-03 Jul 2011 |
2.4 |
75 km NW |
| 09-11 Jul 2011 |
1.5-3.0 |
75 km W and NW |
| 23-30 Aug 2011 |
2.1 |
20-90 km N, NW, and W |
| 08-13 Sep 2011 |
2.1 |
37-65 km NW and W |
| 13-20 Sep 2011 |
2.1 |
25-75 km W,WNW and NW |
| 21-24 Sep 2011 |
2.1 |
37-65 km W, WNW, and NW |
| 27 Oct 2011 |
2.1 |
45 km W |
Batu Tara plume heights ranged from ~ 1 to 3 km altitude, the majority of which were near 2 km in height. Plumes dispersed mostly in westerly directions.
Commercial airline routes. Sonnabend (2007) discussed avoiding ash plumes from Batu Tara on the airline routes between Jakarta and Sidney. He reported "When the pilot smells the sulfur it is too late to escape. Therefore it is essential that, with respect to a safe flight, the information about a volcanic eruption will be passed immediately to the airlines and pilots in flight. Standardized products of describing volcanic ash events in text or graphical form are used by flight crews, dispatchers and also automated systems in order to support the decision making process in view of a safe and economic flight operation."
An example (figure 8) shows the normal route (blue, in the middle) and two alternate ones (black to the E, red to the W).
Table 5 compares time, fuel, and cost resources of the nominal route with the two alternates. The alternate routes cost 3-5 minutes of additional flight time, 1353-1690 kg of fuel, and up to ~ $60 USD per minute. When confronted with the immediacies of ash advisories, this example typifies the decision-making process by a commercial airline confronted with eruptive plumes where changing the flight path adds costs. This is especially true when there are many flights per day or when other routes overlap the same region. The consequences of even minor route deviations could improve safety but add cost and flight time weighed against the possibility of damage from ash.
Table 5. Comparisons of the normal Jakarta-Sidney air route compared to nearby alternate routes that avoid passing over Batu Tara (see figure 8). From Sonnabend, 2007.
| Flight route, color |
Time |
Trip fuel |
Costs, USD |
| Black |
8h 54m |
87402 kg |
$59,427 |
| Red |
8h 56m |
87065 kg |
$58,679 |
| Blue (normal) |
8h 51m |
85712 kg |
$58,391 |
NASA EOS Images. The Moderate Resolution Imaging Spectroradiometer (MODIS) sensor aboard the AQUA satellite acquired an image (figure 9) on 15 March 2010. The plume dispersed S, then immediately split, drifting SE and SW. Other areas to the E and W appear to be residual plumes, but their origin was not mentioned in the EOS report. Notice the bottom of the E plume reversed direction, arcing W. An earlier plume near the crater in the NE sector of the image moved NE along an arc.
Another NASA EOS image (figure 10), acquired on 6 August 2010, showed material extending from the E shore. The N-S diameter of the island is ~ 3 km; the E scarp of the crater extends ~ 700 m to the sea. A large-scale view from a different satellite instrument (MODIS) on the same day showed that the plume extended W from Batu Tara before it disappeared under a bank of weather clouds.
Summer trade winds. Winds aloft play a significant role in three sections of this report: advisories, air routes, and plume-satellite images (e.g. figure 9). The winds at Batu Tara area are often described as trade winds (figure 11). The trades, the most consistent of the Earth's wind systems, with an average altitude of ~ 0.9-1.5 km, are characterized by direction and, to a lesser degree, speed (Glickman, 2000).
The trades (figure 11) vary seasonally and have other complexities. They meet at the Intertropical Convergence Zone (ITCZ), which norminally lies near the equator. However, the ITCZ shifts to the N and S of the equatorial median, typically ranging from ~ 1,500 km S in January to ~ 3,300 km N above the Indonesian Archipelago in July (figure 12; Lutgens and Tarbuck, 2001).
In July, just N of the equator, below the displaced ITCZ, the winds move counter to those below the equator, pushing E instead of W. These two sources, the nominal trade wind and the NW wind located S of the shifted July ITCZ near Batu Tara, disrupt the normal trade wind pattern. This system of multiple winds (more complex than the cartoon shown in figure 11), along with the shifts in winds with altitude, and other factors (such as sea surface conditions) play roles in dispersal of Batu Tara ash plumes.
Eye-witness observations. Thorsten Boeckel and others recorded videos and photos, and noted impressions of Batu Tara's eruptions during 17-19 August 2011. Boeckel's group landed on the island in the morning of 17 August and continuously documented during the day and night. More details of their adventure can be found on the internet (see Information Contacts); several of Boeckel's photos appear in figures 13 and 14.
In Boeckel's words, "The local maps fail to locate Batu Tara. In Larantuka in East-Flores, where the adventurers sighted volcanic plumes on Batu Tara they booked passage on a tuna vessel for the 7 hour trip ignoring gossip from local fishermen that the island is enchanted. After about 5 hours we could recognize the Batu Tara Island. From a distance of 15 km we could see ash clouds over the island.
"During the approach we noticed increasingly that this volcano is a true stone block in the sea. Hence, would we be able to land? That evening, we reached the backside [ E side] of the island and saw the 'Sciara del Fuoco'. And really, this volcano must be the twin volcano of Stromboli. Even the summit, the Pizzo and the fire chute turned away from the mainland resemble Stromboli. The crater is approximately two-thirds the height, surrounded by a powerful steep crater funnel.
"The next morning a landing site was chosen. About 100 m beside the Sciara a narrow landing strip appeared. A skillful native fisherman whom we had onboard ferried our equipment onto the strip. [Ascending] the very steep area would take an immense expenditure of time. After landing, the equipment was set up near the summit recording the ongoing Strombolian eruption.
"The active Strombolian activity was most vigorous. At intervals of 15 minutes we noted many smaller eruptions. Larger outbreaks, 300-400 m high also occurred at 30-45 minute intervals. Those on the boat viewed lava ejecting far over crater edge. Often the forest was bombarded ~ 200 meters below the crater.
"The night began, and in addition to the fascinating lava show [figure 14], the eruption noise was a highlight. Even ~ 700 meters away, the ground tremored during stronger outbreaks.... The fire chute appears impressive, large plastic lava constantly flowed from the crater. At night bouncing rocks from the lava-flow entering the water created loud explosions."
The eruptions continued as the ship traveled E that night. A photograph, taken from the ship after a day spent on the island, shows the slope angle of the scarp (figure 15). The shot was taken too far away to show lava bombs hitting and skipping along the water's surface, however, such behavior was observed.
References. Boeckel T., Rietze, M., Szeglat M., and Weber, C., 2011, Indonesia 2011: Batu Tara, URL: http://www.tboeckel.de/EFSF/efsf_wv/indonesia_11/Batu Tara/Batu Tara 2011_e.hth; Posted 03 August 2011; accessed 23 November 2011.
Elburg, M., 2005, Indonesian Magmatism (URL: http://users.ugent.be/~melburg/Indonesia/IndonesiaElburg.html) Updated 10 August 2005; accessed 23 November 2011.
Glickman, T.S., 2000, Glossary of Meteorology, American Meteorology Society, 2nd ed., 850 p.
Lutgens, F.K. and Tarbuck, E.J., 2001, The Atmosphere, An Introduction to the Atmosphere, Prentice Hall, 8th Ed., 484 pp., Figure 7.9.
Sonnabend, H.R., 2007, Airlines, Aircrafts and Volcanic Ash, World Meterological Association (WMO) Fourth International Workshop on Volcanic Ash, Rotorua, New Zealand, 26-30 March 2007, report number VAWS/4 WP/07-04.
United Nations, Department of Humanitarian Affairs, 1992, Indonesia-Earthquake, DHA-UNDRO Information Report No. 2, 13 December, 1992; DHA-UNDRO 92/0817.
Geologic Background. The small isolated island of Batu Tara in the Flores Sea about 50 km N of Lembata (fomerly Lomblen) Island contains a scarp on the eastern side similar to the Sciara del Fuoco of Italy's Stromboli volcano. Vegetation covers the flanks to within 50 m of the summit. Batu Tara lies north of the main volcanic arc and is noted for its potassic leucite-bearing basanitic and tephritic rocks. The first historical eruption, during 1847-52, produced explosions and a lava flow.
Information Contacts: Darwin Volcanic Ash Advisory Centre (VAAC), Bureau of Meteorology, Northern Territory Regional Office, PO Box 40050, Casuarina, NT 0811, Australia (URL: http://www.bom.gov.au/info/vaac/); NASA Earth Observatory, NASA Goddard Space Flight Center (URL: http://earthobservatory.nasa.gov/); Thorsten Boeckel (URL: http://www.tboeckel.de).