Recently Published Bulletin Reports
Kadovar (Papua New Guinea) An ash plume and weak thermal anomaly during May 2023
San Miguel (El Salvador) Small gas-and-ash explosions during March and May 2023
Ebeko (Russia) Continued explosions, ash plumes, and ashfall during October 2022-May 2023
Home Reef (Tonga) Discolored plumes continued during November 2022-April 2023
Semisopochnoi (United States) Occasional explosions, ash deposits, and gas-and-steam plumes during December 2022-May 2023
Ambae (Vanuatu) New lava flow, ash plumes, and sulfur dioxide plumes during February-May 2023
Ibu (Indonesia) Daily ash explosions continue, along with thermal anomalies in the crater, October 2022-May 2023
Dukono (Indonesia) Continuing ash emissions, SO2 plumes, and thermal signals during October 2022-May 2023
Sabancaya (Peru) Explosions, gas-and-ash plumes, and thermal activity persist during November 2022-April 2023
Sheveluch (Russia) Significant explosions destroyed part of the lava-dome complex during April 2023
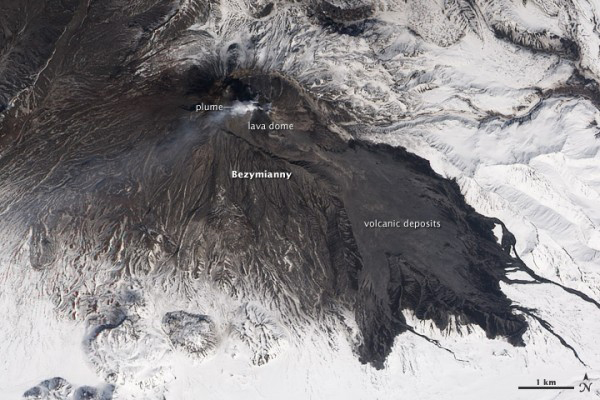
Bezymianny (Russia) Explosions, ash plumes, lava flows, and avalanches during November 2022-April 2023
Chikurachki (Russia) New explosive eruption during late January-early February 2023
Kadovar (Papua New Guinea) — June 2023  Cite this Report
Kadovar
Papua New Guinea
3.608°S, 144.588°E; summit elev. 365 m
All times are local (unless otherwise noted)
An ash plume and weak thermal anomaly during May 2023
Kadovar is a 2-km-wide island that is the emergent summit of a Bismarck Sea stratovolcano. It lies off the coast of New Guinea, about 25 km N of the mouth of the Sepik River. Prior to an eruption that began in 2018, a lava dome formed the high point of the volcano, filling an arcuate landslide scarp open to the S. Submarine debris-avalanche deposits occur to the S of the island. The current eruption began in January 2018 and has comprised lava effusion from vents at the summit and at the E coast; more recent activity has consisted of ash plumes, weak thermal activity, and gas-and-steam plumes (BGVN 48:02). This report covers activity during February through May 2023 using information from the Darwin Volcanic Ash Advisory Center (VAAC) and satellite data.
Activity during the reporting period was relatively low and mainly consisted of white gas-and-steam plumes that were visible in natural color satellite images on clear weather days (figure 67). According to a Darwin VAAC report, at 2040 on 6 May an ash plume rose to 4.6 km altitude and drifted W; by 2300 the plume had dissipated. MODIS satellite instruments using the MODVOLC thermal algorithm detected a single thermal hotspot on the SE side of the island on 7 May. Weak thermal activity was also detected in a satellite image on the E side of the island on 14 May, accompanied by a white gas-and-steam plume that drifted SE (figure 68).
Geologic Background. The 2-km-wide island of Kadovar is the emergent summit of a Bismarck Sea stratovolcano of Holocene age. It is part of the Schouten Islands, and lies off the coast of New Guinea, about 25 km N of the mouth of the Sepik River. Prior to an eruption that began in 2018, a lava dome formed the high point of the andesitic volcano, filling an arcuate landslide scarp open to the south; submarine debris-avalanche deposits occur in that direction. Thick lava flows with columnar jointing forms low cliffs along the coast. The youthful island lacks fringing or offshore reefs. A period of heightened thermal phenomena took place in 1976. An eruption began in January 2018 that included lava effusion from vents at the summit and at the E coast.
Information Contacts: Darwin Volcanic Ash Advisory Centre (VAAC), Bureau of Meteorology, Northern Territory Regional Office, PO Box 40050, Casuarina, NT 0811, Australia (URL: http://www.bom.gov.au/info/vaac/); Hawai'i Institute of Geophysics and Planetology (HIGP) - MODVOLC Thermal Alerts System, School of Ocean and Earth Science and Technology (SOEST), Univ. of Hawai'i, 2525 Correa Road, Honolulu, HI 96822, USA (URL: http://modis.higp.hawaii.edu/); Copernicus Browser, Copernicus Data Space Ecosystem, European Space Agency (URL: https://dataspace.copernicus.eu/browser/).
San Miguel (El Salvador) — June 2023 Cite this Report
San Miguel
El Salvador
13.434°N, 88.269°W; summit elev. 2130 m
All times are local (unless otherwise noted)
Small gas-and-ash explosions during March and May 2023
San Miguel in El Salvador is a broad, deep crater complex that has been frequently modified by eruptions recorded since the early 16th century and consists of the summit known locally as Chaparrastique. Flank eruptions have produced lava flows that extended to the N, NE, and SE during the 17-19th centuries. The most recent activity has consisted of minor ash eruptions from the summit crater. The current eruption period began in November 2022 and has been characterized by frequent phreatic explosions, gas-and-ash emissions, and sulfur dioxide plumes (BGVN 47:12). This report describes small gas-and-ash explosions during December 2022 through May 2023 based on special reports from the Ministero de Medio Ambiente y Recursos Naturales (MARN).
Activity has been relatively low since the last recorded explosions on 29 November 2022. Seismicity recorded by the San Miguel Volcano Station (VSM) located on the N flank at 1.7 km elevation had decreased by 7 December. Sulfur dioxide gas measurements taken with DOAS (Differential Optical Absorption Spectroscopy) mobile equipment were below typical previously recorded values: 300 tons per day (t/d). During December, small explosions were recorded by the seismic network and manifested as gas-and-steam emissions.
Gas-and-ash explosions in the crater occurred during January 2023, which were recorded by the seismic network. Sulfur dioxide values remained low, between 300-400 t/d through 10 March. At 0817 on 14 January a gas-and-ash emission was visible in webcam images, rising just above the crater rim. Some mornings during February, small gas-and-steam plumes were visible in the crater. On 7 March at 2252 MARN noted an increase in degassing from the central crater; gas emissions were constantly observed through the early morning hours on 8 March. During the early morning of 8 March through the afternoon on 9 March, 12 emissions were registered, some accompanied by ash. The last gas-and-ash emission was recorded at 1210 on 9 March; very fine ashfall was reported in El Tránsito (10 km S), La Morita (6 km W), and La Piedrita (3 km W). The smell of sulfur was reported in Piedra Azul (5 km SW). On 16 March MARN reported that gas-and-steam emissions decreased.
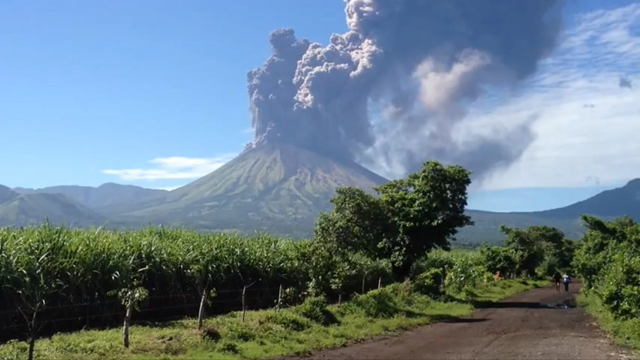
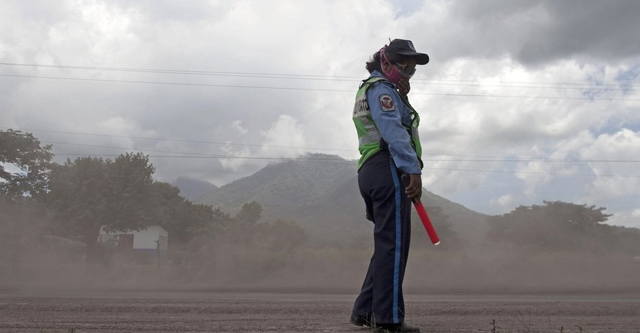
Low degassing and very low seismicity were reported during April; no explosions have been detected between 9 March and 27 May. The sulfur dioxide emissions remained between 350-400 t/d; during 13-20 April sulfur dioxide values fluctuated between 30-300 t/d. Activity remained low through most of May; on 23 May seismicity increased. An explosion was detected at 1647 on 27 May generated a gas-and-ash plume that rose 700 m high (figure 32); a decrease in seismicity and gas emissions followed. The DOAS station installed on the W flank recorded sulfur dioxide values that reached 400 t/d on 27 May; subsequent measurements showed a decrease to 268 t/d on 28 May and 100 t/d on 29 May.
Geologic Background. The symmetrical cone of San Miguel, one of the most active volcanoes in El Salvador, rises from near sea level to form one of the country's most prominent landmarks. A broad, deep, crater complex that has been frequently modified by eruptions recorded since the early 16th century caps the truncated unvegetated summit, also known locally as Chaparrastique. Flanks eruptions of the basaltic-andesitic volcano have produced many lava flows, including several during the 17th-19th centuries that extended to the N, NE, and SE. The SE-flank flows are the largest and form broad, sparsely vegetated lava fields crossed by highways and a railroad skirting the base of the volcano. Flank vent locations have migrated higher on the edifice during historical time, and the most recent activity has consisted of minor ash eruptions from the summit crater.
Information Contacts: Ministero de Medio Ambiente y Recursos Naturales (MARN), Km. 5½ Carretera a Nueva San Salvador, Avenida las Mercedes, San Salvador, El Salvador (URL: http://www.snet.gob.sv/ver/vulcanologia).
Ebeko
Russia
50.686°N, 156.014°E; summit elev. 1103 m
All times are local (unless otherwise noted)
Continued explosions, ash plumes, and ashfall during October 2022-May 2023
Ebeko, located on the N end of Paramushir Island in the Kuril Islands, consists of three summit craters along a SSW-NNE line at the northern end of a complex of five volcanic cones. Eruptions date back to the late 18th century and have been characterized as small-to-moderate explosions from the summit crater, accompanied by intense fumarolic activity. The current eruption period began in June 2022 and has recently consisted of frequent explosions, ash plumes, and thermal activity (BGVN 47:10). This report covers similar activity during October 2022 through May 2023, based on information from the Kamchatka Volcanic Eruptions Response Team (KVERT) and satellite data.
Activity during October consisted of explosive activity, ash plumes, and occasional thermal anomalies. Visual data by volcanologists from Severo-Kurilsk showed explosions producing ash clouds up to 2.1-3 km altitude which drifted E, N, NE, and SE during 1-8, 10, 16, and 18 October. KVERT issued several Volcano Observatory Notices for Aviation (VONA) on 7, 13-15, and 27 October 2022, stating that explosions generated ash plumes that rose to 2.3-4 km altitude and drifted 5 km E, NE, and SE. Ashfall was reported in Severo-Kurilsk (Paramushir Island, about 7 km E) on 7 and 13 October. Satellite data showed a thermal anomaly over the volcano on 15-16 October. Visual data showed ash plumes rising to 2.5-3.6 km altitude on 22, 25-29, and 31 October and moving NE due to constant explosions.
Similar activity continued during November, with explosions, ash plumes, and ashfall occurring. KVERT issued VONAs on 1-2, 4, 6-7, 9, 13, and 16 November that reported explosions and resulting ash plumes that rose to 1.7-3.6 km altitude and drifted 3-5 km SE, ESE, E, and NE. On 1 November ash plumes extended as far as 110 km SE. On 5, 8, 12, and 24-25 November explosions and ash plumes rose to 2-3.1 km altitude and drifted N and E. Ashfall was observed in Severo-Kurilsk on 7 and 16 November. A thermal anomaly was visible during 1-4, 16, and 20 November. Explosions during 26 November rose as high as 2.7 km altitude and drifted NE (figure 45).
Explosions and ash plumes continued to occur in December. During 1-2 and 4 December volcanologists from Severo-Kurilsk observed explosions that sent ash to 1.9-2.5 km altitude and drifted NE and SE (figure 46). VONAs were issued on 5, 9, and 16 December reporting that explosions generated ash plumes rising to 1.9 km, 2.6 km, and 2.4 km altitude and drifted 5 km SE, E, and NE, respectively. A thermal anomaly was visible in satellite imagery on 16 December. On 18 and 27-28 December explosions produced ash plumes that rose to 2.5 km altitude and drifted NE and SE. On 31 December an ash plume rose to 2 km altitude and drifted NE.
Explosions continued during January 2023, based on visual observations by volcanologists from Severo-Kurilsk. During 1-7 January explosions generated ash plumes that rose to 4 km altitude and drifted NE, E, W, and SE. According to VONAs issued by KVERT on 2, 4, 10, and 23 January, explosions produced ash plumes that rose to 2-4 km altitude and drifted 5 km N, NE, E, and ENE; the ash plume that rose to 4 km altitude occurred on 10 January (figure 47). Satellite data showed a thermal anomaly during 3-4, 10, 13, 16, 21, 22, and 31 January. KVERT reported that an ash cloud on 4 January moved 12 km NE. On 6 and 9-11 January explosions sent ash plumes to 4.5 km altitude and drifted W and ESE. On 13 January an ash plume rose to 3 km altitude and drifted SE. During 20-24 January ash plumes from explosions rose to 3.7 km altitude and drifted SE, N, and NE. On 21 January the ash plume drifted as far as 40 km NE. During 28-29 and 31 January and 1 February ash plumes rose to 4 km altitude and drifted NE.
During February, explosions, ash plumes, and ashfall were reported. During 1, 4-5 and 7-8 February explosions generated ash plumes that rose to 4.5 km altitude and drifted E and NE; ashfall was observed on 5 and 8 February. On 6 February an explosion produced an ash plume that rose to 3 km altitude and drifted 7 km E, causing ashfall in Severo-Kurilsk. A thermal anomaly was visible in satellite data on 8, 9, 13, and 21 February. Explosions on 9 and 12-13 February produced ash plumes that rose to 4 km altitude and drifted E and NE; the ash cloud on 12 February extended as far as 45 km E. On 22 February explosions sent ash to 3 km altitude that drifted E. During 24 and 26-27 February ash plumes rose to 4 km altitude and drifted E. On 28 February an explosion sent ash to 2.5-3 km altitude and drifted 5 km E; ashfall was observed in Severo-Kurilsk.
Activity continued during March; visual observations showed that explosions generated ash plumes that rose to 3.6 km altitude on 3, 5-7, and 9-12 March and drifted E, NE, and NW. Thermal anomalies were visible on 10, 13, and 29-30 March in satellite imagery. On 18, 21-23, 26, and 29-30 March explosions produced ash plumes that rose to 2.8 km altitude and drifted NE and E; the ash plumes during 22-23 March extended up to 76 km E. A VONA issued on 21 March reported an explosion that produced an ash plume that rose to 2.8 km altitude and drifted 5 km E. Another VONA issued on 23 March reported that satellite data showed an ash plume rising to 3 km altitude and drifted 14 km E.
Explosions during April continued to generate ash plumes. On 1 and 4 April an ash plume rose to 2.8-3.5 km altitude and drifted SE and NE. A thermal anomaly was visible in satellite imagery during 1-6 April. Satellite data showed ash plumes and clouds rising to 2-3 km altitude and drifting up to 12 km SW and E on 3 and 6 April (figure 48). KVERT issued VONAs on 3, 5, 14, 16 April describing explosions that produced ash plumes rising to 3 km, 3.5 km, 3.5 km, and 3 km altitude and drifting 5 km S, 5 km NE and SE, 72 km NNE, and 5 km NE, respectively. According to satellite data, the resulting ash cloud from the explosion on 14 April was 25 x 7 km in size and drifted 72-104 km NNE during 14-15 April. According to visual data by volcanologists from Severo-Kurilsk explosions sent ash up to 3.5 km altitude that drifted NE and E during 15-16, 22, 25-26, and 29 April.
The explosive eruption continued during May. Explosions during 3-4, 6-7, and 9-10 May generated ash plumes that rose to 4 km altitude and drifted SW and E. Satellite data showed a thermal anomaly on 3, 9, 13-14, and 24 May. During 12-16, 23-25, and 27-28 May ash plumes rose to 3.5 km altitude and drifted in different directions due to explosions. Two VONA notices were issued on 16 and 25 May, describing explosions that generated ash plumes rising to 3 km and 3.5 km altitude, respectively and extending 5 km E. The ash cloud on 25 May drifted 75 km SE.
Thermal activity in the summit crater, occasionally accompanied by ash plumes and ash deposits on the SE and E flanks due to frequent explosions, were visible in infrared and true color satellite images (figure 49).
Geologic Background. The flat-topped summit of the central cone of Ebeko volcano, one of the most active in the Kuril Islands, occupies the northern end of Paramushir Island. Three summit craters located along a SSW-NNE line form Ebeko volcano proper, at the northern end of a complex of five volcanic cones. Blocky lava flows extend west from Ebeko and SE from the neighboring Nezametnyi cone. The eastern part of the southern crater contains strong solfataras and a large boiling spring. The central crater is filled by a lake about 20 m deep whose shores are lined with steaming solfataras; the northern crater lies across a narrow, low barrier from the central crater and contains a small, cold crescentic lake. Historical activity, recorded since the late-18th century, has been restricted to small-to-moderate explosive eruptions from the summit craters. Intense fumarolic activity occurs in the summit craters, on the outer flanks of the cone, and in lateral explosion craters.
Information Contacts: Kamchatka Volcanic Eruptions Response Team (KVERT), Far Eastern Branch, Russian Academy of Sciences, 9 Piip Blvd., Petropavlovsk-Kamchatsky, 683006, Russia (URL: http://www.kscnet.ru/ivs/kvert/); MIROVA (Middle InfraRed Observation of Volcanic Activity), a collaborative project between the Universities of Turin and Florence (Italy) supported by the Centre for Volcanic Risk of the Italian Civil Protection Department (URL: http://www.mirovaweb.it/); Copernicus Browser, Copernicus Data Space Ecosystem, European Space Agency (URL: https://dataspace.copernicus.eu/browser/).
Home Reef
Tonga
18.992°S, 174.775°W; summit elev. -10 m
All times are local (unless otherwise noted)
Discolored plumes continued during November 2022-April 2023
Home Reef is a submarine volcano located in the central Tonga islands between Lateiki (Metis Shoal) and Late Island. The first recorded eruption occurred in the mid-19th century, when an ephemeral island formed. An eruption in 1984 produced a 12-km-high eruption plume, a large volume of floating pumice, and an ephemeral island 500 x 1,500 m wide, with cliffs 30-50 m high that enclosed a water-filled crater. Another island-forming eruption in 2006 produced widespread pumice rafts that drifted as far as Australia; by 2008 the island had eroded below sea level. The previous eruption occurred during October 2022 and was characterized by a new island-forming eruption, lava effusion, ash plumes, discolored water, and gas-and-steam plumes (BGVN 47:11). This report covers discolored water plumes during November 2022 through April 2023 using satellite data.
Discolored plumes continued during the reporting period and were observed in true color satellite images on clear weather days. Satellite images show light green-yellow discolored water extending W on 8 and 28 November 2022 (figure 31), and SW on 18 November. Light green-yellow plumes extended W on 3 December, S on 13 December, SW on 18 December, and W and S on 23 December (figure 31). On 12 January 2023 discolored green-yellow plumes extended to the NE, E, SE, and N. The plume moved SE on 17 January and NW on 22 January. Faint discolored water in February was visible moving NE on 1 February. A discolored plume extended NW on 8 and 28 March and NW on 13 March (figure 31). During April, clear weather showed green-blue discolored plumes moving S on 2 April, W on 7 April, and NE and S on 12 April. A strong green-yellow discolored plume extended E and NE on 22 April for several kilometers (figure 31).
Geologic Background. Home Reef, a submarine volcano midway between Metis Shoal and Late Island in the central Tonga islands, was first reported active in the mid-19th century, when an ephemeral island formed. An eruption in 1984 produced a 12-km-high eruption plume, large amounts of floating pumice, and an ephemeral 500 x 1,500 m island, with cliffs 30-50 m high that enclosed a water-filled crater. In 2006 an island-forming eruption produced widespread dacitic pumice rafts that drifted as far as Australia. Another island was built during a September-October 2022 eruption.
Information Contacts: Copernicus Browser, Copernicus Data Space Ecosystem, European Space Agency (URL: https://dataspace.copernicus.eu/browser/).
Semisopochnoi (United States) — June 2023 Cite this Report
Semisopochnoi
United States
51.93°N, 179.58°E; summit elev. 1221 m
All times are local (unless otherwise noted)
Occasional explosions, ash deposits, and gas-and-steam plumes during December 2022-May 2023
Semisopochnoi is located in the western Aleutians, is 20-km-wide at sea level, and contains an 8-km-wide caldera. The three-peaked Mount Young (formerly Cerberus) was constructed within the caldera during the Holocene. Each of these peaks contains a summit crater; the lava flows on the N flank appear younger than those on the S side. The current eruption period began in early February 2021 and has more recently consisted of intermittent explosions and ash emissions (BGVN 47:12). This report updates activity during December 2022 through May 2023 using daily, weekly, and special reports from the Alaska Volcano Observatory (AVO). AVO monitors the volcano using local seismic and infrasound sensors, satellite data, web cameras, and remote infrasound and lightning networks.
Activity during most of December 2022 was relatively quiet; according to AVO no eruptive or explosive activity was observed since 7 November 2022. Intermittent tremor and occasional small earthquakes were observed in geophysical data. Continuous gas-and-steam emissions were observed from the N crater of Mount Young in webcam images on clear weather days (figure 25). On 24 December, there was a slight increase in earthquake activity and several small possible explosion signals were detected in infrasound data. Eruptive activity resumed on 27 December at the N crater of Mount Young; AVO issued a Volcano Activity Notice (VAN) that reported minor ash deposits on the flanks of Mount Young that extended as far as 1 km from the vent, according to webcam images taken during 27-28 December (figure 26). No ash plumes were observed in webcam or satellite imagery, but a persistent gas-and-steam plume that might have contained some ash rose to 1.5 km altitude. As a result, AVO raised the Aviation Color Code (ACC) to Orange (the second highest level on a four-color scale) and the Volcano Alert Level (VAL) to Watch (the second highest level on a four-level scale). Possible explosions were detected during 21 December 2022 through 1 January 2023 and seismic tremor was recorded during 30-31 December.
During January 2023 eruptive activity continued at the active N crater of Mount Young. Minor ash deposits were observed on the flanks, extending about 2 km SSW, based on webcam images from 1 and 3 January. A possible explosion occurred during 1-2 January based on elevated seismicity recorded on local seismometers and an infrasound signal recorded minutes later by an array at Adak. Though no ash plumes were observed in webcam or satellite imagery, a persistent gas-and-steam plume rose to 1.5 km altitude that might have carried minor traces of ash. Ash deposits were accompanied by periods of elevated seismicity and infrasound signals from the local geophysical network, which AVO reported were likely due to weak explosive activity. Low-level explosive activity was also detected during 2-3 January, with minor gas-and-steam emissions and a new ash deposit that was visible in webcam images. Low-level explosive activity was detected in geophysical data during 4-5 January, with elevated seismicity and infrasound signals observed on local stations. Volcanic tremor was detected during 7-9 January and very weak explosive activity was detected in seismic and infrasound data on 9 January. Weak seismic and infrasound signals were recorded on 17 January, which indicated minor explosive activity, but no ash emissions were observed in clear webcam images; a gas-and-steam plume continued to rise to 1.5 km altitude. During 29-30 January, ash deposits near the summit were observed on fresh snow, according to webcam images.
The active N cone at Mount Young continued to produce a gas-and-steam plume during February, but no ash emissions or explosive events were detected. Seismicity remained elevated with faint tremor during early February. Gas-and-steam emissions from the N crater were observed in clear webcam images on 11-13 and 16 February; no explosive activity was detected in seismic, infrasound, or satellite data. Seismicity has also decreased, with no significant seismic tremor observed since 25 January. Therefore, the ACC was lowered to Yellow (the second lowest level on a four-color scale) and the VAL was lowered to Advisory (the second lowest level on a four-color scale) on 22 February.
Gas-and-steam emissions persisted during March from the N cone of Mount Young, based on clear webcam images. A few brief episodes of weak tremor were detected in seismic data, although seismicity decreased over the month. A gas-and-steam plume detected in satellite data extended 150 km on 18 March. Low-level ash emissions from the N cone at Mount Young were observed in several webcam images during 18-19 March, in addition to small explosions and volcanic tremor. The ACC was raised to Orange and the VAL increased to Watch on 19 March. A small explosion was detected in seismic and infrasound data on 21 March.
Low-level unrest continued during April, although cloudy weather often obscured views of the summit; periods of seismic tremor and local earthquakes were recorded. During 3-4 April a gas-and-steam plume was visible traveling more than 200 km overnight; no ash was evident in the plume, according to AVO. A gas-and-steam plume was observed during 4-6 April that extended 400 km but did not seem to contain ash. Small explosions were detected in seismic and infrasound data on 5 April. Occasional clear webcam images showed continuing gas-and-steam emissions rose from Mount Young, but no ash deposits were observed on the snow. On 19 April small explosions and tremor were detected in seismic and infrasound data. A period of seismic tremor was detected during 22-25 April, with possible weak explosions on 25 April. Ash deposits were visible near the crater rim, but it was unclear if these deposits were recent or due to older deposits.
Occasional small earthquakes were recorded during May, but there were no signs of explosive activity seen in geophysical data. Gas-and-steam emissions continued from the N crater of Mount Young, based on webcam images, and seismicity remained slightly elevated. A new, light ash deposit was visible during the morning of 5 May on fresh snow on the NW flank of Mount Young. During 10 May periods of volcanic tremor were observed. The ACC was lowered to Yellow and the VAL to Advisory on 17 May due to no additional evidence of activity.
Geologic Background. Semisopochnoi, the largest subaerial volcano of the western Aleutians, is 20 km wide at sea level and contains an 8-km-wide caldera. It formed as a result of collapse of a low-angle, dominantly basaltic volcano following the eruption of a large volume of dacitic pumice. The high point of the island is Anvil Peak, a double-peaked late-Pleistocene cone that forms much of the island's northern part. The three-peaked Mount Cerberus (renamed Mount Young in 2023) was constructed within the caldera during the Holocene. Each of the peaks contains a summit crater; lava flows on the N flank appear younger than those on the south side. Other post-caldera volcanoes include the symmetrical Sugarloaf Peak SSE of the caldera and Lakeshore Cone, a small cinder cone at the edge of Fenner Lake in the NE part of the caldera. Most documented eruptions have originated from Young, although Coats (1950) considered that both Sugarloaf and Lakeshore Cone could have been recently active.
Information Contacts: Alaska Volcano Observatory (AVO), a cooperative program of a) U.S. Geological Survey, 4200 University Drive, Anchorage, AK 99508-4667 USA (URL: https://avo.alaska.edu/), b) Geophysical Institute, University of Alaska, PO Box 757320, Fairbanks, AK 99775-7320, USA, and c) Alaska Division of Geological & Geophysical Surveys, 794 University Ave., Suite 200, Fairbanks, AK 99709, USA (URL: http://dggs.alaska.gov/).
Ambae
Vanuatu
15.389°S, 167.835°E; summit elev. 1496 m
All times are local (unless otherwise noted)
New lava flow, ash plumes, and sulfur dioxide plumes during February-May 2023
Ambae, also known as Aoba, is a large basaltic shield volcano in Vanuatu. A broad pyroclastic cone containing three crater lakes (Manaro Ngoru, Voui, and Manaro Lakua) is located at the summit within the youngest of at least two nested calderas. Periodic phreatic and pyroclastic explosions have been reported since the 16th century. A large eruption more than 400 years ago resulted in a volcanic cone within the summit crater that is now filled by Lake Voui; the similarly sized Lake Manaro fills the western third of the caldera. The previous eruption ended in August 2022 that was characterized by gas-and-steam and ash emissions and explosions of wet tephra (BGVN 47:10). This report covers a new eruption during February through May 2023 that consisted of a new lava flow, ash plumes, and sulfur dioxide emissions, using information from the Vanuatu Meteorology and Geo-Hazards Department (VMGD) and satellite data.
During the reporting period, the Alert Level remained at a 2 (on a scale of 0-5), which has been in place since December 2021. Activity during October 2022 through March 2023 remained relatively low and mostly consisted of gas-and-steam emissions in Lake Voui. VMGD reported that at 1300 on 15 November a satellite image captured a strong amount of sulfur dioxide rising above the volcano (figure 99), and that seismicity slightly increased. The southern and northern part of the island reported a strong sulfur dioxide smell and heard explosions. On 20 February 2023 a gas-and-ash plume rose 1.3 km above the summit and drifted SSW, according to a webcam image (figure 100). Gas-and-steam and possibly ash emissions continued on 23 February and volcanic earthquakes were recorded by the seismic network.
During April, volcanic earthquakes and gas-and-steam and ash emissions were reported from the cone in Lake Voui. VMGD reported that activity increased during 5-7 April; high gas-and-steam and ash plumes were visible, accompanied by nighttime incandescence. According to a Wellington VAAC report, a low-level ash plume rose as high as 2.5 km above the summit and drifted W and SW on 5 April, based on satellite imagery. Reports in Saratamata stated that a dark ash plume drifted to the WSW, but no loud explosion was heard. Webcam images from 2100 showed incandescence above the crater and reflected in the clouds. According to an aerial survey, field observations, and satellite data, water was no longer present in the lake. A lava flow was reported effusing from the vent and traveling N into the dry Lake Voui, which lasted three days. The next morning at 0745 on 6 April a gas-and-steam and ash plume rose 5.4 km above the summit and drifted ESE, based on information from VMGD (figure 101). The Wellington VAAC also reported that light ashfall was observed on the island. Intermittent gas-and-steam and ash emissions were visible on 7 April, some of which rose to an estimated 3 km above the summit and drifted E. Webcam images during 0107-0730 on 7 April showed continuing ash emissions. A gas-and-steam and ash plume rose 695 m above the summit crater at 0730 on 19 April and drifted ESE, based on a webcam image (figure 102).
According to visual and infrared satellite data, water was visible in Lake Voui as late as 24 March 2023 (figure 103). The vent in the caldera showed a gas-and-steam plume drifted SE. On 3 April thermal activity was first detected, accompanied by a gas-and-ash plume that drifted W (figure 103). The lava flow moved N within the dry lake and was shown cooling by 8 April. By 23 April much of the water in the lake had returned. Occasional sulfur dioxide plumes were detected by the TROPOMI instrument on the Sentinel-5P satellite that exceeded 2 Dobson Units (DU) and drifted in different directions (figure 104).
Geologic Background. The island of Ambae, also known as Aoba, is a massive 2,500 km3 basaltic shield that is the most voluminous volcano of the New Hebrides archipelago. A pronounced NE-SW-trending rift zone with numerous scoria cones gives the 16 x 38 km island an elongated form. A broad pyroclastic cone containing three crater lakes (Manaro Ngoru, Voui, and Manaro Lakua) is located at the summit within the youngest of at least two nested calderas, the largest of which is 6 km in diameter. That large central edifice is also called Manaro Voui or Lombenben volcano. Post-caldera explosive eruptions formed the summit craters about 360 years ago. A tuff cone was constructed within Lake Voui (or Vui) about 60 years later. The latest known flank eruption, about 300 years ago, destroyed the population of the Nduindui area near the western coast.
Information Contacts: Geo-Hazards Division, Vanuatu Meteorology and Geo-Hazards Department (VMGD), Ministry of Climate Change Adaptation, Meteorology, Geo-Hazards, Energy, Environment and Disaster Management, Private Mail Bag 9054, Lini Highway, Port Vila, Vanuatu (URL: http://www.vmgd.gov.vu/, https://www.facebook.com/VanuatuGeohazardsObservatory/); Wellington Volcanic Ash Advisory Centre (VAAC), Meteorological Service of New Zealand Ltd (MetService), PO Box 722, Wellington, New Zealand (URL: http://www.metservice.com/vaac/, http://www.ssd.noaa.gov/VAAC/OTH/NZ/messages.html); MIROVA (Middle InfraRed Observation of Volcanic Activity), a collaborative project between the Universities of Turin and Florence (Italy) supported by the Centre for Volcanic Risk of the Italian Civil Protection Department (URL: http://www.mirovaweb.it/); Global Sulfur Dioxide Monitoring Page, Atmospheric Chemistry and Dynamics Laboratory, NASA Goddard Space Flight Center (NASA/GSFC), 8800 Greenbelt Road, Goddard, Maryland, USA (URL: https://so2.gsfc.nasa.gov/); Copernicus Browser, Copernicus Data Space Ecosystem, European Space Agency (URL: https://dataspace.copernicus.eu/browser/).
Ibu
Indonesia
1.488°N, 127.63°E; summit elev. 1325 m
All times are local (unless otherwise noted)
Daily ash explosions continue, along with thermal anomalies in the crater, October 2022-May 2023
Persistent eruptive activity since April 2008 at Ibu, a stratovolcano on Indonesian’s Halmahera Island, has consisted of daily explosive ash emissions and plumes, along with observations of thermal anomalies (BGVN 47:04). The current eruption continued during October 2022-May 2023, described below, based on advisories issued by the Pusat Vulkanologi dan Mitigasi Bencana Geologi (PVMBG, also known as Indonesian Center for Volcanology and Geological Hazard Mitigation, CVGHM), daily reports by MAGMA Indonesia (a PVMBG platform), and the Darwin Volcanic Ash Advisory Centre (VAAC), and various satellite data. The Alert Level during the reporting period remained at 2 (on a scale of 1-4), except raised briefly to 3 on 27 May, and the public was warned to stay at least 2 km away from the active crater and 3.5 km away on the N side of the volcano.
According to MAGMA Indonesia, during October 2022-May 2023, daily gray-and-white ash plumes of variable densities rose 200-1,000 m above the summit and drifted in multiple directions. On 30 October and 11 November, plumes rose a maximum of 2 km and 1.5 km above the summit, respectively (figures 42 and 43). According to the Darwin VAAC, discrete ash emissions on 13 November rose to 2.1 km altitude, or 800 m above the summit, and drifted W, and multiple ash emissions on 15 November rose 1.4 km above the summit and drifted NE. Occasional larger ash explosions through May 2023 prompted PVMBG to issue Volcano Observatory Notice for Aviation (VONA) alerts (table 6); the Aviation Color Code remained at Orange throughout this period.
Table 6. Volcano Observatory Notice for Aviation (VONA) ash plume alerts for Ibu issued by PVMBG during October 2022-May 2023. Maximum height above the summit was estimated by a ground observer. VONAs in January-May 2023 all described the ash plumes as dense.
| Date |
Time (local) |
Max height above summit |
Direction |
| 17 Oct 2022 |
0858 |
800 m |
SW |
| 18 Oct 2022 |
1425 |
800 m |
S |
| 19 Oct 2022 |
2017 |
600 m |
SW |
| 21 Oct 2022 |
0916 |
800 m |
NW |
| 16 Jan 2023 |
1959 |
600 m |
NE |
| 22 Jan 2023 |
0942 |
1,000 m |
E |
| 29 Jan 2023 |
2138 |
1,000 m |
E |
| 10 May 2023 |
0940 |
800 m |
NW |
| 10 May 2023 |
2035 |
600 m |
E |
| 21 May 2023 |
2021 |
600 m |
W |
| 21 May 2023 |
2140 |
1,000 m |
W |
| 29 May 2023 |
1342 |
800 m |
N |
| 31 May 2023 |
1011 |
1,000 m |
SW |
Sentinel-2 L1C satellite images throughout the reporting period show two, sometimes three persistent thermal anomalies in the summit crater, with the most prominent hotspot from the top of a cone within the crater. Clear views were more common during March-April 2023, when a vent and lava flows on the NE flank of the intra-crater cone could be distinguished (figure 44). White-to-grayish emissions were also observed during brief periods when weather clouds allowed clear views.
The MIROVA space-based volcano hotspot detection system recorded almost daily thermal anomalies throughout the reporting period, though cloud cover often interfered with detections. Data from imaging spectroradiometers aboard NASA’s Aqua and Terra satellites and processed using the MODVOLC algorithm (MODIS-MODVOLC) recorded hotspots on one day during October 2022 and December 2022, two days in April 2023, three days in November 2022 and May 2023, and four days in March 2023.
Geologic Background. The truncated summit of Gunung Ibu stratovolcano along the NW coast of Halmahera Island has large nested summit craters. The inner crater, 1 km wide and 400 m deep, has contained several small crater lakes. The 1.2-km-wide outer crater is breached on the N, creating a steep-walled valley. A large cone grew ENE of the summit, and a smaller one to the WSW has fed a lava flow down the W flank. A group of maars is located below the N and W flanks. The first observed and recorded eruption was a small explosion from the summit crater in 1911. Eruptive activity began again in December 1998, producing a lava dome that eventually covered much of the floor of the inner summit crater along with ongoing explosive ash emissions.
Information Contacts: Pusat Vulkanologi dan Mitigasi Bencana Geologi (PVMBG, also known as Indonesian Center for Volcanology and Geological Hazard Mitigation, CVGHM), Jalan Diponegoro 57, Bandung 40122, Indonesia (URL: http://www.vsi.esdm.go.id/); MAGMA Indonesia (Multiplatform Application for Geohazard Mitigation and Assessment in Indonesia), Kementerian Energi dan Sumber Daya Mineral (URL: https://magma.esdm.go.id/v1); Copernicus Browser, Copernicus Data Space Ecosystem, European Space Agency (URL: https://dataspace.copernicus.eu/browser/); MIROVA (Middle InfraRed Observation of Volcanic Activity), a collaborative project between the Universities of Turin and Florence (Italy) supported by the Centre for Volcanic Risk of the Italian Civil Protection Department (URL: http://www.mirovaweb.it/); Hawai'i Institute of Geophysics and Planetology (HIGP) - MODVOLC Thermal Alerts System, School of Ocean and Earth Science and Technology (SOEST), Univ. of Hawai'i, 2525 Correa Road, Honolulu, HI 96822, USA (URL: http://modis.higp.hawaii.edu/).
Dukono
Indonesia
1.6992°N, 127.8783°E; summit elev. 1273 m
All times are local (unless otherwise noted)
Continuing ash emissions, SO2 plumes, and thermal signals during October 2022-May 2023
Dukono, a remote volcano on Indonesia’s Halmahera Island, has been erupting continuously since 1933, with frequent ash explosions and sulfur dioxide plumes (BGVN 46:11, 47:10). This activity continued during October 2022 through May 2023, based on reports from the Pusat Vulkanologi dan Mitigasi Bencana Geologi (PVMBG; also known as Indonesian Center for Volcanology and Geological Hazard Mitigation, CVGHM), the Darwin Volcanic Ash Advisory Centre (VAAC), and satellite data. During this period, the Alert Level remained at 2 (on a scale of 1-4) and the public was warned to remain outside of the 2-km exclusion zone. The highest reported plume of the period reached 9.4 km above the summit on 14 November 2022.
According to MAGMA Indonesia (a platform developed by PVMBG), white, gray, or dark plumes of variable densities were observed almost every day during the reporting period, except when fog obscured the volcano (figure 33). Plumes generally rose 25-450 m above the summit, but rose as high as 700-800 m on several days, somewhat lower than the maximum heights reached earlier in 2022 when plumes reached as high as 1 km. However, the Darwin VAAC reported that on 14 November 2022, a discrete ash plume rose 9.4 km above the summit (10.7 km altitude), accompanied by a strong hotspot and a sulfur dioxide signal observed in satellite imagery; a continuous ash plume that day and through the 15th rose to 2.1-2.4 km altitude and drifted NE.
Sentinel-2 images were obscured by weather clouds almost every viewing day during the reporting period. However, the few reasonably clear images showed a hotspot and white or gray emissions and plumes. Strong SO2 plumes from Dukono were present on many days during October 2022-May 2023, as detected using the TROPOMI instrument on the Sentinel-5P satellite (figure 34).
Geologic Background. Reports from this remote volcano in northernmost Halmahera are rare, but Dukono has been one of Indonesia's most active volcanoes. More-or-less continuous explosive eruptions, sometimes accompanied by lava flows, have occurred since 1933. During a major eruption in 1550 CE, a lava flow filled in the strait between Halmahera and the N-flank Gunung Mamuya cone. This complex volcano presents a broad, low profile with multiple summit peaks and overlapping craters. Malupang Wariang, 1 km SW of the summit crater complex, contains a 700 x 570 m crater that has also been active during historical time.
Information Contacts: Pusat Vulkanologi dan Mitigasi Bencana Geologi (PVMBG, also known as Indonesian Center for Volcanology and Geological Hazard Mitigation, CVGHM), Jalan Diponegoro 57, Bandung 40122, Indonesia (URL: http://www.vsi.esdm.go.id/); MAGMA Indonesia (Multiplatform Application for Geohazard Mitigation and Assessment in Indonesia), Kementerian Energi dan Sumber Daya Mineral (URL: https://magma.esdm.go.id/v1); Darwin Volcanic Ash Advisory Centre (VAAC), Bureau of Meteorology, Northern Territory Regional Office, PO Box 40050, Casuarina, NT 0811, Australia (URL: http://www.bom.gov.au/info/vaac/); NASA Global Sulfur Dioxide Monitoring Page, Atmospheric Chemistry and Dynamics Laboratory, NASA Goddard Space Flight Center (NASA/GSFC), 8800 Greenbelt Road, Goddard, Maryland, USA (URL: https://so2.gsfc.nasa.gov/); Sentinel Hub Playground (URL: https://www.sentinel-hub.com/explore/sentinel-playground).
Sabancaya
Peru
15.787°S, 71.857°W; summit elev. 5960 m
All times are local (unless otherwise noted)
Explosions, gas-and-ash plumes, and thermal activity persist during November 2022-April 2023
Sabancaya is located in Peru, NE of Ampato and SE of Hualca Hualca. Eruptions date back to 1750 and have been characterized by explosions, phreatic activity, ash plumes, and ashfall. The current eruption period began in November 2016 and has more recently consisted of daily explosions, gas-and-ash plumes, and thermal activity (BGVN 47:11). This report updates activity during November 2022 through April 2023 using information from Instituto Geophysico del Peru (IGP) that use weekly activity reports and various satellite data.
Intermittent low-to-moderate power thermal anomalies were reported by the MIROVA project during November 2022 through April 2023 (figure 119). There were few short gaps in thermal activity during mid-December 2022, late December-to-early January 2023, late January to mid-February, and late February. According to data recorded by the MODVOLC thermal algorithm, there were a total of eight thermal hotspots: three in November 2022, three in February 2023, one in March, and one in April. On clear weather days, some of this thermal anomaly was visible in infrared satellite imagery showing the active lava dome in the summit crater (figure 120). Almost daily moderate-to-strong sulfur dioxide plumes were recorded during the reporting period by the TROPOMI instrument on the Sentinel-5P satellite (figure 121). Many of these plumes exceeded 2 Dobson Units (DU) and drifted in multiple directions.
IGP reported that moderate activity during November and December 2022 continued; during November, an average number of explosions were reported each week: 30, 33, 36, and 35, and during December, it was 32, 40, 47, 52, and 67. Gas-and-ash plumes in November rose 3-3.5 km above the summit and drifted E, NE, SE, S, N, W, and SW. During December the gas-and-ash plumes rose 2-4 km above the summit and drifted in different directions. There were 1,259 volcanic earthquakes recorded during November and 1,693 during December. Seismicity also included volcano-tectonic-type events that indicate rock fracturing events. Slight inflation was observed in the N part of the volcano near Hualca Hualca (4 km N). Thermal activity was frequently reported in the crater at the active lava dome (figure 120).
Explosive activity continued during January and February 2023. The average number of explosions were reported each week during January (51, 50, 60, and 59) and February (43, 54, 51, and 50). Gas-and-ash plumes rose 1.6-2.9 km above the summit and drifted NW, SW, and W during January and rose 1.4-2.8 above the summit and drifted W, SW, E, SE, N, S, NW, and NE during February. IGP also detected 1,881 volcanic earthquakes during January and 1,661 during February. VT-type earthquakes were also reported. Minor inflation persisted near Hualca Hualca. Satellite imagery showed continuous thermal activity in the crater at the lava dome (figure 120).
During March, the average number of explosions each week was 46, 48, 31, 35, and 22 and during April, it was 29, 41, 31, and 27. Accompanying gas-and-ash plumes rose 1.7-2.6 km above the summit crater and drifted W, SW, NW, S, and SE during March. According to a Buenos Aires Volcano Ash Advisory Center (VAAC) notice, on 22 March at 1800 through 23 March an ash plume rose to 7 km altitude and drifted NW. By 0430 an ash plume rose to 7.6 km altitude and drifted W. On 24 and 26 March continuous ash emissions rose to 7.3 km altitude and drifted SW and on 28 March ash emissions rose to 7.6 km altitude. During April, gas-and-ash plumes rose 1.6-2.5 km above the summit and drifted W, SW, S, NW, NE, and E. Frequent volcanic earthquakes were recorded, with 1,828 in March and 1,077 in April, in addition to VT-type events. Thermal activity continued to be reported in the summit crater at the lava dome (figure 120).
Geologic Background. Sabancaya, located in the saddle NE of Ampato and SE of Hualca Hualca volcanoes, is the youngest of these volcanic centers and the only one to have erupted in historical time. The oldest of the three, Nevado Hualca Hualca, is of probable late-Pliocene to early Pleistocene age. The name Sabancaya (meaning "tongue of fire" in the Quechua language) first appeared in records in 1595 CE, suggesting activity prior to that date. Holocene activity has consisted of Plinian eruptions followed by emission of voluminous andesitic and dacitic lava flows, which form an extensive apron around the volcano on all sides but the south. Records of historical eruptions date back to 1750.
Information Contacts: Instituto Geofisico del Peru (IGP), Centro Vulcanológico Nacional (CENVUL), Calle Badajoz N° 169 Urb. Mayorazgo IV Etapa, Ate, Lima 15012, Perú (URL: https://www.igp.gob.pe/servicios/centro-vulcanologico-nacional/inicio); Buenos Aires Volcanic Ash Advisory Center (VAAC), Servicio Meteorológico Nacional-Fuerza Aérea Argentina, 25 de mayo 658, Buenos Aires, Argentina (URL: http://www.smn.gov.ar/vaac/buenosaires/inicio.php); MIROVA (Middle InfraRed Observation of Volcanic Activity), a collaborative project between the Universities of Turin and Florence (Italy) supported by the Centre for Volcanic Risk of the Italian Civil Protection Department (URL: http://www.mirovaweb.it/); Hawai'i Institute of Geophysics and Planetology (HIGP) - MODVOLC Thermal Alerts System, School of Ocean and Earth Science and Technology (SOEST), Univ. of Hawai'i, 2525 Correa Road, Honolulu, HI 96822, USA (URL: http://modis.higp.hawaii.edu/); NASA Global Sulfur Dioxide Monitoring Page, Atmospheric Chemistry and Dynamics Laboratory, NASA Goddard Space Flight Center (NASA/GSFC), 8800 Greenbelt Road, Goddard MD 20771, USA (URL: https://so2.gsfc.nasa.gov/); Copernicus Browser, Copernicus Data Space Ecosystem, European Space Agency (URL: https://dataspace.copernicus.eu/browser/).
Sheveluch
Russia
56.653°N, 161.36°E; summit elev. 3283 m
All times are local (unless otherwise noted)
Significant explosions destroyed part of the lava-dome complex during April 2023
Sheveluch (also spelled Shiveluch) in Kamchatka, has had at least 60 large eruptions during the last 10,000 years. The summit is truncated by a broad 9-km-wide caldera that is breached to the S, and many lava domes occur on the outer flanks. The lava dome complex was constructed within the large open caldera. Frequent collapses of the dome complex have produced debris avalanches; the resulting deposits cover much of the caldera floor. A major south-flank collapse during a 1964 Plinian explosion produced a scarp in which a “Young Sheveluch” dome began to form in 1980. Repeated episodes of dome formation and destruction since then have produced major and minor ash plumes, pyroclastic flows, block-and-ash flows, and “whaleback domes” of spine-like extrusions in 1993 and 2020 (BGVN 45:11). The current eruption period began in August 1999 and has more recently consisted of lava dome growth, explosions, ash plumes, and avalanches (BGVN 48:01). This report covers a significant explosive eruption during early-to-mid-April 2023 that generated a 20 km altitude ash plume, produced a strong sulfur dioxide plume, and destroyed part of the lava-dome complex; activity described during January through April 2023 use information primarily from the Kamchatka Volcanic Eruptions Response Team (KVERT) and various satellite data.
Satellite data. Activity during the majority of this reporting period was characterized by continued lava dome growth, strong fumarole activity, explosions, and hot avalanches. According to the MODVOLC Thermal Alerts System, 140 hotspots were detected through the reporting period, with 33 recorded in January 2023, 29 in February, 44 in March, and 34 in April. Frequent strong thermal activity was recorded during January 2023 through April, according to the MIROVA (Middle InfraRed Observation of Volcanic Activity) graph and resulted from the continuously growing lava dome (figure 94). A slightly stronger pulse in thermal activity was detected in early-to-mid-April, which represented the significant eruption that destroyed part of the lava-dome complex. Thermal anomalies were also visible in infrared satellite imagery at the summit crater (figure 95).
During January 2023 KVERT reported continued growth of the lava dome, accompanied by strong fumarolic activity, incandescence from the lava dome, explosions, ash plumes, and avalanches. Satellite data showed a daily thermal anomaly over the volcano. Video data showed ash plumes associated with collapses at the dome that generated avalanches that in turn produced ash plumes rising to 3.5 km altitude and drifting 40 km W on 4 January and rising to 7-7.5 km altitude and drifting 15 km SW on 5 January. A gas-and-steam plume containing some ash that was associated with avalanches rose to 5-6 km altitude and extended 52-92 km W on 7 January. Explosions that same day produced ash plumes that rose to 7-7.5 km altitude and drifted 10 km W. According to a Volcano Observatory Notice for Aviation (VONA) issued at 1344 on 19 January, explosions produced an ash cloud that was 15 x 25 km in size and rose to 9.6-10 km altitude, drifting 21-25 km W; as a result, the Aviation Color Code (ACC) was raised to Red (the highest level on a four-color scale). Another VONA issued at 1635 reported that no more ash plumes were observed, and the ACC was lowered to Orange (the second highest level on a four-color scale). On 22 January an ash plume from collapses and avalanches rose to 5 km altitude and drifted 25 km NE and SW; ash plumes associated with collapses extended 70 km NE on 27 and 31 January.
Lava dome growth, fumarolic activity, dome incandescence, and occasional explosions and avalanches continued during February and March. A daily thermal anomaly was visible in satellite data. Explosions on 1 February generated ash plumes that rose to 6.3-6.5 km altitude and extended 15 km NE. Video data showed an ash cloud from avalanches rising to 5.5 km altitude and drifting 5 km SE on 2 February. Satellite data showed gas-and-steam plumes containing some ash rose to 5-5.5 km altitude and drifted 68-110 km ENE and NE on 6 February, to 4.5-5 km altitude and drifted 35 km WNW on 22 February, and to 3.7-4 km altitude and drifted 47 km NE on 28 February. Scientists from the Kamchatka Volcanological Station (KVS) went on a field excursion on 25 February to document the growing lava dome, and although it was cloudy most of the day, nighttime incandescence was visible. Satellite data showed an ash plume extending up to 118 km E during 4-5 March. Video data from 1150 showed an ash cloud from avalanches rose to 3.7-5.5 km altitude and drifted 5-10 km ENE and E on 5 March. On 11 March an ash plume drifted 62 km E. On 27 March ash plumes rose to 3.5 km altitude and drifted 100 km E. Avalanches and constant incandescence at the lava dome was focused on the E and NE slopes on 28 March. A gas-and-steam plume containing some ash rose to 3.5 km altitude and moved 40 km E on 29 March. Ash plumes on 30 March rose to 3.5-3.7 km altitude and drifted 70 km NE.
Similar activity continued during April, with lava dome growth, strong fumarolic activity, incandescence in the dome, occasional explosions, and avalanches. A thermal anomaly persisted throughout the month. During 1-4 April weak ash plumes rose to 2.5-3 km altitude and extended 13-65 km SE and E.
Activity during 11 April 2023. The Institute of Volcanology and Seismology, Far Eastern Branch, Russian Academy of Sciences (IVS FEB RAS) reported a significant increase in seismicity around 0054 on 11 April, as reported by strong explosions detected on 11 April beginning at 0110 that sent ash plumes up to 7-10 km altitude and extended 100-435 km W, WNW, NNW, WSW, and SW. According to a Tokyo VAAC report the ash plume rose to 15.8 km altitude. By 0158 the plume extended over a 75 x 100 km area. According to an IVS FEB RAS report, the eruptive column was not vertical: the initial plume at 0120 on 11 April deviated to the NNE, at 0000 on 12 April, it drifted NW, and by 1900 it drifted SW. KVS reported that significant pulses of activity occurred at around 0200, 0320, and then a stronger phase around 0600. Levin Dmitry took a video from near Békés (3 km away) at around 0600 showing a rising plume; he also reported that a pyroclastic flow traveled across the road behind him as he left the area. According to IVS FEB RAS, the pyroclastic flow traveled several kilometers SSE, stopping a few hundred meters from a bridge on the road between Klyuchi and Petropavlovsk-Kamchatsky.
Ashfall was first observed in Klyuchi (45 km SW) at 0630, and a large, black ash plume blocked light by 0700. At 0729 KVERT issued a Volcano Observatory Notice for Aviation (VONA) raising the Aviation Color Code to Red (the highest level on a four-color scale). It also stated that a large ash plume had risen to 10 km altitude and drifted 100 km W. Near-constant lightning strikes were reported in the plume and sounds like thunderclaps were heard until about 1000. According to IVS FEB RAS the cloud was 200 km long and 76 km wide by 0830, and was spreading W at altitudes of 6-12 km. In the Klyuchi Village, the layer of both ash and snow reached 8.5 cm (figure 96); ashfall was also reported in Kozyrevsk (112 km SW) at 0930, Mayskoye, Anavgay, Atlasovo, Lazo, and Esso. Residents in Klyuchi reported continued darkness and ashfall at 1100. In some areas, ashfall was 6 cm deep and some residents reported dirty water coming from their plumbing. According to IVS FEB RAS, an ash cloud at 1150 rose to 5-20 km altitude and was 400 km long and 250 km wide, extending W. A VONA issued at 1155 reported that ash had risen to 10 km and drifted 340 km NNW and 240 km WSW. According to Simon Carn (Michigan Technological University), about 0.2 Tg of sulfur dioxide in the plume was measured in a satellite image from the TROPOMI instrument on the Sentinel-5P satellite acquired at 1343 that covered an area of about 189,000 km2 (figure 97). Satellite data at 1748 showed an ash plume that rose to 8 km altitude and drifted 430 km WSW and S, according to a VONA.
Activity during 12-15 April 2023. On 12 April at 0730 satellite images showed ash plumes rose to 7-8 km altitude and extended 600 km SW, 1,050 km ESE, and 1,300-3,000 km E. By 1710 that day, the explosions weakened. According to news sources, the ash-and-gas plumes drifted E toward the Aleutian Islands and reached the Gulf of Alaska by 13 April, causing flight disruptions. More than 100 flights involving Alaska airspace were cancelled due to the plume. Satellite data showed ash plumes rising to 4-5.5 km altitude and drifted 400-415 km SE and ESE on 13 April. KVS volcanologists observed the pyroclastic flow deposits and noted that steam rose from downed, smoldering trees. They also noted that the deposits were thin with very few large fragments, which differed from previous flows. The ash clouds traveled across the Pacific Ocean. Flight cancellations were also reported in NW Canada (British Columbia) during 13-14 April. During 14-15 April ash plumes rose to 6 km altitude and drifted 700 km NW.
Alaskan flight schedules were mostly back to normal by 15 April, with only minor delays and far less cancellations; a few cancellations continued to be reported in Canada. Clear weather on 15 April showed that most of the previous lava-dome complex was gone and a new crater roughly 1 km in diameter was observed (figure 98); gas-and-steam emissions were rising from this crater. Evidence suggested that there had been a directed blast to the SE, and pyroclastic flows traveled more than 20 km. An ash plume rose to 4.5-5.2 km altitude and drifted 93-870 km NW on 15 April.
Activity during 16-30 April 2023. Resuspended ash was lifted by the wind from the slopes and rose to 4 km altitude and drifted 224 km NW on 17 April. KVERT reported a plume of resuspended ash from the activity during 10-13 April on 19 April that rose to 3.5-4 km altitude and drifted 146-204 km WNW. During 21-22 April a plume stretched over the Scandinavian Peninsula. A gas-and-steam plume containing some ash rose to 3-3.5 km altitude and drifted 60 km SE on 30 April. A possible new lava dome was visible on the W slope of the volcano on 29-30 April (figure 99); satellite data showed two thermal anomalies, a bright one over the existing lava dome and a weaker one over the possible new one.
References. Girina, O., Loupian, E., Horvath, A., Melnikov, D., Manevich, A., Nuzhdaev, A., Bril, A., Ozerov, A., Kramareva, L., Sorokin, A., 2023, Analysis of the development of the paroxysmal eruption of Sheveluch volcano on April 10–13, 2023, based on data from various satellite systems, ??????????? ???????? ??? ?? ???????, 20(2).
Geologic Background. The high, isolated massif of Sheveluch volcano (also spelled Shiveluch) rises above the lowlands NNE of the Kliuchevskaya volcano group. The 1,300 km3 andesitic volcano is one of Kamchatka's largest and most active volcanic structures, with at least 60 large eruptions during the Holocene. The summit of roughly 65,000-year-old Stary Shiveluch is truncated by a broad 9-km-wide late-Pleistocene caldera breached to the south. Many lava domes occur on its outer flanks. The Molodoy Shiveluch lava dome complex was constructed during the Holocene within the large open caldera; Holocene lava dome extrusion also took place on the flanks of Stary Shiveluch. Widespread tephra layers from these eruptions have provided valuable time markers for dating volcanic events in Kamchatka. Frequent collapses of dome complexes, most recently in 1964, have produced debris avalanches whose deposits cover much of the floor of the breached caldera.
Information Contacts: Kamchatka Volcanic Eruptions Response Team (KVERT), Far Eastern Branch, Russian Academy of Sciences, 9 Piip Blvd., Petropavlovsk-Kamchatsky, 683006, Russia (URL: http://www.kscnet.ru/ivs/kvert/); Institute of Volcanology and Seismology, Far Eastern Branch, Russian Academy of Sciences (IVS FEB RAS), 9 Piip Blvd., Petropavlovsk-Kamchatsky 683006, Russia (URL: http://www.kscnet.ru/ivs/eng/); Kamchatka Volcanological Station, Kamchatka Branch of Geophysical Survey, (KB GS RAS), Klyuchi, Kamchatka Krai, Russia (URL: http://volkstat.ru/); Hawai'i Institute of Geophysics and Planetology (HIGP) - MODVOLC Thermal Alerts System, School of Ocean and Earth Science and Technology (SOEST), Univ. of Hawai'i, 2525 Correa Road, Honolulu, HI 96822, USA (URL: http://modis.higp.hawaii.edu/); MIROVA (Middle InfraRed Observation of Volcanic Activity), a collaborative project between the Universities of Turin and Florence (Italy) supported by the Centre for Volcanic Risk of the Italian Civil Protection Department (URL: http://www.mirovaweb.it/); Copernicus Browser, Copernicus Data Space Ecosystem, European Space Agency (URL: https://dataspace.copernicus.eu/browser/); Kam 24 News Agency, 683032, Kamchatka Territory, Petropavlovsk-Kamchatsky, Vysotnaya St., 2A (URL: https://kam24.ru/news/main/20230411/96657.html#.Cj5Jrky6.dpuf); Simon Carn, Geological and Mining Engineering and Sciences, Michigan Technological University, 1400 Townsend Drive, Houghton, MI 49931, USA (URL: http://www.volcarno.com/, Twitter: @simoncarn).
Bezymianny
Russia
55.972°N, 160.595°E; summit elev. 2882 m
All times are local (unless otherwise noted)
Explosions, ash plumes, lava flows, and avalanches during November 2022-April 2023
Bezymianny is located on the Kamchatka Peninsula of Russia as part of the Klyuchevskoy volcano group. Historic eruptions began in 1955 and have been characterized by dome growth, explosions, pyroclastic flows, ash plumes, and ashfall. During the 1955-56 eruption a large open crater was formed by collapse of the summit and an associated lateral blast. Subsequent episodic but ongoing lava-dome growth, accompanied by intermittent explosive activity and pyroclastic flows, has largely filled the 1956 crater. The current eruption period began in December 2016 and more recent activity has consisted of strong explosions, ash plumes, and thermal activity (BGVN 47:11). This report covers activity during November 2022 through April 2023, based on weekly and daily reports from the Kamchatka Volcano Eruptions Response Team (KVERT) and satellite data.
Activity during November and March 2023 was relatively low and mostly consisted of gas-and-steam emissions, occasional small collapses that generated avalanches along the lava dome slopes, and a persistent thermal anomaly over the volcano that was observed in satellite data on clear weather days. According to the Tokyo VAAC and KVERT, an explosion produced an ash plume that rose to 6 km altitude and drifted 25 km NE at 1825 on 29 March.
Gas-and-steam emissions, collapses generating avalanches, and thermal activity continued during April. According to two Volcano Observatory Notice for Aviation (VONA) issued on 2 and 6 April (local time) ash plumes rose to 3 km and 3.5-3.8 km altitude and drifted 35 km E and 140 km E, respectively. Satellite data from KVERT showed weak ash plumes extending up to 550 km E on 2 and 5-6 April.
A VONA issued at 0843 on 7 April described an ash plume that rose to 4.5-5 km altitude and drifted 250 km ESE. Later that day at 1326 satellite data showed an ash plume that rose to 5.5-6 km altitude and drifted 150 km ESE. A satellite image from 1600 showed an ash plume extending as far as 230 km ESE; KVERT noted that ash emissions were intensifying, likely due to avalanches from the growing lava dome. The Aviation Color Code (ACC) was raised to Red (the highest level on a four-color scale). At 1520 satellite data showed an ash plume rising to 5-5.5 km altitude and drifting 230 km ESE. That same day, Kamchatka Volcanological Station (KVS) volcanologists traveled to Ambon to collect ash; they reported that a notable eruption began at 1730, and within 20 minutes a large ash plume rose to 10 km altitude and drifted NW. KVERT reported that the strong explosive phase began at 1738. Video and satellite data taken at 1738 showed an ash plume that rose to 10-12 km altitude and drifted up to 2,800 km SE and E. Explosions were clearly audible 20 km away for 90 minutes, according to KVS. Significant amounts of ash fell at the Apakhonchich station, which turned the snow gray; ash continued to fall until the morning of 8 April. In a VONA issued at 0906 on 8 April, KVERT stated that the explosive eruption had ended; ash plumes had drifted 2,000 km E. The ACC was lowered to Orange (the third highest level on a four-color scale). The KVS team saw a lava flow on the active dome once the conditions were clear that same day (figure 53). On 20 April lava dome extrusion was reported; lava flows were noted on the flanks of the dome, and according to KVERT satellite data, a thermal anomaly was observed in the area. The ACC was lowered to Yellow (the second lowest on a four-color scale).
Satellite data showed an increase in thermal activity beginning in early April 2023. A total of 31 thermal hotspots were detected by the MODVOLC thermal algorithm on 4, 5, 7, and 12 April 2023. The elevated thermal activity resulted from an increase in explosive activity and the start of an active lava flow. The MIROVA (Middle InfraRed Observation of Volcanic Activity) volcano hotspot detection system based on the analysis of MODIS data also showed a pulse in thermal activity during the same time (figure 54). Infrared satellite imagery captured a continuous thermal anomaly at the summit crater, often accompanied by white gas-and-steam emissions (figure 55). On 4 April 2023 an active lava flow was observed descending the SE flank.
Geologic Background. The modern Bezymianny, much smaller than its massive neighbors Kamen and Kliuchevskoi on the Kamchatka Peninsula, was formed about 4,700 years ago over a late-Pleistocene lava-dome complex and an edifice built about 11,000-7,000 years ago. Three periods of intensified activity have occurred during the past 3,000 years. The latest period, which was preceded by a 1,000-year quiescence, began with the dramatic 1955-56 eruption. This eruption, similar to that of St. Helens in 1980, produced a large open crater that was formed by collapse of the summit and an associated lateral blast. Subsequent episodic but ongoing lava-dome growth, accompanied by intermittent explosive activity and pyroclastic flows, has largely filled the 1956 crater.
Information Contacts: Kamchatka Volcanic Eruptions Response Team (KVERT), Far Eastern Branch, Russian Academy of Sciences, 9 Piip Blvd., Petropavlovsk-Kamchatsky, 683006, Russia (URL: http://www.kscnet.ru/ivs/kvert/); Kamchatka Volcanological Station, Kamchatka Branch of Geophysical Survey, (KB GS RAS), Klyuchi, Kamchatka Krai, Russia (URL: http://volkstat.ru/); Hawai'i Institute of Geophysics and Planetology (HIGP) - MODVOLC Thermal Alerts System, School of Ocean and Earth Science and Technology (SOEST), Univ. of Hawai'i, 2525 Correa Road, Honolulu, HI 96822, USA (URL: http://modis.higp.hawaii.edu/); MIROVA (Middle InfraRed Observation of Volcanic Activity), a collaborative project between the Universities of Turin and Florence (Italy) supported by the Centre for Volcanic Risk of the Italian Civil Protection Department (URL: http://www.mirovaweb.it/); Copernicus Browser, Copernicus Data Space Ecosystem, European Space Agency (URL: https://dataspace.copernicus.eu/browser/).
Chikurachki
Russia
50.324°N, 155.461°E; summit elev. 1781 m
All times are local (unless otherwise noted)
New explosive eruption during late January-early February 2023
Chikurachki, located on Paramushir Island in the northern Kuriles, has had Plinian eruptions during the Holocene. Lava flows have reached the sea and formed capes on the NW coast; several young lava flows are also present on the E flank beneath a scoria deposit. Reported eruptions date back to 1690, with the most recent eruption period occurring during January through October 2022, characterized by occasional explosions, ash plumes, and thermal activity (BGVN 47:11). This report covers a new eruptive period during January through February 2023 that consisted of ash explosions and ash plumes, based on information from the Kamchatka Volcanic Eruptions Response Team (KVERT) and satellite data.
According to reports from KVERT, an explosive eruption began around 0630 on 29 January. Explosions generated ash plumes that rose to 3-3.5 km altitude and drifted 6-75 km SE and E, based on satellite data. As a result, the Aviation Color Code (ACC) was raised to Orange (the second highest level on a four-color scale). At 1406 and 1720 ash plumes were identified in satellite images that rose to 4.3 km altitude and extended 70 km E. By 2320 the ash plume had dissipated. A thermal anomaly was visible at the volcano on 31 January, according to a satellite image, and an ash plume was observed drifting 66 km NE.
Occasional explosions and ash plumes continued during early February. At 0850 on 1 February an ash plume rose to 3.5 km altitude and drifted 35 km NE. Satellite data showed an ash plume that rose to 3.2-3.5 km altitude and drifted 50 km NE at 1222 later that day (figure 22). A thermal anomaly was detected over the volcano during 5-6 February and ash plumes drifted as far as 125 km SE, E, and NE. Explosive events were reported at 0330 on 6 February that produced ash plumes rising to 4-4.5 km altitude and drifting 72-90 km N, NE, and ENE. KVERT noted that the last gas-and steam plume that contained some ash was observed on 8 February and drifted 55 km NE before the explosive eruption ended. The ACC was lowered to Yellow and then Green (the lowest level on a four-color scale) on 18 February.
Geologic Background. Chikurachki, the highest volcano on Paramushir Island in the northern Kuriles, is a relatively small cone constructed on a high Pleistocene edifice. Oxidized basaltic-to-andesitic scoria deposits covering the upper part of the young cone give it a distinctive red color. Frequent basaltic Plinian eruptions have occurred during the Holocene. Lava flows have reached the sea and formed capes on the NW coast; several young lava flows are also present on the E flank beneath a scoria deposit. The Tatarinov group of six volcanic centers is located immediately to the south, and the Lomonosov cinder cone group, the source of an early Holocene lava flow that reached the saddle between it and Fuss Peak to the west, lies at the southern end of the N-S-trending Chikurachki-Tatarinov complex. In contrast to the frequently active Chikurachki, the Tatarinov centers are extensively modified by erosion and have a more complex structure. Tephrochronology gives evidence of an eruption around 1690 CE from Tatarinov, although its southern cone contains a sulfur-encrusted crater with fumaroles that were active along the margin of a crater lake until 1959.
Information Contacts: Kamchatka Volcanic Eruptions Response Team (KVERT), Far East Division, Russian Academy of Sciences, 9 Piip Blvd., Petropavlovsk-Kamchatsky, 683006, Russia (URL: http://www.kscnet.ru/ivs/); Copernicus Browser, Copernicus Data Space Ecosystem, European Space Agency (URL: https://dataspace.copernicus.eu/browser/).
Search Bulletin Archive by Publication Date
Select a month and year from the drop-downs and click "Show Issue" to have that issue displayed in this tab.
The default month and year is the latest issue available.
Bulletin of the Global Volcanism Network - Volume 37, Number 08 (August 2012)
Managing Editor: Richard Wunderman
Asosan (Japan)
Minor mud ejections resumed in 2011, the first since 2008
Bezymianny (Russia)
Dome growth continues in 2012 with plumes up to 1,500 km long
Campi Flegrei (Italy)
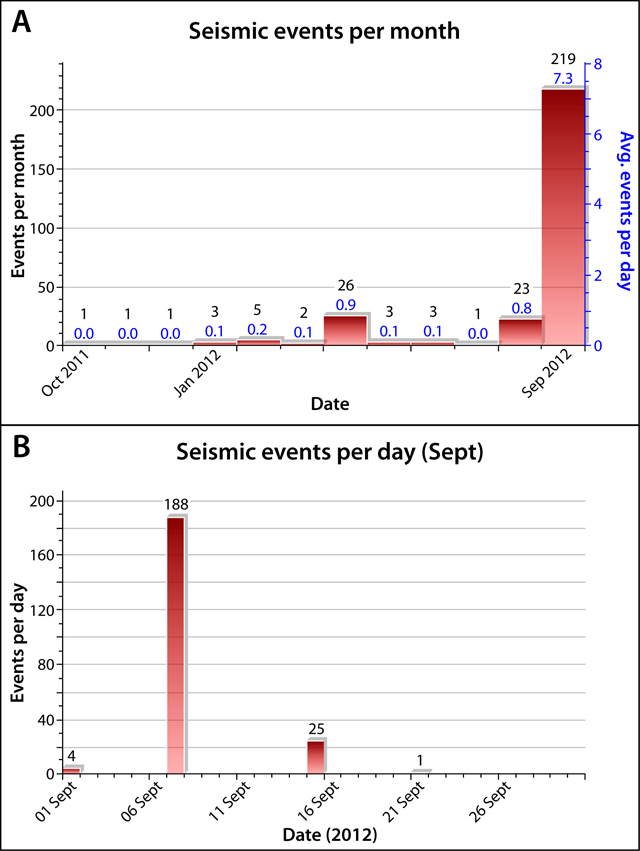
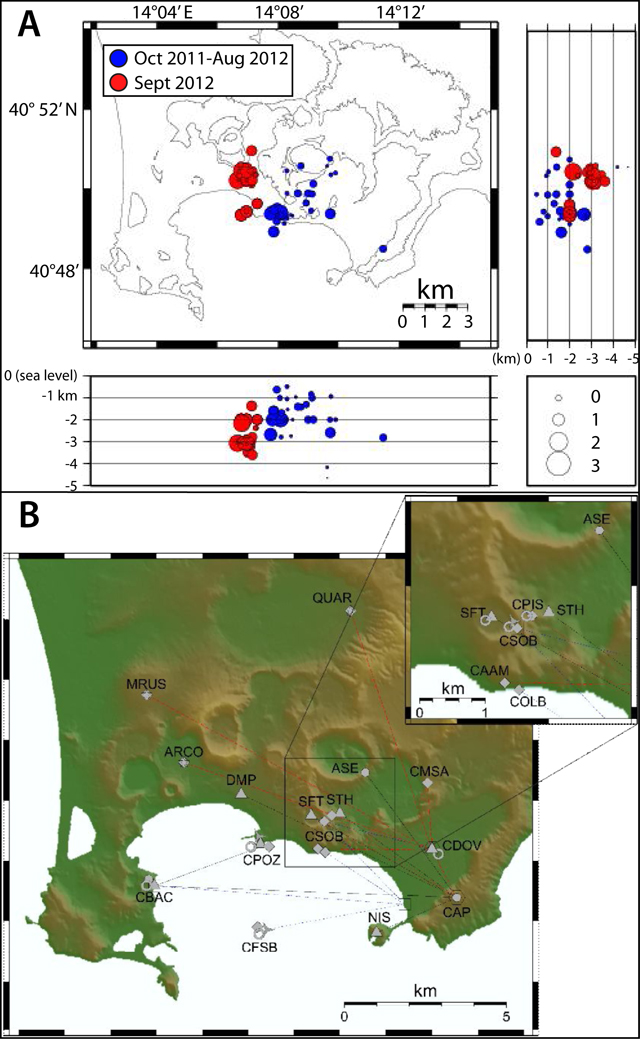
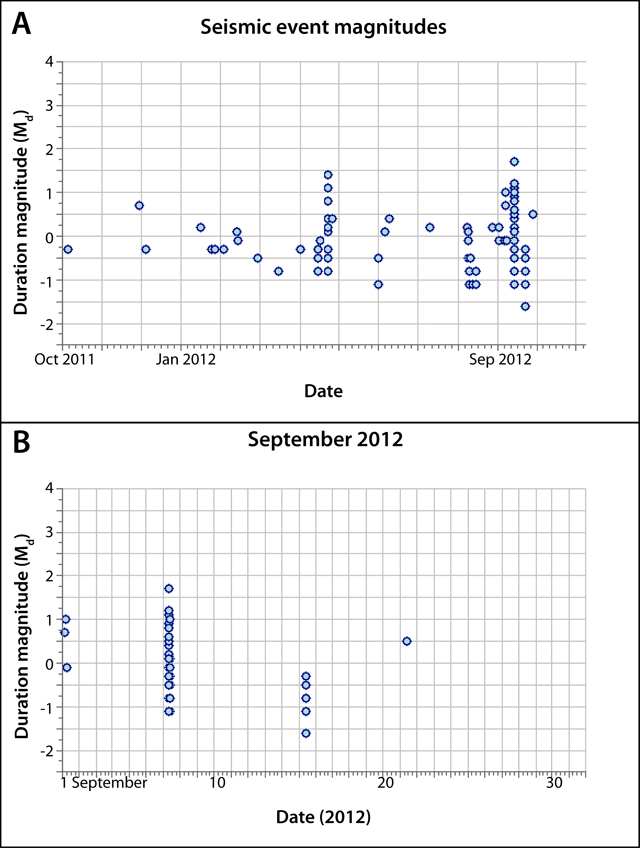
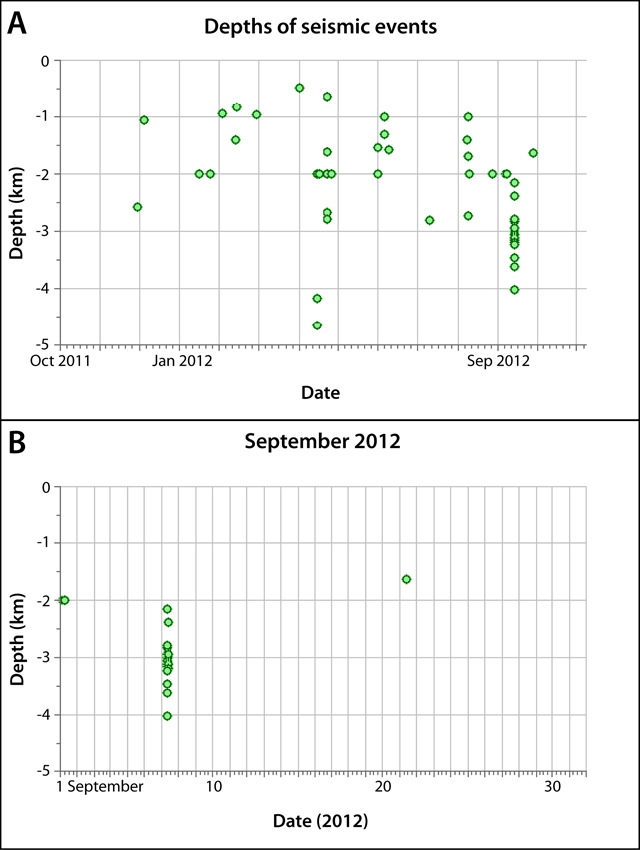
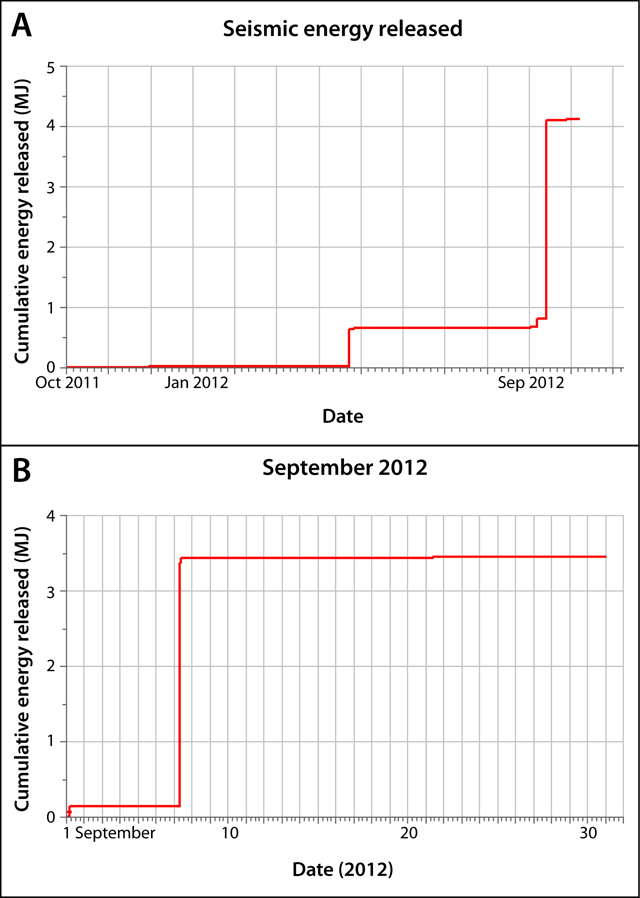
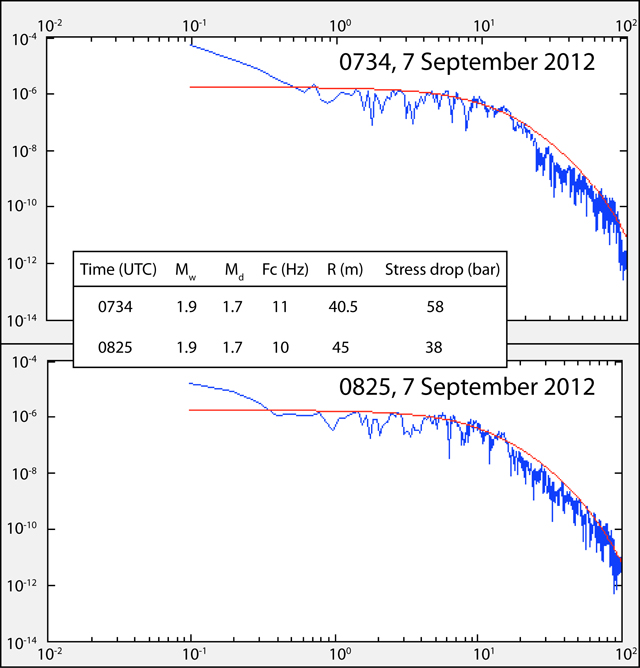
Analysis of seismic swarms (Mw =1.9; ~219 events) during September 2012
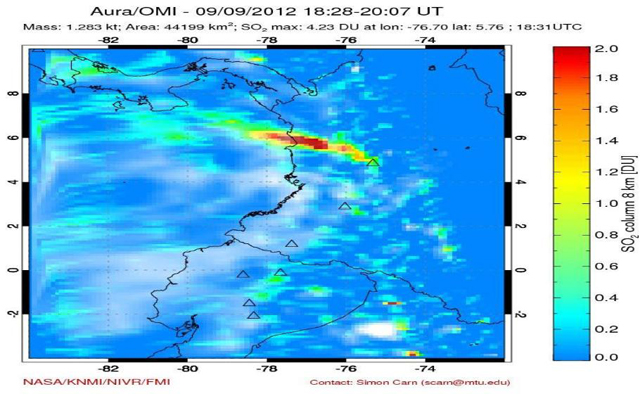
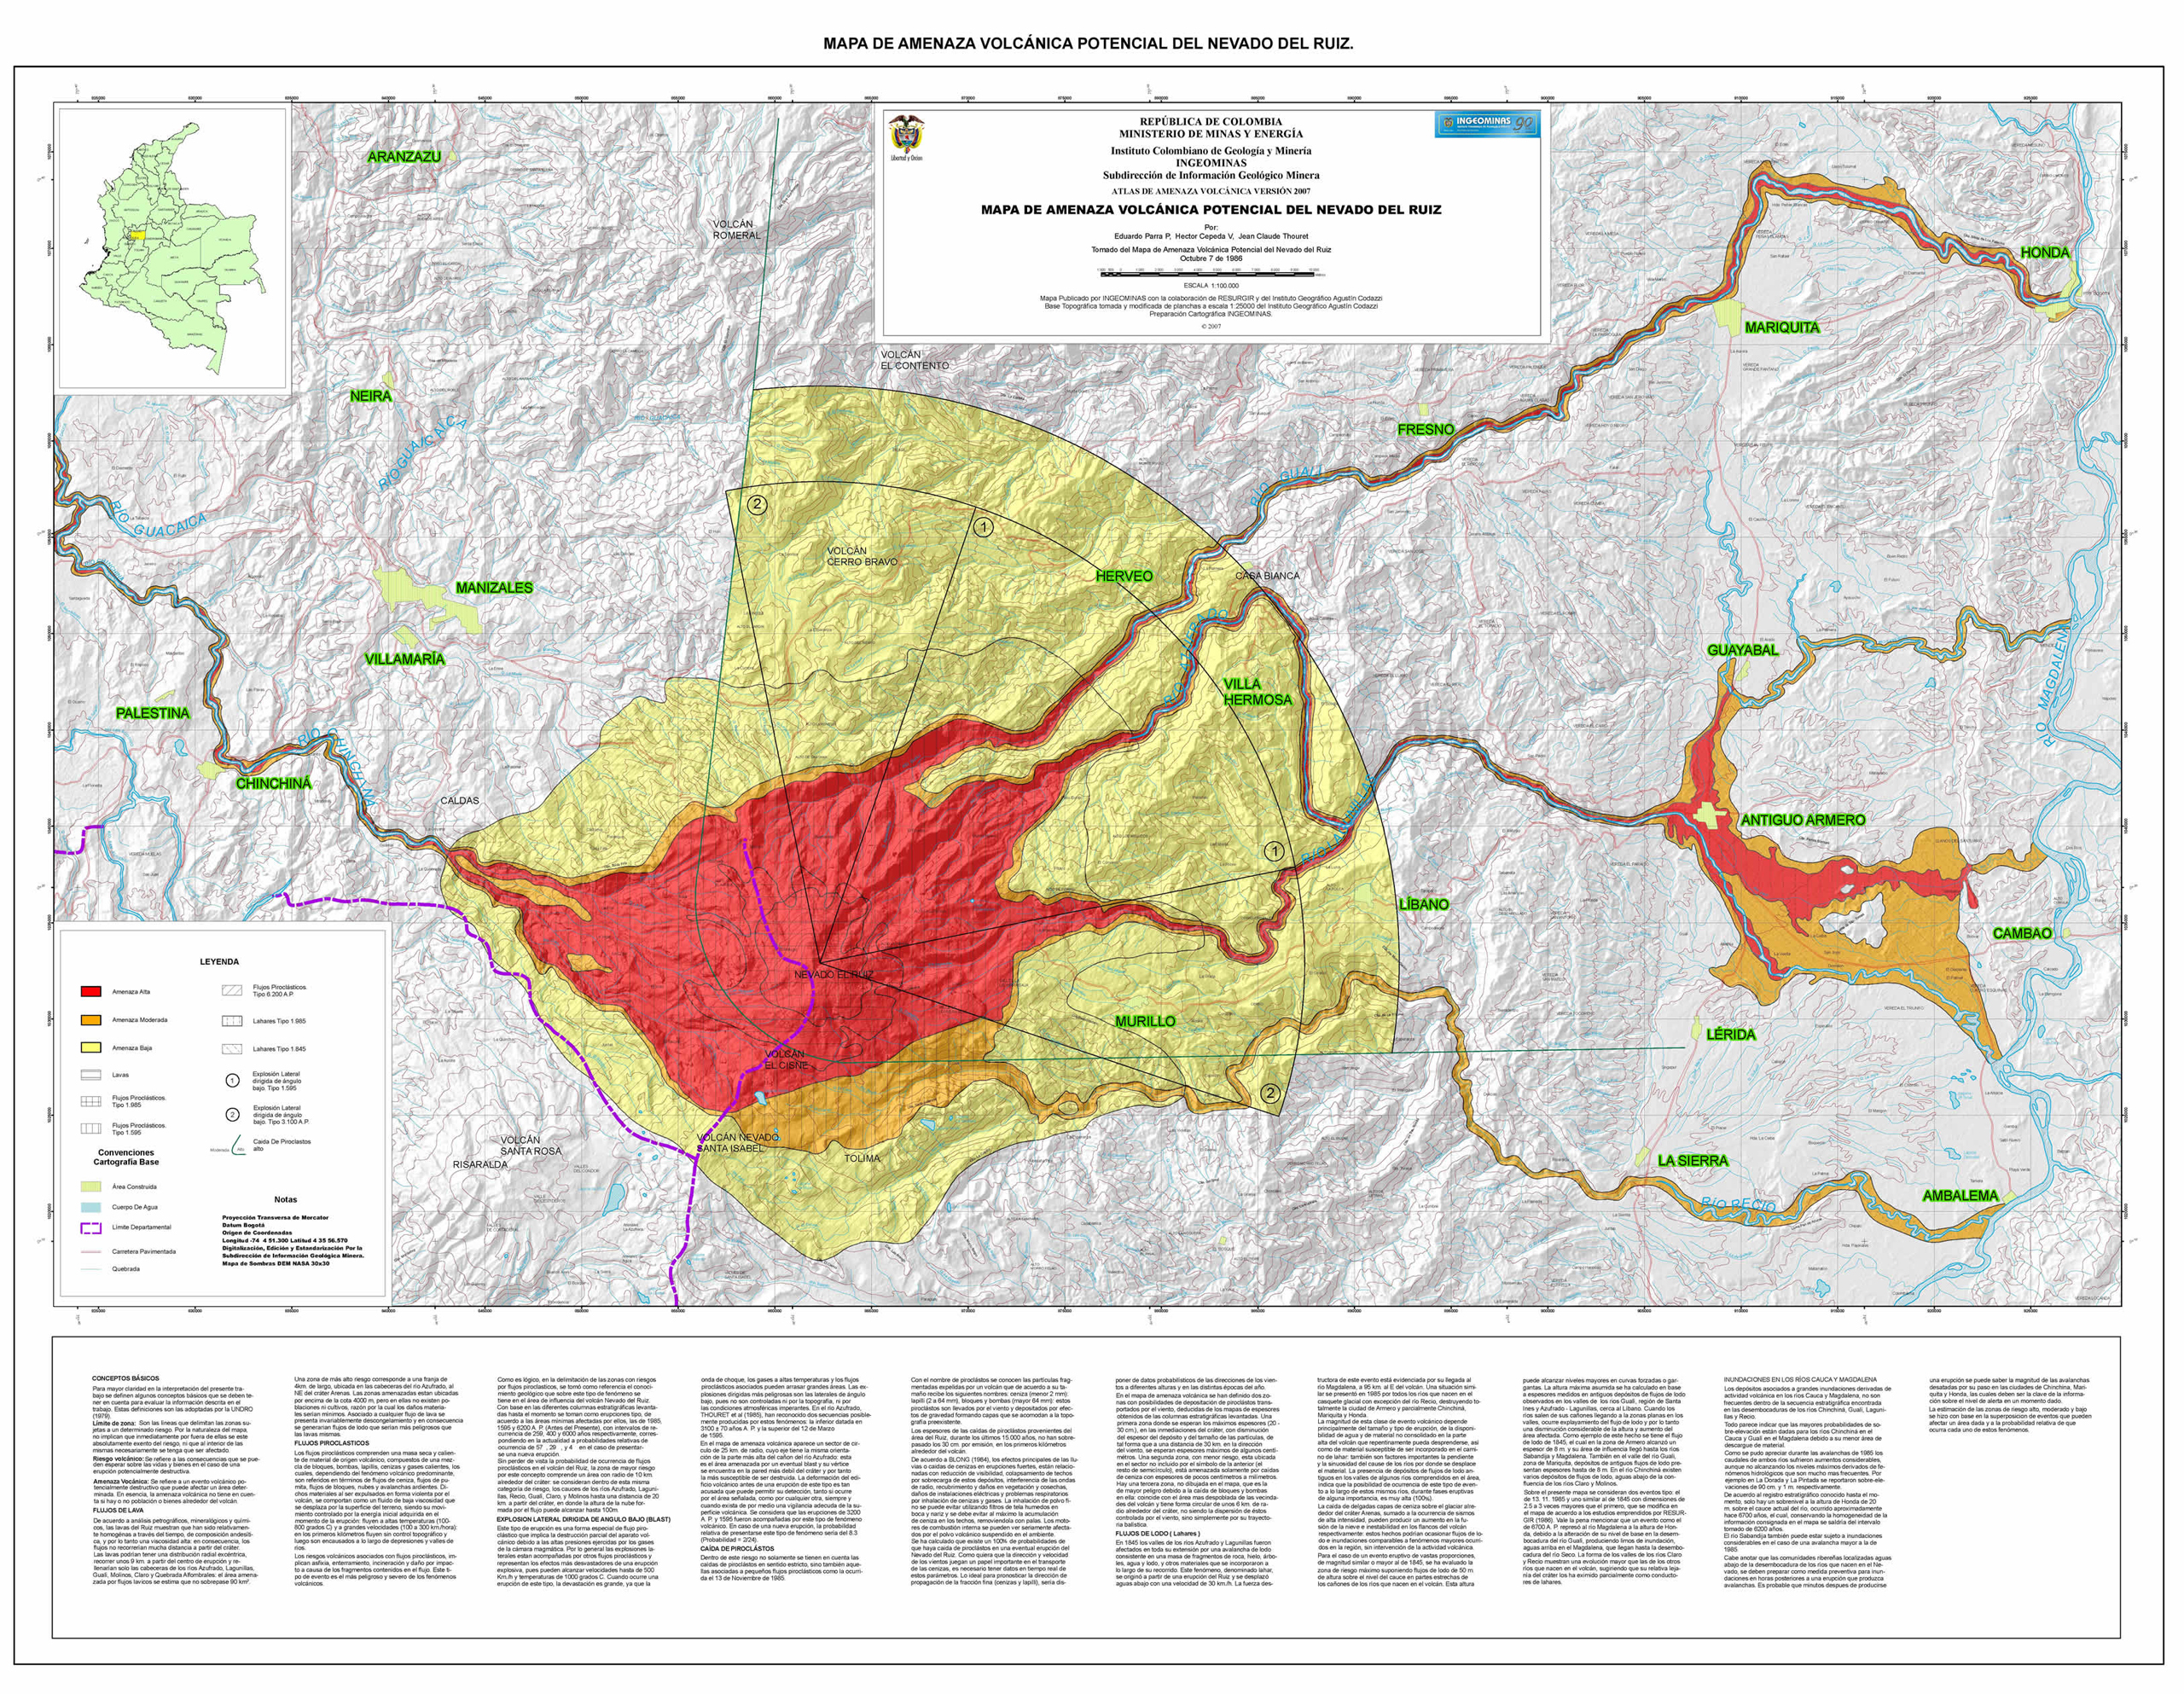
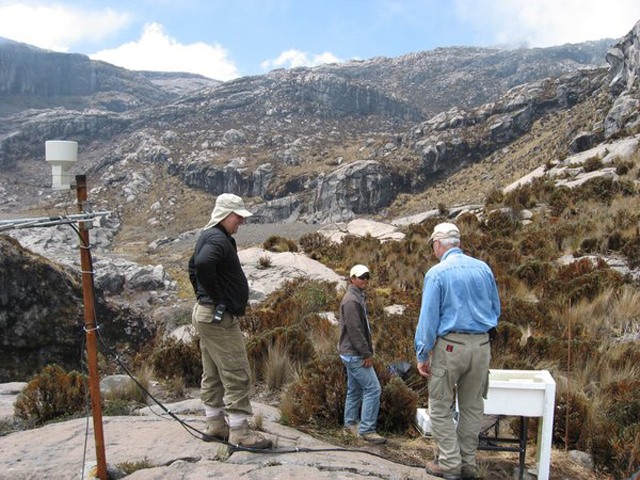
Ruiz, Nevado del (Colombia)
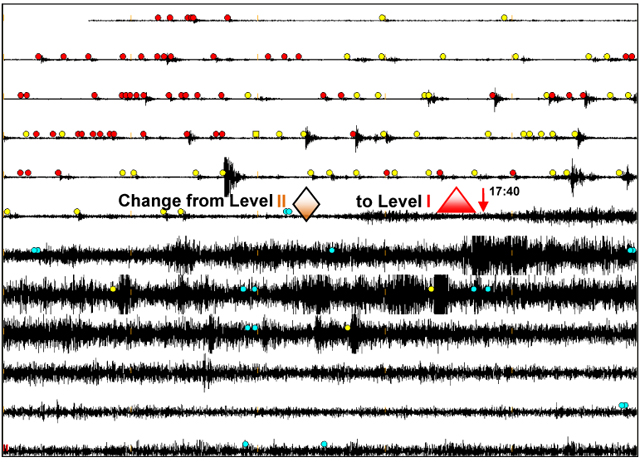
Several years of escalating seismicity followed by ash explosions
San Cristobal (Nicaragua)
Monitoring efforts and 8 September 2012 explosive eruption
Suwanosejima (Japan)
2011-2012 eruptions with plumes rising up to 1 km above crater rim
Asosan
Japan
32.8849°N, 131.085°E; summit elev. 1592 m
All times are local (unless otherwise noted)
Minor mud ejections resumed in 2011, the first since 2008
This report summarizes Japan Meteorological Agency (JMA) monthly reports (available in English since October 2010) covering the interval April 2011 to September 2012, with a separate subsection largely focused on aviation reports of Aso plumes emitted at Naka-dake crater during mid-2011. During this reporting interval Naka-dake continued to degas and emit small ash plumes. Eruptions of mud resumed after a hiatus of several years (February 2008 to April 2011).
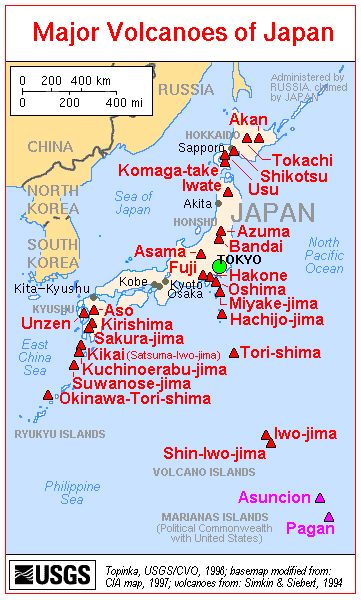
Aso (also called Aso-san) is a caldera with dimensions ~17 km E-W by ~25 km N-S encompassing an area of ~350 km2. Figure 28 indicates the location of Aso in relation to other Holocene Japanese volcanoes and landmarks in the region.
Aso's most recent series of eruptions began in April 2011, with minor phreatic (mud-bearing) eruptions from Naka-dake's crater lake. These eruptions were accompanied by minor ash plumes, rock ejections, an increase in the temperature of fumaroles (BGVN 36:09), and continuous, small-amplitude tremor.
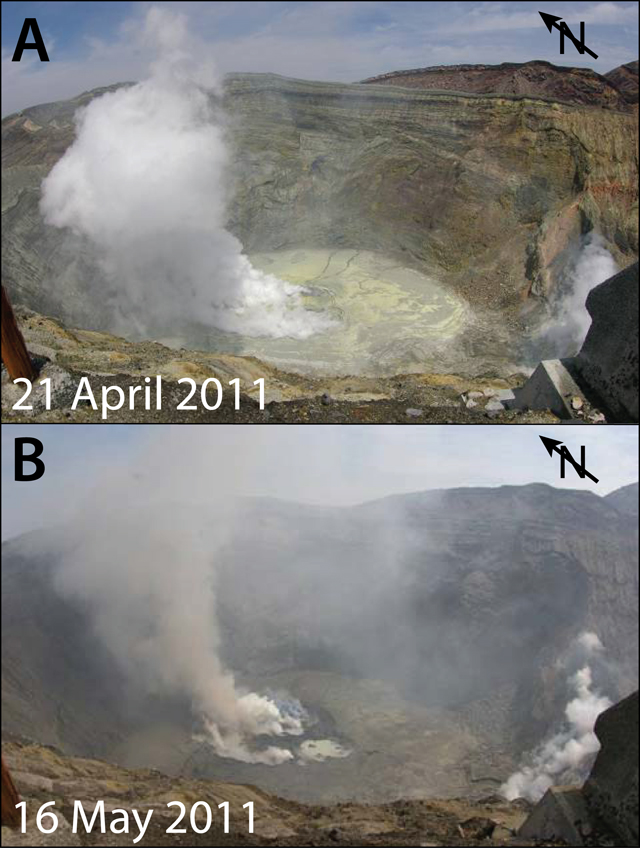
Field observations during April 2011-June 2011. In April 2011, a small phreatic (mud-bearing) eruption 5-10-m-high was observed in Naka-dake's crater lake; the lake's temperature was 67°C. Volcanic seismicity remained at a relatively low level. A photo from 21 April 2011 shows a white steam plume (figure 29).
From 3 to 10 May, continuous small-amplitude tremor was detected. Seismicity, including isolated-pulse events, remained relatively low during this time. On 6 and 9 May, field surveyers observed a small 5-10-m-high phreatic eruption from the hot crater lake (locally called "Yudamari").
A camera installed by the Aso Volcano Museum detected a small volcanic ash emissions from within the crater beginning on 13 May. Six cameras provide live image feeds to the Aso Museum website. There are also many videos showing Aso and Naka-dake on YouTube.
On 13 May, a field survey found increased fumarole temperatures in the crater, and a video camera revealed incandescence on multiple nights. According to JMA, a small eruption occurred on 15 May followed by minor ashfall, which extended 2 km NE of the crater. A field survey on 15 May recorded a temperature of ~370°C at a fumarole in the crater.
Another eruption occurred on 16 May, producing a grayish plume that rose 500 m above the crater rim. As a result of this increased activity, the Alert Level was raised from 1 to 2 (on a scale from 1-5). A field surveyer later the same day saw a gray plume rise 800 m above the crater rim (figure 29). Small-scale eruptions occurred intermittently on the 17th. The lake water volume was low around this time, ~10-20% of its full volume.
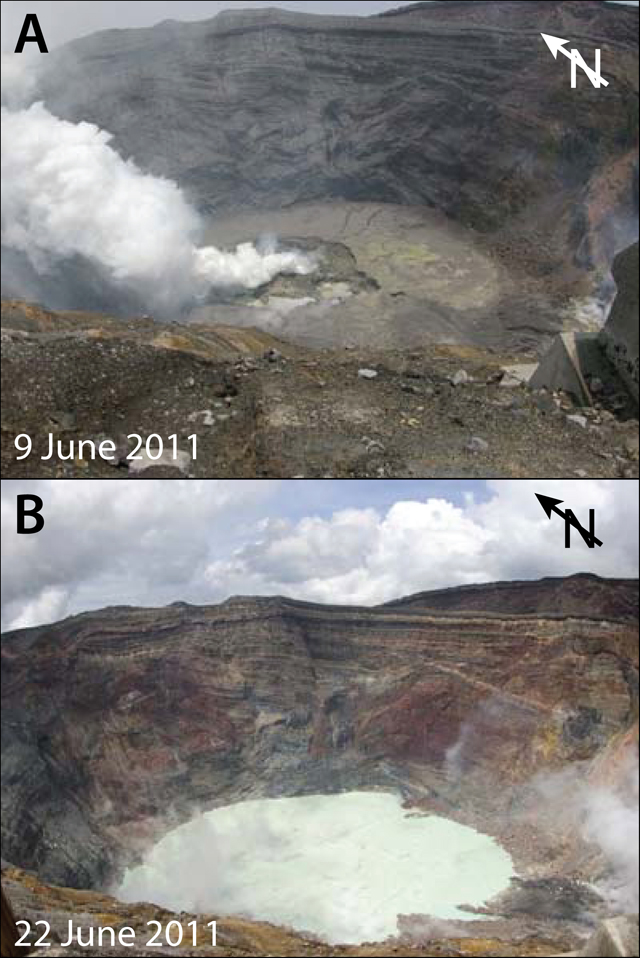
A 9 June field survey revealed a decrease in fumarole temperatures from ~370°C on 15 May to ~160°C on 9 June. After 10 June, eruptions ceased and the lake water volume increased from 60% full on 12 June to 80% full on 17 June (figure 30). The rising lake level suggested a decrease in activity. Consequently, the Alert Level was lowered from 2 to 1 on 20 June. Seismicity, including isolated-pulse events, remained at relatively low levels.
Plume heights and drift directions during May-June 2011. We summarize reports from the Tokyo Volcanic Ash Advisory Center (VAAC) issued between 15 May and 9 June 2011 (table 10). Many plumes contained ash. Notice that the plume heights are stated as altitudes above sea level (as compared to heights above the crater rim, as in the other sections of this report).
Table 10. Summary of plumes at Aso between 15 May and 9 June 2011. Smaller plumes may not have been recorded or were omitted. In most cases, the presence of ash in the plume was noted; in other cases ash may have been present but not recorded. '-' indicates data not reported. Data provided by Tokyo VAAC and JMA.
| Date |
Plume altitude |
Drift |
Ash? |
Pilot/JMA report |
| 15 May 2011 |
2.1 km |
NE |
Ash |
Pilot |
| 16 May 2011 |
1.8-2.1 km |
-- |
-- |
JMA |
| 16 May 2011 |
2.4 km |
N |
Ash |
Pilot |
| 17-18 May 2011 |
1.8 km |
E, SE |
Ash |
JMA |
| 18 May 2011 |
3 km |
-- |
Ash |
Pilot |
| 18-22 May 2011 |
1.5-2.1 km |
N, NE, SE |
Ash |
JMA |
| 25, 27-28, 31 May 2011 |
1.5-1.8 km |
NW, N, E, S |
Ash |
JMA |
| 01-07 June 2011 |
1.5-2.1 km |
NW, N, NE, E, S |
-- |
JMA |
| 08-09 June 2011 |
1.5-1.8 km |
NW, N, NE, E |
-- |
JMA |
Field observations during October 2011-June 2012. In October 2011, white plumes rose on average less than 200 m above the crater rim, with a maximum of 300 m. The lake water volume during September and October was at about 90% full, and the September and October lake-surface temperatures were 47-56°C and 49-58°C, respectively. Based on field surveys made on 3, 17, and 20 October, the sulfur-dioxide (SO2) flux was ~300-500 tons/day, compared to ~300 tons/day in September. Volcanic seismicity remained low. Tremor, detected 13 times during September, was absent during October. The total magnetic intensity measured at the NW rim of the Naka-dake crater had increased since December 2010, but was static during June 2011 through October 2011. No change was detected by GPS measurements.
The next JMA monthly report on Aso discussed activity during May and June 2012. Because of heavy rains after 15 May, the lake water volume had increased to ~70% full, and during the course of the month the volume was in the range 60-80% full. Then in late May, the lake level begain to drop, and continued into at least mid-June.
The lake surface temperature was 63-72°C in May and 67-73°C in June. The highest temperature of fumaroles along the southern crater wall was 246-260°C, compared to 228-267°C in May. Scientists conducting a field survey at night on 22 June noted that part of the S crater wall was incandescent.
In June 2012, white plumes rose an average of 600 m above the crater rim. There were 621 isolated cases of tremor in June, approaching a 2-fold increase over some of the previous months, but only amounting to a duration of a few minutes per month. Isolated volcanic tremor and seismicity remained low but had slightly increased overall after February 2012, with most hypocenters located at shallow depths under Naka-dake. No change was detected by GPS measurements. The total magnetic intensity began to increase again in June 2012.
Lake levels during July-September 2012. In July, heavy rains caused the lake level to rise to 80-90% full (from 30-70% full in June). The volume remained high in August and September (90-100% full). During June-July the lake surface temperature decreased slowly, from 58-66°C in July to 57-61°C in August and to 54-59°C in September. Steam emissions from the crater occurred in July and August, but stopped by September.
Crater temperatures during July-September 2012. The highest temperature of the S wall of Naka-dake-Daiichi crater decreased in July, but rose slightly in August and September (213-250°C in July, 241-249°C in August, and 250-283°C in September). A field survey on 24 September revealed that the hot areas had not changed since the previous survey on 22 June. On 23-26 September, weak glow in the crater was recorded at night by a thermal camera. Officials assumed the glow was caused by the hot crater wall.
July-September 2012 seismicity. Both isolated volcanic tremor and other seismicity returned at low levels during July-September 2012. 621 volcanic tremors occurred in June, 669 in July, 1,025 in August and 867 in September. 669 volcanic earthquakes occurred in July, 951 in August, and 978 in September. Other seismic events occurred 369 times in June, 626 in July, and were not reported in August or September. Few short-term tremors occurred (4 in June, none in July, 2 in August, and 1 in September). Most hypocenters were located at shallow depths (2-4 km) and in an area ~6 km NE of Naka-dake.
Based on field studies, sulfur dioxide levels were elevated during May-September 2012 (600-800 t/d in May, ~400 t/d on 10 July, and 500-700 t/d on 19 and 24 September). The total magnetic intensity at the NW rim of Naka-dake-Daiishi crater increased between December 2010 and September 2012, which officials suggested might signify a temperature rise underneath the crater.
Geologic Background. The 24-km-wide Asosan caldera was formed during four major explosive eruptions from 300,000 to 90,000 years ago. These produced voluminous pyroclastic flows that covered much of Kyushu. The last of these, the Aso-4 eruption, produced more than 600 km3 of airfall tephra and pyroclastic-flow deposits. A group of 17 central cones was constructed in the middle of the caldera, one of which, Nakadake, is one of Japan's most active volcanoes. It was the location of Japan's first documented historical eruption in 553 CE. The Nakadake complex has remained active throughout the Holocene. Several other cones have been active during the Holocene, including the Kometsuka scoria cone as recently as about 210 CE. Historical eruptions have largely consisted of basaltic to basaltic-andesite ash emission with periodic strombolian and phreatomagmatic activity. The summit crater of Nakadake is accessible by toll road and cable car, and is one of Kyushu's most popular tourist destinations.
Information Contacts: Japan Meteorological Agency (JMA), Otemachi, 1-3-4, Chiyoda-ku Tokyo 100-8122, Japan (URL: http://www.jma.go.jp/); Tokyo Volcanic Ash Advisory Center (VAAC), Tokyo, Japan (URL: http://ds.data.jma.go.jp/svd/vaac/data/); Aso Volcano Museum (URL: http://www.asomuse.jp/); Volcano Discovery (URL: http://www.volcanodiscovery.com/); Earth Observation Research Center (Japan) (URL: http://www.eorc.jaxa.jp/en/index.php).
Bezymianny (Russia) — August 2012 Cite this Report
Bezymianny
Russia
55.972°N, 160.595°E; summit elev. 2882 m
All times are local (unless otherwise noted)
Dome growth continues in 2012 with plumes up to 1,500 km long
This report covers ongoing dome growth and other activity at Bezymianny since our previous report in January 2010 (BGVN 34:11) and extending into early September 2012. Multiple strong eruptions occurred during this reporting period. In one case, on 2 September 2012, an eruption generated a plume that rose to 10-12 km altitude and was later detected 1,500 km from the vent. In this and many other cases, fresh lava flows were extruded at the dome. Some intervals of the remainder of 2010 and early 2011 were chiefly characterized by intermittent thermal anomalies at the dome and fumarolic activity.
The data in this report come primarily from the Kamchatka Volcanic Eruptions Response Team (KVERT) and the Tokyo Volcanic Ash Advisory Center (VAAC). Portions of this report were initially synthesized and edited by Matthew Loewen, submitted as part of a graduate student writing assignment in a volcanology class at Oregon State University under the guidance of professor Shan de Silva.
The Kamchatka peninsula's low population density often thwarts confirmation of significant events, and seismic signals were likely obscured by activity at nearby Kliuchevskoi volcano. Seismic activity and other observations between 29 January 2010 and 3 September 2012 are summarized in table 5.
Table 5. Summary of activity at Bezymianny from 29 January 2010 through 3 September 2012. Data courtesy of KVERT, Tokyo VAAC, and Anchorage VAAC.
| Date |
Observations and Remarks |
Aviation Color Code |
| 29-30 Jan 2010 |
Thermal activity over lava dome detected by satellite. |
Yellow |
| 31 Jan 2010 |
Weak to moderate fumarolic activity. |
Yellow |
| 02 Feb 2010 |
Thermal activity deteced by satellite. |
Yellow |
| 06 Feb 2010 |
Weak to moderate fumarolic activity noted with possible explosions. |
Yellow |
| 07-08 Feb 2010 |
Hot new lava flow detected; thermal anomaly over lava dome (58.6°C). |
Orange |
| 09 Feb 2010 |
Explosive eruption not imminent. |
Yellow |
| 16 Feb 2010 |
Unconfirmed explosions. |
Yellow |
| 08-13 Apr 2010 |
Weak to moderate fumarolic activity, weak thermal anomaly over the lava dome. |
Yellow |
| 19 May 2010 |
Rapid temperature increase over lava dome from 18°C on 19 May to 49°C on 23 May. |
Orange |
| 21 May 2010 |
Fumarolic activity detected; continuous through 28 May. |
Orange |
| 23-24 May 2010 |
Earthquakes reported in location of lava dome. |
Orange |
| 31 May 2010 |
Strong explosion. Ash plumes rose ~8-10 km altitude and spread ~250 km W, ~160 km N and NE. Ashfall on Kozyrevsk village (45 km W) on 1 June. |
Red |
| 02 Jun 2010 |
Heavy gas-and-steam emissions from lava dome. Elongated thermal anomalies in satellite images the following days suggested the deposit of two pyroclastic flows. |
Orange |
| 03 Jun 2010 |
-- |
Yellow |
| 04-05 Jun 2010 |
Thermal activity detected by satellite. Ash plume drifted ~600 km SSE. |
Yellow |
| 08 Jun 2010 |
Thermal activity detected by satellite. |
Yellow |
| 12 Jun 2010 |
Thermal activity detected by satellite; slightly elevated seismicity. |
Yellow |
| 12-17 Jun 2010 |
Thermal activity detected by satellite. |
Yellow |
| 13-16 Jun 2010 |
Gas-and-steam activity. |
Yellow |
| 19 Jun 2010 |
Thermal anomaly detected by satellite. |
Yellow |
| 21-23 Jun 2010 |
Thermal anomaly detected by satellite. |
Yellow |
| 28 Jun 2010 |
Thermal anomaly detected by satellite. |
Yellow |
| 01 Sep 2010 |
Weak thermal anomaly attributed to gas-and-steam emissions. |
Yellow |
| 21 Nov 2010 |
Helicopter observation photos showed a new area of lava possibly extruded from the top of the dome. |
Yellow |
| 03 Dec 2010 |
Weak thermal anomaly attributed to gas-and-steam emissions. |
Yellow |
| 07 Dec 2010 |
Weak thermal anomaly attributed to gas-and-steam emissions. |
Yellow |
| 30 Jan-03 Feb 2011 |
Weak thermal anomaly and moderate gas-and-steam activity. |
Yellow |
| 04 Feb 2011 |
Based on information from Yelizovo Airport (UHPP), Tokyo VAAC reported a 4.6 km ash plume drifting to the NE. |
Yellow |
| 14 Apr 2011 |
Strong explosion. Ash reported at ~7.6 km altitude. |
Red |
| 12-19 Feb 2012 |
Increased seismicity. |
Orange |
| 15 Feb 2012 |
Short duration tremor activity. |
Orange |
| 20 Feb 2012 |
Gas-and-steam plumes drifted NE. |
Orange |
| 22 Feb 2012 |
Short duration tremor activity. Gas-and-steam plumes observed in satellite images drifing NE. |
Orange |
| 26-29 Feb 2012 |
Gas-and-steam plumes, short duration tremor. |
Orange |
| 01-05 Mar 2012 |
65-80 weak seismic events. |
Red |
| 08-09 Mar 2012 |
Strong explosion, ash plumes to 3.5-5 km altitude, ash plumes from pyroclastic flows rose to 8 km altitude and drifted 700 km NE. Ashfall in community 120 km ENE. Followed by significant activity decrease. |
Orange/Red |
| 09-13 Mar 2012 |
Strong gas-and-steam emissions, viscous lava flow onto lava dome flank, thermal anomaly. |
Orange/Yellow |
| 24-31 Aug 2012 |
Seismicity increased to moderate (71 events on 31 Aug) with weak-to-moderate fumarolic activity; thermal anomaly. |
Yellow |
| 02 Sep 2012 |
Explosion with ash plumes to 10-12 km altitude, drifting 1,500 km ENE, thermal anomaly. |
Orange/Red/Yellow |
| 03 Sep 2012 |
Seismicity low, viscous lava flow was accompanied by fumarolic activity and hot avalanches. |
Yellow |
Several abstracts discussing the June 2010 explosive eruption were presented at the Fall 2010 American Geophysical Union conference in San Francisco. These studies were primarily the work of the U.S.-Russia Partnership for Volcanological Research and Education (PIRE). Part of the initiative was to install and monitor 14 GPS stations around Bezymianny (Serovetnikov and others, 2010; their figure 4). Over the course of the five-year project, the scientists noted precursory changes in GPS-measured surface velocity. The anomalies occurred 15-25 days before, and 25-30 days after, typical eruptions, suggesting relatively short periods of shallow magma storage before eruptions. Grapenthin and others (2010) also reported that during the December 2009 and May 2010 eruptions, the 12 available GPS stations showed little or no significant inflation before explosions, suggesting the magma was deeply sourced.
Izbekov and others (2010) reported that the December 2009 and June 2010 eruptive products contained abundant high-silica, amphibole-bearing enclaves. This was in contrast to all previous eruptions since 1956. Until December 2009, the juvenile products of Bezymianny were remarkably homogeneous; enclaves and xenoliths had been exceptionally rare.
Figures 13-15 show images and photos of Bezymianny that help document the 14 April 2011 eruption, which is also noted in table 5. Several other strong eruptions took place later in the reporting interval (discussed below).
On 8 March 2012, KVERT raised Bezymianny's Aviation Color Code to Red after a sharp and sustained increase in seismic activity. KVERT also noted a significant increase in both the size and temperature of a thermal anomaly at the summit, suggesting that new, hot magma was very close to or at the dome's surface. Therefore, the organization suggested that "strong ash explosions up to 13 km a.s.l. were possible at any time during the next 24 hours." The following day, 9 March, Bezymainny exploded; the magnitude of the volcanic tremor was 7.52 m/s. Ash plumes from pyroclastic flows rose to 8 km in altitude and drifted NE. According to later satellite data, the ash plume was distinguishable for ~700 km. In addition, gas-and-steam plumes containing ash rose to an altitude of 3.5-4.0 km and drifted NE. Seismologists reported that the explosion did not pose a threat to population centers in the area. After the strong explosive phase, the eruptive vigor decreased gradually and continued at a low level. Following the 8-9 March event, KVERT lowered the Aviation Color Code to Orange.
During 9-13 March, video captured strong gas-and-steam emissions; no ash was noted. Strong degassing accompanied the effusion of a viscous lava flow on the S flank of the lava dome, along with moderate-to-strong gas-and-steam emissions. Seismic activity was low after 10 March, although the volcano emitted gas-and-steam plumes during 14-15 March. Satellites continued to record thermal anomalies. KVERT lowered the Aviation Color Code to Yellow.
According to visual observations during 15-16 March, the length of the 8 March 2012 pyroclastic deposits was ~4 km. According to satellite data, a thermal anomaly continued to register at the volcano on 23 and 25-26 March. Clouds obscured the volcano on other days of week.
The viscous lava flow continued to effuse on the S flank of the lava dome, accompanied by degassing, well into May. KVERT noted thermal anomalies (detected by satellite) during 29-31 March, 3-4, 9-10, 13-17, 19, 28-29 April, and 3 May. Seismic activity remained low.
According to KVERT, seismicity increased during the middle of August 2012. On 28 August, 17 events were recorded; on 31 August, 71 events were detected. Observers noted weak-to-moderate fumarolic activity during 25-26 and 29 August; cloud cover prevented observations on other days. A thermal anomaly was detected in satellite imagery on 25 August.
On 2 September, an explosion sent ash plumes to an altitude of 10-12 km; plumes drifted more than 1,500 km ENE. A thermal anomaly observed in satellite imagery was very bright before the explosion. The Aviation Color Code was raised to Orange, then Red. Later that day, ash plumes rose to an altitude of 4 km and drifted NE before ash emissions ceased. The Aviation Color Code was then lowered to Yellow. On 3 September seismic activity was low, while a viscous lava flow effused on the lava-dome flank, accompanied by fumarolic activity and hot avalanches.
References. Grapenthin, R., Freymueller, J.T., and Serovetnikov, S., 2010. The December 2009 and May 2010 eruptions of Bezymianny volcano, Kamchatka: Interpretation of the GPS Record, American Geophysical Union, Fall Meeting 2010, abstract #V33D-04.
Izbekov, P.E., Neill, O.K., Shipman, J.S., Turner, S.J., Shcherbakov, V.D., and Plechov, P., 2010. Silicic Enclaves in Products of 2009-2010 Eruptions of Bezymianny Volcano, Kamchatka: Implications for Magma Processes, American Geophysical Union, Fall Meeting 2010, abstract #V33D-01.
Serovetnikov, S., Freymueller, J.T., Titkov, N., Bahtiarov, V., and Senyukov, S,2010. GPS Monitoring Bezimyany Volcano 2006-2010 (Kamchatka), American Geophysical Union, Fall Meeting 2010, abstract #V21B-2325.
Geologic Background. The modern Bezymianny, much smaller than its massive neighbors Kamen and Kliuchevskoi on the Kamchatka Peninsula, was formed about 4,700 years ago over a late-Pleistocene lava-dome complex and an edifice built about 11,000-7,000 years ago. Three periods of intensified activity have occurred during the past 3,000 years. The latest period, which was preceded by a 1,000-year quiescence, began with the dramatic 1955-56 eruption. This eruption, similar to that of St. Helens in 1980, produced a large open crater that was formed by collapse of the summit and an associated lateral blast. Subsequent episodic but ongoing lava-dome growth, accompanied by intermittent explosive activity and pyroclastic flows, has largely filled the 1956 crater.
Information Contacts: Kamchatka Volcanic Eruptions Response Team (KVERT), Institute of Volcanology and Seismology (IV&S) Far East Division, Russian Academy of Sciences (FEDRAS), Kamchatka Branch of the Geophysical Service of the Russian Academy of Sciences (KBGS RAS), Piip Ave. 9, Petropavlovsk-Kamchatsky, 683006, Russia (URL: http://www.kscnet.ru/ivs/, http://www.emsd.ru/~ssl/monitoring/main.htm); Sergei Ushakov, IVS FED RAS; Tokyo Volcanic Ash Advisory Center (VAAC), Tokyo, Japan (URL: http://ds.data.jma.go.jp/svd/vaac/data/); Alaska Volcano Observatory (AVO), a cooperative program of the U.S. Geological Survey, the University of Alaska’s Geophysical Insitute, and the Alaska Division of Geological & Geophysical Surveys (URL: http://www.avo.alaska.edu/); Anchorage Volcanic Ash Advisory Center (VAAC), Alaska Aviation Weather Unit, NWS NOAA US Dept of Commerce, 6930 Sand Lake Road, Anchorage, AK 99502-1845 (URL: http://www.ssd.noaa.gov/).
Campi Flegrei (Italy) — August 2012 Cite this Report
Campi Flegrei
Italy
40.827°N, 14.139°E; summit elev. 458 m
All times are local (unless otherwise noted)
Analysis of seismic swarms (Mw =1.9; ~219 events) during September 2012
219 low-magnitude earthquakes occurred at Campi Flegrei during September 2012, a comparatively large number with respect to the previous year (figure 22). The earthquakes chiefly were contained within two swarms (with events up to Mw 1.9; Mw indicates moment magnitude) occurring on 7 and 15 September. Peak ground accelerations (PGA) were non-trivial (up to ~0.5 g), and some earthquakes were widely felt by area residents. Analysis revealed that the strain release rate of the 7 September swarm fell within values seen for other swarms during the last 20 years. The observations reported by the Vesuvius Observatory (who provided the material for this report) were limited to those associated with the earthquakes and related seismic analysis. Other reporting on topics such as deformation appears on the Observatory's website (see Information Contacts, below). The observatory is part of Italy's National Institute of Geophysics and Volcanology (INGV).
Almost all of the earthqaukes that occurred during September took place in two swarms (figures 22 and 23). The first swarm occurred in the area of Pozzuoli during 0715-0935 UTC on 7 September. The two largest events of that swarm were Mw 1.9 (a duration magnitude, Md, value of 1.7; figure 24); these events were the largest recorded events of the prior year (figure 24A). The 7 September swarm was dominant over the 15 September swarm both in terms of the number and magnitude of events.
The second swarm of September 2012 took place between 0901 and 1012 UTC on 15 September (figure 22), with the strongest events (Md -0.3) occurring at 0947 and 0954 UTC. This swarm was recorded by only one station (STH, Agnano, figure 23B) and thus was plausibly located in close proximity to that station at shallow depth. This swarm is absent on the depth plot in figure 25 (depth not available).
The hypocenters of 49 events were determined during September 2012; their depths were generally less than 4 km (figures 23 and 25). The seismological parameters did not show significant anomalies (figures 24 and 25). However, September 2012 was the most seismically energetic time period of the prior year (figure 26); seismicity during September produced >3 times the cumulative energy released during the preceding year.
Analysis of the 7 September seismic swarm. For the two main events (0734 and 0825 UTC) on 7 September, source parameters were determined from S-wave displacement spectra (results shown in figure 27).
The duration and strain release of the 7 September swarm were similar to other seismic swarms at Campi Flegrei since at least 1994 (figure 28).
Some of the events in the swarm were widely felt in the urban area of Pozzuoli. Peak ground acceleration values (PGA, units of %g, the acceleration due to gravity) recorded by the accelerometer in Pozzuoli (CPOZ, figure 23B) show two prominent peaks corresponding to the two largest events that occurred at 0734 and 0825 UTC (figure 29).
Reference. Mooney, W.D., 1989. Seismic methods for determining earthquake source parameters and lithospheric structure, in Pakiser, L.C. and Mooney, W.D. (eds), Geophysical framework of the continental United States, Geological Society of America Memoir 172.
Geologic Background. Campi Flegrei is a 13-km-wide caldera that encompasses part of Naples and extends to the south beneath the Gulf of Pozzuoli. Episodes of significant uplift and subsidence within the dominantly trachytic caldera have occurred since Roman times. The earliest known eruptive products are dated 47,000 years BP. The caldera formed following two large explosive eruptions, the massive Campanian ignimbrite about 36,000 BP, and the over 40 km3 Neapolitan Yellow Tuff (NYT) about 15,000 BP. Following eruption of the NYT a large number of eruptions originated from widely scattered subaerial and submarine vents. Most activity occurred during three intervals: 15,000-9,500, 8,600-8,200, and 4,800-3,800 BP. The latest eruption were in 1158 CE at Solfatara and activity in 1538 CE that formed the Monte Nuovo cinder cone.
Information Contacts: Vesuvius Observatory, National Institute of Geophysics and Volcanology (INGV), Via Diocleziano 328, 80124 Napoli, Italy (URL: http://www.ov.ingv.it/ov/).
Nevado del Ruiz (Colombia) — August 2012 Cite this Report
Nevado del Ruiz
Colombia
4.892°N, 75.324°W; summit elev. 5279 m
All times are local (unless otherwise noted)
Several years of escalating seismicity followed by ash explosions
Our last report on Nevado del Ruiz (BGVN 37:07) summarized monitoring efforts by the Instituto Colombiano de Geología y Minería (INGEOMINAS) volcano observatory based in Manizales, highlighting the long records of geophysical and radon-gas data starting in 1988 and continuing through 2006. Here we follow up on volcanic activity from 2007 to 2012, including an escalation leading to explosions in February 2012. Elevated seismicity, wide-spread ashfall, and very high SO2 fluxes (~30,000 tons/day) resulted in a Level I Red Alert announcement (on a scale from IV to I, Alert Level I is the highest, "Red Alert") in June 2012 and public notices of evacuations. Activity subsided in July 2012 and remained low through the remainder of this reporting period ending 9 September 2012.
Seismicity from 2007-August 2010. From 2007 to August 2010, INGEOMINAS reported numerous volcano-tectonic (VT) and long-period (LP) events originating at depths of 1-12 km below Nevado del Ruiz. Rare hybrid and tremor earthquakes were detected, and seismic swarms occurred intermittently (19-78 events per swarm; figure 54). Seismicity was frequently concentrated within the crater and to the SE, S, SW, and W (table 3).
Geodesy, 2007-August 2010. Deformation monitoring expanded in late 2007 when INGEOMINAS installed additional electronic tilt stations, augmenting their dry tilt datasets. Dry tilt measurements had been recorded since at least 1986 (see the station distribution map, figure 10 in BGVN 37:07). While the term "dry tilt" is pervasive in volcano monitoring literature, this can cause confusion as it was originally adopted to differentiate measurements made with water leveling techniques (Yamashita, 1992). Alternative terms are "single-setup leveling" or "tilt leveling" however, the term "inclinómetro seco," has been used consistently throughout INGEOMINAS monthly technical reports since March 2006. Tilt measurements collected with site occupation techniques are manually intensive, requiring extensive field time, reliable benchmark pairs, a spirit level, and leveling rods. In August 2010, dry tilt values were available from three stations and electronic tilt values were available from five operating stations; results were reported in the INGEOMINAS technical bulletin (available online).
In August 2008, electronic distance meter (EDM) base stations and reflectors were installed on the W flank of the volcano. Site occupations at Olleta and Refugio recorded stable conditions from September 2008 through August 2010.
Gas emissions, 2007-August 2010. Frequent steam plumes were visible reaching 50-850 m above the crater from January 2007 through August 2010. On 17 July 2010, the Washington Volcanic Ash Advisory Center (VAAC) was alerted to a spike in seismicity detected at Nevado del Ruiz. Several aviation alerts were released; however, no volcanic ash was detected in satellite imagery and advisories were canceled that same day. Several peaks in diffuse soil CO2 emissions were detected in mid-2008 from two geochemical stations, Gualí and Cajones (N and S of the summit, respectively).
Radon-gas emissions measured at Gualí and Cajones also showed peaks in early 2010. INGEOMINAS had maintained emission records since 1995 and was investigating links between radon emissions and earthquakes (Garzón and others, 2003). Radon hazard investigations had been conducted in Manizales (located ~30 km NW of the volcano) by INGEOMINAS that determined water supply and household levels of radon (Salazar and others, 2003). This baseline data was mapped for SE Manizales and showed low levels of radon in water supplies and also low levels at the 43 indoor sites where passive sampling detected an average of 1.9 pCi/L.
During fieldwork on 30 November-1 December 2009, INGEOMINAS installed two scanning Differential Optical Absorption Spectrometer (DOAS) systems within 5 km W of the edifice. Stations Bruma and Alfombrales were telemetered to send SO2 flux data to the Manizales observatory where results were analyzed with NOVAC software. The Network for Observation of Volcanic and Atmospheric Change (NOVAC), designed by the European Commission's Sixth Framework Program, supported this installation. Colombia was one of seven countries participating in the program that sought to monitor and assess SO2 emissions from active volcanoes (Galle and others, 2009). During 2-29 December, SO2 flux ranged 195-554 t/d at Bruma and 41-140 t/d at Alfombrales.
Escalating seismicity from September 2010 to 2011. Seismicity notably increased in September 2010 and prompted authorities to raise the alert to Level III (Yellow, on the four-level scale) on 30 September (table 3). Within four months, pseudo-tornillo earthquakes (figure 55) and possible explosive signatures appeared in the seismic record. From September 2010 through December 2011, an average of more than 890 VT earthquakes per month were recorded, almost eight times as many events as recorded during the previous 12 months. A similar increase in LP events was also observed during this time period; however, epicenters were clustered in the same regions as previous years: within the crater, to the SE, S, SW, and W (as in figure 54).
A type of earthquake classified as "multi-event" began to appear in February 2011 (see ME events in table 3). These events frequently occurred from February through August and were attributed to small explosions and degassing (figure 56). Tremor and tornillo earthquakes were recorded in March of 2011 and, over the next six months, occurred more frequently with time.
Geodesy, September 2010-2011. During September 2010-2011, INGEOMINAS recorded stable conditions with minor fluctuations from the EDM stations Refugio and Olleta. Both stations were surveyed in February, October, and November 2011, and only Refugio was surveyed in September and December.
INGEOMINAS noted an increasing trend at the electronic tilt station LISA that began in October 2010 and continued through 2011; the two components registered a cumulative increase of 20 µrad. RECIO had been recording stable conditions until May 2011; from May through December 2011, the N component increased by 23 µrad and the E component decreased by 10 µrad. Corrective measures had been taken to protect the BIS and REFUGIO tilt stations from thermal effects, however, cyclical changes persisted in their datasets. By December 2011, seven electronic tilt stations were online and were recording minor fluctuations primarily due to temperature change.
Permanent GPS stations Gualí and Nereidas were installed on the lower W flanks between May and August 2011 and a third station, Olletas, was online by November 2011. GPS instrumentation and continuous data processing were part of a collaborative effort between INGEOMINAS and the University of Wisconsin, Madison.
SO2 emissions, 2010-2012. Since installation of the two scanning DOAS stations in late 2009, background levels of SO2 were rarely higher than 1,000 t/d until September 2010. INGEOMINAS recorded increased SO2 emissions in late 2010 (figure 57), while plumes rose to heights of 220-1,000 m above the crater (averaging ~700 m) through 2011. An increase was observed from November 2010 through much of 2011; maximum daily values of SO2 flux frequently exceeded 1,500 t/d. Occasional peaks above 3,000 t/d were recorded from November 2010 to January 2011 (a), June-July 2011 (b), and November 2011 to February 2012 (c). Beginning in February 2012, emissions dramatically increased during a period of escalated seismicity (table 3). SO2 flux peaked during May and June; the three strongest peaks were greater than 33,000 t/d. By late June, emissions were declining.
Explosive activity in 2012. In late January 2012, while SO2 flux began to increase dramatically (figure 57), explosion signatures (also described as strong degassing events) and multi-events continued to appear in the seismic records. On 8 March an overflight of the summit provided INGEOMINAS scientists a view of ash-covered snow on the E flank and near the crater rim (figure 58); in their monthly report, INGEOMINAS suggested this ash may have fallen during an explosion detected on 22 February 2012.
On 29 March authorities raised the alert to Level II (Orange) when LP seismicity underwent a ~100-fold increase and banded tremor persisted (table 3).
Based in part on information captured by webcameras around the volcano (including one in Manizales located 30 km NW of Nevado del Ruiz), INGEOMINAS reported that plume heights had increased significantly in March 2012 (figure 59). Reports from local populations around the volcano also alerted INGEOMINAS of sulfur odors. Residents smelled these odors during March; April, May, and August reports were from Manizales, Lebanon, Palocabildo, and Chinchiná.
The national park surrounding the volcano, Los Nevados National Park, closed in April 2012 due to possible ashfall and lahar hazards. The rainy season (March-June) had begun and mass wasting on the steep slopes, especially of remobilized ash, was a major concern. "Most lahars are initiated as dilute, subcritical flows high on volcanic slopes, but quickly increase their volumes as they incorporate sediment along travel paths (Lockwood and Hazlett, 2010)."
On 16 and 19 April 2012, INGEOMINAS observed ash emissions from the summit and on 22 April, Washington VAAC announced possible ash in the steam plume. Volcanic ash was detected later with satellite imagery, spreading ~110 km NE of the summit on 29 May.
Seismicity decreased in early May 2012 to levels observed before the escalation began in February, and fewer explosions and multi-events were recorded. On 3 May authorities lowered the alert to Level III (Yellow). Conditions at Nevado del Ruiz continued to change, however, and when seismicity abruptly increased, the Alert Level was raised to Level II (Orange) on 29 May (table 3, figure 60). That day, explosions from the crater generated ash plumes that dispersed over more than 20 communities located to the WNW, NW, and NNW. Washington VAAC released four notices on 29 May describing ash up to 11 km altitude. News media reported that three primary airports in the region (Manizales, Pereira, and Armenian) collectively canceled ~20 flights that affected ~700 passengers on 29 May.
Widespread ashfall in early June 2012 required field maintenance by INGEOMINAS to clear ash from solar panels and equipment (figure 61). Imagery captured by the NASA satellite EO-1 revealed a two-toned summit disclosing partial ash cover over the white summit glacier (figure 62). The seismic station INDERENA, acoustic flow station MOLINOS, and the radio repeater that served Nevado del Ruiz, Tolima, and Santa Izabel volcanoes were disabled due to ash cover. Washington VAAC released advisories regularly until 24 June; ash reached altitudes in the range of ~5.5-7.6 km. Plumes tended to drift N, NW, WNW, and W; however, an ash plume on 8 June drifted ~28 km SE. The range of plume lengths was 28-110 km until a period of quiescence during 25 June-2 July.
On 30 June 2012, seismicity increased and large plumes of ash vented from the summit (figure 63). At 1700 that day, authorities raised the alert to Level I (Red). Local news media reported the preventative evacuation notice provided by the Emergency Committee of Caldas; Caldas is the department of Colombia encompassing Nevado del Ruiz and six districts, 27 municipalities, and the capital, Manizales. An estimated 300 families were ordered to evacuate from the rural zones of districts Chinchiná (30 km WNW), Villamaría (28 km NW), Palestina (40 km WNW), and Manizales (30 km NW) due to both escalated explosions and also the potential for flooding along the rivers Chinchiná and Río Claro. In the Department of Tolima, located S of Caldas there was a recommendation to evacuate 1,500 families in risk zones in eight municipalities.
On 2 July 2012, Washington VAAC announced a 7.5-km-wide plume visible in satellite imagery that had drifted ~75 km W. Seismicity was decreasing, however, and that same day, authorities lowered the Alert Level to II (Orange). Airborne ash remained visible in satellite images until 8 July and continued to be observed at low elevations based on webcamera images. Ashfall was reported in Pereira (40 km WSW) on 11 July, and on 31 July a plume of ash and gas was observed rising 300 m above the crater.
Low levels of tremor had been detected in late July and throughout much of August 2012. Seismic swarms were detected on 12 and 13 August (table 3) with ~140 low-magnitude events under 5 km deep concentrated WSW of the Arenas Crater. On 6 August, ashfall was reported in Manizales and Chinchiná; on 12 August there were reports of ash in Manizales and Brisas (50 km SW). Through the end of August, plumes (ranging 200-800 m above the crater) were visible from the summit. Field measurements by INGEOMINAS and remote sensing with OMI determined that SO2 emissions remained high (figure 64) through August and early September. On 5 September 2012 authorities reduced the Alert Level to III (Yellow).
Recalling 1985 and additional hazard mitigation efforts. Nevado del Ruiz's most deadly natural disaster was a lahar that, on 13 November 1985, scoured the Lagunillas River (E flank drainage system) and suddenly flooded the towns of Armero, Chinchiná, Mariquita, and Honda (figure 65). Armero was completely destroyed and more than 23,000 residents died. Light ashfall had been reported that day and a seismic network was in place, but no early warning system had been established to initiate evacuations (Lockwood and Hazlett, 2010).
Since 1985, realtime geophysical monitoring greatly increased, including acoustic flow sensors designed to detect impulsive flooding in local drainages. Other advances included mobile gas monitoring (mini-DOAS) that augmented routine geochemical sampling at Nevado del Ruiz and recent hazard map revisions that emphasized inundation scenarios with zoning that clearly communicates areas at highest risk (figure 65). International collaborations with universities and agencies (for example, the University of Wisconsin and the European Union mentioned previously) have focused on mitigation efforts through training and technical resources.
Following the disastrous 1985 lahars, the USGS and the U.S. Office of Foreign Disaster Assistance (OFDA) developed the Volcano Disaster Assistance Program (VDAP) to respond to selected volcanic crises around the world (Ewert and others, 1997). The VDAP mission is to work with international counterparts to reduce fatalities and economic losses in those countries experiencing a volcano emergency. The VDAP website states that "Between crises, VDAP scientists focus on building and improving volcano monitoring systems and conduct joint activities to reduce volcanic risk by improving understanding of volcanic hazards [figure 66]."
References. Ewert, J.W., Miller, C.D., Hendley, J.W., and Stauffer, P.H., 1997. Mobile Response Team Saves Lives in Volcano Crises, USGS Fact Sheet: 064-97.
Galle, B. and the NOVAC Team, 2009. NOVAC - A global network for volcanic gas monitoring, 6th Alexander von Humboldt International Conference, Abstract AvH6-34-1, 2010.
Garzón, G., Serna, D., Diago, J., and Morán, C., 2003. Radon soil increases before volcano-tectonic earthquakes in Colombia, Proceedings of ICGG7: 6-7.
Lockwood, J.P., and Hazlett, R.W., 2010. Volcanoes: Global Perspectives, Wiley-Blackwell, Hoboken, NJ, ix, p.539.
Narváez, L.M., Torres, R.A., Gómez, D.M., Cortez, G.P., Cepeda, H.V., and Stix, J., 1997. 'Tornillo'-type seismic signals at Galeras volcano, Colombia, 1992-1993, Journal of Volcanology and Geothermal Research, 77: 159-171.
Salazar, S., Carvajal, C., and Garzón, G., 2003. Radiological geohazard survey in the south east of Manizales city (Colombia), Proceedings of ICGG7: 3-5.
Yamashita, K.M., 1992. Single-Setup Leveling Used to Monitor Vertical Displacement (Tilt) on Cascades Volcanoes, in Ewert, J. and Swanson, D. (Eds.), Monitoring volcanoes; techniques and strategies used by the staff of the Cascades Volcano Observatory, 1980-90, U.S. Geological Survey Bulletin 1966, pp. 143-149.
Geologic Background. Nevado del Ruiz is a broad, glacier-covered volcano in central Colombia that covers more than 200 km2. Three major edifices, composed of andesitic and dacitic lavas and andesitic pyroclastics, have been constructed since the beginning of the Pleistocene. The modern cone consists of a broad cluster of lava domes built within the caldera of an older edifice. The 1-km-wide, 240-m-deep Arenas crater occupies the summit. The prominent La Olleta pyroclastic cone located on the SW flank may also have been active in historical time. Steep headwalls of massive landslides cut the flanks. Melting of its summit icecap during historical eruptions, which date back to the 16th century, has resulted in devastating lahars, including one in 1985 that was South America's deadliest eruption.
Information Contacts: Instituto Colombiano de Geologia y Mineria (INGEOMINAS), Volcanological and Seismological Observatory, Avenida 12 Octubre 15-47, Manizales, Colombia (URL: https://www2.sgc.gov.co/volcanes/index.html); Washington Volcanic Ash Advisory Center (VAAC), Satellite Analysis Branch (SAB), NOAA/NESDIS E/SP23, NOAA Science Center Room 401, 5200 Auth Rd, Camp Springs, MD 20746, USA (URL: http://www.ospo.noaa.gov/Products/atmosphere/vaac/); Ozone Monitoring Instrument (OMI), Sulfur Dioxide Group, Joint Center for Earth Systems Technology, University of Maryland Baltimore County (UMBC), 1000 Hilltop Circle, Baltimore, MD 21250, USA (URL: https://so2.gsfc.nasa.gov/); El Colombiano (URL: http://www.elcolombiano.com/); The Columbian (URL: http://www.columbian.com/).
San Cristobal (Nicaragua) — August 2012 Cite this Report
San Cristobal
Nicaragua
12.702°N, 87.004°W; summit elev. 1745 m
All times are local (unless otherwise noted)
Monitoring efforts and 8 September 2012 explosive eruption
When last active in October 2011, San Cristóbal produced ash plumes accompanied by elevated seismicity (BGVN 36:12). This report covers the January-September 2012 monitoring efforts (seismic, gas, thermal, and visual observations) and the onset of a volcanic crisis during 8-15 September 2012. Seismicity remained high through early 2012 and tremor was frequently detected. Explosions of ash and gas began impulsively from the summit crater on 8 September causing heavy ashfall, evacuations of local populations, and aircraft deviations.
January-September 2012 seismicity. Instituto Nicaragüense de Estudios Territoriales (INETER) detected seismic tremor every day in January 2012 and throughout much of February, March, and April. A station outage took place during 1-14 June, but when the data stream returned, it recorded significant tremor. INETER reported a generally increasing trend in earthquake counts from January through April (figure 22).
In January, tremor persisted for 1-12 hours per day for a total of 118 hours. In February, tremor duration averaged 4 hours/day (131 hours); in March, 6 hours/day (166 hours); in April, 2 hours/day (38 hours); and in June, 5 hours/day (23.5 hours). No estimates were available for May.
From January through April 2012, a class of seismic events considered "degassing earthquakes" (DE) were detected throughout the seismic records. These events were characterized in spectrograms as events in the range of 4-10 Hz. INETER described the events as resulting from gas moving through the conduit, causing displacements and, after building pressure in confined spaces, the pressure was released impulsively, generating low-amplitude shockwaves and arriving as emergent seismic signals with low energy. These conditions suggested that the volcanic system was partially open (as opposed to a closed system that would be expected to pressurize). Individual DEs occurred with durations of ~60 seconds, and up to 1,379 DE events were recorded in April 2012 with dominant frequencies of 5-10 Hz.
Volcano-tectonic (VT) earthquakes were a minor part of San Cristóbal's seismicity during January-June. Typically occurring 6-15 km deep, the maximum number of VT events occurred in March; 39 earthquakes were detected with dominant frequencies in the range of 10-20 Hz.
Long-period (LP) earthquales dominated the seismic record in June; 1,413 events were recorded (22-707 monthly events were noted in the records during February-April). The duration of these signals ranged from 40-90 seconds with dominant frequencies of 1-5 Hz. Depths of these events were not announced, but in March and April, LPs occurred at depths of 6-25 km.
Reports from INETER during the volcanic crisis in September highlighted sporadic signals indicating eruptions in the seismic records along with tremor and the appearance of shallow, low-magnitude events (microseismicity). Elevated seismicity on 8 September decreased dramatically by 10 September. Seismic tremor increased on 14 September, however, by 16 September, seismicity had returned to normal levels.
SO2 monitoring. In January 2012 INETER reported that three miniature Differential Optical Absorption Spectrometer (Mini-DOAS) stations were installed in the field around the flanks of San Cristóbal. These stations stored SO2 flux data locally and telemetered it to the INETER network through the El Chonco repeater. These installations were part of the Network for Observation of Volcanic and Atmospheric Change (NOVAC), a collaboration supported by the European Union's Natural Disasters Program (Galle and others, 2009).
Employing a mobile DOAS, INETER collected SO2 data on traverses in March; five traverses were made between the junction of Chinandega and Corinto and the town of Las Grecias (for town locations, see BGVN 36:12 figure 20). The average SO2 flux recorded on 30 March 2012 was 542 t/d; the reported wind velocity was 5 m/s to the E. Previous measurements from this region (10 January 2011) yielded an average SO2 flux of 436 t/d.
Thermal data and visits to the summit. INETER technicians noted regular gas emissions from San Crisóbal's summit from January through August 2012. During field investigations to the summit (April-August 2012), loud jetting was heard one day (22 April) coming from the central crater. That day, gas emissions were relatively low and there was evidence of numerous rockfalls from the W side of the crater. Vapor plumes drifted mainly W and E of the crater depending on wind direction.
Fumarole temperatures measured from April through August show small variations in the range of 50-93°C (figure 23). These measurements were taken from five sites located within the SE sector of the crater rim. The previous temperature from the central crater was last measured on 3 December 2011 (382°C); the most recent measurement, on 20 June 2012, was 543.7°C.
Heavy rain in May restricted field operations, however, on 24 May INETER technicians visited the lower flanks of San Cristóbal to maintain seismic and gas instrumentation. They encountered evidence of a lahar that had covered the main trail between the Hacienda Las Rojas and Pedro Marín to the SW of the summit. The lahar had reached a maximum height of 0.8 m and was up to 15 m wide.
Field investigations to the summit on 20 June determined that deep channels had been eroded in the W flank of the volcano, exposing loose soil (figure 24). INETER advised vigilance for this region since the soil could easily remobilize as a mudflow with heavy rainfall. The W flank was particularly at risk due to a forest fire that, in April 2012, removed significant vegetation that would otherwise have provided some stability for the steep slopes. Particularly vulnerable locations would be the areas of Las Rojas and Pedro Marín, farming areas within the drainage network on the W flank.
Ash explosions in September 2012. At 0845 local time on 8 September, a substantial ash plume erupted suddenly from San Cristóbal's summit, followed by a second plume 10 minutes later. Later that day, INETER confirmed GOES-13 satellite observations of a wide-spreading ash plume from the summit of San Cristóbal (figure 25). Three explosions produced ash-and-gas plumes that day and were observed rising up to 1.5 km above the crater and drifted 9 km/hr NW (figure 26).
On 8 September INETER released special online reports announcing observations and volcanic crisis incidents. Residents reported ashfall at El Viejo (18 km WSW of San Cristóbal), El Chonco, and Ranchería. Sporadic explosions later that day generated ash plumes that rose 1.5-5 km and drifted 50 km WNW. The sporadic explosions appeared in the seismic records but microseisms (a category of shallow, small-magnitude earthquakes) dominated the record.
Between 0900 and 1000 local time on 8 September, SO2 flux was 3,221 t/d, well above the normal range of 550-700 t/d. Residents in Versalles Arriba, a zone near the crater, reported seeing a fissure-like feature, however, INETER did not report follow-up site visits for this observation. Rockfalls were observed on the N flank; on the NW flank, ash mixed with incandescent rock fell in an area occupied by livestock. Field investigators noted that six animals were burned from this event.
According to a news article, emergency officials evacuated ~3,000 people by 1857 local time. The national emergency agency of Nicaragua (Sistema de Prevención, Mitigación y Atención de Desastres, SINAPRED) reported that airplanes were diverted around San Cristóbal to other routes.
Rainfall was closely monitored on 8 September. By 1600 local time, 26.1 mm of rain had fallen and INETER warned of possible mudflows resulting from remobilized ash. Thunderstorms were expected on 9 September in the region of Chinandega and INETER warned that acid rain could result from the mixture of volcanic gases.
During 9 September, INETER coordinated field teams that investigated ashfall within the region. These teams determined that ash fell in an area covering 2,438 square kilometers, including the communities of El Viejo, La Grecia, La Joya, Santa Catalina, El Piloto, Las Banderas, Las Rojas, Carlos Fonseca, Jiquilillo, Mechapa, and Cosiguina (figure 27). Ashfall was 5 cm thick in areas near the crater and up to 3 mm thick in more distant places.
By 10 September, INETER reported that seismicity decreased after the 8 September eruption. A traverse between Chinandega and El Guasaule during 0700-0830 with a mobile DOAS measured an SO2 flux of 1,626 t/d. This emission rate was significantly lower compared to the previous day.
During 10-11 September, steam plumes rose 200-300 m above the crater and drifted W. Three small explosions on 11 September generated ash-and-gas plumes that rose 300 m above the crater and drifted W. An explosion and ash venting was observed a few hours later; a plume drifted S and ash fell on the flanks. Microseismicity continued; at 0900 on 11 September, 63 small events had been recorded so far that day.
Abundant gas emissions were observed on the morning of 12 September. RSAM was notably higher (by 35 to 70 RSAM units compared to the previous day). At the time of the Special Report on 12 September at 1100 local time, 86 microseismic events had been recorded.
On 13 September, INETER reported that the seismic network continued to detect small, sporadic explosions. Sulfur dioxide gas emissions were above normal (1,360 t/d), similar to levels detected on 8 September. RSAM calculated since the release of the last INETER Special Report was considered normal, 40-60 RSAM units, and microseismicity appeared to have decreased (only 17 events had been detected).
Fieldwork was conducted on 13 September as a joint venture between INETER and the El Salvadoran agency Servicio Nacional de Estudios Territoriales de El Salvador (SNET). The scientific team reached the summit crater of San Cristóbal to measure temperatures, collect rock samples, and observe current conditions. They noted that portions of the crater had collapsed (N and S sectors) and found blocks and ejecta on the flanks, 850 m from the crater. Changes had also occurred in the summit fumarolic areas. Three of the five fumarolic sites no longer emitted gas; these sites appeared to be sealed. Fumaroles 1 and 2 had measurably elevated temperatures (85°C), broadly similar to previous values recorded (figure 23). Based on the field assessment of ejecta, INETER warned that mudflows remained a hazard during heavy rainfall.
Increased seismic tremor was recorded at 0340 on 14 September. Low levels of summit emissions were visible drifting in a plume to the SW. Elevated SO2 flux continued (2,490 t/d). The following day, abundant gas emissions were visible drifting NE and SO2 emissions had increased (3,054 t/d). RSAM had increased to 120 on 15 September. A small explosion was detected at 0817 local time; however, there was no visual confirmation due to cloud cover.
Early in the morning on 16 September, minor tremor was recorded and few earthquakes were recorded. The seismic events were too small to be located and INETER reported that, based on RSAM, seismicity had returned to normal levels (40 RSAM units). Low level emissions were visible and less SO2 was detected compared to the previous two days (2,053 t/d). By 17 September, no tremor was recorded and minor emissions were visible drifting N of the crater.
References. A Callejas, 2012, Volcan San Cristobal en erupción - Nicaragua Sept 8, 2012 (from YouTube), Uploaded on 10 September 2012, Accessed on 3 October 2012, http://www.youtube.com/watch?v=hQStun1FF3o&feature=related.
Galle, B. and the NOVAC Team, 2009. NOVAC - A global network for volcanic gas monitoring, 6th Alexander von Humboldt International Conference, Abstract AvH6-34-1, 2010.
Geologic Background. The San Cristóbal volcanic complex, consisting of five principal volcanic edifices, forms the NW end of the Marrabios Range. The symmetrical 1745-m-high youngest cone, named San Cristóbal (also known as El Viejo), is Nicaragua's highest volcano and is capped by a 500 x 600 m wide crater. El Chonco, with several flank lava domes, is located 4 km W of San Cristóbal; it and the eroded Moyotepe volcano, 4 km NE of San Cristóbal, are of Pleistocene age. Volcán Casita, containing an elongated summit crater, lies immediately east of San Cristóbal and was the site of a catastrophic landslide and lahar in 1998. The Plio-Pleistocene La Pelona caldera is located at the eastern end of the complex. Historical eruptions from San Cristóbal, consisting of small-to-moderate explosive activity, have been reported since the 16th century. Some other 16th-century eruptions attributed to Casita volcano are uncertain and may pertain to other Marrabios Range volcanoes.
Information Contacts: Instituto Nicaragüense de Estudios Territoriales (INETER), Apartado Postal 2110, Managua, Nicaragua (URL: http://www.ineter.gob.ni/); Washington Volcanic Ash Advisory Center (VAAC), Satellite Analysis Branch (SAB), NOAA/NESDIS E/SP23, NOAA Science Center Room 401, 5200 Auth Rd, Camp Springs, MD 20746, USA (URL: http://www.ospo.noaa.gov/Products/atmosphere/vaac/); La Prensa de Nicaragua (URL: http://www.laprensa.com.ni/2010/07/04/nacionales/30240); La Prensa de Honduras (URL: http://www.laprensa.hn); BBC: Latin America & Caribbean (URL: http://www.bbc.co.uk/news/world-latin-america-19533933).
Suwanosejima (Japan) — August 2012 Cite this Report
Suwanosejima
Japan
29.638°N, 129.714°E; summit elev. 796 m
All times are local (unless otherwise noted)
2011-2012 eruptions with plumes rising up to 1 km above crater rim
Our last report covered beharior at Suwanose-jima through July 2011 (BGVN 36:07). This report, compiling translated material from the Japan Meteorological Agency (JMA), covers ongoing activity through June 2012, with minor magnitude venting at Otake crater and the tallest plume rising to 1 km over the crater rim. Throughout the reporting period, the volcano's crater produced weak glow at night that was imaged by a high-sensitivity camera. The Alert Level remained at Level 2 (on a scale from 1-5, access to the crater area prohibited due to threat of eruption). As summarized in the text, numbers of A- and B-type events were in the ranges of 11-24 and 62-205, respectively. There were multiple cases of ashfall at [the village 4 km SSW] from the summit crater.
The table below summarizes some other information reported by JMA, including a tally of small eruption heights. Tremor duration extended to over 50 hours during several months and to 132 hours in June 2012.
Monthly coverage. Volcanic earthquakes and tremor continued during July and August 2011 (table 10). In August, seismic activity decreased; A- and B-type events occurred 24 and 62 times, respectively. A-type earthquakes are generally considered to have shallow focal depths; B-type earthquakes, deeper focal depths.
Table 10. A compilation of data on Suwanose-jima during July 2011 through June 2012. "--" indicates data not reported. Data courtesy of JMA.
| Month |
Explosive Eruptions |
Tremor Duration (hh:mm) |
Max. plume height above rim (m) |
Other Activity |
| Jul 2011 |
0 |
-- |
400 |
Prolonged activity |
| Aug 2011 |
0 |
15:23 |
300 |
Prolonged activity |
| Sep 2011 |
2 |
64:00 |
300-1,300 |
Small eruptions on 8,9,11, and 12 Sep |
| Oct 2011 |
0 |
18:51 |
1,000 |
Small eruption on 1 Oct |
| Nov 2011 |
0 |
28:30 |
600 |
Small eruption on 15 Nov |
| Dec 2011 |
0 |
-- |
400 |
-- |
| Jan 2012 |
1 |
69:24 |
300 |
-- |
| Feb 2012 |
1 |
00:58 |
400 |
-- |
| Mar 2012 |
1 |
00:17 |
~200 |
-- |
| Apr 2012 |
0 |
09:26 |
300 |
-- |
| May 2012 |
0 |
40:11 |
600 |
Very small eruptions on 25,26, and 28-30 May |
| Jun 2012 |
0 |
132:24 |
300 |
Very small eruptions |
Explosive eruptions from Otake crater occurred on 9 and 12 September 2011. A temporal increase in seismicity, including intermittent tremor, was observed during 9-14 September, later dropping to background level. Ash fell [in the village] on 7, 9, 12, 15, and 18 September.
Small-scale eruptions were observed in October and November 2011. Ashfall was reported [in the village] on 15 November.
Aerial observations were conducted in cooperation with the Japan Maritime Self Defense Force (JMSDF) on 19 December 2011. They revealed a high temperature area at the center of Otake crater.
GPS measurements showed no remarkable crustal change between January and June 2012. GPS data from Tongama ceased starting in mid-May due to a technical failure.
No explosive eruptions occurred in April 2012. Instruments detected 21 A-type events and 85 B-type events.
During May, there were 11 A-type events and 205 B-type events. Noteable volcanic tremor occurred on 5 and 25-26 May. [Residents in the village] registered ashfall on 25 and 28-30 May.
[Village residents] again reported ashfall on 11 and 13-14 June 2012. During June instruments detected 21 A-type events and 116 B-type events. Volcanic tremor was registered during 2?22 June 2012 (table 10).
Geologic Background. The 8-km-long island of Suwanosejima in the northern Ryukyu Islands consists of an andesitic stratovolcano with two active summit craters. The summit is truncated by a large breached crater extending to the sea on the E flank that was formed by edifice collapse. One of Japan's most frequently active volcanoes, it was in a state of intermittent Strombolian activity from Otake, the NE summit crater, between 1949 and 1996, after which periods of inactivity lengthened. The largest recorded eruption took place in 1813-14, when thick scoria deposits covered residential areas, and the SW crater produced two lava flows that reached the western coast. At the end of the eruption the summit of Otake collapsed, forming a large debris avalanche and creating an open collapse scarp extending to the eastern coast. The island remained uninhabited for about 70 years after the 1813-1814 eruption. Lava flows reached the eastern coast of the island in 1884. Only about 50 people live on the island.
Information Contacts: Japan Meteorological Agency (JMA), Otemachi, 1-3-4, Chiyoda-ku Tokyo 100-8122, Japan (URL: http://www.jma.go.jp/).