Recently Published Bulletin Reports
Manam (Papua New Guinea) Few ash plumes during November-December 2022
Krakatau (Indonesia) Strombolian activity and ash plumes during November 2022-April 2023
Stromboli (Italy) Strombolian explosions and lava flows continue during January-April 2023
Nishinoshima (Japan) Small ash plumes and fumarolic activity during November 2022 through April 2023
Karangetang (Indonesia) Lava flows, incandescent avalanches, and ash plumes during January-June 2023
Ahyi (United States) Intermittent hydroacoustic signals and discolored plumes during November 2022-June 2023
Kadovar (Papua New Guinea) An ash plume and weak thermal anomaly during May 2023
San Miguel (El Salvador) Small gas-and-ash explosions during March and May 2023
Semisopochnoi (United States) Occasional explosions, ash deposits, and gas-and-steam plumes during December 2022-May 2023
Ebeko (Russia) Continued explosions, ash plumes, and ashfall during October 2022-May 2023
Home Reef (Tonga) Discolored plumes continued during November 2022-April 2023
Ambae (Vanuatu) New lava flow, ash plumes, and sulfur dioxide plumes during February-May 2023
Manam (Papua New Guinea) — July 2023  Cite this Report
Manam
Papua New Guinea
4.08°S, 145.037°E; summit elev. 1807 m
All times are local (unless otherwise noted)
Few ash plumes during November-December 2022
Manam is a 10-km-wide island that consists of two active summit craters: the Main summit crater and the South summit crater and is located 13 km off the northern coast of mainland Papua New Guinea. Frequent mild-to-moderate eruptions have been recorded since 1616. The current eruption period began during June 2014 and has more recently been characterized by intermittent ash plumes and thermal activity (BGVN 47:11). This report updates activity that occurred from November 2022 through May 2023 based on information from the Darwin Volcanic Ash Advisory Center (VAAC) and various satellite data.
Ash plumes were reported during November and December 2022 by the Darwin VAAC. On 7 November an ash plume rose to 2.1 km altitude and drifted NE based on satellite images and weather models. On 14 November an ash plume rose to 2.1 km altitude and drifted W based on RVO webcam images. On 20 November ash plumes rose to 1.8 km altitude and drifted NW. On 26 December an ash plume rose to 3 km altitude and drifted S and SSE.
Intermittent sulfur dioxide plumes were detected using the TROPOMI instrument on the Sentinel-5P satellite, some of which exceeded at least two Dobson Units (DU) and drifted in different directions (figure 93). Occasional low-to-moderate power thermal anomalies were recorded by the MIROVA (Middle InfraRed Observation of Volcanic Activity) system; less than five anomalies were recorded each month during November 2022 through May 2023 (figure 94). Two thermal hotspots were detected by the MODVOLC thermal alerts system on 10 December 2022. On clear weather days, thermal activity was also captured in infrared satellite imagery in both the Main and South summit craters, accompanied by gas-and-steam emissions (figure 95).
Geologic Background. The 10-km-wide island of Manam, lying 13 km off the northern coast of mainland Papua New Guinea, is one of the country's most active volcanoes. Four large radial valleys extend from the unvegetated summit of the conical basaltic-andesitic stratovolcano to its lower flanks. These valleys channel lava flows and pyroclastic avalanches that have sometimes reached the coast. Five small satellitic centers are located near the island's shoreline on the northern, southern, and western sides. Two summit craters are present; both are active, although most observed eruptions have originated from the southern crater, concentrating eruptive products during much of the past century into the SE valley. Frequent eruptions, typically of mild-to-moderate scale, have been recorded since 1616. Occasional larger eruptions have produced pyroclastic flows and lava flows that reached flat-lying coastal areas and entered the sea, sometimes impacting populated areas.
Information Contacts: Rabaul Volcano Observatory (RVO), Geohazards Management Division, Department of Mineral Policy and Geohazards Management (DMPGM), PO Box 3386, Kokopo, East New Britain Province, Papua New Guinea; Darwin Volcanic Ash Advisory Centre (VAAC), Bureau of Meteorology, Northern Territory Regional Office, PO Box 40050, Casuarina, NT 0811, Australia (URL: http://www.bom.gov.au/info/vaac/); MIROVA (Middle InfraRed Observation of Volcanic Activity), a collaborative project between the Universities of Turin and Florence (Italy) supported by the Centre for Volcanic Risk of the Italian Civil Protection Department (URL: http://www.mirovaweb.it/); Hawai'i Institute of Geophysics and Planetology (HIGP) - MODVOLC Thermal Alerts System, School of Ocean and Earth Science and Technology (SOEST), Univ. of Hawai'i, 2525 Correa Road, Honolulu, HI 96822, USA (URL: http://modis.higp.hawaii.edu/); NASA Global Sulfur Dioxide Monitoring Page, Atmospheric Chemistry and Dynamics Laboratory, NASA Goddard Space Flight Center (NASA/GSFC), 8800 Greenbelt Road, Goddard, Maryland, USA (URL: https://so2.gsfc.nasa.gov/); Copernicus Browser, Copernicus Data Space Ecosystem, European Space Agency (URL: https://dataspace.copernicus.eu/browser/).
Krakatau (Indonesia) — July 2023 Cite this Report
Krakatau
Indonesia
6.1009°S, 105.4233°E; summit elev. 285 m
All times are local (unless otherwise noted)
Strombolian activity and ash plumes during November 2022-April 2023
Krakatau is located in the Sunda Strait between Java and Sumatra, Indonesia. Caldera collapse during the catastrophic 1883 eruption destroyed Danan and Perbuwatan cones and left only a remnant of Rakata. The post-collapse cone of Anak Krakatau (Child of Krakatau) was constructed within the 1883 caldera at a point between the former Danan and Perbuwatan cones; it has been the site of frequent eruptions since 1927. The current eruption period began in May 2021 and has recently consisted of explosions, ash plumes, and thermal activity (BGVN 47:11). This report covers activity during November 2022 through April 2023 based on information provided by the Indonesian Center for Volcanology and Geological Hazard Mitigation, referred to as Pusat Vulkanologi dan Mitigasi Bencana Geologi (PVMBG), MAGMA Indonesia, the Darwin Volcanic Ash Advisory Center (VAAC), and several sources of satellite data.
Activity was relatively low during November and December 2022. Daily white gas-and-steam plumes rose 25-100 m above the summit and drifted in different directions. Gray ash plumes rose 200 m above the summit and drifted NE at 1047 and at 2343 on 11 November. On 14 November at 0933 ash plumes rose 300 m above the summit and drifted E. An ash plume was reported at 0935 on 15 December that rose 100 m above the summit and drifted NE. An eruptive event at 1031 later that day generated an ash plume that rose 700 m above the summit and drifted NE. A gray ash plume at 1910 rose 100 m above the summit and drifted E. Incandescent material was ejected above the vent based on an image taken at 1936.
During January 2023 daily white gas-and-steam plumes rose 25-300 m above the summit and drifted in multiple directions. Gray-to-brown ash plumes were reported at 1638 on 3 January, at 1410 and 1509 on 4 January, and at 0013 on 5 January that rose 100-750 m above the summit and drifted NE and E; the gray-to-black ash plume at 1509 on 4 January rose as high as 3 km above the summit and drifted E. Gray ash plumes were recorded at 1754, 2241, and 2325 on 11 January and at 0046 on 12 January and rose 200-300 m above the summit and drifted NE. Toward the end of January, PVMBG reported that activity had intensified; Strombolian activity was visible in webcam images taken at 0041, 0043, and 0450 on 23 January. Multiple gray ash plumes throughout the day rose 200-500 m above the summit and drifted E and SE (figure 135). Webcam images showed progressively intensifying Strombolian activity at 1919, 1958, and 2113 on 24 January; a gray ash plume at 1957 rose 300 m above the summit and drifted E (figure 135). Eruptive events at 0231 and 2256 on 25 January and at 0003 on 26 January ejected incandescent material from the vent, based on webcam images. Gray ash plumes observed during 26-27 January rose 300-500 m above the summit and drifted NE, E, and SE.
Low levels of activity were reported during February and March. Daily white gas-and-steam plumes rose 25-300 m above the summit and drifted in different directions. The Darwin VAAC reported that continuous ash emissions rose to 1.5-1.8 km altitude and drifted W and NW during 1240-1300 on 10 March, based on satellite images, weather models, and PVMBG webcams. White-and-gray ash plumes rose 500 m and 300 m above the summit and drifted SW at 1446 and 1846 on 18 March, respectively. An eruptive event was recorded at 2143, though it was not visible due to darkness. Multiple ash plumes were reported during 27-29 March that rose as high as 2.5 km above the summit and drifted NE, W, and SW (figure 136). Webcam images captured incandescent ejecta above the vent at 0415 and around the summit area at 2003 on 28 March and at 0047 above the vent on 29 March.
Daily white gas-and-steam plumes rose 25-300 m above the summit and drifted in multiple directions during April and May. White-and-gray and black plumes rose 50-300 m above the summit on 2 and 9 April. On 11 May at 1241 a gray ash plume rose 1-3 km above the summit and drifted SW. On 12 May at 0920 a gray ash plume rose 2.5 km above the summit and drifted SW and at 2320 an ash plume rose 1.5 km above the summit and drifted SW. An accompanying webcam image showed incandescent ejecta. On 13 May at 0710 a gray ash plume rose 2 km above the summit and drifted SW (figure 137).
The MIROVA (Middle InfraRed Observation of Volcanic Activity) graph of MODIS thermal anomaly data showed intermittent low-to-moderate power thermal anomalies during November 2022 through April 2023 (figure 138). Some of this thermal activity was also visible in infrared satellite imagery at the crater, accompanied by gas-and-steam and ash plumes that drifted in different directions (figure 139).
Geologic Background. The renowned Krakatau (frequently mis-named as Krakatoa) volcano lies in the Sunda Strait between Java and Sumatra. Collapse of an older edifice, perhaps in 416 or 535 CE, formed a 7-km-wide caldera. Remnants of that volcano are preserved in Verlaten and Lang Islands; subsequently the Rakata, Danan, and Perbuwatan cones were formed, coalescing to create the pre-1883 Krakatau Island. Caldera collapse during the catastrophic 1883 eruption destroyed Danan and Perbuwatan, and left only a remnant of Rakata. This eruption caused more than 36,000 fatalities, most as a result of tsunamis that swept the adjacent coastlines of Sumatra and Java. Pyroclastic surges traveled 40 km across the Sunda Strait and reached the Sumatra coast. After a quiescence of less than a half century, the post-collapse cone of Anak Krakatau (Child of Krakatau) was constructed within the 1883 caldera at a point between the former Danan and Perbuwatan cones. Anak Krakatau has been the site of frequent eruptions since 1927.
Information Contacts: Pusat Vulkanologi dan Mitigasi Bencana Geologi (PVMBG, also known as Indonesian Center for Volcanology and Geological Hazard Mitigation, CVGHM), Jalan Diponegoro 57, Bandung 40122, Indonesia (URL: http://www.vsi.esdm.go.id/); MAGMA Indonesia, Kementerian Energi dan Sumber Daya Mineral (URL: https://magma.esdm.go.id/v1); Darwin Volcanic Ash Advisory Centre (VAAC), Bureau of Meteorology, Northern Territory Regional Office, PO Box 40050, Casuarina, NT 0811, Australia (URL: http://www.bom.gov.au/info/vaac/); MIROVA (Middle InfraRed Observation of Volcanic Activity), a collaborative project between the Universities of Turin and Florence (Italy) supported by the Centre for Volcanic Risk of the Italian Civil Protection Department (URL: http://www.mirovaweb.it/); Copernicus Browser, Copernicus Data Space Ecosystem, European Space Agency (URL: https://dataspace.copernicus.eu/browser/).
Stromboli
Italy
38.789°N, 15.213°E; summit elev. 924 m
All times are local (unless otherwise noted)
Strombolian explosions and lava flows continue during January-April 2023
Stromboli, located in Italy, has exhibited nearly constant lava fountains for the past 2,000 years; recorded eruptions date back to 350 BCE. Eruptive activity occurs at the summit from multiple vents, which include a north crater area (N area) and a central-southern crater (CS area) on a terrace known as the ‘terrazza craterica’ at the head of the Sciara del Fuoco, a large scarp that runs from the summit down the NW side of the volcano-island. Activity typically consists of Strombolian explosions, incandescent ejecta, lava flows, and pyroclastic flows. Thermal and visual monitoring cameras are located on the nearby Pizzo Sopra La Fossa, above the terrazza craterica, and at multiple flank locations. The current eruption period has been ongoing since 1934 and recent activity has consisted of frequent Strombolian explosions and lava flows (BGVN 48:02). This report updates activity during January through April 2023 primarily characterized by Strombolian explosions and lava flows based on reports from Italy's Istituto Nazionale di Geofisica e Vulcanologia (INGV) and various satellite data.
Frequent explosive activity continued throughout the reporting period, generally in the low-to-medium range, based on the number of hourly explosions in the summit crater (figure 253, table 16). Intermittent thermal activity was recorded by the MIROVA (Middle InfraRed Observation of Volcanic Activity) analysis of MODIS satellite data (figure 254). According to data collected by the MODVOLC thermal algorithm, a total of 9 thermal alerts were detected: one on 2 January 2023, one on 1 February, five on 24 March, and two on 26 March. The stronger pulses of thermal activity likely reflected lava flow events. Infrared satellite imagery captured relatively strong thermal hotspots at the two active summit craters on clear weather days, showing an especially strong event on 8 March (figure 255).
Table 16. Summary of type, frequency, and intensity of explosive activity at Stromboli by month during January-April 2023; information from webcam observations. Courtesy of INGV weekly reports.
| Month |
Explosive Activity |
| Jan 2023 |
Typical Strombolian activity with spattering and lava overflows in the N crater area. Explosions were reported from 4 vents in the N area and 1-2 vents in the CS area. The average hourly frequency of explosions was low-to-medium (1-12 events/hour). The intensity of the explosions varied from low (less than 80 m high) to medium (less than 150 m high) in the N crater area and up to high (greater than 150 m high) in the CS crater area. |
| Feb 2023 |
Typical Strombolian activity with spattering in the N crater area. Explosions were reported from 2-3 vents in the N area and 1-4 vents in the CS area. The average hourly frequency of explosions was low-to-medium (1-14 events/hour). The intensity of the explosions varied from low (less than 80 m high) to medium (less than 150 m high) in the N crater area and up to high (greater than 150 m high) in the CS crater area. |
| Mar 2023 |
Typical Strombolian activity with spattering and lava overflows in the N crater area. Explosions were reported from 2-3 vents in the N area and 2-4 vents in the CS area. The average hourly frequency of explosions was low-to-medium (1-18 events/hour). The intensity of the explosions varied from low (less than 80 m high) to medium (less than 150 m high) in the N crater area and up to high (greater than 150 m high) in the CS crater area. |
| Apr 2023 |
Typical Strombolian activity. Explosions were reported from 2 vents in the N area and 2-3 vents in the CS area. The average hourly frequency of explosions was low-to-high (1-16 events/hour). The intensity of the explosions varied from low (less than 80 m high) to medium (less than 150 m high) in both the N and CS crater areas. |
Activity during January-February 2023. Strombolian explosions were reported in the N crater area, as well as lava effusion. Explosive activity in the N crater area ejected coarse material (bombs and lapilli). Intense spattering was observed in both the N1 and N2 craters. In the CS crater area, explosions generally ejected fine material (ash), sometimes to heights greater than 250 m. The intensity of the explosions was characterized as low-to-medium in the N crater and medium-to-high in the CS crater. After intense spattering activity from the N crater area, a lava overflow began at 2136 on 2 January that flowed part way down the Sciara del Fuoco, possibly moving down the drainage that formed in October, out of view from webcams. The flow remained active for a couple of hours before stopping and beginning to cool. A second lava flow was reported at 0224 on 4 January that similarly remained active for a few hours before stopping and cooling. Intense spattering was observed on 11 and 13 January from the N1 crater. After intense spattering activity at the N2 crater at 1052 on 17 January another lava flow started to flow into the upper part of the Sciara del Fuoco (figure 256), dividing into two: one that traveled in the direction of the drainage formed in October, and the other one moving parallel to the point of emission. By the afternoon, the rate of the flow began to decrease, and at 1900 it started to cool. A lava flow was reported at 1519 on 24 January following intense spattering in the N2 area, which began to flow into the upper part of the Sciara del Fuoco. By the morning of 25 January, the lava flow had begun to cool. During 27 January the frequency of eruption in the CS crater area increased to 6-7 events/hour compared to the typical 1-7 events/hour; the following two days showed a decrease in frequency to less than 1 event/hour. Starting at 1007 on 30 January a high-energy explosive sequence was produced by vents in the CS crater area. The sequence began with an initial energetic pulse that lasted 45 seconds, ejecting predominantly coarse products 300 m above the crater that fell in an ESE direction. Subsequent and less intense explosions ejected material 100 m above the crater. The total duration of this event lasted approximately two minutes. During 31 January through 6, 13, and 24 February spattering activity was particularly intense for short periods in the N2 crater.
An explosive sequence was reported on 16 February that was characterized by a major explosion in the CS crater area (figure 257). The sequence began at 1817 near the S2 crater that ejected material radially. A few seconds later, lava fountains were observed in the central part of the crater. Three explosions of medium intensity (material was ejected less than 150 m high) were recorded at the S2 crater. The first part of this sequence lasted approximately one minute, according to INGV, and material rose 300 m above the crater and then was deposited along the Sciara del Fuoco. The second phase began at 1818 at the S1 crater; it lasted seven seconds and material was ejected 150 m above the crater. Another event 20 seconds later lasted 12 seconds, also ejecting material 150 m above the crater. The sequence ended with at least three explosions of mostly fine material from the S1 crater. The total duration of this sequence was about two minutes.
Short, intense spattering activity was noted above the N1 crater on 27 and 28 February. A lava overflow was first reported at 0657 from the N2 crater on 27 February that flowed into the October 2022 drainage. By 1900 the flow had stopped. A second lava overflow also in the N crater area occurred at 2149, which overlapped the first flow and then stopped by 0150 on 28 February. Material detached from both the lava overflows rolled down the Sciara del Fuoco, some of which was visible in webcam images.
Activity during March-April 2023. Strombolian activity continued with spattering activity and lava overflows in the N crater area during March. Explosive activity at the N crater area varied from low (less than 80 m high) to medium (less than 150 m high) and ejected coarse material, such as bombs and lapilli. Spattering was observed above the N1 crater, while explosive activity at the CS crater area varied from medium to high (greater than 150 m high) and ejected coarse material. Intense spattering activity was observed for short periods on 6 March above the N1 crater. At approximately 0610 a lava overflow was reported around the N2 crater on 8 March, which then flowed into the October 2022 drainage. By 1700 the flow started to cool. A second overflow began at 1712 on 9 March and overlapped the previous flow. It had stopped by 2100. Material from both flows was deposited along the Sciara del Fuoco, though much of the activity was not visible in webcam images. On 11 March a lava overflow was observed at 0215 that overlapped the two previous flows in the October 2022 drainage. By late afternoon on 12 March, it had stopped.
During a field excursion on 16 March, scientists noted that a vent in the central crater area was degassing. Another vent showed occasional Strombolian activity that emitted ash and lapilli. During 1200-1430 low-to-medium intense activity was reported; the N1 crater emitted ash emissions and the N2 crater emitted both ash and coarse material. Some explosions also occurred in the CS crater area that ejected coarse material. The C crater in the CS crater area occasionally showed gas jetting and low intensity explosions on 17 and 22 March; no activity was observed at the S1 crater. Intense, longer periods of spattering were reported in the N1 crater on 19, 24, and 25 March. Around 2242 on 23 March a lava overflow began from the N1 crater that, after about an hour, began moving down the October 2022 drainage and flow along the Sciara del Fuoco (figure 258). Between 0200 and 0400 on 26 March the flow rate increased, which generated avalanches of material from collapses at the advancing flow front. By early afternoon, the flow began to cool. On 25 March at 1548 an explosive sequence began from one of the vents at S2 in the CS crater area (figure 258). Fine ash mixed with coarse material was ejected 300 m above the crater rim and drifted SSE. Some modest explosions around Vent C were detected at 1549 on 25 March, which included an explosion at 1551 that ejected coarse material. The entire explosive sequence lasted approximately three minutes.
During April explosions persisted in both the N and CS crater areas. Fine material was ejected less than 80 m above the N crater rim until 6 April, followed by ejection of coarser material. Fine material was also ejected less than 80 m above the CS crater rim. The C and S2 crater did not show significant eruptive activity. On 7 April an explosive sequence was detected in the CS crater area at 1203 (figure 259). The first explosion lasted approximately 18 seconds and ejected material 400 m above the crater rim, depositing pyroclastic material in the upper part of the Sciara del Fuoco. At 1204 a second, less intense explosion lasted approximately four seconds and deposited pyroclastic products outside the crater area and near Pizzo Sopra La Fossa. A third explosion at 1205 was mainly composed of ash that rose about 150 m above the crater and lasted roughly 20 seconds. A fourth explosion occurred at 1205 about 28 seconds after the third explosion and ejected a mixture of coarse and fine material about 200 m above the crater; the explosion lasted roughly seven seconds. Overall, the entire explosive sequence lasted about two minutes and 20 seconds. After the explosive sequence on 7 April, explosions in both the N and CS crater areas ejected material as high as 150 m above the crater.
On 21 April research scientists from INGV made field observations in the summit area of Stromboli, and some lapilli samples were collected. In the N crater area near the N1 crater, a small cone was observed with at least two active vents, one of which was characterized by Strombolian explosions. The other vent produced explosions that ejected ash and chunks of cooled lava. At the N2 crater at least one vent was active and frequently emitted ash. In the CS crater area, a small cone contained 2-3 degassing vents and a smaller, possible fissure area also showed signs of degassing close to the Pizzo Sopra La Fossa. In the S part of the crater, three vents were active: a small hornito was characterized by modest and rare explosions, a vent that intermittently produced weak Strombolian explosions, and a vent at the end of the terrace that produced frequent ash emissions. Near the S1 crater there was a hornito that generally emitted weak gas-and-steam emissions, sometimes associated with “gas rings”. On 22 April another field inspection was carried out that reported two large sliding surfaces on the Sciara del Fuoco that showed where blocks frequently descended toward the sea. A thermal anomaly was detected at 0150 on 29 April.
Geologic Background. Spectacular incandescent nighttime explosions at Stromboli have long attracted visitors to the "Lighthouse of the Mediterranean" in the NE Aeolian Islands. This volcano has lent its name to the frequent mild explosive activity that has characterized its eruptions throughout much of historical time. The small island is the emergent summit of a volcano that grew in two main eruptive cycles, the last of which formed the western portion of the island. The Neostromboli eruptive period took place between about 13,000 and 5,000 years ago. The active summit vents are located at the head of the Sciara del Fuoco, a prominent scarp that formed about 5,000 years ago due to a series of slope failures which extends to below sea level. The modern volcano has been constructed within this scarp, which funnels pyroclastic ejecta and lava flows to the NW. Essentially continuous mild Strombolian explosions, sometimes accompanied by lava flows, have been recorded for more than a millennium.
Information Contacts: Istituto Nazionale di Geofisica e Vulcanologia (INGV), Sezione di Catania, Piazza Roma 2, 95123 Catania, Italy, (URL: http://www.ct.ingv.it/en/); MIROVA (Middle InfraRed Observation of Volcanic Activity), a collaborative project between the Universities of Turin and Florence (Italy) supported by the Centre for Volcanic Risk of the Italian Civil Protection Department (URL: http://www.mirovaweb.it/); Hawai'i Institute of Geophysics and Planetology (HIGP) - MODVOLC Thermal Alerts System, School of Ocean and Earth Science and Technology (SOEST), Univ. of Hawai'i, 2525 Correa Road, Honolulu, HI 96822, USA (URL: http://modis.higp.hawaii.edu/); Copernicus Browser, Copernicus Data Space Ecosystem, European Space Agency (URL: https://dataspace.copernicus.eu/browser/).
Nishinoshima (Japan) — July 2023 Cite this Report
Nishinoshima
Japan
27.247°N, 140.874°E; summit elev. 100 m
All times are local (unless otherwise noted)
Small ash plumes and fumarolic activity during November 2022 through April 2023
Nishinoshima is a small island located about 1,000 km S of Tokyo in the Ogasawara Arc in Japan. The island is the summit of a massive submarine volcano that has prominent peaks to the S, W, and NE. Eruptions date back to 1973; the most recent eruption period began in October 2022 and was characterized by ash plumes and fumarolic activity (BGVN 47:12). This report describes ash plumes and fumarolic activity during November 2022 through April 2023 based on monthly reports from the Japan Meteorological Agency (JMA) monthly reports and satellite data.
The most recent eruptive activity prior to the reporting internal occurred on 12 October 2022, when an ash plume rose 3.5 km above the crater rim. An aerial observation conducted by the Japan Coast Guard (JCG) on 25 November reported that white fumaroles rose approximately 200 m above the central crater of a pyroclastic cone (figure 119), and multiple plumes were observed on the ESE flank of the cone. Discolored water ranging from reddish-brown to brown and yellowish-green were visible around the perimeter of the island (figure 119). No significant activity was reported in December.
During an overflight conducted by JCG on 25 January 2023 intermittent activity and small, blackish-gray plumes rose 900 m above the central part of the crater were observed (figure 120). The fumarolic zone of the E flank and base of the cone had expanded and emissions had intensified. Dark brown discolored water was visible around the perimeter of the island.
No significant activity was reported during February through March. Ash plumes at 1050 and 1420 on 11 April rose 1.9 km above the crater rim and drifted NW and N. These were the first ash plumes observed since 12 October 2022. On 14 April JCG carried out an overflight and reported that no further eruptive activity was visible, although white gas-and-steam plumes were visible from the central crater and rose 900 m high (figure 121). Brownish and yellow-green discolored water surrounded the island.
Intermittent low-to-moderate power thermal anomalies were recorded in the MIROVA graph (Middle InfraRed Observation of Volcanic Activity) during November 2022 through April 2023 (figure 123). A cluster of six to eight anomalies were detected during November while a smaller number were detected during the following months: two to three during December, one during mid-January 2023, one during February, five during March, and two during April. Thermal activity was also reflected in infrared satellite data at the summit crater, accompanied by occasional gas-and-steam plumes (figure 124).
Geologic Background. The small island of Nishinoshima was enlarged when several new islands coalesced during an eruption in 1973-74. Multiple eruptions that began in 2013 completely covered the previous exposed surface and continued to enlarge the island. The island is the summit of a massive submarine volcano that has prominent peaks to the S, W, and NE. The summit of the southern cone rises to within 214 m of the ocean surface 9 km SSE.
Information Contacts: Japan Meteorological Agency (JMA), 1-3-4 Otemachi, Chiyoda-ku, Tokyo 100-8122, Japan (URL: http://www.jma.go.jp/jma/indexe.html); MIROVA (Middle InfraRed Observation of Volcanic Activity), a collaborative project between the Universities of Turin and Florence (Italy) supported by the Centre for Volcanic Risk of the Italian Civil Protection Department (URL: http://www.mirovaweb.it/); Copernicus Browser, Copernicus Data Space Ecosystem, European Space Agency (URL: https://dataspace.copernicus.eu/browser/).
Karangetang (Indonesia) — July 2023 Cite this Report
Karangetang
Indonesia
2.781°N, 125.407°E; summit elev. 1797 m
All times are local (unless otherwise noted)
Lava flows, incandescent avalanches, and ash plumes during January-June 2023
Karangetang (also known as Api Siau), at the northern end of the island of Siau, Indonesia, contains five summit craters along a N-S line. More than 40 eruptions have been recorded since 1675; recent eruptions have included frequent explosive activity, sometimes accompanied by pyroclastic flows and lahars. Lava dome growth has occurred in the summit craters and collapses of lava flow fronts have produced pyroclastic flows. The two active summit craters are Kawah Dua (the N crater) and Kawah Utama (the S crater, also referred to as the “Main Crater”). The most recent eruption began in late November 2018 and has more recently consisted of weak thermal activity and gas-and-steam emissions (BGVN 48:01). This report updates activity characterized by lava flows, incandescent avalanches, and ash plumes during January through June 2023 using reports from Pusat Vulkanologi dan Mitigasi Bencana Geologi (PVMBG, also known as CVGHM, or the Center of Volcanology and Geological Hazard Mitigation), MAGMA Indonesia, the Darwin VAAC (Volcano Ash Advisory Center), and satellite data.
Activity during January was relatively low and mainly consisted of white gas-and-steam emissions that rose 25-150 m above Main Crater (S crater) and drifted in different directions. Incandescence was visible from the lava dome in Kawah Dua (the N crater). Weather conditions often prevented clear views of the summit. On 18 January the number of seismic signals that indicated avalanches of material began to increase. In addition, there were a total of 71 earthquakes detected during the month.
Activity continued to increase during the first week of February. Material from Main Crater traveled as far as 800 m down the Batuawang (S) and Batang (W) drainages and as far as 1 km W down the Beha (W) drainage on 4 February. On 6 February 43 earthquake events were recorded, and on 7 February, 62 events were recorded. White gas-and-steam emissions rose 25-250 m above both summit craters throughout the month. PVMBG reported an eruption began during the evening of 8 February around 1700. Photos showed incandescent material at Main Crater. Incandescent material had also descended the flank in at least two unconfirmed directions as far as 2 km from Main Crater, accompanied by ash plumes (figure 60). As a result, PVMBG increased the Volcano Alert Level (VAL) to 3 (the second highest level on a 1-4 scale).
Occasional nighttime webcam images showed three main incandescent lava flows of differing lengths traveling down the S, SW, and W flanks (figure 61). Incandescent rocks were visible on the upper flanks, possibly from ejected or collapsed material from the crater, and incandescence was the most intense at the summit. Based on analyses of satellite imagery and weather models, the Darwin VAAC reported that daily ash plumes during 16-20 February rose to 2.1-3 km altitude and drifted NNE, E, and SE. BNPB reported on 16 February that as many as 77 people were evacuated and relocated to the East Siau Museum. A webcam image taken at 2156 on 17 February possibly showed incandescent material descending the SE flank. Ash plumes rose to 2.1 km altitude and drifted SE during 22-23 February, according to the Darwin VAAC.
Incandescent avalanches of material and summit incandescence at Main Crater continued during March. White gas-and-steam emissions during March generally rose 25-150 m above the summit crater; on 31 March gas-and-steam emissions rose 200-400 m high. An ash plume rose to 2.4 km altitude and drifted S at 1710 on 9 March and a large thermal anomaly was visible in images taken at 0550 and 0930 on 10 March. Incandescent material was visible at the summit and on the flanks based on webcam images taken at 0007 and 2345 on 16 March, at 1828 on 17 March, at 1940 on 18 March, at 2311 on 19 March, and at 2351 on 20 March. Incandescence was most intense on 18 and 20 March and webcam images showed possible Strombolian explosions (figure 62). An ash plume rose to 2.4 km altitude and drifted SW on 18 March, accompanied by a thermal anomaly.
Summit crater incandescence at Main Crater and on the flanks persisted during April. Incandescent material at the S crater and on the flanks was reported at 0016 on 1 April. The lava flows had stopped by 1 April according to PVMBG, although incandescence was still visible up to 10 m high. Seismic signals indicating effusion decreased and by 6 April they were no longer detected. Incandescence was visible from both summit craters. On 26 April the VAL was lowered to 2 (the second lowest level on a 1-4 scale). White gas-and-steam emissions rose 25-200 m above the summit crater.
During May white gas-and-steam emissions generally rose 50-250 m above the summit, though it was often cloudy, which prevented clear views; on 21 May gas-and-steam emissions rose 50-400 m high. Nighttime N summit crater incandescence rose 10-25 m above the lava dome, and less intense incandescence was noted above Main Crater, which reached about 10 m above the dome. Sounds of falling rocks at Main Crater were heard on 15 May and the seismic network recorded 32 rockfall events in the crater on 17 May. Avalanches traveled as far as 1.5 km down the SW and S flanks, accompanied by rumbling sounds on 18 May. Incandescent material descending the flanks was captured in a webcam image at 2025 on 19 May (figure 63) and on 29 May; summit crater incandescence was observed in webcam images at 2332 on 26 May and at 2304 on 29 May. On 19 May the VAL was again raised to 3.
Occasional Main Crater incandescence was reported during June, as well as incandescent material on the flanks. White gas-and-steam emissions rose 10-200 m above the summit crater. Ash plumes rose to 2.1 km altitude and drifted SE and E during 2-4 June, according to the Darwin VAAC. Material on the flanks of Main Crater were observed at 2225 on 7 June, at 2051 on 9 June, at 0007 on 17 June, and at 0440 on 18 June. Webcam images taken on 21, 25, and 27 June showed incandescence at Main Crater and from material on the flanks.
MIROVA (Middle InfraRed Observation of Volcanic Activity) analysis of MODIS satellite data showed strong thermal activity during mid-February through March and mid-May through June, which represented incandescent avalanches and lava flows (figure 64). During April through mid-May the power of the anomalies decreased but frequent anomalies were still detected. Brief gaps in activity occurred during late March through early April and during mid-June. Infrared satellite images showed strong lava flows mainly affecting the SW and S flanks, accompanied by gas-and-steam emissions (figure 65). According to data recorded by the MODVOLC thermal algorithm, there were a total of 79 thermal hotspots detected: 28 during February, 24 during March, one during April, five during May, and 21 during June.
Geologic Background. Karangetang (Api Siau) volcano lies at the northern end of the island of Siau, about 125 km NNE of the NE-most point of Sulawesi. The stratovolcano contains five summit craters along a N-S line. It is one of Indonesia's most active volcanoes, with more than 40 eruptions recorded since 1675 and many additional small eruptions that were not documented (Neumann van Padang, 1951). Twentieth-century eruptions have included frequent explosive activity sometimes accompanied by pyroclastic flows and lahars. Lava dome growth has occurred in the summit craters; collapse of lava flow fronts have produced pyroclastic flows.
Information Contacts: Pusat Vulkanologi dan Mitigasi Bencana Geologi (PVMBG, also known as Indonesian Center for Volcanology and Geological Hazard Mitigation, CVGHM), Jalan Diponegoro 57, Bandung 40122, Indonesia (URL: http://www.vsi.esdm.go.id/); MAGMA Indonesia, Kementerian Energi dan Sumber Daya Mineral (URL: https://magma.esdm.go.id/v1); Badan Nasional Penanggulangan Bencana (BNPB), National Disaster Management Agency, Graha BNPB - Jl. Scout Kav.38, East Jakarta 13120, Indonesia (URL: http://www.bnpb.go.id/); Darwin Volcanic Ash Advisory Centre (VAAC), Bureau of Meteorology, Northern Territory Regional Office, PO Box 40050, Casuarina, NT 0811, Australia (URL: http://www.bom.gov.au/info/vaac/); MIROVA (Middle InfraRed Observation of Volcanic Activity), a collaborative project between the Universities of Turin and Florence (Italy) supported by the Centre for Volcanic Risk of the Italian Civil Protection Department (URL: http://www.mirovaweb.it/); Hawai'i Institute of Geophysics and Planetology (HIGP) - MODVOLC Thermal Alerts System, School of Ocean and Earth Science and Technology (SOEST), Univ. of Hawai'i, 2525 Correa Road, Honolulu, HI 96822, USA (URL: http://modis.higp.hawaii.edu/); Copernicus Browser, Copernicus Data Space Ecosystem, European Space Agency (URL: https://dataspace.copernicus.eu/browser/); IDN Times, Jl. Jend. Gatot Subroto Kav. 27 3rd Floor Kuningan, Jakarta, Indonesia 12950, Status of Karangetang Volcano in Sitaro Islands Increases (URL: https://sulsel.idntimes.com/news/indonesia/savi/status-gunung-api-karangetang-di-kepulauan-sitaro-meningkat?page=all).
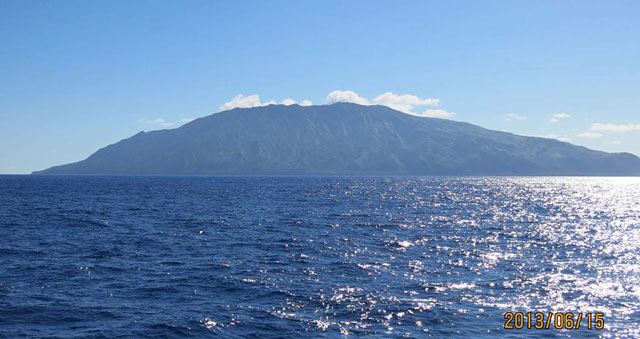
Ahyi (United States) — July 2023 Cite this Report
Ahyi
United States
20.42°N, 145.03°E; summit elev. -75 m
All times are local (unless otherwise noted)
Intermittent hydroacoustic signals and discolored plumes during November 2022-June 2023
Ahyi seamount is a large, conical submarine volcano that rises to within 75 m of the ocean surface about 18 km SE of the island of Farallon de Pajaros in the Northern Marianas. The remote location of the seamount has made eruptions difficult to document, but seismic stations installed in the region confirmed an eruption in the vicinity in 2001. No new activity was detected until April-May 2014 when an eruption was detected by NOAA (National Oceanic and Atmospheric Administration) divers, hydroacoustic sensors, and seismic stations (BGVN 42:04). New activity was first detected on 15 November by hydroacoustic sensors that were consistent with submarine volcanic activity. This report covers activity during November 2022 through June 2023 based on daily and weekly reports from the US Geological Survey.
Starting in mid-October, hydroacoustic sensors at Wake Island (2.2 km E) recorded signals consistent with submarine volcanic activity, according to a report from the USGS issued on 15 November 2022. A combined analysis of the hydroacoustic signals and seismic stations located at Guam and Chichijima Island, Japan, suggested that the source of this activity was at or near the Ahyi seamount. After a re-analysis of a satellite image of the area that was captured on 6 November, USGS confirmed that there was no evidence of discoloration at the ocean surface. Few hydroacoustic and seismic signals continued through November, including on 18 November, which USGS suggested signified a decline or pause in unrest. A VONA (Volcano Observatory Notice for Aviation) reported that a discolored water plume was persistently visible in satellite data starting on 18 November (figure 6). Though clouds often obscured clear views of the volcano, another discolored water plume was captured in a satellite image on 26 November. The Aviation Color Code (ACC) was raised to Yellow (the second lowest level on a four-color scale) and the Volcano Alert Level (VAL) was raised to Advisory (the second lowest level on a four-level scale) on 29 November.
During December, occasional detections were recorded on the Wake Island hydrophone sensors and discolored water over the seamount remained visible. During 2-7, 10-12, and 16-31 December possible explosion signals were detected. A small area of discolored water was observed in high-resolution Sentinel-2 satellite images during 1-6 December (figure 7). High-resolution satellite images recorded discolored water plumes on 13 December that originated from the summit region; no observations indicated that activity breached the ocean surface. A possible underwater plume was visible in satellite images on 18 December, and during 19-20 December a definite but diffuse underwater plume located SSE from the main vent was reported. An underwater plume was visible in a satellite image taken on 26 December (figure 7).
Hydrophone sensors continued to detect signals consistent with possible explosions during 1-8 January 2023. USGS reported that the number of detections decreased during 4-5 January. The hydrophone sensors experienced a data outage that started at 0118 on 8 January and continued through 10 January, though according to USGS, possible explosions were recorded prior to the data outage and likely continued during the outage. A discolored water plume originating from the summit region was detected in a partly cloudy satellite image on 8 January. On 11-12 and 15-17 January possible explosion signals were recorded again. One small signal was detected during 22-23 January and several signals were recorded on 25 and 31 January. During 27-31 January a plume of discolored water was observed above the seamount in satellite imagery (figure 8).
Low levels of activity continued during February and March, based on data from pressure sensors on Wake Island. During 1 and 4-6 February activity was reported, and a submarine plume was observed on 4 February (figure 8). Possible explosion signals were detected during 7-8, 10, 13-14, and 24 February. During 1-2 and 3-5 March a plume of discolored water was observed in satellite imagery (figure 8). Almost continuous hydroacoustic signals were detected in remote pressure sensor data on Wake Island 2,270 km E from the volcano during 7-13 March. During 12-13 March water discoloration around the seamount was observed in satellite imagery, despite cloudy weather. By 14 March discolored water extended about 35 km, but no direction was noted. USGS reported that the continuous hydroacoustic signals detected during 13-14 March stopped abruptly on 14 March and no new detections were observed. Three 30 second hydroacoustic detections were reported during 17-19 March, but no activity was visible due to cloudy weather. A data outage was reported during 21-22 March, making pressure sensor data unavailable; a discolored water plume was, however, visible in satellite data. A possible underwater explosion signal was detected by pressure sensors at Wake Island on 26, 29, and 31 March, though the cause and origin of these events were unclear.
Similar low activity continued during April, May, and June. Several signals were detected during 1-3 April in pressure sensors at Wake Island. USGS suggested that these may be related to underwater explosions or earthquakes at the volcano, but no underwater plumes were visible in clear satellite images. The pressure sensors had data outages during 12-13 April and no data were recorded; no underwater plumes were visible in satellite images, although cloudy weather obscured most clear views. Eruptive activity was reported starting at 2210 on 21 May. On 22 May a discolored water plume that extended 4 km was visible in satellite images, though no direction was recorded. During 23-24 May some signals were detected by the underwater pressure sensors. Possible hydroacoustic signals were detected during 2-3 and 6-8 June. Multiple hydroacoustic signals were detected during 9-11 and 16-17 June, although no activity was visible in satellite images. One hydroacoustic signal was detected during 23-24 June, but there was some uncertainty about its association with volcanic activity. A single possible hydroacoustic signal was detected during 30 June to 1 July.
Geologic Background. Ahyi seamount is a large conical submarine volcano that rises to within 75 m of the ocean surface ~18 km SE of the island of Farallon de Pajaros in the northern Marianas. Water discoloration has been observed there, and in 1979 the crew of a fishing boat felt shocks over the summit area, followed by upwelling of sulfur-bearing water. On 24-25 April 2001 an explosive eruption was detected seismically by a station on Rangiroa Atoll, Tuamotu Archipelago. The event was well constrained (+/- 15 km) at a location near the southern base of Ahyi. An eruption in April-May 2014 was detected by NOAA divers, hydroacoustic sensors, and seismic stations.
Information Contacts: US Geological Survey, Volcano Hazards Program (USGS-VHP), 12201 Sunrise Valley Drive, Reston, VA, USA, https://volcanoes.usgs.gov/index.html; Copernicus Browser, Copernicus Data Space Ecosystem, European Space Agency (URL: https://dataspace.copernicus.eu/browser/).
Kadovar (Papua New Guinea) — June 2023 Cite this Report
Kadovar
Papua New Guinea
3.608°S, 144.588°E; summit elev. 365 m
All times are local (unless otherwise noted)
An ash plume and weak thermal anomaly during May 2023
Kadovar is a 2-km-wide island that is the emergent summit of a Bismarck Sea stratovolcano. It lies off the coast of New Guinea, about 25 km N of the mouth of the Sepik River. Prior to an eruption that began in 2018, a lava dome formed the high point of the volcano, filling an arcuate landslide scarp open to the S. Submarine debris-avalanche deposits occur to the S of the island. The current eruption began in January 2018 and has comprised lava effusion from vents at the summit and at the E coast; more recent activity has consisted of ash plumes, weak thermal activity, and gas-and-steam plumes (BGVN 48:02). This report covers activity during February through May 2023 using information from the Darwin Volcanic Ash Advisory Center (VAAC) and satellite data.
Activity during the reporting period was relatively low and mainly consisted of white gas-and-steam plumes that were visible in natural color satellite images on clear weather days (figure 67). According to a Darwin VAAC report, at 2040 on 6 May an ash plume rose to 4.6 km altitude and drifted W; by 2300 the plume had dissipated. MODIS satellite instruments using the MODVOLC thermal algorithm detected a single thermal hotspot on the SE side of the island on 7 May. Weak thermal activity was also detected in a satellite image on the E side of the island on 14 May, accompanied by a white gas-and-steam plume that drifted SE (figure 68).
Geologic Background. The 2-km-wide island of Kadovar is the emergent summit of a Bismarck Sea stratovolcano of Holocene age. It is part of the Schouten Islands, and lies off the coast of New Guinea, about 25 km N of the mouth of the Sepik River. Prior to an eruption that began in 2018, a lava dome formed the high point of the andesitic volcano, filling an arcuate landslide scarp open to the south; submarine debris-avalanche deposits occur in that direction. Thick lava flows with columnar jointing forms low cliffs along the coast. The youthful island lacks fringing or offshore reefs. A period of heightened thermal phenomena took place in 1976. An eruption began in January 2018 that included lava effusion from vents at the summit and at the E coast.
Information Contacts: Darwin Volcanic Ash Advisory Centre (VAAC), Bureau of Meteorology, Northern Territory Regional Office, PO Box 40050, Casuarina, NT 0811, Australia (URL: http://www.bom.gov.au/info/vaac/); Hawai'i Institute of Geophysics and Planetology (HIGP) - MODVOLC Thermal Alerts System, School of Ocean and Earth Science and Technology (SOEST), Univ. of Hawai'i, 2525 Correa Road, Honolulu, HI 96822, USA (URL: http://modis.higp.hawaii.edu/); Copernicus Browser, Copernicus Data Space Ecosystem, European Space Agency (URL: https://dataspace.copernicus.eu/browser/).
San Miguel (El Salvador) — June 2023 Cite this Report
San Miguel
El Salvador
13.434°N, 88.269°W; summit elev. 2130 m
All times are local (unless otherwise noted)
Small gas-and-ash explosions during March and May 2023
San Miguel in El Salvador is a broad, deep crater complex that has been frequently modified by eruptions recorded since the early 16th century and consists of the summit known locally as Chaparrastique. Flank eruptions have produced lava flows that extended to the N, NE, and SE during the 17-19th centuries. The most recent activity has consisted of minor ash eruptions from the summit crater. The current eruption period began in November 2022 and has been characterized by frequent phreatic explosions, gas-and-ash emissions, and sulfur dioxide plumes (BGVN 47:12). This report describes small gas-and-ash explosions during December 2022 through May 2023 based on special reports from the Ministero de Medio Ambiente y Recursos Naturales (MARN).
Activity has been relatively low since the last recorded explosions on 29 November 2022. Seismicity recorded by the San Miguel Volcano Station (VSM) located on the N flank at 1.7 km elevation had decreased by 7 December. Sulfur dioxide gas measurements taken with DOAS (Differential Optical Absorption Spectroscopy) mobile equipment were below typical previously recorded values: 300 tons per day (t/d). During December, small explosions were recorded by the seismic network and manifested as gas-and-steam emissions.
Gas-and-ash explosions in the crater occurred during January 2023, which were recorded by the seismic network. Sulfur dioxide values remained low, between 300-400 t/d through 10 March. At 0817 on 14 January a gas-and-ash emission was visible in webcam images, rising just above the crater rim. Some mornings during February, small gas-and-steam plumes were visible in the crater. On 7 March at 2252 MARN noted an increase in degassing from the central crater; gas emissions were constantly observed through the early morning hours on 8 March. During the early morning of 8 March through the afternoon on 9 March, 12 emissions were registered, some accompanied by ash. The last gas-and-ash emission was recorded at 1210 on 9 March; very fine ashfall was reported in El Tránsito (10 km S), La Morita (6 km W), and La Piedrita (3 km W). The smell of sulfur was reported in Piedra Azul (5 km SW). On 16 March MARN reported that gas-and-steam emissions decreased.
Low degassing and very low seismicity were reported during April; no explosions have been detected between 9 March and 27 May. The sulfur dioxide emissions remained between 350-400 t/d; during 13-20 April sulfur dioxide values fluctuated between 30-300 t/d. Activity remained low through most of May; on 23 May seismicity increased. An explosion was detected at 1647 on 27 May generated a gas-and-ash plume that rose 700 m high (figure 32); a decrease in seismicity and gas emissions followed. The DOAS station installed on the W flank recorded sulfur dioxide values that reached 400 t/d on 27 May; subsequent measurements showed a decrease to 268 t/d on 28 May and 100 t/d on 29 May.
Geologic Background. The symmetrical cone of San Miguel, one of the most active volcanoes in El Salvador, rises from near sea level to form one of the country's most prominent landmarks. A broad, deep, crater complex that has been frequently modified by eruptions recorded since the early 16th century caps the truncated unvegetated summit, also known locally as Chaparrastique. Flanks eruptions of the basaltic-andesitic volcano have produced many lava flows, including several during the 17th-19th centuries that extended to the N, NE, and SE. The SE-flank flows are the largest and form broad, sparsely vegetated lava fields crossed by highways and a railroad skirting the base of the volcano. Flank vent locations have migrated higher on the edifice during historical time, and the most recent activity has consisted of minor ash eruptions from the summit crater.
Information Contacts: Ministero de Medio Ambiente y Recursos Naturales (MARN), Km. 5½ Carretera a Nueva San Salvador, Avenida las Mercedes, San Salvador, El Salvador (URL: http://www.snet.gob.sv/ver/vulcanologia).
Semisopochnoi (United States) — June 2023 Cite this Report
Semisopochnoi
United States
51.93°N, 179.58°E; summit elev. 1221 m
All times are local (unless otherwise noted)
Occasional explosions, ash deposits, and gas-and-steam plumes during December 2022-May 2023
Semisopochnoi is located in the western Aleutians, is 20-km-wide at sea level, and contains an 8-km-wide caldera. The three-peaked Mount Young (formerly Cerberus) was constructed within the caldera during the Holocene. Each of these peaks contains a summit crater; the lava flows on the N flank appear younger than those on the S side. The current eruption period began in early February 2021 and has more recently consisted of intermittent explosions and ash emissions (BGVN 47:12). This report updates activity during December 2022 through May 2023 using daily, weekly, and special reports from the Alaska Volcano Observatory (AVO). AVO monitors the volcano using local seismic and infrasound sensors, satellite data, web cameras, and remote infrasound and lightning networks.
Activity during most of December 2022 was relatively quiet; according to AVO no eruptive or explosive activity was observed since 7 November 2022. Intermittent tremor and occasional small earthquakes were observed in geophysical data. Continuous gas-and-steam emissions were observed from the N crater of Mount Young in webcam images on clear weather days (figure 25). On 24 December, there was a slight increase in earthquake activity and several small possible explosion signals were detected in infrasound data. Eruptive activity resumed on 27 December at the N crater of Mount Young; AVO issued a Volcano Activity Notice (VAN) that reported minor ash deposits on the flanks of Mount Young that extended as far as 1 km from the vent, according to webcam images taken during 27-28 December (figure 26). No ash plumes were observed in webcam or satellite imagery, but a persistent gas-and-steam plume that might have contained some ash rose to 1.5 km altitude. As a result, AVO raised the Aviation Color Code (ACC) to Orange (the second highest level on a four-color scale) and the Volcano Alert Level (VAL) to Watch (the second highest level on a four-level scale). Possible explosions were detected during 21 December 2022 through 1 January 2023 and seismic tremor was recorded during 30-31 December.
During January 2023 eruptive activity continued at the active N crater of Mount Young. Minor ash deposits were observed on the flanks, extending about 2 km SSW, based on webcam images from 1 and 3 January. A possible explosion occurred during 1-2 January based on elevated seismicity recorded on local seismometers and an infrasound signal recorded minutes later by an array at Adak. Though no ash plumes were observed in webcam or satellite imagery, a persistent gas-and-steam plume rose to 1.5 km altitude that might have carried minor traces of ash. Ash deposits were accompanied by periods of elevated seismicity and infrasound signals from the local geophysical network, which AVO reported were likely due to weak explosive activity. Low-level explosive activity was also detected during 2-3 January, with minor gas-and-steam emissions and a new ash deposit that was visible in webcam images. Low-level explosive activity was detected in geophysical data during 4-5 January, with elevated seismicity and infrasound signals observed on local stations. Volcanic tremor was detected during 7-9 January and very weak explosive activity was detected in seismic and infrasound data on 9 January. Weak seismic and infrasound signals were recorded on 17 January, which indicated minor explosive activity, but no ash emissions were observed in clear webcam images; a gas-and-steam plume continued to rise to 1.5 km altitude. During 29-30 January, ash deposits near the summit were observed on fresh snow, according to webcam images.
The active N cone at Mount Young continued to produce a gas-and-steam plume during February, but no ash emissions or explosive events were detected. Seismicity remained elevated with faint tremor during early February. Gas-and-steam emissions from the N crater were observed in clear webcam images on 11-13 and 16 February; no explosive activity was detected in seismic, infrasound, or satellite data. Seismicity has also decreased, with no significant seismic tremor observed since 25 January. Therefore, the ACC was lowered to Yellow (the second lowest level on a four-color scale) and the VAL was lowered to Advisory (the second lowest level on a four-color scale) on 22 February.
Gas-and-steam emissions persisted during March from the N cone of Mount Young, based on clear webcam images. A few brief episodes of weak tremor were detected in seismic data, although seismicity decreased over the month. A gas-and-steam plume detected in satellite data extended 150 km on 18 March. Low-level ash emissions from the N cone at Mount Young were observed in several webcam images during 18-19 March, in addition to small explosions and volcanic tremor. The ACC was raised to Orange and the VAL increased to Watch on 19 March. A small explosion was detected in seismic and infrasound data on 21 March.
Low-level unrest continued during April, although cloudy weather often obscured views of the summit; periods of seismic tremor and local earthquakes were recorded. During 3-4 April a gas-and-steam plume was visible traveling more than 200 km overnight; no ash was evident in the plume, according to AVO. A gas-and-steam plume was observed during 4-6 April that extended 400 km but did not seem to contain ash. Small explosions were detected in seismic and infrasound data on 5 April. Occasional clear webcam images showed continuing gas-and-steam emissions rose from Mount Young, but no ash deposits were observed on the snow. On 19 April small explosions and tremor were detected in seismic and infrasound data. A period of seismic tremor was detected during 22-25 April, with possible weak explosions on 25 April. Ash deposits were visible near the crater rim, but it was unclear if these deposits were recent or due to older deposits.
Occasional small earthquakes were recorded during May, but there were no signs of explosive activity seen in geophysical data. Gas-and-steam emissions continued from the N crater of Mount Young, based on webcam images, and seismicity remained slightly elevated. A new, light ash deposit was visible during the morning of 5 May on fresh snow on the NW flank of Mount Young. During 10 May periods of volcanic tremor were observed. The ACC was lowered to Yellow and the VAL to Advisory on 17 May due to no additional evidence of activity.
Geologic Background. Semisopochnoi, the largest subaerial volcano of the western Aleutians, is 20 km wide at sea level and contains an 8-km-wide caldera. It formed as a result of collapse of a low-angle, dominantly basaltic volcano following the eruption of a large volume of dacitic pumice. The high point of the island is Anvil Peak, a double-peaked late-Pleistocene cone that forms much of the island's northern part. The three-peaked Mount Cerberus (renamed Mount Young in 2023) was constructed within the caldera during the Holocene. Each of the peaks contains a summit crater; lava flows on the N flank appear younger than those on the south side. Other post-caldera volcanoes include the symmetrical Sugarloaf Peak SSE of the caldera and Lakeshore Cone, a small cinder cone at the edge of Fenner Lake in the NE part of the caldera. Most documented eruptions have originated from Young, although Coats (1950) considered that both Sugarloaf and Lakeshore Cone could have been recently active.
Information Contacts: Alaska Volcano Observatory (AVO), a cooperative program of a) U.S. Geological Survey, 4200 University Drive, Anchorage, AK 99508-4667 USA (URL: https://avo.alaska.edu/), b) Geophysical Institute, University of Alaska, PO Box 757320, Fairbanks, AK 99775-7320, USA, and c) Alaska Division of Geological & Geophysical Surveys, 794 University Ave., Suite 200, Fairbanks, AK 99709, USA (URL: http://dggs.alaska.gov/).
Ebeko
Russia
50.686°N, 156.014°E; summit elev. 1103 m
All times are local (unless otherwise noted)
Continued explosions, ash plumes, and ashfall during October 2022-May 2023
Ebeko, located on the N end of Paramushir Island in the Kuril Islands, consists of three summit craters along a SSW-NNE line at the northern end of a complex of five volcanic cones. Eruptions date back to the late 18th century and have been characterized as small-to-moderate explosions from the summit crater, accompanied by intense fumarolic activity. The current eruption period began in June 2022 and has recently consisted of frequent explosions, ash plumes, and thermal activity (BGVN 47:10). This report covers similar activity during October 2022 through May 2023, based on information from the Kamchatka Volcanic Eruptions Response Team (KVERT) and satellite data.
Activity during October consisted of explosive activity, ash plumes, and occasional thermal anomalies. Visual data by volcanologists from Severo-Kurilsk showed explosions producing ash clouds up to 2.1-3 km altitude which drifted E, N, NE, and SE during 1-8, 10, 16, and 18 October. KVERT issued several Volcano Observatory Notices for Aviation (VONA) on 7, 13-15, and 27 October 2022, stating that explosions generated ash plumes that rose to 2.3-4 km altitude and drifted 5 km E, NE, and SE. Ashfall was reported in Severo-Kurilsk (Paramushir Island, about 7 km E) on 7 and 13 October. Satellite data showed a thermal anomaly over the volcano on 15-16 October. Visual data showed ash plumes rising to 2.5-3.6 km altitude on 22, 25-29, and 31 October and moving NE due to constant explosions.
Similar activity continued during November, with explosions, ash plumes, and ashfall occurring. KVERT issued VONAs on 1-2, 4, 6-7, 9, 13, and 16 November that reported explosions and resulting ash plumes that rose to 1.7-3.6 km altitude and drifted 3-5 km SE, ESE, E, and NE. On 1 November ash plumes extended as far as 110 km SE. On 5, 8, 12, and 24-25 November explosions and ash plumes rose to 2-3.1 km altitude and drifted N and E. Ashfall was observed in Severo-Kurilsk on 7 and 16 November. A thermal anomaly was visible during 1-4, 16, and 20 November. Explosions during 26 November rose as high as 2.7 km altitude and drifted NE (figure 45).
Explosions and ash plumes continued to occur in December. During 1-2 and 4 December volcanologists from Severo-Kurilsk observed explosions that sent ash to 1.9-2.5 km altitude and drifted NE and SE (figure 46). VONAs were issued on 5, 9, and 16 December reporting that explosions generated ash plumes rising to 1.9 km, 2.6 km, and 2.4 km altitude and drifted 5 km SE, E, and NE, respectively. A thermal anomaly was visible in satellite imagery on 16 December. On 18 and 27-28 December explosions produced ash plumes that rose to 2.5 km altitude and drifted NE and SE. On 31 December an ash plume rose to 2 km altitude and drifted NE.
Explosions continued during January 2023, based on visual observations by volcanologists from Severo-Kurilsk. During 1-7 January explosions generated ash plumes that rose to 4 km altitude and drifted NE, E, W, and SE. According to VONAs issued by KVERT on 2, 4, 10, and 23 January, explosions produced ash plumes that rose to 2-4 km altitude and drifted 5 km N, NE, E, and ENE; the ash plume that rose to 4 km altitude occurred on 10 January (figure 47). Satellite data showed a thermal anomaly during 3-4, 10, 13, 16, 21, 22, and 31 January. KVERT reported that an ash cloud on 4 January moved 12 km NE. On 6 and 9-11 January explosions sent ash plumes to 4.5 km altitude and drifted W and ESE. On 13 January an ash plume rose to 3 km altitude and drifted SE. During 20-24 January ash plumes from explosions rose to 3.7 km altitude and drifted SE, N, and NE. On 21 January the ash plume drifted as far as 40 km NE. During 28-29 and 31 January and 1 February ash plumes rose to 4 km altitude and drifted NE.
During February, explosions, ash plumes, and ashfall were reported. During 1, 4-5 and 7-8 February explosions generated ash plumes that rose to 4.5 km altitude and drifted E and NE; ashfall was observed on 5 and 8 February. On 6 February an explosion produced an ash plume that rose to 3 km altitude and drifted 7 km E, causing ashfall in Severo-Kurilsk. A thermal anomaly was visible in satellite data on 8, 9, 13, and 21 February. Explosions on 9 and 12-13 February produced ash plumes that rose to 4 km altitude and drifted E and NE; the ash cloud on 12 February extended as far as 45 km E. On 22 February explosions sent ash to 3 km altitude that drifted E. During 24 and 26-27 February ash plumes rose to 4 km altitude and drifted E. On 28 February an explosion sent ash to 2.5-3 km altitude and drifted 5 km E; ashfall was observed in Severo-Kurilsk.
Activity continued during March; visual observations showed that explosions generated ash plumes that rose to 3.6 km altitude on 3, 5-7, and 9-12 March and drifted E, NE, and NW. Thermal anomalies were visible on 10, 13, and 29-30 March in satellite imagery. On 18, 21-23, 26, and 29-30 March explosions produced ash plumes that rose to 2.8 km altitude and drifted NE and E; the ash plumes during 22-23 March extended up to 76 km E. A VONA issued on 21 March reported an explosion that produced an ash plume that rose to 2.8 km altitude and drifted 5 km E. Another VONA issued on 23 March reported that satellite data showed an ash plume rising to 3 km altitude and drifted 14 km E.
Explosions during April continued to generate ash plumes. On 1 and 4 April an ash plume rose to 2.8-3.5 km altitude and drifted SE and NE. A thermal anomaly was visible in satellite imagery during 1-6 April. Satellite data showed ash plumes and clouds rising to 2-3 km altitude and drifting up to 12 km SW and E on 3 and 6 April (figure 48). KVERT issued VONAs on 3, 5, 14, 16 April describing explosions that produced ash plumes rising to 3 km, 3.5 km, 3.5 km, and 3 km altitude and drifting 5 km S, 5 km NE and SE, 72 km NNE, and 5 km NE, respectively. According to satellite data, the resulting ash cloud from the explosion on 14 April was 25 x 7 km in size and drifted 72-104 km NNE during 14-15 April. According to visual data by volcanologists from Severo-Kurilsk explosions sent ash up to 3.5 km altitude that drifted NE and E during 15-16, 22, 25-26, and 29 April.
The explosive eruption continued during May. Explosions during 3-4, 6-7, and 9-10 May generated ash plumes that rose to 4 km altitude and drifted SW and E. Satellite data showed a thermal anomaly on 3, 9, 13-14, and 24 May. During 12-16, 23-25, and 27-28 May ash plumes rose to 3.5 km altitude and drifted in different directions due to explosions. Two VONA notices were issued on 16 and 25 May, describing explosions that generated ash plumes rising to 3 km and 3.5 km altitude, respectively and extending 5 km E. The ash cloud on 25 May drifted 75 km SE.
Thermal activity in the summit crater, occasionally accompanied by ash plumes and ash deposits on the SE and E flanks due to frequent explosions, were visible in infrared and true color satellite images (figure 49).
Geologic Background. The flat-topped summit of the central cone of Ebeko volcano, one of the most active in the Kuril Islands, occupies the northern end of Paramushir Island. Three summit craters located along a SSW-NNE line form Ebeko volcano proper, at the northern end of a complex of five volcanic cones. Blocky lava flows extend west from Ebeko and SE from the neighboring Nezametnyi cone. The eastern part of the southern crater contains strong solfataras and a large boiling spring. The central crater is filled by a lake about 20 m deep whose shores are lined with steaming solfataras; the northern crater lies across a narrow, low barrier from the central crater and contains a small, cold crescentic lake. Historical activity, recorded since the late-18th century, has been restricted to small-to-moderate explosive eruptions from the summit craters. Intense fumarolic activity occurs in the summit craters, on the outer flanks of the cone, and in lateral explosion craters.
Information Contacts: Kamchatka Volcanic Eruptions Response Team (KVERT), Far Eastern Branch, Russian Academy of Sciences, 9 Piip Blvd., Petropavlovsk-Kamchatsky, 683006, Russia (URL: http://www.kscnet.ru/ivs/kvert/); MIROVA (Middle InfraRed Observation of Volcanic Activity), a collaborative project between the Universities of Turin and Florence (Italy) supported by the Centre for Volcanic Risk of the Italian Civil Protection Department (URL: http://www.mirovaweb.it/); Copernicus Browser, Copernicus Data Space Ecosystem, European Space Agency (URL: https://dataspace.copernicus.eu/browser/).
Home Reef
Tonga
18.992°S, 174.775°W; summit elev. -10 m
All times are local (unless otherwise noted)
Discolored plumes continued during November 2022-April 2023
Home Reef is a submarine volcano located in the central Tonga islands between Lateiki (Metis Shoal) and Late Island. The first recorded eruption occurred in the mid-19th century, when an ephemeral island formed. An eruption in 1984 produced a 12-km-high eruption plume, a large volume of floating pumice, and an ephemeral island 500 x 1,500 m wide, with cliffs 30-50 m high that enclosed a water-filled crater. Another island-forming eruption in 2006 produced widespread pumice rafts that drifted as far as Australia; by 2008 the island had eroded below sea level. The previous eruption occurred during October 2022 and was characterized by a new island-forming eruption, lava effusion, ash plumes, discolored water, and gas-and-steam plumes (BGVN 47:11). This report covers discolored water plumes during November 2022 through April 2023 using satellite data.
Discolored plumes continued during the reporting period and were observed in true color satellite images on clear weather days. Satellite images show light green-yellow discolored water extending W on 8 and 28 November 2022 (figure 31), and SW on 18 November. Light green-yellow plumes extended W on 3 December, S on 13 December, SW on 18 December, and W and S on 23 December (figure 31). On 12 January 2023 discolored green-yellow plumes extended to the NE, E, SE, and N. The plume moved SE on 17 January and NW on 22 January. Faint discolored water in February was visible moving NE on 1 February. A discolored plume extended NW on 8 and 28 March and NW on 13 March (figure 31). During April, clear weather showed green-blue discolored plumes moving S on 2 April, W on 7 April, and NE and S on 12 April. A strong green-yellow discolored plume extended E and NE on 22 April for several kilometers (figure 31).
Geologic Background. Home Reef, a submarine volcano midway between Metis Shoal and Late Island in the central Tonga islands, was first reported active in the mid-19th century, when an ephemeral island formed. An eruption in 1984 produced a 12-km-high eruption plume, large amounts of floating pumice, and an ephemeral 500 x 1,500 m island, with cliffs 30-50 m high that enclosed a water-filled crater. In 2006 an island-forming eruption produced widespread dacitic pumice rafts that drifted as far as Australia. Another island was built during a September-October 2022 eruption.
Information Contacts: Copernicus Browser, Copernicus Data Space Ecosystem, European Space Agency (URL: https://dataspace.copernicus.eu/browser/).
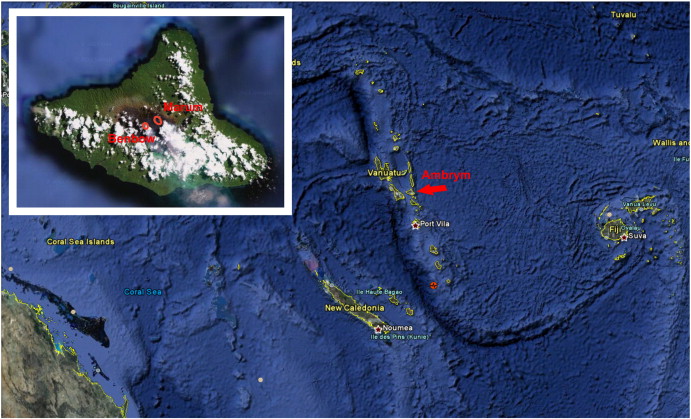
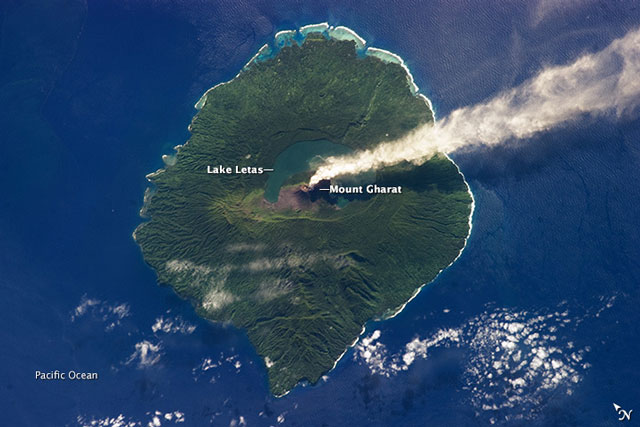
Ambae
Vanuatu
15.389°S, 167.835°E; summit elev. 1496 m
All times are local (unless otherwise noted)
New lava flow, ash plumes, and sulfur dioxide plumes during February-May 2023
Ambae, also known as Aoba, is a large basaltic shield volcano in Vanuatu. A broad pyroclastic cone containing three crater lakes (Manaro Ngoru, Voui, and Manaro Lakua) is located at the summit within the youngest of at least two nested calderas. Periodic phreatic and pyroclastic explosions have been reported since the 16th century. A large eruption more than 400 years ago resulted in a volcanic cone within the summit crater that is now filled by Lake Voui; the similarly sized Lake Manaro fills the western third of the caldera. The previous eruption ended in August 2022 that was characterized by gas-and-steam and ash emissions and explosions of wet tephra (BGVN 47:10). This report covers a new eruption during February through May 2023 that consisted of a new lava flow, ash plumes, and sulfur dioxide emissions, using information from the Vanuatu Meteorology and Geo-Hazards Department (VMGD) and satellite data.
During the reporting period, the Alert Level remained at a 2 (on a scale of 0-5), which has been in place since December 2021. Activity during October 2022 through March 2023 remained relatively low and mostly consisted of gas-and-steam emissions in Lake Voui. VMGD reported that at 1300 on 15 November a satellite image captured a strong amount of sulfur dioxide rising above the volcano (figure 99), and that seismicity slightly increased. The southern and northern part of the island reported a strong sulfur dioxide smell and heard explosions. On 20 February 2023 a gas-and-ash plume rose 1.3 km above the summit and drifted SSW, according to a webcam image (figure 100). Gas-and-steam and possibly ash emissions continued on 23 February and volcanic earthquakes were recorded by the seismic network.
During April, volcanic earthquakes and gas-and-steam and ash emissions were reported from the cone in Lake Voui. VMGD reported that activity increased during 5-7 April; high gas-and-steam and ash plumes were visible, accompanied by nighttime incandescence. According to a Wellington VAAC report, a low-level ash plume rose as high as 2.5 km above the summit and drifted W and SW on 5 April, based on satellite imagery. Reports in Saratamata stated that a dark ash plume drifted to the WSW, but no loud explosion was heard. Webcam images from 2100 showed incandescence above the crater and reflected in the clouds. According to an aerial survey, field observations, and satellite data, water was no longer present in the lake. A lava flow was reported effusing from the vent and traveling N into the dry Lake Voui, which lasted three days. The next morning at 0745 on 6 April a gas-and-steam and ash plume rose 5.4 km above the summit and drifted ESE, based on information from VMGD (figure 101). The Wellington VAAC also reported that light ashfall was observed on the island. Intermittent gas-and-steam and ash emissions were visible on 7 April, some of which rose to an estimated 3 km above the summit and drifted E. Webcam images during 0107-0730 on 7 April showed continuing ash emissions. A gas-and-steam and ash plume rose 695 m above the summit crater at 0730 on 19 April and drifted ESE, based on a webcam image (figure 102).
According to visual and infrared satellite data, water was visible in Lake Voui as late as 24 March 2023 (figure 103). The vent in the caldera showed a gas-and-steam plume drifted SE. On 3 April thermal activity was first detected, accompanied by a gas-and-ash plume that drifted W (figure 103). The lava flow moved N within the dry lake and was shown cooling by 8 April. By 23 April much of the water in the lake had returned. Occasional sulfur dioxide plumes were detected by the TROPOMI instrument on the Sentinel-5P satellite that exceeded 2 Dobson Units (DU) and drifted in different directions (figure 104).
Geologic Background. The island of Ambae, also known as Aoba, is a massive 2,500 km3 basaltic shield that is the most voluminous volcano of the New Hebrides archipelago. A pronounced NE-SW-trending rift zone with numerous scoria cones gives the 16 x 38 km island an elongated form. A broad pyroclastic cone containing three crater lakes (Manaro Ngoru, Voui, and Manaro Lakua) is located at the summit within the youngest of at least two nested calderas, the largest of which is 6 km in diameter. That large central edifice is also called Manaro Voui or Lombenben volcano. Post-caldera explosive eruptions formed the summit craters about 360 years ago. A tuff cone was constructed within Lake Voui (or Vui) about 60 years later. The latest known flank eruption, about 300 years ago, destroyed the population of the Nduindui area near the western coast.
Information Contacts: Geo-Hazards Division, Vanuatu Meteorology and Geo-Hazards Department (VMGD), Ministry of Climate Change Adaptation, Meteorology, Geo-Hazards, Energy, Environment and Disaster Management, Private Mail Bag 9054, Lini Highway, Port Vila, Vanuatu (URL: http://www.vmgd.gov.vu/, https://www.facebook.com/VanuatuGeohazardsObservatory/); Wellington Volcanic Ash Advisory Centre (VAAC), Meteorological Service of New Zealand Ltd (MetService), PO Box 722, Wellington, New Zealand (URL: http://www.metservice.com/vaac/, http://www.ssd.noaa.gov/VAAC/OTH/NZ/messages.html); MIROVA (Middle InfraRed Observation of Volcanic Activity), a collaborative project between the Universities of Turin and Florence (Italy) supported by the Centre for Volcanic Risk of the Italian Civil Protection Department (URL: http://www.mirovaweb.it/); Global Sulfur Dioxide Monitoring Page, Atmospheric Chemistry and Dynamics Laboratory, NASA Goddard Space Flight Center (NASA/GSFC), 8800 Greenbelt Road, Goddard, Maryland, USA (URL: https://so2.gsfc.nasa.gov/); Copernicus Browser, Copernicus Data Space Ecosystem, European Space Agency (URL: https://dataspace.copernicus.eu/browser/).
Search Bulletin Archive by Publication Date
Select a month and year from the drop-downs and click "Show Issue" to have that issue displayed in this tab.
The default month and year is the latest issue available.
Bulletin of the Global Volcanism Network - Volume 38, Number 05 (May 2013)
Managing Editor: Richard Wunderman
Agrigan (United States)
2007 M~3.3 earthquake followed by clouds of equivocal origin
Ambae (Vanuatu)
Minor activity likely continuing into early 2013
Ambrym (Vanuatu)
Roiling lava lake and related observations through mid-2013
Dallol (Ethiopia)
Phreatic eruption in 1st week of January 2011
Fuego (Guatemala)
Continuous activity and a VEI 3 eruption during 13-14 September 2012
Gaua (Vanuatu)
Hazard status raised; emissions continue into 2013; plume observed from above
Kilauea (United States)
Summary of highlights for 2010-2012
Pavlof (United States)
Eruption in May-June 2013 with lava flows and ash emissions to ~8.5 km a.s.l.
Veniaminof (United States)
Ongoing sporadic eruptions as late as 6 October 2013
Yasur (Vanuatu)
Explosive activity continued into at least early 2013
Agrigan (United States) — May 2013 Cite this Report
Agrigan
United States
18.77°N, 145.67°E; summit elev. 965 m
All times are local (unless otherwise noted)
2007 M~3.3 earthquake followed by clouds of equivocal origin
Our last report on Agrigan volcano covered a May 1992 field visit (BGVN 17:06) by a six-member team of USGS volcanologists that visited the Commonwealth of the Northern Mariana Islands (CNMI) at the request of the CNMI Office of Civil Defense. The team detected thermal activity, but no seismicity, deformation or other signs of an eruption.
The following came from a report by both the USGS and CNMI issued mid-July 2007and labeled Current Update. "An earthquake was reported felt on Agrigan island at 3:49 pm July 16 local time. About 3 seconds of shaking was reported by a local resident. Seismometers on Sarigan and Anatahan recorded the earthquake and allowed estimation the magnitude at approximately 3.3. No sulfur smell or any other signs of volcanic activity were reported on July 16 or in a follow up call on July 17."
Some 2012 and 2013 observations were equivocal. On 29 February 2012, NOAA's Washington Volcanic Ash Advisory Center (VAAC) inferred ash and gas emissions here for the first time on record, but this was later discounted due to lack of forthcoming evidence. The inferred plume was seen in satellite infrared imagery. It extended 74 km NW from the summit.
A possible volcanic plume from Agrigan was spotted again by the VAAC in a satellite image from 22 January 2013.
In a 25 January 2013 USGS update, it was noted that neither the USGS nor NOAA received confirmation of a volcanic source for the satellite anomalies. The authors of the 2013 update interpreted the cloud as weather-related and not volcanic in origin.
Figure 2 shows a photo of Agrigan taken in June 2013. No hotspots were detected during mid-2012 to mid-2013 by the MODVOLC Thermal Alerts System.
Agrigan, the highest-standing stratovolcano and largest (by subaerial volume) in the Northern Mariana Islands, stands 882 m a.s.l (figure 3). The island is ~10 by 6.5 km (N-S by E-W) in size, with a surface area of 52.7 km2. The volcano's subaerial volume is ~15.9 km3. The summit contains a large depression, roughly 1.5 by 1.2 km in diameter, and 380 m deep. A spatter cone and flows from the 1917 eruption cover ~50 percent of the crater floor. This large crater implies a local edifice with shallow magma storage within the volcano. The flanks of the volcano are steep (>30 degrees), with deep furrows extending radially away from the crater. To the north is a large canyon into which a recent, large 'a'ā flow advanced to form a delta on the coast. Pyroclastic flow deposits mantle most of the interior of the island. Rocks erupted on the island range from basalt to andesite. The southwest coast has several beaches composed of mineral sands; otherwise, the coast is rocky. (Trusdell, F.A. and others, 2009).
References. Sako, M. K.; Trusdell, F. A.; Koyanagi, R. Y.; Kojima, George; Moore, R. B., 1995, Volcanic investigations in the Commonwealth of the Northern Mariana Islands, April to May 1994, USGS Open-File Report 94-705.
Stern, R.J., 1978, Agrigan: an introduction to the geology of an active volcano in the Northern Mariana Arc: Bulletin of Volcanology, v. 41, p. 43-55.
Trusdell, F.A., Moore, R.B., and Sako, M.K., 2006. Preliminary Geologic Map of Mount Pagan Volcano, Pagan Island, Commonwealth of the Northern Mariana Islands, USGS Open-File Report 2006-1386 (URL: http://pubs.usgs.gov/of/2006/1386/).
Trusdell, F.A. 2009, Geology of the Mariana Islands, in Gillespie, R.G., and Clague, D.A., eds., Encyclopedia of Islands: Enclyclopedias of the Natural World, 2, University of California Press, Chap. 18. P. 598-603.
Geologic Background. The highest of the Marianas arc volcanoes, Agrigan contains a 500-m-deep, flat-floored caldera. The elliptical island is 8 km long; its summit is the top of a massive 4000-m-high submarine volcano. Deep radial valleys dissect the flanks of the thickly vegetated stratovolcano. The elongated caldera is 1 x 2 km wide and is breached to the NW, from where a prominent lava flow extends to the coast and forms a lava delta. The caldera floor is surfaced by fresh-looking lava flows and also contains two cones that may have formed during the only historical eruption in 1917. This eruption deposited large blocks and 3 m of ash and lapilli on a village on the SE coast, prompting its evacuation.
Information Contacts: Emergency Management Office of the Commonwealth of the Northern Mariana Islands (EMO-CNMI) and USGS Volcano Hazards Program, PO Box 100007, Saipan, MP 96950, USA (URL: http://www.cnmihsem.gov.mp/ and http://volcanoes.usgs.gov/nmi/activity/); Washington Volcanic Ash Advisory Center (VAAC), Satellite Analysis Branch (SAB), NOAA/NESDIS E/SP23, NOAA Science Center Room 401, 5200 Auth Rd, Camp Springs, MD 20746, USA (URL: http://www.ospo.noaa.gov/Products/atmosphere/vaac/); Hawai'i Institute of Geophysics and Planetology (HIGP), MODVOLC Thermal Alerts System, School of Ocean and Earth Science and Technology (SOEST), Univ. of Hawai'i, 2525 Correa Road, Honolulu, HI 96822, USA (URL://httphotspot.higp); Robert J. Stern, University of Texas at Dallas, 800 W Campbell Rd Richardson, TX 75080; and Yoshi Tamura, Institute for Research on Earth Evolution (IFREE), Japan Agency for Marine-Earth Science and Technology (JAMSTEC), Yokosuka 237-0061, Japan.
Ambae
Vanuatu
15.389°S, 167.835°E; summit elev. 1496 m
All times are local (unless otherwise noted)
Minor activity likely continuing into early 2013
In our May 2011 Bulletin we reported that there was increased degassing at Aoba (also known as Ambae) starting December 2009 through at least April 2010. This report summarizes notices pereiodically posted by the Vanuatu Geohazards Observatory (VGO) and covers the time interval from 4 June 2011 through 26 February 2013. The Vanautu Volcano Alert Level (VVAL) remained at 1 (on a scale of 0-4.)
Observations on 4 June 2011 revealed that small explosions had been occurring from the crater lake and were accompanied by local ashfall around the crater. Some villagers in the N and W parts of the island had observed the explosions.
Based on analysis of data collected by the Vanuatu Meteorology and Geohazards Department (VMGD), the Vanuatu Geohazards Observatory reported that a small series of explosions from Aoba occurred on 10 July 2011. On July 11, VGO noted that there had been recent increases in activity from Ambae and that local earthquakes were volcanic. Satellite images collected by the Ozone Monitoring Instrument showed sulfur dioxide emissions. Photos showed that the volcano was quiet on 12 July 2011, although ongoing earthquakes were detected.
According to the VGO, Ambanga villagers reported that minor activity at Aoba began in December 2012. The OMI instrument detected strong gas emissions on 18 and 25 January 2013; the emissions continued at a lower level through 7 February. Field observations by the Geohazards team during 30 January-2 February 2013 confirmed that activity had significantly changed. Data retrieved from a monitoring station also confirmed ongoing activity. Satellite images acquired on 3 and 26 February 2013 detected substantial sulfur dioxide emissions.
No MODVOLC Thermal Alerts were issued in the previous year ending 16 July 2013.
Geologic Background. The island of Ambae, also known as Aoba, is a massive 2,500 km3 basaltic shield that is the most voluminous volcano of the New Hebrides archipelago. A pronounced NE-SW-trending rift zone with numerous scoria cones gives the 16 x 38 km island an elongated form. A broad pyroclastic cone containing three crater lakes (Manaro Ngoru, Voui, and Manaro Lakua) is located at the summit within the youngest of at least two nested calderas, the largest of which is 6 km in diameter. That large central edifice is also called Manaro Voui or Lombenben volcano. Post-caldera explosive eruptions formed the summit craters about 360 years ago. A tuff cone was constructed within Lake Voui (or Vui) about 60 years later. The latest known flank eruption, about 300 years ago, destroyed the population of the Nduindui area near the western coast.
Information Contacts: Vanuatu Geohazards Observatory (URL: http://www.vmgd.gov.vu/vmgd/); and Hawai'i Institute of Geophysics and Planetology (HIGP), MODVOLC Thermal Alerts System, School of Ocean and Earth Science and Technology (SOEST), Univ. of Hawai'i, 2525 Correa Road, Honolulu, HI 96822, USA (URL: http://modis.higp.hawaii.edu/).
Ambrym
Vanuatu
16.25°S, 168.12°E; summit elev. 1334 m
All times are local (unless otherwise noted)
Roiling lava lake and related observations through mid-2013
In our previous Ambrym report, we described ongoing plumes, some bearing ash rising to over 6 km altitude through early June 2011 (BGVN 36:05). The volcano has been known to contain two molten, turbulent lava lakes since August 1999, and that continues at least through June 2011, which was the last time lava-lake activity was noted in a report by the Vanuatu Geohazards Observatory (VGO). Our reporting observations drew heavily on government reports of 3 April 2009 and 29 July 2013. The former report also discussed water supply and other issues of public health and safety associated with inhabiting an active volcano. Vanuatu is located in the South Pacific NE of Australia (figures 24 and 25).
Reynolds (2010) posted videos of lava lake behavior seen in September 2010. Figure 26 is a screenshot taken from the Reynolds' video of the turbulent lava lake with a climber in the foreground. The high definition videos showed an exceedingly agitated lake surface, everywhere disturbed and molten, without any chilled material in evidence. Violent upwellings of lava occurred continuously. Some fraction of the videos show climbers in the foreground, at one point descending a steep slope or vertical drop by a single rope secured from above (abseiling or rappelling).
On 27 June 2011, the VGO reported that data collected from Ambrym's monitoring network showed significant daily degassing and occasional explosions in the crater. Field observers noted that the level of the lava lakes was high. During June, villages reported minor ashfall and that acid rain affected agriculture in general in some areas W, S, and E. The Alert Level remained at 1 (on a scale of 0-4).
During the previous 12 months prior to mid-July 2013, MODVOLC thermal alerts were frequent, on the order of several a week to multiple per day, as would be expected for a volcano with active lava lakes. The alerts referred to the lava lakes in Benbow and Marum craters (figure 25).
On 21 June 2013, VGO reported that satellite images on 2, 4, 11, 14, and 16 June detected gas emissions from Ambrym. Emissions of minor amounts of ash and substantial amounts of gas from the active vents had been detected during the previous week. The report warned that communities on the island, especially those downwind of Ambrym, may experience ashfall and acid rain that could damage the environment and contaminate water. The Alert Level remained at 1. Based on pilot observations and analyses of satellite imagery, the Wellington Volcanic Ash Advisory Center (VAAC) reported that on 19 July 2013 an ash plume rose to an altitude of 3 km a.s.l. and drifted 185 km NW.
VGO reported that activity at Ambrym slightly increased to a minor eruptive phase, and a seismic swarm was detected between 2400 and 0700 on 26 July 2013. The Alert Level remained at 1.
Gas fluxes are generally high for Vanuatu volcanoes and have been the subject of regular reporting online and several recent reports in the literature (for example, Bani and others, 2009; Bani and others, 2012).
References. Bani, P., C. Oppenheimer, V.I. Tsanev, S.A. Carn, S.J. Cronin, R. Crimp, J.A. Calkins, D. Charley, M. Lardy, and T.R. Roberts, 2009, Surge in sulfur and halogen degassing from Ambrym volcano, Vanuatu, Bulletin of Volcanology, 71(10), 1159-1168, doi:10.1007/s00445-009-0293-7.
Bani, P., C. Oppenheimer, P. Allard, H. Shinohara, V. Tsanev, S. Carn, M. Lardy, and E. Garaebeti, 2012, First arc-scale volcanic SO2 budget for the Vanuatu archipelago, Journal of Volcanology and Geothermal Research, 211-212, 36-46, doi:10.1016/j.jvolgeores.2011.10.005.
Polacci, M, Baker, D, La Rue, A., Mancini, L., Allard, P., 2012, Degassing behaviour of vesiculated basaltic magmas: an example from Ambrym volcano, Vanuatu Arc, Journal of Volcanology and Geothermal Research, Vol. 233-234, 1 July 2012, pp. 55-64.
Reynolds, J., 2010, (Video) Abseiling towards a lava lake--extreme video From Marum volcano, Ambrym, Vanuatu (September 2010) YouTube (URL: https://www.youtube.com/watch?v=AtGT-_7Xoal) [also available at typhoonfury.com and earthuncut.tv].
Geologic Background. Ambrym, a large basaltic volcano with a 12-km-wide caldera, is one of the most active volcanoes of the New Hebrides Arc. A thick, almost exclusively pyroclastic sequence, initially dacitic then basaltic, overlies lava flows of a pre-caldera shield volcano. The caldera was formed during a major Plinian eruption with dacitic pyroclastic flows about 1,900 years ago. Post-caldera eruptions, primarily from Marum and Benbow cones, have partially filled the caldera floor and produced lava flows that ponded on the floor or overflowed through gaps in the caldera rim. Post-caldera eruptions have also formed a series of scoria cones and maars along a fissure system oriented ENE-WSW. Eruptions have apparently occurred almost yearly during historical time from cones within the caldera or from flank vents. However, from 1850 to 1950, reporting was mostly limited to extra-caldera eruptions that would have affected local populations.
Information Contacts: Vanuatu Geohazards Observatory, Department of Geology, Mines and Water Resources of Vanuatu (URL: http://geohazards.gov.vu/); Hawai'i Institute of Geophysics and Planetology (HIGP), MODVOLC Thermal Alerts System, School of Ocean and Earth Sciences and Technology (SOEST), Univ. of Hawai'i, 2525 Correa Road, Honolulu, HI 96822, USA (URL: http//hotspot.higp.hawaii.edu/); Wellington Volcanic Ash Advisory Centre (VAAC) (URL: http://vaac.metservice.com/); and NASA Global Sulfur Dioxide Monitoring Home Page, Goddard Space Flight Center, Sciences and Exploration Atmospheric Chemistry and Dynamics Laboratory, Code 614 (URL: http://so2.gsfc.nasa.gov/, http://so2.gsfc.nasa.gov/pix/daily/0813/vanuatu_0813z.html).
Dallol
Ethiopia
14.242°N, 40.3°E; summit elev. -48 m
All times are local (unless otherwise noted)
Phreatic eruption in 1st week of January 2011
The Dallol volcano has not been the subject of any previous Bulletin reports; however, the hydrothermal features include diverse brightly colored hot springs that are both dramatic and intriguing. An explosive event at Dallol was noted by observers in January 2011. This report was given to us by Tadiwos Chernet.
Dallol is located in the Danakil Depression in the northern part of the Afar triangle of Ethiopia. The volcano is on the NNW trending Erta Ale axial, a rift segment that hosts a number of active volcanoes, including Erta Ale, itself the host of a perennial lava lake. The elliptical Dallol (figure 1), which rises gently to 60 m above the salt plain (48 m below sea level), has a summit crater (about 100 m diameter) that experienced a phreatic eruption in 1926.
Nearby residents of Almeda observed unusual dark colored smoke from the Dallol crater in the first week of January 2011. The event, which was not strong enough to be recorded by satellite remote sensing, left dark-gray ash and sulfur deposits at Dallol hot springs, suggesting degassing from depth. This process was not unexpected given that the region contains many craters, and the Dallol crater, formed in 1926, was the result of a phreatic eruption. Previous phreatic eruptions at Dallol and the surrounding salt plain have left behind bubbling acid brine pools best explained by a number of active maar craters. Those craters are obscured by the thick evaporite succession and frequent marine invasions of the salt plain during the Holocene.
Evaporites and Geothermal reservoir. According to Chernet, an adjacent salt-crusted depression that lies 120 m below sea level was linked to the Gulf of Zula on the Red Sea in the Pleistocene by the narrow extensional Alid graben to the N. The Alid graben is floored by fissure basalts and the active Alid and Jallua rhyolitic volcanoes. An evaporite succession in the sedimentary basin is mostly bedded halite, but includes minor inter-beds of clay shale, gypsum, anhydrite, and a thick bed of potash. Citing Barberi et al. (1972), Chernet indicated that the deposits, over 1,000 m thick, have continued for 200,000-25,000 years and attest to a number of marine ingressions into the depression which have left behind a number of brine lakes.
At Dallol, a salt dome rises as a notable topographic and geologic feature (figure 1). On the salt dome, several springs with boiling, supersaturated, and extremely acidic waters are discharging on salt cones.
Citing Varet (2010), Chernet stated that geothermal reservoirs, which reside below the evaporite succession, evidently recharge from precipitation on the NW plateau. This suggests the potential for a renewable geothermal energy supply in the area.
The salt cones are tall, brilliantly colored mounds of salt with intervening pools of yellow, orange and blue-green brine. These colors may result from oxidation state of species in solution, such as ferrous chloride to ferric chloride.
Dallol waters are characterized by very high total dissolved solids (up to 525 g/kg). The waters can be grouped into three chemical suites, all of which contain high levels of chloride. Two representative water samples were collected and analyzed. One of the samples was from a hot springs with a 110C temperature that solidified shortly after collection, indicating salt supersaturation. An X-ray diffraction pattern of the solidified product showed the presence of bishofite (MgCl2*6H2O). The other was a brine water of pH 0.2. The chemical composition of the samples was that of concentrated sea water.
According to Chernet, X-ray diffraction of samples from hydrothermal deposits within the crater shows that the major constitutents of most samples are halite, sulfur, calcite,. sodalite, and hematite, with minor levels of silica. Metallic oxides and potassium and/or fluorine impurities have given the sites a brown, yellow, or bluish color.
Chernet noted that frequent earthquakes of magnitude 4.5-5.5 occur in the vicinity of Dallol, as reflected by cracks healed with later salt deposits and a number of phreatic eruptions.
References. Barberi, F., Borsi, S., Ferrara, G., Marinelli, G.; Santacroce, R.; Tazieff, H., Varet, J., 1972, Evolution of the Danakil depression (Afar, Ethiopia) in light of radiometric age determinations, The Journal of Geology, v. 80, iss. 6, p. 720-729.
Carniel, R., Muñoz Jolis, E., Jones, J., 2010, A geophysical multi-parametric analysis of hydrothermal activity at Dallol, Ethiopia, Journal of African Earth Sciences, vol. 58, p. 812-819. (Article cited personal communications from M. Rivas, 2006).
Chernet, T., Dallol Volcano and Danakil Depression: Earth Resources and Geo-hazards, 2012, Magmatic Rifting and Active Volcanism Conference, 11-13 January 2012, (Session 3), Afar Rift Consortium, Addis Ababa, Ethiopia. (http://www.see.leeds.ac.uk/afar/new-afar/conference/talks.html).
Darraha, T.H., Tedesco, D., Tassid, F., Vasellid, O., Cuocob, E., Poredaf, RJ, 2013, Gas chemistry of the Dallol region of the Danakil Depression in the Afar region of the northern-most East African Rift, Chemical Geology, vol. 339, p. 16-29.
Nobile, A., C. Pagli, Keir, D., Wright, T. J., Ayele, A., Ruch, J., and Acocella, V., 2012, Dike-fault interaction during the 2004 Dallol intrusion at the northern edge of the Erta Ale Ridge (Afar, Ethiopia), Geophys. Res. Lett., v. 39, L19305.
Varet, J., 2010, Contribution to Favorable Geothermal Site Selection In the Afar Triangle, ARGEO-C3, Third East African Rift Geothermal Conference, Djibouti, 22-25 November 2010, p. 139-154.
Geologic Background. Numerous phreatic explosion craters are present across the Salt Plain NNE of the Erta Ale Range in one of the lowest areas of the desolate Danakil depression. The most recent of these craters, Dallol, lies 48 m below sea level and was formed during an eruption in 1926. Colorful hot brine springs are found in the Dallol area. Another phreatic explosion was observed in January 2011.
Information Contacts: Tadiwos Chernet, Research and Development Directorate, Ministry of Mines, P.O.Box 486, Addis Ababa, Ethiopia.
Fuego
Guatemala
14.473°N, 90.88°W; summit elev. 3763 m
All times are local (unless otherwise noted)
Continuous activity and a VEI 3 eruption during 13-14 September 2012
In this report we highlight Fuego's ongoing eruptive activity during January 2011-March 2013. Elevated activity occurred during May-September 2012 and included regular thermal, gas, and ash emissions with occasional lava fountaining and pyroclastic flows. Activity peaked during 13-14 September 2012 with a VEI 3 (Volcanic Explosivity Index; where 3 is considered moderate (Newhall and Self, 1982)) summit eruption and SW-directed pyroclastic flow.
During this reporting period, continuous monitoring efforts by the Instituto Nacional de Sismologia, Vulcanología, Meteorología e Hidrologia (INSIVUMEH) included seismic monitoring, regular ground-based observations, and field visits. The Washington Volcanic Ash Advisory Center (VAAC) regularly included monitoring data from INSIVUMEH with satellite remote sensing emissions announcements. We also summarize a recent international collaboration between INSIVUMEH and the International Volcano Monitoring Fund (IVM-Fund) during 2010-2013.
Local observers reported ashfall, shockwaves, and lahars. According to INSIVUMEH, during 2011-2013, ashfall and explosive sounds were frequently reported by communities located within the W sector and up to 8 km of Fuego's summit. Lahars occurred on the S-sector flank in the Taniluyá, Ceniza, Santa Teresa, Las Lajas, and Trinidad drainages (figure 16). Those drainages were also hazardous due to channelization of pyroclastic flows, block avalanches, and lava flows (figure 17); significant events occurred in mid-to-late 2012 and February 2013 (described later in this report). On the SE flank, Las Lajas was frequently affected by pyroclastic flows, and the drainages Taniluyá and Ceniza (SW flank) occasionally contained active lava flows and block avalanches.
Thermal anomaly detection during 2011-2013. Hotspots from the summit region were detected by satellite remote sensing instruments including MODIS (onboard the Terra and Aqua satellites), Landsat 7, and EO-1 Advanced Land Imaging (ALI) throughout this reporting period.
The MODVOLC thermal alert system recorded ~90 significant anomalies between 1 January 2011 and 1 January 2012, ~375 between 1 January 2012 and 1 January 2013 when explosive activity escalated, and ~255 between 1 January 2013 and 31 March 2013 when lava flows were active near the summit region (figure 18). Thermal anomalies were detected by satellite images at least once per month from January 2011 through March 2013 except for July 2011, suggesting poor weather may have inhibited satellite observations that month (note that heaviest rainfall typically occurs during June-October (The World Bank, 2013)). During July 2011, ground-based observations of nighttime incandescence were noted in INSIVUMEH's Report # 1863; other reports that month highlighted the effects of heavy rain from tropical storms and Hurricane Calvin.
MODVOLC continued to detect hotspots during late April 2013 totaling 22 pixels during 21-28 April. Thermal anomalies became rare during May and June 2013; one pixel was detected on three different days.
Regular images captured by ALI and Landsat 7 detected variable incandescence from Fuego's summit during 2011-2013 (figure 19). During 2011, hotspots were mainly located at Fuego's summit; however, during March and December, distinctively elongate, incandescent lava flows extended from the summit to the SW (figure 19A and 19B).
Summit incandescence extending SW, SE, and in the immediate summit area was visible during 2012; some of the strongest incandescence extended at least 1 km from the summit to the SW during November-December. Incandescent flows directed SE appeared in April, June, and September. On 4 September 2012, three narrow flows were visible from the summit extending ≥ 500 m from the summit within the S sector; despite significant cloudcover that day and image artifacts, the lava flows were well-defined (figure 19C).
Satellite images from December 2012 through January 2013 included a long lava flow that persisted in the SW drainage (Ceniza), although cloudcover frequently obscured the full view of Fuego's SW quadrant. That incandescent lava flow remained visible in satellite images until late February 2013. Incandescence was isolated at the summit in early March, but on 20 March incandescence re-appeared within the Ceniza drainage and extended ~2,000 m SW of the summit (figure 19D).
Effusive activity during 2011-2013. The style of eruptive activity at Fuego changed near the end of 2010 when lava effusion events started to occur more frequently than explosive eruptions (figure 20). "At a very general level, the more Strombolian eruptions happen typically during lava effusion times and are much smaller than the more Vulcanian eruptions," commented Rüdiger Escobar-Wolf (Michigan Technological University) with respect to Fuego's more than 12 year-long eruption. Continuous unrest (background-level explosions and effusion) was frequently punctuated by short periods of elevated activity during the preceding six years and, during 2012 and 2013, this activity was interrupted by several significant episodes: in 2012, 25-26 May; 10-11 June; 3-4 and 13-14 September; and in 2013, 17-18 February; 3-4 and 19-20 March (figure 19D).
The Washington VAAC released an increasing number of notices for the aviation community about volcanic ash throughout 2011- March 2013 (table 8). During 2011, these announcements rarely contained calculated plume altitudes due to poor viewing conditions with satellite remote sensing. Data from INSIVUMEH supplemented these reports with direct observations from Fuego Volcano Observatory, located in Panimaché, 8 km SW of Fuego. On 1 January, 8 January, 23 October, and 24 December 2011, reported plume altitudes were less than 5.2 km a.s.l. and had drift speeds in the range of 2.5-10 m/s, drifting S and SW of Fuego's peak.
Table 8. The Washington VAAC released regular advisories due to emissions from Fuego during 2011-March 2013. Date, time, altitude, drift direction, and reporting sources are included as well as comments that described additional eruption characteristics such as thermal anomalies and weather conditions that may have affected observations. Drift velocities and plume width were also calculated when viewing conditions were optimal. INSIVUMEH was a frequent contributor to these reports; other reporting sources included the satellite GOES-2 (NOAA geostationary weather satellite), MWO (local Meteorological Watch Office), Guatemala City's (MGGT) meteorological reports (METAR), and the global numerical weather prediction models GFS and NAM. Courtesy of Washington VAAC.
| Date - Time (UTC) |
Altitude (km) |
Drift Direction |
VAAC Sources |
Comments |
| 01 Jan 2011 - 1515 |
5.2 |
9 km wide line; W 10 m/s |
GOES-13. GFS WINDS. |
Several small emissions. |
| 08 Jan 2011 - 1015 |
5.2 |
18.5 km wide plume; SW 2.6-5 m/s |
GOES-13. GFS WINDS. |
Multiple exhalations since 08/0600 UTC; these explosions have been seen in satellite before dissipating. |
| 13 Feb 2011 - 0504 |
-- |
-- |
GOES-13. INSIVUMEH. |
INSIVUMEH reported increased activity within the summit area; low height emissions of volcanic ash moving W; hot spot was also detected in short wave infrared imagery. |
| 14 Feb 2011 - 0427 |
-- |
-- |
GOES-13. INSIVUMEH. |
INSIVUMEH continued to report low levels of volcanic ash near the summit. |
| 15 Feb 2011 - 0427 |
-- |
-- |
GOES-13. INSIVUMEH. |
Only steam reported. |
| 23 Oct 2011 - 1327 |
-- |
-- |
GOES-13. |
Information received about a possible volcanic ash eruption. |
| 23 Oct 2011 - 1245 |
4.3 |
W 2.6-5 m/s |
GOES-13. GFS WINDS. |
Confidence in height of volcanic ash is medium-high based on movement and density of ash in models and satellite imagery. |
| 22 Nov 2011 - 1530 |
-- |
-- |
GOES-13. INSIVUMEH. |
Ash observed at 1530 UTC. |
| 22 Nov 2011 - 1745 |
-- |
-- |
Tegucigalpa MWO. GOES-13. GFS WINDS. INSIVUMEH. |
INSIVUMEH observed thin plume of possible ash moving SW at 5 m/s at 1530 UTC. This weak plume was observed in satellite imagery at 1415 UTC but had dissipated by 1545 UTC. |
| 02 Dec 2011 - 1845 |
-- |
-- |
Tegucigalpa MWO. GOES-13. GFS WINDS. INSIVUMEH. |
INSIVUMEH reported emission of gases near the summit and light ash that was too small to see in clear satellite imagery. Ash was reported to 305 m above the summit and dispersing SW around 18.5 km. |
| 06 Dec 2011 - 1845 |
-- |
-- |
GOES-13. GFS WINDS. INSIVUMEH. |
INSIVUMEH reported volcanic ash cloud to 3 km observed at 1600 UTC. No ash was observed in satellite imagery. |
| 24 Dec 2011 - 1904 |
-- |
-- |
GOES-13. INSIVUMEH SEISMIC DETECTION. |
Small narrow plume of unknown content began around 1645 UTC; VAAC received information suggesting a possible ash eruption. |
| 24 Dec 2011 - 1845 |
4 |
5.6 km wide line; S 2.5 m/s |
GOES-13. INSIVUMEH SEISMIC DETECTION. |
Small plume of gases with possible ash extended 9 km; small puff seen in visible imagery started around 1645 UTC and drifted S 2.5 m/s; estimated height 4 km a.s.l. with wind forecast uncertain. Plume was projected to dissipate within 6 hours. |
| 25 Dec 2011 - 0015 |
-- |
-- |
GOES-13. |
A possible eruption at 1845 UTC; ash not identifiable in satellite imagery; there were no reports of ash. |
| 03 Jan 2012 - 2041 |
-- |
-- |
GOES-13. |
Possible volcanic ash detected in visible imagery at 2015 UTC moving SE. |
| 03 Jan 2012 - 2045 |
5 |
3.7 km wide line; S 2.6 - 5 m/s |
GOES-13. GFS WINDS. INSIVUMEH. |
Small puff seen in visible imagery at 5 km a.s.l. moving SE 3.5 m/s. At 2045 UTC the leading edge was 12 km SE of summit and dispersing. Plume was projected to dissipate within 6 hours. |
| 16 Jan 2012 - 1724 |
-- |
-- |
INSIVUMEH. |
The VAAC received information suggesting a possible volcanic ash emission. |
| 16 Jan 2012 - 1740 |
-- |
-- |
GOES-13. GFS WINDS. INSIVUMEH. |
INSIVUMEH reported ash to 4.3 km; no ash seen in imagery through 1715 UTC with clear skies. |
| 18 Jan 2012 - 1215 |
6.7 |
W at 5-7.5 m/s |
GOES-13. GFS WINDS. |
Visible and multi-spectral imagery showed a single puff of gas and ash moving W from the summit; ash was projected to dissipate within a few hours as it continued W. A hotspot was detected. |
| 01 Feb 2012 - 1645 |
-- |
-- |
GOES-13. GFS WINDS. INSIVUMEH. |
INSIVUMEH reported ash to ~5 km at 01/1600 UTC; ash not observed in satellite imagery even with sparse clouds. |
| 01 Apr 2012 - 1315 |
5 |
9.3 km wide line; SW 2.6-5 m/s |
GOES-13. GFS WINDS. NAM WINDS. |
Plume extended 13 km WSW from the summit; well-defined hotspot seen in imagery; forecast confidence was low based on latest GFS and NAM. |
| 19 May 2012 - 0915 |
-- |
-- |
GOES-13. GFS WINDS. INSIVUMEH. |
Ash was not seen in satellite imagery due to darkness; hotspot was visible; INSIVUMEH reported volcanic ash up to 5.5 km a.s.l. to 40 km SW of the summit. |
| 19 May 2012 - 1515 |
-- |
-- |
GOES-13. GFS WINDS. INSIVUMEH SEISMIC DETECTION. INSIVUMEH Photos. |
Ash was not seen in satellite imagery due to cloudcover; a strong hotspot was visible in satellite multispectral imagery; seismicity was high. |
| 19 May 2012 - 2045 |
-- |
-- |
GOES-13. GFS WINDS. METAR.
INSIVUMEH. |
Volcanic ash was not detected in satellite imagery due to extensive cloud cover; INSIVUMEH indicated pyroclastic flows likely and ashfalls have been observed. |
| 20 May 2012 - 0245 |
-- |
-- |
GOES-13. GFS WINDS. |
Ash was not observed in satellite imagery due to cloudcover; hotspot had decreased in intensity and late afternoon bulletin indicated decreased energy. |
| 20 May 2012 - 1415 |
-- |
-- |
GOES-13. NAM WINDS. INSIVUMEH. |
No ash was observed in imagery although there were thick clouds in the area; INSIVUMEH reported ash emissions up to 3,000 m above the summit moving SW. |
| 20 May 2012 - 1945 |
-- |
-- |
GOES-13. GFS WINDS. INSIVUMEH SEISMIC DETECTION. |
No ash was seen in imagery due to cloudcover; seismic signal has almost gone to background but with very occasional bursts that may contain volcanic ash. |
| 21 May 2012 - 0045 |
-- |
-- |
GOES-13. GFS WINDS. INSIVUMEH. |
No volcanic ash detected due to cloudcover; INSIVUMEH's evening report only mentioned occasional emission of ash to 4 km a.s.l. or just above the crater drifting SW and dispersed within 9.3 km; seismic activity was back to normal with only occasional small bursts. |
| 25 May 2012 - 1542 |
-- |
--; |
GOES-13. INSIVUMEH. |
Eruption of lava began around 1300 UTC; some volcanic ash was possible. |
| 25 May 2012 - 1615 |
-- |
-- |
GOES-13. GFS WINDS. INSIVUMEH SEISMIC DETECTION. METAR. Pilot Report. INSIVUMEH. |
No plume was seen in satellite imagery due to partly cloudy conditions; pilot report of ash to 7 km a.s.l. moving SW; lava flows generated volcanic ash and gas; no explosive eruption seen in the seismic records; ash was forecasted to moving SW; a strong hotspot was visible in satellite imagery. |
| 26 May 2012 - 0415 |
-- |
-- |
GOES-13. GFS WINDS. |
Volcanic ash was not detected in satellite imagery due to extensive cloudcover; INSIVUMEH indicated constant pyroclastic flows and reports of ashfall. |
| 26 May 2012 - 1015 |
-- |
-- |
GOES-13. GFS WINDS. SEISMIC
DETECTION. |
Volcanic ash was not seen due to darkness and weather conditions; strong hot spot was visible in satellite imagery and seismic activity remained elevated. |
| 26 May 2012 - 1615 |
-- |
-- |
GOES-13. GFS WINDS. INSIVUMEH SEISMIC DETECTION. |
Ash was not seen in imagery due to cloud cover; INSIVUMEH indicated that ash and gas emissions continued. |
| 26 May 2012 - 2215 |
-- |
-- |
GOES-13. GFS WINDS. INSIVUMEH SEISMIC DETECTION. |
Ash was not seen in satellite imagery due to cloudcover; INSIVUMEH reported decreasing seismicity; a hot spot persisted in multispectral imagery. |
| 27 May 2012 - 0415 |
-- |
-- |
GOES-13. INSIVUMEH. |
INSIVUMEH indicated ongoing lava flows; decreasing seismic activity and no mention of ashfall in the most recent report. |
| 05 Jun 2012 - 1732 |
-- |
-- |
GOES-13. INSIVUMEH. |
INSIVUMEH reported increasing activity and suggested that an explosive eruption with little or no warning was possible; hot spot was seen in satellite imagery but no volcanic ash due to cloud cover. |
| 06 Jun 2012 - 1729 |
-- |
-- |
GOES-13. INSIVUMEH. |
INSIVUMEH reported intermittent explosions expelling ash and gas up to ~600 m above the summit; they warned that an explosive eruption with little or no warning was possible. |
| 07 Jun 2012 - 1715 |
-- |
-- |
GOES-13. INSIVUMEH. |
INSIVUMEH reported activity that was limited to within 11 km of the summit; no ash was visible in satellite imagery due to partly cloudy conditions. |
| 11 Jun 2012 - 0945 |
-- |
-- |
Tegucigalpa MWO. GOES-13. GFS WINDS. INSIVUMEH. |
No ash seen in satellite imagery due to nighttime darkness; hotspots see for last few hours. INSIVUMEH reported ash to 5 km. |
| 11 Jun 2012 - 1545 |
-- |
-- |
GOES-13. INSIVUMEH. |
No ash was seen in imagery although there was some cloudcover; there was a strong hotspot occasionally seen in shortwave imagery; INSIVUMEH reported continuous ash emissions up to 15 km to the W and WNW of volcano. |
| 21 Jun 2012 - 1552 |
-- |
-- |
Tegucigalpa MWO. GOES-13.
GEOPHYSICAL INST. EMAILED PHOTOS. |
No ash detected due to cloudcover; INSIVUMEH reported ash moving E from rockfalls and aided by heat of lava flows; bit hotspots were visible through clouds. |
| 21 Jun 2012 - 2138 |
-- |
-- |
GOES-13. GFS WINDS. |
No ash detected in visible satellite imagery due to cloudcover; hotspot seen in infrared imagery. |
| 22 Jun 2012 - 0340 |
-- |
-- |
GOES-13. GFS WINDS. |
No ash seen in visible or multispectral satellite imagery due to night time darkness and cloudcover; hotspot observed prior to clouds moving in 22/0015 UTC. |
| 03 Sep 2012 - 1415 |
4.3/5.2 |
5.6 km wide line; SW 5-7.5 m/s
7.4 km wide line; W 2.6-5 m/s |
GOES-13. GFS WINDS. |
Ash plume height confidence is medium, the estimation is based on models and history of volcanic activity; a well-defined hotspot was seen overnight. |
| 03 Sept 2012 - 2015 |
-- |
-- |
GOES-13. GFS WINDS. INSIVUMEH SEISMIC DETECTION. |
Due to clouds, no good detection of ash but before the clouds arrived, faint ash was seen W-SW as far as 27.7 km; strong hotspots due to lava flows and rockfalls. |
| 04 Sep 2012 - 0145 |
-- |
-- |
GOES-13. GFS WINDS. INSIVUMEH SEISMIC DETECTION. |
No ash detected due to clouds and darkness; multiple hotspots were seen due to rockfalls and lava flows; some ashfall was reported SW of the summit up to 13 km. |
| 04 Sep 2012 - 0445 |
4.5 |
W 2.6-5 m/s |
GOES-12. GFS WINDS. INSIVUMEH SEISMIC DETECTION. |
A plume was visible in multispectral imagery extending about ~145 km W of the summit. |
| 04 Sep 2012 - 1015 |
4.5 |
W 2.6-5 m/s |
GOES-13. |
A continuous emission of ash was visible in multispectral imagery extending ~145 km W of volcano; large hotspot was detected by shortwave imagery. |
| 04 Sep 2012 - 1615 |
-- |
-- |
GOES-13. GFS WINDS. INSIVUMEH. |
Ash was not seen due to weather conditions; strong hotspot remains in thermal imagery and INSIVUMEH reported elevated seismic activity. |
| 04 Sep 2012 - 2145 |
-- |
-- |
GOES-13. GFS WINDS. INSIVUMEH SEISMIC DETECTION. |
No ash or hotspots detected due to thick clouds; INSIVUMEH reported continued lava flows and rockfalls that generated ash to ~4.5 km a.s.l. moving SW; ashfall was reported up to 15 m SW and W of the summit. |
| 05 Sep 2012 - 1545 |
-- |
-- |
GOES-13. INSIVUMEH. |
Ash not seen in the satellite imagery due to partly cloudy skies; a faint hotspot was visible in the morning; INSIVUMEH confirmed that no ash emissions were detected. |
| 13 Sep 2012 - 1115 |
5 |
W 7.5 m/s |
GOES-13. GFS WINDS. INSIVUMEH. |
Faint plume was detected with multispectral imagery that extended ~111 km W; INSIVUMEH reported ash up to 1,000 m above the summit and moving W and SW. |
| 13 Sep 2012 - 1602 |
4.5 /6.7 |
SW 7.5 m/s / SW 7.5-10 m/s |
GOES-13. GFS WINDS. INSIVUMEH. |
INSIVUMEH reported new emission to 3,000 m above the summit W and SW of the summit. 13/1602 UTC image showed a dense ash plume spreading W and SW. Imagery through 13/1632 UTC showed dense volcanic ash emissions continuing. |
| 13 Sep 2012 - 2045 |
7.3 |
W 10-13 m/s |
GOES-13. GFS WINDS. METAR.
INSIVUMEH. |
Ash plume was 148 km wide and extended 226 km W of summit; ash was reported at MGGT METAR station. |
| 14 Sep 2012 - 0045 |
7.3 |
W 10-13 m/s |
GOES-13. GFS WINDS. METAR.
INSIVUMEH. |
Ash plume was 111 km wide and extended 417 W of the summit; ash closest to summit was obscured by cloudcover and was likely rained out; METAR from MGGT continued to report ash. |
| 14 Sep 2012 - 0710 |
4.3 /7.3 |
W 5 m/s / W 5 m/s |
GOES-13. GFS WINDS. INSIVUMEH. |
A bright hotspot persisted with a small plume in multispectral imagery extending 36 km to the W of the summit; latest report indicated current activity was more intermittent and lower in height; larger area to 7.3 km a.s.l. continued to dissipate about 648 km to W of summit moving W. |
| 14 Sep 2012 - 1245 |
4 /7.3 |
W 7.5-10 m/s / W 10-13 m/s |
GOES-13. GFS WINDS. METAR.
INSIVUMEH. |
Multispectral imagery showed dissipating ash to 7.3 km a.s.l. between 370 km and 926 km W moving W; in addition, continuous attached plume to 4 km a.s.l. was seen moving SW; local surface observations reported 4 km a.s.l. |
| 14 Sep 2012 - 1845 |
6 |
W 10 m/s |
GOES-13. GFS WINDS. INSIVUMEH. |
A dissipating area of ash, about ~1,000 km W of the summit, was detected in multispectral imagery; no ash was seen near the summit at 1845 UTC; INSIVUMEH reported ash emissions within 15 km of the summit. |
| 15 Sep 2012 - 0045 |
-- |
-- |
GOES-13. GFS WINDS. INSIVUMEH SEISMIC DETECTION. |
No ash was detected in satellite imagery; the previous plume located S of Mexico had dispersed around 14/2200 UTC. INSIVUMEH reported weaker seismic activity with rockfalls generating ash plumes to 4 km a.s.l. and 15 km W-SW of the summit; a strong hotspot was visible. |
| 29 Sep 2012 - 1245 |
-- |
-- |
GFS WINDS. GOES-14. INSIVUMEH. |
In the morning, satellite imagery detected discreet puffs of ash moving W and WSW from the summit; INSIVUMEH reported ash 500 m to 900 m above the summit with fine ashfall. |
| 17 Feb 2013 - 0544 |
-- |
-- |
GOES-13. INSIVUMEH. |
INSIVUMEH reports incredible outpouring of lava from the crater which is confirmed by brilliant hot spot in satellite imagery; INSIVUMEH reported no ash plume at the moment, but emissions are possible over the next few hours up to 10 km to the S and SW of the summit. |
| 17 Feb 2013 - 1315 |
5 |
W 2.6-5 m/s |
Tegucigalpa MWO. GOES-13. GFS WINDS. INSIVUMEH. |
In the morning, visible imagery showed a plume of ash extending 18.5 km to the W of the volcano; INSIVUMEH reported ash to 4.8 km a.s.l. |
| 17 Feb 2013 - 1445 |
5 |
W |
Tegucigalpa MWO. GOES-13. GFS WINDS. INSIVUMEH. |
Imagery showed ash moving W-SW and S from the volcano; at 17/1445 UTC ash extended 18.5 km SW and 5.6 km S of the volcano. |
| 17 Feb 2013 - 2015 |
5.2 |
0-5 m/s |
Tegucigalpa MWO. GOES-13. GFS WINDS. INSIVUMEH. |
Ongoing emissions of lava with gas and light ash; in imagery the ash is mixed with clouds and, due to light winds spreading N-W-SW from the summit ~13 km; this is mainly a lava event but some light ashfall was being reported in cities on the slopes of the volcano. |
| 18 Feb 2013 - 0815 |
-- |
-- |
GOES-13. GFS WINDS. INSIVUMEH. |
Ongoing lava emission with gases and light ash; no ash detected due to large thunderstorm that developed SW of summit and regional cloudcover. INSIVUMEH reported in the afternoon that less energetic lava, gas, and ash events were occurring. |
| 03 Mar 2013 - 2345 |
-- |
-- |
GOES-13. GFS WINDS. INSIVUMEH. |
Lava emission with occasional light ash due to rockfalls and small venting; hotspot due to lava but no ash was visible in satellite imagery; plume drifted up to 9 km according to INSIVUMEH; wind forecast was light and variable, so the plume was expected to remain close to the summit region. |
| 04 Mar 2013 - 0334 |
-- |
-- |
GOES-13. GFS WINDS. INSIVUMEH. |
An INSIVUMEH special report indicated that a new stage of emissions began and possible ash fall was likely around 18.5 km from the summit. Ash was not seen in multispectral satellite imagery; a very large hotspot was observed with infrared. |
| 04 Mar 2013 - 0845 |
-- |
-- |
GOES-13. GFS WINDS. |
Ash was not seen in overnight satellite imagery; very large and bright hotspot was detected with infrared sensors; emissions of gas and ash were likely. |
| 04 Mar 2013 - 1315 |
4.3 |
moving NE 5-7.5 m/s |
GOES-13. GFS WINDS. INSIVUMEH. |
Ongoing emissions; satellite imagery showed a faint ash plume 13 km wide and extending 42.5 km NE of the summit; a very bright hot spot was detected with infrared sensors. |
| 04 Mar 2013 - 1915 |
-- |
-- |
GOES-13. GFS WINDS. INSIVUMEH. |
Ongoing emissions; ash was too light to be seen in visible satellite imagery although reports indicate that ash was present; a strong hot spot persisted. |
| 05 Mar 2013 - 0115 |
-- |
-- |
Tegucigalpa MWO. GOES-13. |
Ongoing activity; Tegucigalpa MWO canceled Sigmet for the event; a well-defined hotspot was visible in multi-spectral imagery; no ash was present in the last visible images of the day. |
| 18 Mar 2013 - 1345 |
4.3 |
moving SW 2.6-5 m/s |
Tegucigalpa MWO. GOES-13. GFS WINDS. |
Very light volcanic ash emissions; MWO indicated ash moving SW; the ash had a SSW component in satellite imagery and was very light in nature. |
| 18 Mar 2013 - 1945 |
-- |
-- |
GOES-13. GFS WINDS. INSIVUMEH. |
Emissions of gas and occasional light ash were near the summit; no ash was detected or reported in cloudy conditions; INSIVUMEH reported near-summit emissions of gas and occasional, very light ash below 4.3 km a.s.l. and within 9 km of the summit. |
| 19 Mar 2013 - 2232 |
-- |
-- |
GOES-13. GFS WINDS. INSIVUMEH. |
INSIVUMEH reported ash to 5 km a.s.l. at 19/2045 UTC moving SE at 5 m/s; ash not visible in imagery; special observatory report indicated elevated activity with the volcano; a persistent hotspot was present since 1915 UTC and had become increasingly bright in the past hour. |
| 20 Mar 2013 - 0415 |
-- |
-- |
GOES-13. GFS WINDS. INSIVUMEH SEISMIC DETECTION. |
Ash plume was not identifiable in multispectral satellite imagery; a bright hotspot was detected with infrared sensors; occasional bursts of seismic activity were reported; SIGMET reports ash to 5 km a.s.l. moving SE at 5 m/s. |
| 20 Mar 2013 - 1015 |
-- |
-- |
GOES-13. GFS WINDS. |
Near summit emissions of gases and occasional light volcanic ash; although brilliant hot spot was readily apparent in satellite imagery, no ash was detected under partly cloudy conditions. |
| 21 Mar 2013 - 1332 |
5.5 |
E 7.5 m/s |
GOES-13. GFS WINDS. |
Intermittent emissions; ash emissions and a persistent hotspot were observed in satellite imagery in clear skies; several discreet puffs were noted; ash plume extends ~32 km to the ESE of the volcano. |
| 28 Mar 2013 - 1315 |
4.6 |
W 2.6 - 5 m/s |
GOES-13. INSIVUMEH. ECMWF HIRES WINDS. |
Continuous emissions; a series of emissions has resulted in an ash plume extending up to 18.5 km to the WSW of the summit. |
| 30 Mar 2013 - 1415 |
5 |
S 8 m/s |
GOES-13. GFS WINDS. INSIVUMEH SEISMIC DETECTION. |
INSIVUMEH reported degassing with occasional bursts of ash at 1240 UTC, 1330 UTC, and 1415 UTC; multibursts of gas and ash seen moving to S and SE from the summit extending 55.5 km from the summit and dispersing; light ashfall was reported within 18.5 km of the summit. |
| 30 Mar 2013 - 1945; |
5 |
S 2.6-5 m/s |
GOES-13. GFS WINDS. |
Ongoing emissions; satellite imagery showed a 20 km wide plume of light ash extending 13 km S of the summit; ash was expected to disperse within 6 hours. |
| 31 Mar 2013 - 1345 |
-- |
-- |
GOES-13. GFS WINDS. INSIVUMEH. |
Ongoing emissions; ash not seen in satellite imagery under clear skies; however, sun may be preventing light ash from being observed; ash had been reported in the village of Panimaché. |
| 31 Mar 2013 - 1945 |
-- |
-- |
GOES-13. GFS WINDS. INSIVUMEH. |
Continuous gas emissions with occasional short bursts of light ash; INSIVUMEH reported continued gas emissions with short bursts of light ash moving S; ashfall was reported within 9.3 km of the summit; ash not seen in satellite imagery due to cloud cover around the summit. |
During 2011, INSIVUMEH reported that Fuego's activity included small-scale explosions and effusive lava flows. Lava flow activity was reported mainly during late March, late April, June, and early July. The longest lava flows traveled SW within the Ceniza and Santa Teresa drainages. Maximum flow lengths were in the range of 100-200 m and were frequently incandescent at night during spalling events.
Escalating summit activity during 2012. In early 2012, three VAAC advisories included plume altitudes as high as 6.7 km a.s.l. and drift directions up to 7.5 m/s S, SW, and W (table 8). INSIVUMEH reported that during the first week of January 2012, the Alert Level was raised to Yellow due to elevated activity; incandescent explosions were observed during 18-19 and 23 January. Lava flows and intermittent incandescent spatter continued from the summit throughout the rest of this reporting period (2011-March 2013).
The Coordinadora Nacional para la Reducción de Desastres (CONRED) announced Alert Level Orange (third highest on a four-color scale) and evacuations from El Porvenir in Alotenango (9 km ENE) on 19 May due to escalating activity (figure 21). Energetic Strombolian eruptions occurred during 19-20 and 25-27 May. Pyroclastic flows during 25-26 May were directed E and SE (impacting the Las Lajas and El Jute drainages), unlike previous events that concentrated flows within the W sector. Significant populations, resorts, and infrastructure such as the RN-14 road are located along the Las Lajas and El Jute drainages.
During May-June, there were ~20 VAAC advisories that highlighted INSIVUMEH observations and the possibility of ash plumes; satellite observations and calculations of plume altitudes, however, were not available (table 8). INSIVUMEH reported lava flows throughout May-August (extending up to 1.7 km from the summit and as wide as 25 m) and pyroclastic flows occurred during May.
Increased explosivity at Fuego during September 2012. During the first week of September 2012, the Washington VAAC issued advisories describing ash plumes up to 5.2 km a.s.l. (table 8). A large event, on 3 September, generated two ash plumes dispersing SW and W, the former was ~5.5 km wide, and the latter was ~7.5 km wide. Ash plumes and hot spots continued to be visible within satellite images through 4 September (figure 19C) with INSIVUMEH reporting a lack of ash clouds on 5 September, followed by a break in reports until the major eruption on 13 September.
Beginning at 0400 on 13 September, a significant eruption occurred which led to evacuations from local communities within a 10-km radius (figures 22 and 23). At 0715, a vertical plume erupted from the summit. Large pyroclastic flows were generated between 0900 and 1000 local time which became channelized within two drainages. Within the Las Lajas drainage (on the SE flank), flows reached as far as 2 km from the summit; within the Ceniza drainage (SSW flank), they traveled as far as 7.7 km, stopping just 3 km short of Panimaché. On 14 September, the Washington VAAC reported ash plumes up to 7.3 km a.s.l. that drifted W at ~10 m/s (table 8).
In a special report by INSIVUMEH, the 13-14 September 2013 eruption was described as the largest explosive event within the last 13 years; they assigned the event VEI 3 (Volcanic Explosivity Index) based on the volume of pyroclastic material. This was the first eruption since 1974 that directly impacted the S and SW zones of Fuego, areas within 5-7 km of the summit that contained numerous small villages (figure 24). Approximately 10,600 people were evacuated from Panimaché I, Panimaché II, Sangre de Cristo, Morelia, and El Porvenir (figure 16) to the town of Santa Lucía Cotzumalguapa (18 km SW). INSIVUMEH estimated that ~5 mm of ashfall accumulated in those regions closest to the channelized pyroclastic flows. Ashfall damaged coffee and other agricultural crops in the region and congested the air, decreasing visibility in many communities within 10 km of the summit.
Prior to the eruption, there wsa a notable increase in LP seismicity and high-amplitude tremor that lasted for hours. INSIVUMEH seismic records became saturated between 0947 and 0949, the time period when observers noted ash plumes rising from the summit (figure 7). During the explosive event that began at 0400 on 13 September 2012, a lava flow advanced 300 m down the flank from the S side of the summit crater. At roughly the same time, a vertical plume rose from the crater and drifted SW; strong ENE winds rapidly spread the ash into the coastal Suchitepéquez Department. At 0715 the ash plume had risen up to 2 km above the summit crater; by 1500 that day, a diffuse ash plume was reported over the S region Mexico's Chiapas Province. The ash continued to expand W and NW on 14 September, and was ~100 km wide and more than 415 km W of the summit (table 8 and figure 10); ash persisted in the atmosphere for more than 36 hours.
Seismicity and surface activity returned to low levels after the powerful 13-14 September 2012 eruption. Field studies conducted by INSIVUMEH determined that the Las Lajas, El Jute, Trinidad, and Ceniza drainages received the largest concentration of volcanic material during the eruption, making these regions susceptible to lahars with the onset of the rainy season.
Within the Ceniza drainage, in particular, pyroclastic flows had extended ~8 km (figures 17 and 26) and had deposited tree branches and trunks (many that were charred) within the canyon along with large (1-3 m diameter) blocks and volcanic bombs. Preliminary assessments of the deposits within the Ceniza drainage determined that ~13,000,000 m3 of material had been deposited and was already becoming mobilized.
Assessments by INSIVUMEH at the end of 2012 determined that two months of heavy rain had cut deep incisions into the new deposits and that loose, fine-grained volcaniclastic material had already migrated down to the road crossing at Siquinala and San Andrés Osuna, ~13 km SSW of the summit. The study also described the increased vulnerability of the road access for Siquinala and the community of La Róchela (figure 16) due to possible stream capture by Ceniza with Platanares. A narrow (~15 m) zone of the Ceniza drainage had been filled with volcaniclastic material, changing the drainage profile in a location ~2 km upstream from an important stream crossing. The Ceniza drainage had been migrating laterally toward the Platanares over time, especially due to erosion following Tropical Storm Agatha in 2010.
Explosive and effusive activity continued during September 2012-March 2013.From late September 2012 through March 2013, INSIVUMEH documented ash plumes (100-1,300 m above the crater), incandescent spatter (50-200 m above the crater), lava flows (mainly flowing 100-900 m down the SW flank), and lahars. In 2012, hot lahars were reported on 1 June, and later on 27 September and 3 October. Lava flows were frequently channelized within the Ceniza, Trinidad, and Taniluya drainages (SW flank). The last significant VAAC report of 2012 highlighted discreet puffs of ash that reached a maximum of 900 m above the crater on 29 September (table 8).
Large pyroclastic flows on 16 and 17 February 2013 traveled 3 km down the Ceniza drainage (table 8). Ash plumes generated on 16 February caused ashfall in communities up to 12 km from the summit, primarily SW. On 17 February there were collapses at lava-flow fronts.
On 4 March 2013 there were large lava flows following incandescent explosions up to 100 m above the crater (table 8).
On 19 March an explosive eruption occurred with effusive lava flows; a ~5 km a.s.l. ash plume was detected by the Washington VAAC (table 8). Lava fountaining reported on 20 March rose 300-400 above the crater; a ~1.5 km long lava flow within the Ceniza drainage was also observed that day (figure 19D). Incandescent explosions were frequently observed through the rest of the month.
International collaboration aids monitoring capabilities in 2013. In 2010, a partnership was established between INSIVUMEH observatories and the International Volcano Monitoring Fund (IVM-Fund), a non-profit organization based in Seattle, WA. After a successful project to improve monitoring efforts at the Santiaguito Volcano Observatory (OVSAN), the IVM-Fund began working with the Fuego Volcano Observatory (OVFGO), located in Panimaché, in 2012. During March 2013, this observatory received significant support from the IVM-Fund and international donors. Jeff Witter, president and CEO of the IVM-Fund, delivered ~$4,500 worth of field equipment to OVFGO to help outfit the observers and contribute to volcano monitoring capacity in Guatemala (figure 27). Additional visits to Guatemala are planned once sufficient funds are raised to continue the IVM-Fund's collaborative work with Guatemalan volcanologists. Volcano monitoring support projects between the IVM-Fund and INSIVUMEH are planned to address additional needs at OVFGO and OVSAN.
References. CATHALAC, 2012, "Preliminary Analysis of the Eruption of Volcan de Fuego, Guatemala -- 13 September 2012," posted on 27 September 2012, https://servirglobal.net/Global/Articles/tabid/86/Article/1169/preliminary-analysis-of-the-eruption-of-volcan-de-fuego-guatemala-13-september.aspx, accessed on 17 July 2013.
Escobar-Wolf, R., 2013, Volcanic processes and human exposure as elements to build a risk model for Volcán de Fuego, Guatemala [PhD Dissertation]: Houghton, MI, Michigan Technological University.
Newhall, C.G., and Self, S., 1982, The volcanic explosivity index (VEI): An estimate of explosive magnitude for historical volcanism, Journal of Geophysical Research: 87, 1231-1238.
The World Bank, 2013, Country Data: Guatemala Climate Change, http://data.worldbank.org/country/guatemala, accessed on 18 June 2013.
Geologic Background. Volcán Fuego, one of Central America's most active volcanoes, is also one of three large stratovolcanoes overlooking Guatemala's former capital, Antigua. The scarp of an older edifice, Meseta, lies between Fuego and Acatenango to the north. Construction of Meseta dates back to about 230,000 years and continued until the late Pleistocene or early Holocene. Collapse of Meseta may have produced the massive Escuintla debris-avalanche deposit, which extends about 50 km onto the Pacific coastal plain. Growth of the modern Fuego volcano followed, continuing the southward migration of volcanism that began at the mostly andesitic Acatenango. Eruptions at Fuego have become more mafic with time, and most historical activity has produced basaltic rocks. Frequent vigorous historical eruptions have been recorded since the onset of the Spanish era in 1524, and have produced major ashfalls, along with occasional pyroclastic flows and lava flows.
Information Contacts: Gustavo Chigna M., Instituto Nacional de Sismologia, Vulcanología, Meteorología e Hidrologia (INSIVUMEH), Ministero de Communicaciones, Transporto, Obras Públicas y Vivienda, 7a. Av. 14-57, zona 13, Guatemala City 01013, Guatemala (URL: http://www.insivumeh.gob.gt/inicio.html); Coordinadora Nacional para la Reducción de Desastres (CONRED), Av. Hincapié 21-72, Zona 13, Guatemala City, Guatemala (URL: http://conred.gob.gt/www); Washington Volcanic Ash Advisory Center (VAAC), NOAA Science Center Room 401, 5200 Auth road, Camp Springs, MD 20746, USA (URL: http://www.ospo.noaa.gov/Products/atmosphere/vaac/); Rüdiger Escobar-Wolf, Michigan Technological University, Department of Geological and Mining Engineering and Science, Houghton, MI, USA (URL: http://www.geo.mtu.edu/); Hawai`i Institute of Geophysics and Planetology (HIGP) Thermal Alerts System (MODVOLC), School of Ocean and Earth Science and Technology (SOEST), Univ. of Hawai`i, 2525 Correa Road, Honolulu, HI 96822, USA (URL: http://modis.higp.hawaii.edu/); Jeff Witter, International Volcano Monitoring Fund (IVMF) (URL: http://www.ivm-fund.org/guatemala-fuego/); NASA/USGS Landsat Program (URL: https://landsat.usgs.gov/); and NASA ALI (URL: http://eo1.gsfc.nasa.gov/).
Gaua
Vanuatu
14.281°S, 167.514°E; summit elev. 729 m
All times are local (unless otherwise noted)
Hazard status raised; emissions continue into 2013; plume observed from above
In our June 2012 Bulletin report (BGVN 37:06), we noted ongoing eruptions from Gaua during much of 2011. On 5 December 2011, the Vanuatu Meteorology and Geohazards Department (VMGD) changed the status of Gaua volcano from a dormant to an active volcano.
The Wellington Volcanic Ash Advisory Center (VAAC) reported that on 29 April 2013 a plume from Gaua was observed from an aircraft. Satellite imagery did not indicate ash. Astronauts on the International Space Station saw and photographed Gaua's E-blowing plume on 31 May 2013 (figure 24). During the year ending in mid-July 2013, there were no MODVOLC thermal alerts.
The Alert Level remained at level 1 (out of 4) signifying that changes in activity could occur without, or with little, warning. VMGD continued this status through at least mid-August 2013, although they noted a slight increase in tremor since their June report. This status indicates that ashfalls will continue to be expected in areas exposed to trade winds. Strong degassing of the volcano could be accompanied by acid rainfall.
Geologic Background. The roughly 20-km-diameter Gaua Island, also known as Santa Maria, consists of a basaltic-to-andesitic stratovolcano with an 6 x 9 km summit caldera. Small vents near the caldera rim fed Pleistocene lava flows that reached the coast on several sides of the island; littoral cones were formed where these lava flows reached the ocean. Quiet collapse that formed the roughly 700-m-deep caldera was followed by extensive ash eruptions. The active Mount Garet (or Garat) cone in the SW part of the caldera has three pit craters across the summit area. Construction of Garet and other small cinder cones has left a crescent-shaped lake. The onset of eruptive activity from a vent high on the SE flank in 1962 ended a long period of dormancy.
Information Contacts: Vanuatu Geohazards Observatory (URL: http://www.vmgd.gov.vu/vmgd/); Vanuatu Meteorology and Geohazards Department (URL: http:// http://www.meteo.gov.vu/); Wellington Volcanic Ash Advisory Center (VAAC) (URL: vaac.metservice.com); and Hawai'i Institute of Geophysics and Planetology, MODVOLC Thermal Alert System, School of Ocean and Earth Science and Technology (SOEST), Univ. of Hawai'i , 2525 Correa Road, Honolulu, HI 96822 USA (URL: http://modis.higp.hawaii.edu/).
Kilauea (United States) — May 2013 Cite this Report
Kilauea
United States
19.421°N, 155.287°W; summit elev. 1222 m
All times are local (unless otherwise noted)
Summary of highlights for 2010-2012
The following is a concise summary of reports by the U.S. Geological Survey-Hawaiian Volcano Observatory (HVO) on Kīlauea volcano covering the 3 years 2010-2012. Volcano highlights for 2009 were covered in BGVN 38:02.
Figure 209 shows a map of the lava-flow field on Kīlauea's east rift zone as of 26 July 2013. On this map some of the older lava flows are labeled with the years during which they were active. Other maps appearing in earlier Bulletin reports indicated important features such as Napau crater, Pu'u 'O'o. HVO posts both Daily and Weekly updates on Kīlauea activity (at links provided in the Information Contacts section below).
The Hawaiian Volcano Observatory (HVO) celebrated its centennial in January 2012 and the 30th year of Kīlauea's ongoing eruption, now active at its summit and east rift zone, on 3 January 2013.
Orr and others (2012) summarized Kīlauea's 30-year-long eruption, furnishing the following excerpt from the 2010-2012 period in that report.
Summary of 2010-2012. Regarding this interval, Orr and others (2012) made the following comments. "In January 2010 . . . the tube system broke down [enabling lava to escape from the tube] and surface flows began moving toward the east, encroaching on the Kalapana area once again. Three more houses were destroyed between July 2010 and March 2011, when the surface flows faltered.
"2011-2013: History Repeats Itself.
"Pu'u 'O'o began to refill slowly during 2010, and by early March 2011, the crater floor was within 65 feet (20 meters) of the crater's east rim. On March 5, 2011, following rapid summit deflation and increased seismicity, the crater floor of Pu'u 'O'o collapsed. Within a few hours, it had dropped 380 feet (115 meters). Shortly thereafter, lava broke to the surface between Pu'u 'O'o and Napau Crater, marking the start of the Kamoamoa fissure eruption, which was active through March 9. Reminiscent of Kīlauea's 1997 and 2007 East Rift Zone fissure eruptions, the Kamoamoa eruption cut the lava supply to the active tube, causing activity on the flow field to die.
"After 2 weeks of quiet, lava reappeared in Pu'u 'O'o on March 26, and a perched lava lake developed as the crater refilled. In late June, wholesale uplift of the crater floor raised the entire lava lake until its surface was higher than the eastern and western crater rims. Leaks from the "ring" fault bounding the uplifted area resulted in lava overflowing the crater for the first time since 2004, sending flows down the southwestern flank of Pu'u 'O'o. {Note that this is discussed further below.}
"On August 3, 2011, the crater floor of Pu'u 'O'o collapsed again when lava burst through Pu'u 'O'o's west flank, burying the western base of the cone in a massive flood of lava. The floor of the crater dropped 260 feet (80 meters), accompanied by the collapse of large slabs of rock from the crater walls into the resulting pit. The flow on the west side of Pu'u 'O'o diminished greatly after the first several hours but remained active until August 15.
"As in March, lava returned to Pu'u 'O'o within days of the August outbreak, but this time the crater filled quickly. By September 10, lava had begun to overflow the crater again, with flows spilling toward the northeast and southwest. This activity ended on September 21, when the northeastern flank of the cone fractured and lava began pouring out.
"Confined to a shallow valley between older Pu'u 'O'o flow fields, lava turned again toward the volcano's S coast. In March 2012, lava flows destroyed another house-the 214th since 1983-within the now-abandoned Royal Gardens subdivision {approximate location shown in figure 209}.
"Unlike past years, however, eruptive activity throughout 2012 was relatively weak. Lava flows were almost always active on the coastal flow field but failed to make significant forward progress. Finally, in late November, lava reached the coastline for the first time in nearly 11 months, forming a small and sporadic ocean entry. This marked the end to the longest period without an ocean entry since lava first reached the water in 1986.
"As the eruption enters its 31st year in 2013, it is showing no signs of stopping, despite the recent slow down in activity. What Kīlauea Volcano has in store next remains to be seen. Although recent patterns suggest continued activity on the East Rift Zone, this could change abruptly. Even a return to Kīlauea's more explosive past is possible (see USGS Fact Sheet 2011-3064, Kīlauea-an Explosive Volcano in Hawai'i, available at http://pubs.usgs.gov/fs/2011/3064 {Swanson and others, 2011}). What is certain is that Kīlauea will remain an active volcano for millennia to come."
More details on 2010-2012 events. HVO reporting disclosed events presented below (tables 6-8), including a brief summary of 2010-2012 events (table 5), a broad overview of the eruption during 2007-2012 (table 6), and several of the notable collapses during 2010-2011 (table 7).
Table 6. Brief summary of events at Kīlauea during the period 2010-2012. Courtesy of various USGS/HVO reports (periodic, fact sheets, etc.).
| Date(s) |
Event |
| 04 Jan 2010 |
Cessation of Waikupanaha ocean entry after 22 months |
| 25 Jan-10 Mar 2010 |
Persistent flow through Royal Gardens and out onto the coastal plain |
| Feb or Mar 2010 |
Small collapse of E wall Pu'u 'O'o crater rim |
| 29 Apr-30 Nov 2010 |
New ocean entries of lava at Ki, Puhi-o-Kalaikini, and 'Ili'ili |
| May, Jul, and Aug 2010 |
Portions of N rim of Pu'u 'O'o fall into crater |
| May-Jun 2010 |
Lava erupted on S wall and NE side of Pu'u 'O'o crater |
| Late July, 27 Nov 2010 |
2 houses destroyed in Kalapana Gardens subdivision |
| Sep-Dec 2010 |
Eruption of vent on W edge of Pu'u 'O'o crater |
| Nov 2010-Feb 2011 |
Increase in long-term inflation of Pu'u 'O'o crater |
| 2011 |
East rift zone eruption episodes 58-61 (see Table 6) |
| Jan, early Feb 2011 |
Ocean entries at 2 previous areas, Puhi-o-Kalaikini and Ki |
| 17 Feb 2011 |
House destroyed in Kalapana Gardens subdivision |
| 05 Mar 2011 |
Beginning of eruption Episode 59 (see table 6); floor of Pu'u 'Æ crater began collapsing; new fissures opened between Napau Crater and Pu'u 'O'o |
| 26 Mar 2011 |
Beginning of eruption Episode 60 (see table 6); lava filled collapse crater of Pu'u 'O'o and uplifted lake floor |
| 24 July 2011 |
Lava flow from ring fracture along SW margins of Pu'u 'O'o crater |
| 03 Aug 2011 |
Lava lake draining through from lower W flank of Pu'u 'O'o; lake completely drained within several hours, leaving a rubble-filled depression ~80 m below its pre-collapse level |
| 20 Aug 2011 |
Beginning of eruption Episode 61; Pu'u 'O'o refilled and overflowed |
| 21 Sep 2011 |
Lava broke through the upper E flank of the Pu'u 'O'o cone; Pu'u 'O'o crater subsided ~20 m; flow (Peace Day flow) resulted in a channelized 'a'a' flow to SW |
| 22 Sep 2011 |
Channelized 'a'a' flow stalled; fissure and open channel crusted over by mid-Oct 2011 |
| 09 Dec 2011 |
Flow reached ocean entry by evening 9 Dec 2011 |
| 2012 |
Peace Day flow continued to be active |
| Early 2012 |
Subsidence in Pu'u 'O'o crater continued; outgassing events on crater floor |
| 02 Mar 2012 |
House in Royal Gardens subdivision destroyed |
| End of Aug 2012 |
Deflation phase led to lowering of lava lake beneath Pu'u 'O'o crater ; lava began erupting and filled in NW pit by Sep 2012. |
Table 7. An overview of the Kīlauea East Rift Zone (ERZ) eruption during 2007-2012 (eruption episodes 57-61) including (from left) episodes, dates, (approximate in some cases) vent locations, and estimated volume of erupted material. HVO subdivides 30-year-long Pu`u `O`o eruption into episodes. Each new episode denotes vigorous new eruptive activity either from a different vent or commencing after a pause or slowdown. Some episodes are well defined; others more arbitrary. The day and time of various episodes may vary slightly with different instrumentation. The dates in the table signify the duration of the episode or episodes. Courtesy of M. Patrick (USGS) and various USGS/HVO reports.
| Dates |
Episode(s) |
Vent location |
Est. volume (km3) |
| 1 Jul 2007-5 Mar 2011 |
57-58 |
Crater fill and fissures E of Pu'u 'O'o |
0.63 |
| 05 Mar-09 Mar 2011 |
59 |
Kamoamoa fissures |
0.003 |
| 26 Mar-15 Aug 2011 |
60 |
Pu'u 'O'o overflows and W flank vent |
0.04 |
| 20 Aug 2011-present |
61 |
Pu'u 'O'o overflows and Peace Day flow |
0.15 |
Table 8. For Kīlauea, a list containing several notable collapses and/or explosive events during 2010-2011. Courtesy of various USGS/HVO reports and Matthew Patrick, USGS/HVO.
| Date |
Time (HST) |
Notes |
| 11 Feb 2010 |
1551 |
Collapse in vent; continuous lava lake started |
| 26 Apr 2010 |
1409 |
Collapse in vent; lava lake doubled in size |
| 17 Jan 2011 |
2311 |
Series of explosions |
| 21 Jan 2011 |
1430 |
Explosion |
| 14 Feb 2011 |
0908 |
Series of explosions |
| 15 Feb 2011 |
0305 |
Series of explosions |
| 20 Feb 2011 |
0049 |
Explosion |
| 03 Mar 2011 |
1236 |
Series of explosions |
| 21 Dec 2011 |
1655 |
Explosion |
30-year long eruption summary comments. Table 9 and figure 210 present general information about the total 30-yr eruption period.
Table 9. Selected eruption statistics for the entire 30-year during 1983 to January 2013. Courtesy of Orr and others (2013) and various USGS/HVO reports.
| Feature |
Statistic |
| Area covered |
125.5 km2 |
| New land on coast |
2.02 km2 |
| Volume erupted (dense rock equivalent) |
~4 km3 |
| Thickness along coast |
10 to 35 m |
| Pre-1983 area covered in 2012 |
0.4 km2 |
| Net total of land added to the island (Nov 1986–Dec 2012) |
2.015 km2 |
| Coastal highway covered by lava |
14.3 km |
| Structures destroyed |
214 |
| Pu'u 'O'o maximum height |
255 m in 1987; 171 m in 2012 |
| Pu'u 'O'o crater size |
300-450 m |
Satellite images. To provide a comparison, NASA Earth Observatory prepared both a natural-color satellite image from 6 June 2011 (figure 210a), and a black-and-white aerial photograph from 25 March 1977 (figure 210b). As the authors noted, the images both show the landscape surrounding Napau Crater and Pu'u 'O'o. Lava flows that are more than a century old are covered by a dense forest of ohia lehua and tree ferns forest (green in the 2011 image). Flows from eruptions in 1965, 1968, and 1969 are much lighter than the forest in the 1977 image, but difficult to differentiate from one another. By comparison, the 2011 image shows profound changes in the landscape.
Weathered lava from the initial Napau Crater vent is almost indistinguishable from the older (1968 and 1969) lavas that cover most of the crater floor. In January 1997, a fresh line of fissures opened within Napau Crater, erupting lava during Episode 54 of the Pu'u 'O'o-Kupaianaha eruption. Additional cracks and fissures split the earth between Napau Crater and Pu'u 'O'o in the March 2011 Kamoamoa Fissure Eruption (Episode 59), spreading black lava through the forest. Scorched forest appears reddish-brown along the edges of the lava flows. Since 9 March 2011, lava flows have originated from Pu'u 'O'o(figure 210a, upper right). A lava pond is visible within the crater, and a system of lava tubes carries molten rock underground to the southeast. Brown lavas surrounding the crater flowed directly from the lava pond.
References. Orr, T., Heliker, C., and Patrick, M., 2012, The ongoing Pu'u'O'o eruption of Kīlauea Volcano, Hawai'i-30 years of eruptive activity, U.S. Geological Survey Fact Sheet 2012-3127, 6 p. (URL: http://pubs.usgs.gov/fs/2012/3127/; accessed 15 August 2013).
Simmon, R., 2012, 30th Anniversary of the Pu'u 'O'o Eruption on Kīlauea, NASA Earth Observatory (URL: http://earthobservatory.nasa.gov/NaturalHazards/view.php?id=80091).
Swanson, D., Fiske, D., Rose, T., Houghton, B, and Mastin, L., 2011, Kīlauea-an explosive volcano in Hawai'i, U.S. Geological Survey Fact Sheet 2011-3064, 4 p (URL: http://pubs.usgs.gov/fs/2011/3064/; accessed 15 August 2013).
USGS/HVO, 2012, Kīlauea's east rift zone (Pu'u 'O'o) eruption 1983 to present, 13 April 2012, 14 p. (URL: http://hvo.wr.usgs.gov/kilauea/summary/#Mar2011; accessed 15 August 2013).
USGS/HVO, 2013, Maps, July 26, 2013 - Kīlauea, Kīlauea's east rift zone flow field, web site (URL: http://www.wr.usgs.gov/maps; accessed 15 August 2013).
Geologic Background. Kilauea overlaps the E flank of the massive Mauna Loa shield volcano in the island of Hawaii. Eruptions are prominent in Polynesian legends; written documentation since 1820 records frequent summit and flank lava flow eruptions interspersed with periods of long-term lava lake activity at Halemaumau crater in the summit caldera until 1924. The 3 x 5 km caldera was formed in several stages about 1,500 years ago and during the 18th century; eruptions have also originated from the lengthy East and Southwest rift zones, which extend to the ocean in both directions. About 90% of the surface of the basaltic shield volcano is formed of lava flows less than about 1,100 years old; 70% of the surface is younger than 600 years. The long-term eruption from the East rift zone between 1983 and 2018 produced lava flows covering more than 100 km2, destroyed hundreds of houses, and added new coastline.
Information Contacts: Hawaiian Volcano Observatory (HVO), U.S. Geological Survey, PO Box 51, Hawai'i National Park, HI 96718, USA (URL: https://volcanoes.usgs.gov/observatories/hvo/, Daily updates, https://volcanoes.usgs.gov/observatories/hvo/activity/kilaueastatus.php, and Weekly updates, https://volcanoes.usgs.gov/observatories/hvo/volcanowatch/).
Pavlof (United States) — May 2013 Cite this Report
Pavlof
United States
55.417°N, 161.894°W; summit elev. 2493 m
All times are local (unless otherwise noted)
Eruption in May-June 2013 with lava flows and ash emissions to ~8.5 km a.s.l.
Pavlof, the most active volcano in the Aleutian arc, erupted on 13 May 2013. Before this, it had most recently erupted on 15 August 2007, following an 11-year period of quiescence. The eruption that began in May 2013 continued through June before slowly subsiding to background levels by 8 August. Pavlof generated several ash plumes during the six-week eruption that disrupted aviation, including an 8-km high plume on 24 June. As in past Pavlof eruptions, the recent eruptions fluctuated in intensity. This report briefly discusses earthquake data during 2007-2011 and, in greater detail, the series of eruptions during May and June 2013.
According to Mangan and others (2009), Pavlof has discharged more than 40 recorded eruptions within the previous 200 years, producing mostly basaltic andesite to andesite products. That work, discussed in a separate subsection near the end of this report, also discusses the adjacent 12x19 km Emmons Lake caldera (a chain of nested calderas) on Pavlof's SW flank (figure 5). The Emmons Lake Volcanic Center (ELCV) is used to collectively describe the entire complex, including the nested caldera, intra-caldera stratovolcanoes, and the adjacent stratovolcanoes (including Pavlof) to the NE.
According to the Alaska Volcano Observatory (AVO), 48 earthquakes were located beneath Pavlof in 2007, the year of the previous eruption. During the following non-eruptive years, AVO reported 9 earthquakes centered at Pavlof in 2008, 7 earthquakes in 2009, 19 in 2010, and 13 in 2011. As of this writing, AVO has not yet published 2012 earthquake data.
Eruption in May 2013. On 13 May 2013, seismicity increased at 0800 and an intense thermal anomaly was observed at the summit in satellite imagery. Several spikes in seismicity occurred between 0900 and 1000. AVO noted that similar patterns of seismicity and elevated surface temperatures in previous cases had signaled the onset of eruptive activity at Pavlof. The Volcanic Alert Level was increased to Watch (the second highest category of four) and the Aviation Color Code was increased to Orange (the second highest category of four).
On 14 May 2013, pilot reports and satellite images indicated a spatter-fed lava flow that had advanced about 0.5 km down the N flank. The advancing lava had also generated debris-laden deposits, presumably from the interaction of hot lava with snow and ice on the flank. According to AVO, a diffuse ash plume drifted about 160 km NE at an altitude of 4.6 km before dissipating. Minor ashfall was reported the evening of 14 May in a mining camp 80 km NE of the volcano. No other nearby communities reported ashfall. Minor steam-and-ash emissions from the summit were visible from Cold Bay (~58 km SW).
During 14-15 May 2013, elevated seismicity persisted. Steam-and-ash clouds observed with a web camera at Cold Bay (55 km W of the volcano) occasionally rose to an altitude of 6.1 km. Residents in Cold Bay observed incandescence from the summit during the night. On 15 May a pilot reported a dark ash cloud drifting ENE at an altitude of 6.1 km.
On 16 May, AVO observed lava fountaining at the summit and a continuous ash, steam, and gas cloud extending 50-100 km downwind at an altitude of about 6.1 km. Satellite images showed persistent elevated surface temperatures at the summit and on the NW flank, consistent with lava fountaining at the summit and the resulting lava flow.
During 18-19 May 2013, reports noted that a narrow plume of steam, ash, and gas occasionally rising up to an altitude of 6.7 km and drifting SE was visible in satellite and pilot images (figures 6 and 7). Pilots noted that lava fountaining and ash emission continued. Overnight, trace amounts of ash fell on the community of Sand Point (88 km E). During the afternoon on 19 May, pilots reported that ash plumes rose to altitudes of 4.6-6.7 km. Trace amounts of ash fell in Nelson Lagoon (78 km NNE) during 19-20 May.
News articles (Associated Press, PRNewswire, Alaska Dispatch) stated that during 19-21 May 2013 two regional airlines canceled flights to several remote communities and delayed or re-routed other flights. On 21 May AVO reported that a low-level plume of steam, gas, and ash occasionally rose to an altitude of 6.1 km and drifted NNE. Trace amounts of ash again fell in Nelson Lagoon.
AVO reported that seismic tremor markedly declined around 1100 on 21 May 2013 and was followed through 23 May by the detection of small discrete events, likely indicative of small explosions, by an infrasonic pressure sensor (Chaparral model 2.5 at site PN7). Although cloud cover prevented satellite observations, elevated surface temperatures at the vent were detected. On 22 May a pilot report and photographs indicated weak steam-and-gas emissions containing little to no ash.
The eruption continued at a lower level during 24-26 May. Neither evidence of elevated surface temperatures nor a plume were observed in partly clear satellite images during 24-25 and 27 May. Clouds obscured views on 26 May. The Volcanic Alert Level was lowered to Advisory and the Aviation Color Code was lowered to Yellow on 28 May.
According to AVO, Pavlof emitted ash on 4 June at about 1100, as observed in satellite images and by pilots. Satellite images showed an ash cloud drifting SE, and pilots estimated that the cloud was at an altitude of 5.8 km. Weak seismicity that began at 1057 accompanied the emissions, and then continued. AVO increased the Volcanic Alert Level to Watch and increased the Aviation Color Code to Orange.
AVO reported that ash emissions continued during 5-11 June 2013, accompanied by tremor and explosion signals. Overnight during 4-8 June, satellite images detected elevated surface temperatures near the vent consistent with lava effusion and fountaining. Elevated surface temperatures persisted until 14 June. On 5 and 6 June, an ash plume drifted 40-45 km W and SW at altitudes of 4.3-5.5 km based on pilot estimates. During 8-10 June, an ash plume drifted 20-53 km SE. During 12-14 June, ash emissions were intermittent and minor; ash plumes remained below an altitude of 6.1 km and mostly drifted SE.
During 14-15 June 2013, seismicity decreased. Minor emissions probably ceased, but web-camera views were partially obscured by clouds. On 17 June no plumes were visible in satellite images, and web camera views showed mostly cloudy conditions.
During 17-18 June, tremor amplitude increased slightly, and elevated surface temperatures were again detected in satellite images. A small ash plume rose from the crater. The eruption continued during 19-25 June, with tremor and occasional explosions. Cloud cover prevented web camera views. Elevated surface temperatures continued to be detected during 19-20 and 24 June. A small ash plume from the summit vent was also detected in a satellite image on 19 June, and possibly during 20-22 June.
On 24 June, seismicity increased to the strongest level to date during 2013 and included continuous intense tremor and frequent small explosions likely associated with lava fountaining and ash production. Seismicity remained high on 25 June. Satellite images and pilot observations indicated that a plume drifted W at altitudes as high as 8.2-8.5 km. Satellite images also detected a strong thermal anomaly at the summit. Trace amounts of ash fell in King Cove (48 km SW). According to a news report (Reuters), regional air traffic was again cancelled or re-routed.
According to AVO, seismicity declined during 25-26 June and consisted of intermittent bursts of tremor and occasional small explosions. Satellite images showed a plume containing small amounts of ash drifting NW, and strong thermal anomalies at the summit. Pilot reports on 26 June indicated that plumes rose to altitudes between 6.1-7.6 km during the morning and then to heights just above the summit later that day. Seismicity during 26 June-1 July continued at low levels and consisted primarily of intervals of continuous, low-level tremor. Thermal anomalies at the summit detected in satellite images were strong during 26-29 June and weak during 30 June-1 July.
AVO reported that activity further declined during 1-2 July; tremor and explosions were no longer detected in seismic and pressure sensor data. Satellite images did not detect elevated surface temperatures, volcanic gas, or ash emissions, and there were no visual observations from pilots or from webcam images of any eruptive activity since 26 June. Consequently, AVO lowered the Aviation Color Code to Yellow and the Volcano Alert Level to Advisory.
On 8 August, AVO reported that no lava or ash emissions had been observed at Pavlof since 26 June and the volcano had exhibited gradually declining levels of unrest. Seismicity was at background levels. Thus, AVO lowered the Aviation Color Code to Green and the Volcano Alert Level to Normal.
Mangan and others (2009) discussion. Mangan and others (2009) cite Power and others (2004) as stating that background (non-eruptive) seismicity at Pavlof occurs as infrequent long-period earthquakes at focal depths between 20-40 km. Mangan and others contend that while only a few of these events at most occur annually, they are a stable feature attributed to quasi-steady fluxing of basaltic magma and exsolved CO2 in a deep dike and sill complex. According to the article, the seismic network at Pavlof is poorly situated to detect deep seismicity under the Emmons Lake caldera.
Mangan and others state, "All witnessed [Emmons Lake Volcanic Center] ELVC eruptions have occurred outside the caldera [,specifically] at Pavlof, the most active volcano in the entire arc. Pavlof's slopes are extensively mantled with tephra and pyroclastic debris produced during [its] historical strombolian, vulcanian, and lava fountain events (Miller et al., 1998). Limited precursory seismicity herald Pavlof eruptions (McNutt, 1989) and, to the extent studied, negligible precursory ground deformation (Lu et al., 2003; Z. Lu personal communication 2008). Of the 20 eruptions occurring since the installation of Pavlof's seismic network (1973), 13 eruptions have occurred with less than 24 h of warning. Pavlof is essentially an "open vent" volcano with magma rising aseismically through a thermally well-groomed conduit. High-frequency volcano-tectonic earthquakes, characteristic of magma rise through brittle crust, are virtually absent."
Figure 8 presents Mangan and others (2009) conceptualization of the plumbing beneath the ELVC, which includes Pavlof.
The other volcano of the ELVC considered to have high likelihood of eruption is Mt. Hague (Waythomas and others, 2006). That study also presents a set of hazard maps for the complex.
References. Mangan, M., Miller, T., Waythomas, C., Trusdell, F., Calvert, A., and Layer, P., 2009, Diverse lavas from closely spaced volcanoes drawing from a common parent: Emmons Lake Volcanic Center, Eastern Aleutian Arc, Earth and Planetary Science Letters, Vol. 287, pp. 363-372.
Waythomas, CF; Miller, TP, and Mangan, MT, 2006, Preliminary Volcano Hazard Assessment for the Emmons Lake Volcanic Center, Alaska, U.S. Geological Survey Scientific Investigations Report 2006-5248 (URL: http://pubs.usgs.gov/sir/2006/5248/).
Geologic Background. The most active volcano of the Aleutian arc, Pavlof is a Holocene stratovolcano that was constructed along a line of vents extending NE from the Emmons Lake caldera. Pavlof and Pavlof Sister to the NE form a dramatic pair of symmetrical, glacier-covered stratovolcanoes that overlook Pavlof and Volcano bays. Little Pavlof is a smaller cone on the SW flank of Pavlof volcano, near the rim of Emmons Lake caldera. Unlike Pavlof Sister, eruptions have frequently been reported from Pavlof, typically Strombolian to Vulcanian explosive eruptions from the summit vents and occasional lava flows. The active vents lie near the summit on the north and east sides. The largest recorded eruption took place in 1911, at the end of a 5-year-long eruptive episode, when a fissure opened on the N flank, ejecting large blocks and issuing lava flows.
Information Contacts: Alaska Volcano Observatory (AVO), a cooperative program of a)U.S. Geological Survey, 4200 University Drive, Anchorage, AK 99508-4667 USA (URL: http://www.avo.alaska.edu/), b)Geophysical Institute, University of Alaska, PO Box 757320, Fairbanks, AK 99775-7320, USA, and c)Alaska Division of Geological & Geophysical Surveys, 794 University Ave., Suite 200, Fairbanks, AK 99709, USA (URL: http://www.dggs.alaska.gov/); Associated Press (URL: http://www.ap.org/); PRNewswire (URL: http://www.prnewswire.com); Alaska Dispatch (URL: http://www.alaskadispatch.com/); and Reuters (URL: http://www.reuters.com/).
Veniaminof (United States) — May 2013 Cite this Report
Veniaminof
United States
56.17°N, 159.38°W; summit elev. 2507 m
All times are local (unless otherwise noted)
Ongoing sporadic eruptions as late as 6 October 2013
In our last report on Veniaminof (figure 12) (BGVN 33:05), we noted that on 22 February 2008 several minor ash bursts had occurred, a process common in ten's of Bulletin and predecessor Smithsonian reports going back to 1983 (SEAN 08:05). In this report we provide a brief summary of activity from 1 March 2008 into October 2013, an interval including several episodes with lava flows, ash bursts, elevated seismicity, and ash fall. During 4 May 2008-7 June 2013 the available data suggest comparative quite, although during part of that time the volcano lacked a seismic monitoring system. During the reporting interval, the Aviation Alert Level often shifted between Orange and Yellow (high to intermediate values on a scale from Green to Red). As discussed below, there was also an interval without seismic monitoring announced 17 November 2009 when the hazard status was termed 'unassigned' owing to a seismic instrument outage. This report omits detailed seismic data published by the USGS (eg. Dixon and Stilher, 2009; Dixon and others, 2012). On 30 August 2013 ash plumes rose to over 6 km altitude.
Table 1 synthesizes available AVO reporting on Veniaminof behavior during February 2008 through 6 October 2013. See their reports for more details. During the interval 4 May 2008 to 7 June 2013 the volcano was often quietly steaming, although seismicity increased during part of May 2009. Several highlights follow. Weather permitting, satellite images showed some days with high elevated surface temperatures at the cinder cone inside the caldera consistent with lava effusion. For example, during 24 July-30 July 2013, a "river of lava" flowed down the cone. As discussed in a subsection below, several noteworthy images were acquired in mid-2013 showing ash and thermal signatures on the volcano. On 30 August 2013 the plume reached over 6 km altitude as an unusually vigorous eruptive event ensued. The last lava emissions of the reporting interval took place on 6 October 2013.
Table 1. Representative dates and noteworthy eruptive or non-eruptive intervals at Veniaminof during March 2008 through late August 2013. Courtesy of AVO.
| Date |
Ash plume altitude and movement |
Other comments |
| Late Feb through May 2008 |
Below 2.7 km |
Sporadic increases in seismic and eruptive activity were noted since 11 February, including tremor episodes that lasted 1-2 minutes and occurred several times per hour. Broadly during late February 2008, AVO noted both small ash bursts with local ashfall at the crater accompanied by seismicity, and occasional high thermal fluxes. |
| 4 May 2008-7 June 2013 |
(Steaming) |
7-26 May 2009, often quiet steaming with generally low to occasional high seismicity and with absence of thermal anomalies. No reports during other portions of the interval 4 May 2008 to 7 June 2013. Seismic station outage announced 17 November 2009, with seismic reports returning 8 June 2013. |
| 19 June 2013 |
4.6 km NE |
Cloudy weather sometimes prevented views of the caldera, although most days satellite images showed very high elevated surface temperatures at the cinder cone inside the caldera consistent with lava effusion. On 19 June, residents in Sandy River reported ash bursts. |
| 24-30 July 2013 |
4.5 km NW |
Lava effusion, a "river of lava," flowing down the cone. |
| 14-20 August 2013 |
3.7 km W and then SSE |
AVO reported that during 13-15 August seismic tremor at Veniaminof was high, and persistent elevated surface temperatures consistent with lava effusion were visible on satellite imagery. An 18 August webcamera image revealed minor ash emissions. On 19 August a helicopter overflight revealed two lava flows On 20 August, trace ash fall reported in Perryville ((32 km SSE); they also heard hearing explosions; infrasound equipment in Dillingham (322 km NE) also detected impulses. |
| 21 Aug-20 Oct 2013 |
4.6-6.7 km SE |
27-29 Aug, episodic tremor bursts interpreted as lava effusion and emissions; prominent satellite thermal anomalies. On 30 Aug, some of the strongest emissions since the eruption began in June 2013; ongoing into early Sept but diminishing in late Sept, and without evidence of eruption in satellite and webcamera data on and around 20 Sept. A lava effusion was recognized 6 October, then waning by mid-October. |
As noted above and in table 1, non-eruptive steaming prevailed at the volcano during much or all of the interval 4 May 2008-7 May 2009. On 17 November 2009 AVO announced that Veniaminof was one of four volcanoes in Alaska that they could no longer monitor because of seismic station outages. They then shifted both their Alert Level of Normal and the Aviation Color Code of Green to the category "unassigned." AVO stated that these volcanoes "will likely remain without real-time seismic monitoring until next summer, when necessary upgrades at these and other networks will occur. As at other volcanoes without real-time seismic networks, AVO will continue to use satellite data and reports from pilots and ground observers to detect signs of eruptive activity."
Following the announced station outage, the next update at Veniaminof was on 8 June 2013.
Pilots of aircraft PEN241 saw on 27 August 2013 intermittent ash discharges at 1720 UTC . "Occasional ash to [~3 km a.s.l.] moving NNE. Cloud height up to [~4 km a.s.l.] every 2-5 minutes." This reporting was transmitted to Air Traffic authorities and then to Bulletin editors via the Volcanic Activity Reporting Form (VAR; Appendix 2 of Federal Aviation Administration, 2012). Reports like these are valuable to engineers and scientists who benefit from the direct observations provided by pilots.
During 6-7 May 2009, seismic activity from Veniaminof increased, prompting AVO to raise the Volcanic Alert Level to Advisory and the Aviation Color Code to Yellow. Small magnitude earthquakes occurred at rates of 5-10 per hour during quieter periods and 1-3 per minute during periods of more intense activity. Visual observations indicated typical steaming from the summit caldera cone. Seismicity remained elevated during 8-12 May 2009. On 26 May 2009, AVO reported that seismicity from Veniaminof had decreased during the previous week. The Volcanic Alert Level was lowered to Normal and the Aviation Color Code was lowered to Green.
During 2010-12 the volcano was relatively quiet (table 1). There were no AVO weekly reports on Veniaminof during this interval.
On 13 June 2013, low-level emissions led the AVO to increase the aviation color code to orange. The Anchorage Volcanic Ash Advisory Center (VAAC) reported on 15 June 2013 that the eruptions had ended, but AVO still reported intermittent activity continuing through 8 July 2013. In addition, MODVOLC had detected 248 thermal alerts during 14 June-11 July 2013 (figure 13).
July 2013 activity. Figure 14 shows a satellite image from 4 July 2013 portraying both ash desposits on the snow surface and the thermal signature of an ongoing lava flow. On 8 July 2013, AVO reported that nearly continuous, low-level volcanic tremor had occurred during the previous 24 hours. Cloudy satellite images detected thermal anomalies (figure 14). Web camera images from Perryville (32 m SSE) showed incandescence from the Veniaminof intracaldera cone.
AVO reported that the ongoing low-level eruption of Veniaminof, characterized by lava effusion and emission of minor amounts of ash and steam, continued during 26 June-8 July 2013, indicated by nearly continuous volcanic tremor and occasional small explosions detected by the seismic network. Figure 15 shows a photo taken on 26 June. Satellite images showed elevated surface temperatures at the cinder cone inside the caldera consistent with lava effusion. During 26-30 June web camera images from Perryville showed a small light-colored plume rising above the cone to just above the rim of the caldera, and night time images showed persistent incandescence from the cone. The Volcano Alert Level remained at Watch and the Aviation Color code remained at Orange.
2008-2011 seismicity. According to Dixon and others (2009) and additional AVO reports, the monitoring network for Veniaminof included nine stations, at least through 2011. The network experienced intermittent outages (eg. figure 16 of broken solar panel.) The number of recorded earthquakes between 2008-2011 is presented in table 1.
Table 2. Veniaminof VT and LF earthquakes detected during 2008-2011. Because of occasional equipment outages, values in the table may under-represent actual numbers. Values for 2012 were not yet available. Sources included Dixon and others (2008, 2009, 2010, 2011).
| Year |
Earthquakes located |
Volcano-tectonic (VT) |
Low frequency (LF) |
| 2008 |
17 |
14 |
3 |
| 2009 |
4 |
3 |
1 |
| 2010 |
22 |
18 |
4 |
| 2011 |
7 |
6 |
1 |
2009 annual seismicity. The Aniakchak, Cerberus, Gareloi, Great Sitkin, Pavlof, Veniaminof, and Wrangell subnetworks had insufficient numbers of located earthquakes to calculate a Mc. The Mc ranged from -0.1 to 1.5 for the individual subnetworks.
2010 annual seismicity. The seismograph networks on Aniakchak, Korovin, and Veniaminof were repaired in 2010. There were many station outages in the previous two years.
Seismicity at Veniaminof and Westdahl were the only areas in which an increase over the seismicity in 2009 was noted. The increase in seismicity at Veniaminof was a result of a small swarm of activity northwest of the active cone in late July.
2011 annual seismicity. There were fewer station outages and more than four were operating during the year. Veniaminof had insufficient numbers of located earthquakes in 2011 to calculate a magnitude completeness.
References. Dixon, J.P., Stihler, S.D., Power, J.A., and Searcy, C.K., 2011, Catalog of earthquake hypocenters at Alaskan Volcanoes: January 1 through December 31, 2010: U.S. Geological Survey Data Series 645, 82 p.
Dixon, J.P., Stihler, S.D., Power, J.A., and Searcy, C.K., 2012, Catalog of earthquake hypocenters at Alaskan Volcanoes: January 1 through December 31, 2011: U.S. Geological Survey Data Series 730, 82 p.
Dixon, J.P., Stihler, S.D., Power, J.A., and Searcy, Cheryl, 2010, Catalog of earthquake hypocenters at Alaskan volcanoes: January 1 through December 31, 2009: U.S. Geological Survey Data Series 531, 84 p.
Dixon, J.P., and Stihler, S.D., 2009, Catalog of earthquake hypocenters at Alaskan volcanoes: January 1 through December 31, 2008: U.S. Geological Survey Data Series 467, 86 p.
Federal Aviation Administration, 2012, Aeronautical Information Manual, Official Guide to Basic Flight Information and ATC Procedures (issued 9 February 2012; with revisions as late as 22 Aug ust 2013) (URL: http://www.faa.gov/air_traffic/publications/atpubs/aim/index.htm).
Geologic Background. Veniaminof, on the Alaska Peninsula, is truncated by a steep-walled, 8 x 11 km, glacier-filled caldera that formed around 3,700 years ago. The caldera rim is up to 520 m high on the north, is deeply notched on the west by Cone Glacier, and is covered by an ice sheet on the south. Post-caldera vents are located along a NW-SE zone bisecting the caldera that extends 55 km from near the Bering Sea coast, across the caldera, and down the Pacific flank. Historical eruptions probably all originated from the westernmost and most prominent of two intra-caldera cones, which rises about 300 m above the surrounding icefield. The other cone is larger, and has a summit crater or caldera that may reach 2.5 km in diameter, but is more subdued and barely rises above the glacier surface.
Information Contacts: Alaska Volcano Observatory, a cooperative program of a)U.S. Geological Survey, 4200 University Drive, Anchorage, AK 99508-4667 USA URL: http://www.avo.alaska.edu/); b)Geophysical Institute, University of Alaska, PO Box 757320, Fairbanks, AK 99775-7320 USA and c)Alaska Division of Geological & Geophysical Surveys, 794 University Ave., Suite 200, Fairbanks, AK 99709, USA (URL: http://www.dggs.alaska.gov/); Anchorage Volcanic Ash Advisory Center (VAAC), 6930 Sand lake Road Anchorage, AK 99502-1845 USA (URL: http://vaac.arh.noaa.gov/); and Hawai'i Institute of Geophysics and Planetology (HIGP), MODVOLC Thermal Alert System, School of Ocean and Earth Science and Technology (SOEST), University of Hawai'i, 2525 Correa Road, Honolulu, HI 96822, USA (URL: http:hotspot.higp.hawaiii.edu/).
Yasur
Vanuatu
19.532°S, 169.447°E; summit elev. 361 m
All times are local (unless otherwise noted)
Explosive activity continued into at least early 2013
In BGVN 36:05, we reported that on 12 May 2011, the Vanuatu Geohazards Observatory (VGO) reported, based on information collected by the Vanuatu Meteorology and Geohazards Department, that a OMI (ozone monitoring instrument) satellite image showed strong degassing of SO2 from Yasur volcano during the previous week (see map of this island volcano in figure 42 of BGVN 36:05). On 1 June 2011, the Vanuatu Volcano Alert Level (VVAL) was raised from 2 to 3, following increasing explosive activity during May, then lowered to 2 on 13 June (table 3).
Table 3. The Vanuatu Volcanic Alert Level (VVAL) scale for the six volcanoes monitored by Vanuato Geohazard Observatory (Yasur, Lopevi, Ambrym, Aoba, Gaua, and Suretamatai). Courtesy of Vanuatu Geohazards Observatory.
| VVAL |
Description |
| Lvl. ? |
Insufficient monitoring to make assessment. |
| Lvl. 0 |
Normal low-level activity. |
| Lvl. 1 |
Increased activity, danger near crater only. |
| Lvl. 2 |
Moderate eruptions, danger close to the volcano vent, within parts of Volcanic Hazards Map Red Zone. |
| Lvl. 3 |
Large eruption, danger in specific areas within parts of Volcanic Hazards Map Red and Yellow Zones. |
| Lvl. 4 |
Very large eruption, island-wide danger (including areas within Red Yellow and Green Zones). |
During the week of 7-12 July 2012, VGO observed that explosive activity at Yasur became stronger and more frequent, and shifted from Strombolian to sub Plinian. Bombs ejected from the vents fell in the crater, around the summit area, and on the tourist walk and parking area (within the red zone, figure 43). The explosions were heard, felt, and observed from nearby villages and schools. Activity at all three volcanic vents was characterized by degassing, ash emissions, and ejection of bombs. On 13 July 2012, the Alert Level was raised to 3.
VGO reported an OMI satellite image on 1 April 2013 showed diffuse SO2 from Yasur. Explosive activity increased on 2 April 2013, with explosions becoming stronger and more frequent, and continued to slightly increase through 28 May. Bombs again fell around the summit area, the tourist walk, and the parking area. Moderate ash emissions and ashfall occurred on 2, 4, and 5 April, and 5 and 8 May 2013. Photos included in the report showed dense white plumes on 23 and 24 May. The Alert Level remained at 2 (on a scale of 0 4).
Volcano Ash Advisory Centre (VAAC) reports on Yasur. In many cases the VAAC lacked any satellite data and in cases where they did have data they frequently were unable to detect the plume or in other cases could not detect ash in the plume (table 4).
Table 4. Yasur volcano aviation reports (VAAs, Volcanic Ash Advisories) for the time interval 11 January 2009 to 10 June 2010. In many cases the information sources were the Vanuatu Geohazard Observatory (VGO). On 11 January the source was an AIREP, an aircraft report. Data provided courtesy of the Wellington Volcanic Ash Advisor Centre (VAAC).
| Date (time UTC) |
Info Source (type of observation) |
Details |
Altitude (km) |
Drift or cited wind direction |
| 11 Jan 2009 |
AIREP |
Plume sighted over volcano by aircraft (to ~4 km altitude, drifting SE). Ash not seen by VAAC analysts in satellite data. |
~4km |
SE |
| 29 May 2010 |
VGO |
Observatory reported plume, however no satellite image was made. |
~2km |
Winds NE |
| 30 May 2010 |
VGO |
Observatory reported plume, and a volcanic ash cloud was captured with a Modis image. |
~2km |
Winds E |
| 31 May 2010 |
VGO |
Observatory reported plume, and a volcanic ash cloud obscured the satellite image. |
~2km |
Winds NE |
| 01 Jun 2010 |
VGO |
Observatory reported plume, and a volcanic ash cloud obscured the satellite image. |
~2km |
Winds N |
| 02 Jun 2010 |
VGO |
Observatory reported plume, and a volcanic ash cloud was unidentifiable on satellite image. |
~2km |
Winds N |
| 03 Jun 2010 |
VGO |
Observatory reported plume, and a volcanic ash cloud was unidentifiable on satellite image. |
~2km |
Winds E/NE |
| 04 Jun 2010 |
VGO |
Observatory reported plume, and a volcanic ash cloud was unidentifiable on satellite image. |
~2km |
Winds NE |
| 05 Jun 2010 |
VGO |
Observatory reported a plume, and a volcanic ash could was unidentifiable on satellite image. A remark was made suggesting volcanic eruption may be easing. |
~2km |
Winds NW |
| 06 Jun 2010 |
VGO |
Observatory reported a plume,and a volcanic ash cloud was unidentifiable on satellite image. |
~2km |
Winds NW |
| 07 Jun 2010 |
VGO |
Observatory reported a plume, and satellite image was unavailable. |
~2km |
Winds NW |
| 08 Jun 2010 |
VGO |
Observatory reported a plume, and satellite image was unavailable. |
~2km |
Winds NW |
| 09 Jun 2010 |
VGO |
Observatory reported a plume, and satellite image was unavailable. |
~2km |
Winds |
| 10 Jun 2010 |
VGO |
Observatory reported a plume, and that no volcanic ash was visible on satellite image. |
~2km |
Winds NE |
Satellite Thermal Alerts. The MODIS/MODVOLC satellite thermal alert system has shown least 1 to 10 alerts each month over Yasur since the beginning of 2011. A lava lake has existed at Yasur for many years.
References. Allen, S.R., 2005, Complex spatter and pumice rich pyroclastic deposits from an andesitic caldera forming eruption:The Siwi pyroclastic sequence, Tanna, Vanuatu, Bulletin of Volcanology, v. 67, pp. 27 41.
Calmant, S., Pelletier, B., Lebellegard, P., Bevis, M., Taylor, F.W., and Phillips, D.A., 2003, New insights on the tectonics along the New Hebrides subduction zone based on GPS results, Journal of Geophysical Research, v. 108, no. B6, pp. 2319 2339.
Carnay, JN., and MacFarlane, A, 1979, Geology of Tanna, Aneityum, Futuna and Aniva, New Hebrides Geological Survey Report 1979, pp. 5 29.
Métrich, N., Allard, P., Aiuppa, A., Bani, P., Bertagnini, A., Shinohara, H., Parello, F., Di Muro, A., Garaebiti, E., Belhadj, O., and Massare, D., 2011, Magma and Volatile Supply to Post collapse Volcanism and Block Resurgence in Siwi Caldera (Tanna Island, Vanuatu Arc), Journal of Petrology, v. 52, no. 6, pp. 1077 1105; DOI: 10.1093/petrology/egr019.
Nairn, I.A., Scott, B.J., and Giggenbach, W.F., 1988, Yasur volcanic investigations, Vanuatu September 1988, New Zealand Geological Survey Report 1988, pp.1 74.
Pelletier, B., Calmant, S., and Pillet, R., 1998, Current tectonic of the Tonga New Hebrides region, Earth and Planetary Science Letters, v. 164, pp. 263 276.
Geologic Background. Yasur has exhibited essentially continuous Strombolian and Vulcanian activity at least since Captain Cook observed ash eruptions in 1774. This style of activity may have continued for the past 800 years. Located at the SE tip of Tanna Island in Vanuatu, this pyroclastic cone has a nearly circular, 400-m-wide summit crater. The active cone is largely contained within the small Yenkahe caldera, and is the youngest of a group of Holocene volcanic centers constructed over the down-dropped NE flank of the Pleistocene Tukosmeru volcano. The Yenkahe horst is located within the Siwi ring fracture, a 4-km-wide open feature associated with eruption of the andesitic Siwi pyroclastic sequence. Active tectonism along the Yenkahe horst accompanying eruptions has raised Port Resolution harbor more than 20 m during the past century.
Information Contacts: Vanuatu Geohazards Observatory, Department of Geology, Mines and Water Resources of Vanuatu (URL: http://www.geohazards.gov.vu); NASA Earth Observatory (URL: http://earthobservatory.nasa.gov); MODIS/MODVOLC Thermal Alerts System, Hawai'i Institute of Geophysics and Planetology (HIGP), School of Ocean and Earth Science and Technology (SOEST), Univ. of Hawai'i, 2525 Correa Road, Honolulu, HI 96822, USA (URL: http://modis.higp.hawaii.edu/); and Wellington Volcanic Ash Advisory Centre (VAAC), Meteorological Service of New Zealand Ltd (MetService), PO Box 722, Wellington, New Zealand (URL: http://www.metservice.com/vaac/, URL: http://vaac.metservice.com/).