Recently Published Bulletin Reports
Manam (Papua New Guinea) Few ash plumes during November-December 2022
Krakatau (Indonesia) Strombolian activity and ash plumes during November 2022-April 2023
Stromboli (Italy) Strombolian explosions and lava flows continue during January-April 2023
Nishinoshima (Japan) Small ash plumes and fumarolic activity during November 2022 through April 2023
Karangetang (Indonesia) Lava flows, incandescent avalanches, and ash plumes during January-June 2023
Ahyi (United States) Intermittent hydroacoustic signals and discolored plumes during November 2022-June 2023
Kadovar (Papua New Guinea) An ash plume and weak thermal anomaly during May 2023
San Miguel (El Salvador) Small gas-and-ash explosions during March and May 2023
Ebeko (Russia) Continued explosions, ash plumes, and ashfall during October 2022-May 2023
Home Reef (Tonga) Discolored plumes continued during November 2022-April 2023
Semisopochnoi (United States) Occasional explosions, ash deposits, and gas-and-steam plumes during December 2022-May 2023
Ambae (Vanuatu) New lava flow, ash plumes, and sulfur dioxide plumes during February-May 2023
Manam (Papua New Guinea) — July 2023  Cite this Report
Manam
Papua New Guinea
4.08°S, 145.037°E; summit elev. 1807 m
All times are local (unless otherwise noted)
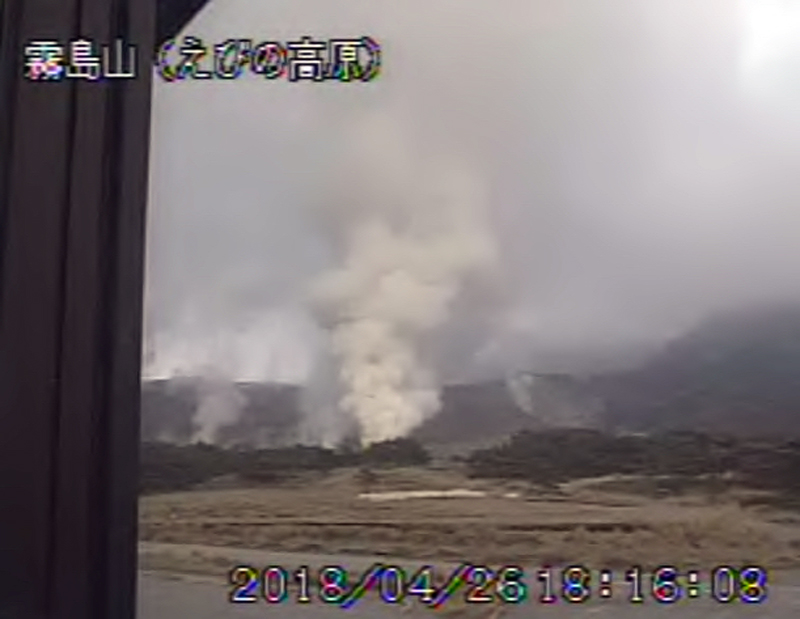
Few ash plumes during November-December 2022
Manam is a 10-km-wide island that consists of two active summit craters: the Main summit crater and the South summit crater and is located 13 km off the northern coast of mainland Papua New Guinea. Frequent mild-to-moderate eruptions have been recorded since 1616. The current eruption period began during June 2014 and has more recently been characterized by intermittent ash plumes and thermal activity (BGVN 47:11). This report updates activity that occurred from November 2022 through May 2023 based on information from the Darwin Volcanic Ash Advisory Center (VAAC) and various satellite data.
Ash plumes were reported during November and December 2022 by the Darwin VAAC. On 7 November an ash plume rose to 2.1 km altitude and drifted NE based on satellite images and weather models. On 14 November an ash plume rose to 2.1 km altitude and drifted W based on RVO webcam images. On 20 November ash plumes rose to 1.8 km altitude and drifted NW. On 26 December an ash plume rose to 3 km altitude and drifted S and SSE.
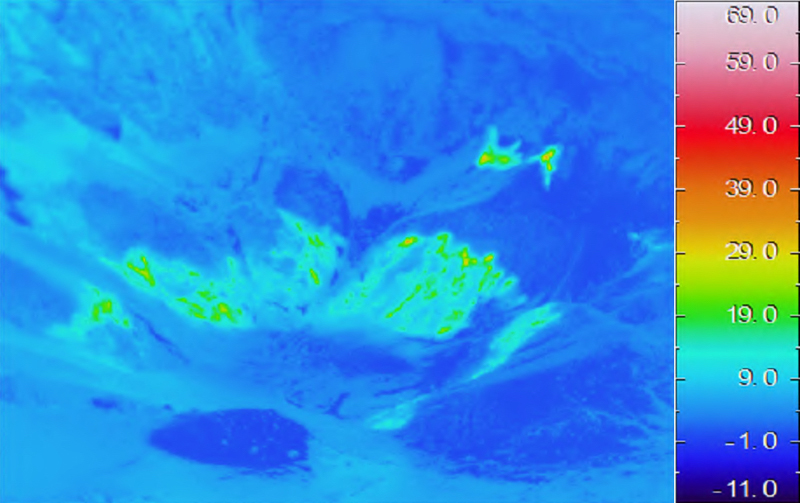
Intermittent sulfur dioxide plumes were detected using the TROPOMI instrument on the Sentinel-5P satellite, some of which exceeded at least two Dobson Units (DU) and drifted in different directions (figure 93). Occasional low-to-moderate power thermal anomalies were recorded by the MIROVA (Middle InfraRed Observation of Volcanic Activity) system; less than five anomalies were recorded each month during November 2022 through May 2023 (figure 94). Two thermal hotspots were detected by the MODVOLC thermal alerts system on 10 December 2022. On clear weather days, thermal activity was also captured in infrared satellite imagery in both the Main and South summit craters, accompanied by gas-and-steam emissions (figure 95).
Geologic Background. The 10-km-wide island of Manam, lying 13 km off the northern coast of mainland Papua New Guinea, is one of the country's most active volcanoes. Four large radial valleys extend from the unvegetated summit of the conical basaltic-andesitic stratovolcano to its lower flanks. These valleys channel lava flows and pyroclastic avalanches that have sometimes reached the coast. Five small satellitic centers are located near the island's shoreline on the northern, southern, and western sides. Two summit craters are present; both are active, although most observed eruptions have originated from the southern crater, concentrating eruptive products during much of the past century into the SE valley. Frequent eruptions, typically of mild-to-moderate scale, have been recorded since 1616. Occasional larger eruptions have produced pyroclastic flows and lava flows that reached flat-lying coastal areas and entered the sea, sometimes impacting populated areas.
Information Contacts: Rabaul Volcano Observatory (RVO), Geohazards Management Division, Department of Mineral Policy and Geohazards Management (DMPGM), PO Box 3386, Kokopo, East New Britain Province, Papua New Guinea; Darwin Volcanic Ash Advisory Centre (VAAC), Bureau of Meteorology, Northern Territory Regional Office, PO Box 40050, Casuarina, NT 0811, Australia (URL: http://www.bom.gov.au/info/vaac/); MIROVA (Middle InfraRed Observation of Volcanic Activity), a collaborative project between the Universities of Turin and Florence (Italy) supported by the Centre for Volcanic Risk of the Italian Civil Protection Department (URL: http://www.mirovaweb.it/); Hawai'i Institute of Geophysics and Planetology (HIGP) - MODVOLC Thermal Alerts System, School of Ocean and Earth Science and Technology (SOEST), Univ. of Hawai'i, 2525 Correa Road, Honolulu, HI 96822, USA (URL: http://modis.higp.hawaii.edu/); NASA Global Sulfur Dioxide Monitoring Page, Atmospheric Chemistry and Dynamics Laboratory, NASA Goddard Space Flight Center (NASA/GSFC), 8800 Greenbelt Road, Goddard, Maryland, USA (URL: https://so2.gsfc.nasa.gov/); Copernicus Browser, Copernicus Data Space Ecosystem, European Space Agency (URL: https://dataspace.copernicus.eu/browser/).
Krakatau (Indonesia) — July 2023 Cite this Report
Krakatau
Indonesia
6.1009°S, 105.4233°E; summit elev. 285 m
All times are local (unless otherwise noted)
Strombolian activity and ash plumes during November 2022-April 2023
Krakatau is located in the Sunda Strait between Java and Sumatra, Indonesia. Caldera collapse during the catastrophic 1883 eruption destroyed Danan and Perbuwatan cones and left only a remnant of Rakata. The post-collapse cone of Anak Krakatau (Child of Krakatau) was constructed within the 1883 caldera at a point between the former Danan and Perbuwatan cones; it has been the site of frequent eruptions since 1927. The current eruption period began in May 2021 and has recently consisted of explosions, ash plumes, and thermal activity (BGVN 47:11). This report covers activity during November 2022 through April 2023 based on information provided by the Indonesian Center for Volcanology and Geological Hazard Mitigation, referred to as Pusat Vulkanologi dan Mitigasi Bencana Geologi (PVMBG), MAGMA Indonesia, the Darwin Volcanic Ash Advisory Center (VAAC), and several sources of satellite data.
Activity was relatively low during November and December 2022. Daily white gas-and-steam plumes rose 25-100 m above the summit and drifted in different directions. Gray ash plumes rose 200 m above the summit and drifted NE at 1047 and at 2343 on 11 November. On 14 November at 0933 ash plumes rose 300 m above the summit and drifted E. An ash plume was reported at 0935 on 15 December that rose 100 m above the summit and drifted NE. An eruptive event at 1031 later that day generated an ash plume that rose 700 m above the summit and drifted NE. A gray ash plume at 1910 rose 100 m above the summit and drifted E. Incandescent material was ejected above the vent based on an image taken at 1936.
During January 2023 daily white gas-and-steam plumes rose 25-300 m above the summit and drifted in multiple directions. Gray-to-brown ash plumes were reported at 1638 on 3 January, at 1410 and 1509 on 4 January, and at 0013 on 5 January that rose 100-750 m above the summit and drifted NE and E; the gray-to-black ash plume at 1509 on 4 January rose as high as 3 km above the summit and drifted E. Gray ash plumes were recorded at 1754, 2241, and 2325 on 11 January and at 0046 on 12 January and rose 200-300 m above the summit and drifted NE. Toward the end of January, PVMBG reported that activity had intensified; Strombolian activity was visible in webcam images taken at 0041, 0043, and 0450 on 23 January. Multiple gray ash plumes throughout the day rose 200-500 m above the summit and drifted E and SE (figure 135). Webcam images showed progressively intensifying Strombolian activity at 1919, 1958, and 2113 on 24 January; a gray ash plume at 1957 rose 300 m above the summit and drifted E (figure 135). Eruptive events at 0231 and 2256 on 25 January and at 0003 on 26 January ejected incandescent material from the vent, based on webcam images. Gray ash plumes observed during 26-27 January rose 300-500 m above the summit and drifted NE, E, and SE.
Low levels of activity were reported during February and March. Daily white gas-and-steam plumes rose 25-300 m above the summit and drifted in different directions. The Darwin VAAC reported that continuous ash emissions rose to 1.5-1.8 km altitude and drifted W and NW during 1240-1300 on 10 March, based on satellite images, weather models, and PVMBG webcams. White-and-gray ash plumes rose 500 m and 300 m above the summit and drifted SW at 1446 and 1846 on 18 March, respectively. An eruptive event was recorded at 2143, though it was not visible due to darkness. Multiple ash plumes were reported during 27-29 March that rose as high as 2.5 km above the summit and drifted NE, W, and SW (figure 136). Webcam images captured incandescent ejecta above the vent at 0415 and around the summit area at 2003 on 28 March and at 0047 above the vent on 29 March.
Daily white gas-and-steam plumes rose 25-300 m above the summit and drifted in multiple directions during April and May. White-and-gray and black plumes rose 50-300 m above the summit on 2 and 9 April. On 11 May at 1241 a gray ash plume rose 1-3 km above the summit and drifted SW. On 12 May at 0920 a gray ash plume rose 2.5 km above the summit and drifted SW and at 2320 an ash plume rose 1.5 km above the summit and drifted SW. An accompanying webcam image showed incandescent ejecta. On 13 May at 0710 a gray ash plume rose 2 km above the summit and drifted SW (figure 137).
The MIROVA (Middle InfraRed Observation of Volcanic Activity) graph of MODIS thermal anomaly data showed intermittent low-to-moderate power thermal anomalies during November 2022 through April 2023 (figure 138). Some of this thermal activity was also visible in infrared satellite imagery at the crater, accompanied by gas-and-steam and ash plumes that drifted in different directions (figure 139).
Geologic Background. The renowned Krakatau (frequently mis-named as Krakatoa) volcano lies in the Sunda Strait between Java and Sumatra. Collapse of an older edifice, perhaps in 416 or 535 CE, formed a 7-km-wide caldera. Remnants of that volcano are preserved in Verlaten and Lang Islands; subsequently the Rakata, Danan, and Perbuwatan cones were formed, coalescing to create the pre-1883 Krakatau Island. Caldera collapse during the catastrophic 1883 eruption destroyed Danan and Perbuwatan, and left only a remnant of Rakata. This eruption caused more than 36,000 fatalities, most as a result of tsunamis that swept the adjacent coastlines of Sumatra and Java. Pyroclastic surges traveled 40 km across the Sunda Strait and reached the Sumatra coast. After a quiescence of less than a half century, the post-collapse cone of Anak Krakatau (Child of Krakatau) was constructed within the 1883 caldera at a point between the former Danan and Perbuwatan cones. Anak Krakatau has been the site of frequent eruptions since 1927.
Information Contacts: Pusat Vulkanologi dan Mitigasi Bencana Geologi (PVMBG, also known as Indonesian Center for Volcanology and Geological Hazard Mitigation, CVGHM), Jalan Diponegoro 57, Bandung 40122, Indonesia (URL: http://www.vsi.esdm.go.id/); MAGMA Indonesia, Kementerian Energi dan Sumber Daya Mineral (URL: https://magma.esdm.go.id/v1); Darwin Volcanic Ash Advisory Centre (VAAC), Bureau of Meteorology, Northern Territory Regional Office, PO Box 40050, Casuarina, NT 0811, Australia (URL: http://www.bom.gov.au/info/vaac/); MIROVA (Middle InfraRed Observation of Volcanic Activity), a collaborative project between the Universities of Turin and Florence (Italy) supported by the Centre for Volcanic Risk of the Italian Civil Protection Department (URL: http://www.mirovaweb.it/); Copernicus Browser, Copernicus Data Space Ecosystem, European Space Agency (URL: https://dataspace.copernicus.eu/browser/).
Stromboli
Italy
38.789°N, 15.213°E; summit elev. 924 m
All times are local (unless otherwise noted)
Strombolian explosions and lava flows continue during January-April 2023
Stromboli, located in Italy, has exhibited nearly constant lava fountains for the past 2,000 years; recorded eruptions date back to 350 BCE. Eruptive activity occurs at the summit from multiple vents, which include a north crater area (N area) and a central-southern crater (CS area) on a terrace known as the ‘terrazza craterica’ at the head of the Sciara del Fuoco, a large scarp that runs from the summit down the NW side of the volcano-island. Activity typically consists of Strombolian explosions, incandescent ejecta, lava flows, and pyroclastic flows. Thermal and visual monitoring cameras are located on the nearby Pizzo Sopra La Fossa, above the terrazza craterica, and at multiple flank locations. The current eruption period has been ongoing since 1934 and recent activity has consisted of frequent Strombolian explosions and lava flows (BGVN 48:02). This report updates activity during January through April 2023 primarily characterized by Strombolian explosions and lava flows based on reports from Italy's Istituto Nazionale di Geofisica e Vulcanologia (INGV) and various satellite data.
Frequent explosive activity continued throughout the reporting period, generally in the low-to-medium range, based on the number of hourly explosions in the summit crater (figure 253, table 16). Intermittent thermal activity was recorded by the MIROVA (Middle InfraRed Observation of Volcanic Activity) analysis of MODIS satellite data (figure 254). According to data collected by the MODVOLC thermal algorithm, a total of 9 thermal alerts were detected: one on 2 January 2023, one on 1 February, five on 24 March, and two on 26 March. The stronger pulses of thermal activity likely reflected lava flow events. Infrared satellite imagery captured relatively strong thermal hotspots at the two active summit craters on clear weather days, showing an especially strong event on 8 March (figure 255).
Table 16. Summary of type, frequency, and intensity of explosive activity at Stromboli by month during January-April 2023; information from webcam observations. Courtesy of INGV weekly reports.
| Month |
Explosive Activity |
| Jan 2023 |
Typical Strombolian activity with spattering and lava overflows in the N crater area. Explosions were reported from 4 vents in the N area and 1-2 vents in the CS area. The average hourly frequency of explosions was low-to-medium (1-12 events/hour). The intensity of the explosions varied from low (less than 80 m high) to medium (less than 150 m high) in the N crater area and up to high (greater than 150 m high) in the CS crater area. |
| Feb 2023 |
Typical Strombolian activity with spattering in the N crater area. Explosions were reported from 2-3 vents in the N area and 1-4 vents in the CS area. The average hourly frequency of explosions was low-to-medium (1-14 events/hour). The intensity of the explosions varied from low (less than 80 m high) to medium (less than 150 m high) in the N crater area and up to high (greater than 150 m high) in the CS crater area. |
| Mar 2023 |
Typical Strombolian activity with spattering and lava overflows in the N crater area. Explosions were reported from 2-3 vents in the N area and 2-4 vents in the CS area. The average hourly frequency of explosions was low-to-medium (1-18 events/hour). The intensity of the explosions varied from low (less than 80 m high) to medium (less than 150 m high) in the N crater area and up to high (greater than 150 m high) in the CS crater area. |
| Apr 2023 |
Typical Strombolian activity. Explosions were reported from 2 vents in the N area and 2-3 vents in the CS area. The average hourly frequency of explosions was low-to-high (1-16 events/hour). The intensity of the explosions varied from low (less than 80 m high) to medium (less than 150 m high) in both the N and CS crater areas. |
Activity during January-February 2023. Strombolian explosions were reported in the N crater area, as well as lava effusion. Explosive activity in the N crater area ejected coarse material (bombs and lapilli). Intense spattering was observed in both the N1 and N2 craters. In the CS crater area, explosions generally ejected fine material (ash), sometimes to heights greater than 250 m. The intensity of the explosions was characterized as low-to-medium in the N crater and medium-to-high in the CS crater. After intense spattering activity from the N crater area, a lava overflow began at 2136 on 2 January that flowed part way down the Sciara del Fuoco, possibly moving down the drainage that formed in October, out of view from webcams. The flow remained active for a couple of hours before stopping and beginning to cool. A second lava flow was reported at 0224 on 4 January that similarly remained active for a few hours before stopping and cooling. Intense spattering was observed on 11 and 13 January from the N1 crater. After intense spattering activity at the N2 crater at 1052 on 17 January another lava flow started to flow into the upper part of the Sciara del Fuoco (figure 256), dividing into two: one that traveled in the direction of the drainage formed in October, and the other one moving parallel to the point of emission. By the afternoon, the rate of the flow began to decrease, and at 1900 it started to cool. A lava flow was reported at 1519 on 24 January following intense spattering in the N2 area, which began to flow into the upper part of the Sciara del Fuoco. By the morning of 25 January, the lava flow had begun to cool. During 27 January the frequency of eruption in the CS crater area increased to 6-7 events/hour compared to the typical 1-7 events/hour; the following two days showed a decrease in frequency to less than 1 event/hour. Starting at 1007 on 30 January a high-energy explosive sequence was produced by vents in the CS crater area. The sequence began with an initial energetic pulse that lasted 45 seconds, ejecting predominantly coarse products 300 m above the crater that fell in an ESE direction. Subsequent and less intense explosions ejected material 100 m above the crater. The total duration of this event lasted approximately two minutes. During 31 January through 6, 13, and 24 February spattering activity was particularly intense for short periods in the N2 crater.
An explosive sequence was reported on 16 February that was characterized by a major explosion in the CS crater area (figure 257). The sequence began at 1817 near the S2 crater that ejected material radially. A few seconds later, lava fountains were observed in the central part of the crater. Three explosions of medium intensity (material was ejected less than 150 m high) were recorded at the S2 crater. The first part of this sequence lasted approximately one minute, according to INGV, and material rose 300 m above the crater and then was deposited along the Sciara del Fuoco. The second phase began at 1818 at the S1 crater; it lasted seven seconds and material was ejected 150 m above the crater. Another event 20 seconds later lasted 12 seconds, also ejecting material 150 m above the crater. The sequence ended with at least three explosions of mostly fine material from the S1 crater. The total duration of this sequence was about two minutes.
Short, intense spattering activity was noted above the N1 crater on 27 and 28 February. A lava overflow was first reported at 0657 from the N2 crater on 27 February that flowed into the October 2022 drainage. By 1900 the flow had stopped. A second lava overflow also in the N crater area occurred at 2149, which overlapped the first flow and then stopped by 0150 on 28 February. Material detached from both the lava overflows rolled down the Sciara del Fuoco, some of which was visible in webcam images.
Activity during March-April 2023. Strombolian activity continued with spattering activity and lava overflows in the N crater area during March. Explosive activity at the N crater area varied from low (less than 80 m high) to medium (less than 150 m high) and ejected coarse material, such as bombs and lapilli. Spattering was observed above the N1 crater, while explosive activity at the CS crater area varied from medium to high (greater than 150 m high) and ejected coarse material. Intense spattering activity was observed for short periods on 6 March above the N1 crater. At approximately 0610 a lava overflow was reported around the N2 crater on 8 March, which then flowed into the October 2022 drainage. By 1700 the flow started to cool. A second overflow began at 1712 on 9 March and overlapped the previous flow. It had stopped by 2100. Material from both flows was deposited along the Sciara del Fuoco, though much of the activity was not visible in webcam images. On 11 March a lava overflow was observed at 0215 that overlapped the two previous flows in the October 2022 drainage. By late afternoon on 12 March, it had stopped.
During a field excursion on 16 March, scientists noted that a vent in the central crater area was degassing. Another vent showed occasional Strombolian activity that emitted ash and lapilli. During 1200-1430 low-to-medium intense activity was reported; the N1 crater emitted ash emissions and the N2 crater emitted both ash and coarse material. Some explosions also occurred in the CS crater area that ejected coarse material. The C crater in the CS crater area occasionally showed gas jetting and low intensity explosions on 17 and 22 March; no activity was observed at the S1 crater. Intense, longer periods of spattering were reported in the N1 crater on 19, 24, and 25 March. Around 2242 on 23 March a lava overflow began from the N1 crater that, after about an hour, began moving down the October 2022 drainage and flow along the Sciara del Fuoco (figure 258). Between 0200 and 0400 on 26 March the flow rate increased, which generated avalanches of material from collapses at the advancing flow front. By early afternoon, the flow began to cool. On 25 March at 1548 an explosive sequence began from one of the vents at S2 in the CS crater area (figure 258). Fine ash mixed with coarse material was ejected 300 m above the crater rim and drifted SSE. Some modest explosions around Vent C were detected at 1549 on 25 March, which included an explosion at 1551 that ejected coarse material. The entire explosive sequence lasted approximately three minutes.
During April explosions persisted in both the N and CS crater areas. Fine material was ejected less than 80 m above the N crater rim until 6 April, followed by ejection of coarser material. Fine material was also ejected less than 80 m above the CS crater rim. The C and S2 crater did not show significant eruptive activity. On 7 April an explosive sequence was detected in the CS crater area at 1203 (figure 259). The first explosion lasted approximately 18 seconds and ejected material 400 m above the crater rim, depositing pyroclastic material in the upper part of the Sciara del Fuoco. At 1204 a second, less intense explosion lasted approximately four seconds and deposited pyroclastic products outside the crater area and near Pizzo Sopra La Fossa. A third explosion at 1205 was mainly composed of ash that rose about 150 m above the crater and lasted roughly 20 seconds. A fourth explosion occurred at 1205 about 28 seconds after the third explosion and ejected a mixture of coarse and fine material about 200 m above the crater; the explosion lasted roughly seven seconds. Overall, the entire explosive sequence lasted about two minutes and 20 seconds. After the explosive sequence on 7 April, explosions in both the N and CS crater areas ejected material as high as 150 m above the crater.
On 21 April research scientists from INGV made field observations in the summit area of Stromboli, and some lapilli samples were collected. In the N crater area near the N1 crater, a small cone was observed with at least two active vents, one of which was characterized by Strombolian explosions. The other vent produced explosions that ejected ash and chunks of cooled lava. At the N2 crater at least one vent was active and frequently emitted ash. In the CS crater area, a small cone contained 2-3 degassing vents and a smaller, possible fissure area also showed signs of degassing close to the Pizzo Sopra La Fossa. In the S part of the crater, three vents were active: a small hornito was characterized by modest and rare explosions, a vent that intermittently produced weak Strombolian explosions, and a vent at the end of the terrace that produced frequent ash emissions. Near the S1 crater there was a hornito that generally emitted weak gas-and-steam emissions, sometimes associated with “gas rings”. On 22 April another field inspection was carried out that reported two large sliding surfaces on the Sciara del Fuoco that showed where blocks frequently descended toward the sea. A thermal anomaly was detected at 0150 on 29 April.
Geologic Background. Spectacular incandescent nighttime explosions at Stromboli have long attracted visitors to the "Lighthouse of the Mediterranean" in the NE Aeolian Islands. This volcano has lent its name to the frequent mild explosive activity that has characterized its eruptions throughout much of historical time. The small island is the emergent summit of a volcano that grew in two main eruptive cycles, the last of which formed the western portion of the island. The Neostromboli eruptive period took place between about 13,000 and 5,000 years ago. The active summit vents are located at the head of the Sciara del Fuoco, a prominent scarp that formed about 5,000 years ago due to a series of slope failures which extends to below sea level. The modern volcano has been constructed within this scarp, which funnels pyroclastic ejecta and lava flows to the NW. Essentially continuous mild Strombolian explosions, sometimes accompanied by lava flows, have been recorded for more than a millennium.
Information Contacts: Istituto Nazionale di Geofisica e Vulcanologia (INGV), Sezione di Catania, Piazza Roma 2, 95123 Catania, Italy, (URL: http://www.ct.ingv.it/en/); MIROVA (Middle InfraRed Observation of Volcanic Activity), a collaborative project between the Universities of Turin and Florence (Italy) supported by the Centre for Volcanic Risk of the Italian Civil Protection Department (URL: http://www.mirovaweb.it/); Hawai'i Institute of Geophysics and Planetology (HIGP) - MODVOLC Thermal Alerts System, School of Ocean and Earth Science and Technology (SOEST), Univ. of Hawai'i, 2525 Correa Road, Honolulu, HI 96822, USA (URL: http://modis.higp.hawaii.edu/); Copernicus Browser, Copernicus Data Space Ecosystem, European Space Agency (URL: https://dataspace.copernicus.eu/browser/).
Nishinoshima (Japan) — July 2023 Cite this Report
Nishinoshima
Japan
27.247°N, 140.874°E; summit elev. 100 m
All times are local (unless otherwise noted)
Small ash plumes and fumarolic activity during November 2022 through April 2023
Nishinoshima is a small island located about 1,000 km S of Tokyo in the Ogasawara Arc in Japan. The island is the summit of a massive submarine volcano that has prominent peaks to the S, W, and NE. Eruptions date back to 1973; the most recent eruption period began in October 2022 and was characterized by ash plumes and fumarolic activity (BGVN 47:12). This report describes ash plumes and fumarolic activity during November 2022 through April 2023 based on monthly reports from the Japan Meteorological Agency (JMA) monthly reports and satellite data.
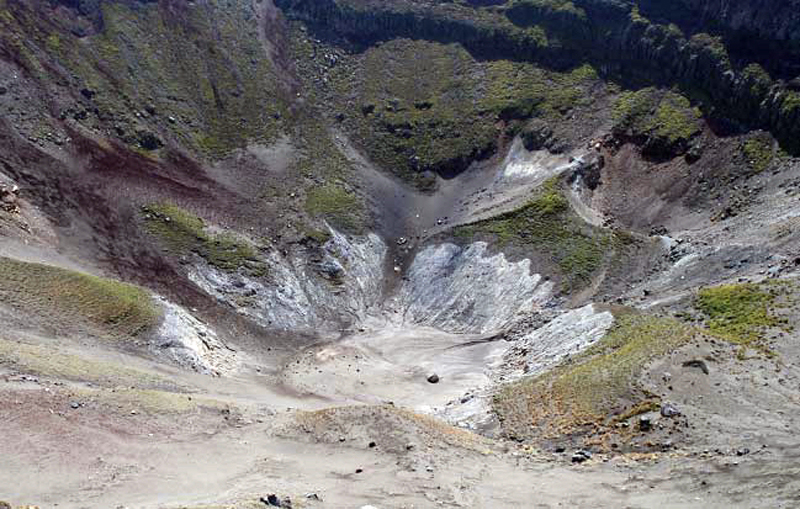
The most recent eruptive activity prior to the reporting internal occurred on 12 October 2022, when an ash plume rose 3.5 km above the crater rim. An aerial observation conducted by the Japan Coast Guard (JCG) on 25 November reported that white fumaroles rose approximately 200 m above the central crater of a pyroclastic cone (figure 119), and multiple plumes were observed on the ESE flank of the cone. Discolored water ranging from reddish-brown to brown and yellowish-green were visible around the perimeter of the island (figure 119). No significant activity was reported in December.
During an overflight conducted by JCG on 25 January 2023 intermittent activity and small, blackish-gray plumes rose 900 m above the central part of the crater were observed (figure 120). The fumarolic zone of the E flank and base of the cone had expanded and emissions had intensified. Dark brown discolored water was visible around the perimeter of the island.
No significant activity was reported during February through March. Ash plumes at 1050 and 1420 on 11 April rose 1.9 km above the crater rim and drifted NW and N. These were the first ash plumes observed since 12 October 2022. On 14 April JCG carried out an overflight and reported that no further eruptive activity was visible, although white gas-and-steam plumes were visible from the central crater and rose 900 m high (figure 121). Brownish and yellow-green discolored water surrounded the island.
Intermittent low-to-moderate power thermal anomalies were recorded in the MIROVA graph (Middle InfraRed Observation of Volcanic Activity) during November 2022 through April 2023 (figure 123). A cluster of six to eight anomalies were detected during November while a smaller number were detected during the following months: two to three during December, one during mid-January 2023, one during February, five during March, and two during April. Thermal activity was also reflected in infrared satellite data at the summit crater, accompanied by occasional gas-and-steam plumes (figure 124).
Geologic Background. The small island of Nishinoshima was enlarged when several new islands coalesced during an eruption in 1973-74. Multiple eruptions that began in 2013 completely covered the previous exposed surface and continued to enlarge the island. The island is the summit of a massive submarine volcano that has prominent peaks to the S, W, and NE. The summit of the southern cone rises to within 214 m of the ocean surface 9 km SSE.
Information Contacts: Japan Meteorological Agency (JMA), 1-3-4 Otemachi, Chiyoda-ku, Tokyo 100-8122, Japan (URL: http://www.jma.go.jp/jma/indexe.html); MIROVA (Middle InfraRed Observation of Volcanic Activity), a collaborative project between the Universities of Turin and Florence (Italy) supported by the Centre for Volcanic Risk of the Italian Civil Protection Department (URL: http://www.mirovaweb.it/); Copernicus Browser, Copernicus Data Space Ecosystem, European Space Agency (URL: https://dataspace.copernicus.eu/browser/).
Karangetang (Indonesia) — July 2023 Cite this Report
Karangetang
Indonesia
2.781°N, 125.407°E; summit elev. 1797 m
All times are local (unless otherwise noted)
Lava flows, incandescent avalanches, and ash plumes during January-June 2023
Karangetang (also known as Api Siau), at the northern end of the island of Siau, Indonesia, contains five summit craters along a N-S line. More than 40 eruptions have been recorded since 1675; recent eruptions have included frequent explosive activity, sometimes accompanied by pyroclastic flows and lahars. Lava dome growth has occurred in the summit craters and collapses of lava flow fronts have produced pyroclastic flows. The two active summit craters are Kawah Dua (the N crater) and Kawah Utama (the S crater, also referred to as the “Main Crater”). The most recent eruption began in late November 2018 and has more recently consisted of weak thermal activity and gas-and-steam emissions (BGVN 48:01). This report updates activity characterized by lava flows, incandescent avalanches, and ash plumes during January through June 2023 using reports from Pusat Vulkanologi dan Mitigasi Bencana Geologi (PVMBG, also known as CVGHM, or the Center of Volcanology and Geological Hazard Mitigation), MAGMA Indonesia, the Darwin VAAC (Volcano Ash Advisory Center), and satellite data.
Activity during January was relatively low and mainly consisted of white gas-and-steam emissions that rose 25-150 m above Main Crater (S crater) and drifted in different directions. Incandescence was visible from the lava dome in Kawah Dua (the N crater). Weather conditions often prevented clear views of the summit. On 18 January the number of seismic signals that indicated avalanches of material began to increase. In addition, there were a total of 71 earthquakes detected during the month.
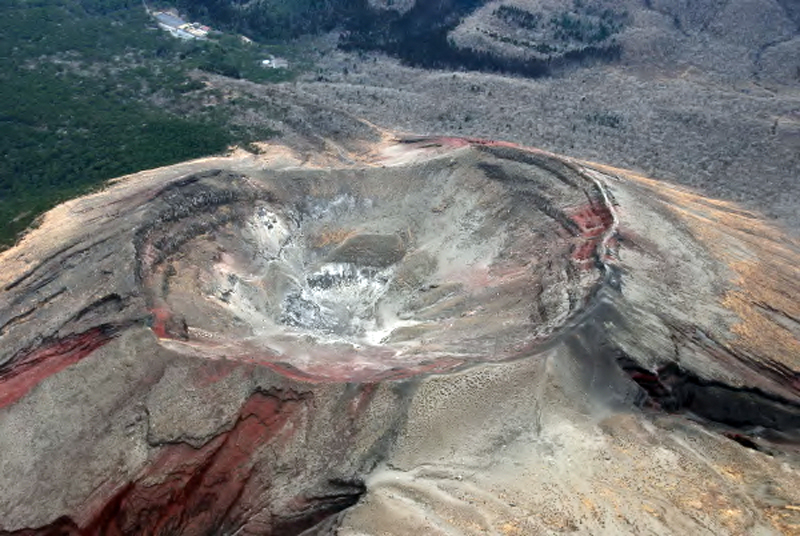
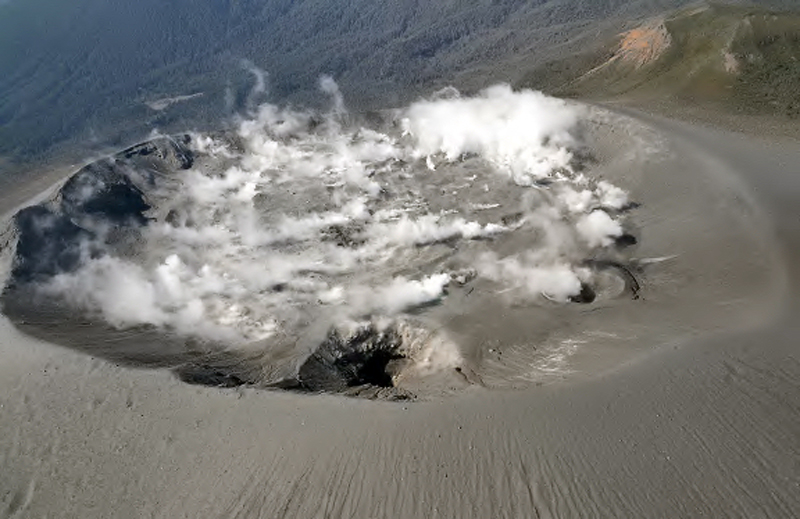
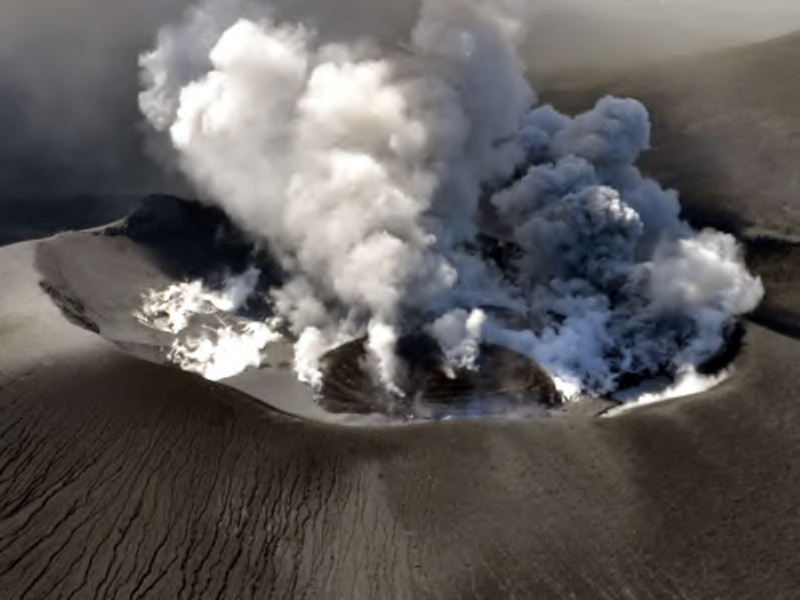
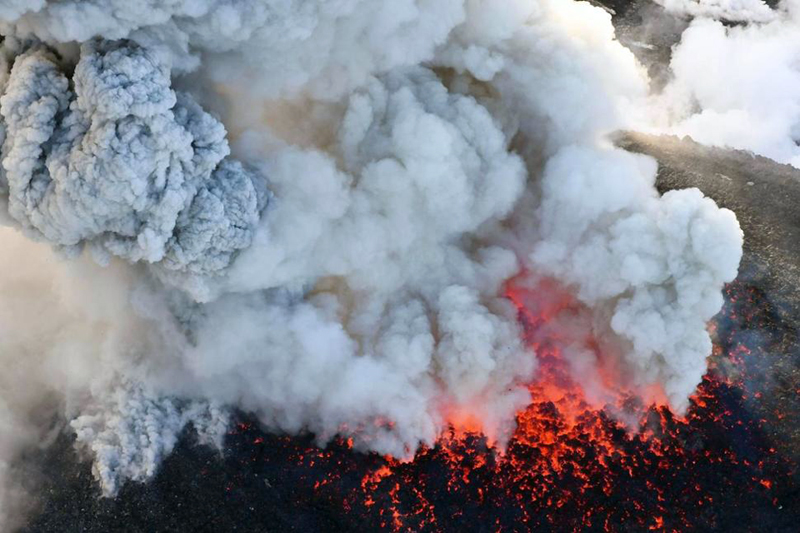
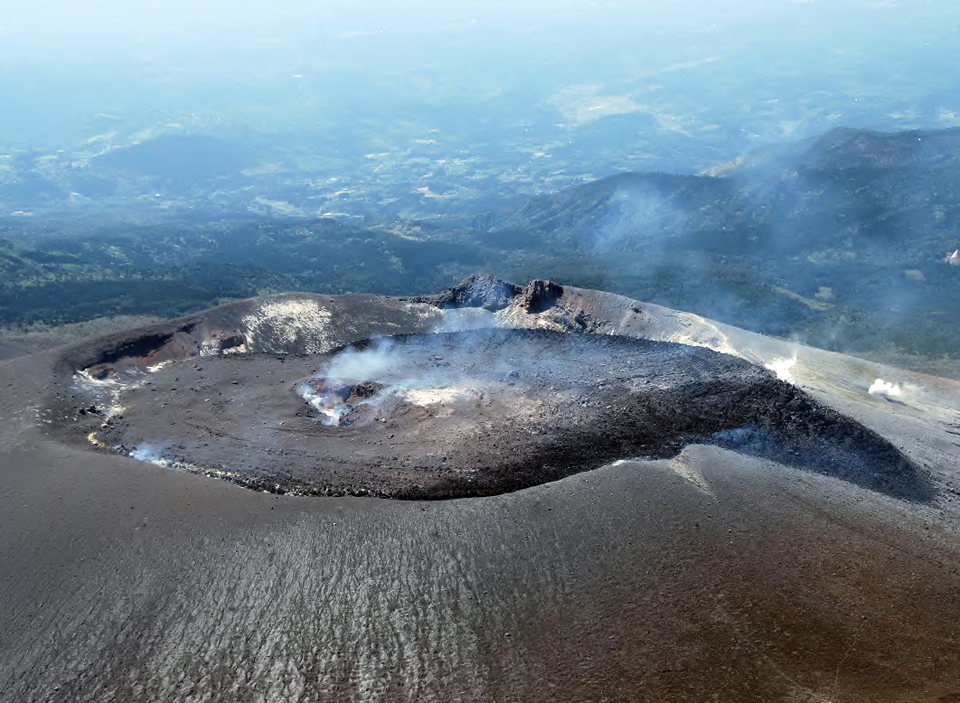
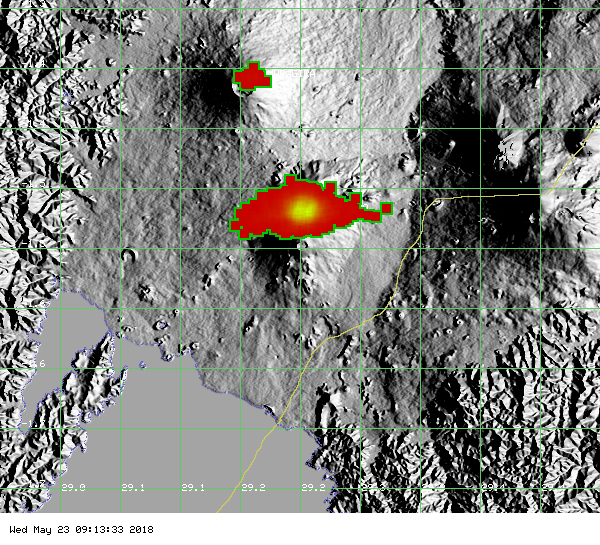
Activity continued to increase during the first week of February. Material from Main Crater traveled as far as 800 m down the Batuawang (S) and Batang (W) drainages and as far as 1 km W down the Beha (W) drainage on 4 February. On 6 February 43 earthquake events were recorded, and on 7 February, 62 events were recorded. White gas-and-steam emissions rose 25-250 m above both summit craters throughout the month. PVMBG reported an eruption began during the evening of 8 February around 1700. Photos showed incandescent material at Main Crater. Incandescent material had also descended the flank in at least two unconfirmed directions as far as 2 km from Main Crater, accompanied by ash plumes (figure 60). As a result, PVMBG increased the Volcano Alert Level (VAL) to 3 (the second highest level on a 1-4 scale).
Occasional nighttime webcam images showed three main incandescent lava flows of differing lengths traveling down the S, SW, and W flanks (figure 61). Incandescent rocks were visible on the upper flanks, possibly from ejected or collapsed material from the crater, and incandescence was the most intense at the summit. Based on analyses of satellite imagery and weather models, the Darwin VAAC reported that daily ash plumes during 16-20 February rose to 2.1-3 km altitude and drifted NNE, E, and SE. BNPB reported on 16 February that as many as 77 people were evacuated and relocated to the East Siau Museum. A webcam image taken at 2156 on 17 February possibly showed incandescent material descending the SE flank. Ash plumes rose to 2.1 km altitude and drifted SE during 22-23 February, according to the Darwin VAAC.
Incandescent avalanches of material and summit incandescence at Main Crater continued during March. White gas-and-steam emissions during March generally rose 25-150 m above the summit crater; on 31 March gas-and-steam emissions rose 200-400 m high. An ash plume rose to 2.4 km altitude and drifted S at 1710 on 9 March and a large thermal anomaly was visible in images taken at 0550 and 0930 on 10 March. Incandescent material was visible at the summit and on the flanks based on webcam images taken at 0007 and 2345 on 16 March, at 1828 on 17 March, at 1940 on 18 March, at 2311 on 19 March, and at 2351 on 20 March. Incandescence was most intense on 18 and 20 March and webcam images showed possible Strombolian explosions (figure 62). An ash plume rose to 2.4 km altitude and drifted SW on 18 March, accompanied by a thermal anomaly.
Summit crater incandescence at Main Crater and on the flanks persisted during April. Incandescent material at the S crater and on the flanks was reported at 0016 on 1 April. The lava flows had stopped by 1 April according to PVMBG, although incandescence was still visible up to 10 m high. Seismic signals indicating effusion decreased and by 6 April they were no longer detected. Incandescence was visible from both summit craters. On 26 April the VAL was lowered to 2 (the second lowest level on a 1-4 scale). White gas-and-steam emissions rose 25-200 m above the summit crater.
During May white gas-and-steam emissions generally rose 50-250 m above the summit, though it was often cloudy, which prevented clear views; on 21 May gas-and-steam emissions rose 50-400 m high. Nighttime N summit crater incandescence rose 10-25 m above the lava dome, and less intense incandescence was noted above Main Crater, which reached about 10 m above the dome. Sounds of falling rocks at Main Crater were heard on 15 May and the seismic network recorded 32 rockfall events in the crater on 17 May. Avalanches traveled as far as 1.5 km down the SW and S flanks, accompanied by rumbling sounds on 18 May. Incandescent material descending the flanks was captured in a webcam image at 2025 on 19 May (figure 63) and on 29 May; summit crater incandescence was observed in webcam images at 2332 on 26 May and at 2304 on 29 May. On 19 May the VAL was again raised to 3.
Occasional Main Crater incandescence was reported during June, as well as incandescent material on the flanks. White gas-and-steam emissions rose 10-200 m above the summit crater. Ash plumes rose to 2.1 km altitude and drifted SE and E during 2-4 June, according to the Darwin VAAC. Material on the flanks of Main Crater were observed at 2225 on 7 June, at 2051 on 9 June, at 0007 on 17 June, and at 0440 on 18 June. Webcam images taken on 21, 25, and 27 June showed incandescence at Main Crater and from material on the flanks.
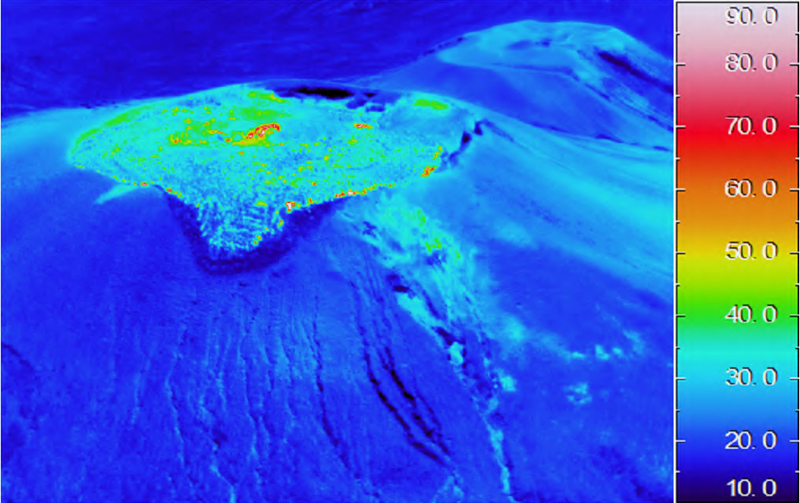
MIROVA (Middle InfraRed Observation of Volcanic Activity) analysis of MODIS satellite data showed strong thermal activity during mid-February through March and mid-May through June, which represented incandescent avalanches and lava flows (figure 64). During April through mid-May the power of the anomalies decreased but frequent anomalies were still detected. Brief gaps in activity occurred during late March through early April and during mid-June. Infrared satellite images showed strong lava flows mainly affecting the SW and S flanks, accompanied by gas-and-steam emissions (figure 65). According to data recorded by the MODVOLC thermal algorithm, there were a total of 79 thermal hotspots detected: 28 during February, 24 during March, one during April, five during May, and 21 during June.
Geologic Background. Karangetang (Api Siau) volcano lies at the northern end of the island of Siau, about 125 km NNE of the NE-most point of Sulawesi. The stratovolcano contains five summit craters along a N-S line. It is one of Indonesia's most active volcanoes, with more than 40 eruptions recorded since 1675 and many additional small eruptions that were not documented (Neumann van Padang, 1951). Twentieth-century eruptions have included frequent explosive activity sometimes accompanied by pyroclastic flows and lahars. Lava dome growth has occurred in the summit craters; collapse of lava flow fronts have produced pyroclastic flows.
Information Contacts: Pusat Vulkanologi dan Mitigasi Bencana Geologi (PVMBG, also known as Indonesian Center for Volcanology and Geological Hazard Mitigation, CVGHM), Jalan Diponegoro 57, Bandung 40122, Indonesia (URL: http://www.vsi.esdm.go.id/); MAGMA Indonesia, Kementerian Energi dan Sumber Daya Mineral (URL: https://magma.esdm.go.id/v1); Badan Nasional Penanggulangan Bencana (BNPB), National Disaster Management Agency, Graha BNPB - Jl. Scout Kav.38, East Jakarta 13120, Indonesia (URL: http://www.bnpb.go.id/); Darwin Volcanic Ash Advisory Centre (VAAC), Bureau of Meteorology, Northern Territory Regional Office, PO Box 40050, Casuarina, NT 0811, Australia (URL: http://www.bom.gov.au/info/vaac/); MIROVA (Middle InfraRed Observation of Volcanic Activity), a collaborative project between the Universities of Turin and Florence (Italy) supported by the Centre for Volcanic Risk of the Italian Civil Protection Department (URL: http://www.mirovaweb.it/); Hawai'i Institute of Geophysics and Planetology (HIGP) - MODVOLC Thermal Alerts System, School of Ocean and Earth Science and Technology (SOEST), Univ. of Hawai'i, 2525 Correa Road, Honolulu, HI 96822, USA (URL: http://modis.higp.hawaii.edu/); Copernicus Browser, Copernicus Data Space Ecosystem, European Space Agency (URL: https://dataspace.copernicus.eu/browser/); IDN Times, Jl. Jend. Gatot Subroto Kav. 27 3rd Floor Kuningan, Jakarta, Indonesia 12950, Status of Karangetang Volcano in Sitaro Islands Increases (URL: https://sulsel.idntimes.com/news/indonesia/savi/status-gunung-api-karangetang-di-kepulauan-sitaro-meningkat?page=all).
Ahyi (United States) — July 2023 Cite this Report
Ahyi
United States
20.42°N, 145.03°E; summit elev. -75 m
All times are local (unless otherwise noted)
Intermittent hydroacoustic signals and discolored plumes during November 2022-June 2023
Ahyi seamount is a large, conical submarine volcano that rises to within 75 m of the ocean surface about 18 km SE of the island of Farallon de Pajaros in the Northern Marianas. The remote location of the seamount has made eruptions difficult to document, but seismic stations installed in the region confirmed an eruption in the vicinity in 2001. No new activity was detected until April-May 2014 when an eruption was detected by NOAA (National Oceanic and Atmospheric Administration) divers, hydroacoustic sensors, and seismic stations (BGVN 42:04). New activity was first detected on 15 November by hydroacoustic sensors that were consistent with submarine volcanic activity. This report covers activity during November 2022 through June 2023 based on daily and weekly reports from the US Geological Survey.
Starting in mid-October, hydroacoustic sensors at Wake Island (2.2 km E) recorded signals consistent with submarine volcanic activity, according to a report from the USGS issued on 15 November 2022. A combined analysis of the hydroacoustic signals and seismic stations located at Guam and Chichijima Island, Japan, suggested that the source of this activity was at or near the Ahyi seamount. After a re-analysis of a satellite image of the area that was captured on 6 November, USGS confirmed that there was no evidence of discoloration at the ocean surface. Few hydroacoustic and seismic signals continued through November, including on 18 November, which USGS suggested signified a decline or pause in unrest. A VONA (Volcano Observatory Notice for Aviation) reported that a discolored water plume was persistently visible in satellite data starting on 18 November (figure 6). Though clouds often obscured clear views of the volcano, another discolored water plume was captured in a satellite image on 26 November. The Aviation Color Code (ACC) was raised to Yellow (the second lowest level on a four-color scale) and the Volcano Alert Level (VAL) was raised to Advisory (the second lowest level on a four-level scale) on 29 November.
During December, occasional detections were recorded on the Wake Island hydrophone sensors and discolored water over the seamount remained visible. During 2-7, 10-12, and 16-31 December possible explosion signals were detected. A small area of discolored water was observed in high-resolution Sentinel-2 satellite images during 1-6 December (figure 7). High-resolution satellite images recorded discolored water plumes on 13 December that originated from the summit region; no observations indicated that activity breached the ocean surface. A possible underwater plume was visible in satellite images on 18 December, and during 19-20 December a definite but diffuse underwater plume located SSE from the main vent was reported. An underwater plume was visible in a satellite image taken on 26 December (figure 7).
Hydrophone sensors continued to detect signals consistent with possible explosions during 1-8 January 2023. USGS reported that the number of detections decreased during 4-5 January. The hydrophone sensors experienced a data outage that started at 0118 on 8 January and continued through 10 January, though according to USGS, possible explosions were recorded prior to the data outage and likely continued during the outage. A discolored water plume originating from the summit region was detected in a partly cloudy satellite image on 8 January. On 11-12 and 15-17 January possible explosion signals were recorded again. One small signal was detected during 22-23 January and several signals were recorded on 25 and 31 January. During 27-31 January a plume of discolored water was observed above the seamount in satellite imagery (figure 8).
Low levels of activity continued during February and March, based on data from pressure sensors on Wake Island. During 1 and 4-6 February activity was reported, and a submarine plume was observed on 4 February (figure 8). Possible explosion signals were detected during 7-8, 10, 13-14, and 24 February. During 1-2 and 3-5 March a plume of discolored water was observed in satellite imagery (figure 8). Almost continuous hydroacoustic signals were detected in remote pressure sensor data on Wake Island 2,270 km E from the volcano during 7-13 March. During 12-13 March water discoloration around the seamount was observed in satellite imagery, despite cloudy weather. By 14 March discolored water extended about 35 km, but no direction was noted. USGS reported that the continuous hydroacoustic signals detected during 13-14 March stopped abruptly on 14 March and no new detections were observed. Three 30 second hydroacoustic detections were reported during 17-19 March, but no activity was visible due to cloudy weather. A data outage was reported during 21-22 March, making pressure sensor data unavailable; a discolored water plume was, however, visible in satellite data. A possible underwater explosion signal was detected by pressure sensors at Wake Island on 26, 29, and 31 March, though the cause and origin of these events were unclear.
Similar low activity continued during April, May, and June. Several signals were detected during 1-3 April in pressure sensors at Wake Island. USGS suggested that these may be related to underwater explosions or earthquakes at the volcano, but no underwater plumes were visible in clear satellite images. The pressure sensors had data outages during 12-13 April and no data were recorded; no underwater plumes were visible in satellite images, although cloudy weather obscured most clear views. Eruptive activity was reported starting at 2210 on 21 May. On 22 May a discolored water plume that extended 4 km was visible in satellite images, though no direction was recorded. During 23-24 May some signals were detected by the underwater pressure sensors. Possible hydroacoustic signals were detected during 2-3 and 6-8 June. Multiple hydroacoustic signals were detected during 9-11 and 16-17 June, although no activity was visible in satellite images. One hydroacoustic signal was detected during 23-24 June, but there was some uncertainty about its association with volcanic activity. A single possible hydroacoustic signal was detected during 30 June to 1 July.
Geologic Background. Ahyi seamount is a large conical submarine volcano that rises to within 75 m of the ocean surface ~18 km SE of the island of Farallon de Pajaros in the northern Marianas. Water discoloration has been observed there, and in 1979 the crew of a fishing boat felt shocks over the summit area, followed by upwelling of sulfur-bearing water. On 24-25 April 2001 an explosive eruption was detected seismically by a station on Rangiroa Atoll, Tuamotu Archipelago. The event was well constrained (+/- 15 km) at a location near the southern base of Ahyi. An eruption in April-May 2014 was detected by NOAA divers, hydroacoustic sensors, and seismic stations.
Information Contacts: US Geological Survey, Volcano Hazards Program (USGS-VHP), 12201 Sunrise Valley Drive, Reston, VA, USA, https://volcanoes.usgs.gov/index.html; Copernicus Browser, Copernicus Data Space Ecosystem, European Space Agency (URL: https://dataspace.copernicus.eu/browser/).
Kadovar (Papua New Guinea) — June 2023 Cite this Report
Kadovar
Papua New Guinea
3.608°S, 144.588°E; summit elev. 365 m
All times are local (unless otherwise noted)
An ash plume and weak thermal anomaly during May 2023
Kadovar is a 2-km-wide island that is the emergent summit of a Bismarck Sea stratovolcano. It lies off the coast of New Guinea, about 25 km N of the mouth of the Sepik River. Prior to an eruption that began in 2018, a lava dome formed the high point of the volcano, filling an arcuate landslide scarp open to the S. Submarine debris-avalanche deposits occur to the S of the island. The current eruption began in January 2018 and has comprised lava effusion from vents at the summit and at the E coast; more recent activity has consisted of ash plumes, weak thermal activity, and gas-and-steam plumes (BGVN 48:02). This report covers activity during February through May 2023 using information from the Darwin Volcanic Ash Advisory Center (VAAC) and satellite data.
Activity during the reporting period was relatively low and mainly consisted of white gas-and-steam plumes that were visible in natural color satellite images on clear weather days (figure 67). According to a Darwin VAAC report, at 2040 on 6 May an ash plume rose to 4.6 km altitude and drifted W; by 2300 the plume had dissipated. MODIS satellite instruments using the MODVOLC thermal algorithm detected a single thermal hotspot on the SE side of the island on 7 May. Weak thermal activity was also detected in a satellite image on the E side of the island on 14 May, accompanied by a white gas-and-steam plume that drifted SE (figure 68).
Geologic Background. The 2-km-wide island of Kadovar is the emergent summit of a Bismarck Sea stratovolcano of Holocene age. It is part of the Schouten Islands, and lies off the coast of New Guinea, about 25 km N of the mouth of the Sepik River. Prior to an eruption that began in 2018, a lava dome formed the high point of the andesitic volcano, filling an arcuate landslide scarp open to the south; submarine debris-avalanche deposits occur in that direction. Thick lava flows with columnar jointing forms low cliffs along the coast. The youthful island lacks fringing or offshore reefs. A period of heightened thermal phenomena took place in 1976. An eruption began in January 2018 that included lava effusion from vents at the summit and at the E coast.
Information Contacts: Darwin Volcanic Ash Advisory Centre (VAAC), Bureau of Meteorology, Northern Territory Regional Office, PO Box 40050, Casuarina, NT 0811, Australia (URL: http://www.bom.gov.au/info/vaac/); Hawai'i Institute of Geophysics and Planetology (HIGP) - MODVOLC Thermal Alerts System, School of Ocean and Earth Science and Technology (SOEST), Univ. of Hawai'i, 2525 Correa Road, Honolulu, HI 96822, USA (URL: http://modis.higp.hawaii.edu/); Copernicus Browser, Copernicus Data Space Ecosystem, European Space Agency (URL: https://dataspace.copernicus.eu/browser/).
San Miguel (El Salvador) — June 2023 Cite this Report
San Miguel
El Salvador
13.434°N, 88.269°W; summit elev. 2130 m
All times are local (unless otherwise noted)
Small gas-and-ash explosions during March and May 2023
San Miguel in El Salvador is a broad, deep crater complex that has been frequently modified by eruptions recorded since the early 16th century and consists of the summit known locally as Chaparrastique. Flank eruptions have produced lava flows that extended to the N, NE, and SE during the 17-19th centuries. The most recent activity has consisted of minor ash eruptions from the summit crater. The current eruption period began in November 2022 and has been characterized by frequent phreatic explosions, gas-and-ash emissions, and sulfur dioxide plumes (BGVN 47:12). This report describes small gas-and-ash explosions during December 2022 through May 2023 based on special reports from the Ministero de Medio Ambiente y Recursos Naturales (MARN).
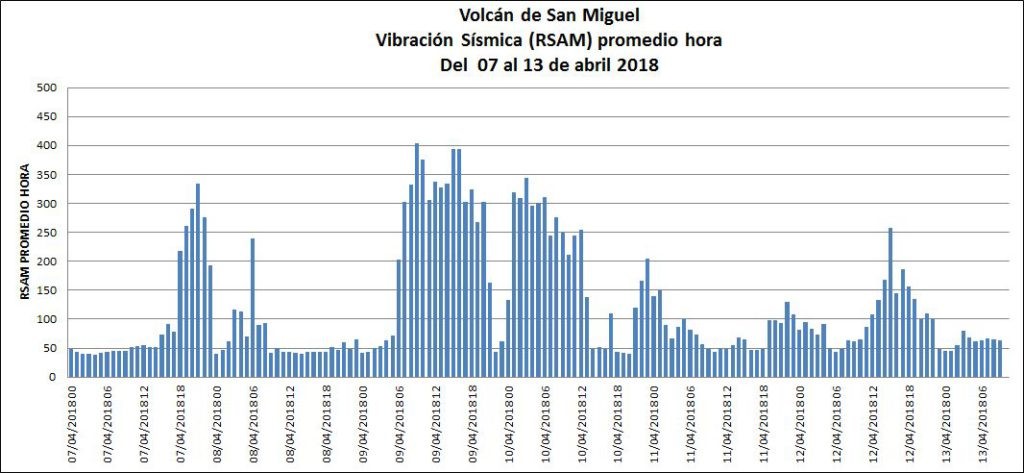
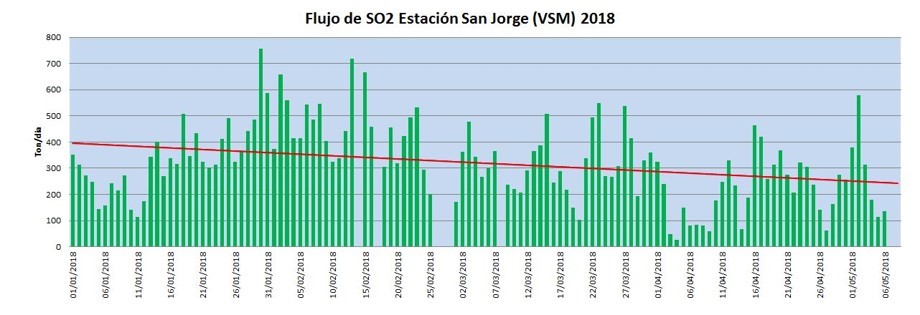
Activity has been relatively low since the last recorded explosions on 29 November 2022. Seismicity recorded by the San Miguel Volcano Station (VSM) located on the N flank at 1.7 km elevation had decreased by 7 December. Sulfur dioxide gas measurements taken with DOAS (Differential Optical Absorption Spectroscopy) mobile equipment were below typical previously recorded values: 300 tons per day (t/d). During December, small explosions were recorded by the seismic network and manifested as gas-and-steam emissions.
Gas-and-ash explosions in the crater occurred during January 2023, which were recorded by the seismic network. Sulfur dioxide values remained low, between 300-400 t/d through 10 March. At 0817 on 14 January a gas-and-ash emission was visible in webcam images, rising just above the crater rim. Some mornings during February, small gas-and-steam plumes were visible in the crater. On 7 March at 2252 MARN noted an increase in degassing from the central crater; gas emissions were constantly observed through the early morning hours on 8 March. During the early morning of 8 March through the afternoon on 9 March, 12 emissions were registered, some accompanied by ash. The last gas-and-ash emission was recorded at 1210 on 9 March; very fine ashfall was reported in El Tránsito (10 km S), La Morita (6 km W), and La Piedrita (3 km W). The smell of sulfur was reported in Piedra Azul (5 km SW). On 16 March MARN reported that gas-and-steam emissions decreased.
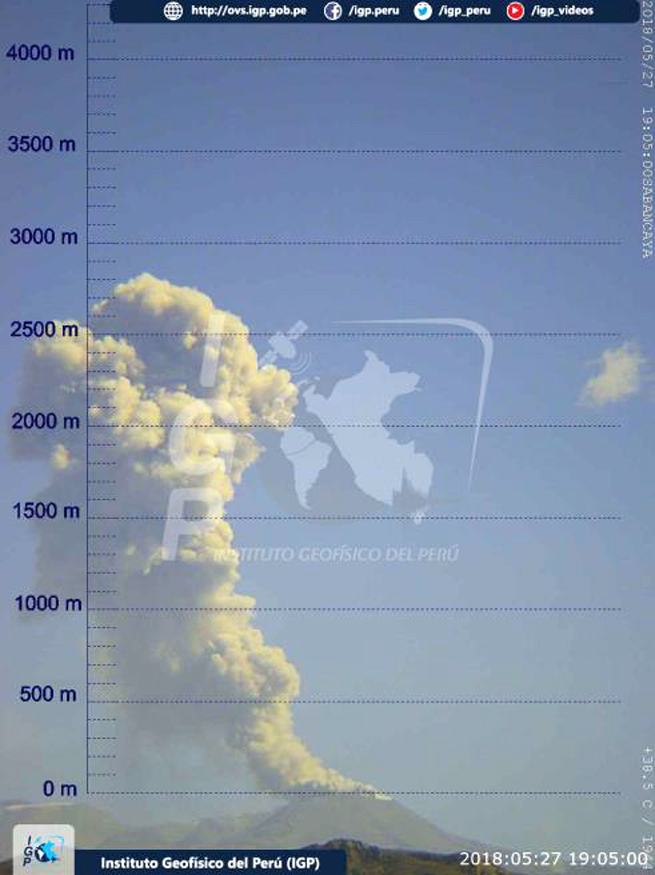
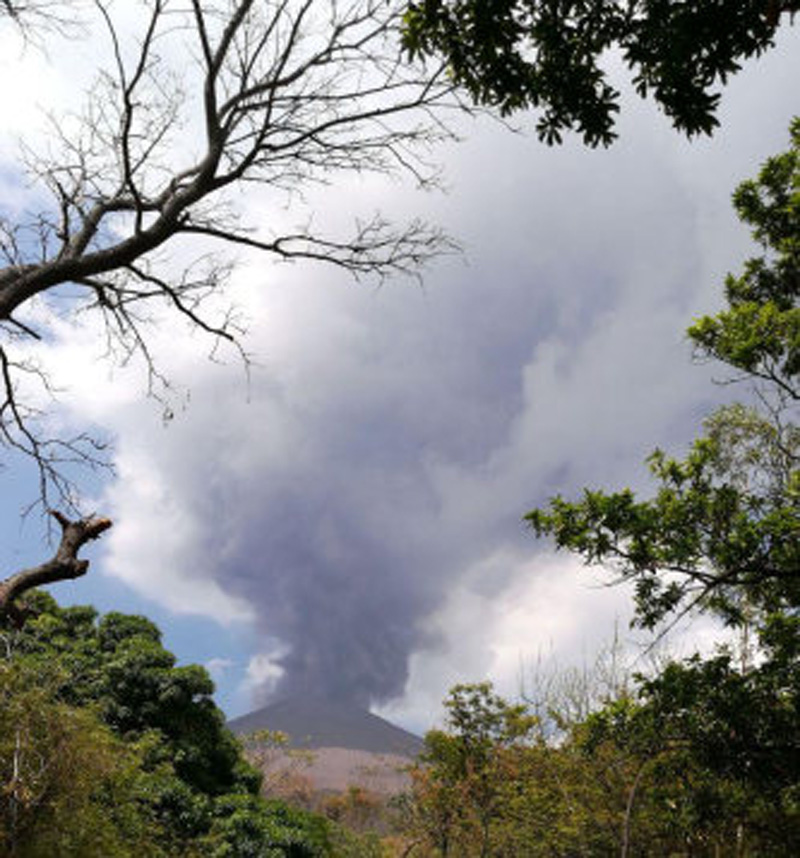
Low degassing and very low seismicity were reported during April; no explosions have been detected between 9 March and 27 May. The sulfur dioxide emissions remained between 350-400 t/d; during 13-20 April sulfur dioxide values fluctuated between 30-300 t/d. Activity remained low through most of May; on 23 May seismicity increased. An explosion was detected at 1647 on 27 May generated a gas-and-ash plume that rose 700 m high (figure 32); a decrease in seismicity and gas emissions followed. The DOAS station installed on the W flank recorded sulfur dioxide values that reached 400 t/d on 27 May; subsequent measurements showed a decrease to 268 t/d on 28 May and 100 t/d on 29 May.
Geologic Background. The symmetrical cone of San Miguel, one of the most active volcanoes in El Salvador, rises from near sea level to form one of the country's most prominent landmarks. A broad, deep, crater complex that has been frequently modified by eruptions recorded since the early 16th century caps the truncated unvegetated summit, also known locally as Chaparrastique. Flanks eruptions of the basaltic-andesitic volcano have produced many lava flows, including several during the 17th-19th centuries that extended to the N, NE, and SE. The SE-flank flows are the largest and form broad, sparsely vegetated lava fields crossed by highways and a railroad skirting the base of the volcano. Flank vent locations have migrated higher on the edifice during historical time, and the most recent activity has consisted of minor ash eruptions from the summit crater.
Information Contacts: Ministero de Medio Ambiente y Recursos Naturales (MARN), Km. 5½ Carretera a Nueva San Salvador, Avenida las Mercedes, San Salvador, El Salvador (URL: http://www.snet.gob.sv/ver/vulcanologia).
Ebeko
Russia
50.686°N, 156.014°E; summit elev. 1103 m
All times are local (unless otherwise noted)
Continued explosions, ash plumes, and ashfall during October 2022-May 2023
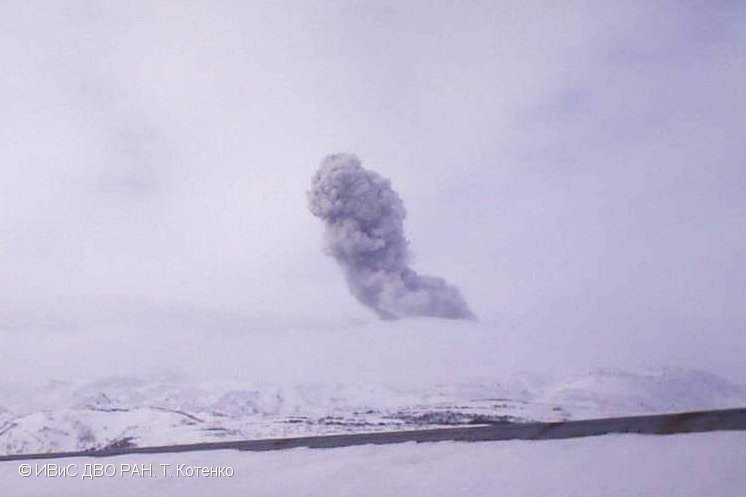
Ebeko, located on the N end of Paramushir Island in the Kuril Islands, consists of three summit craters along a SSW-NNE line at the northern end of a complex of five volcanic cones. Eruptions date back to the late 18th century and have been characterized as small-to-moderate explosions from the summit crater, accompanied by intense fumarolic activity. The current eruption period began in June 2022 and has recently consisted of frequent explosions, ash plumes, and thermal activity (BGVN 47:10). This report covers similar activity during October 2022 through May 2023, based on information from the Kamchatka Volcanic Eruptions Response Team (KVERT) and satellite data.
Activity during October consisted of explosive activity, ash plumes, and occasional thermal anomalies. Visual data by volcanologists from Severo-Kurilsk showed explosions producing ash clouds up to 2.1-3 km altitude which drifted E, N, NE, and SE during 1-8, 10, 16, and 18 October. KVERT issued several Volcano Observatory Notices for Aviation (VONA) on 7, 13-15, and 27 October 2022, stating that explosions generated ash plumes that rose to 2.3-4 km altitude and drifted 5 km E, NE, and SE. Ashfall was reported in Severo-Kurilsk (Paramushir Island, about 7 km E) on 7 and 13 October. Satellite data showed a thermal anomaly over the volcano on 15-16 October. Visual data showed ash plumes rising to 2.5-3.6 km altitude on 22, 25-29, and 31 October and moving NE due to constant explosions.
Similar activity continued during November, with explosions, ash plumes, and ashfall occurring. KVERT issued VONAs on 1-2, 4, 6-7, 9, 13, and 16 November that reported explosions and resulting ash plumes that rose to 1.7-3.6 km altitude and drifted 3-5 km SE, ESE, E, and NE. On 1 November ash plumes extended as far as 110 km SE. On 5, 8, 12, and 24-25 November explosions and ash plumes rose to 2-3.1 km altitude and drifted N and E. Ashfall was observed in Severo-Kurilsk on 7 and 16 November. A thermal anomaly was visible during 1-4, 16, and 20 November. Explosions during 26 November rose as high as 2.7 km altitude and drifted NE (figure 45).
Explosions and ash plumes continued to occur in December. During 1-2 and 4 December volcanologists from Severo-Kurilsk observed explosions that sent ash to 1.9-2.5 km altitude and drifted NE and SE (figure 46). VONAs were issued on 5, 9, and 16 December reporting that explosions generated ash plumes rising to 1.9 km, 2.6 km, and 2.4 km altitude and drifted 5 km SE, E, and NE, respectively. A thermal anomaly was visible in satellite imagery on 16 December. On 18 and 27-28 December explosions produced ash plumes that rose to 2.5 km altitude and drifted NE and SE. On 31 December an ash plume rose to 2 km altitude and drifted NE.
Explosions continued during January 2023, based on visual observations by volcanologists from Severo-Kurilsk. During 1-7 January explosions generated ash plumes that rose to 4 km altitude and drifted NE, E, W, and SE. According to VONAs issued by KVERT on 2, 4, 10, and 23 January, explosions produced ash plumes that rose to 2-4 km altitude and drifted 5 km N, NE, E, and ENE; the ash plume that rose to 4 km altitude occurred on 10 January (figure 47). Satellite data showed a thermal anomaly during 3-4, 10, 13, 16, 21, 22, and 31 January. KVERT reported that an ash cloud on 4 January moved 12 km NE. On 6 and 9-11 January explosions sent ash plumes to 4.5 km altitude and drifted W and ESE. On 13 January an ash plume rose to 3 km altitude and drifted SE. During 20-24 January ash plumes from explosions rose to 3.7 km altitude and drifted SE, N, and NE. On 21 January the ash plume drifted as far as 40 km NE. During 28-29 and 31 January and 1 February ash plumes rose to 4 km altitude and drifted NE.
During February, explosions, ash plumes, and ashfall were reported. During 1, 4-5 and 7-8 February explosions generated ash plumes that rose to 4.5 km altitude and drifted E and NE; ashfall was observed on 5 and 8 February. On 6 February an explosion produced an ash plume that rose to 3 km altitude and drifted 7 km E, causing ashfall in Severo-Kurilsk. A thermal anomaly was visible in satellite data on 8, 9, 13, and 21 February. Explosions on 9 and 12-13 February produced ash plumes that rose to 4 km altitude and drifted E and NE; the ash cloud on 12 February extended as far as 45 km E. On 22 February explosions sent ash to 3 km altitude that drifted E. During 24 and 26-27 February ash plumes rose to 4 km altitude and drifted E. On 28 February an explosion sent ash to 2.5-3 km altitude and drifted 5 km E; ashfall was observed in Severo-Kurilsk.
Activity continued during March; visual observations showed that explosions generated ash plumes that rose to 3.6 km altitude on 3, 5-7, and 9-12 March and drifted E, NE, and NW. Thermal anomalies were visible on 10, 13, and 29-30 March in satellite imagery. On 18, 21-23, 26, and 29-30 March explosions produced ash plumes that rose to 2.8 km altitude and drifted NE and E; the ash plumes during 22-23 March extended up to 76 km E. A VONA issued on 21 March reported an explosion that produced an ash plume that rose to 2.8 km altitude and drifted 5 km E. Another VONA issued on 23 March reported that satellite data showed an ash plume rising to 3 km altitude and drifted 14 km E.
Explosions during April continued to generate ash plumes. On 1 and 4 April an ash plume rose to 2.8-3.5 km altitude and drifted SE and NE. A thermal anomaly was visible in satellite imagery during 1-6 April. Satellite data showed ash plumes and clouds rising to 2-3 km altitude and drifting up to 12 km SW and E on 3 and 6 April (figure 48). KVERT issued VONAs on 3, 5, 14, 16 April describing explosions that produced ash plumes rising to 3 km, 3.5 km, 3.5 km, and 3 km altitude and drifting 5 km S, 5 km NE and SE, 72 km NNE, and 5 km NE, respectively. According to satellite data, the resulting ash cloud from the explosion on 14 April was 25 x 7 km in size and drifted 72-104 km NNE during 14-15 April. According to visual data by volcanologists from Severo-Kurilsk explosions sent ash up to 3.5 km altitude that drifted NE and E during 15-16, 22, 25-26, and 29 April.
The explosive eruption continued during May. Explosions during 3-4, 6-7, and 9-10 May generated ash plumes that rose to 4 km altitude and drifted SW and E. Satellite data showed a thermal anomaly on 3, 9, 13-14, and 24 May. During 12-16, 23-25, and 27-28 May ash plumes rose to 3.5 km altitude and drifted in different directions due to explosions. Two VONA notices were issued on 16 and 25 May, describing explosions that generated ash plumes rising to 3 km and 3.5 km altitude, respectively and extending 5 km E. The ash cloud on 25 May drifted 75 km SE.
Thermal activity in the summit crater, occasionally accompanied by ash plumes and ash deposits on the SE and E flanks due to frequent explosions, were visible in infrared and true color satellite images (figure 49).
Geologic Background. The flat-topped summit of the central cone of Ebeko volcano, one of the most active in the Kuril Islands, occupies the northern end of Paramushir Island. Three summit craters located along a SSW-NNE line form Ebeko volcano proper, at the northern end of a complex of five volcanic cones. Blocky lava flows extend west from Ebeko and SE from the neighboring Nezametnyi cone. The eastern part of the southern crater contains strong solfataras and a large boiling spring. The central crater is filled by a lake about 20 m deep whose shores are lined with steaming solfataras; the northern crater lies across a narrow, low barrier from the central crater and contains a small, cold crescentic lake. Historical activity, recorded since the late-18th century, has been restricted to small-to-moderate explosive eruptions from the summit craters. Intense fumarolic activity occurs in the summit craters, on the outer flanks of the cone, and in lateral explosion craters.
Information Contacts: Kamchatka Volcanic Eruptions Response Team (KVERT), Far Eastern Branch, Russian Academy of Sciences, 9 Piip Blvd., Petropavlovsk-Kamchatsky, 683006, Russia (URL: http://www.kscnet.ru/ivs/kvert/); MIROVA (Middle InfraRed Observation of Volcanic Activity), a collaborative project between the Universities of Turin and Florence (Italy) supported by the Centre for Volcanic Risk of the Italian Civil Protection Department (URL: http://www.mirovaweb.it/); Copernicus Browser, Copernicus Data Space Ecosystem, European Space Agency (URL: https://dataspace.copernicus.eu/browser/).
Home Reef
Tonga
18.992°S, 174.775°W; summit elev. -10 m
All times are local (unless otherwise noted)
Discolored plumes continued during November 2022-April 2023
Home Reef is a submarine volcano located in the central Tonga islands between Lateiki (Metis Shoal) and Late Island. The first recorded eruption occurred in the mid-19th century, when an ephemeral island formed. An eruption in 1984 produced a 12-km-high eruption plume, a large volume of floating pumice, and an ephemeral island 500 x 1,500 m wide, with cliffs 30-50 m high that enclosed a water-filled crater. Another island-forming eruption in 2006 produced widespread pumice rafts that drifted as far as Australia; by 2008 the island had eroded below sea level. The previous eruption occurred during October 2022 and was characterized by a new island-forming eruption, lava effusion, ash plumes, discolored water, and gas-and-steam plumes (BGVN 47:11). This report covers discolored water plumes during November 2022 through April 2023 using satellite data.
Discolored plumes continued during the reporting period and were observed in true color satellite images on clear weather days. Satellite images show light green-yellow discolored water extending W on 8 and 28 November 2022 (figure 31), and SW on 18 November. Light green-yellow plumes extended W on 3 December, S on 13 December, SW on 18 December, and W and S on 23 December (figure 31). On 12 January 2023 discolored green-yellow plumes extended to the NE, E, SE, and N. The plume moved SE on 17 January and NW on 22 January. Faint discolored water in February was visible moving NE on 1 February. A discolored plume extended NW on 8 and 28 March and NW on 13 March (figure 31). During April, clear weather showed green-blue discolored plumes moving S on 2 April, W on 7 April, and NE and S on 12 April. A strong green-yellow discolored plume extended E and NE on 22 April for several kilometers (figure 31).
Geologic Background. Home Reef, a submarine volcano midway between Metis Shoal and Late Island in the central Tonga islands, was first reported active in the mid-19th century, when an ephemeral island formed. An eruption in 1984 produced a 12-km-high eruption plume, large amounts of floating pumice, and an ephemeral 500 x 1,500 m island, with cliffs 30-50 m high that enclosed a water-filled crater. In 2006 an island-forming eruption produced widespread dacitic pumice rafts that drifted as far as Australia. Another island was built during a September-October 2022 eruption.
Information Contacts: Copernicus Browser, Copernicus Data Space Ecosystem, European Space Agency (URL: https://dataspace.copernicus.eu/browser/).
Semisopochnoi (United States) — June 2023 Cite this Report
Semisopochnoi
United States
51.93°N, 179.58°E; summit elev. 1221 m
All times are local (unless otherwise noted)
Occasional explosions, ash deposits, and gas-and-steam plumes during December 2022-May 2023
Semisopochnoi is located in the western Aleutians, is 20-km-wide at sea level, and contains an 8-km-wide caldera. The three-peaked Mount Young (formerly Cerberus) was constructed within the caldera during the Holocene. Each of these peaks contains a summit crater; the lava flows on the N flank appear younger than those on the S side. The current eruption period began in early February 2021 and has more recently consisted of intermittent explosions and ash emissions (BGVN 47:12). This report updates activity during December 2022 through May 2023 using daily, weekly, and special reports from the Alaska Volcano Observatory (AVO). AVO monitors the volcano using local seismic and infrasound sensors, satellite data, web cameras, and remote infrasound and lightning networks.
Activity during most of December 2022 was relatively quiet; according to AVO no eruptive or explosive activity was observed since 7 November 2022. Intermittent tremor and occasional small earthquakes were observed in geophysical data. Continuous gas-and-steam emissions were observed from the N crater of Mount Young in webcam images on clear weather days (figure 25). On 24 December, there was a slight increase in earthquake activity and several small possible explosion signals were detected in infrasound data. Eruptive activity resumed on 27 December at the N crater of Mount Young; AVO issued a Volcano Activity Notice (VAN) that reported minor ash deposits on the flanks of Mount Young that extended as far as 1 km from the vent, according to webcam images taken during 27-28 December (figure 26). No ash plumes were observed in webcam or satellite imagery, but a persistent gas-and-steam plume that might have contained some ash rose to 1.5 km altitude. As a result, AVO raised the Aviation Color Code (ACC) to Orange (the second highest level on a four-color scale) and the Volcano Alert Level (VAL) to Watch (the second highest level on a four-level scale). Possible explosions were detected during 21 December 2022 through 1 January 2023 and seismic tremor was recorded during 30-31 December.
During January 2023 eruptive activity continued at the active N crater of Mount Young. Minor ash deposits were observed on the flanks, extending about 2 km SSW, based on webcam images from 1 and 3 January. A possible explosion occurred during 1-2 January based on elevated seismicity recorded on local seismometers and an infrasound signal recorded minutes later by an array at Adak. Though no ash plumes were observed in webcam or satellite imagery, a persistent gas-and-steam plume rose to 1.5 km altitude that might have carried minor traces of ash. Ash deposits were accompanied by periods of elevated seismicity and infrasound signals from the local geophysical network, which AVO reported were likely due to weak explosive activity. Low-level explosive activity was also detected during 2-3 January, with minor gas-and-steam emissions and a new ash deposit that was visible in webcam images. Low-level explosive activity was detected in geophysical data during 4-5 January, with elevated seismicity and infrasound signals observed on local stations. Volcanic tremor was detected during 7-9 January and very weak explosive activity was detected in seismic and infrasound data on 9 January. Weak seismic and infrasound signals were recorded on 17 January, which indicated minor explosive activity, but no ash emissions were observed in clear webcam images; a gas-and-steam plume continued to rise to 1.5 km altitude. During 29-30 January, ash deposits near the summit were observed on fresh snow, according to webcam images.
The active N cone at Mount Young continued to produce a gas-and-steam plume during February, but no ash emissions or explosive events were detected. Seismicity remained elevated with faint tremor during early February. Gas-and-steam emissions from the N crater were observed in clear webcam images on 11-13 and 16 February; no explosive activity was detected in seismic, infrasound, or satellite data. Seismicity has also decreased, with no significant seismic tremor observed since 25 January. Therefore, the ACC was lowered to Yellow (the second lowest level on a four-color scale) and the VAL was lowered to Advisory (the second lowest level on a four-color scale) on 22 February.
Gas-and-steam emissions persisted during March from the N cone of Mount Young, based on clear webcam images. A few brief episodes of weak tremor were detected in seismic data, although seismicity decreased over the month. A gas-and-steam plume detected in satellite data extended 150 km on 18 March. Low-level ash emissions from the N cone at Mount Young were observed in several webcam images during 18-19 March, in addition to small explosions and volcanic tremor. The ACC was raised to Orange and the VAL increased to Watch on 19 March. A small explosion was detected in seismic and infrasound data on 21 March.
Low-level unrest continued during April, although cloudy weather often obscured views of the summit; periods of seismic tremor and local earthquakes were recorded. During 3-4 April a gas-and-steam plume was visible traveling more than 200 km overnight; no ash was evident in the plume, according to AVO. A gas-and-steam plume was observed during 4-6 April that extended 400 km but did not seem to contain ash. Small explosions were detected in seismic and infrasound data on 5 April. Occasional clear webcam images showed continuing gas-and-steam emissions rose from Mount Young, but no ash deposits were observed on the snow. On 19 April small explosions and tremor were detected in seismic and infrasound data. A period of seismic tremor was detected during 22-25 April, with possible weak explosions on 25 April. Ash deposits were visible near the crater rim, but it was unclear if these deposits were recent or due to older deposits.
Occasional small earthquakes were recorded during May, but there were no signs of explosive activity seen in geophysical data. Gas-and-steam emissions continued from the N crater of Mount Young, based on webcam images, and seismicity remained slightly elevated. A new, light ash deposit was visible during the morning of 5 May on fresh snow on the NW flank of Mount Young. During 10 May periods of volcanic tremor were observed. The ACC was lowered to Yellow and the VAL to Advisory on 17 May due to no additional evidence of activity.
Geologic Background. Semisopochnoi, the largest subaerial volcano of the western Aleutians, is 20 km wide at sea level and contains an 8-km-wide caldera. It formed as a result of collapse of a low-angle, dominantly basaltic volcano following the eruption of a large volume of dacitic pumice. The high point of the island is Anvil Peak, a double-peaked late-Pleistocene cone that forms much of the island's northern part. The three-peaked Mount Cerberus (renamed Mount Young in 2023) was constructed within the caldera during the Holocene. Each of the peaks contains a summit crater; lava flows on the N flank appear younger than those on the south side. Other post-caldera volcanoes include the symmetrical Sugarloaf Peak SSE of the caldera and Lakeshore Cone, a small cinder cone at the edge of Fenner Lake in the NE part of the caldera. Most documented eruptions have originated from Young, although Coats (1950) considered that both Sugarloaf and Lakeshore Cone could have been recently active.
Information Contacts: Alaska Volcano Observatory (AVO), a cooperative program of a) U.S. Geological Survey, 4200 University Drive, Anchorage, AK 99508-4667 USA (URL: https://avo.alaska.edu/), b) Geophysical Institute, University of Alaska, PO Box 757320, Fairbanks, AK 99775-7320, USA, and c) Alaska Division of Geological & Geophysical Surveys, 794 University Ave., Suite 200, Fairbanks, AK 99709, USA (URL: http://dggs.alaska.gov/).
Ambae
Vanuatu
15.389°S, 167.835°E; summit elev. 1496 m
All times are local (unless otherwise noted)
New lava flow, ash plumes, and sulfur dioxide plumes during February-May 2023
Ambae, also known as Aoba, is a large basaltic shield volcano in Vanuatu. A broad pyroclastic cone containing three crater lakes (Manaro Ngoru, Voui, and Manaro Lakua) is located at the summit within the youngest of at least two nested calderas. Periodic phreatic and pyroclastic explosions have been reported since the 16th century. A large eruption more than 400 years ago resulted in a volcanic cone within the summit crater that is now filled by Lake Voui; the similarly sized Lake Manaro fills the western third of the caldera. The previous eruption ended in August 2022 that was characterized by gas-and-steam and ash emissions and explosions of wet tephra (BGVN 47:10). This report covers a new eruption during February through May 2023 that consisted of a new lava flow, ash plumes, and sulfur dioxide emissions, using information from the Vanuatu Meteorology and Geo-Hazards Department (VMGD) and satellite data.
During the reporting period, the Alert Level remained at a 2 (on a scale of 0-5), which has been in place since December 2021. Activity during October 2022 through March 2023 remained relatively low and mostly consisted of gas-and-steam emissions in Lake Voui. VMGD reported that at 1300 on 15 November a satellite image captured a strong amount of sulfur dioxide rising above the volcano (figure 99), and that seismicity slightly increased. The southern and northern part of the island reported a strong sulfur dioxide smell and heard explosions. On 20 February 2023 a gas-and-ash plume rose 1.3 km above the summit and drifted SSW, according to a webcam image (figure 100). Gas-and-steam and possibly ash emissions continued on 23 February and volcanic earthquakes were recorded by the seismic network.
During April, volcanic earthquakes and gas-and-steam and ash emissions were reported from the cone in Lake Voui. VMGD reported that activity increased during 5-7 April; high gas-and-steam and ash plumes were visible, accompanied by nighttime incandescence. According to a Wellington VAAC report, a low-level ash plume rose as high as 2.5 km above the summit and drifted W and SW on 5 April, based on satellite imagery. Reports in Saratamata stated that a dark ash plume drifted to the WSW, but no loud explosion was heard. Webcam images from 2100 showed incandescence above the crater and reflected in the clouds. According to an aerial survey, field observations, and satellite data, water was no longer present in the lake. A lava flow was reported effusing from the vent and traveling N into the dry Lake Voui, which lasted three days. The next morning at 0745 on 6 April a gas-and-steam and ash plume rose 5.4 km above the summit and drifted ESE, based on information from VMGD (figure 101). The Wellington VAAC also reported that light ashfall was observed on the island. Intermittent gas-and-steam and ash emissions were visible on 7 April, some of which rose to an estimated 3 km above the summit and drifted E. Webcam images during 0107-0730 on 7 April showed continuing ash emissions. A gas-and-steam and ash plume rose 695 m above the summit crater at 0730 on 19 April and drifted ESE, based on a webcam image (figure 102).
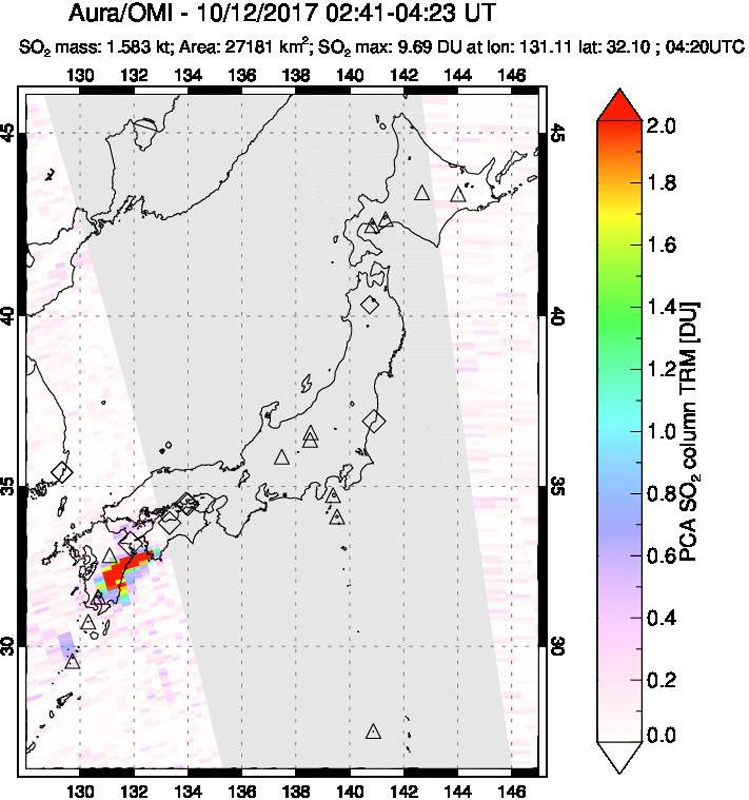
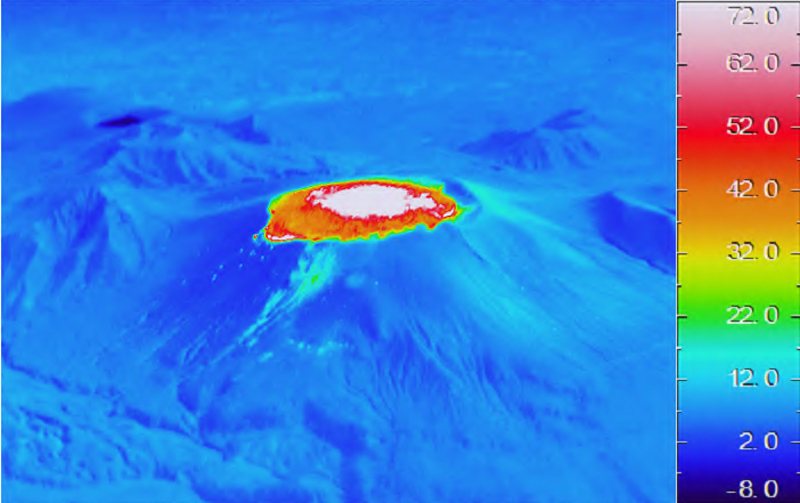
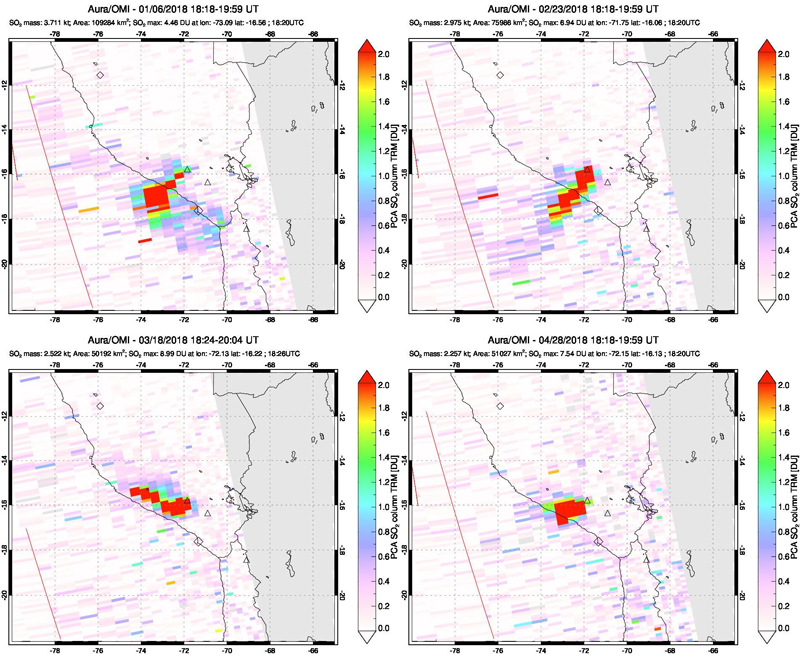
According to visual and infrared satellite data, water was visible in Lake Voui as late as 24 March 2023 (figure 103). The vent in the caldera showed a gas-and-steam plume drifted SE. On 3 April thermal activity was first detected, accompanied by a gas-and-ash plume that drifted W (figure 103). The lava flow moved N within the dry lake and was shown cooling by 8 April. By 23 April much of the water in the lake had returned. Occasional sulfur dioxide plumes were detected by the TROPOMI instrument on the Sentinel-5P satellite that exceeded 2 Dobson Units (DU) and drifted in different directions (figure 104).
Geologic Background. The island of Ambae, also known as Aoba, is a massive 2,500 km3 basaltic shield that is the most voluminous volcano of the New Hebrides archipelago. A pronounced NE-SW-trending rift zone with numerous scoria cones gives the 16 x 38 km island an elongated form. A broad pyroclastic cone containing three crater lakes (Manaro Ngoru, Voui, and Manaro Lakua) is located at the summit within the youngest of at least two nested calderas, the largest of which is 6 km in diameter. That large central edifice is also called Manaro Voui or Lombenben volcano. Post-caldera explosive eruptions formed the summit craters about 360 years ago. A tuff cone was constructed within Lake Voui (or Vui) about 60 years later. The latest known flank eruption, about 300 years ago, destroyed the population of the Nduindui area near the western coast.
Information Contacts: Geo-Hazards Division, Vanuatu Meteorology and Geo-Hazards Department (VMGD), Ministry of Climate Change Adaptation, Meteorology, Geo-Hazards, Energy, Environment and Disaster Management, Private Mail Bag 9054, Lini Highway, Port Vila, Vanuatu (URL: http://www.vmgd.gov.vu/, https://www.facebook.com/VanuatuGeohazardsObservatory/); Wellington Volcanic Ash Advisory Centre (VAAC), Meteorological Service of New Zealand Ltd (MetService), PO Box 722, Wellington, New Zealand (URL: http://www.metservice.com/vaac/, http://www.ssd.noaa.gov/VAAC/OTH/NZ/messages.html); MIROVA (Middle InfraRed Observation of Volcanic Activity), a collaborative project between the Universities of Turin and Florence (Italy) supported by the Centre for Volcanic Risk of the Italian Civil Protection Department (URL: http://www.mirovaweb.it/); Global Sulfur Dioxide Monitoring Page, Atmospheric Chemistry and Dynamics Laboratory, NASA Goddard Space Flight Center (NASA/GSFC), 8800 Greenbelt Road, Goddard, Maryland, USA (URL: https://so2.gsfc.nasa.gov/); Copernicus Browser, Copernicus Data Space Ecosystem, European Space Agency (URL: https://dataspace.copernicus.eu/browser/).
Search Bulletin Archive by Publication Date
Select a month and year from the drop-downs and click "Show Issue" to have that issue displayed in this tab.
The default month and year is the latest issue available.
Bulletin of the Global Volcanism Network - Volume 43, Number 06 (June 2018)
Managing Editor: Edward Venzke
Chillan, Nevados de (Chile)
Hundreds of ash-bearing explosions; dome appears in crater in mid-December 2017
Ebeko (Russia)
Ash explosions remained frequent through May 2018, with plumes typically rising more than 1 km
Kirishimayama (Japan)
Ash plumes and lava flows at Shinmoedake starting in March 2018; explosion at Iwo-yama
Langila (Papua New Guinea)
Gradual decline in activity after July 2017, but continuing through May 2018
Marapi (Indonesia)
Two explosions during April-May 2018 cause ashfall to the southeast
Masaya (Nicaragua)
Lava lake persists during July 2017-April 2018
Nyiragongo (DR Congo)
Thermal anomalies show that lava lake remains active through May 2018
Sabancaya (Peru)
Strong, sporadic explosions with ash plumes throughout December 2017-May 2018
San Cristobal (Nicaragua)
Moderate explosion on 22 April 2018
San Miguel (El Salvador)
Intermittent small ash emissions between 14 January and 30 May 2018
Nevados de Chillan (Chile) — June 2018 Cite this Report
Nevados de Chillan
Chile
36.868°S, 71.378°W; summit elev. 3180 m
All times are local (unless otherwise noted)
Hundreds of ash-bearing explosions; dome appears in crater in mid-December 2017
Nevados de Chillán is a complex of late-Pleistocene to Holocene stratovolcanoes constructed in the Chilean Central Andes. The Nuevo and Arrau craters are adjacent vents on the NW flank of the cone of the large stratovolcano referred to as Volcán Viejo. An eruption started with a phreatic explosion and ash emission on 8 January 2016 from a new crater on the E flank of Nuevo. Explosions continued through September 2017 with ash plumes rising several kilometers and Strombolian activity sending ejecta hundreds of meters (BGVN 42:10). This report covers continuing activity from September 2017-May 2018. Information for this report is provided by Chile's Servicio Nacional de Geología y Minería (SERNAGEOMIN)-Observatorio Volcanológico de Los Andes del Sur (OVDAS), Oficina Nacional de Emergencia-Ministerio del Interior (ONEMI), and by the Buenos Aires Volcanic Ash Advisory Center (VAAC).
About 150 ash-bearing explosions were recorded during September and October 2017, with plumes rising almost 2 km above the summit. Activity decreased during the second half of October, and no ash plumes were recorded during November. A significant increase in activity in early December led to over 200 explosions with ash emissions. An overflight on 21 December 2017 produced images of a fissure at the bottom of the new crater. The presence of a growing lava dome in the crater was confirmed in early January 2018. Frequent Strombolian explosions produced nighttime incandescence at the summit and down the flanks. Hundreds of ash-bearing explosions occurred during February 2018; the largest plume rose 2.5 km above the summit, and many smaller pulses produced ash and steam that rose 1.5 km. Sporadic incandescence at night and continued explosions of magmatic gases were typical during March 2018. A large explosion on 31 March coincided with the first appearance of a low-level MODIS thermal anomaly in the MIROVA data, and incandescence from explosions at night indicated that the dome continued to grow during April and May. SERNAGEOMIN reported that the top of the lava dome was visible from the E flank for the first time at the end of May 2018.
Activity during September-December 2017. SERNAGEOMIN reported 117 ash-bearing explosions between 16 and 30 September 2017 (figure 17). The one that released the most energy occurred on 19 September. The plumes of steam and ash rose up to 1,800 m above the crater. The Buenos Aires VAAC observed a narrow plume of ash in satellite imagery moving N at 3.9 km altitude and dissipating rapidly on 15 September, and a similar plume moving SE near the summit on 26 September 2017.
During the first two weeks of October 2017 there were 30 ash-bearing explosions recorded. The Buenos Aires VAAC reported small sporadic puffs of ash on 6 October 2017 that were visible in the webcam (figure 18), but not in satellite data, and a similar dense but short-lived plume on 14 October. SERNAGEOMIN reported a series of pulsating low-energy explosions visible in the webcam that drifted SW on 11 and 12 October 2017, and rose no more than 1 km above the summit.. Only two ash-bearing explosions were recorded during the second half of the month. The volcano was much quieter during November; plumes of steam were observed rising only 100 m above the summit throughout the month, with no ash-bearing plumes reported.
A significant increase in activity in early December 2017 resulted in 245 explosions associated with ash emissions during the first two weeks, some rising as high as 3,000 m above the summit. The Buenos Aires VAAC reported a puff of ash on 1 December that rose to 3.7 km altitude and drifted S, dissipating rapidly. The next day another plume rose slightly higher, to 4.3 km. A dense emission on 4 December rose to 4.9 km and drifted SE before dissipating in a few hours and was not visible in satellite data. On 11 and 14 December, short-lived emissions rose to 4.3 km (figure 19). A yellow cloud of sulfur formed on 11 December within 300 m of the active crater. The webcams also recorded sporadic nighttime incandescence during increased explosions in the early morning of 14 December. Continuous steam emissions with pulses of minor ash were first noted on 16 December; they were visible in satellite imagery the next day at 3.9-4.3 km altitude drifting NE, and by 18 December, consisted only of water vapor.
In a special report released on 19 December, OVDAS-SERNAGEOMIN reported an increase in surface activity over the previous three days, recording minor explosions averaging four per hour, and seismic pulses lasting 5-10 minutes; they also noted harmonic tremor with the increase in explosion frequency. A detailed review of images taken during an overflight on 21 December revealed a fissure 30-40 m long trending NW at the bottom of the crater. Incandescence at night was regularly observed after 20 December (figure 20), and ash emissions rose to 3,000 m above the summit during the second half of the month.
Activity during January-April 2018. SERNAGEOMIN volcanologists identified a growing lava dome within the new crater during two overflights on 9 and 12 January 2018 (figures 21); it was emerging from the fissure first identified on 21 December. During the first two weeks of January SERNAGEOMIN reported 1,027 pulsating explosions associated primarily with magmatic gases, and very little ash that rose up to 1,000 m above the summit. Confirmed ash emissions were reported on 11 January at 4.3 km altitude faintly visible moving SE in satellite imagery, according to the Buenos Aires VAAC. Nighttime incandescence from the growing dome was periodically observed (figure 22). Based on the overflight data and satellite imagery, they calculated a growth rate for the dome of 1,360 m3 per day. They estimated the size at 37,000 m3 by mid-month.
Overflights on 23 and 31 January measured temperatures of 305-480°C over the surface of the dome, with the highest values at the fissure. The growth rate calculated after these overflights was 2,540 m3 per day. The webcam revealed emissions of ash and water vapor during the second half of the month that rose less than 1,000 m above the summit crater.
An explosion on 2 February 2018 sent an ash plume to 2,500 m above the summit (figure 23). Vibrations from the explosion were reported in Las Trancas (10 km) and at the Gran Hotel Termas de Chillan (5 km). SERNAGEOMIN began referring to the active crater as Nicanor, and the dome was named Gil-Cruz. During the first two weeks of February, 840 explosions associated with plumes of magmatic gases were reported. The plumes generally rose as high as 1,500 m above the summit and were often accompanied by incandescence at night. Two overflights on 7 and 14 February recorded temperatures of 500 and 550°C. SERNAGEOMIN determined a dome growth rate of 1,389 m3 per day, and a total volume of 82,500 m3 by mid-month. At least four explosions on 14 February were characterized by two simultaneous plumes, one of white steam and the other darker with a higher ash content according to SERNAGEOMIN. The highest plume that day reached 1,200 m above the summit crater. The Buenos Aires VAAC also reported a small pulse of ash on 14 February that rose to 4.6 km altitude and drifted SE. The dome continued to grow slowly during the rest of February, with a small increase in size noted during a 22 February flyover. Plumes of mostly water vapor with minor ash rose a maximum of 1,080 m above the summit during the hundreds of small explosions that took place.
Sporadic incandescence at night and continued explosions of magmatic gases were typical during March 2018, with plume heights reaching 2,000 m over the Nicanor crater. During an overflight on 11 March, a temperature of 330°C was measured around the Gil-Cruz dome, which had grown to a volume of about 100,000 m3 but still remained below the crater rim. Morphological changes in the still-slowly growing dome included fracture lines and unstable large vertical blocks. A significant decrease in seismic energy was noted beginning on 24 March that ended when two larger explosions occurred on 30 and 31 March (figure 24).
During an overflight on 3 April 2018, scientists observed energetic pulses of steam and minor ash from the central NW-SE trending fissure inside the crater. They noted that lapilli from explosions had been ejected as far as 1 km from the fissure, and that the Gil-Cruz dome had increased in volume since 11 March; they also observed an area of subsidence on the top of the growing dome (figure 25). The dome was expanding toward the E side of the crater, and the top of the dome rose above the crater rim. They measured a maximum temperature of 670°C on the surface of the dome. The decrease in daily seismicity, the larger explosions of the previous days, and the increased size of the dome with greater risk of collapse, pyroclastic flows, and lahars, all led SERNAGEOMIN to raise the alert level at Chillan to Orange on 5 April 2018.
The Buenos Aires VAAC reported continuous emissions of steam and gas with minor ash along with a small pulse of ash on 2 April 2018. Low-altitude plumes of mostly water vapor were common throughout April 2018. Incandescence from explosions was visible on clear nights during the month, and ejecta rose as high as 250 m above the crater and was scattered around the crater rim. Seismicity remained constant at moderate levels related to the repeated explosions and the growth of the dome. A faint ash plume could be seen in visible satellite imagery on 18 April at 3.7 km altitude drifting E.
Observations reported on 1 May 2018 from the previous flyover indicated that the rate of growth of the dome had slowed to about 690 m3 per day, and the estimated volume had grown to about 150,000 m3. Activity remained at similar levels throughout May 2018. Seismic instruments recorded long-period seismicity and tremor episodes similar to previous months that corresponded with surface explosions and the extrusion of the lava dome. Seismic energy levels were moderate but fluctuated at times. Plumes of predominantly water vapor with minor gas rose a few hundred meters above the summit drifting generally S or SE before dissipating. Incandescence was often observed on clear nights, accompanied by ejection of incandescent blocks that were observed generally 100 to 150 m above the active crater. A larger explosive event took place on 7 May. Occasional plumes with minor ash were reported on 11 May. SERNAGEOMIN reported on 24 May 2018 that the top of the lava dome was visible from the E flank.
Geologic Background. The compound volcano of Nevados de Chillán is one of the most active of the Central Andes. Three late-Pleistocene to Holocene stratovolcanoes were constructed along a NNW-SSE line within three nested Pleistocene calderas, which produced ignimbrite sheets extending more than 100 km into the Central Depression of Chile. The dominantly andesitic Cerro Blanco (Volcán Nevado) stratovolcano is located at the NW end of the massif. Volcán Viejo (Volcán Chillán), which was the main active vent during the 17th-19th centuries, occupies the SE end. The Volcán Nuevo lava-dome complex formed during 1906-1945 on the NW flank of Viejo. The Volcán Arrau dome complex was then constructed on the SE side of Volcán Nuevo between 1973 and 1986, and eventually exceeded its height. Smaller domes or cones are present in the 5-km valley between the two major edifices.
Information Contacts: Servicio Nacional de Geología y Minería, (SERNAGEOMIN), Observatorio Volcanológico de Los Andes del Sur (OVDAS), Avda Sta María No. 0104, Santiago, Chile (URL: http://www.sernageomin.cl/); Oficina Nacional de Emergencia - Ministerio del Interior (ONEMI), Beaucheff 1637/1671, Santiago, Chile (URL: http://www.onemi.cl/); Buenos Aires Volcanic Ash Advisory Center (VAAC), Servicio Meteorológico Nacional-Fuerza Aérea Argentina, 25 de mayo 658, Buenos Aires, Argentina (URL: http://www.smn.gov.ar/vaac/buenosaires/inicio.php); MIROVA (Middle InfraRed Observation of Volcanic Activity), a collaborative project between the Universities of Turin and Florence (Italy) supported by the Centre for Volcanic Risk of the Italian Civil Protection Department (URL: http://www.mirovaweb.it/).
Ebeko
Russia
50.686°N, 156.014°E; summit elev. 1103 m
All times are local (unless otherwise noted)
Ash explosions remained frequent through May 2018, with plumes typically rising more than 1 km
The most recent eruption at Ebeko, a remote volcano in the Kuril Islands, began in October 2016 (BGVN 42:08) with explosive eruptions accompanied by ashfall. Frequent ash explosions were observed through November 2017 and the eruption remained ongoing at that time (BGVN 43:03). Activity consisting of explosive eruptions, ash plumes, and ashfalls continued during December 2017 through May 2018 (table 6). Eruptions were observed by residents in Severo-Kurilsk (about 7 km E), by volcanologists, and based on satellite imagery. The Kamchatkan Volcanic Eruption Response Team (KVERT) is responsible for monitoring Ebeko, and is the primary source of information. The Aviation Color Code (ACC) remained at Orange throughout this reporting period. This color is the second highest level of the four color scale.
Table 6. Summary of activity at Ebeko volcano from December 2017 to May 2018. Aviation Color Code (ACC) is a 4-color scale. Data courtesy of KVERT
| Date |
Plume Altitude |
Plume Distance |
Plume Direction |
Other observations |
| 1-4 and 7 Dec 2017 |
2 km |
-- |
-- |
ACC at Orange. Ashfall reported in Severo-Kurilisk. Explosions on 2-4 and 7 Dec. |
| 8, 9, 11 Dec 2017 |
2.3 km |
-- |
-- |
Explosions. |
| 16, 18-19, and 21-22 Dec 2017 |
3.5 km |
16 km |
SSW |
Explosions. Ash plume and weak thermal anomaly on 16 Dec. |
| 25 Dec 2017 |
1.5 km |
-- |
-- |
Explosion. |
| 01-05 Jan 2018 |
-- |
-- |
-- |
No activity noted. |
| 08-10 Jan 2018 |
2.5 km |
-- |
-- |
Explosions. |
| 11-12, 14-16, and 18 Jan 2018 |
3.1 km |
-- |
-- |
Explosion. Minor ashfall reported in Severo-Kurilsk on 15,16, and 18 Jan. |
| 22-23 Jan 2018 |
2 km |
-- |
-- |
Explosions. |
| 26-27 and 29-31 Jan 2018 |
2.5 km |
-- |
-- |
Explosions. Ashfall reported in Severo-Kurilsk on 29 Jan. |
| 05-08 Feb 2018 |
2.4 km |
-- |
-- |
Explosions. Ashfall reported in Severo-Kurilisk on 8 Feb. |
| 09-10 and 14 Feb 2018 |
2.2 km |
-- |
-- |
Explosions. |
| 17-18 and 20-21 Feb 2018 |
2.4 km |
-- |
-- |
Explosions. Ashfall reported in Severo-Kurilisk on 17-18 Feb. |
| 23-25 and 27-28 Feb 2018 |
3.3 km |
-- |
-- |
Explosions. |
| 06 Mar 2018 |
1.7 km |
-- |
-- |
Explosions. |
| 12-13 Mar 2018 |
2.7 km |
-- |
-- |
Explosions. |
| 18 and 21-22 Mar 2018 |
1.8 km |
-- |
-- |
Explosions. Ashfall reported in Severo-Kurilisk on 17 and 21 Mar. |
| 23-25 and 28-29 Mar 2018 |
2.3 km |
-- |
-- |
Explosions. |
| 31 Mar-06 Apr 2018 |
2.7 km |
-- |
-- |
Explosions. |
| 07 and 11-12 Apr 2018 |
1.8 km |
-- |
-- |
Explosions. Ashfall reported in Severo-Kurilisk on 6 Apr. |
| 15 and 17-19 Apr 2018 |
2.6 km |
-- |
-- |
Explosions. |
| 21 and 25 Apr 2018 |
2.5 km |
-- |
-- |
Explosions. |
| 01-03 May 2018 |
2.8 km |
-- |
-- |
Explosions. |
| 04 and 06-10 May 2018 |
2.4 km |
-- |
-- |
Explosions. |
| 12-14 May 2018 |
2.8 km |
21 km |
SW |
Explosions. Ash plume drifted SW on 13 May. |
Minor ash explosions were reported throughout the period from December 2017 through May 2018 (figure 17). Minor amounts of ash fell in Severo-Kurilisk at the end of 2017 and into 2018. Ash was reported on 2-4, and 7 December 2017; 15, 16, 18, and 29 January 2018; 8, 17, and18 February; 17 and 21 March; and 6 April. Ash plume altitudes during this reporting period ranged from 1.5 to 3.5 km (table 6); the summit is at 1.1 km.
Geologic Background. The flat-topped summit of the central cone of Ebeko volcano, one of the most active in the Kuril Islands, occupies the northern end of Paramushir Island. Three summit craters located along a SSW-NNE line form Ebeko volcano proper, at the northern end of a complex of five volcanic cones. Blocky lava flows extend west from Ebeko and SE from the neighboring Nezametnyi cone. The eastern part of the southern crater contains strong solfataras and a large boiling spring. The central crater is filled by a lake about 20 m deep whose shores are lined with steaming solfataras; the northern crater lies across a narrow, low barrier from the central crater and contains a small, cold crescentic lake. Historical activity, recorded since the late-18th century, has been restricted to small-to-moderate explosive eruptions from the summit craters. Intense fumarolic activity occurs in the summit craters, on the outer flanks of the cone, and in lateral explosion craters.
Information Contacts: Kamchatka Volcanic Eruptions Response Team (KVERT), Far Eastern Branch, Russian Academy of Sciences, 9 Piip Blvd., Petropavlovsk-Kamchatsky, 683006, Russia (URL: http://www.kscnet.ru/ivs/kvert/); Institute of Volcanology and Seismology, Far Eastern Branch, Russian Academy of Sciences (IVS FEB RAS), 9 Piip Blvd., Petropavlovsk-Kamchatsky 683006, Russia (URL: http://www.kscnet.ru/ivs/eng/).
Kirishimayama (Japan) — June 2018 Cite this Report
Kirishimayama
Japan
31.934°N, 130.862°E; summit elev. 1700 m
All times are local (unless otherwise noted)
Ash plumes and lava flows at Shinmoedake starting in March 2018; explosion at Iwo-yama
Kirishimayama is a large group of more than 20 Quaternary volcanoes located N of Kagoshima Bay, Japan (figure 22). For the last 1,000 years, repeated eruptions have taken place at two locations in the complex: the Ohachi crater on the W flank of the Takachihomine stratovolcano, and the Shinmoedake stratovolcano 4 km NW of Ohachi. A single eruption was reported in 1768 from the Iwo-yama (Ebino Kogen) dome located on the NW flank of the Karakunidake stratovolcano, about 5 km NW of Shinmoedake.
The last confirmed eruption at the Ohachi crater was in July 1923. Intermittent steam plumes have been observed since then, including in December 2003 (BGVN 33:09), but the Japan Meteorological Agency (JMA) noted that it had been quiet since 1 December 2007. Shinmoedake has been the site of several short-lived eruptive events since 2008. Most of the events were single-day explosions with ash emissions (BGVN 35:12). A more protracted event from January to September 2011 included numerous explosions with ash plumes, which produced ashfall tens of kilometers away, the growth of a lava dome, ejecta of large blocks, and small pyroclastic flows (BGVN 36:07). Shinmoedake remained quiet until seismicity increased on 23 September 2017, followed by several explosions during October 2017 (BGVN 43:01). Seismic unrest was first reported from the area around Iwo-yama in December 2013, and it has been regularly monitored since that time. This report covers activity from November 2017 through May 2018 and includes new explosive events at Shinmoedake during March-May 2018, an explosive event at Iwo-yama in April 2018, and a brief increase in seismicity at Ohachi in February 2018. Information is provided primarily by the JMA and the Tokyo Volcanic Ash Advisory Center (VAAC), with additional satellite data and news media reports.
Summary of activity during November 2017-May 2018. After steam plumes disappeared at Ohachi in mid-2006, only minor intermittent seismicity was reported through 2017. A sudden increase in earthquakes and tremor activity on 9 February 2018 led JMA to raise the 5-level Alert Level system from 1 (potential for increased activity) to 2 (do not approach the crater) for about a month. Activity diminished after the middle of February and Ohachi remained quiet through May 2018, with only a continuing modest thermal anomaly at the crater.
The latest eruptive episode at Shinmoedake, during 11-17 October 2017, generated an SO2 plume recorded by NASA satellites, caused ashfall up to 100 km away, and created a new vent about 80 m in diameter on the E side of the crater. Intermittent earthquakes and tremors along with low-level steam plumes characterized activity during November 2017-February 2018. A new eruptive episode began on 1 March 2018 with near-constant explosive activity that lasted until 10 March. A new lava flow at the summit was first observed by JMA on 6 March and began to overflow the NW rim of the crater on 9 March. The Tokyo VAAC reported ash plumes over 6 km altitude on 10 March. An explosion on 5 April produced the largest ash plume of the period; it rose to 10.1 km altitude, was visible drifting E for 24 hours, and resulted in significant ashfall in the region. The lava flow had ceased advancing down the NW flank by the end of April. Another explosion on 14 May 2018 generated an ash plume that rose to 7.3 km altitude and caused ashfall 30 km S that covered the roadways.
An increase in seismicity at Iwo-yama in December 2013, followed by a 7-minute-period of tremor activity in August 2014 was the first recorded at the site since 1768. Thermal anomalies and weak fumarolic activity first appeared in December 2015. Seismicity, including intermittent tremor events and larger amplitude earthquakes, gradually increased during 2016 and 2017. Intermittent fumarolic activity and temperature anomalies began to increase measurably in mid-2017. Jets of sediment-laden hot water emerged from several vents early in 2017. A further increase in fumarolic activity and the temperature of the thermal anomalies in February 2018 led JMA to raise the Alert Level at Iwo-yama. Large amplitude earthquakes and a tremor event accompanied an ash-bearing explosion on 19 April 2018 from a vent on the S side of Iwo-yama. The following day, a vent opened 500 m to the W and produced vigorous steam emissions. On 26 April 2018 an explosion from the new vent sent ash 200 m high. Jets of hot water continued at the Iwo-yama vents through May 2018.
Activity at Ohachi during 2003-May 2018. JMA reported tremor activity with epicenters near Ohachi in mid-December 2003 (BGVN 33:09) that was followed by fumarolic activity for a few weeks. Intermittent steam plumes were observed during 2004; on 26 March 2004 a tremor event lasted for four hours and a steam plume rose 800 m above the crater (figure 23). A few periods of microtremor were recorded, and intermittent fumarolic activity was observed with webcams until March 2006, after which most activity ceased. JMA lowered the 5-level Alert Level from 2 (Do not approach the crater) to 1 (Potential for increased activity) on 22 May 2006. Fumarolic activity was not observed after July 2006, and no new thermal activity was reported during a field visit in October 2006. Minor seismicity was reported for a few days during July 2007, and small-amplitude, short-duration tremor activity was occasionally recorded during 2008-2014.
Although earthquake activity increased slightly in July 2015, the warning level was not raised, and no surface fumarolic activity was observed during field visits in August and September 2015 (figure 24). Seismic activity remained elevated at Ohachi through February 2016 and then gradually decreased during March. Although tremors were recorded in May and December 2016, there was no change in condition at the site and seismicity continued to decrease; no tremors were recorded during 2017.
Earthquake frequency on the SW side of Ohachi increased during 9-16 February 2018, resulting in 199 seismic events, and tremor activity was also recorded on 9 February. This activity led JMA to increase the Alert Level to 2 on 9 February 2018. In spite of the increased seismic activity, the thermal activity remained unchanged from previous months with continued minor thermal anomalies in the same areas as before (figure 25). Seismicity decreased significantly during March 2018 to only 13 volcanic earthquakes, and no microtremor activity was recorded. Inspections carried out on 11 and 14 March showed no surface changes (figure 26) and resulted in JMA lowering the Alert Level back to 1 on 15 March 2018. Ohachi remained quiet through May 2018.
Activity at Shinmoedake during August 2008-October 2017. An explosion on 22 August 2008 lasted for about six hours and produced ashfall in Kobayashi City (10 km NE) (BGVN 33:09). Seismicity had increased rapidly a few days prior to the explosion, and then decreased gradually for the remainder of 2008. Other than a brief increase in seismicity in May the following year, only steam plumes rising about 100 m from the crater were reported for 2009.
Seven small ash-bearing explosive events were reported during March-July 2010. Small-amplitude tremor activity on 30 March 2010 was accompanied by a plume that rose 400 m above the crater rim; a small amount of ash fell 400 m to the W of the fumarole within the crater. The webcam on the S rim of the crater captured a grayish plume rising 300 m after a small explosion on 17 April 2010. Another small explosion on 27 May produced a grayish-white plume that rose 100 m above the crater rim and resulted in minor ashfall NE in Kobayashi City. Officials noted a new fumarole on the W flank after this event. Two more explosions on 27 and 28 June 2010 resulted in a small amount of ash deposited 10 km E of Shinmoedake. A small explosion was reported on 5 July. On 10 July, a grayish-white plume, observed in the webcam, rose 100 m above the crater rim after an explosion, and a small low-temperature pyroclastic surge flowed 300 m down the SW slope. GPS instruments recorded minor inflation from December 2009 through September 2010.
A new, more substantial, eruption began at Shinmoedake on 19 January 2011. Activity increased on 26 January with an explosion that released a large volume of ash and pumice and included the growth of a new lava dome (BGVN 35:12, 36:07). Thirteen additional explosions occurred through 1 March 2011. Activity became more intermittent after mid-February, and the last emission was reported on 7 September 2011. Seismicity declined significantly in March 2012 and had returned to background levels by May 2012. With no surface changes and very low seismicity, JMA reduced the Alert Level from 3 to 2 on 22 October 2013, and the only reported activity was steam plumes rising 50-200 m above the crater rim during 2013. The lava dome in the crater remained about 600 m in diameter. Inflation had slowed and stopped after December 2011 but began again around December 2013. Shallow, low-level seismicity during 2014 with epicenters near Shinmoedake was distributed within a few kilometers below the summit; there were no surface changes observed at the crater during several overflights conducted by the Japan Maritime Self Defense Force throughout the year.
Occasional steam plumes rising 400 m above the crater rim were reported during 2015. Volcanic earthquakes were intermittent, with brief increases in activity during March-May and October- December with roughly the same number as the previous year. Inflationary deformation that began around December 2013 ceased in January 2015. A very brief tremor on 1 March 2015 was the first recorded since 1 February 2012. During 2016, occasional steam plumes rose 300 m above the crater. In spite of a seismic swarm on 23 February 2016, and a general increase in seismicity throughout the year, no eruptions occurred, and no surface changes were observed. JMA kept the Alert Level at 2 throughout the year. A small tremor event on 17 September was the only recorded during 2016. Very little activity was reported from January to September 2017; occasional steam plumes were reported rising 400 m above the crater rim. JMA lowered the Alert Level from 2 to 1 on 26 May 2017.
A minor increase in seismicity was observed beginning in July 2017, and was followed by a marked increase on 23 September. After a further increase in frequency and amplitude of earthquakes on 4 October, JMA raised the Alert Level to 2 for Shinmoedake on 5 October 2017. This was followed by an eruption that began on 11 October 2017. A new vent was observed on the E side of the crater during an overflight that same day, and ashfall was reported in numerous communities as far as 90 km NE (BGVN 43:01). A significant SO2 plume was measured by the OMI instrument on the Aura satellite the following day (figure 27). After raising the Alert Level to 3 on 11 October, JMA expanded the restricted area radius from 2-3 km during 15-31 October.
Explosions on 14 October 2017 resulted in confirmed ashfall in Kagoshima city (50 km SW), Takahara Town (15 km E), Kobayashi city (25 km NE), Saito city (55 km NE), Hyuga city (90 km NE), and Misato town (75 km NE). Ongoing explosions continued until 17 October, after which persistent steam plumes were observed rising as high as 600 m above the crater. In an overflight conducted on 23 October JMA scientists noted the new vent was about 80 m in diameter, and ejecta from the vent had formed a small cone around the vent. (figure 28).
Activity at Shinmoedake during November 2017-March 2018. After the eruption of 11-17 October 2017 seismicity decreased significantly, and no morphological changes were observed for the remainder of the year. Steam plumes rose 300-500 m above the crater during November and December. Short-duration tremors were detected during 25-29 November, along with a slight increase in the number of volcanic earthquakes. A small earthquake swarm recorded during 2-4 December was the only significant seismic activity that month.
Infrequent, large-amplitude earthquakes were recorded during 15-17 January 2018, along with a few short-duration tremor events, the first since 29 November 2017. The earthquakes were located within a 1 km radius of Shinmoedake, around 2-4 km deep. Steam plumes at the crater rose no more than 100 m most days; occasional plumes rising as high as 200 m were noted. An earthquake swarm on 25 February was the first notable event of the month; the steam plumes remained under 100 m above the crater, except for a 500-m-high plume on 21 February. Thermal imaging surveys in late February indicated a modest increase in heat flow from fractures inside the crater and on the W slope compared with previous measurements.
Earthquakes with shallow epicenters below Shinmoedake increased in number early on 1 March 2018 and a new eruptive episode followed a few hours later, leading JMA to increase the restricted zone to 3 km around the crater (figure 29). SO2 emissions also increased sharply. By the afternoon of 1 March an ash plume rose 1,500 m above the crater, emerging from the vent on the E side and drifting SE. Ashfall was confirmed on 1 March in the area up to 18 km E of the crater. Large blocks of ejecta were observed within the crater on 5 March.
During an overflight on 6 March 2018, JMA witnessed a new lava flow covering a large area on the E side of the crater floor (figure 30). Eighteen explosive eruptions occurred on 6 March and JMA reported that the ash plume rose 2,800 m above the crater (figure 31). Ashfall was confirmed SW of Shinmoedake in Shibushi city (50 km SSE), Tarumizu City (50 km SSW) and Aira City (30 km SW). NASA 's Aqua satellite captured a false color image of the eruption on 6 March showing the ash plume drifting SE and SW from Shinmoedake (figure 32). About 80 flights in and out of nearby Kagoshima airport were canceled.
Tremor events occurred continuously over 1-8 March; forty-seven explosions were recorded between 6 and 8 March; they decreased in frequency after the middle of the month. The OMI instrument on the NASA Aura satellite recorded a significant SO2 plume on 7 March 2018 (figure 33). Geospatial data that had shown a gradual inflation of the Kirishimayama complex since July 2017 showed a sharp deflation during 6-7 March 2018, after which inflation resumed.
During an overflight on 9 March 2018, a staff member from the Geographical Survey Institute observed the lava flow beginning to overflow the NW side of the crater (figure 34). Explosions resulted in ejecta traveling 800 m from the crater on 9 March and an ash plume rising 3,200 m. An increase in the intensity of activity the following day sent ejecta 1,800 m from the vent and generated an ash plume that rose 4,500 m (figure 35); this led JMA to increase the restricted area around the crater to 4 km between 10 and 15 March.
A thermal image taken on 11 March showed that the lava was moving very slowly down the NW flank, advancing only a few tens of meters since 9 March (figure 36). JMA confirmed during an overflight on 14 March that the lava flowing down the NW flank was about 200 m wide. Two explosions on 25 March produced plumes that rose 3,200 and 2,100 m, ejecta that traveled 800 m, and a small pyroclastic flow that advanced about 400 m down the W flank (figure 37). Although analysis of satellite data by Japan's Geographical Survey Institute suggested that the eruption of lava into the crater had ceased by 9 March, it continued to flow slowly down the NW flank for several weeks. The diameter of the flow inside the crater was about 700 m, and it had traveled about 85 m down the NW flank by 28 March (figure 38).
The Tokyo VAAC issued multiple daily reports from 1-15 March 2018, and a few intermittent reports during the rest of the month. JMA usually reports plume heights in meters above the crater and the Tokyo VAAC reports them as altitudes above sea level; conversions are noted where the height or altitude of a plume is exceptional. They reported an ash plume drifting SE on 1 March at 1.5 km altitude; the plume had risen to 2.4 km by the end of the day. The following day a plume was visible in satellite images at 2.1 km altitude drifting E. Continuous emissions drifting NE above 2.4 km altitude were reported on 3 and 4 March. Several explosions generated plumes that were visible in satellite imagery during 5-7 March drifting S, SW, and W at altitudes between 3.0 and 4.6 km. Plumes from larger explosions during 9 and 10 March rose to altitudes between 4.3 and 6.1 km and drifted SE, finally dissipating after about 24 hours. Explosions on 12 and 13 March drifted NE and E at 3.4-4.9 km altitude, with continuous emissions visible in satellite imagery during those days. Two explosions on 24 March produced plumes that drifted SE at 3.7 and 4.9 km altitude, and were visible in satellite imagery until they dissipated the next day.
A strong MIROVA thermal anomaly signal appeared at the beginning of March and slowly tapered off into April. The signal is consistent with the reports of the eruption of lava from the summit of Shinmoedake and its gradual cooling (figure 39). The MODVOLC thermal alert signals also closely match the reports of the eruption of the lava. The first six alerts were issued on 6 March, four each on 9 and 10 March, three each on 11 and 12 March, and one each on 13, 14, 16, 23, and 30 March, matching a gradual cooling pattern for the lava after the main eruptive event.
Activity at Shinmoedake during April and May 2018. A new explosion on 5 April 2018 generated a large ash plume that rose 5,000 m above the crater; a small pyroclastic flow traveled 400 m down the SE flank, and ejecta was thrown 1,100 m from the vent (figure 40). The Tokyo VAAC reported an explosion, and an ash plume at 6.7 km altitude drifting E visible in satellite imagery early in the day. A few hours later, the plume was visible at 10.1 km altitude, or more than 8,000 m above the crater. Incandescent tephra was ejected hundreds of meters high, and lightning was observed within the large ash plume (figures 41 and 42). The plume was observed continuously in satellite images for almost 24 hours before dissipating; a significant SO2 plume was also recorded (figure 43).
A large amount of ashfall was reported in parts of Kobayashi city and Takaharu (15 km E) (figures 44 and 45) on 5 April 2018. Ashfall reports also indicated that a wide area to the N of Shinmoedake including Hitoyoshi City (30 km N), to the NE including Kadogawa Town (95 km NE), and to the E including Miyazaki City (50 km E) were also affected. Another eruption took place the following day, on 6 April, but weather clouds obscured views of the summit. No eruptions were recorded after 6 April for the remainder of the month.
In multiple flyovers, on 19, 20, and 21 April 2018, authorities observed lava continuing to flow down the NW flank (figure 46), along with residual high temperatures in the central part of the lava flow (figure 47). Additionally, fumarolic areas around the fractures on the W slope persisted. By the end of April, the flow on the NW flank of the crater was 150 m long. Seismicity had declined at the end of March, but increased again during the explosive period in early April. Occasional tremors were recorded during 5-14 April. Intermittent spikes of around 100 small earthquakes were also recorded on 14 and 21 April.
Another spike in earthquakes with epicenters within 2 km of Shinmoedake occurred on 2 May 2018 with over 700 events recorded. A substantial explosion on 14 May generated an ash plume that rose 4.5 km above the crater according JMA (figure 48). The Tokyo VAAC reported the ash plume initially at 4.9 km altitude drifting SE based on webcam reports; when the plume appeared in satellite data a short time later it was drifting SE at 7.3 km altitude and was continuously visible in satellite imagery for about 24 hours before dissipating. Ashfall was confirmed in numerous areas of the Miyazaki prefecture to the E, and the Kagoshima prefecture to the S and W. Seismicity increased briefly after the explosion. Enough ash fell in Miyakonojo City (30 km S) that it covered the white lines on the roadways (figure 49). A thermal image taken on 15 May showed a new high-heat flow area on the E side of the new lava flow inside the crater that JMA concluded was likely the result of the explosive event of the previous day (figure 50).
Activity at Iwo-yama during 2014-2017. An increase in seismicity around Iwo-yama, on the NW flank of the Karakunidake stratovolcano (figure 22) beginning in December 2013 was noted by JMA. The epicenters were distributed from 1-6 km below Iwo-yama. Satellite measurements suggested minor inflation in the area around Karakunidake beginning in December 2013, which lasted until January 2015. A 7-minute-long tremor event occurred near Iwo-yama on 20 August 2014. Although inspections of the area by JMA revealed no thermal or fumarolic activity, they listed the Iwo-yama area with an unofficial Alert Level of "Danger around the crater" on 24 October 2014, equivalent to the official Alert Level 2. They modified the warning during May 2015 to "Normal, keep in mind, it is an active volcano," the same as the official Alert Level 1. During the second half of 2015 there were occasional earthquakes and tremors reported in the area, but no surface or thermal activity was recorded (figure 51) until December. Thermal anomalies appeared in the area for the first time during the first week of December 2015; weak fumarolic activity accompanied by H2S odors were first reported during 15-17 December 2015 on the SW side of the Iwo-yama crater (figure 52).
Periods of intermittent microtremor activity occurred once in January, four times in February, and twice in December during 2016, with durations ranging from 40 seconds to 5 minutes. A seismic swarm on 28 February led JMA to raise the unofficial Alert Level to "danger around the crater" for the month of March (equivalent to the official Alert Level 2). A new thermal area with fumarolic activity appeared on 24 March 2016 on the SE side of the crater. Intermittent steam plumes were observed throughout 2016; the highest rose 200 m on 11 October. Thermal anomalies also persisted throughout the year on the S and SW areas of the crater. Alert Level 1 (Note that it is an active volcano) was formally assigned to Iwo-yama on 6 December 2016. The Alert Level was raised to 2 on 12 December after a seismic swarm, tremor, and the observation of inflation in the inclination data in the previous days.
Fumarolic activity decreased in January 2017 after a brief increase at the end of December 2016; JMA lowered the Alert Level back to 1 on 13 January and steam plumes generally rose only 30 m high during the month. The thermal anomalies persisted in the same areas of the SW and W portions of the crater as before, though new fumarolic activity appeared in those areas during February 2017. During March field surveys, observers identified hot water emerging from the fumaroles in the SW and S areas of the crater. The inclinometer detected inflation beginning on 25 April 2017, but it leveled off during August. An increase in the number of fumaroles in the area of the thermal anomaly at the SW side of the crater was confirmed by a JMA field inspection in late April. When the University of Tokyo Earthquake Research Institute visited the site on 8 May 2017, they observed sediment-laden water deposits that had been dispersed on the SW side within the crater, and ejecta around the SW edge. This led JMA to increase the Alert Level to 2.
Fumarolic activity increased during mid-to-late July 2017 and steam plumes were reported at 300 m above the crater for a brief period. On 27 July visitors confirmed dead and discolored plants on the NE side of the crater, and audible fumarolic activity. A new thermal anomaly zone with fumaroles was visible on the SW flank outside the crater during a site visit on 31 August. Low levels of seismicity were intermittent throughout 2017, but no tremor events were recorded. A large amplitude earthquake with its epicenter under Iwo-yama occurred on 5 September 2017; no sudden changes were observed at the site a few days later, although thermal images taken on 9 September revealed an increase in temperature from two years prior (figure 53, compared with figure 52). JMA lowered the warning level to 1 at the end of October. During November and December 2017, steam plumes generally rose 100-200 m above the crater.
Activity at Iwo-yama during January-May 2018. An analysis of nearby hot-spring waters indicated a significant jump in Cl/SO4 ratios characteristic of high-temperature volcanic gas beginning in November 2017. The first tremor since 12 December 2016 was recorded on 19 January 2018 and coincided with a brief period of inflation in the vicinity of Iwo-yama. Regional inflation of the area had begun again in July 2017 and continued into 2018. Low-frequency, small-amplitude earthquakes were intermittent during January 2018 and steam plumes rose 100-200 m. Increases in seismicity, fumarolic activity, and the temperatures of the thermal anomalies during mid-February 2018 prompted JMA to raise the Alert Level on 20 February 2018 at Iwo-yama to 2. Steam plume heights increased to 200-300 m after 20 February. Seismicity decreased during March 2018, however observations from the webcam revealed an increase in fumarolic and thermal activity (figure 54).
The infrared imaging webcam recorded a burst of heat from a vent on the SW side of the crater on 7 April; the amplitude of seismic vibrations also increased. A field visit on 9 April revealed a hot water pool several meters in diameter on the SW side of the crater with sediment-laden water flowing from it and a 10-m-high steam plume. Local inflation recorded at Iwo-yama turned to deflation on 19 April; large-amplitude earthquakes were also reported. A tremor that day was followed by an explosion a few minutes later from a new vent on the S side of Iwo-yama. The plume rose 500 m and ejecta was scattered 200-300 m from the vent to the SE. During an overflight on 19 April JMA noted ash deposits around the vent; ash emission from the vent continued until the following morning (figure 55). The Tokyo VAAC reported a small ash emission on 19 April from Kirishimayama that rose to 1.8 km altitude and drifted E, but it was not visible in satellite imagery. On the evening of 20 April, another new vent with a vigorous steam plume appeared 500 m W of Iwo-yama (figure 56). Sediment-laden water was observed around the vent the following day. Increased seismicity at Iwo-yama lasted for about 20 days; additional tremor activity was reported on 20 and 24 April.
A brief explosion that lasted about ten minutes occurred from this new vent around 1815 on 26 April 2018 sending a plume of ash about 200 m above the vent (figure 57). A small ash emission from Kirishimayama was reported by the Tokyo VAAC on 26 April that rose to 1.5 km altitude. In a site visit on 30 April, JMA noted active fumaroles and small explosions around both vent areas (figure 58). After the explosion of 19 April, steam plumes rose as high as 700 m from the vent on the S side of the crater, and intermittent spouts a few meters high of sediment-laden water were also observed. Steam plumes rose as high as 500 m from the vent located 500 m to the W.
Fumarolic activity continued at Iwo-yama during May 2018, but no new explosions nor ash emissions were reported. Shallow seismic events were intermittent, but significantly decreased from April. No tremors were recorded. JMA lowered the Alert Level on 1 May 2018 from 3 to 2. Steam plumes rose 300-500 m from the vents, and thermal anomalies persisted at the crater and the adjacent new vent to the W throughout the month. Jets of sediment-laden hot water rising several meters continued from the vent on the S side of Iwo-yama (figure 59).
Geologic Background. Kirishimayama is a large group of more than 20 Quaternary volcanoes located north of Kagoshima Bay. The late-Pleistocene to Holocene dominantly andesitic group consists of stratovolcanoes, pyroclastic cones, maars, and underlying shield volcanoes located over an area of 20 x 30 km. The larger stratovolcanoes are scattered throughout the field, with the centrally located Karakunidake being the highest. Onamiike and Miike, the two largest maars, are located SW of Karakunidake and at its far eastern end, respectively. Holocene eruptions have been concentrated along an E-W line of vents from Miike to Ohachi, and at Shinmoedake to the NE. Frequent small-to-moderate explosive eruptions have been recorded since the 8th century.
Information Contacts: Japan Meteorological Agency (JMA), Otemachi, 1-3-4, Chiyoda-ku Tokyo 100-8122, Japan (URL: http://www.jma.go.jp/jma/indexe.html); NASA Goddard Space Flight Center (NASA/GSFC), Global Sulfur Dioxide Monitoring Page, Atmospheric Chemistry and Dynamics Laboratory, 8800 Greenbelt Road, Goddard, Maryland, USA (URL: https://so2.gsfc.nasa.gov/); NASA Earth Observatory, EOS Project Science Office, NASA Goddard Space Flight Center, Goddard, Maryland, USA (URL: http://earthobservatory.nasa.gov/); MIROVA (Middle InfraRed Observation of Volcanic Activity), a collaborative project between the Universities of Turin and Florence (Italy) supported by the Centre for Volcanic Risk of the Italian Civil Protection Department (URL: http://www.mirovaweb.it/); Hawai'i Institute of Geophysics and Planetology (HIGP) - MODVOLC Thermal Alerts System, School of Ocean and Earth Science and Technology (SOEST), Univ. of Hawai'i, 2525 Correa Road, Honolulu, HI 96822, USA (URL: http://modis.higp.hawaii.edu/); Geographical Survey Institute, Geospatial Information Authority of Japan, Ministry of Land, Infrastructure, Transport and Tourism, No. 1 North Town, Tsukuba city, Ibaraki Prefecture 305-0811 Japan Tel: 029-864-1111 (Representative) Fax: 029-864-1807 (URL: http://www.gsi.go.jp/index.html); Kyodo News (URL: https://www.kyodonews.jp/english/); Associated Press (URL: http://www.ap.org/ ); Reuters (http://www.reuters.com/).
Langila (Papua New Guinea) — June 2018 Cite this Report
Langila
Papua New Guinea
5.525°S, 148.42°E; summit elev. 1330 m
All times are local (unless otherwise noted)
Gradual decline in activity after July 2017, but continuing through May 2018
Langila, one of the most active volcanoes of New Britain (figure 7), has been intermittently ejecting ash since April 2016 (BGVN 42:09). Volcanic ash warnings continue to be issued by the Darwin Volcanic Ash Advisory Centre (VAAC). Recent ash plume altitudes (table 5) are in the range of 1.5-2.5 km, but several in mid-April to mid-May 2018 reached up to twice that level. Thermal anomaly data acquired by satellite-based MODIS instruments showed a gradual decrease in power level and occurrence through mid- to late-2017, followed by significantly fewer alerts and anomalies in the first half of 2018. Rabaul Volcano Observatory (RVO) data indicates the activity during 2017 was primarily located in Crater 2 (northern-most crater).
Table 5. Reported data by Darwin Volcanic Ash Advisory Centre (VAAC) on ash plume altitude and drift from Langila based on analyses of satellite imagery and wind model data between 21 June 2017 and 28 May 2018.
| Dates |
Ash Plume Altitude (km) |
Ash Plume Drift |
Other Observations |
| 07 Aug 2017 |
2.1 |
55 km NW |
-- |
| 09 Aug 2017 |
1.8 |
N |
-- |
| 16 Aug 2017 |
2.1 |
NW |
-- |
| 01-02 Sep 2017 |
1.8 |
N, NW |
-- |
| 07-08, 10-12 Sep 2017 |
1.8-2.4 |
NNW, NW, SW |
-- |
| 22-23 Sep 2017 |
2.1 |
NNW |
-- |
| 04 Oct 2017 |
1.8 |
N |
Minor ash emission |
| 11, 15-16 Oct 2017 |
1.8-2.1 |
NE, NNW, NW |
-- |
| 17-18, 20 Oct 2017 |
1.5-1.8 |
NE, NNW, NW |
-- |
| 05 Nov 2017 |
3.7 |
SE, ESE |
-- |
| 15-16 Nov 2017 |
1.8-2.7 |
S, SW |
-- |
| 15 Apr 2018 |
3.7 |
S |
-- |
| 24 Apr 2018 |
4 |
SW |
Ash dissipated in 6 hours |
| 13 May 2018 |
5.5 |
W |
At 0709; ash dissipated in 6 hours |
| 17-18, 21-22 May 2018 |
2.1-2.4 |
WSW, W, WNW |
-- |
| 23, 26-28 May 2018 |
2.4-3 |
WSW, W, NW |
-- |
MIROVA analysis of thermal anomalies measured by MODIS satellite sensors show a gradual decline of radiative power from early June 2017 to the end of the year (figure 8). Sporadic low-power anomalies occurred in January, April, and May 2018.
Thermal alerts from MODVOLC analyses were concentrated between early June 2017 and late September 2017 (figure 9), with only one pixel being measured in 2018 through early June, that alert being on 5 January 2018.
Geologic Background. Langila, one of the most active volcanoes of New Britain, consists of a group of four small overlapping composite basaltic-andesitic cones on the lower E flank of the extinct Talawe volcano in the Cape Gloucester area of NW New Britain. A rectangular, 2.5-km-long crater is breached widely to the SE; Langila was constructed NE of the breached crater of Talawe. An extensive lava field reaches the coast on the N and NE sides of Langila. Frequent mild-to-moderate explosive eruptions, sometimes accompanied by lava flows, have been recorded since the 19th century from three active craters at the summit. The youngest and smallest crater (no. 3 crater) was formed in 1960 and has a diameter of 150 m.
Information Contacts: Darwin Volcanic Ash Advisory Centre (VAAC), Bureau of Meteorology, Northern Territory Regional Office, PO Box 40050, Casuarina, NT 0811, Australia (URL: http://www.bom.gov.au/info/vaac/); Hawai'i Institute of Geophysics and Planetology (HIGP) - MODVOLC Thermal Alerts System, School of Ocean and Earth Science and Technology (SOEST), Univ. of Hawai'i, 2525 Correa Road, Honolulu, HI 96822, USA (URL: http://modis.higp.hawaii.edu/); MIROVA (Middle InfraRed Observation of Volcanic Activity), a collaborative project between the Universities of Turin and Florence (Italy) supported by the Centre for Volcanic Risk of the Italian Civil Protection Department (URL: http://www.mirovaweb.it/); Rabaul Volcano Observatory (RVO), Geohazards Management Division, Department of Mineral Policy and Geohazards Management (DMPGM), PO Box 3386, Kokopo, East New Britain Province, Papua New Guinea.
Marapi
Indonesia
0.38°S, 100.474°E; summit elev. 2885 m
All times are local (unless otherwise noted)
Two explosions during April-May 2018 cause ashfall to the southeast
The Marapi volcano on Sumatra (not to be confused with the better known Merapi volcano on Java) previously erupted on 4 June 2017, generating dense ash-and-steam plumes that rose as high as 700 m above the crater and caused minor ashfall in a nearby district (BGVN 42:10). The volcano is monitored by the Pusat Vulkanologi dan Mitigasi Bencana Geologi (PVMBG, also known as Centre for Volcanology and Geological Hazard Mitigation or CVGHM).
On 27 April 2018, a phreatic explosion produced an ash plume that rose 300 m above the crater rim (figure 8); a thin ash deposit was reported in the Cubadak area (Tanah Datar Regency), about 12 km SE. Another explosion at 0703 on 2 May 2018 (figure 9) produced a voluminous dense gray ash plume that rose 4 km above the crater rim and drifted SE; seismic data recorded by PVMBG indicated that the event lasted just over 8 minutes (485 seconds).
The Alert Level has remained at 2 (on a scale of 1-4), where it has been since August 2011. Residents and visitors have been advised not to enter an area within 3 km of the summit.
Geologic Background. Gunung Marapi, not to be confused with the better-known Merapi volcano on Java, is Sumatra's most active volcano. This massive complex stratovolcano rises 2,000 m above the Bukittinggi Plain in the Padang Highlands. A broad summit contains multiple partially overlapping summit craters constructed within the small 1.4-km-wide Bancah caldera. The summit craters are located along an ENE-WSW line, with volcanism migrating to the west. More than 50 eruptions, typically consisting of small-to-moderate explosive activity, have been recorded since the end of the 18th century; no lava flows outside the summit craters have been reported in historical time.
Information Contacts: Pusat Vulkanologi dan Mitigasi Bencana Geologi (PVMBG, also known as Indonesian Center for Volcanology and Geological Hazard Mitigation, CVGHM), Jalan Diponegoro 57, Bandung 40122, Indonesia (URL: http://www.vsi.esdm.go.id/); Badan Nasional Penanggulangan Bencana (BNPB), National Disaster Management Agency, Graha BNPB - Jl. Scout Kav.38, East Jakarta 13120, Indonesia (URL: http://www.bnpb.go.id/).
Masaya
Nicaragua
11.9844°N, 86.1688°W; summit elev. 594 m
All times are local (unless otherwise noted)
Lava lake persists during July 2017-April 2018
Nicaragua's Volcan Masaya has an intermittent lava lake that has attracted visitors since the time of the Spanish Conquistadores; tephrochronology has dated eruptions back several thousand years. The unusual basaltic caldera has had historical explosive eruptions in addition to lava flows and actively circulating magma at the lava lake. An explosion in 2012 ejected ash to several hundred meters above the volcano, bombs as large as 60 cm fell around the crater, and ash fell to a thickness of 2 mm in some areas of the park. Brief incandescence and thermal anomalies of uncertain origin in April 2013 were followed by very little activity until the reemergence of the lava lake inside Santiago crater was reported in December 2015. By late March 2016 the lava lake had grown and intensified enough to generate a significant thermal anomaly signature (BGVN 41:08, figure 49) which persisted at a constant power level through April 2017 (BGVN 42:09, figure 53) with an increase in the number of thermal anomalies from November 2016 through April 2017. Although the MIROVA thermal anomaly signal decreased slightly in intensity during May 2017, INETER scientists reported continued strong convection at the lava lake. Similar activity continued throughout July 2017-April 2018 and is covered in this report with information provided by the Instituto Nicareguense de Estudios Territoriales (INETER) and satellite thermal data.
A persistent thermal signature in the MIROVA data during July 2017-April 2018 supported the visual observations of the active lava lake at the summit throughout this period (figure 58). MODVOLC thermal alerts were also issued every month, with the number of alerts ranging from a high of 17 in November 2017 to a low of six in April 2018.
INETER made regular visits to the summit most months in coordination with specialists from several universities to gather SO2 data; CO2, H2S and gravity measurements were also taken during specific site visits. Thermal measurements around the lava lake inside Santiago crater taken on 24 February 2018 indicated temperatures ranging from 210-389°C. Seismicity remained very low throughout the period. The lava lake was actively convecting each time it was visited, and Pele's hair was abundant around the summit area (figures 59-64).
Geologic Background. Masaya volcano in Nicaragua has erupted frequently since the time of the Spanish Conquistadors, when an active lava lake prompted attempts to extract the volcano's molten "gold" until it was found to be basalt rock upon cooling. It lies within the massive Pleistocene Las Sierras caldera and is itself a broad, 6 x 11 km basaltic caldera with steep-sided walls up to 300 m high. The caldera is filled on its NW end by more than a dozen vents that erupted along a circular, 4-km-diameter fracture system. The Nindirí and Masaya cones, the source of observed eruptions, were constructed at the southern end of the fracture system and contain multiple summit craters, including the currently active Santiago crater. A major basaltic Plinian tephra erupted from Masaya about 6,500 years ago. Recent lava flows cover much of the caldera floor and there is a lake at the far eastern end. A lava flow from the 1670 eruption overtopped the north caldera rim. Periods of long-term vigorous gas emission at roughly quarter-century intervals have caused health hazards and crop damage.
Information Contacts: Instituto Nicaragüense de Estudios Territoriales (INETER), Apartado Postal 2110, Managua, Nicaragua (URL: http://www.ineter.gob.ni/); MIROVA (Middle InfraRed Observation of Volcanic Activity), a collaborative project between the Universities of Turin and Florence (Italy) supported by the Centre for Volcanic Risk of the Italian Civil Protection Department (URL: http://www.mirovaweb.it/); Hawai'i Institute of Geophysics and Planetology (HIGP) - MODVOLC Thermal Alerts System, School of Ocean and Earth Science and Technology (SOEST), Univ. of Hawai'i, 2525 Correa Road, Honolulu, HI 96822, USA (URL: http://modis.higp.hawaii.edu/); Alexander Schimmeck, flickr (URL: https://www.flickr.com/photos/alschim/), photo used under Creative Commons license Attribution-NonCommercial-NoDerivs 2.0 Generic (CC BY-NC-ND 2.0) (URL: https://creativecommons.org/licenses/by-nc-nd/2.0/); Carsten ten Brink, flickr (URL: https://www.flickr.com/photos/carsten_tb/), photo used under Creative Commons license Attribution-NonCommercial-NoDerivs 2.0 Generic (CC BY-NC-ND 2.0) (URL: https://creativecommons.org/licenses/by-nc-nd/2.0/).
Nyiragongo (DR Congo) — June 2018 Cite this Report
Nyiragongo
DR Congo
1.52°S, 29.25°E; summit elev. 3470 m
All times are local (unless otherwise noted)
Thermal anomalies show that lava lake remains active through May 2018
As has been the case since at least 1971, the active lava lake in the summit crater of Nyiragongo was present during a tourist visit in June 2017, and seismicity was recorded in the crater in October 2017 (BGVN 42:11). Thermal data from satellite-based instruments shows that an open lava lake remained through 23 May 2018. MIROVA analysis of MODIS satellite thermal data (figure 64) shows nearly daily strong thermal anomalies. Similarly, MODVOLC alerts for the same time period shows a consistently frequent number of anomalies (figure 65).
Geologic Background. The Nyiragongo stratovolcano contained a lava lake in its deep summit crater that was active for half a century before draining catastrophically through its outer flanks in 1977. The steep slopes contrast to the low profile of its neighboring shield volcano, Nyamuragira. Benches in the steep-walled, 1.2-km-wide summit crater mark levels of former lava lakes, which have been observed since the late-19th century. Two older stratovolcanoes, Baruta and Shaheru, are partially overlapped by Nyiragongo on the north and south. About 100 cones are located primarily along radial fissures south of Shaheru, east of the summit, and along a NE-SW zone extending as far as Lake Kivu. Many cones are buried by voluminous lava flows that extend long distances down the flanks, which is characterized by the eruption of foiditic rocks. The extremely fluid 1977 lava flows caused many fatalities, as did lava flows that inundated portions of the major city of Goma in January 2002.
Information Contacts: Hawai'i Institute of Geophysics and Planetology (HIGP) - MODVOLC Thermal Alerts System, School of Ocean and Earth Science and Technology (SOEST), Univ. of Hawai'i, 2525 Correa Road, Honolulu, HI 96822, USA (URL: http://modis.higp.hawaii.edu/); MIROVA (Middle InfraRed Observation of Volcanic Activity), a collaborative project between the Universities of Turin and Florence (Italy) supported by the Centre for Volcanic Risk of the Italian Civil Protection Department (URL: http://www.mirovaweb.it/).
Sabancaya
Peru
15.787°S, 71.857°W; summit elev. 5960 m
All times are local (unless otherwise noted)
Strong, sporadic explosions with ash plumes throughout December 2017-May 2018
Although tephrochronology has dated activity at Sabancaya back several thousand years, renewed activity that began in 1986 was the first recorded in over 200 years. Intermittent activity since then has produced significant ashfall deposits, seismic unrest, and fumarolic emissions. A renewed period of explosive activity began in early November 2016 and continued through 2017. It was characterized by continuing pulses of ash emissions with plume heights exceeding 10 km altitude, thermal anomalies, and numerous significant SO2 plumes (BGVN 42:12). Details of the continuing eruptive activity from December 2017 to May 2018 in this report come from the two Peruvian observatories that monitor the volcano: Instituto Geofisico del Peru - Observatoria Vulcanologico del Sur (IGP-OVS), and Observatorio Volcanologico del INGEMMET (Instituto Geológical Minero y Metalúrgico) (OVI-INGEMMET). Aviation notices come from the Buenos Aires Volcanic Ash Advisory Center (VAAC), and satellite data is reported from several sources.
Sabancaya continued with its explosive eruption that began on 6 November 2016 during December 2017-May 2018. Around 100 aviation notices were issued each month by the Buenos Aires VAAC; tens of daily explosions were reported, fluctuating from highs in the 60s per day in December 2017 to lows in the teens per day during February-April 2018. Ash plumes heights varied at 3-5 km above the summit; altitudes mentioned in the VAAC reports were between 7.3 and 8.5 km altitude most days, although plume heights over 9.1 km were observed a number of times. MIROVA thermal anomalies were recorded every week; MODVOLC thermal alerts occurred every month. A significant number of SO2 anomalies greater than two Dobson Units were measured by NASA's Goddard Space Flight Center each month (table 2).
Table 2. Eruptive Activity at Sabancaya, December 2017-May 2018. Compiled using data from IGP-OVS, OVI-INGEMMET, Buenos Aires VAAC, HIGP - MODVOLC Thermal Alerts System, and NASA Goddard Space Flight Center.
| Month |
VAAC Reports |
Avg Daily Explosions by week |
Max Plume Heights (m above crater) |
Plume Drift |
MODVOLC Alerts |
Min Days with SO2 over 2 DU |
| Dec 2017 |
120 |
69, 63, 55, 67, 42 |
2,500-3,300 |
40-50 km, SW, NE, NW, W, N |
2 |
7 |
| Jan 2018 |
101 |
41, 57, 57, 33 |
2,500-3,300 |
50 km, SW, W, NW, N |
2 |
13 |
| Feb 2018 |
94 |
22, 18, 19, 17 |
2,500-4,500 |
30-50 km, SE, S, SW, NW |
1 |
12 |
| Mar 2018 |
115 |
12, 10, 17, 17, 18 |
2,000-5,350 |
30-50 km, S, SW, W, NW, N |
3 |
13 |
| Apr 2018 |
114 |
15, 15, 19, 22 |
2,000-3,200 |
30-40 km, All |
3 |
12 |
| May 2018 |
132 |
25, 27, 30, 35, 28 |
1,900-4,300 |
30-40 km, NW, N, NE, E, SE, S |
4 |
7 |
Activity during December 2017-February 2018. The Buenos Aires VAAC issued 120 aviation alerts during December 2017; webcam and satellite imagery revealed continuous emissions of water vapor and gas, accompanied by sporadic puffs of ash, throughout the month. When visible in satellite imagery, plumes rose to 7.3-8.2 km altitude (figure 46); a few plumes were reported to 9.1 km altitude. According to OVI-INGEMMET, about 1,800 explosions took place in December. During the third week, ashfall was reported in Huambo (28 km WNW). There were two MODVOLC thermal alerts issued, on 3 and 10 December.
The number of explosions reported by OVI-INGEMMET dropped slightly to about 1,400 during January 2018. The number of VAAC reports was similar to December; when weather clouds prevented observations of emissions, seismic activity showed intermittent peaks that suggested puffs of ash. Plume descriptions by the Buenos Aires VAAC ranged from intermittent plumes that rose to 7.0-7.6 km altitude early in the month to persistent puffs of ash that rose to 7.9-8.2 km altitude during the last two weeks of January. The prevailing winds were directed SW and NW, and ash plumes often drifted as far as 50 km. NASA Goddard Space Flight Center recorded at least 13 days with SO2 emissions greater than two Dobson Units (DU) (figure 47). HIGP issued two MODVOLC thermal alerts on 4 and 20 January.
OVI-INGEMMET reported ash plume heights during February 2018 at 2,500-4,500 m above the summit. They also noted that deflation was measured during the middle two weeks of the month. The number of daily explosions decreased significantly from the previous few months, with about 500 total explosions recorded in February. The Buenos Aires VAAC noted that the webcam showed continuous emissions of gases with sporadic puffs of ash every day that the summit was visible. Ash plumes were only visible in satellite imagery a few times during the month; during 8-10 February, intermittent emissions were seen moving SE between 7.9 and 8.5 km altitude. During 17-24 February, weak, thin ash plumes drifted several different directions at 7.3-7.9 km altitude (figure 48), and on 28 February a plume was visible drifting NW at 7.6 km altitude. Only a single MODVOLC thermal alert was issued on 18 February.
Activity during March-May 2018. Three MODVOLC thermal alerts were issued in March 2018, two on 14 March and one on 27 March. Sporadic ash explosions continued, but with the lowest number per day of the reporting period. About 450 explosions were recorded during March. In spite of the smaller number of explosions, some of the tallest ash plumes of the period occurred this month. The Buenos Aires VAAC reported a diffuse ash plume drifting NW in satellite imagery on 2 March at 8.8 km altitude. The following week, several ash plumes were spotted in satellite imagery at altitudes of 7.3-8.2 km drifting either SW or NW. On 11 March, cloudy weather prevented visual satellite imagery observations, but multispectral imagery and the webcam revealed intermittent pulses of ash moving SW at 7.6 km altitude. The following day sporadic strong pulses of ash were observed in the webcam, and there was a pilot report of an ash plume at 9.1 km altitude. During the second half of March, ash plumes were noted in satellite imagery most days at altitudes of 6.4-8.2 km; a few pulses produced short-lived ash plumes that rose over 9.1 km, including on 14, 22, 24, and during 27-30 March (figure 49). The highest plume was observed in visible imagery drifting E on 28 March at 10.1 km altitude. A lahar was also reported on 28 March descending the SE flank, towards the Sallalli River; no damage was reported.
The number of explosions during April 2018 increased slightly from March to about 540. The maximum plume heights ranged from 2,000 to 3,200 m above the summit according to OVI-INGEMMET. The webcam showed continuous emissions of water vapor and gas and sporadic pulses of ash throughout the month. Ashfall was reported during the first week in Achoma (23 km NE), Chivay (33 km NE), and Huanca. During the second week, the prevailing winds brought ashfall to the W and NW to Huambo (28 km W) and Cabanaconde (22 km NW). The Buenos Aires VAAC reported faint ash plumes visible in satellite imagery nearly every day; plume heights consistently ranged from 7.0 to 8.2 km altitude. Three MODVOLC thermal alerts were issued during the month, one on 13 April and two on 17 April.
Activity increased in many ways during May 2018. The Buenos Aires VAAC issued 132 aviation alerts, the most of any month during the period. The numbers of daily explosions increased compared to April, resulting in a monthly total of around 900. OVI-INGEMMET reported plume heights up to 4,300 m above the summit. MODVOLC thermal alerts were issued on 8, 19, 24, and 26 May. In addition to ash plumes visible in satellite imagery every day at altitudes of 7.3-8.2 km altitude (figure 50), a significant number of ash plumes were reported to altitudes greater than 9.1 km during the month, resulting in more VONA's (Volcanic Observatory Notice to Aviation) issued than in previous months. Sporadic strong puffs of ash were observed in the webcam on the days that satellite imagery measurements of ash plume heights exceeded 9.1 km including on 4, 5, 10, 14, 19, 21, 22, 25, 28, and 31 May. The highest plumes reached 10.4 km altitude on 19 May and 10.1 km altitude on 25 May. Hotspots were also reported on 20, 24, and 27 May. As in previous months, the webcam showed constant emissions of steam and gas, with intermittent pulses of volcanic ash throughout the month.
Geologic Background. Sabancaya, located in the saddle NE of Ampato and SE of Hualca Hualca volcanoes, is the youngest of these volcanic centers and the only one to have erupted in historical time. The oldest of the three, Nevado Hualca Hualca, is of probable late-Pliocene to early Pleistocene age. The name Sabancaya (meaning "tongue of fire" in the Quechua language) first appeared in records in 1595 CE, suggesting activity prior to that date. Holocene activity has consisted of Plinian eruptions followed by emission of voluminous andesitic and dacitic lava flows, which form an extensive apron around the volcano on all sides but the south. Records of historical eruptions date back to 1750.
Information Contacts: Observatorio Volcanologico del INGEMMET, (Instituto Geológical Minero y Metalúrgico), Barrio Magisterial Nro. 2 B-16 Umacollo - Yanahuara Arequipa, Peru (URL: http://ovi.ingemmet.gob.pe); Instituto Geofisico del Peru, Observatoria Vulcanologico del Sur (IGP-OVS), Arequipa Regional Office, Urb La Marina B-19, Cayma, Arequipa, Peru (URL: http://ovs.igp.gob.pe/); Buenos Aires Volcanic Ash Advisory Center (VAAC), Servicio Meteorológico Nacional-Fuerza Aérea Argentina, 25 de mayo 658, Buenos Aires, Argentina (URL: http://www.smn.gov.ar/vaac/buenosaires/inicio.php); Hawai'i Institute of Geophysics and Planetology (HIGP) - MODVOLC Thermal Alerts System, School of Ocean and Earth Science and Technology (SOEST), Univ. of Hawai'i, 2525 Correa Road, Honolulu, HI 96822, USA (URL: http://modis.higp.hawaii.edu/); NASA Goddard Space Flight Center (NASA/GSFC), Global Sulfur Dioxide Monitoring Page, Atmospheric Chemistry and Dynamics Laboratory, 8800 Greenbelt Road, Goddard, Maryland, USA (URL: https://so2.gsfc.nasa.gov/).
San Cristobal (Nicaragua) — June 2018 Cite this Report
San Cristobal
Nicaragua
12.702°N, 87.004°W; summit elev. 1745 m
All times are local (unless otherwise noted)
Moderate explosion on 22 April 2018
Activity at the San Cristobal volcano complex during 2017 was characterized by numerous weak ash-and-gas explosions, a succession of strong ash-and-gas explosion on 18 August, and thousands of degassing events (BGVN 43:03). This report covers January through July 2018.
According to the Instituto Nicaragüense de Estudios Territoriales (INETER), at 1320 on 22 April a moderate explosion generated an ash-and-gas plume that rose 500-800 m (figure 38), causing ashfall in the Comarca La Bolsa (8 km SW) and Hacienda Las Rojas (3 km WSW) and Loma Las Brujas (2 km W).
INETER's April bulletin reported that the monthly averages of sulfur dioxide levels at San Cristobal during January through March 2018 ranged from 305-449 metric tons per day. On 22 April, the day of the explosion, levels reached 1903 tons. During the reporting period, MODIS satellite instruments using the MODVOLC algorithm recorded only two questionable thermal anomalies at San Cristobal. The MIROVA (Middle InfraRed Observation of Volcanic Activity) volcano hotspot detection system, also based on analysis of MODIS data, recorded numerous hotspots, but only one within 5 km of the volcano during January through July 2018. The latter one occurred during late March.
Geologic Background. The San Cristóbal volcanic complex, consisting of five principal volcanic edifices, forms the NW end of the Marrabios Range. The symmetrical 1745-m-high youngest cone, named San Cristóbal (also known as El Viejo), is Nicaragua's highest volcano and is capped by a 500 x 600 m wide crater. El Chonco, with several flank lava domes, is located 4 km W of San Cristóbal; it and the eroded Moyotepe volcano, 4 km NE of San Cristóbal, are of Pleistocene age. Volcán Casita, containing an elongated summit crater, lies immediately east of San Cristóbal and was the site of a catastrophic landslide and lahar in 1998. The Plio-Pleistocene La Pelona caldera is located at the eastern end of the complex. Historical eruptions from San Cristóbal, consisting of small-to-moderate explosive activity, have been reported since the 16th century. Some other 16th-century eruptions attributed to Casita volcano are uncertain and may pertain to other Marrabios Range volcanoes.
Information Contacts: Instituto Nicaragüense de Estudios Territoriales (INETER), Apartado Postal 2110, Managua, Nicaragua (URL: http://webserver2.ineter.gob.ni/vol/dep-vol.html); Hawai'i Institute of Geophysics and Planetology (HIGP) - MODVOLC Thermal Alerts System, School of Ocean and Earth Science and Technology (SOEST), Univ. of Hawai'i, 2525 Correa Road, Honolulu, HI 96822, USA (URL: http://modis.higp.hawaii.edu/); MIROVA (Middle InfraRed Observation of Volcanic Activity), a collaborative project between the Universities of Turin and Florence (Italy) supported by the Centre for Volcanic Risk of the Italian Civil Protection Department (URL: http://www.mirovaweb.it/).
San Miguel (El Salvador) — June 2018 Cite this Report
San Miguel
El Salvador
13.434°N, 88.269°W; summit elev. 2130 m
All times are local (unless otherwise noted)
Intermittent small ash emissions between 14 January and 30 May 2018
El Salvador's San Miguel, also known as Chaparrastique, had six small ash emission events during January 2015-June 2017 (BGVN 42:07). New activity consisting of intermittent ash emissions began on 14 January and continued until 30 May 2018, reported below based on information provided by El Salvador's Servicio Nacional de Estudios Territoriales (SNET) and special reports from the Ministero de Medio Ambiente y Recursos Naturales (MARN).
SNET and MARN reported that during 14-17 January 2018 there were four gas-and-ash emissions from San Miguel that rose no higher than 300 m above the crater rim, at least one of which dispersed SW. The reports noted that prior to each emission seismicity decreased and then suddenly increased. MARN reported that during 25-26 January seismic tremor levels fluctuated between 75 and 179 RSAM (Real-time Seismic Amplitude Measurement) units per hour on average, slightly above normal (50-150 units).
On 19 February, MARN reported the beginning of sustained gas emissions along with small ash emissions. The plume did not exceed 350 m above and was displaced by winds to the SW. This activity was similar to the activity on 14-15 January 2018.
SNET reported on 2 March that gas plumes rose as high as 400 m above the crater rim during the previous week. Ash appeared in "gas pulse" emissions on 24, 26, and 28 February, and 1 March. RSAM values fluctuated between 70 and 179 units during 1-2 March. At 2200 on 5 March seismic amplitude began to increase, with RSAM values rising to as high as 318 units by 0600 on 6 March. A webcam recorded minor gas emission during 5-6 March. MARN reported that RSAM values fluctuated between 68 and 248 units, with an average of 156 during 8-9 March. Continued volcanic tremor during 9-16 March was noted, along with persistent low-level degassing from the central crater. Volcanic tremor levels during 15-16 March fluctuated between 77 and 203 RSAM units per hour, with an average of 124.
By early April, MARN had noted a decrease in activity. On 3 April it reported that RSAM levels varied between 46 and 87 units, with an average of 55. Activity increased briefly during 7-13 April, and MARN reported that periodic microseisms combined with changes in seismic tremor and gas pulses had increased significantly, reaching maximum values of 400 RSAM units in an average hour (figure 25).
Discrete earthquakes were detected between 13 and 17 April, and discontinuous volcanic tremor during 17-18 April was associated with weak, sporadic degassing from the central crater. Seismicity reached maximum values of 216 RSAM units in an average hour.
MARN reported that during 20-27 April volcanic tremor fluctuated between 37 and 106 RSAM units per average hour. Seismicity was low during 28 April-4 May, with RSAM between 39 and 61 units per hour.
In May MARN reported that the volcanic activity had declined compared to April. As of 18 May there was no change in volcanic activity, despite the seismic swarm that started on the night of 5 May felt in the municipalities of Chirilagua-Intipucá, 30 km SE. Average SO2 emission rates were variable during 1 January-6 May 2018 (figure 26).
SNET reported a significant increase in the number of low- and high-frequency earthquakes beneath the crater beginning on 22 May. RSAM values fluctuated between 142 and 176 units during 30 May-1 June. Webcam images on 30 May showed a small gray gas emission.
Geologic Background. The symmetrical cone of San Miguel, one of the most active volcanoes in El Salvador, rises from near sea level to form one of the country's most prominent landmarks. A broad, deep, crater complex that has been frequently modified by eruptions recorded since the early 16th century caps the truncated unvegetated summit, also known locally as Chaparrastique. Flanks eruptions of the basaltic-andesitic volcano have produced many lava flows, including several during the 17th-19th centuries that extended to the N, NE, and SE. The SE-flank flows are the largest and form broad, sparsely vegetated lava fields crossed by highways and a railroad skirting the base of the volcano. Flank vent locations have migrated higher on the edifice during historical time, and the most recent activity has consisted of minor ash eruptions from the summit crater.
Information Contacts: Servicio Nacional de Estudios Territoriales (SNET), Ministero de Medio Ambiente y Recursos Naturales (MARN), Km. 5½ Carretera a Nueva San Salvador, Avenida las Mercedes, San Salvador, El Salvador (URL: http://www.snet.gob.sv/ver/vulcanologia, http://www.marn.gob.sv/category/avisos/vulcanologia/).