Recently Published Bulletin Reports
Manam (Papua New Guinea) Few ash plumes during November-December 2022
Krakatau (Indonesia) Strombolian activity and ash plumes during November 2022-April 2023
Stromboli (Italy) Strombolian explosions and lava flows continue during January-April 2023
Nishinoshima (Japan) Small ash plumes and fumarolic activity during November 2022 through April 2023
Karangetang (Indonesia) Lava flows, incandescent avalanches, and ash plumes during January-June 2023
Ahyi (United States) Intermittent hydroacoustic signals and discolored plumes during November 2022-June 2023
Kadovar (Papua New Guinea) An ash plume and weak thermal anomaly during May 2023
San Miguel (El Salvador) Small gas-and-ash explosions during March and May 2023
Ebeko (Russia) Continued explosions, ash plumes, and ashfall during October 2022-May 2023
Home Reef (Tonga) Discolored plumes continued during November 2022-April 2023
Semisopochnoi (United States) Occasional explosions, ash deposits, and gas-and-steam plumes during December 2022-May 2023
Ambae (Vanuatu) New lava flow, ash plumes, and sulfur dioxide plumes during February-May 2023
Manam (Papua New Guinea) — July 2023  Cite this Report
Manam
Papua New Guinea
4.08°S, 145.037°E; summit elev. 1807 m
All times are local (unless otherwise noted)
Few ash plumes during November-December 2022
Manam is a 10-km-wide island that consists of two active summit craters: the Main summit crater and the South summit crater and is located 13 km off the northern coast of mainland Papua New Guinea. Frequent mild-to-moderate eruptions have been recorded since 1616. The current eruption period began during June 2014 and has more recently been characterized by intermittent ash plumes and thermal activity (BGVN 47:11). This report updates activity that occurred from November 2022 through May 2023 based on information from the Darwin Volcanic Ash Advisory Center (VAAC) and various satellite data.
Ash plumes were reported during November and December 2022 by the Darwin VAAC. On 7 November an ash plume rose to 2.1 km altitude and drifted NE based on satellite images and weather models. On 14 November an ash plume rose to 2.1 km altitude and drifted W based on RVO webcam images. On 20 November ash plumes rose to 1.8 km altitude and drifted NW. On 26 December an ash plume rose to 3 km altitude and drifted S and SSE.
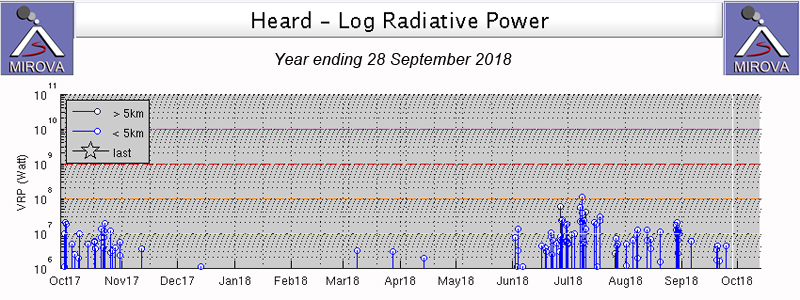
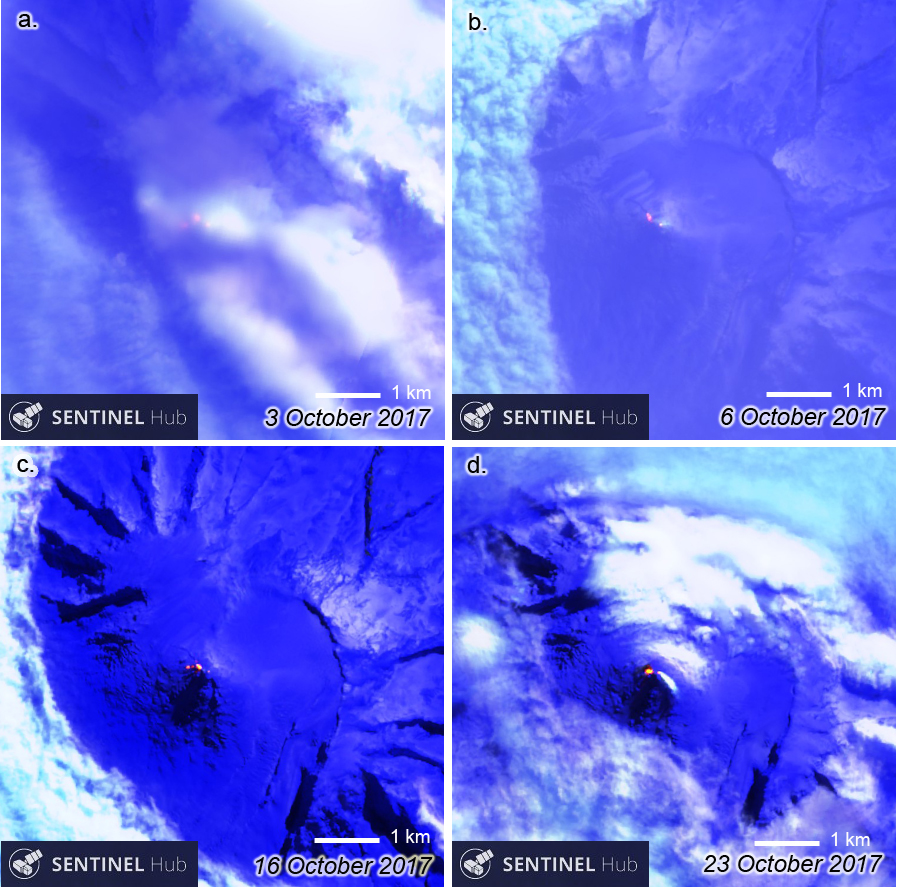
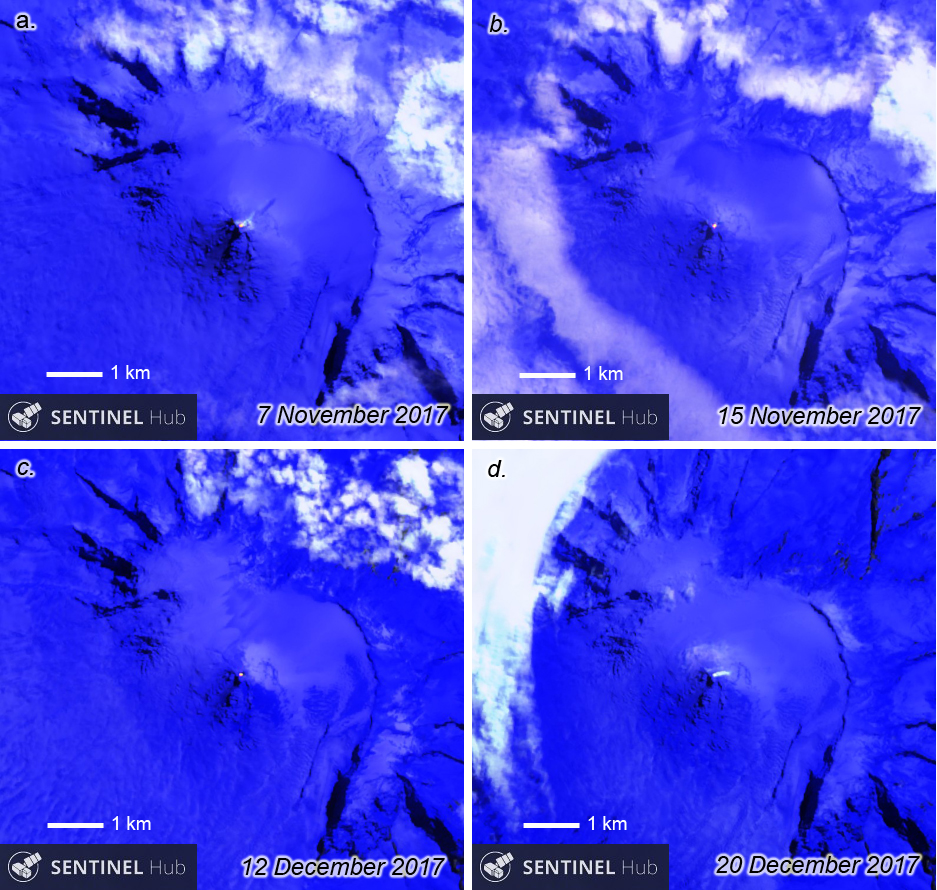
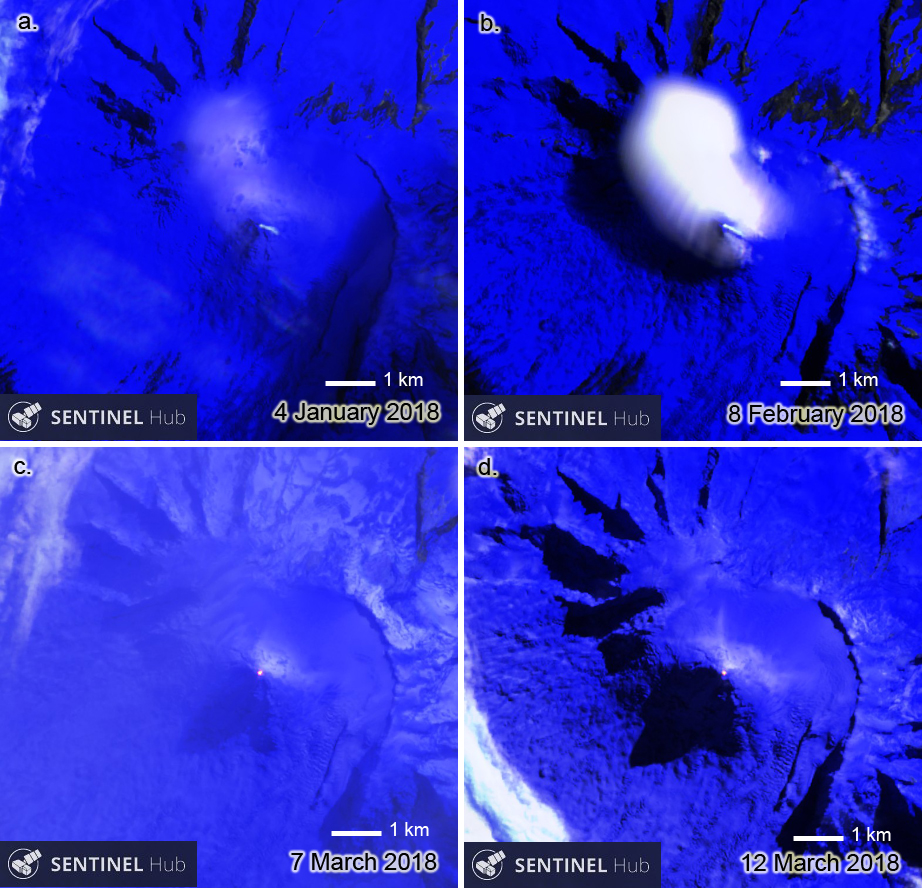
Intermittent sulfur dioxide plumes were detected using the TROPOMI instrument on the Sentinel-5P satellite, some of which exceeded at least two Dobson Units (DU) and drifted in different directions (figure 93). Occasional low-to-moderate power thermal anomalies were recorded by the MIROVA (Middle InfraRed Observation of Volcanic Activity) system; less than five anomalies were recorded each month during November 2022 through May 2023 (figure 94). Two thermal hotspots were detected by the MODVOLC thermal alerts system on 10 December 2022. On clear weather days, thermal activity was also captured in infrared satellite imagery in both the Main and South summit craters, accompanied by gas-and-steam emissions (figure 95).
Geologic Background. The 10-km-wide island of Manam, lying 13 km off the northern coast of mainland Papua New Guinea, is one of the country's most active volcanoes. Four large radial valleys extend from the unvegetated summit of the conical basaltic-andesitic stratovolcano to its lower flanks. These valleys channel lava flows and pyroclastic avalanches that have sometimes reached the coast. Five small satellitic centers are located near the island's shoreline on the northern, southern, and western sides. Two summit craters are present; both are active, although most observed eruptions have originated from the southern crater, concentrating eruptive products during much of the past century into the SE valley. Frequent eruptions, typically of mild-to-moderate scale, have been recorded since 1616. Occasional larger eruptions have produced pyroclastic flows and lava flows that reached flat-lying coastal areas and entered the sea, sometimes impacting populated areas.
Information Contacts: Rabaul Volcano Observatory (RVO), Geohazards Management Division, Department of Mineral Policy and Geohazards Management (DMPGM), PO Box 3386, Kokopo, East New Britain Province, Papua New Guinea; Darwin Volcanic Ash Advisory Centre (VAAC), Bureau of Meteorology, Northern Territory Regional Office, PO Box 40050, Casuarina, NT 0811, Australia (URL: http://www.bom.gov.au/info/vaac/); MIROVA (Middle InfraRed Observation of Volcanic Activity), a collaborative project between the Universities of Turin and Florence (Italy) supported by the Centre for Volcanic Risk of the Italian Civil Protection Department (URL: http://www.mirovaweb.it/); Hawai'i Institute of Geophysics and Planetology (HIGP) - MODVOLC Thermal Alerts System, School of Ocean and Earth Science and Technology (SOEST), Univ. of Hawai'i, 2525 Correa Road, Honolulu, HI 96822, USA (URL: http://modis.higp.hawaii.edu/); NASA Global Sulfur Dioxide Monitoring Page, Atmospheric Chemistry and Dynamics Laboratory, NASA Goddard Space Flight Center (NASA/GSFC), 8800 Greenbelt Road, Goddard, Maryland, USA (URL: https://so2.gsfc.nasa.gov/); Copernicus Browser, Copernicus Data Space Ecosystem, European Space Agency (URL: https://dataspace.copernicus.eu/browser/).
Krakatau (Indonesia) — July 2023 Cite this Report
Krakatau
Indonesia
6.1009°S, 105.4233°E; summit elev. 285 m
All times are local (unless otherwise noted)
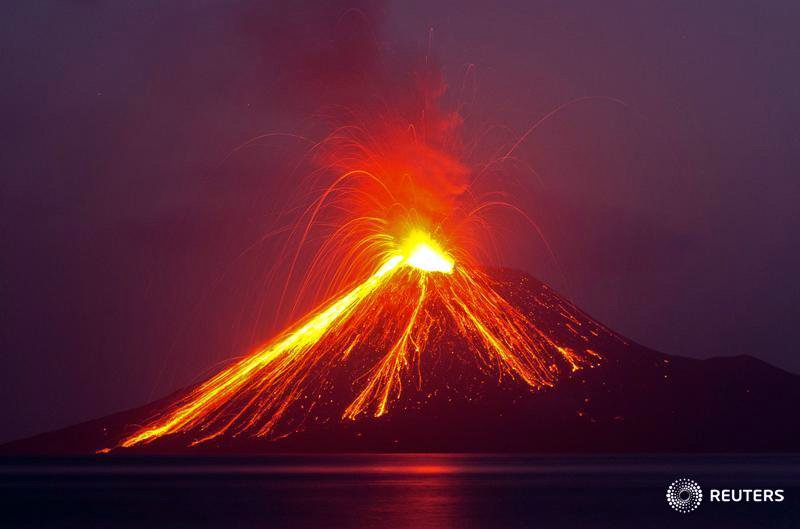
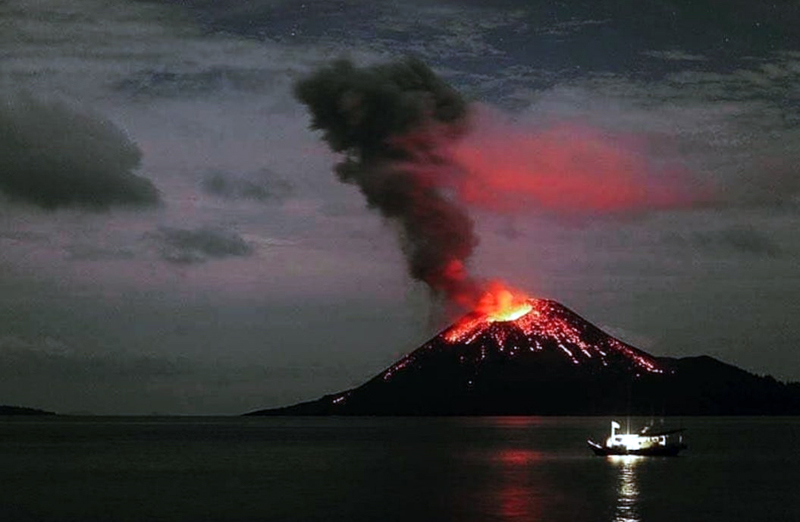
Strombolian activity and ash plumes during November 2022-April 2023
Krakatau is located in the Sunda Strait between Java and Sumatra, Indonesia. Caldera collapse during the catastrophic 1883 eruption destroyed Danan and Perbuwatan cones and left only a remnant of Rakata. The post-collapse cone of Anak Krakatau (Child of Krakatau) was constructed within the 1883 caldera at a point between the former Danan and Perbuwatan cones; it has been the site of frequent eruptions since 1927. The current eruption period began in May 2021 and has recently consisted of explosions, ash plumes, and thermal activity (BGVN 47:11). This report covers activity during November 2022 through April 2023 based on information provided by the Indonesian Center for Volcanology and Geological Hazard Mitigation, referred to as Pusat Vulkanologi dan Mitigasi Bencana Geologi (PVMBG), MAGMA Indonesia, the Darwin Volcanic Ash Advisory Center (VAAC), and several sources of satellite data.
Activity was relatively low during November and December 2022. Daily white gas-and-steam plumes rose 25-100 m above the summit and drifted in different directions. Gray ash plumes rose 200 m above the summit and drifted NE at 1047 and at 2343 on 11 November. On 14 November at 0933 ash plumes rose 300 m above the summit and drifted E. An ash plume was reported at 0935 on 15 December that rose 100 m above the summit and drifted NE. An eruptive event at 1031 later that day generated an ash plume that rose 700 m above the summit and drifted NE. A gray ash plume at 1910 rose 100 m above the summit and drifted E. Incandescent material was ejected above the vent based on an image taken at 1936.
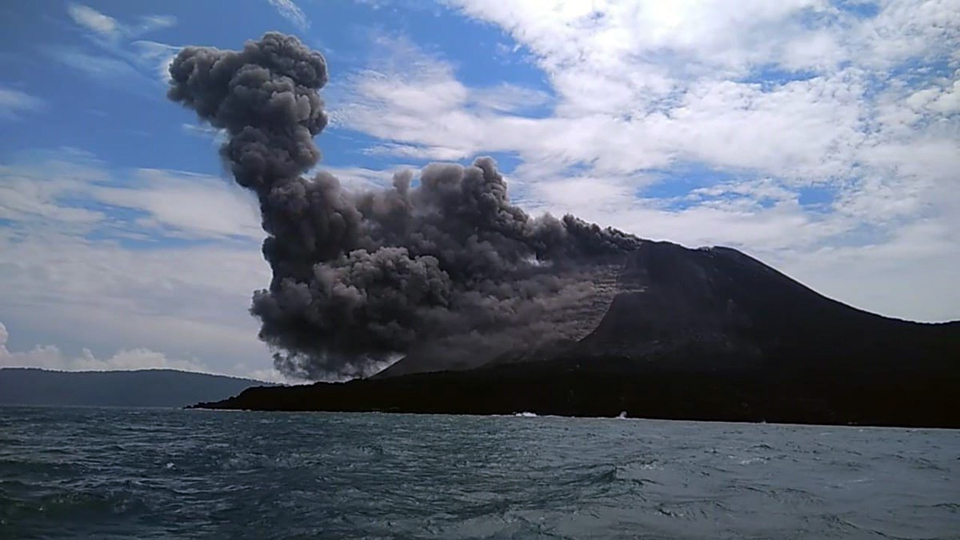
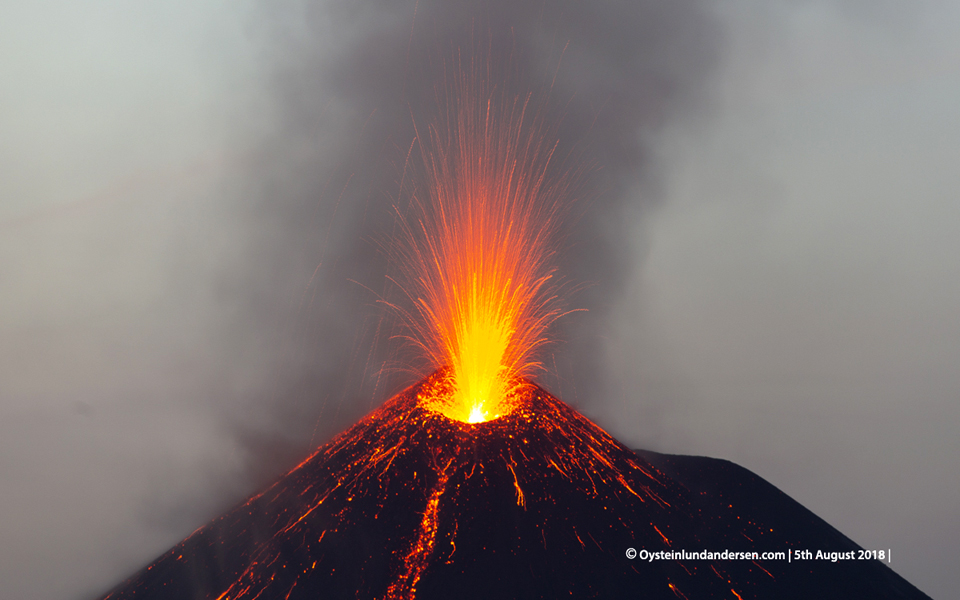
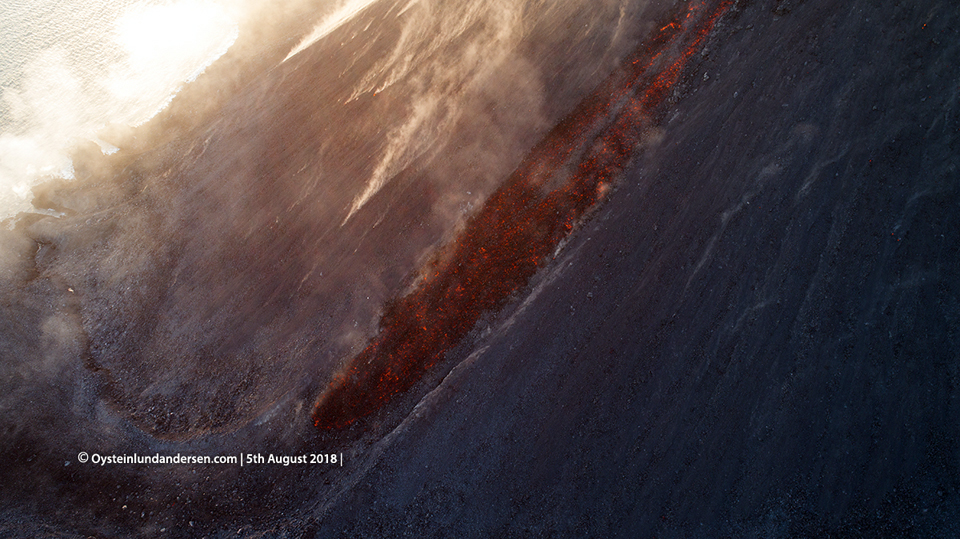
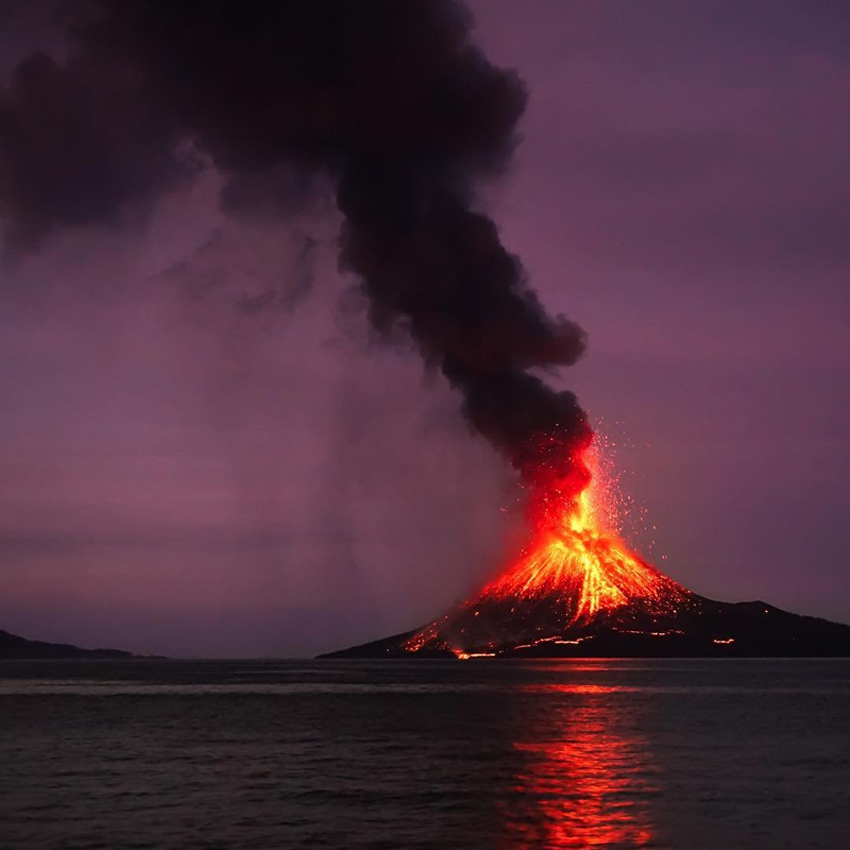
During January 2023 daily white gas-and-steam plumes rose 25-300 m above the summit and drifted in multiple directions. Gray-to-brown ash plumes were reported at 1638 on 3 January, at 1410 and 1509 on 4 January, and at 0013 on 5 January that rose 100-750 m above the summit and drifted NE and E; the gray-to-black ash plume at 1509 on 4 January rose as high as 3 km above the summit and drifted E. Gray ash plumes were recorded at 1754, 2241, and 2325 on 11 January and at 0046 on 12 January and rose 200-300 m above the summit and drifted NE. Toward the end of January, PVMBG reported that activity had intensified; Strombolian activity was visible in webcam images taken at 0041, 0043, and 0450 on 23 January. Multiple gray ash plumes throughout the day rose 200-500 m above the summit and drifted E and SE (figure 135). Webcam images showed progressively intensifying Strombolian activity at 1919, 1958, and 2113 on 24 January; a gray ash plume at 1957 rose 300 m above the summit and drifted E (figure 135). Eruptive events at 0231 and 2256 on 25 January and at 0003 on 26 January ejected incandescent material from the vent, based on webcam images. Gray ash plumes observed during 26-27 January rose 300-500 m above the summit and drifted NE, E, and SE.
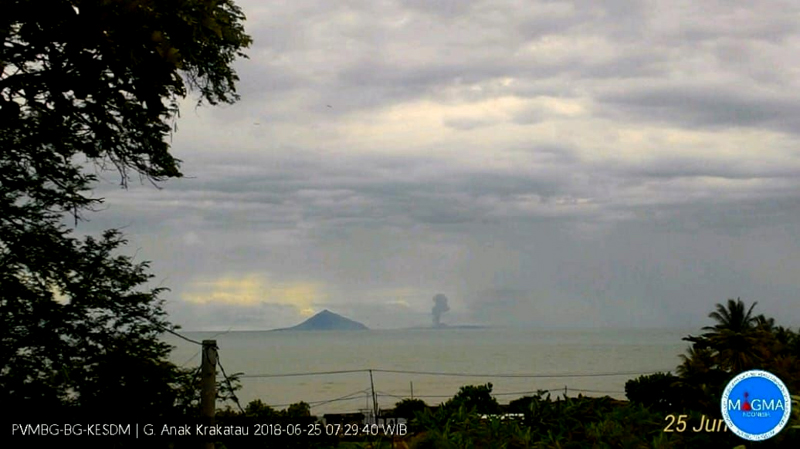
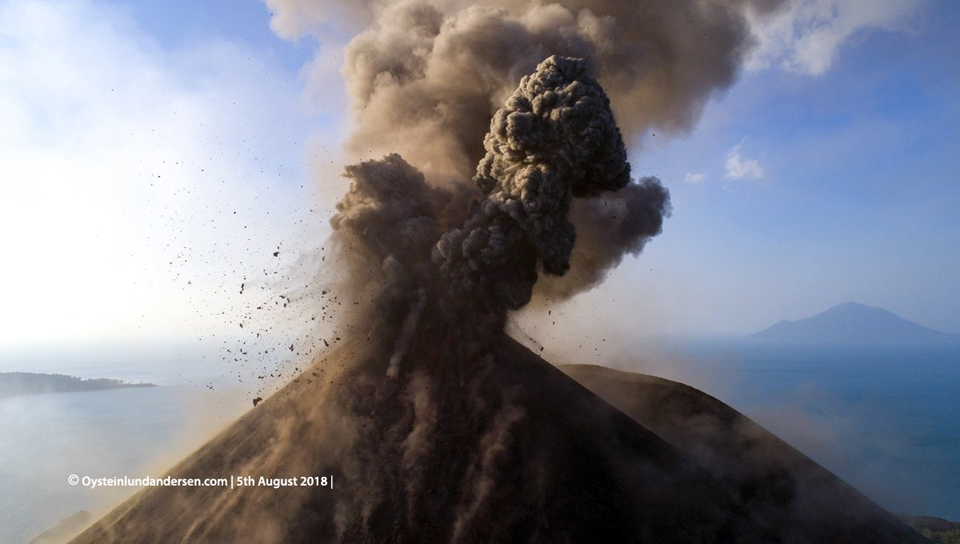
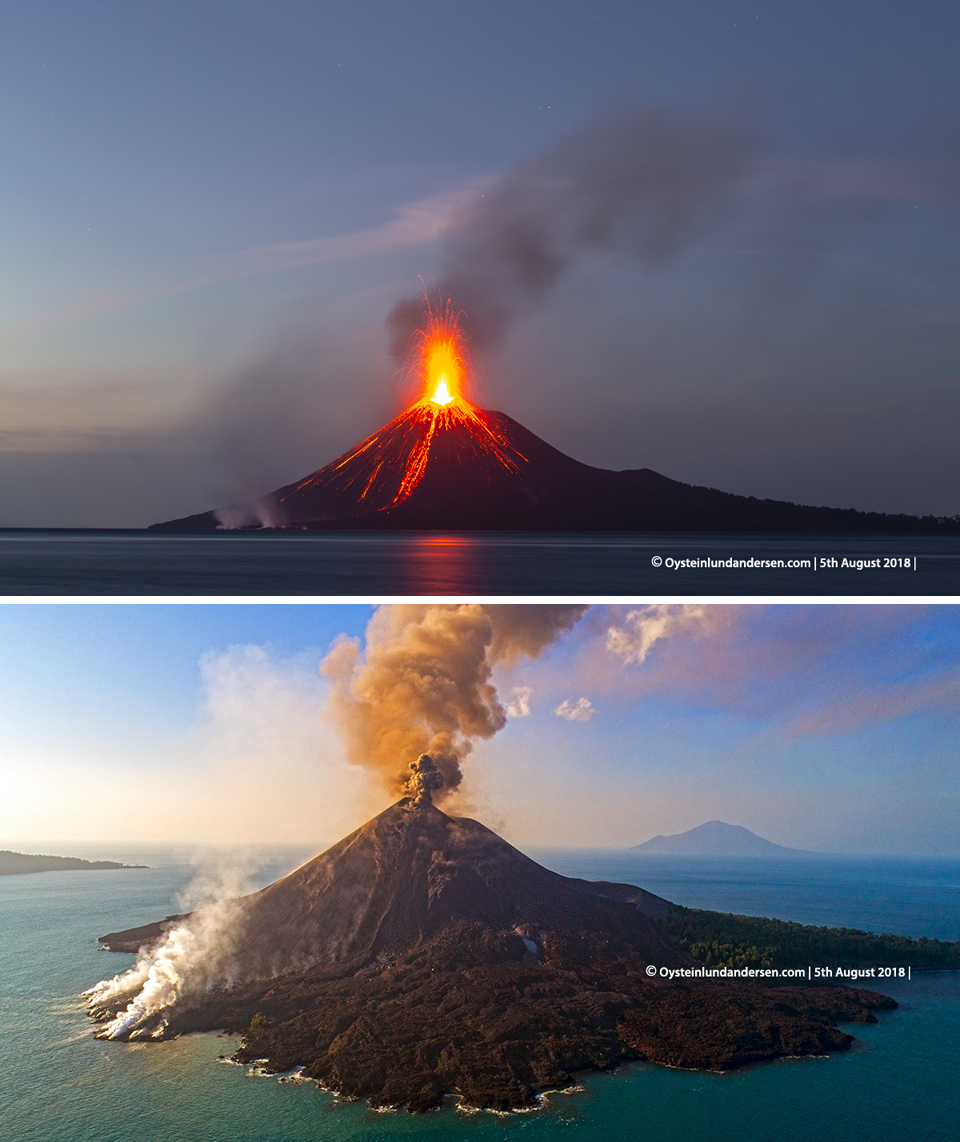
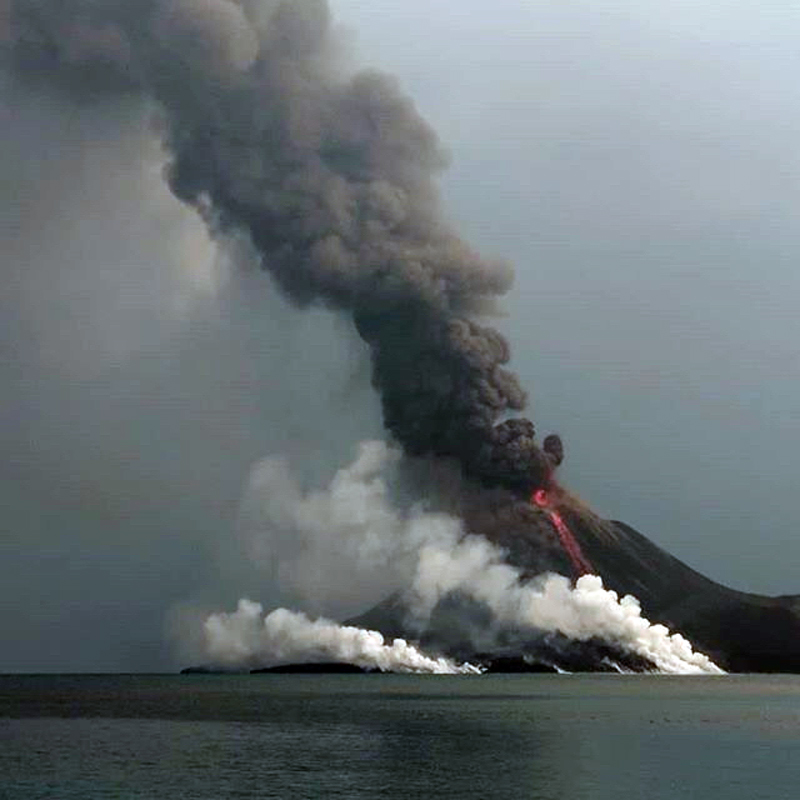
Low levels of activity were reported during February and March. Daily white gas-and-steam plumes rose 25-300 m above the summit and drifted in different directions. The Darwin VAAC reported that continuous ash emissions rose to 1.5-1.8 km altitude and drifted W and NW during 1240-1300 on 10 March, based on satellite images, weather models, and PVMBG webcams. White-and-gray ash plumes rose 500 m and 300 m above the summit and drifted SW at 1446 and 1846 on 18 March, respectively. An eruptive event was recorded at 2143, though it was not visible due to darkness. Multiple ash plumes were reported during 27-29 March that rose as high as 2.5 km above the summit and drifted NE, W, and SW (figure 136). Webcam images captured incandescent ejecta above the vent at 0415 and around the summit area at 2003 on 28 March and at 0047 above the vent on 29 March.
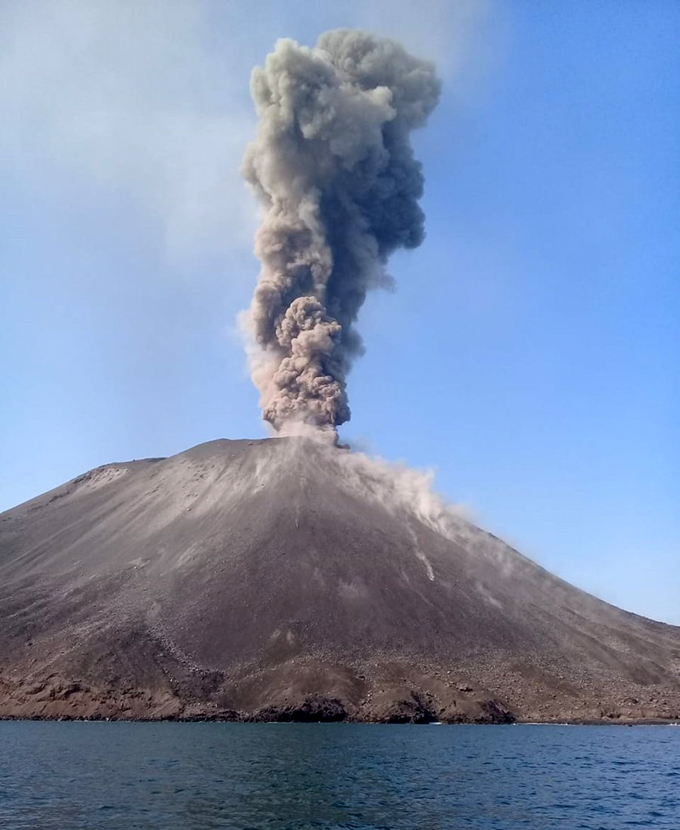
Daily white gas-and-steam plumes rose 25-300 m above the summit and drifted in multiple directions during April and May. White-and-gray and black plumes rose 50-300 m above the summit on 2 and 9 April. On 11 May at 1241 a gray ash plume rose 1-3 km above the summit and drifted SW. On 12 May at 0920 a gray ash plume rose 2.5 km above the summit and drifted SW and at 2320 an ash plume rose 1.5 km above the summit and drifted SW. An accompanying webcam image showed incandescent ejecta. On 13 May at 0710 a gray ash plume rose 2 km above the summit and drifted SW (figure 137).
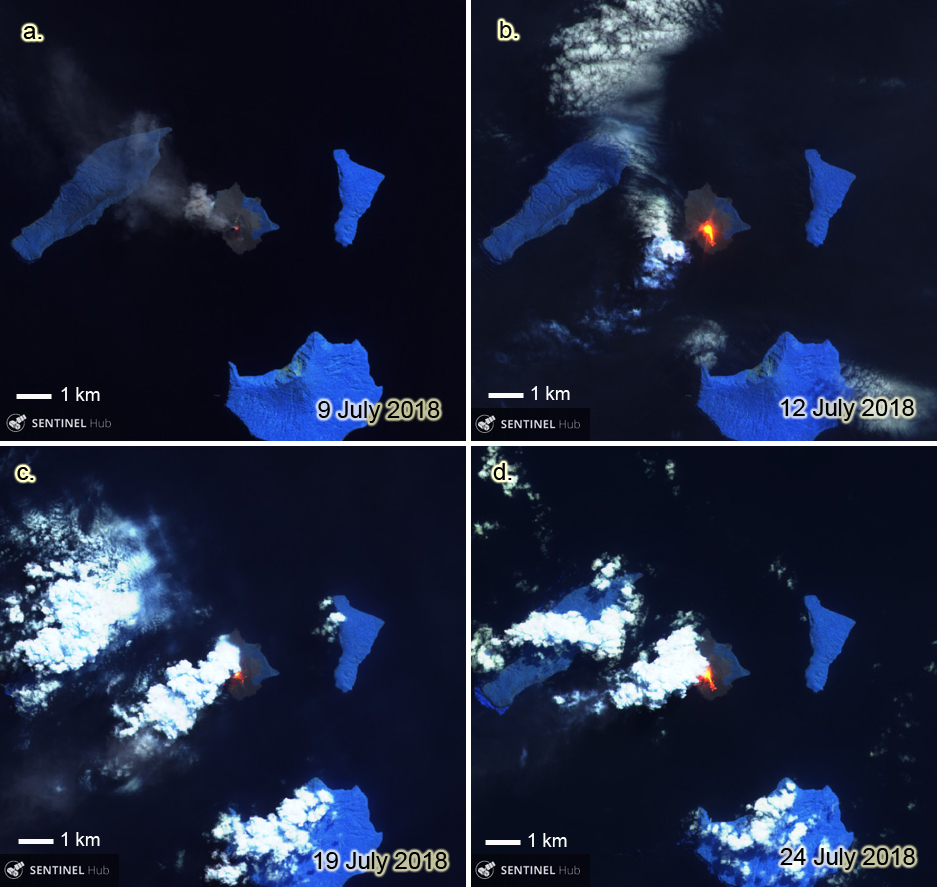
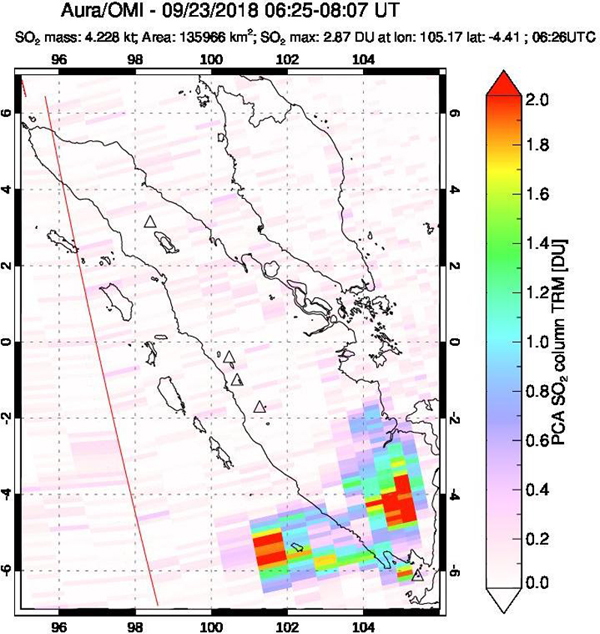
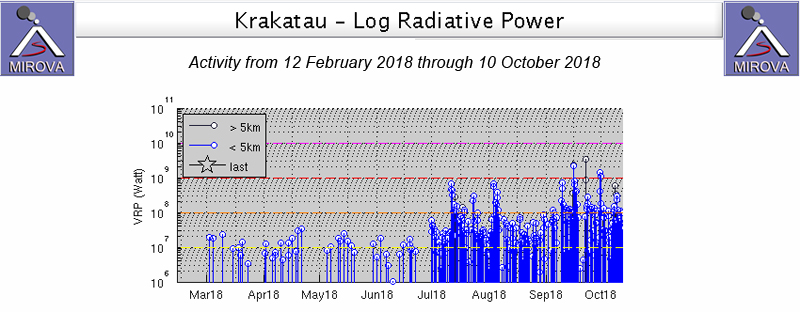
The MIROVA (Middle InfraRed Observation of Volcanic Activity) graph of MODIS thermal anomaly data showed intermittent low-to-moderate power thermal anomalies during November 2022 through April 2023 (figure 138). Some of this thermal activity was also visible in infrared satellite imagery at the crater, accompanied by gas-and-steam and ash plumes that drifted in different directions (figure 139).
Geologic Background. The renowned Krakatau (frequently mis-named as Krakatoa) volcano lies in the Sunda Strait between Java and Sumatra. Collapse of an older edifice, perhaps in 416 or 535 CE, formed a 7-km-wide caldera. Remnants of that volcano are preserved in Verlaten and Lang Islands; subsequently the Rakata, Danan, and Perbuwatan cones were formed, coalescing to create the pre-1883 Krakatau Island. Caldera collapse during the catastrophic 1883 eruption destroyed Danan and Perbuwatan, and left only a remnant of Rakata. This eruption caused more than 36,000 fatalities, most as a result of tsunamis that swept the adjacent coastlines of Sumatra and Java. Pyroclastic surges traveled 40 km across the Sunda Strait and reached the Sumatra coast. After a quiescence of less than a half century, the post-collapse cone of Anak Krakatau (Child of Krakatau) was constructed within the 1883 caldera at a point between the former Danan and Perbuwatan cones. Anak Krakatau has been the site of frequent eruptions since 1927.
Information Contacts: Pusat Vulkanologi dan Mitigasi Bencana Geologi (PVMBG, also known as Indonesian Center for Volcanology and Geological Hazard Mitigation, CVGHM), Jalan Diponegoro 57, Bandung 40122, Indonesia (URL: http://www.vsi.esdm.go.id/); MAGMA Indonesia, Kementerian Energi dan Sumber Daya Mineral (URL: https://magma.esdm.go.id/v1); Darwin Volcanic Ash Advisory Centre (VAAC), Bureau of Meteorology, Northern Territory Regional Office, PO Box 40050, Casuarina, NT 0811, Australia (URL: http://www.bom.gov.au/info/vaac/); MIROVA (Middle InfraRed Observation of Volcanic Activity), a collaborative project between the Universities of Turin and Florence (Italy) supported by the Centre for Volcanic Risk of the Italian Civil Protection Department (URL: http://www.mirovaweb.it/); Copernicus Browser, Copernicus Data Space Ecosystem, European Space Agency (URL: https://dataspace.copernicus.eu/browser/).
Stromboli
Italy
38.789°N, 15.213°E; summit elev. 924 m
All times are local (unless otherwise noted)
Strombolian explosions and lava flows continue during January-April 2023
Stromboli, located in Italy, has exhibited nearly constant lava fountains for the past 2,000 years; recorded eruptions date back to 350 BCE. Eruptive activity occurs at the summit from multiple vents, which include a north crater area (N area) and a central-southern crater (CS area) on a terrace known as the ‘terrazza craterica’ at the head of the Sciara del Fuoco, a large scarp that runs from the summit down the NW side of the volcano-island. Activity typically consists of Strombolian explosions, incandescent ejecta, lava flows, and pyroclastic flows. Thermal and visual monitoring cameras are located on the nearby Pizzo Sopra La Fossa, above the terrazza craterica, and at multiple flank locations. The current eruption period has been ongoing since 1934 and recent activity has consisted of frequent Strombolian explosions and lava flows (BGVN 48:02). This report updates activity during January through April 2023 primarily characterized by Strombolian explosions and lava flows based on reports from Italy's Istituto Nazionale di Geofisica e Vulcanologia (INGV) and various satellite data.
Frequent explosive activity continued throughout the reporting period, generally in the low-to-medium range, based on the number of hourly explosions in the summit crater (figure 253, table 16). Intermittent thermal activity was recorded by the MIROVA (Middle InfraRed Observation of Volcanic Activity) analysis of MODIS satellite data (figure 254). According to data collected by the MODVOLC thermal algorithm, a total of 9 thermal alerts were detected: one on 2 January 2023, one on 1 February, five on 24 March, and two on 26 March. The stronger pulses of thermal activity likely reflected lava flow events. Infrared satellite imagery captured relatively strong thermal hotspots at the two active summit craters on clear weather days, showing an especially strong event on 8 March (figure 255).
Table 16. Summary of type, frequency, and intensity of explosive activity at Stromboli by month during January-April 2023; information from webcam observations. Courtesy of INGV weekly reports.
| Month |
Explosive Activity |
| Jan 2023 |
Typical Strombolian activity with spattering and lava overflows in the N crater area. Explosions were reported from 4 vents in the N area and 1-2 vents in the CS area. The average hourly frequency of explosions was low-to-medium (1-12 events/hour). The intensity of the explosions varied from low (less than 80 m high) to medium (less than 150 m high) in the N crater area and up to high (greater than 150 m high) in the CS crater area. |
| Feb 2023 |
Typical Strombolian activity with spattering in the N crater area. Explosions were reported from 2-3 vents in the N area and 1-4 vents in the CS area. The average hourly frequency of explosions was low-to-medium (1-14 events/hour). The intensity of the explosions varied from low (less than 80 m high) to medium (less than 150 m high) in the N crater area and up to high (greater than 150 m high) in the CS crater area. |
| Mar 2023 |
Typical Strombolian activity with spattering and lava overflows in the N crater area. Explosions were reported from 2-3 vents in the N area and 2-4 vents in the CS area. The average hourly frequency of explosions was low-to-medium (1-18 events/hour). The intensity of the explosions varied from low (less than 80 m high) to medium (less than 150 m high) in the N crater area and up to high (greater than 150 m high) in the CS crater area. |
| Apr 2023 |
Typical Strombolian activity. Explosions were reported from 2 vents in the N area and 2-3 vents in the CS area. The average hourly frequency of explosions was low-to-high (1-16 events/hour). The intensity of the explosions varied from low (less than 80 m high) to medium (less than 150 m high) in both the N and CS crater areas. |
Activity during January-February 2023. Strombolian explosions were reported in the N crater area, as well as lava effusion. Explosive activity in the N crater area ejected coarse material (bombs and lapilli). Intense spattering was observed in both the N1 and N2 craters. In the CS crater area, explosions generally ejected fine material (ash), sometimes to heights greater than 250 m. The intensity of the explosions was characterized as low-to-medium in the N crater and medium-to-high in the CS crater. After intense spattering activity from the N crater area, a lava overflow began at 2136 on 2 January that flowed part way down the Sciara del Fuoco, possibly moving down the drainage that formed in October, out of view from webcams. The flow remained active for a couple of hours before stopping and beginning to cool. A second lava flow was reported at 0224 on 4 January that similarly remained active for a few hours before stopping and cooling. Intense spattering was observed on 11 and 13 January from the N1 crater. After intense spattering activity at the N2 crater at 1052 on 17 January another lava flow started to flow into the upper part of the Sciara del Fuoco (figure 256), dividing into two: one that traveled in the direction of the drainage formed in October, and the other one moving parallel to the point of emission. By the afternoon, the rate of the flow began to decrease, and at 1900 it started to cool. A lava flow was reported at 1519 on 24 January following intense spattering in the N2 area, which began to flow into the upper part of the Sciara del Fuoco. By the morning of 25 January, the lava flow had begun to cool. During 27 January the frequency of eruption in the CS crater area increased to 6-7 events/hour compared to the typical 1-7 events/hour; the following two days showed a decrease in frequency to less than 1 event/hour. Starting at 1007 on 30 January a high-energy explosive sequence was produced by vents in the CS crater area. The sequence began with an initial energetic pulse that lasted 45 seconds, ejecting predominantly coarse products 300 m above the crater that fell in an ESE direction. Subsequent and less intense explosions ejected material 100 m above the crater. The total duration of this event lasted approximately two minutes. During 31 January through 6, 13, and 24 February spattering activity was particularly intense for short periods in the N2 crater.
An explosive sequence was reported on 16 February that was characterized by a major explosion in the CS crater area (figure 257). The sequence began at 1817 near the S2 crater that ejected material radially. A few seconds later, lava fountains were observed in the central part of the crater. Three explosions of medium intensity (material was ejected less than 150 m high) were recorded at the S2 crater. The first part of this sequence lasted approximately one minute, according to INGV, and material rose 300 m above the crater and then was deposited along the Sciara del Fuoco. The second phase began at 1818 at the S1 crater; it lasted seven seconds and material was ejected 150 m above the crater. Another event 20 seconds later lasted 12 seconds, also ejecting material 150 m above the crater. The sequence ended with at least three explosions of mostly fine material from the S1 crater. The total duration of this sequence was about two minutes.
Short, intense spattering activity was noted above the N1 crater on 27 and 28 February. A lava overflow was first reported at 0657 from the N2 crater on 27 February that flowed into the October 2022 drainage. By 1900 the flow had stopped. A second lava overflow also in the N crater area occurred at 2149, which overlapped the first flow and then stopped by 0150 on 28 February. Material detached from both the lava overflows rolled down the Sciara del Fuoco, some of which was visible in webcam images.
Activity during March-April 2023. Strombolian activity continued with spattering activity and lava overflows in the N crater area during March. Explosive activity at the N crater area varied from low (less than 80 m high) to medium (less than 150 m high) and ejected coarse material, such as bombs and lapilli. Spattering was observed above the N1 crater, while explosive activity at the CS crater area varied from medium to high (greater than 150 m high) and ejected coarse material. Intense spattering activity was observed for short periods on 6 March above the N1 crater. At approximately 0610 a lava overflow was reported around the N2 crater on 8 March, which then flowed into the October 2022 drainage. By 1700 the flow started to cool. A second overflow began at 1712 on 9 March and overlapped the previous flow. It had stopped by 2100. Material from both flows was deposited along the Sciara del Fuoco, though much of the activity was not visible in webcam images. On 11 March a lava overflow was observed at 0215 that overlapped the two previous flows in the October 2022 drainage. By late afternoon on 12 March, it had stopped.
During a field excursion on 16 March, scientists noted that a vent in the central crater area was degassing. Another vent showed occasional Strombolian activity that emitted ash and lapilli. During 1200-1430 low-to-medium intense activity was reported; the N1 crater emitted ash emissions and the N2 crater emitted both ash and coarse material. Some explosions also occurred in the CS crater area that ejected coarse material. The C crater in the CS crater area occasionally showed gas jetting and low intensity explosions on 17 and 22 March; no activity was observed at the S1 crater. Intense, longer periods of spattering were reported in the N1 crater on 19, 24, and 25 March. Around 2242 on 23 March a lava overflow began from the N1 crater that, after about an hour, began moving down the October 2022 drainage and flow along the Sciara del Fuoco (figure 258). Between 0200 and 0400 on 26 March the flow rate increased, which generated avalanches of material from collapses at the advancing flow front. By early afternoon, the flow began to cool. On 25 March at 1548 an explosive sequence began from one of the vents at S2 in the CS crater area (figure 258). Fine ash mixed with coarse material was ejected 300 m above the crater rim and drifted SSE. Some modest explosions around Vent C were detected at 1549 on 25 March, which included an explosion at 1551 that ejected coarse material. The entire explosive sequence lasted approximately three minutes.
During April explosions persisted in both the N and CS crater areas. Fine material was ejected less than 80 m above the N crater rim until 6 April, followed by ejection of coarser material. Fine material was also ejected less than 80 m above the CS crater rim. The C and S2 crater did not show significant eruptive activity. On 7 April an explosive sequence was detected in the CS crater area at 1203 (figure 259). The first explosion lasted approximately 18 seconds and ejected material 400 m above the crater rim, depositing pyroclastic material in the upper part of the Sciara del Fuoco. At 1204 a second, less intense explosion lasted approximately four seconds and deposited pyroclastic products outside the crater area and near Pizzo Sopra La Fossa. A third explosion at 1205 was mainly composed of ash that rose about 150 m above the crater and lasted roughly 20 seconds. A fourth explosion occurred at 1205 about 28 seconds after the third explosion and ejected a mixture of coarse and fine material about 200 m above the crater; the explosion lasted roughly seven seconds. Overall, the entire explosive sequence lasted about two minutes and 20 seconds. After the explosive sequence on 7 April, explosions in both the N and CS crater areas ejected material as high as 150 m above the crater.
On 21 April research scientists from INGV made field observations in the summit area of Stromboli, and some lapilli samples were collected. In the N crater area near the N1 crater, a small cone was observed with at least two active vents, one of which was characterized by Strombolian explosions. The other vent produced explosions that ejected ash and chunks of cooled lava. At the N2 crater at least one vent was active and frequently emitted ash. In the CS crater area, a small cone contained 2-3 degassing vents and a smaller, possible fissure area also showed signs of degassing close to the Pizzo Sopra La Fossa. In the S part of the crater, three vents were active: a small hornito was characterized by modest and rare explosions, a vent that intermittently produced weak Strombolian explosions, and a vent at the end of the terrace that produced frequent ash emissions. Near the S1 crater there was a hornito that generally emitted weak gas-and-steam emissions, sometimes associated with “gas rings”. On 22 April another field inspection was carried out that reported two large sliding surfaces on the Sciara del Fuoco that showed where blocks frequently descended toward the sea. A thermal anomaly was detected at 0150 on 29 April.
Geologic Background. Spectacular incandescent nighttime explosions at Stromboli have long attracted visitors to the "Lighthouse of the Mediterranean" in the NE Aeolian Islands. This volcano has lent its name to the frequent mild explosive activity that has characterized its eruptions throughout much of historical time. The small island is the emergent summit of a volcano that grew in two main eruptive cycles, the last of which formed the western portion of the island. The Neostromboli eruptive period took place between about 13,000 and 5,000 years ago. The active summit vents are located at the head of the Sciara del Fuoco, a prominent scarp that formed about 5,000 years ago due to a series of slope failures which extends to below sea level. The modern volcano has been constructed within this scarp, which funnels pyroclastic ejecta and lava flows to the NW. Essentially continuous mild Strombolian explosions, sometimes accompanied by lava flows, have been recorded for more than a millennium.
Information Contacts: Istituto Nazionale di Geofisica e Vulcanologia (INGV), Sezione di Catania, Piazza Roma 2, 95123 Catania, Italy, (URL: http://www.ct.ingv.it/en/); MIROVA (Middle InfraRed Observation of Volcanic Activity), a collaborative project between the Universities of Turin and Florence (Italy) supported by the Centre for Volcanic Risk of the Italian Civil Protection Department (URL: http://www.mirovaweb.it/); Hawai'i Institute of Geophysics and Planetology (HIGP) - MODVOLC Thermal Alerts System, School of Ocean and Earth Science and Technology (SOEST), Univ. of Hawai'i, 2525 Correa Road, Honolulu, HI 96822, USA (URL: http://modis.higp.hawaii.edu/); Copernicus Browser, Copernicus Data Space Ecosystem, European Space Agency (URL: https://dataspace.copernicus.eu/browser/).
Nishinoshima (Japan) — July 2023 Cite this Report
Nishinoshima
Japan
27.247°N, 140.874°E; summit elev. 100 m
All times are local (unless otherwise noted)
Small ash plumes and fumarolic activity during November 2022 through April 2023
Nishinoshima is a small island located about 1,000 km S of Tokyo in the Ogasawara Arc in Japan. The island is the summit of a massive submarine volcano that has prominent peaks to the S, W, and NE. Eruptions date back to 1973; the most recent eruption period began in October 2022 and was characterized by ash plumes and fumarolic activity (BGVN 47:12). This report describes ash plumes and fumarolic activity during November 2022 through April 2023 based on monthly reports from the Japan Meteorological Agency (JMA) monthly reports and satellite data.
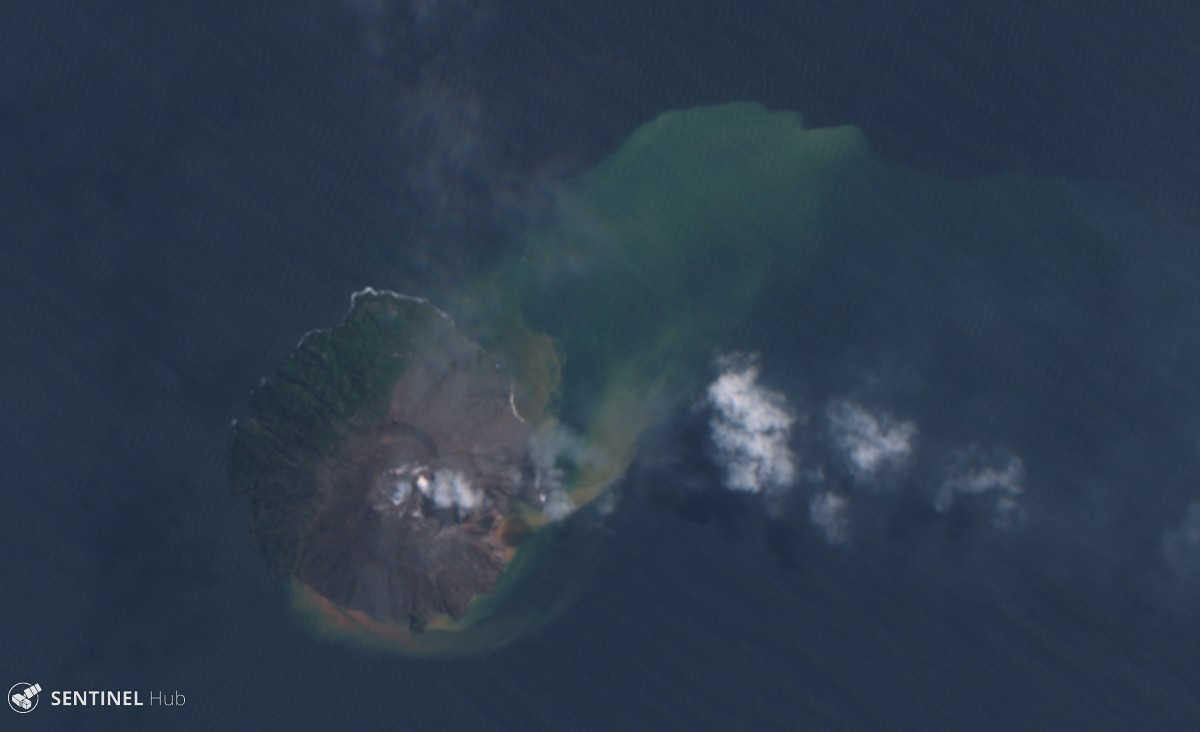
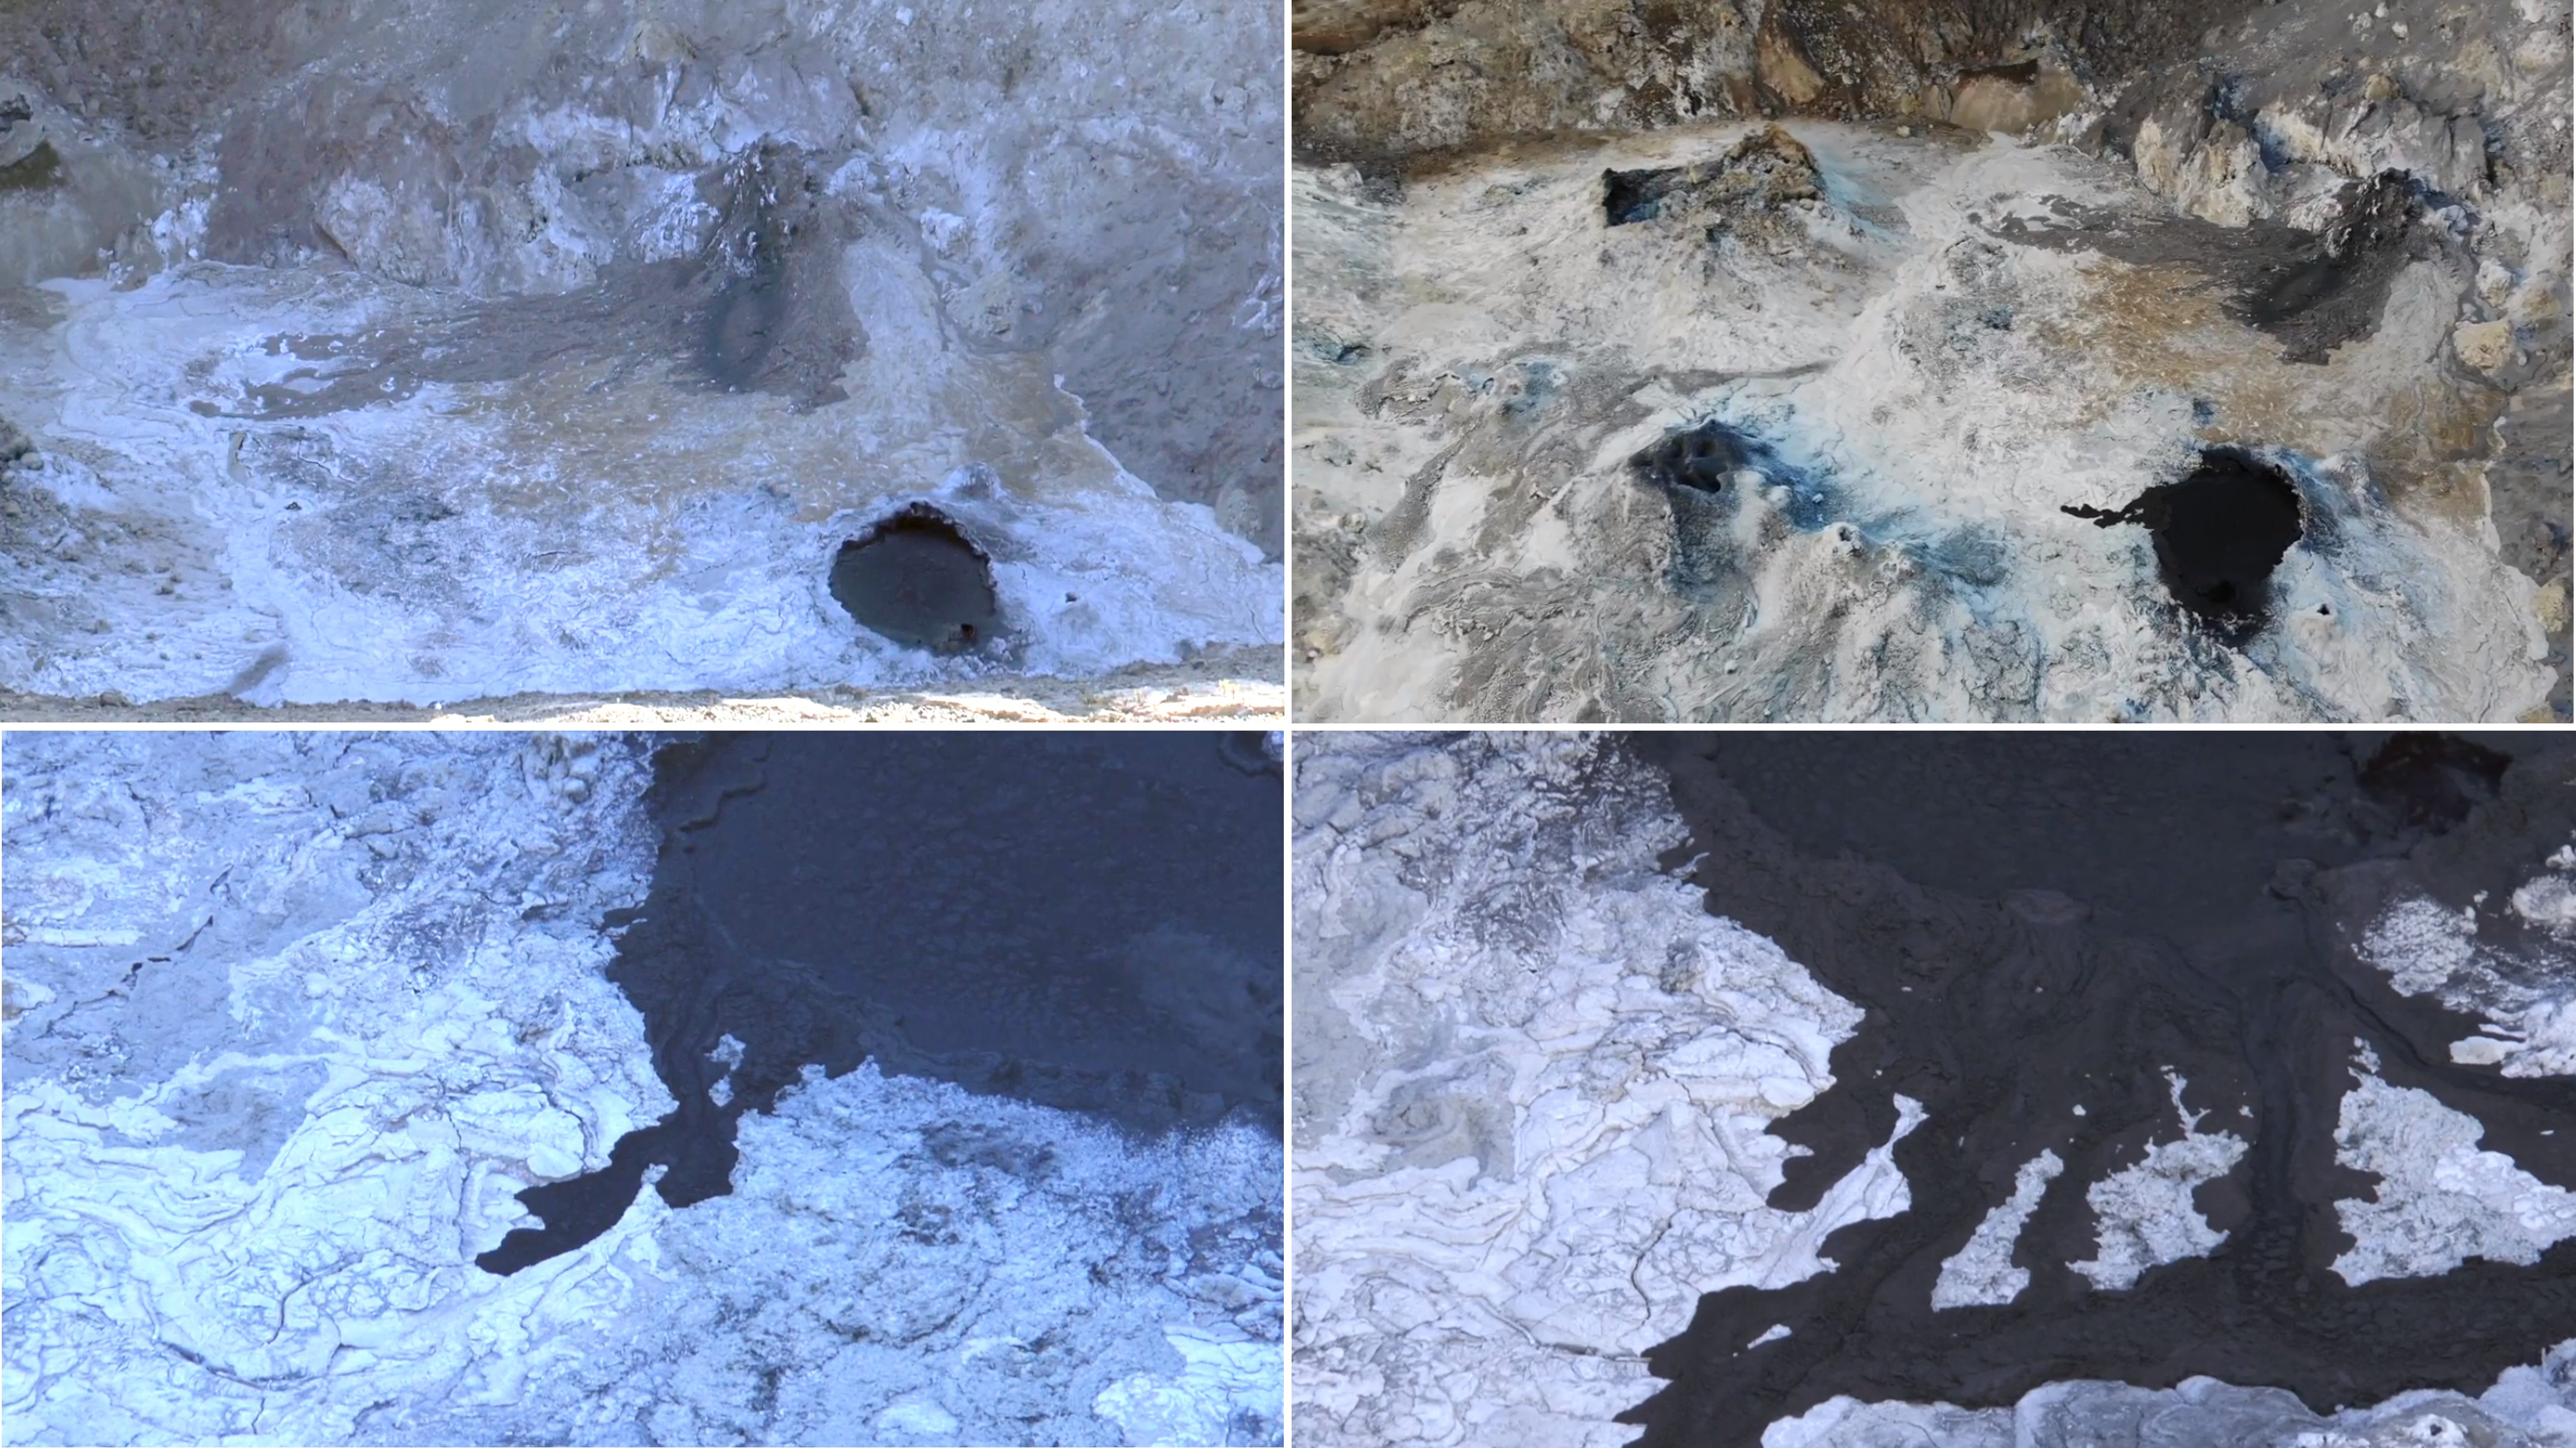
The most recent eruptive activity prior to the reporting internal occurred on 12 October 2022, when an ash plume rose 3.5 km above the crater rim. An aerial observation conducted by the Japan Coast Guard (JCG) on 25 November reported that white fumaroles rose approximately 200 m above the central crater of a pyroclastic cone (figure 119), and multiple plumes were observed on the ESE flank of the cone. Discolored water ranging from reddish-brown to brown and yellowish-green were visible around the perimeter of the island (figure 119). No significant activity was reported in December.
During an overflight conducted by JCG on 25 January 2023 intermittent activity and small, blackish-gray plumes rose 900 m above the central part of the crater were observed (figure 120). The fumarolic zone of the E flank and base of the cone had expanded and emissions had intensified. Dark brown discolored water was visible around the perimeter of the island.
No significant activity was reported during February through March. Ash plumes at 1050 and 1420 on 11 April rose 1.9 km above the crater rim and drifted NW and N. These were the first ash plumes observed since 12 October 2022. On 14 April JCG carried out an overflight and reported that no further eruptive activity was visible, although white gas-and-steam plumes were visible from the central crater and rose 900 m high (figure 121). Brownish and yellow-green discolored water surrounded the island.
Intermittent low-to-moderate power thermal anomalies were recorded in the MIROVA graph (Middle InfraRed Observation of Volcanic Activity) during November 2022 through April 2023 (figure 123). A cluster of six to eight anomalies were detected during November while a smaller number were detected during the following months: two to three during December, one during mid-January 2023, one during February, five during March, and two during April. Thermal activity was also reflected in infrared satellite data at the summit crater, accompanied by occasional gas-and-steam plumes (figure 124).
Geologic Background. The small island of Nishinoshima was enlarged when several new islands coalesced during an eruption in 1973-74. Multiple eruptions that began in 2013 completely covered the previous exposed surface and continued to enlarge the island. The island is the summit of a massive submarine volcano that has prominent peaks to the S, W, and NE. The summit of the southern cone rises to within 214 m of the ocean surface 9 km SSE.
Information Contacts: Japan Meteorological Agency (JMA), 1-3-4 Otemachi, Chiyoda-ku, Tokyo 100-8122, Japan (URL: http://www.jma.go.jp/jma/indexe.html); MIROVA (Middle InfraRed Observation of Volcanic Activity), a collaborative project between the Universities of Turin and Florence (Italy) supported by the Centre for Volcanic Risk of the Italian Civil Protection Department (URL: http://www.mirovaweb.it/); Copernicus Browser, Copernicus Data Space Ecosystem, European Space Agency (URL: https://dataspace.copernicus.eu/browser/).
Karangetang (Indonesia) — July 2023 Cite this Report
Karangetang
Indonesia
2.781°N, 125.407°E; summit elev. 1797 m
All times are local (unless otherwise noted)
Lava flows, incandescent avalanches, and ash plumes during January-June 2023
Karangetang (also known as Api Siau), at the northern end of the island of Siau, Indonesia, contains five summit craters along a N-S line. More than 40 eruptions have been recorded since 1675; recent eruptions have included frequent explosive activity, sometimes accompanied by pyroclastic flows and lahars. Lava dome growth has occurred in the summit craters and collapses of lava flow fronts have produced pyroclastic flows. The two active summit craters are Kawah Dua (the N crater) and Kawah Utama (the S crater, also referred to as the “Main Crater”). The most recent eruption began in late November 2018 and has more recently consisted of weak thermal activity and gas-and-steam emissions (BGVN 48:01). This report updates activity characterized by lava flows, incandescent avalanches, and ash plumes during January through June 2023 using reports from Pusat Vulkanologi dan Mitigasi Bencana Geologi (PVMBG, also known as CVGHM, or the Center of Volcanology and Geological Hazard Mitigation), MAGMA Indonesia, the Darwin VAAC (Volcano Ash Advisory Center), and satellite data.
Activity during January was relatively low and mainly consisted of white gas-and-steam emissions that rose 25-150 m above Main Crater (S crater) and drifted in different directions. Incandescence was visible from the lava dome in Kawah Dua (the N crater). Weather conditions often prevented clear views of the summit. On 18 January the number of seismic signals that indicated avalanches of material began to increase. In addition, there were a total of 71 earthquakes detected during the month.
Activity continued to increase during the first week of February. Material from Main Crater traveled as far as 800 m down the Batuawang (S) and Batang (W) drainages and as far as 1 km W down the Beha (W) drainage on 4 February. On 6 February 43 earthquake events were recorded, and on 7 February, 62 events were recorded. White gas-and-steam emissions rose 25-250 m above both summit craters throughout the month. PVMBG reported an eruption began during the evening of 8 February around 1700. Photos showed incandescent material at Main Crater. Incandescent material had also descended the flank in at least two unconfirmed directions as far as 2 km from Main Crater, accompanied by ash plumes (figure 60). As a result, PVMBG increased the Volcano Alert Level (VAL) to 3 (the second highest level on a 1-4 scale).
Occasional nighttime webcam images showed three main incandescent lava flows of differing lengths traveling down the S, SW, and W flanks (figure 61). Incandescent rocks were visible on the upper flanks, possibly from ejected or collapsed material from the crater, and incandescence was the most intense at the summit. Based on analyses of satellite imagery and weather models, the Darwin VAAC reported that daily ash plumes during 16-20 February rose to 2.1-3 km altitude and drifted NNE, E, and SE. BNPB reported on 16 February that as many as 77 people were evacuated and relocated to the East Siau Museum. A webcam image taken at 2156 on 17 February possibly showed incandescent material descending the SE flank. Ash plumes rose to 2.1 km altitude and drifted SE during 22-23 February, according to the Darwin VAAC.
Incandescent avalanches of material and summit incandescence at Main Crater continued during March. White gas-and-steam emissions during March generally rose 25-150 m above the summit crater; on 31 March gas-and-steam emissions rose 200-400 m high. An ash plume rose to 2.4 km altitude and drifted S at 1710 on 9 March and a large thermal anomaly was visible in images taken at 0550 and 0930 on 10 March. Incandescent material was visible at the summit and on the flanks based on webcam images taken at 0007 and 2345 on 16 March, at 1828 on 17 March, at 1940 on 18 March, at 2311 on 19 March, and at 2351 on 20 March. Incandescence was most intense on 18 and 20 March and webcam images showed possible Strombolian explosions (figure 62). An ash plume rose to 2.4 km altitude and drifted SW on 18 March, accompanied by a thermal anomaly.
Summit crater incandescence at Main Crater and on the flanks persisted during April. Incandescent material at the S crater and on the flanks was reported at 0016 on 1 April. The lava flows had stopped by 1 April according to PVMBG, although incandescence was still visible up to 10 m high. Seismic signals indicating effusion decreased and by 6 April they were no longer detected. Incandescence was visible from both summit craters. On 26 April the VAL was lowered to 2 (the second lowest level on a 1-4 scale). White gas-and-steam emissions rose 25-200 m above the summit crater.
During May white gas-and-steam emissions generally rose 50-250 m above the summit, though it was often cloudy, which prevented clear views; on 21 May gas-and-steam emissions rose 50-400 m high. Nighttime N summit crater incandescence rose 10-25 m above the lava dome, and less intense incandescence was noted above Main Crater, which reached about 10 m above the dome. Sounds of falling rocks at Main Crater were heard on 15 May and the seismic network recorded 32 rockfall events in the crater on 17 May. Avalanches traveled as far as 1.5 km down the SW and S flanks, accompanied by rumbling sounds on 18 May. Incandescent material descending the flanks was captured in a webcam image at 2025 on 19 May (figure 63) and on 29 May; summit crater incandescence was observed in webcam images at 2332 on 26 May and at 2304 on 29 May. On 19 May the VAL was again raised to 3.
Occasional Main Crater incandescence was reported during June, as well as incandescent material on the flanks. White gas-and-steam emissions rose 10-200 m above the summit crater. Ash plumes rose to 2.1 km altitude and drifted SE and E during 2-4 June, according to the Darwin VAAC. Material on the flanks of Main Crater were observed at 2225 on 7 June, at 2051 on 9 June, at 0007 on 17 June, and at 0440 on 18 June. Webcam images taken on 21, 25, and 27 June showed incandescence at Main Crater and from material on the flanks.
MIROVA (Middle InfraRed Observation of Volcanic Activity) analysis of MODIS satellite data showed strong thermal activity during mid-February through March and mid-May through June, which represented incandescent avalanches and lava flows (figure 64). During April through mid-May the power of the anomalies decreased but frequent anomalies were still detected. Brief gaps in activity occurred during late March through early April and during mid-June. Infrared satellite images showed strong lava flows mainly affecting the SW and S flanks, accompanied by gas-and-steam emissions (figure 65). According to data recorded by the MODVOLC thermal algorithm, there were a total of 79 thermal hotspots detected: 28 during February, 24 during March, one during April, five during May, and 21 during June.
Geologic Background. Karangetang (Api Siau) volcano lies at the northern end of the island of Siau, about 125 km NNE of the NE-most point of Sulawesi. The stratovolcano contains five summit craters along a N-S line. It is one of Indonesia's most active volcanoes, with more than 40 eruptions recorded since 1675 and many additional small eruptions that were not documented (Neumann van Padang, 1951). Twentieth-century eruptions have included frequent explosive activity sometimes accompanied by pyroclastic flows and lahars. Lava dome growth has occurred in the summit craters; collapse of lava flow fronts have produced pyroclastic flows.
Information Contacts: Pusat Vulkanologi dan Mitigasi Bencana Geologi (PVMBG, also known as Indonesian Center for Volcanology and Geological Hazard Mitigation, CVGHM), Jalan Diponegoro 57, Bandung 40122, Indonesia (URL: http://www.vsi.esdm.go.id/); MAGMA Indonesia, Kementerian Energi dan Sumber Daya Mineral (URL: https://magma.esdm.go.id/v1); Badan Nasional Penanggulangan Bencana (BNPB), National Disaster Management Agency, Graha BNPB - Jl. Scout Kav.38, East Jakarta 13120, Indonesia (URL: http://www.bnpb.go.id/); Darwin Volcanic Ash Advisory Centre (VAAC), Bureau of Meteorology, Northern Territory Regional Office, PO Box 40050, Casuarina, NT 0811, Australia (URL: http://www.bom.gov.au/info/vaac/); MIROVA (Middle InfraRed Observation of Volcanic Activity), a collaborative project between the Universities of Turin and Florence (Italy) supported by the Centre for Volcanic Risk of the Italian Civil Protection Department (URL: http://www.mirovaweb.it/); Hawai'i Institute of Geophysics and Planetology (HIGP) - MODVOLC Thermal Alerts System, School of Ocean and Earth Science and Technology (SOEST), Univ. of Hawai'i, 2525 Correa Road, Honolulu, HI 96822, USA (URL: http://modis.higp.hawaii.edu/); Copernicus Browser, Copernicus Data Space Ecosystem, European Space Agency (URL: https://dataspace.copernicus.eu/browser/); IDN Times, Jl. Jend. Gatot Subroto Kav. 27 3rd Floor Kuningan, Jakarta, Indonesia 12950, Status of Karangetang Volcano in Sitaro Islands Increases (URL: https://sulsel.idntimes.com/news/indonesia/savi/status-gunung-api-karangetang-di-kepulauan-sitaro-meningkat?page=all).
Ahyi (United States) — July 2023 Cite this Report
Ahyi
United States
20.42°N, 145.03°E; summit elev. -75 m
All times are local (unless otherwise noted)
Intermittent hydroacoustic signals and discolored plumes during November 2022-June 2023
Ahyi seamount is a large, conical submarine volcano that rises to within 75 m of the ocean surface about 18 km SE of the island of Farallon de Pajaros in the Northern Marianas. The remote location of the seamount has made eruptions difficult to document, but seismic stations installed in the region confirmed an eruption in the vicinity in 2001. No new activity was detected until April-May 2014 when an eruption was detected by NOAA (National Oceanic and Atmospheric Administration) divers, hydroacoustic sensors, and seismic stations (BGVN 42:04). New activity was first detected on 15 November by hydroacoustic sensors that were consistent with submarine volcanic activity. This report covers activity during November 2022 through June 2023 based on daily and weekly reports from the US Geological Survey.
Starting in mid-October, hydroacoustic sensors at Wake Island (2.2 km E) recorded signals consistent with submarine volcanic activity, according to a report from the USGS issued on 15 November 2022. A combined analysis of the hydroacoustic signals and seismic stations located at Guam and Chichijima Island, Japan, suggested that the source of this activity was at or near the Ahyi seamount. After a re-analysis of a satellite image of the area that was captured on 6 November, USGS confirmed that there was no evidence of discoloration at the ocean surface. Few hydroacoustic and seismic signals continued through November, including on 18 November, which USGS suggested signified a decline or pause in unrest. A VONA (Volcano Observatory Notice for Aviation) reported that a discolored water plume was persistently visible in satellite data starting on 18 November (figure 6). Though clouds often obscured clear views of the volcano, another discolored water plume was captured in a satellite image on 26 November. The Aviation Color Code (ACC) was raised to Yellow (the second lowest level on a four-color scale) and the Volcano Alert Level (VAL) was raised to Advisory (the second lowest level on a four-level scale) on 29 November.
During December, occasional detections were recorded on the Wake Island hydrophone sensors and discolored water over the seamount remained visible. During 2-7, 10-12, and 16-31 December possible explosion signals were detected. A small area of discolored water was observed in high-resolution Sentinel-2 satellite images during 1-6 December (figure 7). High-resolution satellite images recorded discolored water plumes on 13 December that originated from the summit region; no observations indicated that activity breached the ocean surface. A possible underwater plume was visible in satellite images on 18 December, and during 19-20 December a definite but diffuse underwater plume located SSE from the main vent was reported. An underwater plume was visible in a satellite image taken on 26 December (figure 7).
Hydrophone sensors continued to detect signals consistent with possible explosions during 1-8 January 2023. USGS reported that the number of detections decreased during 4-5 January. The hydrophone sensors experienced a data outage that started at 0118 on 8 January and continued through 10 January, though according to USGS, possible explosions were recorded prior to the data outage and likely continued during the outage. A discolored water plume originating from the summit region was detected in a partly cloudy satellite image on 8 January. On 11-12 and 15-17 January possible explosion signals were recorded again. One small signal was detected during 22-23 January and several signals were recorded on 25 and 31 January. During 27-31 January a plume of discolored water was observed above the seamount in satellite imagery (figure 8).
Low levels of activity continued during February and March, based on data from pressure sensors on Wake Island. During 1 and 4-6 February activity was reported, and a submarine plume was observed on 4 February (figure 8). Possible explosion signals were detected during 7-8, 10, 13-14, and 24 February. During 1-2 and 3-5 March a plume of discolored water was observed in satellite imagery (figure 8). Almost continuous hydroacoustic signals were detected in remote pressure sensor data on Wake Island 2,270 km E from the volcano during 7-13 March. During 12-13 March water discoloration around the seamount was observed in satellite imagery, despite cloudy weather. By 14 March discolored water extended about 35 km, but no direction was noted. USGS reported that the continuous hydroacoustic signals detected during 13-14 March stopped abruptly on 14 March and no new detections were observed. Three 30 second hydroacoustic detections were reported during 17-19 March, but no activity was visible due to cloudy weather. A data outage was reported during 21-22 March, making pressure sensor data unavailable; a discolored water plume was, however, visible in satellite data. A possible underwater explosion signal was detected by pressure sensors at Wake Island on 26, 29, and 31 March, though the cause and origin of these events were unclear.
Similar low activity continued during April, May, and June. Several signals were detected during 1-3 April in pressure sensors at Wake Island. USGS suggested that these may be related to underwater explosions or earthquakes at the volcano, but no underwater plumes were visible in clear satellite images. The pressure sensors had data outages during 12-13 April and no data were recorded; no underwater plumes were visible in satellite images, although cloudy weather obscured most clear views. Eruptive activity was reported starting at 2210 on 21 May. On 22 May a discolored water plume that extended 4 km was visible in satellite images, though no direction was recorded. During 23-24 May some signals were detected by the underwater pressure sensors. Possible hydroacoustic signals were detected during 2-3 and 6-8 June. Multiple hydroacoustic signals were detected during 9-11 and 16-17 June, although no activity was visible in satellite images. One hydroacoustic signal was detected during 23-24 June, but there was some uncertainty about its association with volcanic activity. A single possible hydroacoustic signal was detected during 30 June to 1 July.
Geologic Background. Ahyi seamount is a large conical submarine volcano that rises to within 75 m of the ocean surface ~18 km SE of the island of Farallon de Pajaros in the northern Marianas. Water discoloration has been observed there, and in 1979 the crew of a fishing boat felt shocks over the summit area, followed by upwelling of sulfur-bearing water. On 24-25 April 2001 an explosive eruption was detected seismically by a station on Rangiroa Atoll, Tuamotu Archipelago. The event was well constrained (+/- 15 km) at a location near the southern base of Ahyi. An eruption in April-May 2014 was detected by NOAA divers, hydroacoustic sensors, and seismic stations.
Information Contacts: US Geological Survey, Volcano Hazards Program (USGS-VHP), 12201 Sunrise Valley Drive, Reston, VA, USA, https://volcanoes.usgs.gov/index.html; Copernicus Browser, Copernicus Data Space Ecosystem, European Space Agency (URL: https://dataspace.copernicus.eu/browser/).
Kadovar (Papua New Guinea) — June 2023 Cite this Report
Kadovar
Papua New Guinea
3.608°S, 144.588°E; summit elev. 365 m
All times are local (unless otherwise noted)
An ash plume and weak thermal anomaly during May 2023
Kadovar is a 2-km-wide island that is the emergent summit of a Bismarck Sea stratovolcano. It lies off the coast of New Guinea, about 25 km N of the mouth of the Sepik River. Prior to an eruption that began in 2018, a lava dome formed the high point of the volcano, filling an arcuate landslide scarp open to the S. Submarine debris-avalanche deposits occur to the S of the island. The current eruption began in January 2018 and has comprised lava effusion from vents at the summit and at the E coast; more recent activity has consisted of ash plumes, weak thermal activity, and gas-and-steam plumes (BGVN 48:02). This report covers activity during February through May 2023 using information from the Darwin Volcanic Ash Advisory Center (VAAC) and satellite data.
Activity during the reporting period was relatively low and mainly consisted of white gas-and-steam plumes that were visible in natural color satellite images on clear weather days (figure 67). According to a Darwin VAAC report, at 2040 on 6 May an ash plume rose to 4.6 km altitude and drifted W; by 2300 the plume had dissipated. MODIS satellite instruments using the MODVOLC thermal algorithm detected a single thermal hotspot on the SE side of the island on 7 May. Weak thermal activity was also detected in a satellite image on the E side of the island on 14 May, accompanied by a white gas-and-steam plume that drifted SE (figure 68).
Geologic Background. The 2-km-wide island of Kadovar is the emergent summit of a Bismarck Sea stratovolcano of Holocene age. It is part of the Schouten Islands, and lies off the coast of New Guinea, about 25 km N of the mouth of the Sepik River. Prior to an eruption that began in 2018, a lava dome formed the high point of the andesitic volcano, filling an arcuate landslide scarp open to the south; submarine debris-avalanche deposits occur in that direction. Thick lava flows with columnar jointing forms low cliffs along the coast. The youthful island lacks fringing or offshore reefs. A period of heightened thermal phenomena took place in 1976. An eruption began in January 2018 that included lava effusion from vents at the summit and at the E coast.
Information Contacts: Darwin Volcanic Ash Advisory Centre (VAAC), Bureau of Meteorology, Northern Territory Regional Office, PO Box 40050, Casuarina, NT 0811, Australia (URL: http://www.bom.gov.au/info/vaac/); Hawai'i Institute of Geophysics and Planetology (HIGP) - MODVOLC Thermal Alerts System, School of Ocean and Earth Science and Technology (SOEST), Univ. of Hawai'i, 2525 Correa Road, Honolulu, HI 96822, USA (URL: http://modis.higp.hawaii.edu/); Copernicus Browser, Copernicus Data Space Ecosystem, European Space Agency (URL: https://dataspace.copernicus.eu/browser/).
San Miguel (El Salvador) — June 2023 Cite this Report
San Miguel
El Salvador
13.434°N, 88.269°W; summit elev. 2130 m
All times are local (unless otherwise noted)
Small gas-and-ash explosions during March and May 2023
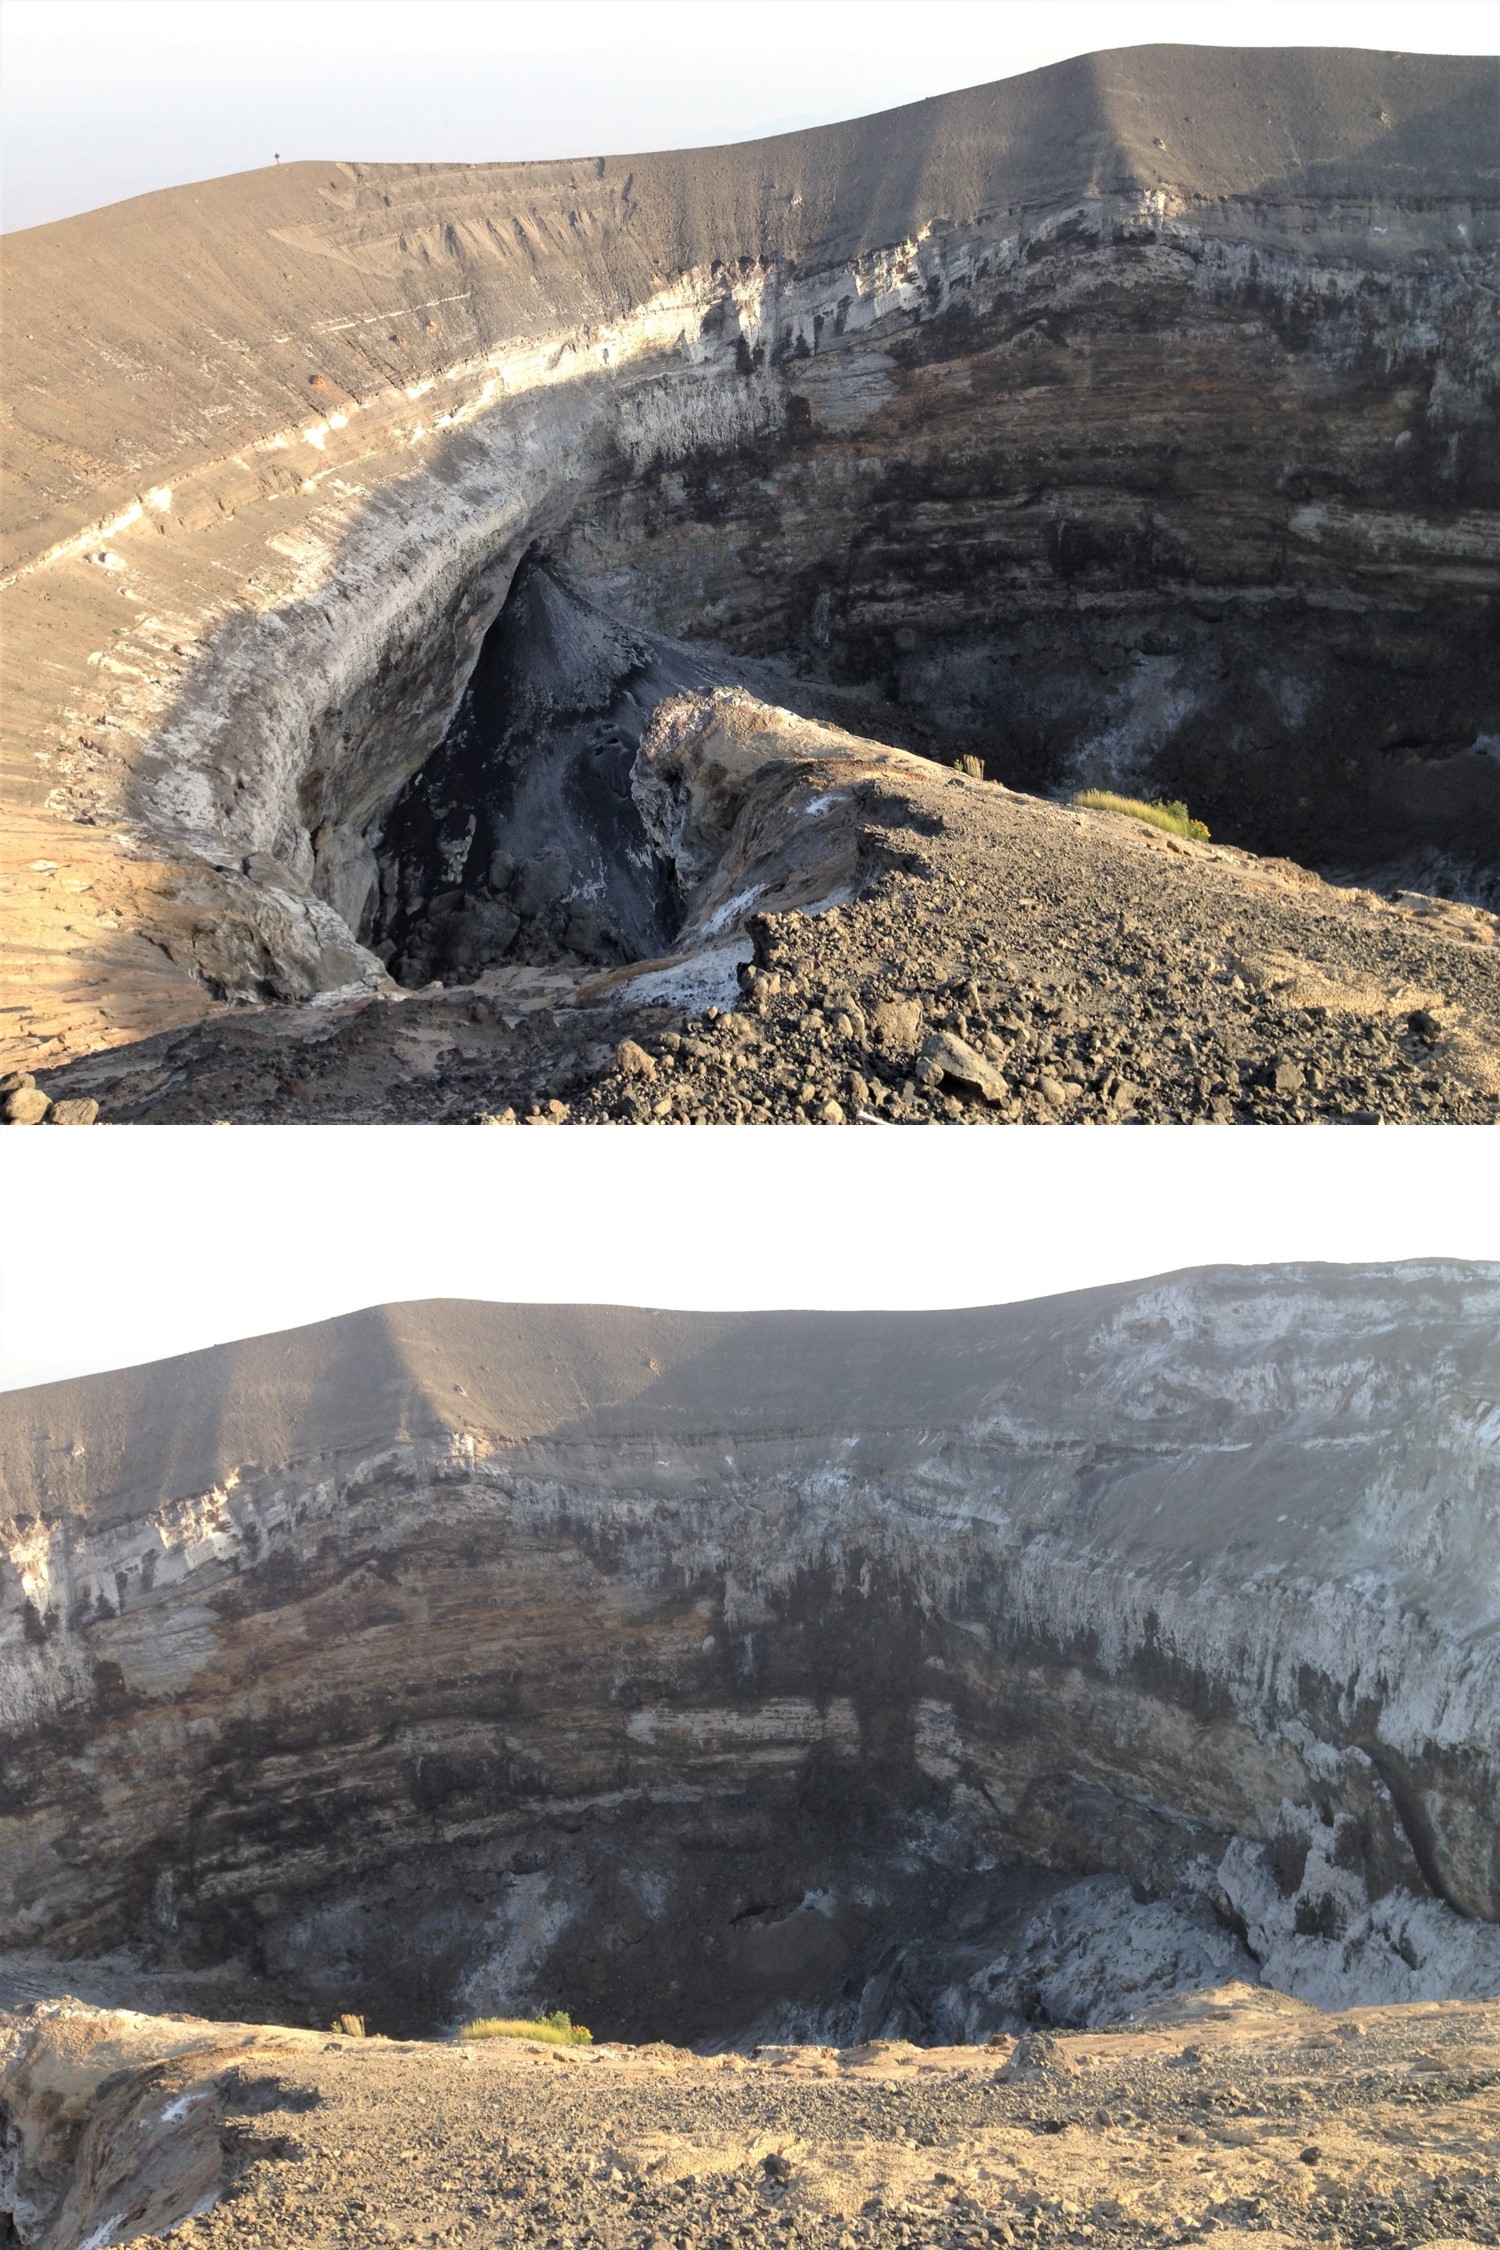
San Miguel in El Salvador is a broad, deep crater complex that has been frequently modified by eruptions recorded since the early 16th century and consists of the summit known locally as Chaparrastique. Flank eruptions have produced lava flows that extended to the N, NE, and SE during the 17-19th centuries. The most recent activity has consisted of minor ash eruptions from the summit crater. The current eruption period began in November 2022 and has been characterized by frequent phreatic explosions, gas-and-ash emissions, and sulfur dioxide plumes (BGVN 47:12). This report describes small gas-and-ash explosions during December 2022 through May 2023 based on special reports from the Ministero de Medio Ambiente y Recursos Naturales (MARN).
Activity has been relatively low since the last recorded explosions on 29 November 2022. Seismicity recorded by the San Miguel Volcano Station (VSM) located on the N flank at 1.7 km elevation had decreased by 7 December. Sulfur dioxide gas measurements taken with DOAS (Differential Optical Absorption Spectroscopy) mobile equipment were below typical previously recorded values: 300 tons per day (t/d). During December, small explosions were recorded by the seismic network and manifested as gas-and-steam emissions.
Gas-and-ash explosions in the crater occurred during January 2023, which were recorded by the seismic network. Sulfur dioxide values remained low, between 300-400 t/d through 10 March. At 0817 on 14 January a gas-and-ash emission was visible in webcam images, rising just above the crater rim. Some mornings during February, small gas-and-steam plumes were visible in the crater. On 7 March at 2252 MARN noted an increase in degassing from the central crater; gas emissions were constantly observed through the early morning hours on 8 March. During the early morning of 8 March through the afternoon on 9 March, 12 emissions were registered, some accompanied by ash. The last gas-and-ash emission was recorded at 1210 on 9 March; very fine ashfall was reported in El Tránsito (10 km S), La Morita (6 km W), and La Piedrita (3 km W). The smell of sulfur was reported in Piedra Azul (5 km SW). On 16 March MARN reported that gas-and-steam emissions decreased.
Low degassing and very low seismicity were reported during April; no explosions have been detected between 9 March and 27 May. The sulfur dioxide emissions remained between 350-400 t/d; during 13-20 April sulfur dioxide values fluctuated between 30-300 t/d. Activity remained low through most of May; on 23 May seismicity increased. An explosion was detected at 1647 on 27 May generated a gas-and-ash plume that rose 700 m high (figure 32); a decrease in seismicity and gas emissions followed. The DOAS station installed on the W flank recorded sulfur dioxide values that reached 400 t/d on 27 May; subsequent measurements showed a decrease to 268 t/d on 28 May and 100 t/d on 29 May.
Geologic Background. The symmetrical cone of San Miguel, one of the most active volcanoes in El Salvador, rises from near sea level to form one of the country's most prominent landmarks. A broad, deep, crater complex that has been frequently modified by eruptions recorded since the early 16th century caps the truncated unvegetated summit, also known locally as Chaparrastique. Flanks eruptions of the basaltic-andesitic volcano have produced many lava flows, including several during the 17th-19th centuries that extended to the N, NE, and SE. The SE-flank flows are the largest and form broad, sparsely vegetated lava fields crossed by highways and a railroad skirting the base of the volcano. Flank vent locations have migrated higher on the edifice during historical time, and the most recent activity has consisted of minor ash eruptions from the summit crater.
Information Contacts: Ministero de Medio Ambiente y Recursos Naturales (MARN), Km. 5½ Carretera a Nueva San Salvador, Avenida las Mercedes, San Salvador, El Salvador (URL: http://www.snet.gob.sv/ver/vulcanologia).
Ebeko
Russia
50.686°N, 156.014°E; summit elev. 1103 m
All times are local (unless otherwise noted)
Continued explosions, ash plumes, and ashfall during October 2022-May 2023
Ebeko, located on the N end of Paramushir Island in the Kuril Islands, consists of three summit craters along a SSW-NNE line at the northern end of a complex of five volcanic cones. Eruptions date back to the late 18th century and have been characterized as small-to-moderate explosions from the summit crater, accompanied by intense fumarolic activity. The current eruption period began in June 2022 and has recently consisted of frequent explosions, ash plumes, and thermal activity (BGVN 47:10). This report covers similar activity during October 2022 through May 2023, based on information from the Kamchatka Volcanic Eruptions Response Team (KVERT) and satellite data.
Activity during October consisted of explosive activity, ash plumes, and occasional thermal anomalies. Visual data by volcanologists from Severo-Kurilsk showed explosions producing ash clouds up to 2.1-3 km altitude which drifted E, N, NE, and SE during 1-8, 10, 16, and 18 October. KVERT issued several Volcano Observatory Notices for Aviation (VONA) on 7, 13-15, and 27 October 2022, stating that explosions generated ash plumes that rose to 2.3-4 km altitude and drifted 5 km E, NE, and SE. Ashfall was reported in Severo-Kurilsk (Paramushir Island, about 7 km E) on 7 and 13 October. Satellite data showed a thermal anomaly over the volcano on 15-16 October. Visual data showed ash plumes rising to 2.5-3.6 km altitude on 22, 25-29, and 31 October and moving NE due to constant explosions.
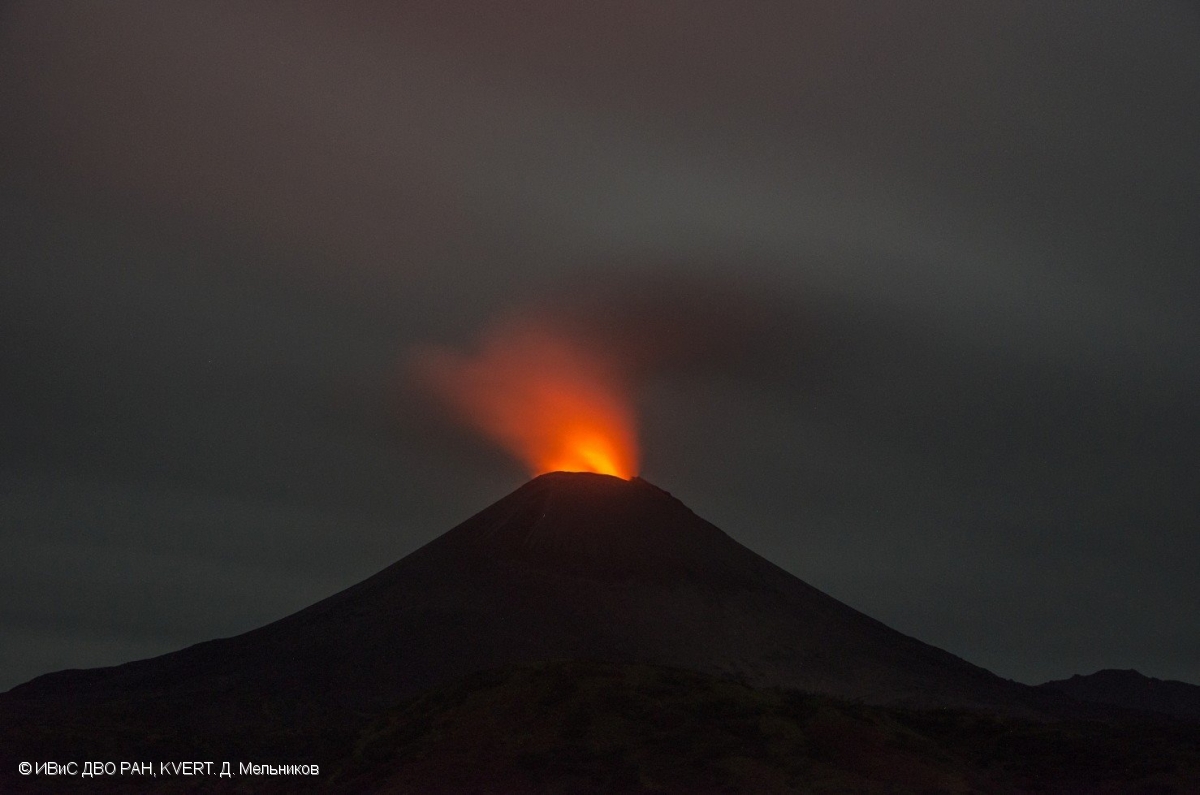
Similar activity continued during November, with explosions, ash plumes, and ashfall occurring. KVERT issued VONAs on 1-2, 4, 6-7, 9, 13, and 16 November that reported explosions and resulting ash plumes that rose to 1.7-3.6 km altitude and drifted 3-5 km SE, ESE, E, and NE. On 1 November ash plumes extended as far as 110 km SE. On 5, 8, 12, and 24-25 November explosions and ash plumes rose to 2-3.1 km altitude and drifted N and E. Ashfall was observed in Severo-Kurilsk on 7 and 16 November. A thermal anomaly was visible during 1-4, 16, and 20 November. Explosions during 26 November rose as high as 2.7 km altitude and drifted NE (figure 45).
Explosions and ash plumes continued to occur in December. During 1-2 and 4 December volcanologists from Severo-Kurilsk observed explosions that sent ash to 1.9-2.5 km altitude and drifted NE and SE (figure 46). VONAs were issued on 5, 9, and 16 December reporting that explosions generated ash plumes rising to 1.9 km, 2.6 km, and 2.4 km altitude and drifted 5 km SE, E, and NE, respectively. A thermal anomaly was visible in satellite imagery on 16 December. On 18 and 27-28 December explosions produced ash plumes that rose to 2.5 km altitude and drifted NE and SE. On 31 December an ash plume rose to 2 km altitude and drifted NE.
Explosions continued during January 2023, based on visual observations by volcanologists from Severo-Kurilsk. During 1-7 January explosions generated ash plumes that rose to 4 km altitude and drifted NE, E, W, and SE. According to VONAs issued by KVERT on 2, 4, 10, and 23 January, explosions produced ash plumes that rose to 2-4 km altitude and drifted 5 km N, NE, E, and ENE; the ash plume that rose to 4 km altitude occurred on 10 January (figure 47). Satellite data showed a thermal anomaly during 3-4, 10, 13, 16, 21, 22, and 31 January. KVERT reported that an ash cloud on 4 January moved 12 km NE. On 6 and 9-11 January explosions sent ash plumes to 4.5 km altitude and drifted W and ESE. On 13 January an ash plume rose to 3 km altitude and drifted SE. During 20-24 January ash plumes from explosions rose to 3.7 km altitude and drifted SE, N, and NE. On 21 January the ash plume drifted as far as 40 km NE. During 28-29 and 31 January and 1 February ash plumes rose to 4 km altitude and drifted NE.
During February, explosions, ash plumes, and ashfall were reported. During 1, 4-5 and 7-8 February explosions generated ash plumes that rose to 4.5 km altitude and drifted E and NE; ashfall was observed on 5 and 8 February. On 6 February an explosion produced an ash plume that rose to 3 km altitude and drifted 7 km E, causing ashfall in Severo-Kurilsk. A thermal anomaly was visible in satellite data on 8, 9, 13, and 21 February. Explosions on 9 and 12-13 February produced ash plumes that rose to 4 km altitude and drifted E and NE; the ash cloud on 12 February extended as far as 45 km E. On 22 February explosions sent ash to 3 km altitude that drifted E. During 24 and 26-27 February ash plumes rose to 4 km altitude and drifted E. On 28 February an explosion sent ash to 2.5-3 km altitude and drifted 5 km E; ashfall was observed in Severo-Kurilsk.
Activity continued during March; visual observations showed that explosions generated ash plumes that rose to 3.6 km altitude on 3, 5-7, and 9-12 March and drifted E, NE, and NW. Thermal anomalies were visible on 10, 13, and 29-30 March in satellite imagery. On 18, 21-23, 26, and 29-30 March explosions produced ash plumes that rose to 2.8 km altitude and drifted NE and E; the ash plumes during 22-23 March extended up to 76 km E. A VONA issued on 21 March reported an explosion that produced an ash plume that rose to 2.8 km altitude and drifted 5 km E. Another VONA issued on 23 March reported that satellite data showed an ash plume rising to 3 km altitude and drifted 14 km E.
Explosions during April continued to generate ash plumes. On 1 and 4 April an ash plume rose to 2.8-3.5 km altitude and drifted SE and NE. A thermal anomaly was visible in satellite imagery during 1-6 April. Satellite data showed ash plumes and clouds rising to 2-3 km altitude and drifting up to 12 km SW and E on 3 and 6 April (figure 48). KVERT issued VONAs on 3, 5, 14, 16 April describing explosions that produced ash plumes rising to 3 km, 3.5 km, 3.5 km, and 3 km altitude and drifting 5 km S, 5 km NE and SE, 72 km NNE, and 5 km NE, respectively. According to satellite data, the resulting ash cloud from the explosion on 14 April was 25 x 7 km in size and drifted 72-104 km NNE during 14-15 April. According to visual data by volcanologists from Severo-Kurilsk explosions sent ash up to 3.5 km altitude that drifted NE and E during 15-16, 22, 25-26, and 29 April.
The explosive eruption continued during May. Explosions during 3-4, 6-7, and 9-10 May generated ash plumes that rose to 4 km altitude and drifted SW and E. Satellite data showed a thermal anomaly on 3, 9, 13-14, and 24 May. During 12-16, 23-25, and 27-28 May ash plumes rose to 3.5 km altitude and drifted in different directions due to explosions. Two VONA notices were issued on 16 and 25 May, describing explosions that generated ash plumes rising to 3 km and 3.5 km altitude, respectively and extending 5 km E. The ash cloud on 25 May drifted 75 km SE.
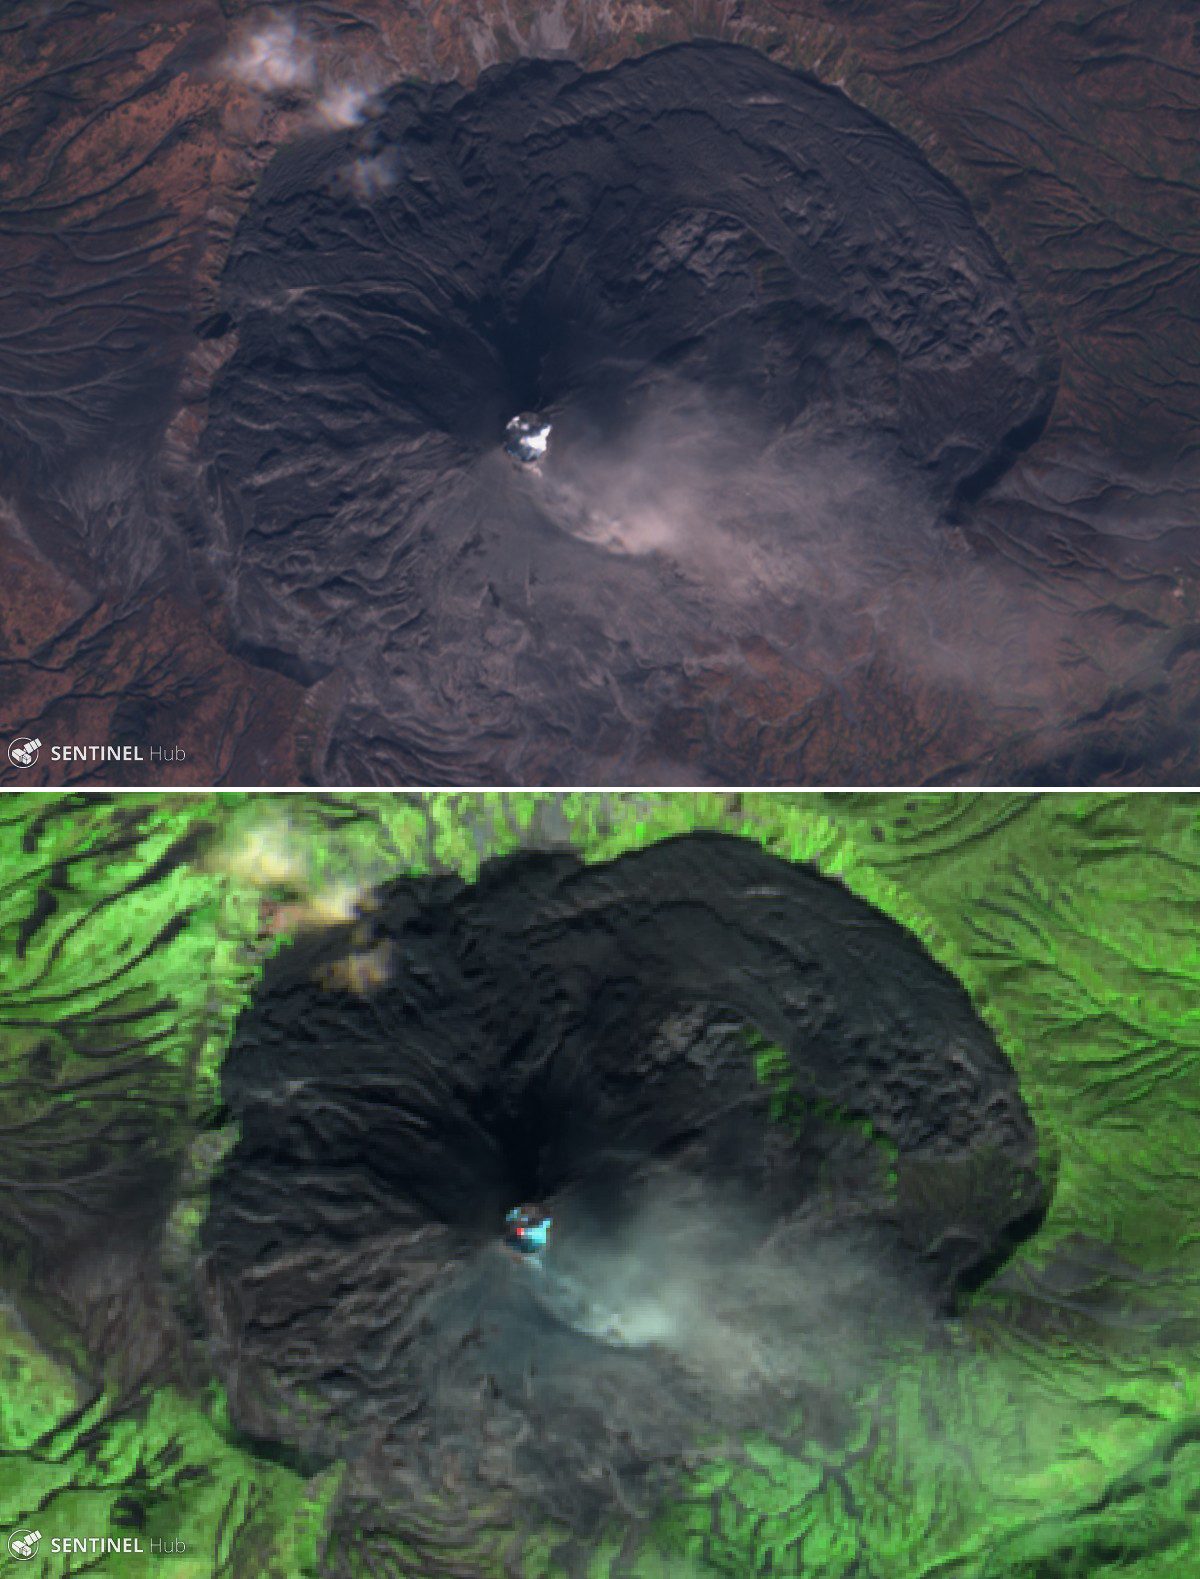
Thermal activity in the summit crater, occasionally accompanied by ash plumes and ash deposits on the SE and E flanks due to frequent explosions, were visible in infrared and true color satellite images (figure 49).
Geologic Background. The flat-topped summit of the central cone of Ebeko volcano, one of the most active in the Kuril Islands, occupies the northern end of Paramushir Island. Three summit craters located along a SSW-NNE line form Ebeko volcano proper, at the northern end of a complex of five volcanic cones. Blocky lava flows extend west from Ebeko and SE from the neighboring Nezametnyi cone. The eastern part of the southern crater contains strong solfataras and a large boiling spring. The central crater is filled by a lake about 20 m deep whose shores are lined with steaming solfataras; the northern crater lies across a narrow, low barrier from the central crater and contains a small, cold crescentic lake. Historical activity, recorded since the late-18th century, has been restricted to small-to-moderate explosive eruptions from the summit craters. Intense fumarolic activity occurs in the summit craters, on the outer flanks of the cone, and in lateral explosion craters.
Information Contacts: Kamchatka Volcanic Eruptions Response Team (KVERT), Far Eastern Branch, Russian Academy of Sciences, 9 Piip Blvd., Petropavlovsk-Kamchatsky, 683006, Russia (URL: http://www.kscnet.ru/ivs/kvert/); MIROVA (Middle InfraRed Observation of Volcanic Activity), a collaborative project between the Universities of Turin and Florence (Italy) supported by the Centre for Volcanic Risk of the Italian Civil Protection Department (URL: http://www.mirovaweb.it/); Copernicus Browser, Copernicus Data Space Ecosystem, European Space Agency (URL: https://dataspace.copernicus.eu/browser/).
Home Reef
Tonga
18.992°S, 174.775°W; summit elev. -10 m
All times are local (unless otherwise noted)
Discolored plumes continued during November 2022-April 2023
Home Reef is a submarine volcano located in the central Tonga islands between Lateiki (Metis Shoal) and Late Island. The first recorded eruption occurred in the mid-19th century, when an ephemeral island formed. An eruption in 1984 produced a 12-km-high eruption plume, a large volume of floating pumice, and an ephemeral island 500 x 1,500 m wide, with cliffs 30-50 m high that enclosed a water-filled crater. Another island-forming eruption in 2006 produced widespread pumice rafts that drifted as far as Australia; by 2008 the island had eroded below sea level. The previous eruption occurred during October 2022 and was characterized by a new island-forming eruption, lava effusion, ash plumes, discolored water, and gas-and-steam plumes (BGVN 47:11). This report covers discolored water plumes during November 2022 through April 2023 using satellite data.
Discolored plumes continued during the reporting period and were observed in true color satellite images on clear weather days. Satellite images show light green-yellow discolored water extending W on 8 and 28 November 2022 (figure 31), and SW on 18 November. Light green-yellow plumes extended W on 3 December, S on 13 December, SW on 18 December, and W and S on 23 December (figure 31). On 12 January 2023 discolored green-yellow plumes extended to the NE, E, SE, and N. The plume moved SE on 17 January and NW on 22 January. Faint discolored water in February was visible moving NE on 1 February. A discolored plume extended NW on 8 and 28 March and NW on 13 March (figure 31). During April, clear weather showed green-blue discolored plumes moving S on 2 April, W on 7 April, and NE and S on 12 April. A strong green-yellow discolored plume extended E and NE on 22 April for several kilometers (figure 31).
Geologic Background. Home Reef, a submarine volcano midway between Metis Shoal and Late Island in the central Tonga islands, was first reported active in the mid-19th century, when an ephemeral island formed. An eruption in 1984 produced a 12-km-high eruption plume, large amounts of floating pumice, and an ephemeral 500 x 1,500 m island, with cliffs 30-50 m high that enclosed a water-filled crater. In 2006 an island-forming eruption produced widespread dacitic pumice rafts that drifted as far as Australia. Another island was built during a September-October 2022 eruption.
Information Contacts: Copernicus Browser, Copernicus Data Space Ecosystem, European Space Agency (URL: https://dataspace.copernicus.eu/browser/).
Semisopochnoi (United States) — June 2023 Cite this Report
Semisopochnoi
United States
51.93°N, 179.58°E; summit elev. 1221 m
All times are local (unless otherwise noted)
Occasional explosions, ash deposits, and gas-and-steam plumes during December 2022-May 2023
Semisopochnoi is located in the western Aleutians, is 20-km-wide at sea level, and contains an 8-km-wide caldera. The three-peaked Mount Young (formerly Cerberus) was constructed within the caldera during the Holocene. Each of these peaks contains a summit crater; the lava flows on the N flank appear younger than those on the S side. The current eruption period began in early February 2021 and has more recently consisted of intermittent explosions and ash emissions (BGVN 47:12). This report updates activity during December 2022 through May 2023 using daily, weekly, and special reports from the Alaska Volcano Observatory (AVO). AVO monitors the volcano using local seismic and infrasound sensors, satellite data, web cameras, and remote infrasound and lightning networks.
Activity during most of December 2022 was relatively quiet; according to AVO no eruptive or explosive activity was observed since 7 November 2022. Intermittent tremor and occasional small earthquakes were observed in geophysical data. Continuous gas-and-steam emissions were observed from the N crater of Mount Young in webcam images on clear weather days (figure 25). On 24 December, there was a slight increase in earthquake activity and several small possible explosion signals were detected in infrasound data. Eruptive activity resumed on 27 December at the N crater of Mount Young; AVO issued a Volcano Activity Notice (VAN) that reported minor ash deposits on the flanks of Mount Young that extended as far as 1 km from the vent, according to webcam images taken during 27-28 December (figure 26). No ash plumes were observed in webcam or satellite imagery, but a persistent gas-and-steam plume that might have contained some ash rose to 1.5 km altitude. As a result, AVO raised the Aviation Color Code (ACC) to Orange (the second highest level on a four-color scale) and the Volcano Alert Level (VAL) to Watch (the second highest level on a four-level scale). Possible explosions were detected during 21 December 2022 through 1 January 2023 and seismic tremor was recorded during 30-31 December.
During January 2023 eruptive activity continued at the active N crater of Mount Young. Minor ash deposits were observed on the flanks, extending about 2 km SSW, based on webcam images from 1 and 3 January. A possible explosion occurred during 1-2 January based on elevated seismicity recorded on local seismometers and an infrasound signal recorded minutes later by an array at Adak. Though no ash plumes were observed in webcam or satellite imagery, a persistent gas-and-steam plume rose to 1.5 km altitude that might have carried minor traces of ash. Ash deposits were accompanied by periods of elevated seismicity and infrasound signals from the local geophysical network, which AVO reported were likely due to weak explosive activity. Low-level explosive activity was also detected during 2-3 January, with minor gas-and-steam emissions and a new ash deposit that was visible in webcam images. Low-level explosive activity was detected in geophysical data during 4-5 January, with elevated seismicity and infrasound signals observed on local stations. Volcanic tremor was detected during 7-9 January and very weak explosive activity was detected in seismic and infrasound data on 9 January. Weak seismic and infrasound signals were recorded on 17 January, which indicated minor explosive activity, but no ash emissions were observed in clear webcam images; a gas-and-steam plume continued to rise to 1.5 km altitude. During 29-30 January, ash deposits near the summit were observed on fresh snow, according to webcam images.
The active N cone at Mount Young continued to produce a gas-and-steam plume during February, but no ash emissions or explosive events were detected. Seismicity remained elevated with faint tremor during early February. Gas-and-steam emissions from the N crater were observed in clear webcam images on 11-13 and 16 February; no explosive activity was detected in seismic, infrasound, or satellite data. Seismicity has also decreased, with no significant seismic tremor observed since 25 January. Therefore, the ACC was lowered to Yellow (the second lowest level on a four-color scale) and the VAL was lowered to Advisory (the second lowest level on a four-color scale) on 22 February.
Gas-and-steam emissions persisted during March from the N cone of Mount Young, based on clear webcam images. A few brief episodes of weak tremor were detected in seismic data, although seismicity decreased over the month. A gas-and-steam plume detected in satellite data extended 150 km on 18 March. Low-level ash emissions from the N cone at Mount Young were observed in several webcam images during 18-19 March, in addition to small explosions and volcanic tremor. The ACC was raised to Orange and the VAL increased to Watch on 19 March. A small explosion was detected in seismic and infrasound data on 21 March.
Low-level unrest continued during April, although cloudy weather often obscured views of the summit; periods of seismic tremor and local earthquakes were recorded. During 3-4 April a gas-and-steam plume was visible traveling more than 200 km overnight; no ash was evident in the plume, according to AVO. A gas-and-steam plume was observed during 4-6 April that extended 400 km but did not seem to contain ash. Small explosions were detected in seismic and infrasound data on 5 April. Occasional clear webcam images showed continuing gas-and-steam emissions rose from Mount Young, but no ash deposits were observed on the snow. On 19 April small explosions and tremor were detected in seismic and infrasound data. A period of seismic tremor was detected during 22-25 April, with possible weak explosions on 25 April. Ash deposits were visible near the crater rim, but it was unclear if these deposits were recent or due to older deposits.
Occasional small earthquakes were recorded during May, but there were no signs of explosive activity seen in geophysical data. Gas-and-steam emissions continued from the N crater of Mount Young, based on webcam images, and seismicity remained slightly elevated. A new, light ash deposit was visible during the morning of 5 May on fresh snow on the NW flank of Mount Young. During 10 May periods of volcanic tremor were observed. The ACC was lowered to Yellow and the VAL to Advisory on 17 May due to no additional evidence of activity.
Geologic Background. Semisopochnoi, the largest subaerial volcano of the western Aleutians, is 20 km wide at sea level and contains an 8-km-wide caldera. It formed as a result of collapse of a low-angle, dominantly basaltic volcano following the eruption of a large volume of dacitic pumice. The high point of the island is Anvil Peak, a double-peaked late-Pleistocene cone that forms much of the island's northern part. The three-peaked Mount Cerberus (renamed Mount Young in 2023) was constructed within the caldera during the Holocene. Each of the peaks contains a summit crater; lava flows on the N flank appear younger than those on the south side. Other post-caldera volcanoes include the symmetrical Sugarloaf Peak SSE of the caldera and Lakeshore Cone, a small cinder cone at the edge of Fenner Lake in the NE part of the caldera. Most documented eruptions have originated from Young, although Coats (1950) considered that both Sugarloaf and Lakeshore Cone could have been recently active.
Information Contacts: Alaska Volcano Observatory (AVO), a cooperative program of a) U.S. Geological Survey, 4200 University Drive, Anchorage, AK 99508-4667 USA (URL: https://avo.alaska.edu/), b) Geophysical Institute, University of Alaska, PO Box 757320, Fairbanks, AK 99775-7320, USA, and c) Alaska Division of Geological & Geophysical Surveys, 794 University Ave., Suite 200, Fairbanks, AK 99709, USA (URL: http://dggs.alaska.gov/).
Ambae
Vanuatu
15.389°S, 167.835°E; summit elev. 1496 m
All times are local (unless otherwise noted)
New lava flow, ash plumes, and sulfur dioxide plumes during February-May 2023
Ambae, also known as Aoba, is a large basaltic shield volcano in Vanuatu. A broad pyroclastic cone containing three crater lakes (Manaro Ngoru, Voui, and Manaro Lakua) is located at the summit within the youngest of at least two nested calderas. Periodic phreatic and pyroclastic explosions have been reported since the 16th century. A large eruption more than 400 years ago resulted in a volcanic cone within the summit crater that is now filled by Lake Voui; the similarly sized Lake Manaro fills the western third of the caldera. The previous eruption ended in August 2022 that was characterized by gas-and-steam and ash emissions and explosions of wet tephra (BGVN 47:10). This report covers a new eruption during February through May 2023 that consisted of a new lava flow, ash plumes, and sulfur dioxide emissions, using information from the Vanuatu Meteorology and Geo-Hazards Department (VMGD) and satellite data.
During the reporting period, the Alert Level remained at a 2 (on a scale of 0-5), which has been in place since December 2021. Activity during October 2022 through March 2023 remained relatively low and mostly consisted of gas-and-steam emissions in Lake Voui. VMGD reported that at 1300 on 15 November a satellite image captured a strong amount of sulfur dioxide rising above the volcano (figure 99), and that seismicity slightly increased. The southern and northern part of the island reported a strong sulfur dioxide smell and heard explosions. On 20 February 2023 a gas-and-ash plume rose 1.3 km above the summit and drifted SSW, according to a webcam image (figure 100). Gas-and-steam and possibly ash emissions continued on 23 February and volcanic earthquakes were recorded by the seismic network.
During April, volcanic earthquakes and gas-and-steam and ash emissions were reported from the cone in Lake Voui. VMGD reported that activity increased during 5-7 April; high gas-and-steam and ash plumes were visible, accompanied by nighttime incandescence. According to a Wellington VAAC report, a low-level ash plume rose as high as 2.5 km above the summit and drifted W and SW on 5 April, based on satellite imagery. Reports in Saratamata stated that a dark ash plume drifted to the WSW, but no loud explosion was heard. Webcam images from 2100 showed incandescence above the crater and reflected in the clouds. According to an aerial survey, field observations, and satellite data, water was no longer present in the lake. A lava flow was reported effusing from the vent and traveling N into the dry Lake Voui, which lasted three days. The next morning at 0745 on 6 April a gas-and-steam and ash plume rose 5.4 km above the summit and drifted ESE, based on information from VMGD (figure 101). The Wellington VAAC also reported that light ashfall was observed on the island. Intermittent gas-and-steam and ash emissions were visible on 7 April, some of which rose to an estimated 3 km above the summit and drifted E. Webcam images during 0107-0730 on 7 April showed continuing ash emissions. A gas-and-steam and ash plume rose 695 m above the summit crater at 0730 on 19 April and drifted ESE, based on a webcam image (figure 102).
According to visual and infrared satellite data, water was visible in Lake Voui as late as 24 March 2023 (figure 103). The vent in the caldera showed a gas-and-steam plume drifted SE. On 3 April thermal activity was first detected, accompanied by a gas-and-ash plume that drifted W (figure 103). The lava flow moved N within the dry lake and was shown cooling by 8 April. By 23 April much of the water in the lake had returned. Occasional sulfur dioxide plumes were detected by the TROPOMI instrument on the Sentinel-5P satellite that exceeded 2 Dobson Units (DU) and drifted in different directions (figure 104).
Geologic Background. The island of Ambae, also known as Aoba, is a massive 2,500 km3 basaltic shield that is the most voluminous volcano of the New Hebrides archipelago. A pronounced NE-SW-trending rift zone with numerous scoria cones gives the 16 x 38 km island an elongated form. A broad pyroclastic cone containing three crater lakes (Manaro Ngoru, Voui, and Manaro Lakua) is located at the summit within the youngest of at least two nested calderas, the largest of which is 6 km in diameter. That large central edifice is also called Manaro Voui or Lombenben volcano. Post-caldera explosive eruptions formed the summit craters about 360 years ago. A tuff cone was constructed within Lake Voui (or Vui) about 60 years later. The latest known flank eruption, about 300 years ago, destroyed the population of the Nduindui area near the western coast.
Information Contacts: Geo-Hazards Division, Vanuatu Meteorology and Geo-Hazards Department (VMGD), Ministry of Climate Change Adaptation, Meteorology, Geo-Hazards, Energy, Environment and Disaster Management, Private Mail Bag 9054, Lini Highway, Port Vila, Vanuatu (URL: http://www.vmgd.gov.vu/, https://www.facebook.com/VanuatuGeohazardsObservatory/); Wellington Volcanic Ash Advisory Centre (VAAC), Meteorological Service of New Zealand Ltd (MetService), PO Box 722, Wellington, New Zealand (URL: http://www.metservice.com/vaac/, http://www.ssd.noaa.gov/VAAC/OTH/NZ/messages.html); MIROVA (Middle InfraRed Observation of Volcanic Activity), a collaborative project between the Universities of Turin and Florence (Italy) supported by the Centre for Volcanic Risk of the Italian Civil Protection Department (URL: http://www.mirovaweb.it/); Global Sulfur Dioxide Monitoring Page, Atmospheric Chemistry and Dynamics Laboratory, NASA Goddard Space Flight Center (NASA/GSFC), 8800 Greenbelt Road, Goddard, Maryland, USA (URL: https://so2.gsfc.nasa.gov/); Copernicus Browser, Copernicus Data Space Ecosystem, European Space Agency (URL: https://dataspace.copernicus.eu/browser/).
Search Bulletin Archive by Publication Date
Select a month and year from the drop-downs and click "Show Issue" to have that issue displayed in this tab.
The default month and year is the latest issue available.
Bulletin of the Global Volcanism Network - Volume 43, Number 10 (October 2018)
Managing Editor: Edward Venzke
Heard (Australia)
Thermal hotspots persist at Mawson Peak, lava flows visible in satellite data November 2017-September 2018
Kadovar (Papua New Guinea)
Intermittent ash plumes; thermal anomalies in the crater and Coastal Vent through September 2018
Karymsky (Russia)
Thermal anomalies and ash explosions during August-September 2018
Ketoi (Russia)
Plume of uncertain composition reported based on satellite data one day in September
Kilauea (United States)
Twenty-four fissures open on the lower East Rift Zone in May 2018; at least 94 structures destroyed
Krakatau (Indonesia)
Strombolian, lava flow, and explosive activities resume, June-October 2018
Lengai, Ol Doinyo (Tanzania)
Effusive activity continues at the summit through August 2018 with small lava flows and spattering confined to the crater
Mayon (Philippines)
Low activity during April-September with some ash plumes and ongoing crater incandescence
Saunders (United Kingdom)
Intermittent thermal pulses and satellite imagery hotspots during September 2016-September 2018
Villarrica (Chile)
Thermal activity increases November-December 2017 and July-August 2018; intermittent incandescence and ash
Heard (Australia) — October 2018 Cite this Report
Heard
Australia
53.106°S, 73.513°E; summit elev. 2745 m
All times are local (unless otherwise noted)
Thermal hotspots persist at Mawson Peak, lava flows visible in satellite data November 2017-September 2018
Remote Heard Island in the southern Indian Ocean is home to the snow-covered Big Ben stratovolcano, which has had confirmed intermittent activity since 1910. The nearest continental landmass, Antarctica, lies over 1,000 km S. Visual confirmation of lava flows on Heard are rare; thermal anomalies and hotspots detected by satellite-based instruments provide the most reliable information about eruptive activity. Thermal alerts reappeared in September 2012 after a four-year hiatus (BGVN 38:01), and have been intermittent since that time. Information comes from instruments on the European Space Agency's (ESA) Sentinel-2 satellite and MODVOLC and MIROVA thermal anomaly data from other satellite instruments. This report reviews evidence for eruptive activity from November 2017 through September 2018.
Satellite observations indicated intermittent hot spots at the summit through 12 December 2017. A few observations in January and February 2018 suggested steam plumes at the summit, but no significant thermal activity. An infrared pixel indicative of renewed thermal activity appeared again on 7 March, and similar observations were made at least twice each month in April and May. Activity increased significantly during June and remained elevated through September 2018 with multiple days of hotspot observations in satellite data each of those months, including images that indicated lava flowing in different directions from Mawson Peak. MODVOLC and MIROVA data also indicated increased thermal activity during June-September 2018.
Activity during October-December 2017. MIROVA thermal anomalies recorded during October 2017 indicated ongoing thermal activity at Heard (figure 32). This was confirmed by Sentinel-2 satellite imagery that revealed hotpots at the summit on ten different days in October (3, 6, 8, 13, 16, 21, 23, 26, 28, and 31), and included images suggesting lava flows descending from the summit in different directions on different days (figure 33).
The MODVOLC thermal alert data showed no further alerts for the year after 22 October 2017, and the MIROVA system anomalies tapered off in mid-November 2017. The Sentinel-2 satellite imagery, however, continued to record intermittent hotspots at and around Mawson Peak, the summit of Big Ben volcano, into December 2017 (figure 34). Hotspots were visible during six days in November (7, 15, 20, 25, 27, and 30) and three days during December (5, 7, and 12).
Activity during January-May 2018. The satellite images during January and February 2018 were indicative of steam plumes at the summit, but distinct thermal signals reappeared on 7 and 12 March 2018 (figure 35). In spite of extensive cloud cover, the Sentinel-2 imagery also captured thermal signals twice each month in April (4 and 14) and May (9 and 14) (figure 36).
Activity during June-September 2018. Thermal signals increased significantly in the satellite data during June 2018. The sizes of the thermal anomalies were bigger, and they were visible at least nine days of the month (3, 5, 8, 10, 15, 18, 23, 25, and 30). Five substantial thermal signals appeared during July (3, 10, 15, 18, and 28); images on 23 June and 3 July distinctly show a lava flow trending NE from the summit (figure 37). MODVOLC thermal alerts appeared in June 2018 on three days (2, 26, and 27) and on four days during July (7, 8, 9, 10) indicating increased activity during this time. The MIROVA thermal signals also showed a substantial increase in early June that peaked in mid-July and remained steady through September 2018 (figure 32).
Six images in August (2, 7, 9, 22, 27, 29) showed evidence of active lava at the summit, and suggested flows both NE and SE from the summit that were long enough to cause multiple hotspots (figure 38). During September and early October 2018 the satellite images continued to show multiple hotspots that indicated flow activity tens of meters SE from the summit multiple days of each month (figure 39).
Geologic Background. Heard Island on the Kerguelen Plateau in the southern Indian Ocean consists primarily of the emergent portion of two volcanic structures. The large glacier-covered composite basaltic-to-trachytic cone of Big Ben comprises most of the island, and the smaller Mt. Dixon lies at the NW tip of the island across a narrow isthmus. Little is known about the structure of Big Ben because of its extensive ice cover. The active Mawson Peak forms the island's high point and lies within a 5-6 km wide caldera breached to the SW side of Big Ben. Small satellitic scoria cones are mostly located on the northern coast. Several subglacial eruptions have been reported at this isolated volcano, but observations are infrequent and additional activity may have occurred.
Information Contacts: Sentinel Hub Playground (URL: https://www.sentinel-hub.com/explore/sentinel-playground); Hawai'i Institute of Geophysics and Planetology (HIGP) - MODVOLC Thermal Alerts System, School of Ocean and Earth Science and Technology (SOEST), Univ. of Hawai'i, 2525 Correa Road, Honolulu, HI 96822, USA (URL: http://modis.higp.hawaii.edu/); MIROVA (Middle InfraRed Observation of Volcanic Activity), a collaborative project between the Universities of Turin and Florence (Italy) supported by the Centre for Volcanic Risk of the Italian Civil Protection Department (URL: http://www.mirovaweb.it/).
Kadovar (Papua New Guinea) — October 2018 Cite this Report
Kadovar
Papua New Guinea
3.608°S, 144.588°E; summit elev. 365 m
All times are local (unless otherwise noted)
Intermittent ash plumes; thermal anomalies in the crater and Coastal Vent through September 2018
The first confirmed eruption of Kadovar began on 5 January 2018 with dense ash plumes and steam and a lava flow. The eruption continued through February and then slowed during March (BGVN 43:04). This report describes notices of ash plumes from the Darwin Volcanic Ash Advisory Centre (VAAC) and satellite images during April through 1 October 2018.
According to the Darwin VAAC a pilot observed an ash plume rising to an altitude of 1.2 km on 10 June. The ash plume was not identified in satellite data. Another ash plume identified by a pilot and in satellite images rose to an altitude of 1.8 km on 20 June and drifted W. An ash plume was visible in satellite images on 28 September drifting SE at an altitude of 2.1 km. On 1 October an ash plume rose to 2.7 km and drifted W.
Infrared satellite data from Sentinel-2 showed hot spots in the summit crater and at the Coastal Vent along the W shoreline on 10, 15, and 25 April 2018; plumes of brown discolored water were streaming from the western side of the island (figure 18). Similar activity was frequently seen during clear weather in the following months. A steam plume was also often rising from the crater. The Coastal Vent cone was still hot on 8 August, but no infrared anomaly was seen in imagery from 28 August through September.
Geologic Background. The 2-km-wide island of Kadovar is the emergent summit of a Bismarck Sea stratovolcano of Holocene age. It is part of the Schouten Islands, and lies off the coast of New Guinea, about 25 km N of the mouth of the Sepik River. Prior to an eruption that began in 2018, a lava dome formed the high point of the andesitic volcano, filling an arcuate landslide scarp open to the south; submarine debris-avalanche deposits occur in that direction. Thick lava flows with columnar jointing forms low cliffs along the coast. The youthful island lacks fringing or offshore reefs. A period of heightened thermal phenomena took place in 1976. An eruption began in January 2018 that included lava effusion from vents at the summit and at the E coast.
Information Contacts: Darwin Volcanic Ash Advisory Centre (VAAC), Bureau of Meteorology, Northern Territory Regional Office, PO Box 40050, Casuarina, NT 0811, Australia (URL: http://www.bom.gov.au/info/vaac/); Sentinel Hub Playground (URL: https://www.sentinel-hub.com/explore/sentinel-playground).
Karymsky (Russia) — October 2018 Cite this Report
Karymsky
Russia
54.049°N, 159.443°E; summit elev. 1513 m
All times are local (unless otherwise noted)
Thermal anomalies and ash explosions during August-September 2018
The most recent eruptive period at Karymsky, on the Kamchatka Peninsula of Russia, began on 28 April 2018, with thermal anomalies, gas-and-steam emissions, and ash plumes observed through July 2018. The current report discusses activity through September 2018 (table 11). This report was compiled using information from the Kamchatka Volcanic Eruptions Response Team (KVERT).
KVERT reported ongoing thermal anomalies and intermittent ash plumes over Karymsky during August and September 2018 (table 11). Ash plumes drifted 50 km SE on 7 August, and 40 km S on 25 August. Stronger activity during 10-11 September consisted of continuous dense ash emissions along with explosions that sent plumes 5-6 km high which drifted 860 km NE. Incandescence photographed the next night was attributed to fumarolic activity (figure 41). Ash plumes were identified drifting 365 km E on 22-23 September. The last thermal anomaly was identified in satellite images on 28 September, and an ash plume was last visible on 30 September.
Table 11. Ash plumes and thermal anomalies at Karymsky, 1 August-30 September 2018. Clouds often obscured the volcano. Data compiled from KVERT reports.
| Date |
Observations |
| 01-07 Aug 2018 |
Thermal anomalies; ash plume drifted 50 km SE on 7 Aug. |
| 08-14 Aug 2018 |
Thermal anomalies. |
| 25-31 Aug 2018 |
Thermal anomalies; ash plume drifted 40 km S on 25 Aug. |
| 01-07 Sep 2018 |
Thermal anomalies. |
| 08-15 Sep 2018 |
Continuous ash emissions on 10 Sep. Explosions during 10-11 Sep with plumes rising 5-6 km that drifted 860 km NE. |
| 16-23 Sep 2018 |
Thermal anomalies; ash plumes drifted 365 km E on 22-23 Sep. |
| 24-30 Sep 2018 |
Thermal anomalies; ash plume on 30 Sep. |
Thermal anomalies, based on MODIS satellite instruments analyzed using the MODVOLC algorithm, were last observed on 31 July 2018. The MIROVA (Middle InfraRed Observation of Volcanic Activity) system detected one hotspot in early August (moderate power), and two hotspots in late September (low power).
Geologic Background. Karymsky, the most active volcano of Kamchatka's eastern volcanic zone, is a symmetrical stratovolcano constructed within a 5-km-wide caldera that formed during the early Holocene. The caldera cuts the south side of the Pleistocene Dvor volcano and is located outside the north margin of the large mid-Pleistocene Polovinka caldera, which contains the smaller Akademia Nauk and Odnoboky calderas. Most seismicity preceding Karymsky eruptions originated beneath Akademia Nauk caldera, located immediately south. The caldera enclosing Karymsky formed about 7600-7700 radiocarbon years ago; construction of the stratovolcano began about 2000 years later. The latest eruptive period began about 500 years ago, following a 2300-year quiescence. Much of the cone is mantled by lava flows less than 200 years old. Historical eruptions have been vulcanian or vulcanian-strombolian with moderate explosive activity and occasional lava flows from the summit crater.
Information Contacts: Kamchatka Volcanic Eruptions Response Team (KVERT), Far Eastern Branch, Russian Academy of Sciences, 9 Piip Blvd., Petropavlovsk-Kamchatsky, 683006, Russia (URL: http://www.kscnet.ru/ivs/kvert/); Institute of Volcanology and Seismology, Far Eastern Branch, Russian Academy of Sciences (IVS FEB RAS), 9 Piip Blvd., Petropavlovsk-Kamchatsky 683006, Russia (URL: http://www.kscnet.ru/ivs/eng/); Hawai'i Institute of Geophysics and Planetology (HIGP) - MODVOLC Thermal Alerts System, School of Ocean and Earth Science and Technology (SOEST), Univ. of Hawai'i, 2525 Correa Road, Honolulu, HI 96822, USA (URL: http://hotspot.higp.hawaii.edu/); MIROVA (Middle InfraRed Observation of Volcanic Activity), a collaborative project between the Universities of Turin and Florence (Italy) supported by the Centre for Volcanic Risk of the Italian Civil Protection Department (URL: http://www.mirovaweb.it/); Sentinel Hub Playground (URL: https://www.sentinel-hub.com/explore/sentinel-playground).
Ketoi
Russia
47.35°N, 152.475°E; summit elev. 1172 m
All times are local (unless otherwise noted)
Plume of uncertain composition reported based on satellite data one day in September
Gas-and-steam emissions were previously reported at Ketoi (figure 1) in January, July, and August 2013 (BGVN 40:09). Intense fumarolic activity originating from the same area, the N slope of Pallas Peak, was reported in 1981, 1987, and 1989. Based on a report from the Sakhalin Volcanic Eruption Response Team (SVERT) using Himawari-8 imagery, the Tokyo VAAC reported an ash plume on 21 September 2018 which drifted to the NE; however, evidence of the plume could not be confirmed by the VAAC from satellite imagery. The original VONA (Volcano Observatory Notice for Aviation) issued by SVERT noted a volcanic cloud without a specific mention of ash, but also remarked that thermal anomalies had been observed on 17 and 20 September.
Geologic Background. The circular 10-km-wide Ketoi island, which rises across the 19-km-wide Diana Strait from Simushir Island, hosts of one of the most complex volcanic structures of the Kuril Islands. The rim of a 5-km-wide Pleistocene caldera is exposed only on the NE side. A younger stratovolcano forming the NW part of the island is cut by a horst-and-graben structure containing two solfatara fields. A 1.5-km-wide freshwater lake fills an explosion crater in the center of the island. Pallas Peak, a large andesitic cone in the NE part of the caldera, is truncated by a 550-m-wide crater containing a brilliantly colored turquoise crater lake. Lava flows from Pallas Peak overtop the caldera rim and descend nearly 5 km to the SE coast. The first historical eruption of Pallas Peak, during 1843-46, was its largest.
Information Contacts: Sakhalin Volcanic Eruption Response Team (SVERT), Institute of Marine Geology and Geophysics, Far Eastern Branch, Russian Academy of Science, Nauki st., 1B, Yuzhno-Sakhalinsk, Russia, 693022 (URL: http://www.imgg.ru/en/, http://www.imgg.ru/ru/svert/reports); Sentinel Hub Playground (URL: https://www.sentinel-hub.com/explore/sentinel-playground).
Kilauea (United States) — October 2018 Cite this Report
Kilauea
United States
19.421°N, 155.287°W; summit elev. 1222 m
All times are local (unless otherwise noted)
Twenty-four fissures open on the lower East Rift Zone in May 2018; at least 94 structures destroyed
Kīlauea's East Rift Zone (ERZ) has been intermittently active for at least two thousand years. Open lava lakes at the summit caldera, and a lava lake and flows from the East Rift Zone, have been almost continuously active since the current eruption began in 1983. A marked increase in seismicity and ground deformation at Pu'u 'O'o Cone on the upper East Rift Zone during the afternoon of 30 April 2018 and the subsequent collapse of its crater floor marked the beginning of the largest lower East Rift Zone eruptive episode in at least 200 years. The daily events of this episode underscored the nature of the interconnected components of the volcanic system. The lava lake level at Halema'uma'u began dropping on 1 May 2018, and fissures first opened on the lower East Rift Zone two days later. The eruptive events of May 2018 (figure 332), the first month of this episode, are described in this report with information provided primarily from the US Geological Survey's (USGS) Hawaiian Volcano Observatory (HVO) in the form of daily reports, volcanic activity notices, and abundant photo, map, and video data.
Summary of events. During 1-11 May, seismicity propagated eastward from Pu'u 'O'o, indicating the intrusion of magma into the middle and lower East Rift Zone (LERZ). The first surface cracks appeared in the LERZ on 2 May, and the first eruptive fissure opened the next afternoon. Fissures were several hundred meters long and formed a NE-SW trending line near the axis of the LERZ that reached about 4 km in length by 8 May. Three large (greater than M 5) earthquakes shook the island on 4 May. New fissures opened daily, with activity consisting of spattering and lava flows; the largest effusion was a flow from fissure 8 that traveled N for a little over 1 km. By 9 May, 15 fissures had opened in the vicinity of the Leilani Estates subdivision; the residents had been evacuated and numerous structures were destroyed by the flows, spatter, and fissures. Active spattering paused on 10 and 11 May, although strong degassing continued, and many cracks within the fissure zone continued to widen.
The lava lake level in the Overlook vent at Halema'uma'u crater at the summit began to drop slowly on 1 May; the rate of deflationary tilt increased by late the next afternoon. The lake level had dropped about 128 m below the vent rim by 5 May, and satellite data indicated a 10 cm subsidence of the Halema'uma'u crater floor during that time. Rockfalls from the crater walls produced ash plumes above Halema'uma'u, resulting in light ashfall in the summit area. By 8 May the lake level was 295 m below the floor of Halema'uma'u crater. Larger rockfalls caused by the dropping lake level generated larger explosions and ash plumes on 9 May.
New fissures began opening again on 12 May in an area about 1.5 km NE of the previous activity on the LERZ, and over the following 11 days flow activity increased substantially, creating multiple flow channels. The fissure 17 flow reached 2.5 km in length on 15 May. A fast-moving flow from fissure 20 headed 4 km SE on 18 May, traveling over 300 m per hour. The two lobes of the flow reached the SE Puna coast overnight on 19-20 May and were joined by another adjacent flow to the west two days later. Fissures 16-23, all located in the NE half of the fissure zone, were active during 12-23 May.
Steam and ash emissions were persistent at Halema'uma'u crater during 12-23 May; they varied in intensity with abrupt increases associated with large rockfalls into the vent, and ashfall reported more than 50 km from the summit. Strong earthquakes at the summit continued in response to the deflation, causing frequent ground shaking and damage to roads and buildings. A large explosion on 17 May generated the highest ash plume for the period; it reached 9.1 km altitude and drifted NE. Intermittent explosive eruptions continued at the summit, and robust plumes of gas, ash, and steam periodically emerged from the Overlook vent.
Beginning on 24 May, activity on the LERZ shifted back towards the SW part of the fissure zone, again impacting the residents of the Leilani Estates subdivision with reactivation of fissures and new flows. While flows continued to reach the ocean on the SE coast, the volume of lava gradually decreased until the supply of lava ceased by 28 May. During 24-26 May fissures 7 and 21 were feeding a perched lava pond and flows that moved E and N within the subdivision. Overnight on 26-27 May activity increased substantially at fissure 7 with a 30-m-tall spatter rampart, and fountains that reached 70 m high feeding a flow moving N. Large cracks opened into fissure 24 adjacent to the reactivated fissure 8; fast-moving flows traveled W then N through the subdivision. By 28 May the eruptive activity was focused on vigorous fountaining at fissure 8, which supplied a voluminous flow that headed rapidly NE.
Intermittent explosions continued from the summit Overlook vent during 24-28 May as a result of the ongoing subsidence at Halema'uma'u. Ash clouds generally rose to about 3.1 km altitude and drifted SW. Earthquakes in the summit region continued as the summit area subsided and adjusted to the withdrawal of magma.
Activity during 1-11 May 2018. An intrusion of magma began overnight on 30 April-1 May into the lower East Rift Zone (LERZ), extending from the vicinity of Pu'u 'O'o eastward at least as far as Highway 130 (15 km E of Pu'u 'O'o). The intrusion began after the collapse of the Pu'u 'O'o crater floor on the afternoon of 30 April; about 250 located earthquakes were reported through the afternoon of 1 May, with the locations migrating eastward during the day. The seismicity consisted primarily of small-magnitude (less than M 3) earthquakes at depths of less than 10 km. During a helicopter overflight to Pu'u 'O'o on 1 May, HVO geologists observed a new fissure and crack extending about 1 km uprift (west) from the W flank of the Pu'u 'O'o cone (figures 333 and 334). A small amount of lava had erupted from the crack, apparently during the collapse of the Pu'u 'O'o crater floor. They also noted a few small, sluggish breakouts of the 61g lava flow, likely from lava still moving through the lava-tube system.
Overnight on 1-2 May, earthquakes continued at a high rate in the area from Highway 130 eastward towards Kapoho (32 km NE of Pu'u 'O'o). Many events were felt by residents and there were reports of nearly constant ground vibration in some areas; seismicity generally migrated eastward (figure 335). During the morning of 2 May a GPS station located about 1.5 km SW of Nanawale Estates (24 km NE of Pu'u 'O'o ) began moving toward the north by several centimeters, indicating the approaching magma intrusion. A tiltmeter at Pu'u 'O'o recorded steady, deflationary tilt throughout the day, with several sharp inflation offsets. Some of these offsets corresponded to short-lived ashy plumes rising from the crater. New small ground cracks less than a few centimeters wide developed across some roads in and adjacent to Leilani Estates (23 km NE of Pu'u 'O'o).
The summit lake level showed very little change immediately after the collapse of the Pu'u 'O'o crater floor, but tiltmeters at the summit began recording deflationary tilt in the early morning of 1 May. The lava lake level had dropped about 20 m by the afternoon of 2 May when the rate of deflationary tilt increased. By the evening of 3 May, it had dropped an additional 37 m.
At 1030 HST on 3 May 2018 ground shaking from a M 5.0 earthquake south of Pu'u 'O'o caused rockfalls and possibly additional collapse into the Pu'u 'O'o crater (figure 336). A short-lived plume of ash produced by this event rose and dissipated as it drifted SW (figure 337).
New ground cracks were reported in Leilani Estates late in the afternoon of 3 May. Hot white vapor and blue fumes emanated from an area of cracking in the eastern part of the subdivision. Spatter began erupting from the cracks shortly before 1700 local time. The Hawaii County Civil Defense coordinated the evacuation of the subdivision. Lava spatter and gas bursts erupted from the fissure for about two hours; lava spread less than 10 m (figure 338).
By the morning of 4 May 2018 three fissures had opened in the eastern portion of Leilani Estates; activity consisted primarily of vigorous lava spattering and development of short lava flows (figure 339). Additional eruptive fissures or vents opened during the day, each several hundred meters long (figure 340). Spatter and lava accumulated primarily within a few tens of meters of the vents. Fissure 6 opened on the eastern edge of the subdivision by the afternoon. Between 1130 and 1500 three large earthquakes (M 5.4, M 6.9, and M 5.3) shook the island along with numerous lower-magnitude events. The M 6.9 event at 1232 HST (the largest on the island in 43 years) produced a robust ash plume at Pu'u 'O'o (figure 341), and numerous rockfall events were triggered at both Pu'u 'O'o and Halema'uma'u craters.
Fissures 7, 8, and 9 opened in the Leilani Estates subdivision on 5 May. Fissure 7 was only active until mid-afternoon (figure 342). Fissure 8 activity included fountaining and occasional bursts of spatter to 100 m as well as building a spatter cone (figure 343); the flow from fissure 9 migrated W. New ground cracks were reported on Highway 130 along the W edge of the subdivision.
Tiltmeters at the summit continued to record a deflationary trend. Satellite InSAR data showed that between 23 April and 5 May 2018 the summit caldera floor subsided about 10 cm. Corresponding to this deflation, the lava lake in the Overlook vent had dropped about 128 m below the crater rim during that same period. Rockfalls from the crater walls into the retreating lake produced ashy plumes above Halema'uma'u crater, resulting in light ashfall in the summit area. During 4 and 5 May about 152 M 2 and M 3 earthquakes occurred at depths less than 5 km beneath the summit area. These earthquakes were related to the ongoing subsidence of the summit area and south flank of the volcano.
Fissure 8 erupted lava fountains until about 1600 on 6 May. By early that afternoon, ten fissures had opened in the Leilani Estates subdivision, but not all were continuing to erupt (figure 344). A lava flow from fissure 8 advanced northward, reaching 1.1 km in length by early evening (figure 345). Deflation continued at the summit with the lava lake dropping at a rate of about 2 m per hour throughout the day, and by evening it had dropped a total of 220 m since 30 April (figure 346).
Two new fissures broke ground in the morning on 7 May. The first (fissure 11) opened in a forested area SW of Leilani Estates and was active for only 3 hours. The second (fissure 12) opened around noon between fissures 10 and 11. By 1515 both new fissures were inactive but the west end of fissure 10 was steaming heavily. Cracks on Highway 130 widened from 7 to 8 cm over the course of the day and additional cracks were found just W of the highway on trend with the previous fissures (figure 347).
By the evening of 8 May 2018, the overall fissure zone was about 4 km long (figure 348), stretching SW-NE across most of the now-evacuated Leilani Estates subdivision; 14 distinct fissures had been mapped, and a lava flow starting from fissure 8 had traveled about 1 km NE from its source. Officials noted that 35 structures had been destroyed. Loud jetting and booming noises were heard from fissure 13 that evening. Rockfalls into the Overlook vent at the summit were intermittently producing small ash plumes that rose several hundred meters above the summit and traveled downwind as the lava lake continued to fall. Based on model data collected in the afternoon, the lake level was about 295 m below the floor of Halema'uma'u Crater by the end of the day on 8 May.
At 0832 HST on 9 May 2018, a large rockfall from the steep crater walls into the summit lava lake triggered an explosion that generated an ash column above Halema'uma'u crater; the ash was blown SSW (figure 349). During the day on 9 May fissure 15 broke ground at the NE edge of the LERZ fissure area and generated a pahoehoe flow about 20 m long. Severe ground cracks associated with fissure 14 were steaming vigorously in the morning (figure 350). During an overflight around 1500 in the afternoon HVO geologists also noticed an area of steaming uprift (west) of Highway 130 at the SW edge of the fissure area. Rates of motion increased late in the morning at a GPS station located 1.5 km SE of Nanawale Estates (about 2 km N of Leilani Estates). The direction of motion was consistent with renewed movement of magma in the downrift direction (to the NE).
Strong degassing continued from existing fissures on 10 and 11 May; although active spatter and lava had paused, several cracks within the fissure zone continued to widen (figure 351). A 3D model constructed of thermal images of Pu'u 'O'o crater taken on 11 May indicated that the deepest part of the crater was 350 m below the rim (figure 352). Hawai'i Volcanoes National Park closed to the public on 11 May due to heightened (daily) earthquake activity at the summit, and concerns about a potentially larger summit explosion.
Activity during 12-23 May 2018. Minor spattering resumed from a new fissure (16) that opened about 0645 on 12 May around 1.5 km NE of fissure 15, at the NE end of the existing vent system (figure 353). It produced a lava flow that traveled about 230 m before stalling in the early afternoon. A steady, vigorous plume of steam and variable amounts of ash rose from the Overlook vent and drifted SW. Over the course of the day, rockfalls from the steep enclosing crater walls at the summit crater periodically generated small ash clouds mixed with water vapor. These ash clouds rose only about a hundred meters above the ground, a few generating very localized ashfall downwind.
A plume of steam and volcanic gas, occasionally mixed with ash, rose from the Overlook vent within Halema'uma'u for much of the day on 13 May 2018. That morning, a new outbreak was reported about 0.5 km NE of fissure 16. Aerial observations of this new fissure (17) indicated it was at least several hundred meters long and produced spatter rising tens of meters into the air. By late in the day, activity was dominated by lava fountaining, explosions of spatter bombs, and several advancing lava flow lobes moving generally NE at the downrift (NE) end of the new fissure system. As of about 1900 on 13 May, one lobe was 2 m thick and advancing roughly parallel to Highway 132 (figure 354). A smaller fissure 18, a few hundred meters S of 17, was weakly active late in the day. A new fissure (19) was spotted early on 14 May producing a sluggish lava flow. By 1430 on 14 May, fissure 17 was producing a lava flow extending about 1.7 km from the fissure (figure 355).
Activity on the LERZ on 15 May 2018 was concentrated at fissure 17 with intermittent spattering at fissure 18; the fissure 17 flow continued to slowly advance ESE reaching a length of nearly 2.5 km in the early morning (figures 356 and 357). A new fissure (20) opened up SW of fissure 18 and produced two small pads of lava. During the morning, ash emissions from the Overlook vent inside Halema'uma'u varied greatly in intensity with abrupt increases likely associated with large rockfalls deep into the vent (figure 358). Ashfall was reported as far away as Discovery Harbor (55 km SW), Pahala (30 km SW), at locations along Highway 11 from Pahala to Volcano, and in the Ka'u Desert section of Hawaii Volcanoes National Park near the summit. NWS radar and pilot reports indicated the top of the ash cloud ranged from 3.0 to 3.7 km altitude.
On the morning of 16 May dense ballistic blocks up to 60 cm across were found in the parking lot a few hundred meters from Halema'uma'u crater, reflecting the most energetic explosions to date. Strong earthquakes within the summit continued in response to ongoing deflation and lava column drop. By the afternoon of 16 May the floor of the larger Kīlauea Caldera had dropped 90 cm from the ongoing deflation, stressing faults around the caldera and causing multiple earthquakes. Employees at the Hawaiian Volcano Observatory, Hawai`i Volcanoes National Park, and nearby residents reported frequent ground shaking and damage to roads and buildings. The decision was made to evacuate HVO's office building on Uekahuna Bluff overlooking Halema'uma'u Crater. Low-level eruption of lava continued from multiple points along the NE end of the active fissure system on the lower East Rift Zone, but spattering generally decreased in vigor throughout the day.
At about 0415 on 17 May an explosion from the Overlook vent produced a volcanic cloud that reached 9.1 km altitude and drifted NE. Traces of ash fell with rain on the Volcano Golf Course, in Volcano Village, and in other areas immediately around the summit (figure 359). Subsequent continued emissions reached 3.7 km altitude; vog or volcanic air pollution produced by volcanic gas was reported in Pahala. After the explosion, seismic levels increased gradually throughout the day.
At the LERZ, fissures 18, 19, and 20 reactivated during the afternoon of 17 May, and a new fissure opened (21) between fissures 7 and 3 (figure 360). Ground cracks continued to open and widen around Leilani Estates, several with both horizontal and vertical offsets (figures 361 and 362). An area 50-90 m wide, parallel to and N of the line of fissures between Highway 130 and Lanipuna Gardens, dropped slightly, forming a depression that pahoehoe flows from fissures 20 and 21 began filling. Fissure 22 opened just downrift of fissure 19.
Spattering continued on 18 May 2018 from fissures 15, 17, 18, 20, 21, and new fissure 22. Pahoehoe lava flows were also erupted from fissures 17, 18, and 20 (figure 363). During the afternoon, fissure 17 was actively spattering fragments as high as 100 m, and the flow was active but had not covered new ground (figure 364). A flow from fissure 18 had traveled approximately 1 km SE. The graben area N of the fissures was still being filled by pahoehoe flows from fissures 20 and 21; fissure 15 produced a flow that crossed Pohoiki Road. Later in the afternoon a fast-moving pahoehoe flow emerged from fissure 20 and traveled SE, moving over 300 m per hour. By late that evening, the flow had three main lobes; the easternmost was E of Pohoiki Road moving about 200 m per hour while the westernmost was near Malamaki Road and moving about 40 m per hour. At the summit, for much of the day, a steady steam plume rose from the Overlook vent. Several minor emissions of ash were observed in web cameras; no significant explosions and no earthquakes greater than M 3.5 had occurred in the previous 24 hours. At 2358 local time, however, a short-lived explosion from Halema'uma'u created an ash cloud that reached up to 3.1 km altitude and was carried SW by the wind.
The rate of lava eruption increased overnight on 18-19 May; fountaining continued at fissure 17, and fissures 16 and 20 merged into a continuous line of spatter and fountaining. Two flows from this consolidated fissure complex were wide, very active, and advancing southward at rates up to 300 m per hour (figures 365 and 366). Flows from fissures 17 and 18 were also still active but advancing slowly, and fissure 18 had stalled by the end of the day. By mid-afternoon on 19 May the two fast-moving flows had joined about a kilometer from the coast and continued to flow southward (figure 367). The GPS instrument located on the NE side of Leilani Estates was no longer moving. While earthquake activity continued, it had not moved farther downrift in the previous few days.
The two flows from the fissure 20 complex entered the ocean at two points along the SE Puna coast overnight on 19-20 May (figure 368). Soon after, a crack opened under the E lava channel diverting some of the lava into underground voids (figure 369) and reducing the amount of lava flowing into the ocean. Spattering continued from fissures 6 and 17 during the day on 20 May. Fissure 23 first appeared at 1100 on 20 May, at the NE corner of the Leilani Estates subdivision near fissures 4 and 14, about 2 km SW of fissure 20; it was only active during 19-20 May. Volcanic gas emissions tripled as a result of the voluminous eruptions from the fissure 20 complex; satellite instruments measured a major increase in SO2 emissions on 19 May (figure 370). Intermittent explosive eruptions continued at the summit, and plumes of gas and steam periodically emerged from the Overlook vent and drifted SW.
The most vigorous eruptive activity during 21-23 May in the lower East Rift Zone, was concentrated in the middle portion of the system of fissures, primarily between fissure 20 on the NE and fissure 23 on the SW (figure 371). Fountaining 50 m high from fissure 22 was feeding the channelized flow reaching the coast (figure 372). Fissure 6 reactivated with spattering and a short flow on 21 May. Fissure 17, at the NE end of the fissure system was only weakly active. On 22 May lava fountains continued from fissures 6 and 22, with fissures 19 and 5 also active; a new area of fountaining also appeared near fissure 23. Fountaining from fissures 5 and 23 fed flows in the eastern part of Leilani Estates and blue methane was observed burning in road cracks overnight on 22-23 May (figure 373). Observers noted that the height of the perched lava pond forming on the NW side of fissures 5 and 6 had reached 11 m above the ground level.
By 23 May, fountains from fissures 5, 6 (figure 374), 13, and 19 were feeding a flow advancing to the S, roughly parallel to the western flow from fissure 22 (figure 375); it reached the ocean late in the afternoon, creating multiple entry points that produced occasional small explosions. Small ash emissions from the Overlook vent occurred frequently during 21-23 May (figure 376). Fissure 8 reactivated briefly in the morning of 23 May and erupted two small pahoehoe flows over the initial `a`a flow.
Activity during 24-28 May 2018. Overnight on 23-24 May field crews observed that fissure areas 2, 7, 8, 3, 14, and 21 had reactivated and were spattering (figure 377). Fissure 22 continued to erupt lava flowing SE to the coast (figure 378). Fissures 7 and 21 were feeding a perched lava pond and pahoehoe flow that advanced eastward later that afternoon. An explosion from the summit Overlook vent just after 1800 on 24 May produced an ash cloud that rose to 3.1 km altitude and had more ash than most recent explosions (figure 379). The National Weather Service Nexrad radar tracked the cloud for 15-20 minutes; moderate trade winds were blowing to the SW.
By 25 May, the two flows from fissure 22 and fissures 6 and 13 were still reaching the ocean with two entry points (figure 380); fissures 7 and 21 were feeding a flow that continued to slowly advance NE, covering several streets in Leilani Estates (figure 381). By the next day, the flow front of fissure 21 had become an 'a'a flow and was continuing to move NE (figure 382), reaching the PGV (Puna Geothermal Venture) property by late afternoon on 26 May. Fissure 7 was feeding a flow that had turned S toward the coast, and at dusk the lava was cascading into the Pawaii crater, adjacent to the western margin of the fissure 6 flow that fed one of the ocean entries. On the W side of fissure 7 a perched pahoehoe flow broke out around 0400 on 26 May, feeding short flows to the W. Multiple small eruptions continued to occur at the summit, most ejecting ash to under 3.1 km altitude. One of the largest occurred about 1617 on 25 May sending ash as high as 3.7 km altitude.
Overnight during 26-27 May fissure 17 was the source of multiple booming gas emissions. Fissure 7 activity increased overnight, producing a large spatter rampart over 30 m tall from fountains reaching 50-70 m high (figure 383). The fountains fed two perched channels, the N channel, 8-15 m thick, fed a lava flow that advanced toward pad E of the PGV property; the S channel was a flow advanced SE. Large cracks were observed overnight near fissure 9 which developed into fissure 24. Fissure 8 had three vents active overnight on 26-27 May that were spattering and flaming; they had doubled in size over the previous 24 hours.
The fissure 21 'a'a flow continued to advance NE onto PGV property but at a slower pace on 27 May. By the end of the day, fissures 7 and 8 were the most active, fountaining and feeding lava flows that advanced NE onto PGV property. At about 1900 HST a fast-moving lava flow broke from this area and advanced rapidly to the N and W through the eastern portion of Leilani Estates, causing additional evacuations. Activity had noticeably diminished from fissures 22 and 13, and the supply of lava to the channel flowing to the sea had ceased by the next day, 28 May. Ash continued to erupt intermittently from the Overlook vent at the summit. Observations from the ground and by UAV during the previous week documented retreat of the Overlook vent wall due to collapse of the steep enclosing walls and rim. Trade winds carried the ash clouds primarily SW.
Fissure 8 fed a fast-moving flow early on 28 May that moved N along the margin of the existing fissure 7 flow before turning E and crossing out of Leilani Estates (figure 384). Flow activity from fissure 8 diminished abruptly midday and a few other fissures reactivated briefly with fissure 7/21 having the tallest fountains. Vigorous fountaining resumed at fissure 8 late in the afternoon, spawning a flow that traveled an estimated 20 m per hour to the NE over the flow of the previous day; fountains were 50-60 m tall (figure 385). During the evening, fissures 16, 18, 22, 13, and 20 were also active, with flows moving S from fissures 16/18. Pele's hair from vigorous fountaining of fissure 8 was being transported downwind, and there were reports of some strands falling in Pahoa. Residents were warned to minimize exposure to Pele's hair, which could cause skin and eye irritation similar to exposure to volcanic ash. Ash continued to erupt intermittently from the vent within Halema'uma'u crater. A magnitude 4.1 earthquake occurred at 1739 HST on the Koa'e fault zone south of the caldera. Earthquakes in the summit region continued as the area subsided and adjusted to the withdrawal of magma.
By 26 May 2018, flows on the lower East Rift Zone had destroyed at least 82 structures including 41 homes since the beginning of May. Twelve more were destroyed on 27 and 28 May as flows continued to move across the region, according to USA Today. By 29 May, activity on the lower East Rift Zone was focused on the vigorous eruption of lava from fissure 8 advancing rapidly downslope towards the NE and Highway 132.
Geologic Background. Kilauea overlaps the E flank of the massive Mauna Loa shield volcano in the island of Hawaii. Eruptions are prominent in Polynesian legends; written documentation since 1820 records frequent summit and flank lava flow eruptions interspersed with periods of long-term lava lake activity at Halemaumau crater in the summit caldera until 1924. The 3 x 5 km caldera was formed in several stages about 1,500 years ago and during the 18th century; eruptions have also originated from the lengthy East and Southwest rift zones, which extend to the ocean in both directions. About 90% of the surface of the basaltic shield volcano is formed of lava flows less than about 1,100 years old; 70% of the surface is younger than 600 years. The long-term eruption from the East rift zone between 1983 and 2018 produced lava flows covering more than 100 km2, destroyed hundreds of houses, and added new coastline.
Information Contacts: Hawaiian Volcano Observatory (HVO), U.S. Geological Survey, PO Box 51, Hawai'i National Park, HI 96718, USA (URL: http://hvo.wr.usgs.gov/); NASA Goddard Space Flight Center (NASA/GSFC), Global Sulfur Dioxide Monitoring Page, Atmospheric Chemistry and Dynamics Laboratory, 8800 Greenbelt Road, Goddard, Maryland, USA (URL: https://so2.gsfc.nasa.gov/); USA Today (URL: https://www.kiiitv.com/article/news/nation-now/hawaii-lava-flow-destroys-12-more-homes-as-Kilauea -volcano-continues-exploding/465-afd62fc3-91d2-4764-9eb9-c3dee473033d).
Krakatau (Indonesia) — October 2018 Cite this Report
Krakatau
Indonesia
6.1009°S, 105.4233°E; summit elev. 285 m
All times are local (unless otherwise noted)
Strombolian, lava flow, and explosive activities resume, June-October 2018
Krakatau volcano in the Sunda Strait between Java and Sumatra, Indonesia experienced a major caldera collapse, likely in 535 CE, that formed a 7-km-wide caldera ringed by three islands (see inset figure 23, BGVN 36:08). Remnants of this volcano coalesced to create the pre-1883 Krakatau Island which collapsed during the 1883 eruption. The post-collapse cone of Anak Krakatau (Child of Krakatau), constructed within the 1883 caldera has been the site of frequent eruptions since 1927. The most recent event was a brief episode of Strombolian activity, ash plumes, and a lava flow during the second half of February 2017. Activity resumed in late June 2018 and continued through early October, the period covered in this report. Information is provided primarily by the Indonesian Center for Volcanology and Geological Hazard Mitigation, referred to as Pusat Vulkanologi dan Mitigasi Bencana Geologi (PVMBG). Aviation reports are provided by the Darwin Volcanic Ash Advisory Center (VAAC), and photographs came from several social media sources and professional photographers.
After the brief event during February 2017, Anak Krakatau remained quiet for about 15 months. PVMBG kept the Alert Level at II, noting no significant changes until mid-June 2018. Increased seismicity on 18 June was followed by explosions with ash plumes beginning on 21 June. Intermittent ash emissions were accompanied by Strombolian activity with large blocks of incandescent ejecta that traveled down the flanks to the ocean throughout July. Explosions were reported as short bursts of seismic activity, repeating multiple times in a day, and producing dense black ash plumes that rose a few hundred meters from the summit. Similar activity continued throughout August, with the addition of a lava flow visible on the S flank that reached the ocean during 4-5 August. Generally increased activity in September resulted in the highest ash plumes of the period, up to 4.9 km altitude on 8 September; high-intensity explosions were heard tens of kilometers away during 9-10 September. PVMBG reported significantly increased numbers of daily explosions during the second half of the month. The thermal signature recorded in satellite data also increased during September, and a large SO2 plume was recorded in satellite data on 23 September.
Activity during June-July 2018. PVMBG noted an increase in seismic activity beginning on 18 June 2018. Foggy conditions hampered visual observations during 19-20 June, but on 21 June gray plumes were observed rising 100-200 m above the summit (figure 41). Two ash plumes were reported on 25 June; the first rose to about 1 km altitude and drifted N, and the second rose to 600 m altitude and drifted S (figure 42).
Incandescence was observed at the summit during 1-2 July 2018, and two ash emissions were reported in VONA's (Volcano Observatory Notice for Aviation) on 3 July. PVMBG reported that during 4-5 July there were four additional ash-producing events, each lasting between 30 and 41 seconds. The last three of these events produced ash plumes that rose 300-500 m above the crater rim and drifted N and NW. The Darwin VAAC reported essentially continuous ash emissions during 3-9 July drifting generally W and SW at about 1.2 km altitude (figure 43). They were intermittently visible in satellite imagery when not obscured by meteoric clouds.
Ash plumes were again observed by the Darwin VAAC in satellite imagery beginning on 13 July 2018 at 1.2 km altitude drifting NW. They were essentially continuous until they gradually decreased and dissipated early on 17 July, rising to 1.2-1.5 km altitude and drifting W, clearly visible in satellite imagery several times during the period. Satellite imagery revealed hotspots several times during July; they ranged from small pixels at the summit (9 July) to clear flow activity down the SE flank on multiple days (12, 19, and 24 July) (figure 44). In the VONA's reported by PVMBG during 15-17 July, they noted intermittent explosions that lasted around 30-90 seconds each. PVMBG reported a black ash plume 500 m above the summit drifting N during the afternoon of 16 July. The Darwin VAAC continued to report ash emission to 1.2-1.5 km altitude during 18-19 July, moving in several different directions; Strombolian activity sent incandescent ejecta in all directions on 19 July (figure 45). During 25-26 July the Darwin VAAC noted continuous minor ash emissions drifting SW at 1.2 km altitude, and a hotspot visible in infrared imagery.
Activity during August-early October 2018. A series of at least nine explosions took place on 2 August 2018 between 1333 and 1757 local time. They ranged from 13 to 64 seconds long, and produced ash plumes that drifted N. The Darwin VAAC reported minor ash observed in imagery at around 2 km altitude for much of the day. In a special report, PVMBG noted a black ash plume 500 m above sea level drifting N at 1757 local time. Continued explosive activity was reported by local observers during the early nighttime hours of 3 August (figure 46).
The Darwin VAAC reported continuous ash emissions rising to 1.8 km altitude and drifting E on 5 August, clearly visible in satellite imagery, along with a strong hotspot. The ash plume drifted SE then S the next day before dissipating. PVMBG reported incandescence visible during the nights of 5-15 August. Photographer Øystein Lund Andersen visited Krakatau during 4-6 August 2018 and recorded Strombolian activity, lava bomb ejecta, and a lava flow entering the ocean (figures 47-50).
Emissions were reported intermittently drifting W on 11, 14, and 16 August at 1.2-1.5 km altitude. Video of explosions on 12 August with large bombs and dark ash plumes were captured by photographer James Reynolds (Earth Uncut TV). PVMBG reported black ash plumes drifting N at 500 m above the summit on 17 and 18 August after explosions that lasted 1-2 minutes each. The Darwin VAAC also reported ash plumes rising to 1.2 km altitude on 17-18 drifting NE. VONA's were issued during 22-23 August reporting at least three explosions that lasted 30-40 seconds and produced ash plumes that drifted N and NE. The Darwin VAAC reported the plume on 22 August as originating from a vent below the summit. PVMBG noted that a dark plume on 23 August drifted NE at about 700 m above the summit. During 27-30 August, the Darwin VAAC reported ash plumes intermittently visible in satellite imagery extending SW at 1.2-1.5 km altitude.
Ash plumes drifting N and NW were visible in satellite imagery during 3-4 September at 1.2-1.5 km altitude. The Darwin VAAC reported an ash plume moving NW and W at 4.9 km altitude on 8 September, the highest plume noted for the report period. The following day, the plume height had dropped to 1.5 km altitude, and was clearly observed drifting W in satellite imagery. A hotspot was reported on 12 September. During the night of 9-10 September PVMBG reported bursts of incandescent material rising 100-200 m above the peak, with explosions that rattled windows at the Anak Krakatau PGA Post, located 42 km from the volcano. Ash plumes continued to be observed through 13 September. The Darwin VAAC reported continuous ash emissions to 1.8 km altitude drifting W and NW on 16-17 September (figure 51). The ash plume was no longer visible on 18 September, but a hotspot remained discernable in satellite data through 20 September.
PVMBG reported incandescence at the summit and gray and black ash plumes on 20 September that rose 500 m above the summit. A low-level ash emission was reported drifting S on 21 September and confirmed in the webcam. Four VONA's were issued that day, reporting explosions at 0221, 0827, 2241, and 2248, lasting from 72-115 seconds each. PVMBG subsequently reported observing 44 explosions with black ash plumes rising 100-600 m above the summit, and incandescence at night on 21 September. Ash emissions continued on 22 September at 1.5 km altitude, with a secondary explosion rising to 2.4 km altitude drifting W. The plume height was based on and infrared temperature measurement of 12 degrees C. Later in the day, an additional plume was observed in satellite imagery at 3.7 km altitude drifting N. PVMBG reported observations of 56 explosions, with 200-300 m high (above the summit) black ash plumes and incandescence at night on 22 September. Observations from nearby Rakata Island on 22 September indicated that tephra from incandescent explosions of the previous night mostly fell on the flanks, but some reached the sea. A lava flow on the SSE flank had also reached the ocean (figure 52).
By 23 September 2018, a single plume was observed at 2.1 km altitude drifting WNW. A glow at the summit was visible in the webcam that day, and a hotspot was seen in satellite imagery the next day as observations of an ash plume drifting W at 2.1 km continued. A significant SO2 plume was captured in satellite data on 23 September (figure 53).
On 24 September, PVMBG reported black ash plumes rising 1,000 m above the summit, incandescence at the summit, and lava flowing 300 m down the S flank observed in the webcam during the night. An ash plume was observed by the Darwin VAAC drifting WSW and then W on 25-26 September at 2.1 km altitude, lowering slightly to 1.8 km the following day, and to 1.2 km on 28 September. Continuous ash emissions were observed through 29 September. A new emission was reported on 30 September drifting SW at 1.8 km altitude. Ash emissions were observed daily by the Darwin VAAC from the 1st to at least 5 October at 2.1 km altitude drifting W. A large hotspot near the summit was noted on 3 October. The thermal activity at Anak Krakatau from late June into early October 2018, as recorded in infrared satellite data by the MIROVA project, confirmed the visual observations of increased activity that included Strombolian explosions, lava flows, ash plumes, and incandescent ejecta witnessed by ground observers during the period (figure 54).
Geologic Background. The renowned Krakatau (frequently mis-named as Krakatoa) volcano lies in the Sunda Strait between Java and Sumatra. Collapse of an older edifice, perhaps in 416 or 535 CE, formed a 7-km-wide caldera. Remnants of that volcano are preserved in Verlaten and Lang Islands; subsequently the Rakata, Danan, and Perbuwatan cones were formed, coalescing to create the pre-1883 Krakatau Island. Caldera collapse during the catastrophic 1883 eruption destroyed Danan and Perbuwatan, and left only a remnant of Rakata. This eruption caused more than 36,000 fatalities, most as a result of tsunamis that swept the adjacent coastlines of Sumatra and Java. Pyroclastic surges traveled 40 km across the Sunda Strait and reached the Sumatra coast. After a quiescence of less than a half century, the post-collapse cone of Anak Krakatau (Child of Krakatau) was constructed within the 1883 caldera at a point between the former Danan and Perbuwatan cones. Anak Krakatau has been the site of frequent eruptions since 1927.
Information Contacts: Pusat Vulkanologi dan Mitigasi Bencana Geologi (PVMBG, also known as Indonesian Center for Volcanology and Geological Hazard Mitigation, CVGHM), Jalan Diponegoro 57, Bandung 40122, Indonesia (URL: http://www.vsi.esdm.go.id/); Darwin Volcanic Ash Advisory Centre (VAAC), Bureau of Meteorology, Northern Territory Regional Office, PO Box 40050, Casuarina, NT 0811, Australia (URL: http://www.bom.gov.au/info/vaac/); MIROVA (Middle InfraRed Observation of Volcanic Activity), a collaborative project between the Universities of Turin and Florence (Italy) supported by the Centre for Volcanic Risk of the Italian Civil Protection Department (URL: http://www.mirovaweb.it/); Sentinel Hub Playground (URL: https://www.sentinel-hub.com/explore/sentinel-playground); Sutopo Purwo Nugroho, BNPB (Twitter: @Sutopo_PN, URL: https://twitter.com/Sutopo_PN); Øystein Lund Andersen (Twitter: @OysteinLAnderse, https://twitter.com/OysteinLAnderse, URL: http://www.oysteinlundandersen.com); Reuters Latam (Twitter: @ReutersLatam, URL: http://www.reuters.com/); James Reynolds, Earth Uncut TV (Twitter: @EarthUncutTV, URL: https://www.earthuncut.tv/, Video: https://www.youtube.com/watch?v=UD3SLWtuPZs); Thibaud Plaquet (Instagram: tibomvm, URL: https://www.instagram.com/tibomvm/); Malmo Travel (Instagram: malmo.travel, URL: https://www.instagram.com/malmo.travel/).
Ol Doinyo Lengai (Tanzania) — October 2018 Cite this Report
Ol Doinyo Lengai
Tanzania
2.764°S, 35.914°E; summit elev. 2962 m
All times are local (unless otherwise noted)
Effusive activity continues at the summit through August 2018 with small lava flows and spattering confined to the crater
Ol Doinyo Lengai is the only volcano on Earth currently erupting carbonatite lavas. Activity is based in the crater offset to the N about 100 m below the summit, where hornitos (small cones) and pit craters produce lava flows and spattering. After displaying effusive activity in the north crater since at least 1983, it became filled and lava began overflowing in 1998. The eruption transitioned to significant explosive activity in September 2007 through March 2008 that cleared out and recreated the crater (figure 175). Since then, intermittent effusive carbonatite eruptions have continued. This report summarizes observed activity from August 2014 through August 2018, including observations by visitors and satellite data (figure 176).
Lava fountaining was seen by geologists on 5 July 2014 (BGVN 39:07). A tourist report on Trip Advisor for an unknown date in July 2014 described potential fumarolic activity, while another report that month did not note any activity. No clear reports are known describing activity between August 2014 and May 2015. On 20 June 2015 an Earth Sciences group from the University of Glasgow and University of Dodoma, including volcanologist David Brown, visited the crater (figure 177). They observed minor eruptive activity consisting of gentle spattering at one of the mounds. Evidence of this activity continuing through August is seen in Landsat satellite images (figure 178).
Only one Sentinel-2 thermal image (out of 22 cloud-free images) contained elevated temperatures during 2016. The image showed activity in the northern part of the crater. Landsat-8 true color images show color variations on the crater floor in October 2016 indicating activity at that time (figure 179).
On 29-30 November 2017, a French-Belgium team including M. Kervyn conducted a summit morphology study. Accounts from previous visitors in September-October 2017 reported significant activity in the large half-cone with regular emission of spatter from the summit vent. They observed significant fumarolic activity and the remnants of rockfalls in the crater. Several secondary vents were visible on the side of the large half-cone along the western wall, but no activity was witnessed at this time (figure 180). Active spattering was occurring from a lava pool within a vent in the north-central part of the crater where spattering up to 10 m above the vent continued for several hours (figure 181). A circular cavity in the north-central part of the crater contained a lava pool that had partially crusted over. Darker surfaces suggested recent activity from several vents in the crater.
Sentinel-2 thermal satellite images acquired during 2017 show intermittent activity in the crater (figure 182). Out of 21 cloud-free images, 13 contained elevated thermal signatures between April through December. The locations of the activity move around the crater, indicating that the center of activity was variable through time. Lava pond activity was also noted in early December 2017 by Gian Schachenmann, documented with photos taken during an overflight and posted at Volcano Discovery.
On 1-2 July 2018, K. A. Laxton and F. Boschetty from University College London visited the summit, accompanied by local guides Papakinye Lemolo Ngayeni, Amadeus Mtui, and Ignas Mtui. Vigorous fumarolic activity was observed near the summit, with sulfur deposits and acrid-smelling gases. A small lava flow was observed that had cooled and turned from black to white by later that day. A pool of lava was observed inside a small hornito in the southern area of the crater floor (figure 183). A small cluster of hornitos were developing in the southern area of the crater and one produced a lava flow on 2 July (figure 184).
A video taken by Patrick Marcel in August 2018 showed a recent lava flow that had occurred from a vent at the base of the crater wall and an active flow over-spilling from an active lava pond (figure 185). Throughout 2018, there were 18 out of 24 Sentinel-2 thermal cloud-free images which contained areas of elevated thermal activity. Like 2017, the 2018 activity was located in different areas around the crater (figure 186).
Geologic Background. The symmetrical Ol Doinyo Lengai is the only volcano known to have erupted carbonatite tephras and lavas in historical time. The prominent stratovolcano, known to the Maasai as "The Mountain of God," rises abruptly above the broad plain south of Lake Natron in the Gregory Rift Valley. The cone-building stage ended about 15,000 years ago and was followed by periodic ejection of natrocarbonatitic and nephelinite tephra during the Holocene. Historical eruptions have consisted of smaller tephra ejections and emission of numerous natrocarbonatitic lava flows on the floor of the summit crater and occasionally down the upper flanks. The depth and morphology of the northern crater have changed dramatically during the course of historical eruptions, ranging from steep crater walls about 200 m deep in the mid-20th century to shallow platforms mostly filling the crater. Long-term lava effusion in the summit crater beginning in 1983 had by the turn of the century mostly filled the northern crater; by late 1998 lava had begun overflowing the crater rim.
Information Contacts: Matthieu Kervyn, Vrije Universiteit Brussel, Department of Geography, Pleinlaan 2, 1050 Brussels, Belgium (URL: http://we.vub.ac.be/en/matthieu-kervyn-de-meerendre); Kate Laxton and Felix Boschetty, University College London, Gower Street, London, WC1E 6BT, United Kingdom (URL: https://www.ucl.ac.uk/earth-sciences/people/research-students/kate-laxton); Patrick Marcel (URL: https://www.youtube.com/watch?v=ZqxuYOEFNLk); David Brown, School of Geographical and Earth Sciences, University of Glasgow, University Avenue, Glasgow G12 8QQ, United Kingdom (URL: https://www.gla.ac.uk/schools/ges/staff/davidbrown/); Sentinel Hub Playground (URL: https://www.sentinel-hub.com/explore/sentinel-playground); Gian Schachenmann, Volcano Discovery (URL: https://www.volcanodiscovery.com/nl/photos/ol-doinyo-lengai/dec2017/crater.html); Trip Advisor (URL: https://www.tripadvisor.com with initial search term 'Ol Doinyo Lengai').
Mayon (Philippines) — October 2018 Cite this Report
Mayon
Philippines
13.257°N, 123.685°E; summit elev. 2462 m
All times are local (unless otherwise noted)
Low activity during April-September with some ash plumes and ongoing crater incandescence
Mayon is a frequently active volcano in the Philippines that produces ash plumes, lava flows, pyroclastic flows, and lahars. In early 2018, eruptive activity included lava fountaining that reached 700 m above the summit, and lava flows that traveled down the flanks and collapsed to produce pyroclastic flows (figure 39). Lava fountaining and lava flows decreased then ceased towards late March. Lava effusion was last detected on 18 March 2018, and the last pyroclastic flow for this eruptive episode occurred on 27 March 2018 (see BVGN 43:04). The hazard status for was lowered from alert level 4 to 3 (on a scale of 0 to 5) on 6 March 2018 due to decreased seismicity and degassing; the level was lowered again to 2 on 29 March. This report summarizes the activity during April through September 2018 and is based on daily bulletins issued by the Philippine Institute of Volcanology and Seismology (PHIVOLCS) and satellite data.
The hazard status remained on Alert level 2 (increasing unrest) throughout the reporting period. Activity was minimal with low seismicity (zero to four per day) and a total of 19 rockfall events throughout the entire period. White to light-brown plumes that reached a maximum of 1 km above the crater were observed almost every day from April through September (figure 40). Two short-lived light brown plumes were noted on 27 and 28 August and both reached 200 m above the crater.
On the days that sulfur dioxide was measured, the amount ranged from 436 to 2,800 tons per day (figure 41). Mayon remains inflated relative to 2010 baselines but the edifice has experienced deflation since 20 February, a period of inflation from 2-14 April, and slight inflation of the mid-slopes beginning 5 May, which then became more pronounced beginning 25 June. No other notable inflation or deflation was described throughout the reporting period.
Incandescence at the summit was observed almost every night (when weather permitted) from April through to the end of September 2018, and this elevated crater temperature is also seen in satellite thermal imagery (figure 42). Thermal satellite data showed a slight increase in output during April through to June, although not as high as the earlier 2018 activity, with a decline in thermal output starting in July (figure 43).
Geologic Background. Symmetrical Mayon, which rises above the Albay Gulf NW of Legazpi City, is the most active volcano of the Philippines. The steep upper slopes are capped by a small summit crater. Recorded eruptions since 1616 CE range from Strombolian to basaltic Plinian, with cyclical activity beginning with basaltic eruptions, followed by longer term andesitic lava flows. Eruptions occur predominately from the central conduit and have also produced lava flows that travel far down the flanks. Pyroclastic flows and mudflows have commonly swept down many of the approximately 40 ravines that radiate from the summit and have often damaged populated lowland areas. A violent eruption in 1814 killed more than 1,200 people and devastated several towns.
Information Contacts: Philippine Institute of Volcanology and Seismology (PHIVOLCS), Department of Science and Technology, University of the Philippines Campus, Diliman, Quezon City, Philippines (URL: http://www.phivolcs.dost.gov.ph/); MIROVA (Middle InfraRed Observation of Volcanic Activity), a collaborative project between the Universities of Turin and Florence (Italy) supported by the Centre for Volcanic Risk of the Italian Civil Protection Department (URL: http://www.mirovaweb.it/); Sentinel Hub Playground (URL: https://www.sentinel-hub.com/explore/sentinel-playground).
Saunders (United Kingdom) — October 2018 Cite this Report
Saunders
United Kingdom
57.8°S, 26.483°W; summit elev. 843 m
All times are local (unless otherwise noted)
Intermittent thermal pulses and satellite imagery hotspots during September 2016-September 2018
Historical observations of eruptive activity on ice-covered Mount Michael stratovolcano on Saunders Island in the South Sandwich Islands were not recorded until the early 19th century at this remote site in the southernmost Atlantic Ocean. With the advent of satellite observation technology, indications of more frequent eruptive activity have become apparent. The last confirmed eruption evidenced by MODVOLC thermal alerts was during August-October 2015 (BGVN 41:02). Limited thermal anomaly data and satellite imagery since then have indicated intermittent activity through September 2018. Information for this report comes from MODVOLC and MIROVA thermal anomaly data and Sentinel-2, Landsat, and NASA Terra satellite imagery.
Evidence for thermal activity at Mount Michael tapered off in MIROVA data from October 2015 through January 2016. MODVOLC thermal alerts reappeared on 28 September 2016 and recurred intermittently through 6 January 2017. Low-level MIROVA thermal signals appeared in June and September-November 2017. During January-September 2018, evidence for some type of thermal or eruptive activity was recorded from either MODVOLC, MIROVA, or satellite imagery each month except for May and June.
Although MODVOLC thermal alerts at Mount Michael ended on 8 October 2015, the MIROVA radiative power data showed intermittent pulses of decreasing energy into early January 2016 (figure 10, BGVN 41:02). At a high-latitude, frequently cloud-covered site such as Saunders Island, this could be indicative of continued eruptive activity. A white plume in low resolution NASA's Terra satellite data was spotted drifting away from Saunders in April 2016, but no thermal activity was reported. The only high-confidence data available from April 2016 through May 2017 is from the MODVOLC thermal alert system, which recorded two thermal alerts on 28 September 2016, one the next day, one on 30 October, and eight alerts on four days in November. Activity continued into January 2017 with one alert on 17 December 2016, and six alerts on 2 and 6 January 2017 (figure 11).
A low-level log radiative power MIROVA signal appeared in early June 2017; two more signals appeared in September 2017, one in early October and one in late November (figure 12). Additional signals plotted as more than 5 km from the source may or may not reflect activity from the volcano. Steam plumes were visible in NASA Terra satellite images drifting away from the island in August, October, and December 2017, but no thermal signatures were captured.
More sources of evidence for activity became available in 2018 with the addition of the Sentinel-2 satellite data during the months of February-April and September. Multiple thermal signals appeared from MIROVA in January 2018 (figure 13), and the first Sentinel-2 satellite image showed a distinct hotspot at the summit on 10 February (figure 14).
A MODVOLC thermal alert appeared on 26 March 2019 followed by a significant hotspot signal in Sentinel-2 imagery on 29 March (figure 15). The hotspot was still present along with a substantial steam plume on 3 April 2018. Sentinel-2 imagery on 11 April revealed a large steam plume and cloud cover, but no hotspot.
MIROVA thermal signals appeared in mid-July and mid-August 2018 (figure 13) but little satellite imagery was available to confirm any thermal activity. The next clear signal of eruptive activity was evident in a Sentinel-2 image as a hotspot at the summit on 23 September. A small MIROVA signal was recorded the same day (figure 13, bottom). A few days later, on 28 September 2018, a Landsat 8 image showed a clear streak of dark-gray ash trending NW from the summit of Mount Michael (figure 16).
Geologic Background. Saunders Island consists of a large central volcanic edifice intersected by two seamount chains, as shown by bathymetric mapping (Leat et al., 2013). The young Mount Michael stratovolcano dominates the glacier-covered island, while two submarine plateaus, Harpers Bank and Saunders Bank, extend north. The symmetrical Michael has a 500-m-wide summit crater and a remnant of a somma rim to the SE. Tephra layers visible in ice cliffs surrounding the island are evidence of recent eruptions. Ash clouds were reported from the summit crater in 1819, and an effusive eruption was inferred to have occurred from a N-flank fissure around the end of the 19th century and beginning of the 20th century. A low ice-free lava platform, Blackstone Plain, is located on the north coast, surrounding a group of former sea stacks. A cluster of cones on the SE flank, the Ashen Hills, appear to have been modified since 1820 (LeMasurier and Thomson, 1990). Analysis of satellite imagery available since 1989 (Gray et al., 2019; MODVOLC) suggests frequent eruptive activity (when weather conditions allow), volcanic clouds, steam plumes, and thermal anomalies indicative of a persistent, or at least frequently active, lava lake in the summit crater. Due to this observational bias, there has been a presumption when defining eruptive periods that activity has been ongoing unless there is no evidence for at least 10 months.
Information Contacts: Hawai'i Institute of Geophysics and Planetology (HIGP) - MODVOLC Thermal Alerts System, School of Ocean and Earth Science and Technology (SOEST), Univ. of Hawai'i, 2525 Correa Road, Honolulu, HI 96822, USA (URL: http://modis.higp.hawaii.edu/); MIROVA (Middle InfraRed Observation of Volcanic Activity), a collaborative project between the Universities of Turin and Florence (Italy) supported by the Centre for Volcanic Risk of the Italian Civil Protection Department (URL: http://www.mirovaweb.it/); Sentinel Hub Playground, (URL: https://www.sentinel-hub.com/explore/sentinel-playground); NASA Worldview (URL: https://worldview.earthdata.nasa.gov/).
Villarrica (Chile) — October 2018 Cite this Report
Villarrica
Chile
39.42°S, 71.93°W; summit elev. 2847 m
All times are local (unless otherwise noted)
Thermal activity increases November-December 2017 and July-August 2018; intermittent incandescence and ash
Historical eruptions at Chile's Villarrica, documented since 1558, have consisted largely of mild-to-moderate explosive activity with occasional lava effusion. An intermittently active lava lake at the summit has been the source of explosive activity, incandescence, and thermal anomalies for several decades. A large explosion on 3 March 2015 included a 9-km-altitude ash plume; significant thermal anomalies from intermittent Strombolian activity at the lava lake and small ash emissions have continued since that time. Sporadic but reduced activity during November 2017-August 2018 is covered in this report, with information provided primarily by the Southern Andes Volcano Observatory (Observatorio Volcanológico de Los Andes del Sur, OVDAS), part of Chile's National Service of Geology and Mining (Servicio Nacional de Geología y Minería, SERNAGEOMIN), and Projecto Observación Villarrica Internet (POVI), part of the Fundacion Volcanes de Chile, a research group that studies volcanoes across Chile.
Seismicity increased during the second half of November 2017, along with observations of increased incandescence at night from occasional explosions inside the summit crater. Satellite instruments measured a brief surge of thermal activity from late November through early December. The next episode of increased activity occurred in the second half of February 2018 with minor satellite thermal data and webcam views of incandescence. A slow but sustained increase in energy was recorded during March 2018; sporadic incandescence was reported a few times each month between March and May, but observations indicated that the lava lake level was over 100 m below the crater rim. Satellite and webcam observations of incandescence increased in frequency and intensity during June; sporadic ash emissions were noted during mid- and late July. Continuous incandescence was observed in webcams during August 2018; satellite thermal data identified an abrupt rise in thermal energy in late July that remained at a low level into early September 2018.
Activity during November 2017-January 2018. OVDAS reported that during November 2017, the webcams near the summit showed evidence of low-intensity, predominantly white degassing to low altitudes (100 m above the summit). Nighttime incandescence associated with occasional explosions inside the crater were typical. They also noted that long-period (LP) seismicity increased in both energy amplitude and frequency during the last few days of the month. A gradual increase in RSAM values began on 15 November with a continuous tremor signal. A magnitude 4.1 event occurred on 24 November located 2.6 km ESE of the summit at a depth of 1.8 km. A single MODVOLC thermal alert was reported on 28 November. According to POVI the lava lake on the crater floor subsided 8 m between 10 and 20 November (figure 54); during the second half of the month they documented 50-m-high lava fountains, spatter on the crater rim, incandescent jets, and fresh ashfall on the snow cover around the crater rim (figures 55 and 56).
On 5 December 2017, SERNAGEOMIN raised the Alert Level at Villarrica from Green to Yellow (on a 4-level scale), noting a progressive increase in seismic and thermal energy since 15 November. They increased the restricted radius from 500 to 1,000 m from the summit crater. SERNAGEOMIN reported low-intensity degassing during the first half of December 2017, mostly white, and rising not more than 650 m above the crater. Incandescence was visible on clear nights, with occasional explosions that remained below the crater rim. They reported that increased surficial activity was visible during the first few days of December, followed by a decrease in activity (figure 57). POVI images at the end of December (figure 58) showed that the lake level had dropped more than 45 m between 5 and 27 December 2017. Seismicity also decreased throughout the month, reaching its lowest level of the year at the end of December.
On 6 January 2018 SERNAGEOMIN lowered the Alert Level to Green, noting a reduced thermal signal, low-level white degassing rising less than 300 m above the crater, and only occasional nighttime incandescence associated with explosions below the crater rim during the second half of December. POVI noted that the drop in seismicity at the end of December corresponded to the end of a 17-month-long period of increased seismicity (figure 59).
Activity during February-August 2018. Activity remained low at Villarrica during January 2018. Steam plumes rose less than 550 m above the crater and no thermal activity was apparent. After about six weeks of low activity, Sentinel-2 images indicated an increase in thermal activity between 5 and 18 February 2018 (figure 60). The Villarrica webcam also recorded incandescence at the summit for the first time in two months on 25 February 2018.
While SERNAGEOMIN reported only white degassing to less than 50 m above the summit in March 2018, POVI noted that seismic instruments recorded a slow but sustained increase in released energy. The lava lake was not visible and remained more than 110 m below the crater rim; a small spatter event was detected by a webcam on 7 March 2018 (figure 61). Sporadic incandescence, including on 13 and 20 March, was captured with a webcam located in Pucón, about 16 km N of the summit.
A research effort in mid-March 2018 by Liu et al. (2019) to capture gas emissions close to the vent using Unmanned Aerial Systems (UAS) demonstrated good agreement between gas ratios obtained from simultaneous UAS- and ground-based multi-GAS acquisitions. The UAS measurements, however, taken from the young, less diluted gas plume revealed additional short-term patterns that reflected active degassing through discrete, audible gas exhalations (figures 62 and 63).
A minor collapse of the crater wall caused a small plume of ash that rose a short distance above the summit on 29 March 2018. POVI's time-lapse webcams located in Pucón captured the event. Overnight on 1-2 April, sporadic incandescence was observed in the webcams and in Sentinel-2 satellite imagery. SERNAGEOMIN reported a single MIROVA alert signal on 13 April and an abrupt fall of the seismic signal on 27 April. The POVI webcam captured the brightest incandescence since mid-December 2017 on 3 May 2018. SERNAGEOMIN reported incandescence at the summit again on 23 May, and two thermal alerts on 22 and 25 May 2018.
While gas emissions remained less than 150 m above the summit during June 2018, observations of incandescence at night increased and were reported on 14, 18, 24, and 28 June, and were accompanied by satellite thermal signals on 14 and 24 June. Sporadic ash emissions that reached 400 m above the summit were reported by SERNAGEOMIN during July. The POVI webcam in Pucón captured an ash emission on 16 July 2018 that left ash and pyroclastic debris around the crater rim (figures 64 and 65). A second emission was recorded on 18 July;the Sentinel-2 satellite recorded the largest summit thermal signature since 10 December 2017 the same day.
Activity continued to increase during July 2018; POVI photographed significant incandescence at the summit on 19 July and again on 25, 29, and 30 July after a period of cloudy weather. ESA's Sentinel-2 camera measured the largest heat area on the summit since August 2015 on 30 July (figure 66). As a result, the interior of the crater lost much of its snow cover and ice (figure 67). Ash and lapilli were visible in satellite imagery on the eastern edges of the crater.
SERNAGEOMIN reported continuous incandescence at the summit during August nights when the weather was clear. POVI noted on 31 August 2018 that the lake level had not changed during the month and was about 75 m below the inner W rim of the crater. The lake level remained unchanged during the first 10 days of September 2018 as well (figure 68).
The thermal signature in the MIROVA graph for the period from October 2017 through August 2018 showed two clear increases in thermal energy between late November and mid-December 2017, and again from mid-June through August 2018 (figure 69). These corresponded well with MODVOLC thermal alert data which recorded one alert on 28 November 2017, 10 alerts during 2-11 December 2017, and five alerts between 30 July and 2 August 2018.
Reference: Liu, E. J., Wood, K., Mason, E., Edmonds, M., Aiuppa, A., Giudice, G., Bitetto, M., Francofonte, V., Burrow, S., Richardson, T., Watson, M., Pering, T.D., Wilkes, T.C., McGonigle, A.J.S., Velasquez, G., Melgarejo, C., and Bucarey, C., 2019. Dynamics of outgassing and plume transport revealed by proximal unmanned aerial system (UAS) measurements at Volcán Villarrica, Chile. Geochemistry, Geophysics, Geosystems, 20. https://doi.org/10.1029/2018GC007692
Geologic Background. The glacier-covered Villarrica stratovolcano, in the northern Lakes District of central Chile, is ~15 km south of the city of Pucon. A 2-km-wide caldera that formed about 3,500 years ago is located at the base of the presently active, dominantly basaltic to basaltic-andesite cone at the NW margin of a 6-km-wide Pleistocene caldera. More than 30 scoria cones and fissure vents are present on the flanks. Plinian eruptions and pyroclastic flows that have extended up to 20 km from the volcano were produced during the Holocene. Lava flows up to 18 km long have issued from summit and flank vents. Eruptions documented since 1558 CE have consisted largely of mild-to-moderate explosive activity with occasional lava effusion. Glaciers cover 40 km2 of the volcano, and lahars have damaged towns on its flanks.
Information Contacts: Servicio Nacional de Geología y Minería (SERNAGEOMIN), Observatorio Volcanológico de Los Andes del Sur (OVDAS), Avda Sta María No. 0104, Santiago, Chile (URL: http://www.sernageomin.cl/); Proyecto Observación Villarrica Internet (POVI) (URL: http://www.povi.cl/); MIROVA (Middle InfraRed Observation of Volcanic Activity), a collaborative project between the Universities of Turin and Florence (Italy) supported by the Centre for Volcanic Risk of the Italian Civil Protection Department (URL: http://www.mirovaweb.it/); Hawai'i Institute of Geophysics and Planetology (HIGP) - MODVOLC Thermal Alerts System, School of Ocean and Earth Science and Technology (SOEST), Univ. of Hawai'i, 2525 Correa Road, Honolulu, HI 96822, USA (URL: http://modis.higp.hawaii.edu/).