Recently Published Bulletin Reports
Kadovar (Papua New Guinea) An ash plume and weak thermal anomaly during May 2023
San Miguel (El Salvador) Small gas-and-ash explosions during March and May 2023
Ebeko (Russia) Continued explosions, ash plumes, and ashfall during October 2022-May 2023
Home Reef (Tonga) Discolored plumes continued during November 2022-April 2023
Semisopochnoi (United States) Occasional explosions, ash deposits, and gas-and-steam plumes during December 2022-May 2023
Ambae (Vanuatu) New lava flow, ash plumes, and sulfur dioxide plumes during February-May 2023
Ibu (Indonesia) Daily ash explosions continue, along with thermal anomalies in the crater, October 2022-May 2023
Dukono (Indonesia) Continuing ash emissions, SO2 plumes, and thermal signals during October 2022-May 2023
Sabancaya (Peru) Explosions, gas-and-ash plumes, and thermal activity persist during November 2022-April 2023
Sheveluch (Russia) Significant explosions destroyed part of the lava-dome complex during April 2023
Bezymianny (Russia) Explosions, ash plumes, lava flows, and avalanches during November 2022-April 2023
Chikurachki (Russia) New explosive eruption during late January-early February 2023
Kadovar (Papua New Guinea) — June 2023  Cite this Report
Kadovar
Papua New Guinea
3.608°S, 144.588°E; summit elev. 365 m
All times are local (unless otherwise noted)
An ash plume and weak thermal anomaly during May 2023
Kadovar is a 2-km-wide island that is the emergent summit of a Bismarck Sea stratovolcano. It lies off the coast of New Guinea, about 25 km N of the mouth of the Sepik River. Prior to an eruption that began in 2018, a lava dome formed the high point of the volcano, filling an arcuate landslide scarp open to the S. Submarine debris-avalanche deposits occur to the S of the island. The current eruption began in January 2018 and has comprised lava effusion from vents at the summit and at the E coast; more recent activity has consisted of ash plumes, weak thermal activity, and gas-and-steam plumes (BGVN 48:02). This report covers activity during February through May 2023 using information from the Darwin Volcanic Ash Advisory Center (VAAC) and satellite data.
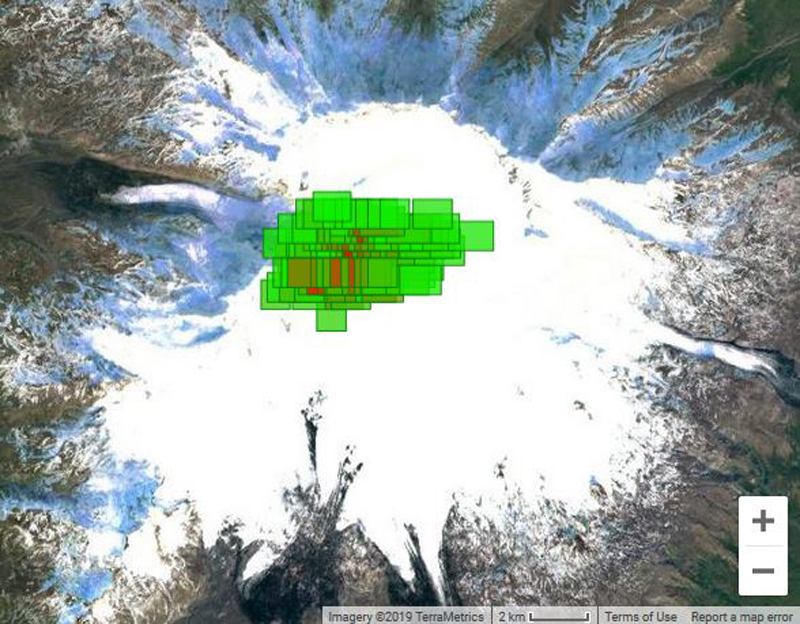
Activity during the reporting period was relatively low and mainly consisted of white gas-and-steam plumes that were visible in natural color satellite images on clear weather days (figure 67). According to a Darwin VAAC report, at 2040 on 6 May an ash plume rose to 4.6 km altitude and drifted W; by 2300 the plume had dissipated. MODIS satellite instruments using the MODVOLC thermal algorithm detected a single thermal hotspot on the SE side of the island on 7 May. Weak thermal activity was also detected in a satellite image on the E side of the island on 14 May, accompanied by a white gas-and-steam plume that drifted SE (figure 68).
Geologic Background. The 2-km-wide island of Kadovar is the emergent summit of a Bismarck Sea stratovolcano of Holocene age. It is part of the Schouten Islands, and lies off the coast of New Guinea, about 25 km N of the mouth of the Sepik River. Prior to an eruption that began in 2018, a lava dome formed the high point of the andesitic volcano, filling an arcuate landslide scarp open to the south; submarine debris-avalanche deposits occur in that direction. Thick lava flows with columnar jointing forms low cliffs along the coast. The youthful island lacks fringing or offshore reefs. A period of heightened thermal phenomena took place in 1976. An eruption began in January 2018 that included lava effusion from vents at the summit and at the E coast.
Information Contacts: Darwin Volcanic Ash Advisory Centre (VAAC), Bureau of Meteorology, Northern Territory Regional Office, PO Box 40050, Casuarina, NT 0811, Australia (URL: http://www.bom.gov.au/info/vaac/); Hawai'i Institute of Geophysics and Planetology (HIGP) - MODVOLC Thermal Alerts System, School of Ocean and Earth Science and Technology (SOEST), Univ. of Hawai'i, 2525 Correa Road, Honolulu, HI 96822, USA (URL: http://modis.higp.hawaii.edu/); Copernicus Browser, Copernicus Data Space Ecosystem, European Space Agency (URL: https://dataspace.copernicus.eu/browser/).
San Miguel (El Salvador) — June 2023 Cite this Report
San Miguel
El Salvador
13.434°N, 88.269°W; summit elev. 2130 m
All times are local (unless otherwise noted)
Small gas-and-ash explosions during March and May 2023
San Miguel in El Salvador is a broad, deep crater complex that has been frequently modified by eruptions recorded since the early 16th century and consists of the summit known locally as Chaparrastique. Flank eruptions have produced lava flows that extended to the N, NE, and SE during the 17-19th centuries. The most recent activity has consisted of minor ash eruptions from the summit crater. The current eruption period began in November 2022 and has been characterized by frequent phreatic explosions, gas-and-ash emissions, and sulfur dioxide plumes (BGVN 47:12). This report describes small gas-and-ash explosions during December 2022 through May 2023 based on special reports from the Ministero de Medio Ambiente y Recursos Naturales (MARN).
Activity has been relatively low since the last recorded explosions on 29 November 2022. Seismicity recorded by the San Miguel Volcano Station (VSM) located on the N flank at 1.7 km elevation had decreased by 7 December. Sulfur dioxide gas measurements taken with DOAS (Differential Optical Absorption Spectroscopy) mobile equipment were below typical previously recorded values: 300 tons per day (t/d). During December, small explosions were recorded by the seismic network and manifested as gas-and-steam emissions.
Gas-and-ash explosions in the crater occurred during January 2023, which were recorded by the seismic network. Sulfur dioxide values remained low, between 300-400 t/d through 10 March. At 0817 on 14 January a gas-and-ash emission was visible in webcam images, rising just above the crater rim. Some mornings during February, small gas-and-steam plumes were visible in the crater. On 7 March at 2252 MARN noted an increase in degassing from the central crater; gas emissions were constantly observed through the early morning hours on 8 March. During the early morning of 8 March through the afternoon on 9 March, 12 emissions were registered, some accompanied by ash. The last gas-and-ash emission was recorded at 1210 on 9 March; very fine ashfall was reported in El Tránsito (10 km S), La Morita (6 km W), and La Piedrita (3 km W). The smell of sulfur was reported in Piedra Azul (5 km SW). On 16 March MARN reported that gas-and-steam emissions decreased.
Low degassing and very low seismicity were reported during April; no explosions have been detected between 9 March and 27 May. The sulfur dioxide emissions remained between 350-400 t/d; during 13-20 April sulfur dioxide values fluctuated between 30-300 t/d. Activity remained low through most of May; on 23 May seismicity increased. An explosion was detected at 1647 on 27 May generated a gas-and-ash plume that rose 700 m high (figure 32); a decrease in seismicity and gas emissions followed. The DOAS station installed on the W flank recorded sulfur dioxide values that reached 400 t/d on 27 May; subsequent measurements showed a decrease to 268 t/d on 28 May and 100 t/d on 29 May.
Geologic Background. The symmetrical cone of San Miguel, one of the most active volcanoes in El Salvador, rises from near sea level to form one of the country's most prominent landmarks. A broad, deep, crater complex that has been frequently modified by eruptions recorded since the early 16th century caps the truncated unvegetated summit, also known locally as Chaparrastique. Flanks eruptions of the basaltic-andesitic volcano have produced many lava flows, including several during the 17th-19th centuries that extended to the N, NE, and SE. The SE-flank flows are the largest and form broad, sparsely vegetated lava fields crossed by highways and a railroad skirting the base of the volcano. Flank vent locations have migrated higher on the edifice during historical time, and the most recent activity has consisted of minor ash eruptions from the summit crater.
Information Contacts: Ministero de Medio Ambiente y Recursos Naturales (MARN), Km. 5½ Carretera a Nueva San Salvador, Avenida las Mercedes, San Salvador, El Salvador (URL: http://www.snet.gob.sv/ver/vulcanologia).
Ebeko
Russia
50.686°N, 156.014°E; summit elev. 1103 m
All times are local (unless otherwise noted)
Continued explosions, ash plumes, and ashfall during October 2022-May 2023
Ebeko, located on the N end of Paramushir Island in the Kuril Islands, consists of three summit craters along a SSW-NNE line at the northern end of a complex of five volcanic cones. Eruptions date back to the late 18th century and have been characterized as small-to-moderate explosions from the summit crater, accompanied by intense fumarolic activity. The current eruption period began in June 2022 and has recently consisted of frequent explosions, ash plumes, and thermal activity (BGVN 47:10). This report covers similar activity during October 2022 through May 2023, based on information from the Kamchatka Volcanic Eruptions Response Team (KVERT) and satellite data.
Activity during October consisted of explosive activity, ash plumes, and occasional thermal anomalies. Visual data by volcanologists from Severo-Kurilsk showed explosions producing ash clouds up to 2.1-3 km altitude which drifted E, N, NE, and SE during 1-8, 10, 16, and 18 October. KVERT issued several Volcano Observatory Notices for Aviation (VONA) on 7, 13-15, and 27 October 2022, stating that explosions generated ash plumes that rose to 2.3-4 km altitude and drifted 5 km E, NE, and SE. Ashfall was reported in Severo-Kurilsk (Paramushir Island, about 7 km E) on 7 and 13 October. Satellite data showed a thermal anomaly over the volcano on 15-16 October. Visual data showed ash plumes rising to 2.5-3.6 km altitude on 22, 25-29, and 31 October and moving NE due to constant explosions.
Similar activity continued during November, with explosions, ash plumes, and ashfall occurring. KVERT issued VONAs on 1-2, 4, 6-7, 9, 13, and 16 November that reported explosions and resulting ash plumes that rose to 1.7-3.6 km altitude and drifted 3-5 km SE, ESE, E, and NE. On 1 November ash plumes extended as far as 110 km SE. On 5, 8, 12, and 24-25 November explosions and ash plumes rose to 2-3.1 km altitude and drifted N and E. Ashfall was observed in Severo-Kurilsk on 7 and 16 November. A thermal anomaly was visible during 1-4, 16, and 20 November. Explosions during 26 November rose as high as 2.7 km altitude and drifted NE (figure 45).
Explosions and ash plumes continued to occur in December. During 1-2 and 4 December volcanologists from Severo-Kurilsk observed explosions that sent ash to 1.9-2.5 km altitude and drifted NE and SE (figure 46). VONAs were issued on 5, 9, and 16 December reporting that explosions generated ash plumes rising to 1.9 km, 2.6 km, and 2.4 km altitude and drifted 5 km SE, E, and NE, respectively. A thermal anomaly was visible in satellite imagery on 16 December. On 18 and 27-28 December explosions produced ash plumes that rose to 2.5 km altitude and drifted NE and SE. On 31 December an ash plume rose to 2 km altitude and drifted NE.
Explosions continued during January 2023, based on visual observations by volcanologists from Severo-Kurilsk. During 1-7 January explosions generated ash plumes that rose to 4 km altitude and drifted NE, E, W, and SE. According to VONAs issued by KVERT on 2, 4, 10, and 23 January, explosions produced ash plumes that rose to 2-4 km altitude and drifted 5 km N, NE, E, and ENE; the ash plume that rose to 4 km altitude occurred on 10 January (figure 47). Satellite data showed a thermal anomaly during 3-4, 10, 13, 16, 21, 22, and 31 January. KVERT reported that an ash cloud on 4 January moved 12 km NE. On 6 and 9-11 January explosions sent ash plumes to 4.5 km altitude and drifted W and ESE. On 13 January an ash plume rose to 3 km altitude and drifted SE. During 20-24 January ash plumes from explosions rose to 3.7 km altitude and drifted SE, N, and NE. On 21 January the ash plume drifted as far as 40 km NE. During 28-29 and 31 January and 1 February ash plumes rose to 4 km altitude and drifted NE.
During February, explosions, ash plumes, and ashfall were reported. During 1, 4-5 and 7-8 February explosions generated ash plumes that rose to 4.5 km altitude and drifted E and NE; ashfall was observed on 5 and 8 February. On 6 February an explosion produced an ash plume that rose to 3 km altitude and drifted 7 km E, causing ashfall in Severo-Kurilsk. A thermal anomaly was visible in satellite data on 8, 9, 13, and 21 February. Explosions on 9 and 12-13 February produced ash plumes that rose to 4 km altitude and drifted E and NE; the ash cloud on 12 February extended as far as 45 km E. On 22 February explosions sent ash to 3 km altitude that drifted E. During 24 and 26-27 February ash plumes rose to 4 km altitude and drifted E. On 28 February an explosion sent ash to 2.5-3 km altitude and drifted 5 km E; ashfall was observed in Severo-Kurilsk.
Activity continued during March; visual observations showed that explosions generated ash plumes that rose to 3.6 km altitude on 3, 5-7, and 9-12 March and drifted E, NE, and NW. Thermal anomalies were visible on 10, 13, and 29-30 March in satellite imagery. On 18, 21-23, 26, and 29-30 March explosions produced ash plumes that rose to 2.8 km altitude and drifted NE and E; the ash plumes during 22-23 March extended up to 76 km E. A VONA issued on 21 March reported an explosion that produced an ash plume that rose to 2.8 km altitude and drifted 5 km E. Another VONA issued on 23 March reported that satellite data showed an ash plume rising to 3 km altitude and drifted 14 km E.
Explosions during April continued to generate ash plumes. On 1 and 4 April an ash plume rose to 2.8-3.5 km altitude and drifted SE and NE. A thermal anomaly was visible in satellite imagery during 1-6 April. Satellite data showed ash plumes and clouds rising to 2-3 km altitude and drifting up to 12 km SW and E on 3 and 6 April (figure 48). KVERT issued VONAs on 3, 5, 14, 16 April describing explosions that produced ash plumes rising to 3 km, 3.5 km, 3.5 km, and 3 km altitude and drifting 5 km S, 5 km NE and SE, 72 km NNE, and 5 km NE, respectively. According to satellite data, the resulting ash cloud from the explosion on 14 April was 25 x 7 km in size and drifted 72-104 km NNE during 14-15 April. According to visual data by volcanologists from Severo-Kurilsk explosions sent ash up to 3.5 km altitude that drifted NE and E during 15-16, 22, 25-26, and 29 April.
The explosive eruption continued during May. Explosions during 3-4, 6-7, and 9-10 May generated ash plumes that rose to 4 km altitude and drifted SW and E. Satellite data showed a thermal anomaly on 3, 9, 13-14, and 24 May. During 12-16, 23-25, and 27-28 May ash plumes rose to 3.5 km altitude and drifted in different directions due to explosions. Two VONA notices were issued on 16 and 25 May, describing explosions that generated ash plumes rising to 3 km and 3.5 km altitude, respectively and extending 5 km E. The ash cloud on 25 May drifted 75 km SE.
Thermal activity in the summit crater, occasionally accompanied by ash plumes and ash deposits on the SE and E flanks due to frequent explosions, were visible in infrared and true color satellite images (figure 49).
Geologic Background. The flat-topped summit of the central cone of Ebeko volcano, one of the most active in the Kuril Islands, occupies the northern end of Paramushir Island. Three summit craters located along a SSW-NNE line form Ebeko volcano proper, at the northern end of a complex of five volcanic cones. Blocky lava flows extend west from Ebeko and SE from the neighboring Nezametnyi cone. The eastern part of the southern crater contains strong solfataras and a large boiling spring. The central crater is filled by a lake about 20 m deep whose shores are lined with steaming solfataras; the northern crater lies across a narrow, low barrier from the central crater and contains a small, cold crescentic lake. Historical activity, recorded since the late-18th century, has been restricted to small-to-moderate explosive eruptions from the summit craters. Intense fumarolic activity occurs in the summit craters, on the outer flanks of the cone, and in lateral explosion craters.
Information Contacts: Kamchatka Volcanic Eruptions Response Team (KVERT), Far Eastern Branch, Russian Academy of Sciences, 9 Piip Blvd., Petropavlovsk-Kamchatsky, 683006, Russia (URL: http://www.kscnet.ru/ivs/kvert/); MIROVA (Middle InfraRed Observation of Volcanic Activity), a collaborative project between the Universities of Turin and Florence (Italy) supported by the Centre for Volcanic Risk of the Italian Civil Protection Department (URL: http://www.mirovaweb.it/); Copernicus Browser, Copernicus Data Space Ecosystem, European Space Agency (URL: https://dataspace.copernicus.eu/browser/).
Home Reef
Tonga
18.992°S, 174.775°W; summit elev. -10 m
All times are local (unless otherwise noted)
Discolored plumes continued during November 2022-April 2023
Home Reef is a submarine volcano located in the central Tonga islands between Lateiki (Metis Shoal) and Late Island. The first recorded eruption occurred in the mid-19th century, when an ephemeral island formed. An eruption in 1984 produced a 12-km-high eruption plume, a large volume of floating pumice, and an ephemeral island 500 x 1,500 m wide, with cliffs 30-50 m high that enclosed a water-filled crater. Another island-forming eruption in 2006 produced widespread pumice rafts that drifted as far as Australia; by 2008 the island had eroded below sea level. The previous eruption occurred during October 2022 and was characterized by a new island-forming eruption, lava effusion, ash plumes, discolored water, and gas-and-steam plumes (BGVN 47:11). This report covers discolored water plumes during November 2022 through April 2023 using satellite data.
Discolored plumes continued during the reporting period and were observed in true color satellite images on clear weather days. Satellite images show light green-yellow discolored water extending W on 8 and 28 November 2022 (figure 31), and SW on 18 November. Light green-yellow plumes extended W on 3 December, S on 13 December, SW on 18 December, and W and S on 23 December (figure 31). On 12 January 2023 discolored green-yellow plumes extended to the NE, E, SE, and N. The plume moved SE on 17 January and NW on 22 January. Faint discolored water in February was visible moving NE on 1 February. A discolored plume extended NW on 8 and 28 March and NW on 13 March (figure 31). During April, clear weather showed green-blue discolored plumes moving S on 2 April, W on 7 April, and NE and S on 12 April. A strong green-yellow discolored plume extended E and NE on 22 April for several kilometers (figure 31).
Geologic Background. Home Reef, a submarine volcano midway between Metis Shoal and Late Island in the central Tonga islands, was first reported active in the mid-19th century, when an ephemeral island formed. An eruption in 1984 produced a 12-km-high eruption plume, large amounts of floating pumice, and an ephemeral 500 x 1,500 m island, with cliffs 30-50 m high that enclosed a water-filled crater. In 2006 an island-forming eruption produced widespread dacitic pumice rafts that drifted as far as Australia. Another island was built during a September-October 2022 eruption.
Information Contacts: Copernicus Browser, Copernicus Data Space Ecosystem, European Space Agency (URL: https://dataspace.copernicus.eu/browser/).
Semisopochnoi (United States) — June 2023 Cite this Report
Semisopochnoi
United States
51.93°N, 179.58°E; summit elev. 1221 m
All times are local (unless otherwise noted)
Occasional explosions, ash deposits, and gas-and-steam plumes during December 2022-May 2023
Semisopochnoi is located in the western Aleutians, is 20-km-wide at sea level, and contains an 8-km-wide caldera. The three-peaked Mount Young (formerly Cerberus) was constructed within the caldera during the Holocene. Each of these peaks contains a summit crater; the lava flows on the N flank appear younger than those on the S side. The current eruption period began in early February 2021 and has more recently consisted of intermittent explosions and ash emissions (BGVN 47:12). This report updates activity during December 2022 through May 2023 using daily, weekly, and special reports from the Alaska Volcano Observatory (AVO). AVO monitors the volcano using local seismic and infrasound sensors, satellite data, web cameras, and remote infrasound and lightning networks.
Activity during most of December 2022 was relatively quiet; according to AVO no eruptive or explosive activity was observed since 7 November 2022. Intermittent tremor and occasional small earthquakes were observed in geophysical data. Continuous gas-and-steam emissions were observed from the N crater of Mount Young in webcam images on clear weather days (figure 25). On 24 December, there was a slight increase in earthquake activity and several small possible explosion signals were detected in infrasound data. Eruptive activity resumed on 27 December at the N crater of Mount Young; AVO issued a Volcano Activity Notice (VAN) that reported minor ash deposits on the flanks of Mount Young that extended as far as 1 km from the vent, according to webcam images taken during 27-28 December (figure 26). No ash plumes were observed in webcam or satellite imagery, but a persistent gas-and-steam plume that might have contained some ash rose to 1.5 km altitude. As a result, AVO raised the Aviation Color Code (ACC) to Orange (the second highest level on a four-color scale) and the Volcano Alert Level (VAL) to Watch (the second highest level on a four-level scale). Possible explosions were detected during 21 December 2022 through 1 January 2023 and seismic tremor was recorded during 30-31 December.
During January 2023 eruptive activity continued at the active N crater of Mount Young. Minor ash deposits were observed on the flanks, extending about 2 km SSW, based on webcam images from 1 and 3 January. A possible explosion occurred during 1-2 January based on elevated seismicity recorded on local seismometers and an infrasound signal recorded minutes later by an array at Adak. Though no ash plumes were observed in webcam or satellite imagery, a persistent gas-and-steam plume rose to 1.5 km altitude that might have carried minor traces of ash. Ash deposits were accompanied by periods of elevated seismicity and infrasound signals from the local geophysical network, which AVO reported were likely due to weak explosive activity. Low-level explosive activity was also detected during 2-3 January, with minor gas-and-steam emissions and a new ash deposit that was visible in webcam images. Low-level explosive activity was detected in geophysical data during 4-5 January, with elevated seismicity and infrasound signals observed on local stations. Volcanic tremor was detected during 7-9 January and very weak explosive activity was detected in seismic and infrasound data on 9 January. Weak seismic and infrasound signals were recorded on 17 January, which indicated minor explosive activity, but no ash emissions were observed in clear webcam images; a gas-and-steam plume continued to rise to 1.5 km altitude. During 29-30 January, ash deposits near the summit were observed on fresh snow, according to webcam images.
The active N cone at Mount Young continued to produce a gas-and-steam plume during February, but no ash emissions or explosive events were detected. Seismicity remained elevated with faint tremor during early February. Gas-and-steam emissions from the N crater were observed in clear webcam images on 11-13 and 16 February; no explosive activity was detected in seismic, infrasound, or satellite data. Seismicity has also decreased, with no significant seismic tremor observed since 25 January. Therefore, the ACC was lowered to Yellow (the second lowest level on a four-color scale) and the VAL was lowered to Advisory (the second lowest level on a four-color scale) on 22 February.
Gas-and-steam emissions persisted during March from the N cone of Mount Young, based on clear webcam images. A few brief episodes of weak tremor were detected in seismic data, although seismicity decreased over the month. A gas-and-steam plume detected in satellite data extended 150 km on 18 March. Low-level ash emissions from the N cone at Mount Young were observed in several webcam images during 18-19 March, in addition to small explosions and volcanic tremor. The ACC was raised to Orange and the VAL increased to Watch on 19 March. A small explosion was detected in seismic and infrasound data on 21 March.
Low-level unrest continued during April, although cloudy weather often obscured views of the summit; periods of seismic tremor and local earthquakes were recorded. During 3-4 April a gas-and-steam plume was visible traveling more than 200 km overnight; no ash was evident in the plume, according to AVO. A gas-and-steam plume was observed during 4-6 April that extended 400 km but did not seem to contain ash. Small explosions were detected in seismic and infrasound data on 5 April. Occasional clear webcam images showed continuing gas-and-steam emissions rose from Mount Young, but no ash deposits were observed on the snow. On 19 April small explosions and tremor were detected in seismic and infrasound data. A period of seismic tremor was detected during 22-25 April, with possible weak explosions on 25 April. Ash deposits were visible near the crater rim, but it was unclear if these deposits were recent or due to older deposits.
Occasional small earthquakes were recorded during May, but there were no signs of explosive activity seen in geophysical data. Gas-and-steam emissions continued from the N crater of Mount Young, based on webcam images, and seismicity remained slightly elevated. A new, light ash deposit was visible during the morning of 5 May on fresh snow on the NW flank of Mount Young. During 10 May periods of volcanic tremor were observed. The ACC was lowered to Yellow and the VAL to Advisory on 17 May due to no additional evidence of activity.
Geologic Background. Semisopochnoi, the largest subaerial volcano of the western Aleutians, is 20 km wide at sea level and contains an 8-km-wide caldera. It formed as a result of collapse of a low-angle, dominantly basaltic volcano following the eruption of a large volume of dacitic pumice. The high point of the island is Anvil Peak, a double-peaked late-Pleistocene cone that forms much of the island's northern part. The three-peaked Mount Cerberus (renamed Mount Young in 2023) was constructed within the caldera during the Holocene. Each of the peaks contains a summit crater; lava flows on the N flank appear younger than those on the south side. Other post-caldera volcanoes include the symmetrical Sugarloaf Peak SSE of the caldera and Lakeshore Cone, a small cinder cone at the edge of Fenner Lake in the NE part of the caldera. Most documented eruptions have originated from Young, although Coats (1950) considered that both Sugarloaf and Lakeshore Cone could have been recently active.
Information Contacts: Alaska Volcano Observatory (AVO), a cooperative program of a) U.S. Geological Survey, 4200 University Drive, Anchorage, AK 99508-4667 USA (URL: https://avo.alaska.edu/), b) Geophysical Institute, University of Alaska, PO Box 757320, Fairbanks, AK 99775-7320, USA, and c) Alaska Division of Geological & Geophysical Surveys, 794 University Ave., Suite 200, Fairbanks, AK 99709, USA (URL: http://dggs.alaska.gov/).
Ambae
Vanuatu
15.389°S, 167.835°E; summit elev. 1496 m
All times are local (unless otherwise noted)
New lava flow, ash plumes, and sulfur dioxide plumes during February-May 2023
Ambae, also known as Aoba, is a large basaltic shield volcano in Vanuatu. A broad pyroclastic cone containing three crater lakes (Manaro Ngoru, Voui, and Manaro Lakua) is located at the summit within the youngest of at least two nested calderas. Periodic phreatic and pyroclastic explosions have been reported since the 16th century. A large eruption more than 400 years ago resulted in a volcanic cone within the summit crater that is now filled by Lake Voui; the similarly sized Lake Manaro fills the western third of the caldera. The previous eruption ended in August 2022 that was characterized by gas-and-steam and ash emissions and explosions of wet tephra (BGVN 47:10). This report covers a new eruption during February through May 2023 that consisted of a new lava flow, ash plumes, and sulfur dioxide emissions, using information from the Vanuatu Meteorology and Geo-Hazards Department (VMGD) and satellite data.
During the reporting period, the Alert Level remained at a 2 (on a scale of 0-5), which has been in place since December 2021. Activity during October 2022 through March 2023 remained relatively low and mostly consisted of gas-and-steam emissions in Lake Voui. VMGD reported that at 1300 on 15 November a satellite image captured a strong amount of sulfur dioxide rising above the volcano (figure 99), and that seismicity slightly increased. The southern and northern part of the island reported a strong sulfur dioxide smell and heard explosions. On 20 February 2023 a gas-and-ash plume rose 1.3 km above the summit and drifted SSW, according to a webcam image (figure 100). Gas-and-steam and possibly ash emissions continued on 23 February and volcanic earthquakes were recorded by the seismic network.
During April, volcanic earthquakes and gas-and-steam and ash emissions were reported from the cone in Lake Voui. VMGD reported that activity increased during 5-7 April; high gas-and-steam and ash plumes were visible, accompanied by nighttime incandescence. According to a Wellington VAAC report, a low-level ash plume rose as high as 2.5 km above the summit and drifted W and SW on 5 April, based on satellite imagery. Reports in Saratamata stated that a dark ash plume drifted to the WSW, but no loud explosion was heard. Webcam images from 2100 showed incandescence above the crater and reflected in the clouds. According to an aerial survey, field observations, and satellite data, water was no longer present in the lake. A lava flow was reported effusing from the vent and traveling N into the dry Lake Voui, which lasted three days. The next morning at 0745 on 6 April a gas-and-steam and ash plume rose 5.4 km above the summit and drifted ESE, based on information from VMGD (figure 101). The Wellington VAAC also reported that light ashfall was observed on the island. Intermittent gas-and-steam and ash emissions were visible on 7 April, some of which rose to an estimated 3 km above the summit and drifted E. Webcam images during 0107-0730 on 7 April showed continuing ash emissions. A gas-and-steam and ash plume rose 695 m above the summit crater at 0730 on 19 April and drifted ESE, based on a webcam image (figure 102).
According to visual and infrared satellite data, water was visible in Lake Voui as late as 24 March 2023 (figure 103). The vent in the caldera showed a gas-and-steam plume drifted SE. On 3 April thermal activity was first detected, accompanied by a gas-and-ash plume that drifted W (figure 103). The lava flow moved N within the dry lake and was shown cooling by 8 April. By 23 April much of the water in the lake had returned. Occasional sulfur dioxide plumes were detected by the TROPOMI instrument on the Sentinel-5P satellite that exceeded 2 Dobson Units (DU) and drifted in different directions (figure 104).
Geologic Background. The island of Ambae, also known as Aoba, is a massive 2,500 km3 basaltic shield that is the most voluminous volcano of the New Hebrides archipelago. A pronounced NE-SW-trending rift zone with numerous scoria cones gives the 16 x 38 km island an elongated form. A broad pyroclastic cone containing three crater lakes (Manaro Ngoru, Voui, and Manaro Lakua) is located at the summit within the youngest of at least two nested calderas, the largest of which is 6 km in diameter. That large central edifice is also called Manaro Voui or Lombenben volcano. Post-caldera explosive eruptions formed the summit craters about 360 years ago. A tuff cone was constructed within Lake Voui (or Vui) about 60 years later. The latest known flank eruption, about 300 years ago, destroyed the population of the Nduindui area near the western coast.
Information Contacts: Geo-Hazards Division, Vanuatu Meteorology and Geo-Hazards Department (VMGD), Ministry of Climate Change Adaptation, Meteorology, Geo-Hazards, Energy, Environment and Disaster Management, Private Mail Bag 9054, Lini Highway, Port Vila, Vanuatu (URL: http://www.vmgd.gov.vu/, https://www.facebook.com/VanuatuGeohazardsObservatory/); Wellington Volcanic Ash Advisory Centre (VAAC), Meteorological Service of New Zealand Ltd (MetService), PO Box 722, Wellington, New Zealand (URL: http://www.metservice.com/vaac/, http://www.ssd.noaa.gov/VAAC/OTH/NZ/messages.html); MIROVA (Middle InfraRed Observation of Volcanic Activity), a collaborative project between the Universities of Turin and Florence (Italy) supported by the Centre for Volcanic Risk of the Italian Civil Protection Department (URL: http://www.mirovaweb.it/); Global Sulfur Dioxide Monitoring Page, Atmospheric Chemistry and Dynamics Laboratory, NASA Goddard Space Flight Center (NASA/GSFC), 8800 Greenbelt Road, Goddard, Maryland, USA (URL: https://so2.gsfc.nasa.gov/); Copernicus Browser, Copernicus Data Space Ecosystem, European Space Agency (URL: https://dataspace.copernicus.eu/browser/).
Ibu
Indonesia
1.488°N, 127.63°E; summit elev. 1325 m
All times are local (unless otherwise noted)
Daily ash explosions continue, along with thermal anomalies in the crater, October 2022-May 2023
Persistent eruptive activity since April 2008 at Ibu, a stratovolcano on Indonesian’s Halmahera Island, has consisted of daily explosive ash emissions and plumes, along with observations of thermal anomalies (BGVN 47:04). The current eruption continued during October 2022-May 2023, described below, based on advisories issued by the Pusat Vulkanologi dan Mitigasi Bencana Geologi (PVMBG, also known as Indonesian Center for Volcanology and Geological Hazard Mitigation, CVGHM), daily reports by MAGMA Indonesia (a PVMBG platform), and the Darwin Volcanic Ash Advisory Centre (VAAC), and various satellite data. The Alert Level during the reporting period remained at 2 (on a scale of 1-4), except raised briefly to 3 on 27 May, and the public was warned to stay at least 2 km away from the active crater and 3.5 km away on the N side of the volcano.
According to MAGMA Indonesia, during October 2022-May 2023, daily gray-and-white ash plumes of variable densities rose 200-1,000 m above the summit and drifted in multiple directions. On 30 October and 11 November, plumes rose a maximum of 2 km and 1.5 km above the summit, respectively (figures 42 and 43). According to the Darwin VAAC, discrete ash emissions on 13 November rose to 2.1 km altitude, or 800 m above the summit, and drifted W, and multiple ash emissions on 15 November rose 1.4 km above the summit and drifted NE. Occasional larger ash explosions through May 2023 prompted PVMBG to issue Volcano Observatory Notice for Aviation (VONA) alerts (table 6); the Aviation Color Code remained at Orange throughout this period.
Table 6. Volcano Observatory Notice for Aviation (VONA) ash plume alerts for Ibu issued by PVMBG during October 2022-May 2023. Maximum height above the summit was estimated by a ground observer. VONAs in January-May 2023 all described the ash plumes as dense.
| Date |
Time (local) |
Max height above summit |
Direction |
| 17 Oct 2022 |
0858 |
800 m |
SW |
| 18 Oct 2022 |
1425 |
800 m |
S |
| 19 Oct 2022 |
2017 |
600 m |
SW |
| 21 Oct 2022 |
0916 |
800 m |
NW |
| 16 Jan 2023 |
1959 |
600 m |
NE |
| 22 Jan 2023 |
0942 |
1,000 m |
E |
| 29 Jan 2023 |
2138 |
1,000 m |
E |
| 10 May 2023 |
0940 |
800 m |
NW |
| 10 May 2023 |
2035 |
600 m |
E |
| 21 May 2023 |
2021 |
600 m |
W |
| 21 May 2023 |
2140 |
1,000 m |
W |
| 29 May 2023 |
1342 |
800 m |
N |
| 31 May 2023 |
1011 |
1,000 m |
SW |
Sentinel-2 L1C satellite images throughout the reporting period show two, sometimes three persistent thermal anomalies in the summit crater, with the most prominent hotspot from the top of a cone within the crater. Clear views were more common during March-April 2023, when a vent and lava flows on the NE flank of the intra-crater cone could be distinguished (figure 44). White-to-grayish emissions were also observed during brief periods when weather clouds allowed clear views.
The MIROVA space-based volcano hotspot detection system recorded almost daily thermal anomalies throughout the reporting period, though cloud cover often interfered with detections. Data from imaging spectroradiometers aboard NASA’s Aqua and Terra satellites and processed using the MODVOLC algorithm (MODIS-MODVOLC) recorded hotspots on one day during October 2022 and December 2022, two days in April 2023, three days in November 2022 and May 2023, and four days in March 2023.
Geologic Background. The truncated summit of Gunung Ibu stratovolcano along the NW coast of Halmahera Island has large nested summit craters. The inner crater, 1 km wide and 400 m deep, has contained several small crater lakes. The 1.2-km-wide outer crater is breached on the N, creating a steep-walled valley. A large cone grew ENE of the summit, and a smaller one to the WSW has fed a lava flow down the W flank. A group of maars is located below the N and W flanks. The first observed and recorded eruption was a small explosion from the summit crater in 1911. Eruptive activity began again in December 1998, producing a lava dome that eventually covered much of the floor of the inner summit crater along with ongoing explosive ash emissions.
Information Contacts: Pusat Vulkanologi dan Mitigasi Bencana Geologi (PVMBG, also known as Indonesian Center for Volcanology and Geological Hazard Mitigation, CVGHM), Jalan Diponegoro 57, Bandung 40122, Indonesia (URL: http://www.vsi.esdm.go.id/); MAGMA Indonesia (Multiplatform Application for Geohazard Mitigation and Assessment in Indonesia), Kementerian Energi dan Sumber Daya Mineral (URL: https://magma.esdm.go.id/v1); Copernicus Browser, Copernicus Data Space Ecosystem, European Space Agency (URL: https://dataspace.copernicus.eu/browser/); MIROVA (Middle InfraRed Observation of Volcanic Activity), a collaborative project between the Universities of Turin and Florence (Italy) supported by the Centre for Volcanic Risk of the Italian Civil Protection Department (URL: http://www.mirovaweb.it/); Hawai'i Institute of Geophysics and Planetology (HIGP) - MODVOLC Thermal Alerts System, School of Ocean and Earth Science and Technology (SOEST), Univ. of Hawai'i, 2525 Correa Road, Honolulu, HI 96822, USA (URL: http://modis.higp.hawaii.edu/).
Dukono
Indonesia
1.6992°N, 127.8783°E; summit elev. 1273 m
All times are local (unless otherwise noted)
Continuing ash emissions, SO2 plumes, and thermal signals during October 2022-May 2023
Dukono, a remote volcano on Indonesia’s Halmahera Island, has been erupting continuously since 1933, with frequent ash explosions and sulfur dioxide plumes (BGVN 46:11, 47:10). This activity continued during October 2022 through May 2023, based on reports from the Pusat Vulkanologi dan Mitigasi Bencana Geologi (PVMBG; also known as Indonesian Center for Volcanology and Geological Hazard Mitigation, CVGHM), the Darwin Volcanic Ash Advisory Centre (VAAC), and satellite data. During this period, the Alert Level remained at 2 (on a scale of 1-4) and the public was warned to remain outside of the 2-km exclusion zone. The highest reported plume of the period reached 9.4 km above the summit on 14 November 2022.
According to MAGMA Indonesia (a platform developed by PVMBG), white, gray, or dark plumes of variable densities were observed almost every day during the reporting period, except when fog obscured the volcano (figure 33). Plumes generally rose 25-450 m above the summit, but rose as high as 700-800 m on several days, somewhat lower than the maximum heights reached earlier in 2022 when plumes reached as high as 1 km. However, the Darwin VAAC reported that on 14 November 2022, a discrete ash plume rose 9.4 km above the summit (10.7 km altitude), accompanied by a strong hotspot and a sulfur dioxide signal observed in satellite imagery; a continuous ash plume that day and through the 15th rose to 2.1-2.4 km altitude and drifted NE.
Sentinel-2 images were obscured by weather clouds almost every viewing day during the reporting period. However, the few reasonably clear images showed a hotspot and white or gray emissions and plumes. Strong SO2 plumes from Dukono were present on many days during October 2022-May 2023, as detected using the TROPOMI instrument on the Sentinel-5P satellite (figure 34).
Geologic Background. Reports from this remote volcano in northernmost Halmahera are rare, but Dukono has been one of Indonesia's most active volcanoes. More-or-less continuous explosive eruptions, sometimes accompanied by lava flows, have occurred since 1933. During a major eruption in 1550 CE, a lava flow filled in the strait between Halmahera and the N-flank Gunung Mamuya cone. This complex volcano presents a broad, low profile with multiple summit peaks and overlapping craters. Malupang Wariang, 1 km SW of the summit crater complex, contains a 700 x 570 m crater that has also been active during historical time.
Information Contacts: Pusat Vulkanologi dan Mitigasi Bencana Geologi (PVMBG, also known as Indonesian Center for Volcanology and Geological Hazard Mitigation, CVGHM), Jalan Diponegoro 57, Bandung 40122, Indonesia (URL: http://www.vsi.esdm.go.id/); MAGMA Indonesia (Multiplatform Application for Geohazard Mitigation and Assessment in Indonesia), Kementerian Energi dan Sumber Daya Mineral (URL: https://magma.esdm.go.id/v1); Darwin Volcanic Ash Advisory Centre (VAAC), Bureau of Meteorology, Northern Territory Regional Office, PO Box 40050, Casuarina, NT 0811, Australia (URL: http://www.bom.gov.au/info/vaac/); NASA Global Sulfur Dioxide Monitoring Page, Atmospheric Chemistry and Dynamics Laboratory, NASA Goddard Space Flight Center (NASA/GSFC), 8800 Greenbelt Road, Goddard, Maryland, USA (URL: https://so2.gsfc.nasa.gov/); Sentinel Hub Playground (URL: https://www.sentinel-hub.com/explore/sentinel-playground).
Sabancaya
Peru
15.787°S, 71.857°W; summit elev. 5960 m
All times are local (unless otherwise noted)
Explosions, gas-and-ash plumes, and thermal activity persist during November 2022-April 2023
Sabancaya is located in Peru, NE of Ampato and SE of Hualca Hualca. Eruptions date back to 1750 and have been characterized by explosions, phreatic activity, ash plumes, and ashfall. The current eruption period began in November 2016 and has more recently consisted of daily explosions, gas-and-ash plumes, and thermal activity (BGVN 47:11). This report updates activity during November 2022 through April 2023 using information from Instituto Geophysico del Peru (IGP) that use weekly activity reports and various satellite data.
Intermittent low-to-moderate power thermal anomalies were reported by the MIROVA project during November 2022 through April 2023 (figure 119). There were few short gaps in thermal activity during mid-December 2022, late December-to-early January 2023, late January to mid-February, and late February. According to data recorded by the MODVOLC thermal algorithm, there were a total of eight thermal hotspots: three in November 2022, three in February 2023, one in March, and one in April. On clear weather days, some of this thermal anomaly was visible in infrared satellite imagery showing the active lava dome in the summit crater (figure 120). Almost daily moderate-to-strong sulfur dioxide plumes were recorded during the reporting period by the TROPOMI instrument on the Sentinel-5P satellite (figure 121). Many of these plumes exceeded 2 Dobson Units (DU) and drifted in multiple directions.
IGP reported that moderate activity during November and December 2022 continued; during November, an average number of explosions were reported each week: 30, 33, 36, and 35, and during December, it was 32, 40, 47, 52, and 67. Gas-and-ash plumes in November rose 3-3.5 km above the summit and drifted E, NE, SE, S, N, W, and SW. During December the gas-and-ash plumes rose 2-4 km above the summit and drifted in different directions. There were 1,259 volcanic earthquakes recorded during November and 1,693 during December. Seismicity also included volcano-tectonic-type events that indicate rock fracturing events. Slight inflation was observed in the N part of the volcano near Hualca Hualca (4 km N). Thermal activity was frequently reported in the crater at the active lava dome (figure 120).
Explosive activity continued during January and February 2023. The average number of explosions were reported each week during January (51, 50, 60, and 59) and February (43, 54, 51, and 50). Gas-and-ash plumes rose 1.6-2.9 km above the summit and drifted NW, SW, and W during January and rose 1.4-2.8 above the summit and drifted W, SW, E, SE, N, S, NW, and NE during February. IGP also detected 1,881 volcanic earthquakes during January and 1,661 during February. VT-type earthquakes were also reported. Minor inflation persisted near Hualca Hualca. Satellite imagery showed continuous thermal activity in the crater at the lava dome (figure 120).
During March, the average number of explosions each week was 46, 48, 31, 35, and 22 and during April, it was 29, 41, 31, and 27. Accompanying gas-and-ash plumes rose 1.7-2.6 km above the summit crater and drifted W, SW, NW, S, and SE during March. According to a Buenos Aires Volcano Ash Advisory Center (VAAC) notice, on 22 March at 1800 through 23 March an ash plume rose to 7 km altitude and drifted NW. By 0430 an ash plume rose to 7.6 km altitude and drifted W. On 24 and 26 March continuous ash emissions rose to 7.3 km altitude and drifted SW and on 28 March ash emissions rose to 7.6 km altitude. During April, gas-and-ash plumes rose 1.6-2.5 km above the summit and drifted W, SW, S, NW, NE, and E. Frequent volcanic earthquakes were recorded, with 1,828 in March and 1,077 in April, in addition to VT-type events. Thermal activity continued to be reported in the summit crater at the lava dome (figure 120).
Geologic Background. Sabancaya, located in the saddle NE of Ampato and SE of Hualca Hualca volcanoes, is the youngest of these volcanic centers and the only one to have erupted in historical time. The oldest of the three, Nevado Hualca Hualca, is of probable late-Pliocene to early Pleistocene age. The name Sabancaya (meaning "tongue of fire" in the Quechua language) first appeared in records in 1595 CE, suggesting activity prior to that date. Holocene activity has consisted of Plinian eruptions followed by emission of voluminous andesitic and dacitic lava flows, which form an extensive apron around the volcano on all sides but the south. Records of historical eruptions date back to 1750.
Information Contacts: Instituto Geofisico del Peru (IGP), Centro Vulcanológico Nacional (CENVUL), Calle Badajoz N° 169 Urb. Mayorazgo IV Etapa, Ate, Lima 15012, Perú (URL: https://www.igp.gob.pe/servicios/centro-vulcanologico-nacional/inicio); Buenos Aires Volcanic Ash Advisory Center (VAAC), Servicio Meteorológico Nacional-Fuerza Aérea Argentina, 25 de mayo 658, Buenos Aires, Argentina (URL: http://www.smn.gov.ar/vaac/buenosaires/inicio.php); MIROVA (Middle InfraRed Observation of Volcanic Activity), a collaborative project between the Universities of Turin and Florence (Italy) supported by the Centre for Volcanic Risk of the Italian Civil Protection Department (URL: http://www.mirovaweb.it/); Hawai'i Institute of Geophysics and Planetology (HIGP) - MODVOLC Thermal Alerts System, School of Ocean and Earth Science and Technology (SOEST), Univ. of Hawai'i, 2525 Correa Road, Honolulu, HI 96822, USA (URL: http://modis.higp.hawaii.edu/); NASA Global Sulfur Dioxide Monitoring Page, Atmospheric Chemistry and Dynamics Laboratory, NASA Goddard Space Flight Center (NASA/GSFC), 8800 Greenbelt Road, Goddard MD 20771, USA (URL: https://so2.gsfc.nasa.gov/); Copernicus Browser, Copernicus Data Space Ecosystem, European Space Agency (URL: https://dataspace.copernicus.eu/browser/).
Sheveluch
Russia
56.653°N, 161.36°E; summit elev. 3283 m
All times are local (unless otherwise noted)
Significant explosions destroyed part of the lava-dome complex during April 2023
Sheveluch (also spelled Shiveluch) in Kamchatka, has had at least 60 large eruptions during the last 10,000 years. The summit is truncated by a broad 9-km-wide caldera that is breached to the S, and many lava domes occur on the outer flanks. The lava dome complex was constructed within the large open caldera. Frequent collapses of the dome complex have produced debris avalanches; the resulting deposits cover much of the caldera floor. A major south-flank collapse during a 1964 Plinian explosion produced a scarp in which a “Young Sheveluch” dome began to form in 1980. Repeated episodes of dome formation and destruction since then have produced major and minor ash plumes, pyroclastic flows, block-and-ash flows, and “whaleback domes” of spine-like extrusions in 1993 and 2020 (BGVN 45:11). The current eruption period began in August 1999 and has more recently consisted of lava dome growth, explosions, ash plumes, and avalanches (BGVN 48:01). This report covers a significant explosive eruption during early-to-mid-April 2023 that generated a 20 km altitude ash plume, produced a strong sulfur dioxide plume, and destroyed part of the lava-dome complex; activity described during January through April 2023 use information primarily from the Kamchatka Volcanic Eruptions Response Team (KVERT) and various satellite data.
Satellite data. Activity during the majority of this reporting period was characterized by continued lava dome growth, strong fumarole activity, explosions, and hot avalanches. According to the MODVOLC Thermal Alerts System, 140 hotspots were detected through the reporting period, with 33 recorded in January 2023, 29 in February, 44 in March, and 34 in April. Frequent strong thermal activity was recorded during January 2023 through April, according to the MIROVA (Middle InfraRed Observation of Volcanic Activity) graph and resulted from the continuously growing lava dome (figure 94). A slightly stronger pulse in thermal activity was detected in early-to-mid-April, which represented the significant eruption that destroyed part of the lava-dome complex. Thermal anomalies were also visible in infrared satellite imagery at the summit crater (figure 95).
During January 2023 KVERT reported continued growth of the lava dome, accompanied by strong fumarolic activity, incandescence from the lava dome, explosions, ash plumes, and avalanches. Satellite data showed a daily thermal anomaly over the volcano. Video data showed ash plumes associated with collapses at the dome that generated avalanches that in turn produced ash plumes rising to 3.5 km altitude and drifting 40 km W on 4 January and rising to 7-7.5 km altitude and drifting 15 km SW on 5 January. A gas-and-steam plume containing some ash that was associated with avalanches rose to 5-6 km altitude and extended 52-92 km W on 7 January. Explosions that same day produced ash plumes that rose to 7-7.5 km altitude and drifted 10 km W. According to a Volcano Observatory Notice for Aviation (VONA) issued at 1344 on 19 January, explosions produced an ash cloud that was 15 x 25 km in size and rose to 9.6-10 km altitude, drifting 21-25 km W; as a result, the Aviation Color Code (ACC) was raised to Red (the highest level on a four-color scale). Another VONA issued at 1635 reported that no more ash plumes were observed, and the ACC was lowered to Orange (the second highest level on a four-color scale). On 22 January an ash plume from collapses and avalanches rose to 5 km altitude and drifted 25 km NE and SW; ash plumes associated with collapses extended 70 km NE on 27 and 31 January.
Lava dome growth, fumarolic activity, dome incandescence, and occasional explosions and avalanches continued during February and March. A daily thermal anomaly was visible in satellite data. Explosions on 1 February generated ash plumes that rose to 6.3-6.5 km altitude and extended 15 km NE. Video data showed an ash cloud from avalanches rising to 5.5 km altitude and drifting 5 km SE on 2 February. Satellite data showed gas-and-steam plumes containing some ash rose to 5-5.5 km altitude and drifted 68-110 km ENE and NE on 6 February, to 4.5-5 km altitude and drifted 35 km WNW on 22 February, and to 3.7-4 km altitude and drifted 47 km NE on 28 February. Scientists from the Kamchatka Volcanological Station (KVS) went on a field excursion on 25 February to document the growing lava dome, and although it was cloudy most of the day, nighttime incandescence was visible. Satellite data showed an ash plume extending up to 118 km E during 4-5 March. Video data from 1150 showed an ash cloud from avalanches rose to 3.7-5.5 km altitude and drifted 5-10 km ENE and E on 5 March. On 11 March an ash plume drifted 62 km E. On 27 March ash plumes rose to 3.5 km altitude and drifted 100 km E. Avalanches and constant incandescence at the lava dome was focused on the E and NE slopes on 28 March. A gas-and-steam plume containing some ash rose to 3.5 km altitude and moved 40 km E on 29 March. Ash plumes on 30 March rose to 3.5-3.7 km altitude and drifted 70 km NE.
Similar activity continued during April, with lava dome growth, strong fumarolic activity, incandescence in the dome, occasional explosions, and avalanches. A thermal anomaly persisted throughout the month. During 1-4 April weak ash plumes rose to 2.5-3 km altitude and extended 13-65 km SE and E.
Activity during 11 April 2023. The Institute of Volcanology and Seismology, Far Eastern Branch, Russian Academy of Sciences (IVS FEB RAS) reported a significant increase in seismicity around 0054 on 11 April, as reported by strong explosions detected on 11 April beginning at 0110 that sent ash plumes up to 7-10 km altitude and extended 100-435 km W, WNW, NNW, WSW, and SW. According to a Tokyo VAAC report the ash plume rose to 15.8 km altitude. By 0158 the plume extended over a 75 x 100 km area. According to an IVS FEB RAS report, the eruptive column was not vertical: the initial plume at 0120 on 11 April deviated to the NNE, at 0000 on 12 April, it drifted NW, and by 1900 it drifted SW. KVS reported that significant pulses of activity occurred at around 0200, 0320, and then a stronger phase around 0600. Levin Dmitry took a video from near Békés (3 km away) at around 0600 showing a rising plume; he also reported that a pyroclastic flow traveled across the road behind him as he left the area. According to IVS FEB RAS, the pyroclastic flow traveled several kilometers SSE, stopping a few hundred meters from a bridge on the road between Klyuchi and Petropavlovsk-Kamchatsky.
Ashfall was first observed in Klyuchi (45 km SW) at 0630, and a large, black ash plume blocked light by 0700. At 0729 KVERT issued a Volcano Observatory Notice for Aviation (VONA) raising the Aviation Color Code to Red (the highest level on a four-color scale). It also stated that a large ash plume had risen to 10 km altitude and drifted 100 km W. Near-constant lightning strikes were reported in the plume and sounds like thunderclaps were heard until about 1000. According to IVS FEB RAS the cloud was 200 km long and 76 km wide by 0830, and was spreading W at altitudes of 6-12 km. In the Klyuchi Village, the layer of both ash and snow reached 8.5 cm (figure 96); ashfall was also reported in Kozyrevsk (112 km SW) at 0930, Mayskoye, Anavgay, Atlasovo, Lazo, and Esso. Residents in Klyuchi reported continued darkness and ashfall at 1100. In some areas, ashfall was 6 cm deep and some residents reported dirty water coming from their plumbing. According to IVS FEB RAS, an ash cloud at 1150 rose to 5-20 km altitude and was 400 km long and 250 km wide, extending W. A VONA issued at 1155 reported that ash had risen to 10 km and drifted 340 km NNW and 240 km WSW. According to Simon Carn (Michigan Technological University), about 0.2 Tg of sulfur dioxide in the plume was measured in a satellite image from the TROPOMI instrument on the Sentinel-5P satellite acquired at 1343 that covered an area of about 189,000 km2 (figure 97). Satellite data at 1748 showed an ash plume that rose to 8 km altitude and drifted 430 km WSW and S, according to a VONA.
Activity during 12-15 April 2023. On 12 April at 0730 satellite images showed ash plumes rose to 7-8 km altitude and extended 600 km SW, 1,050 km ESE, and 1,300-3,000 km E. By 1710 that day, the explosions weakened. According to news sources, the ash-and-gas plumes drifted E toward the Aleutian Islands and reached the Gulf of Alaska by 13 April, causing flight disruptions. More than 100 flights involving Alaska airspace were cancelled due to the plume. Satellite data showed ash plumes rising to 4-5.5 km altitude and drifted 400-415 km SE and ESE on 13 April. KVS volcanologists observed the pyroclastic flow deposits and noted that steam rose from downed, smoldering trees. They also noted that the deposits were thin with very few large fragments, which differed from previous flows. The ash clouds traveled across the Pacific Ocean. Flight cancellations were also reported in NW Canada (British Columbia) during 13-14 April. During 14-15 April ash plumes rose to 6 km altitude and drifted 700 km NW.
Alaskan flight schedules were mostly back to normal by 15 April, with only minor delays and far less cancellations; a few cancellations continued to be reported in Canada. Clear weather on 15 April showed that most of the previous lava-dome complex was gone and a new crater roughly 1 km in diameter was observed (figure 98); gas-and-steam emissions were rising from this crater. Evidence suggested that there had been a directed blast to the SE, and pyroclastic flows traveled more than 20 km. An ash plume rose to 4.5-5.2 km altitude and drifted 93-870 km NW on 15 April.
Activity during 16-30 April 2023. Resuspended ash was lifted by the wind from the slopes and rose to 4 km altitude and drifted 224 km NW on 17 April. KVERT reported a plume of resuspended ash from the activity during 10-13 April on 19 April that rose to 3.5-4 km altitude and drifted 146-204 km WNW. During 21-22 April a plume stretched over the Scandinavian Peninsula. A gas-and-steam plume containing some ash rose to 3-3.5 km altitude and drifted 60 km SE on 30 April. A possible new lava dome was visible on the W slope of the volcano on 29-30 April (figure 99); satellite data showed two thermal anomalies, a bright one over the existing lava dome and a weaker one over the possible new one.
References. Girina, O., Loupian, E., Horvath, A., Melnikov, D., Manevich, A., Nuzhdaev, A., Bril, A., Ozerov, A., Kramareva, L., Sorokin, A., 2023, Analysis of the development of the paroxysmal eruption of Sheveluch volcano on April 10–13, 2023, based on data from various satellite systems, ??????????? ???????? ??? ?? ???????, 20(2).
Geologic Background. The high, isolated massif of Sheveluch volcano (also spelled Shiveluch) rises above the lowlands NNE of the Kliuchevskaya volcano group. The 1,300 km3 andesitic volcano is one of Kamchatka's largest and most active volcanic structures, with at least 60 large eruptions during the Holocene. The summit of roughly 65,000-year-old Stary Shiveluch is truncated by a broad 9-km-wide late-Pleistocene caldera breached to the south. Many lava domes occur on its outer flanks. The Molodoy Shiveluch lava dome complex was constructed during the Holocene within the large open caldera; Holocene lava dome extrusion also took place on the flanks of Stary Shiveluch. Widespread tephra layers from these eruptions have provided valuable time markers for dating volcanic events in Kamchatka. Frequent collapses of dome complexes, most recently in 1964, have produced debris avalanches whose deposits cover much of the floor of the breached caldera.
Information Contacts: Kamchatka Volcanic Eruptions Response Team (KVERT), Far Eastern Branch, Russian Academy of Sciences, 9 Piip Blvd., Petropavlovsk-Kamchatsky, 683006, Russia (URL: http://www.kscnet.ru/ivs/kvert/); Institute of Volcanology and Seismology, Far Eastern Branch, Russian Academy of Sciences (IVS FEB RAS), 9 Piip Blvd., Petropavlovsk-Kamchatsky 683006, Russia (URL: http://www.kscnet.ru/ivs/eng/); Kamchatka Volcanological Station, Kamchatka Branch of Geophysical Survey, (KB GS RAS), Klyuchi, Kamchatka Krai, Russia (URL: http://volkstat.ru/); Hawai'i Institute of Geophysics and Planetology (HIGP) - MODVOLC Thermal Alerts System, School of Ocean and Earth Science and Technology (SOEST), Univ. of Hawai'i, 2525 Correa Road, Honolulu, HI 96822, USA (URL: http://modis.higp.hawaii.edu/); MIROVA (Middle InfraRed Observation of Volcanic Activity), a collaborative project between the Universities of Turin and Florence (Italy) supported by the Centre for Volcanic Risk of the Italian Civil Protection Department (URL: http://www.mirovaweb.it/); Copernicus Browser, Copernicus Data Space Ecosystem, European Space Agency (URL: https://dataspace.copernicus.eu/browser/); Kam 24 News Agency, 683032, Kamchatka Territory, Petropavlovsk-Kamchatsky, Vysotnaya St., 2A (URL: https://kam24.ru/news/main/20230411/96657.html#.Cj5Jrky6.dpuf); Simon Carn, Geological and Mining Engineering and Sciences, Michigan Technological University, 1400 Townsend Drive, Houghton, MI 49931, USA (URL: http://www.volcarno.com/, Twitter: @simoncarn).
Bezymianny
Russia
55.972°N, 160.595°E; summit elev. 2882 m
All times are local (unless otherwise noted)
Explosions, ash plumes, lava flows, and avalanches during November 2022-April 2023
Bezymianny is located on the Kamchatka Peninsula of Russia as part of the Klyuchevskoy volcano group. Historic eruptions began in 1955 and have been characterized by dome growth, explosions, pyroclastic flows, ash plumes, and ashfall. During the 1955-56 eruption a large open crater was formed by collapse of the summit and an associated lateral blast. Subsequent episodic but ongoing lava-dome growth, accompanied by intermittent explosive activity and pyroclastic flows, has largely filled the 1956 crater. The current eruption period began in December 2016 and more recent activity has consisted of strong explosions, ash plumes, and thermal activity (BGVN 47:11). This report covers activity during November 2022 through April 2023, based on weekly and daily reports from the Kamchatka Volcano Eruptions Response Team (KVERT) and satellite data.
Activity during November and March 2023 was relatively low and mostly consisted of gas-and-steam emissions, occasional small collapses that generated avalanches along the lava dome slopes, and a persistent thermal anomaly over the volcano that was observed in satellite data on clear weather days. According to the Tokyo VAAC and KVERT, an explosion produced an ash plume that rose to 6 km altitude and drifted 25 km NE at 1825 on 29 March.
Gas-and-steam emissions, collapses generating avalanches, and thermal activity continued during April. According to two Volcano Observatory Notice for Aviation (VONA) issued on 2 and 6 April (local time) ash plumes rose to 3 km and 3.5-3.8 km altitude and drifted 35 km E and 140 km E, respectively. Satellite data from KVERT showed weak ash plumes extending up to 550 km E on 2 and 5-6 April.
A VONA issued at 0843 on 7 April described an ash plume that rose to 4.5-5 km altitude and drifted 250 km ESE. Later that day at 1326 satellite data showed an ash plume that rose to 5.5-6 km altitude and drifted 150 km ESE. A satellite image from 1600 showed an ash plume extending as far as 230 km ESE; KVERT noted that ash emissions were intensifying, likely due to avalanches from the growing lava dome. The Aviation Color Code (ACC) was raised to Red (the highest level on a four-color scale). At 1520 satellite data showed an ash plume rising to 5-5.5 km altitude and drifting 230 km ESE. That same day, Kamchatka Volcanological Station (KVS) volcanologists traveled to Ambon to collect ash; they reported that a notable eruption began at 1730, and within 20 minutes a large ash plume rose to 10 km altitude and drifted NW. KVERT reported that the strong explosive phase began at 1738. Video and satellite data taken at 1738 showed an ash plume that rose to 10-12 km altitude and drifted up to 2,800 km SE and E. Explosions were clearly audible 20 km away for 90 minutes, according to KVS. Significant amounts of ash fell at the Apakhonchich station, which turned the snow gray; ash continued to fall until the morning of 8 April. In a VONA issued at 0906 on 8 April, KVERT stated that the explosive eruption had ended; ash plumes had drifted 2,000 km E. The ACC was lowered to Orange (the third highest level on a four-color scale). The KVS team saw a lava flow on the active dome once the conditions were clear that same day (figure 53). On 20 April lava dome extrusion was reported; lava flows were noted on the flanks of the dome, and according to KVERT satellite data, a thermal anomaly was observed in the area. The ACC was lowered to Yellow (the second lowest on a four-color scale).
Satellite data showed an increase in thermal activity beginning in early April 2023. A total of 31 thermal hotspots were detected by the MODVOLC thermal algorithm on 4, 5, 7, and 12 April 2023. The elevated thermal activity resulted from an increase in explosive activity and the start of an active lava flow. The MIROVA (Middle InfraRed Observation of Volcanic Activity) volcano hotspot detection system based on the analysis of MODIS data also showed a pulse in thermal activity during the same time (figure 54). Infrared satellite imagery captured a continuous thermal anomaly at the summit crater, often accompanied by white gas-and-steam emissions (figure 55). On 4 April 2023 an active lava flow was observed descending the SE flank.
Geologic Background. The modern Bezymianny, much smaller than its massive neighbors Kamen and Kliuchevskoi on the Kamchatka Peninsula, was formed about 4,700 years ago over a late-Pleistocene lava-dome complex and an edifice built about 11,000-7,000 years ago. Three periods of intensified activity have occurred during the past 3,000 years. The latest period, which was preceded by a 1,000-year quiescence, began with the dramatic 1955-56 eruption. This eruption, similar to that of St. Helens in 1980, produced a large open crater that was formed by collapse of the summit and an associated lateral blast. Subsequent episodic but ongoing lava-dome growth, accompanied by intermittent explosive activity and pyroclastic flows, has largely filled the 1956 crater.
Information Contacts: Kamchatka Volcanic Eruptions Response Team (KVERT), Far Eastern Branch, Russian Academy of Sciences, 9 Piip Blvd., Petropavlovsk-Kamchatsky, 683006, Russia (URL: http://www.kscnet.ru/ivs/kvert/); Kamchatka Volcanological Station, Kamchatka Branch of Geophysical Survey, (KB GS RAS), Klyuchi, Kamchatka Krai, Russia (URL: http://volkstat.ru/); Hawai'i Institute of Geophysics and Planetology (HIGP) - MODVOLC Thermal Alerts System, School of Ocean and Earth Science and Technology (SOEST), Univ. of Hawai'i, 2525 Correa Road, Honolulu, HI 96822, USA (URL: http://modis.higp.hawaii.edu/); MIROVA (Middle InfraRed Observation of Volcanic Activity), a collaborative project between the Universities of Turin and Florence (Italy) supported by the Centre for Volcanic Risk of the Italian Civil Protection Department (URL: http://www.mirovaweb.it/); Copernicus Browser, Copernicus Data Space Ecosystem, European Space Agency (URL: https://dataspace.copernicus.eu/browser/).
Chikurachki
Russia
50.324°N, 155.461°E; summit elev. 1781 m
All times are local (unless otherwise noted)
New explosive eruption during late January-early February 2023
Chikurachki, located on Paramushir Island in the northern Kuriles, has had Plinian eruptions during the Holocene. Lava flows have reached the sea and formed capes on the NW coast; several young lava flows are also present on the E flank beneath a scoria deposit. Reported eruptions date back to 1690, with the most recent eruption period occurring during January through October 2022, characterized by occasional explosions, ash plumes, and thermal activity (BGVN 47:11). This report covers a new eruptive period during January through February 2023 that consisted of ash explosions and ash plumes, based on information from the Kamchatka Volcanic Eruptions Response Team (KVERT) and satellite data.
According to reports from KVERT, an explosive eruption began around 0630 on 29 January. Explosions generated ash plumes that rose to 3-3.5 km altitude and drifted 6-75 km SE and E, based on satellite data. As a result, the Aviation Color Code (ACC) was raised to Orange (the second highest level on a four-color scale). At 1406 and 1720 ash plumes were identified in satellite images that rose to 4.3 km altitude and extended 70 km E. By 2320 the ash plume had dissipated. A thermal anomaly was visible at the volcano on 31 January, according to a satellite image, and an ash plume was observed drifting 66 km NE.
Occasional explosions and ash plumes continued during early February. At 0850 on 1 February an ash plume rose to 3.5 km altitude and drifted 35 km NE. Satellite data showed an ash plume that rose to 3.2-3.5 km altitude and drifted 50 km NE at 1222 later that day (figure 22). A thermal anomaly was detected over the volcano during 5-6 February and ash plumes drifted as far as 125 km SE, E, and NE. Explosive events were reported at 0330 on 6 February that produced ash plumes rising to 4-4.5 km altitude and drifting 72-90 km N, NE, and ENE. KVERT noted that the last gas-and steam plume that contained some ash was observed on 8 February and drifted 55 km NE before the explosive eruption ended. The ACC was lowered to Yellow and then Green (the lowest level on a four-color scale) on 18 February.
Geologic Background. Chikurachki, the highest volcano on Paramushir Island in the northern Kuriles, is a relatively small cone constructed on a high Pleistocene edifice. Oxidized basaltic-to-andesitic scoria deposits covering the upper part of the young cone give it a distinctive red color. Frequent basaltic Plinian eruptions have occurred during the Holocene. Lava flows have reached the sea and formed capes on the NW coast; several young lava flows are also present on the E flank beneath a scoria deposit. The Tatarinov group of six volcanic centers is located immediately to the south, and the Lomonosov cinder cone group, the source of an early Holocene lava flow that reached the saddle between it and Fuss Peak to the west, lies at the southern end of the N-S-trending Chikurachki-Tatarinov complex. In contrast to the frequently active Chikurachki, the Tatarinov centers are extensively modified by erosion and have a more complex structure. Tephrochronology gives evidence of an eruption around 1690 CE from Tatarinov, although its southern cone contains a sulfur-encrusted crater with fumaroles that were active along the margin of a crater lake until 1959.
Information Contacts: Kamchatka Volcanic Eruptions Response Team (KVERT), Far East Division, Russian Academy of Sciences, 9 Piip Blvd., Petropavlovsk-Kamchatsky, 683006, Russia (URL: http://www.kscnet.ru/ivs/); Copernicus Browser, Copernicus Data Space Ecosystem, European Space Agency (URL: https://dataspace.copernicus.eu/browser/).
Search Bulletin Archive by Publication Date
Select a month and year from the drop-downs and click "Show Issue" to have that issue displayed in this tab.
The default month and year is the latest issue available.
Bulletin of the Global Volcanism Network - Volume 44, Number 01 (January 2019)
Managing Editor: Edward Venzke
Aira (Japan)
Ash plumes continue at the Minamidake crater from July through December 2018
Ambrym (Vanuatu)
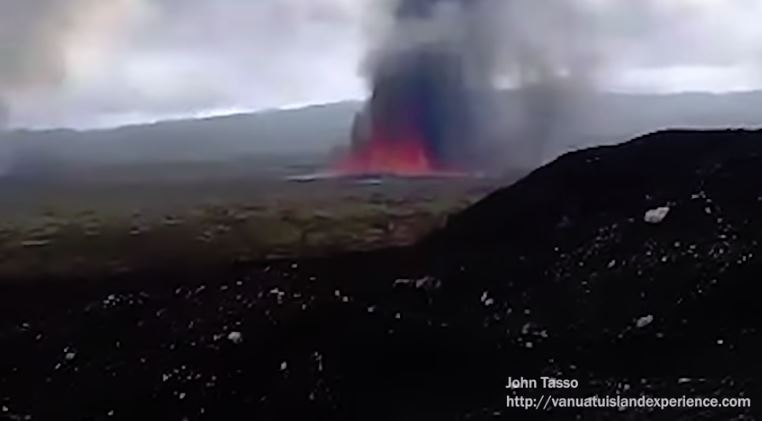
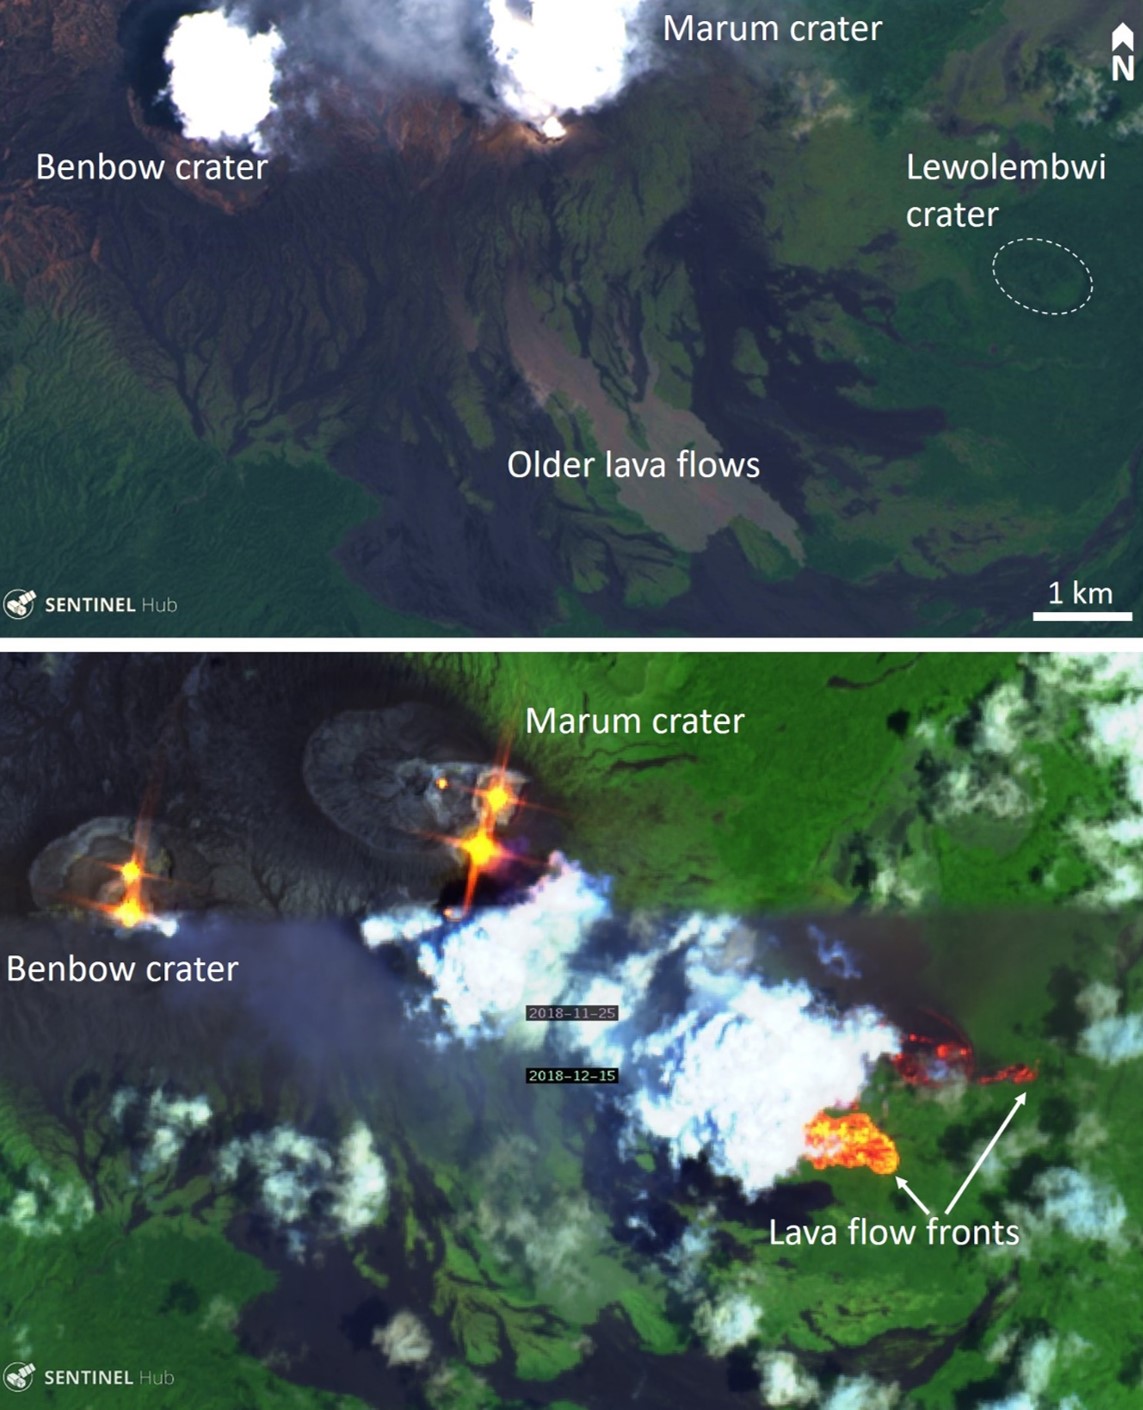
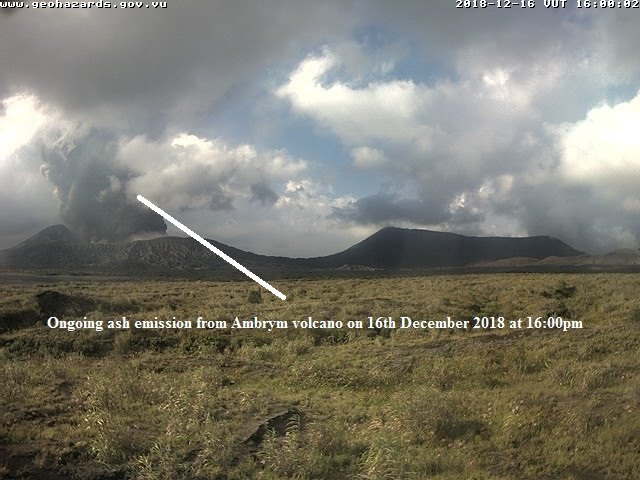
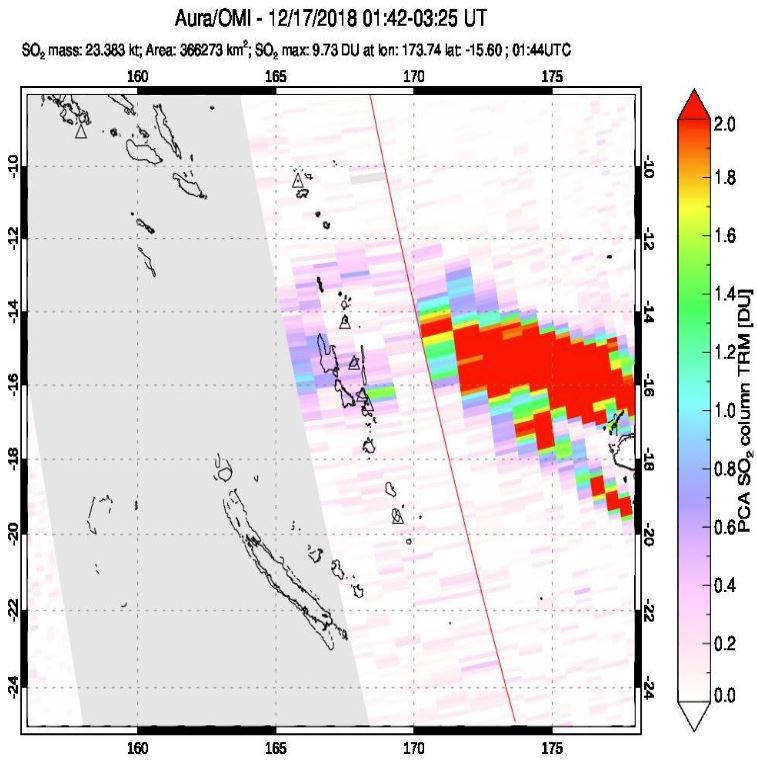
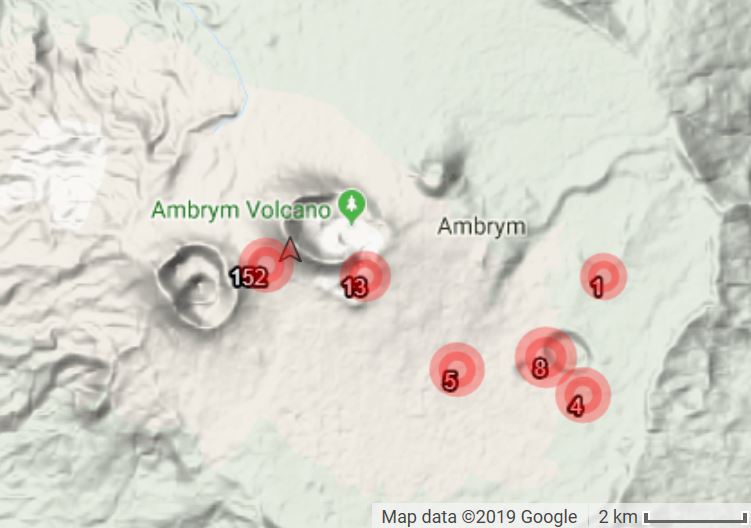
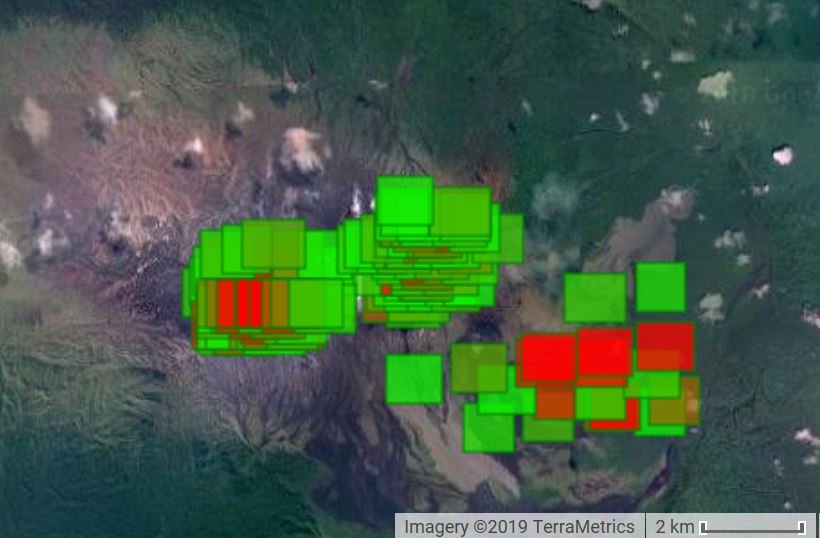
Fissure eruption in mid-December 2018 produces fountaining and lava flows; no activity evident in caldera after 17 December
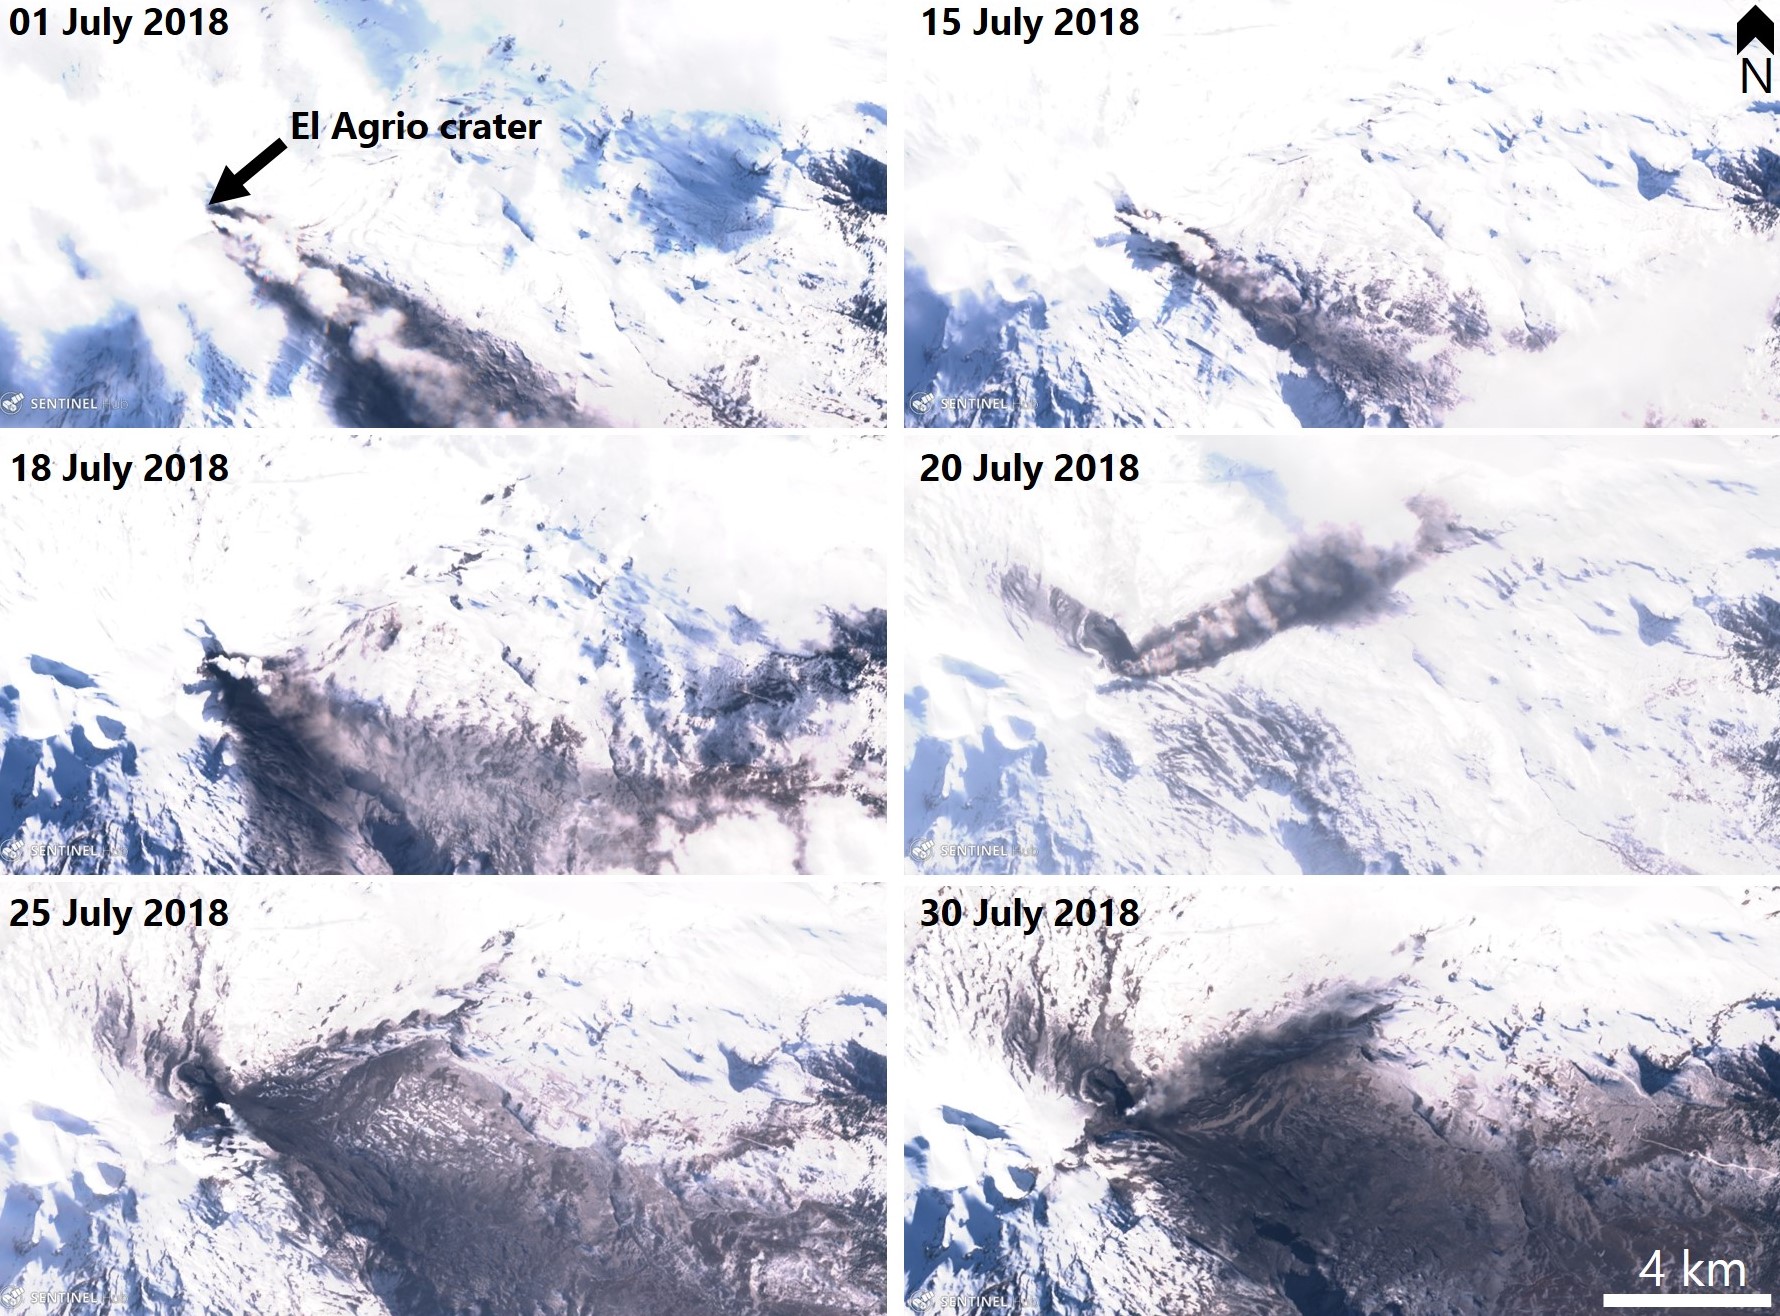
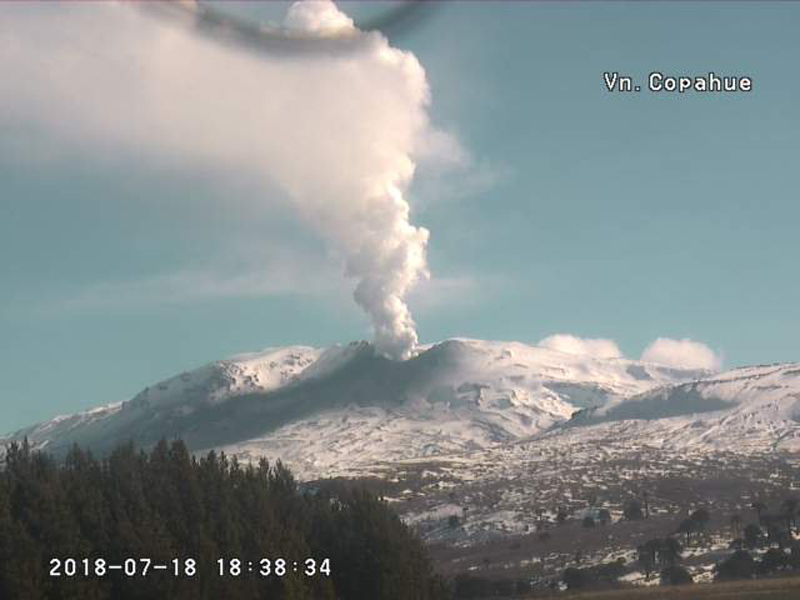
Copahue (Chile-Argentina)
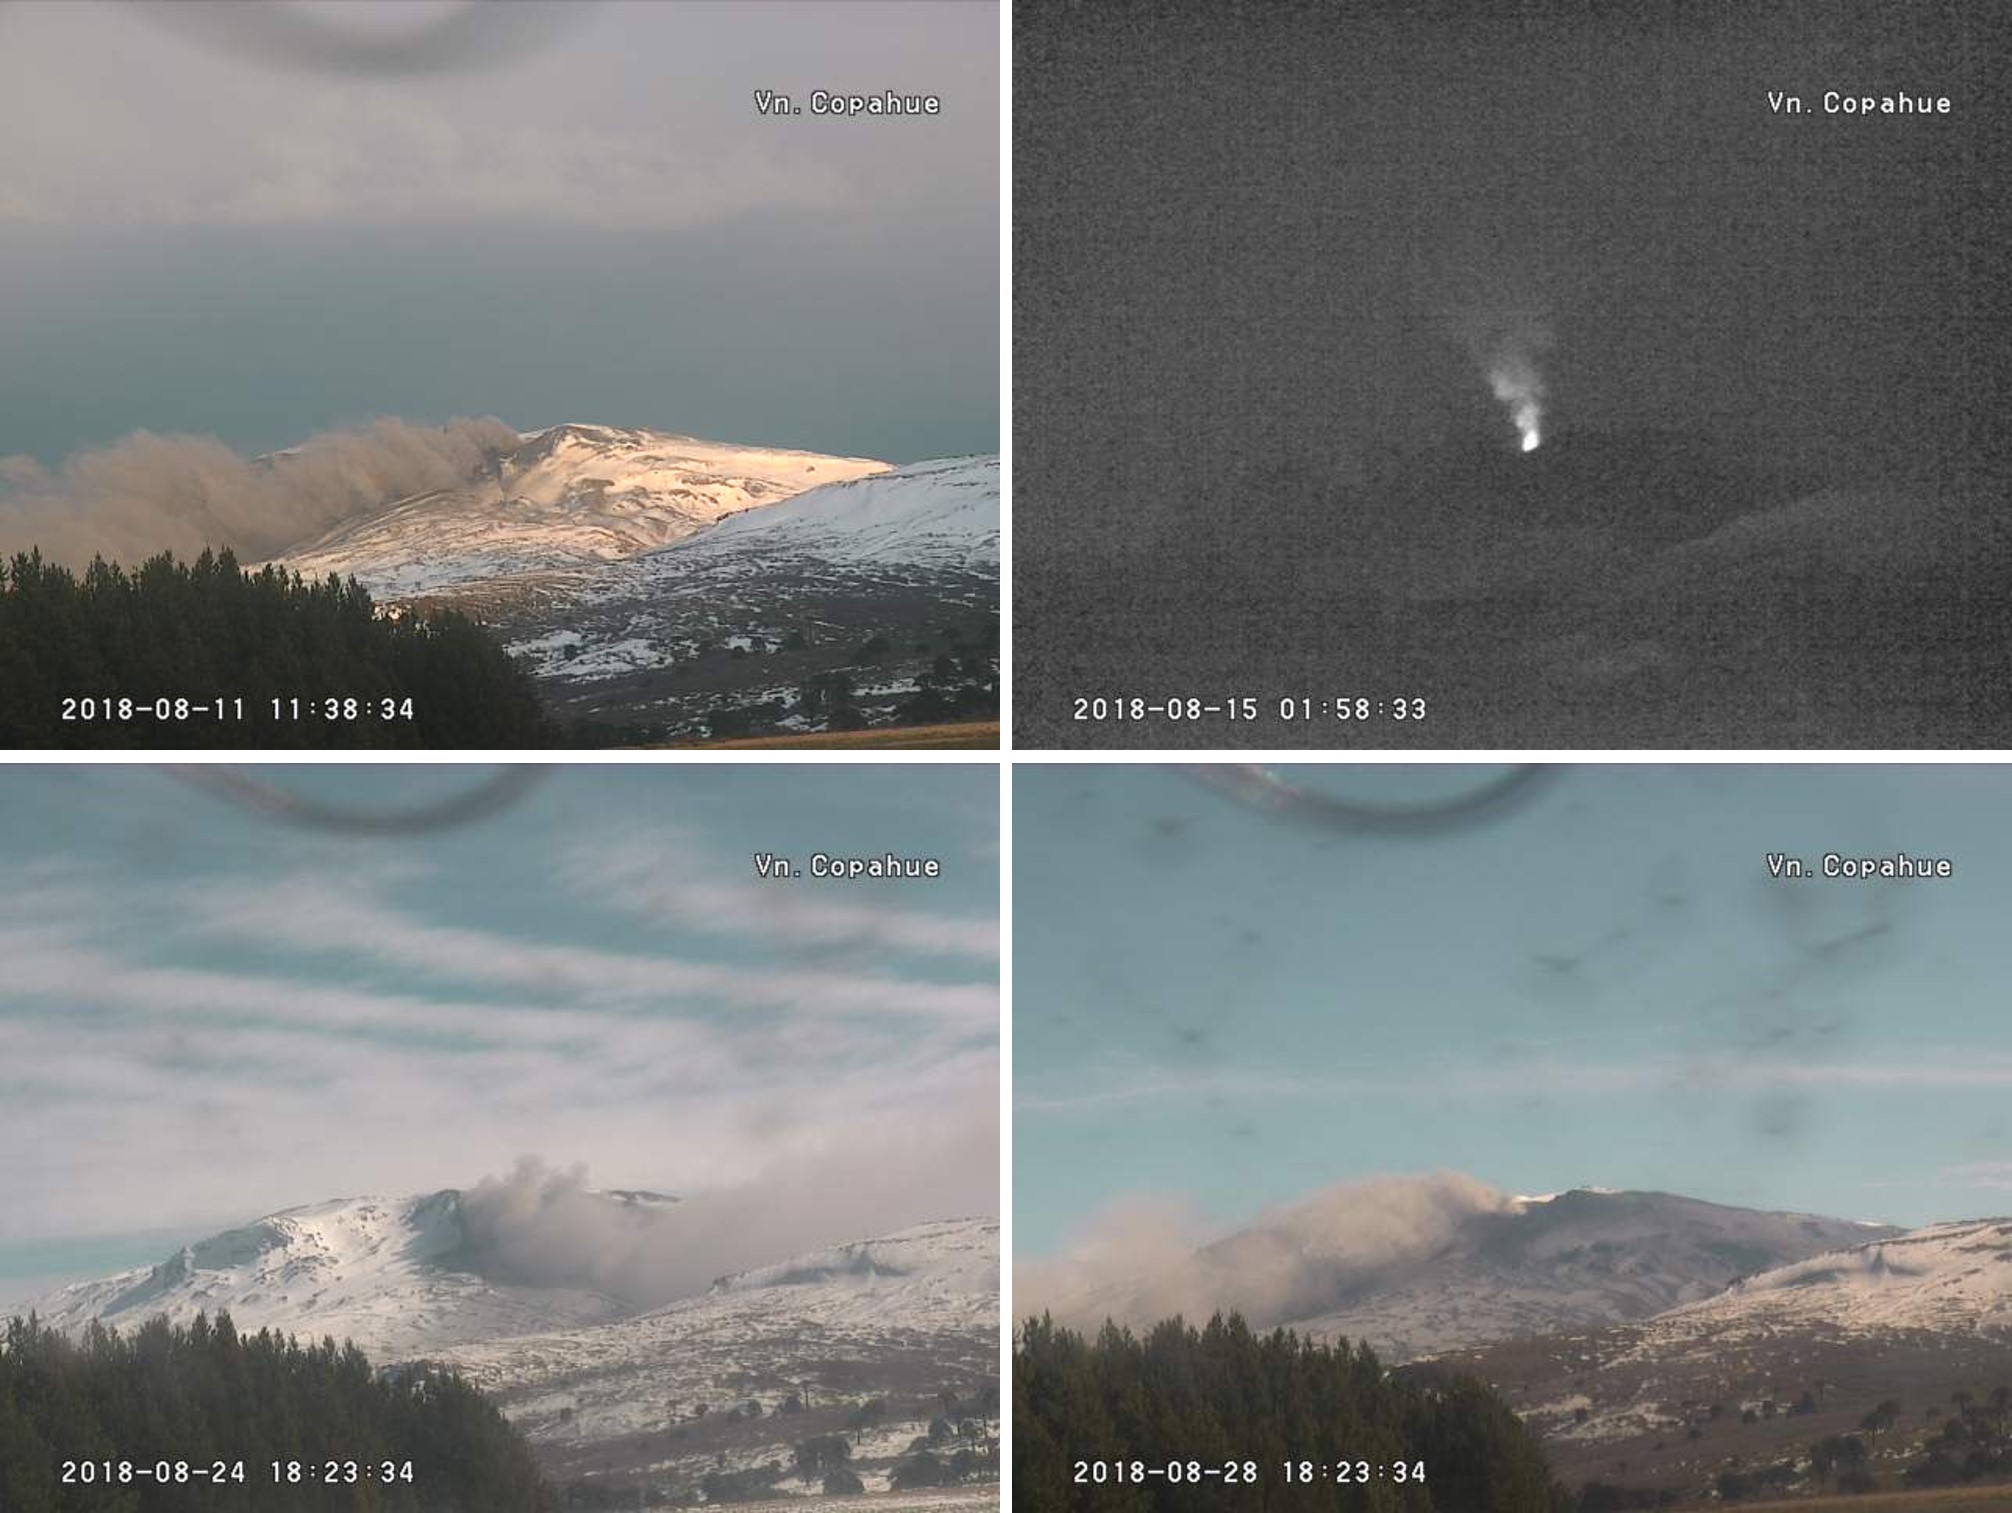
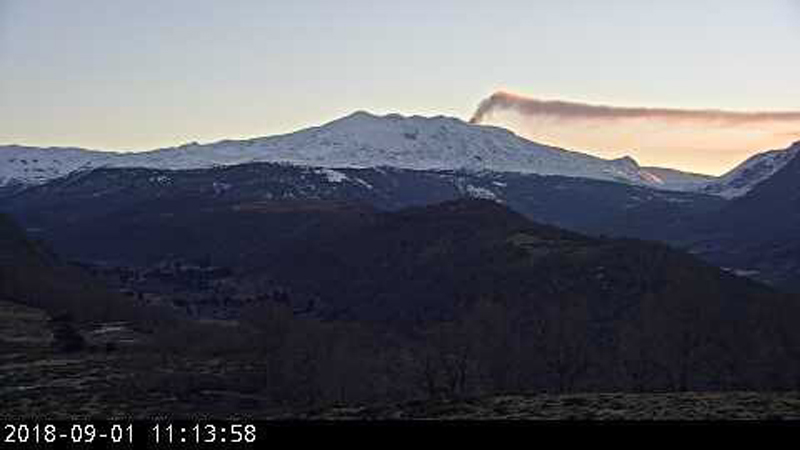
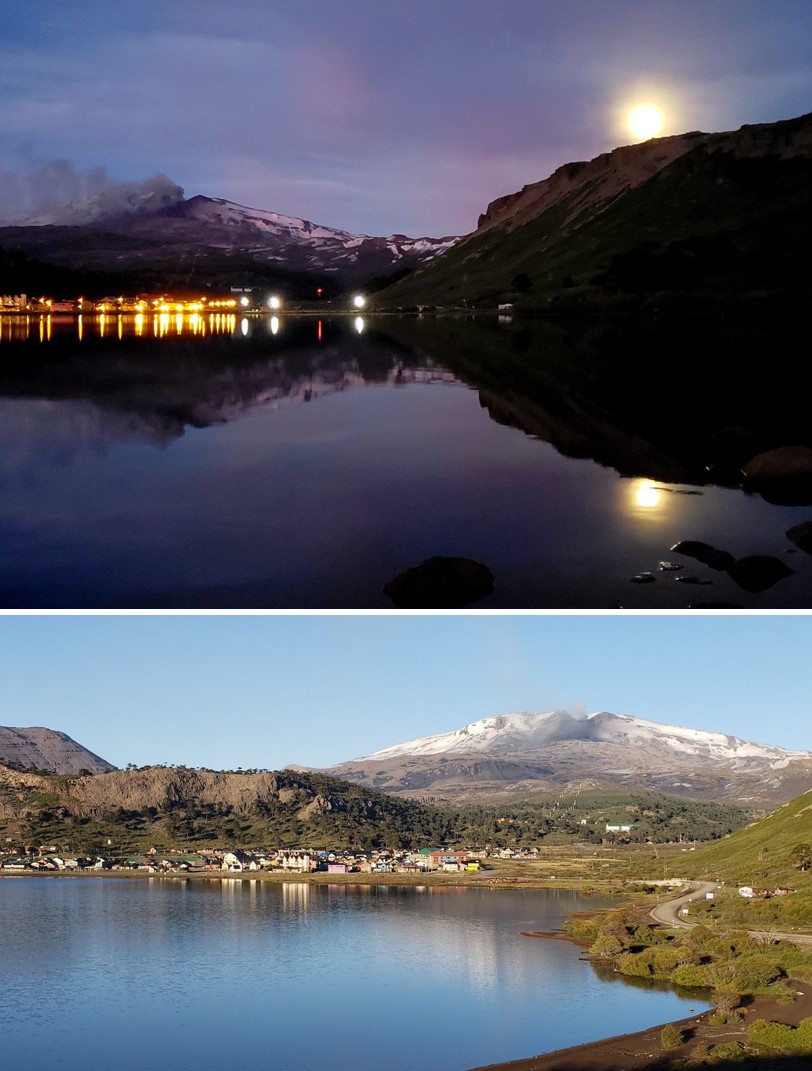
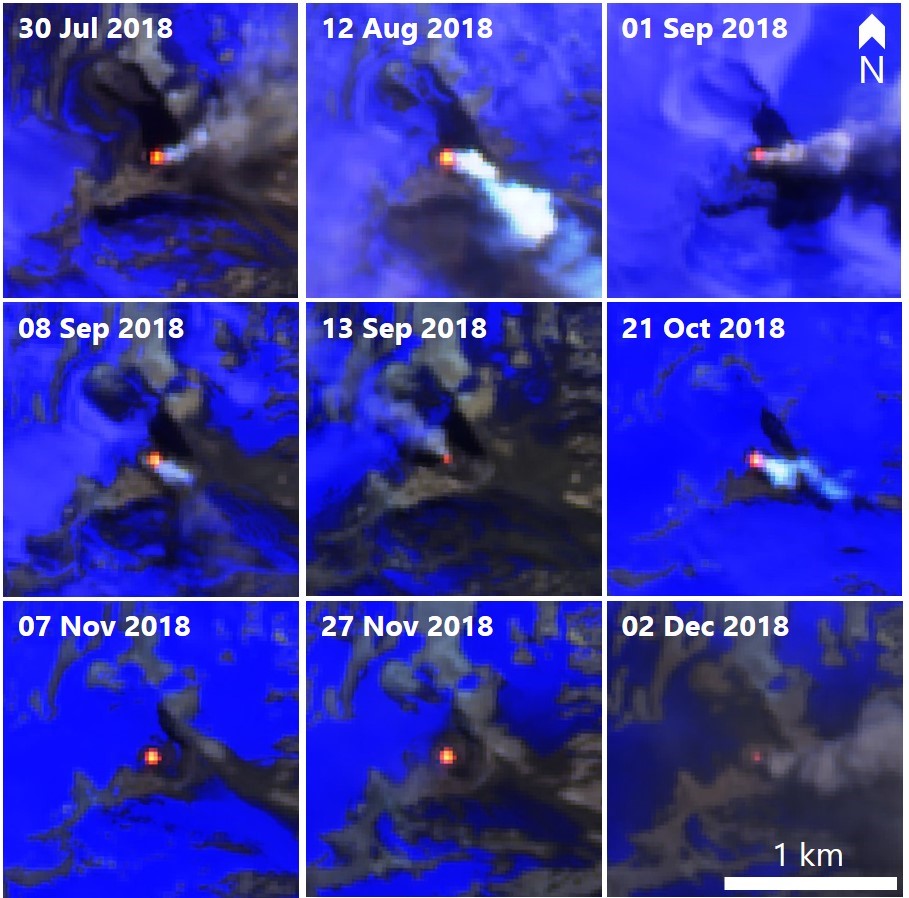
Frequent emissions and small ash plumes continue from July through 7 December 2018
Erebus (Antarctica)
Lava lakes persist through 2017 and 2018
Kilauea (United States)
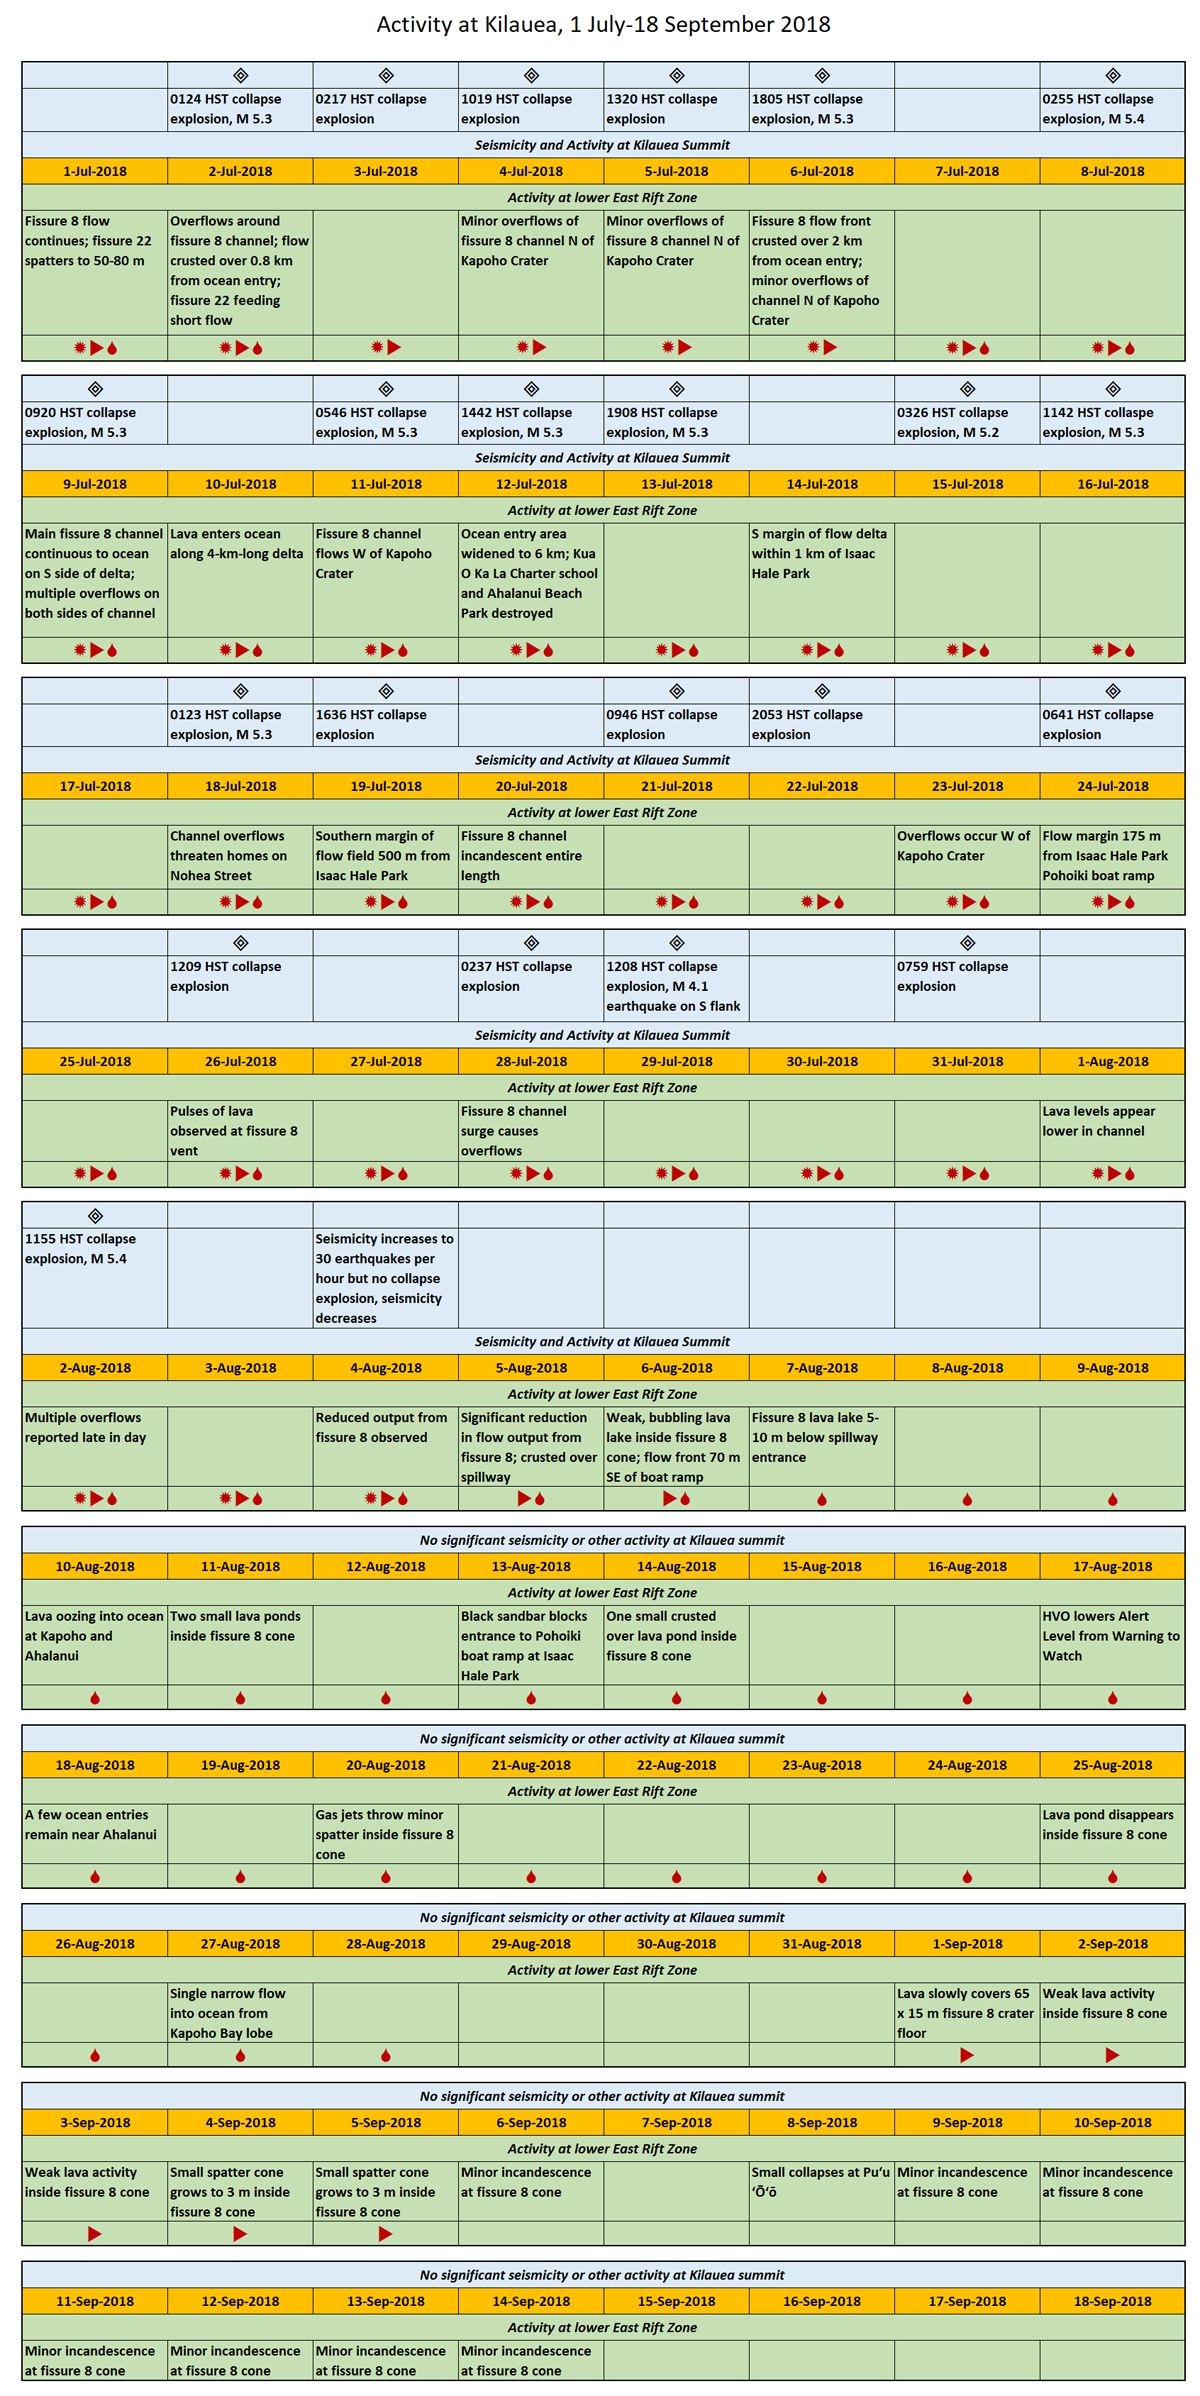
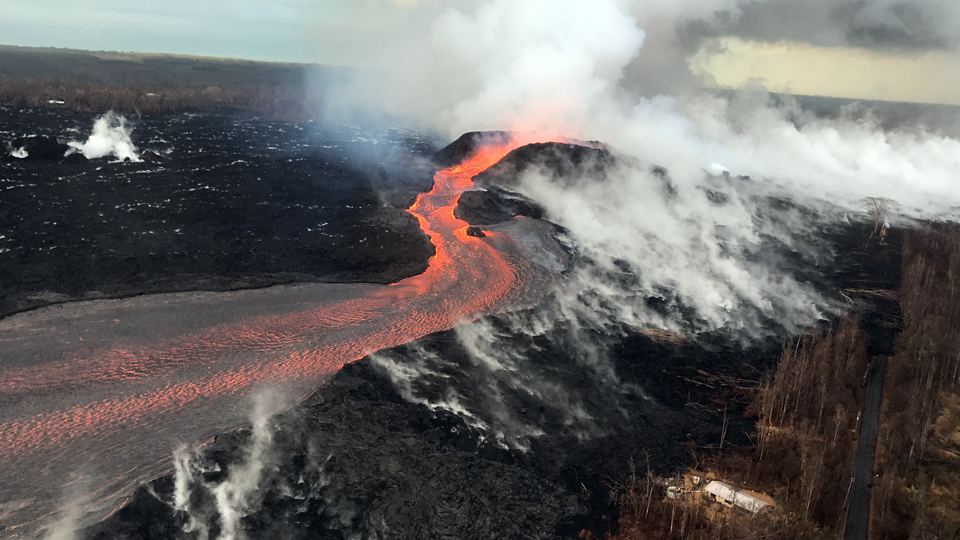
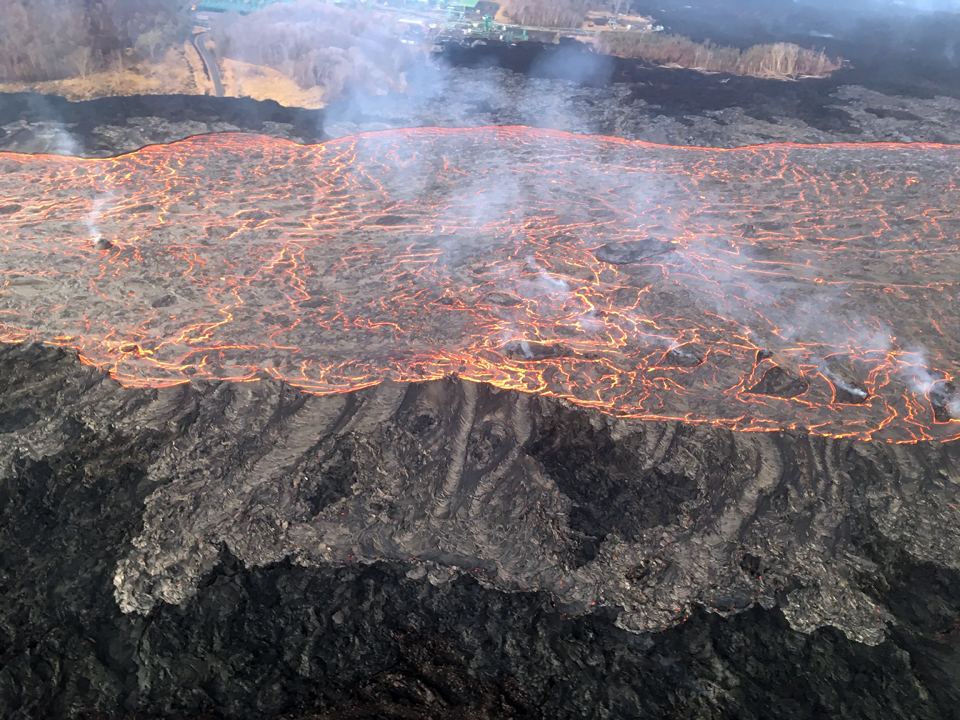
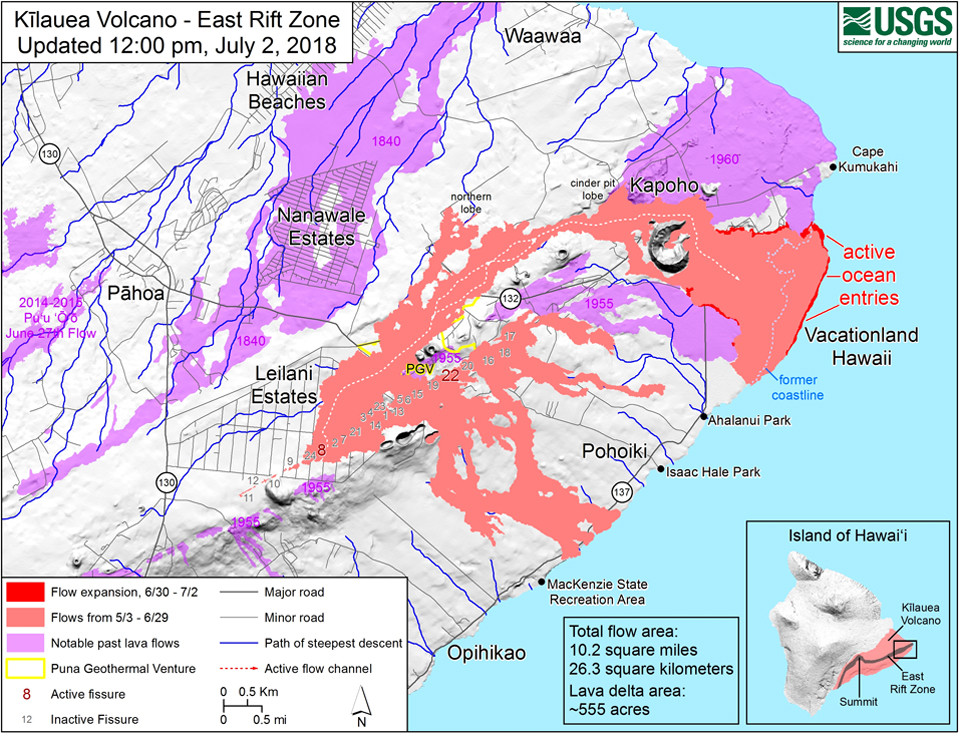
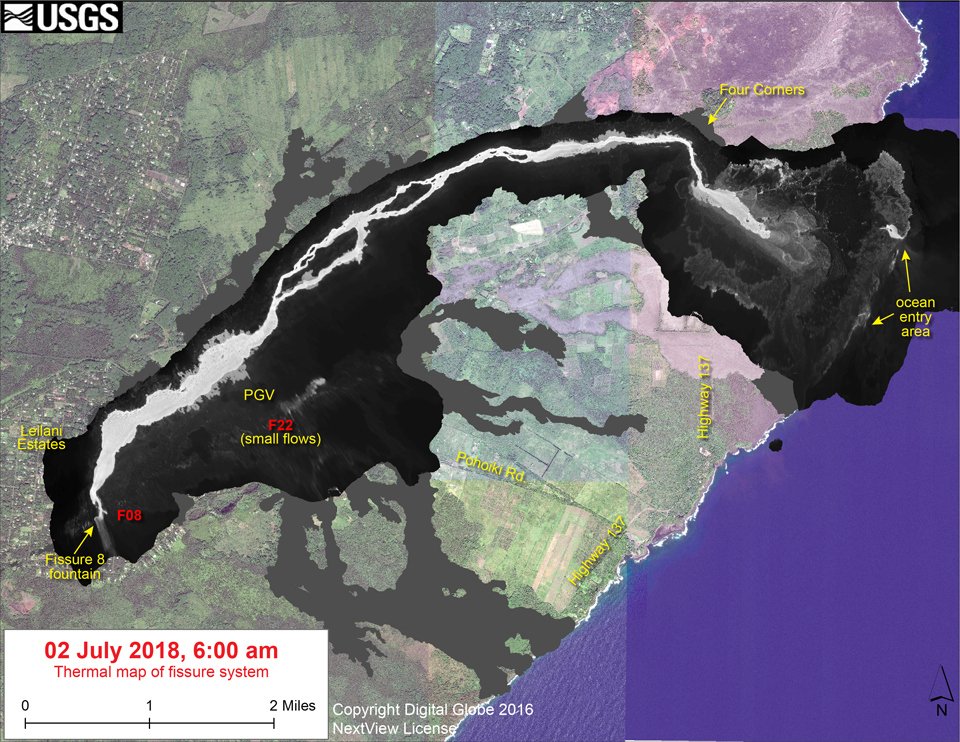
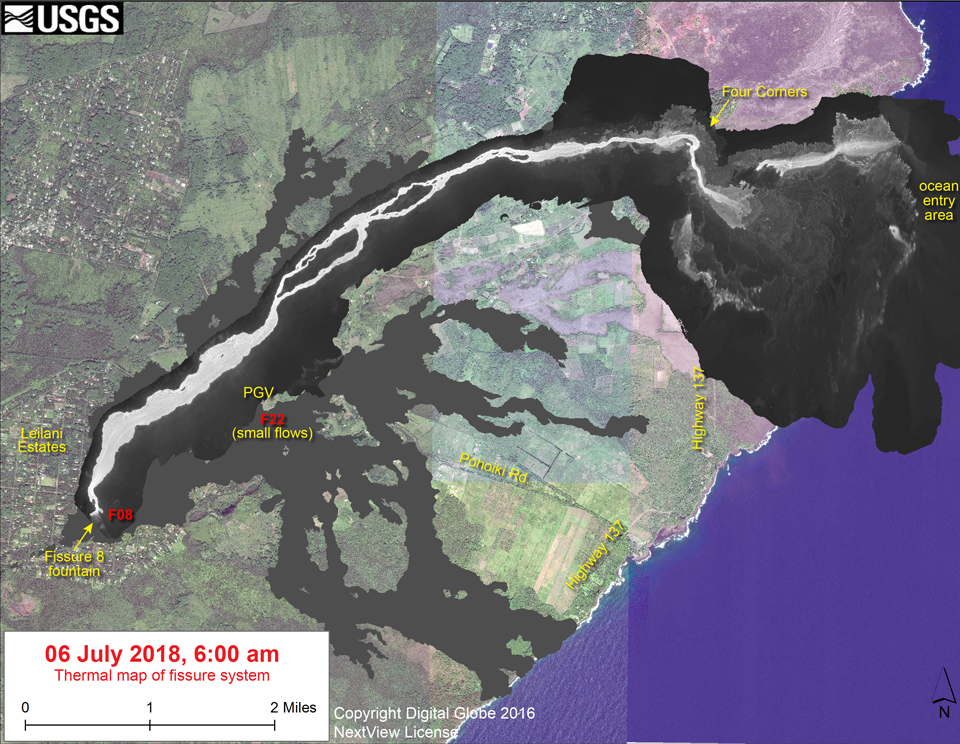
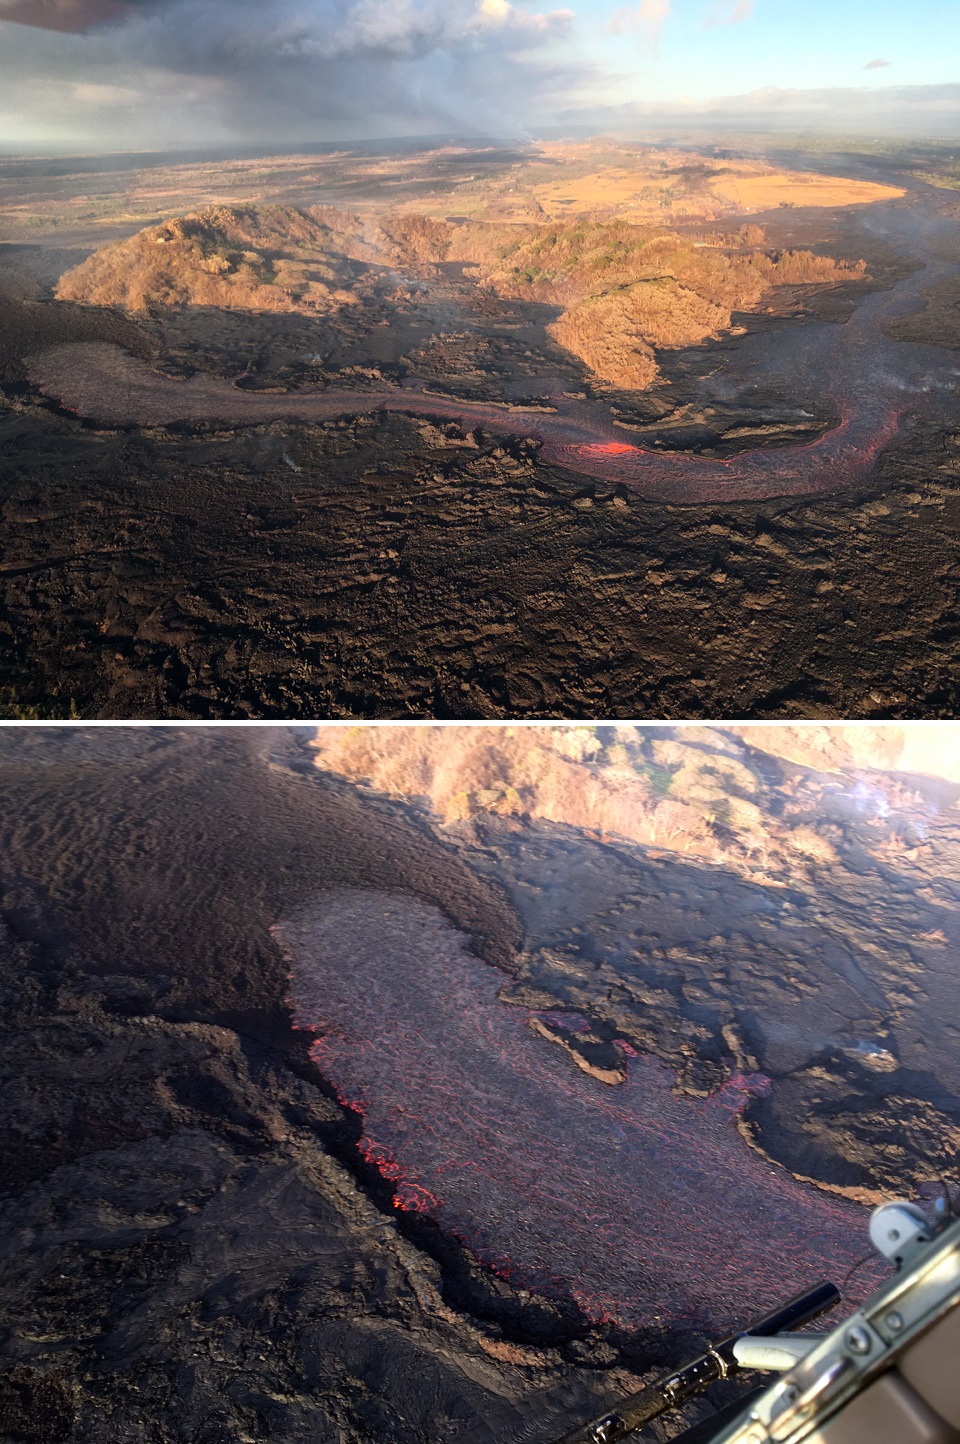
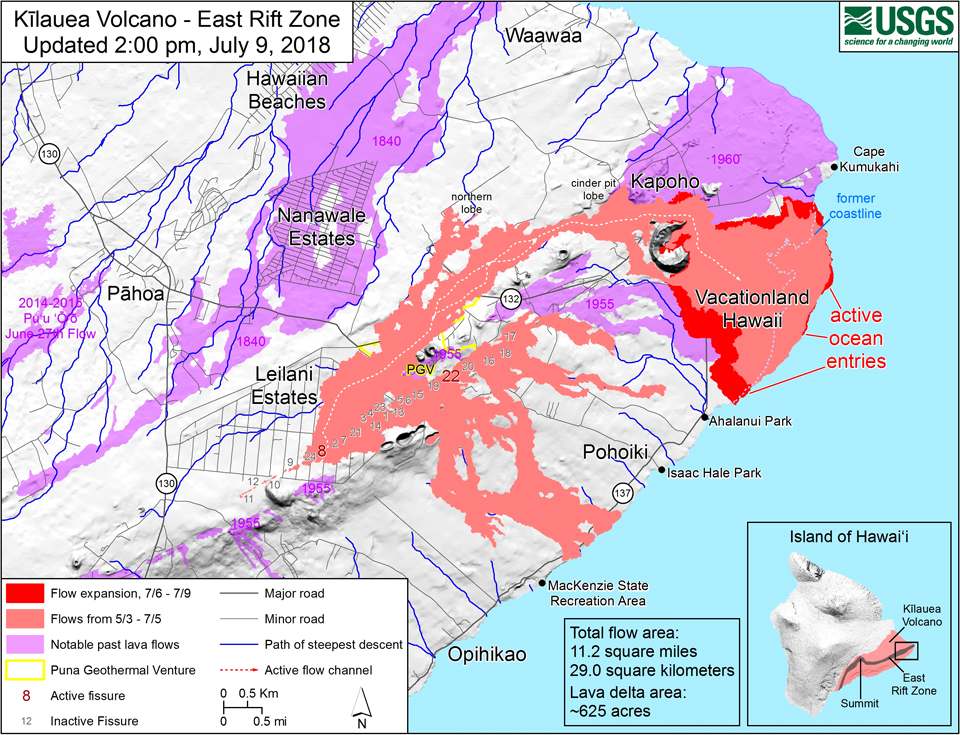
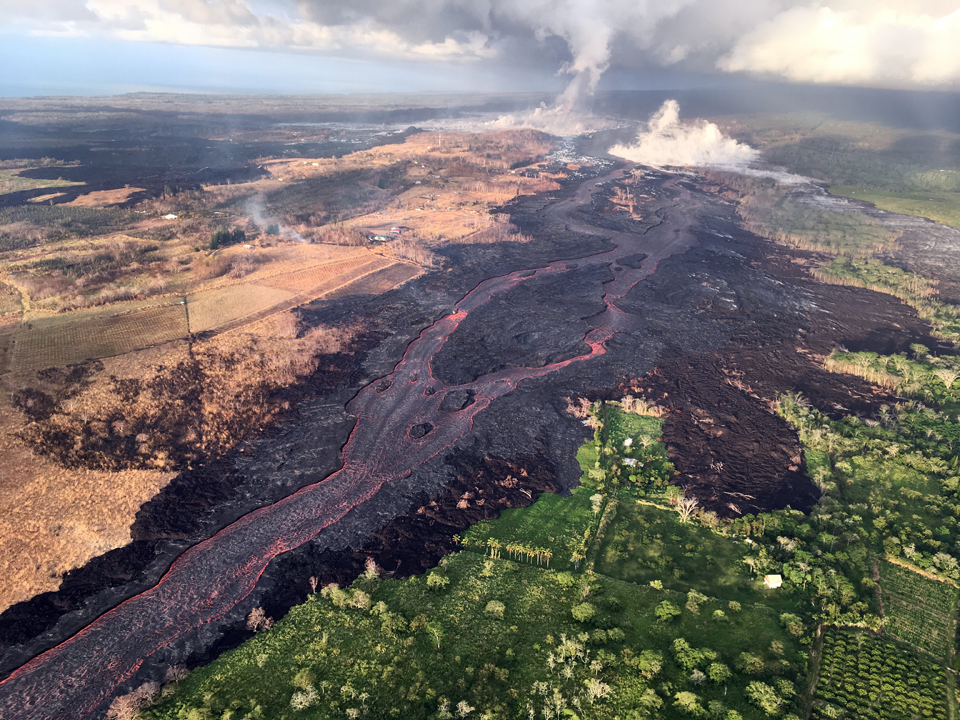
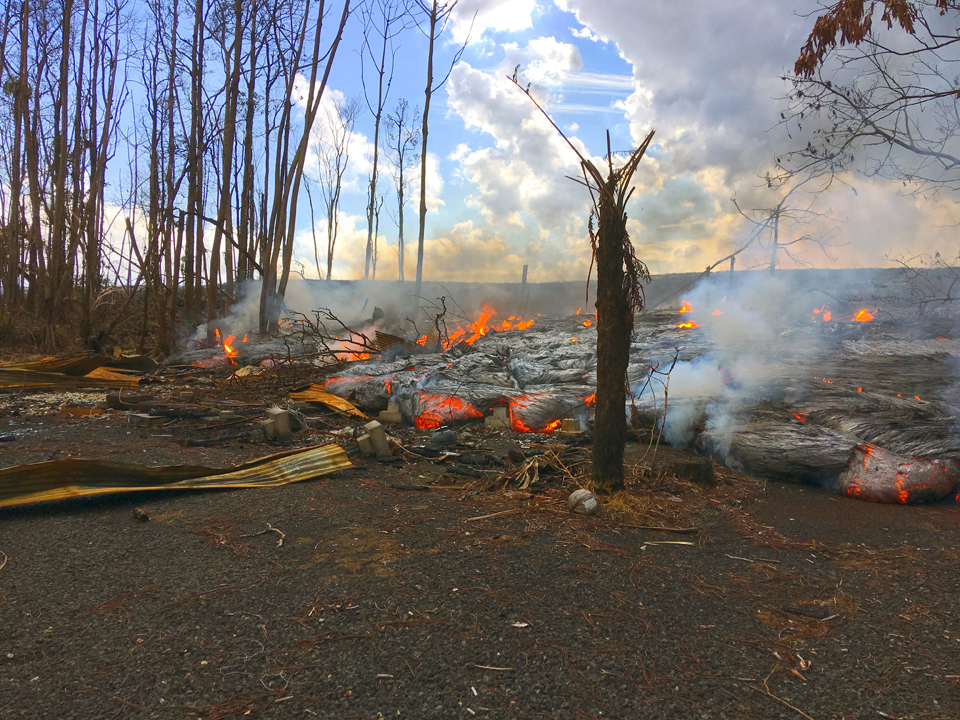
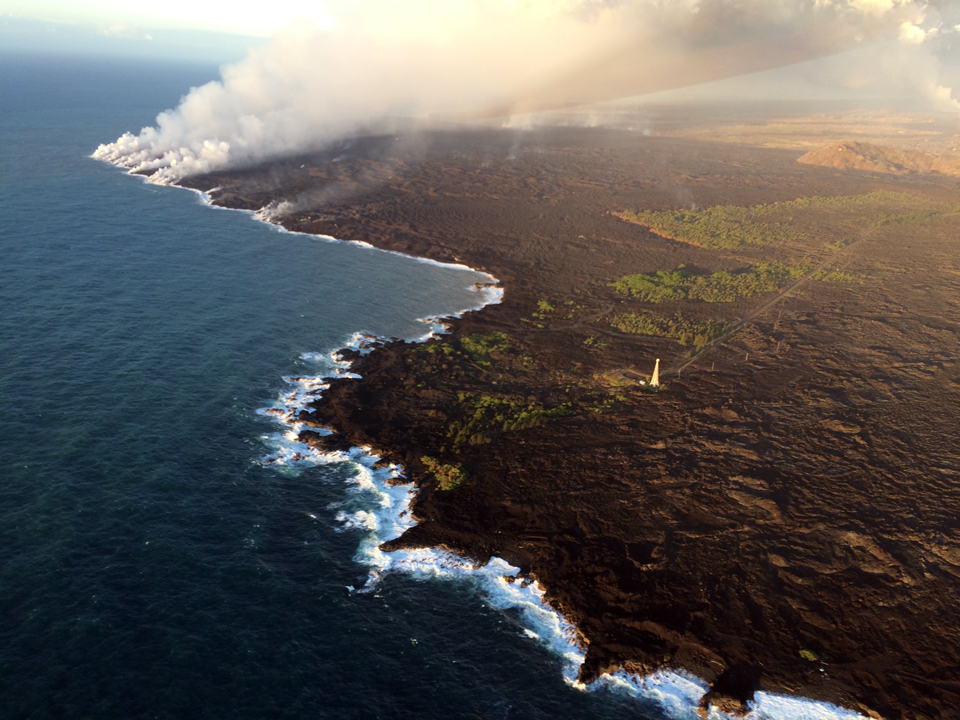
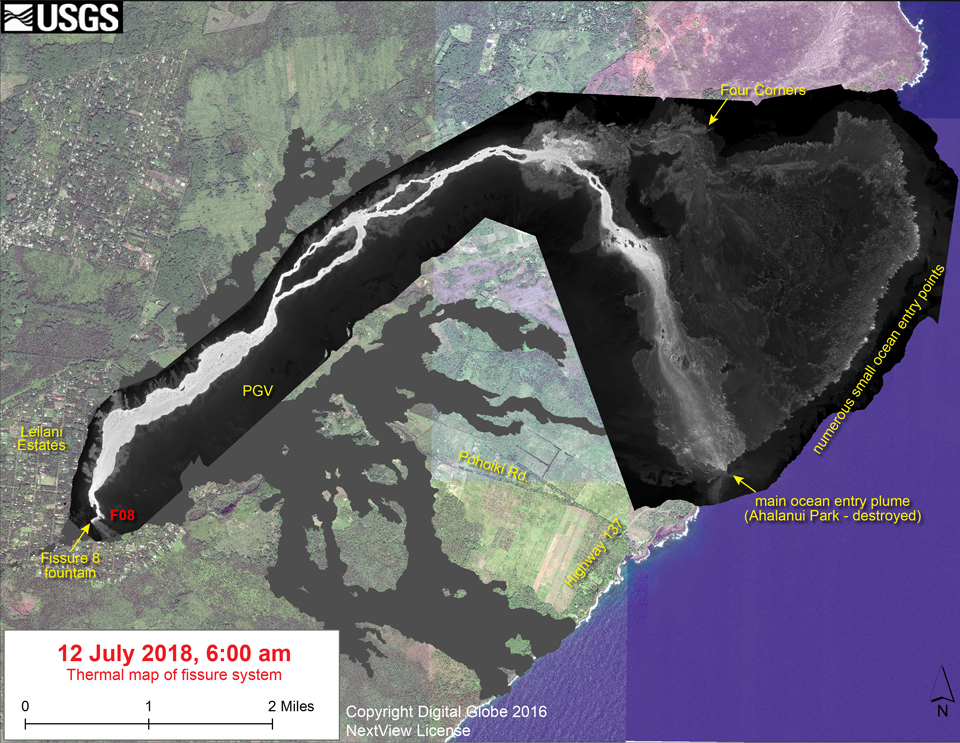
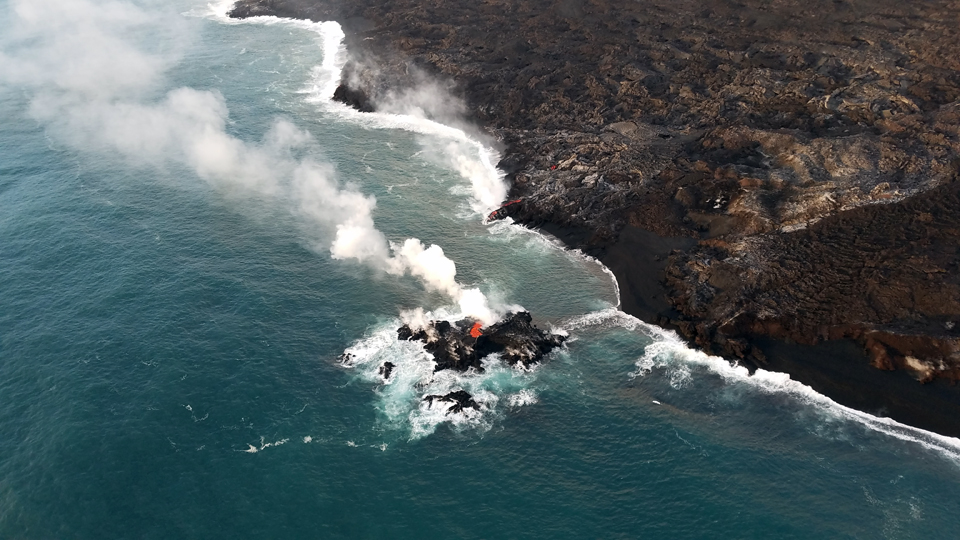
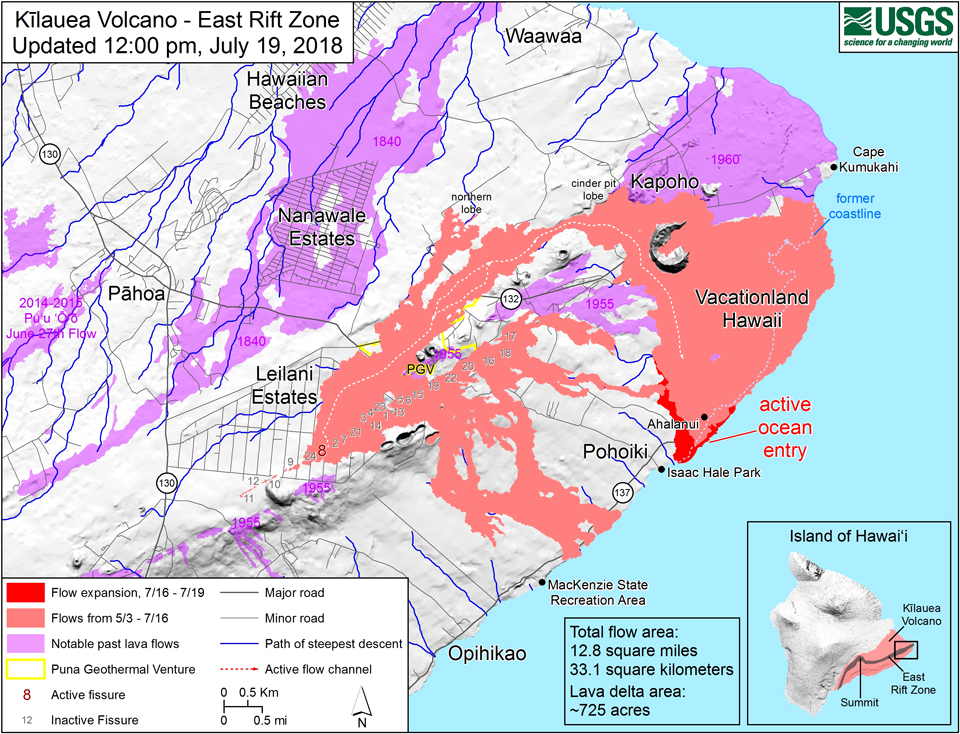
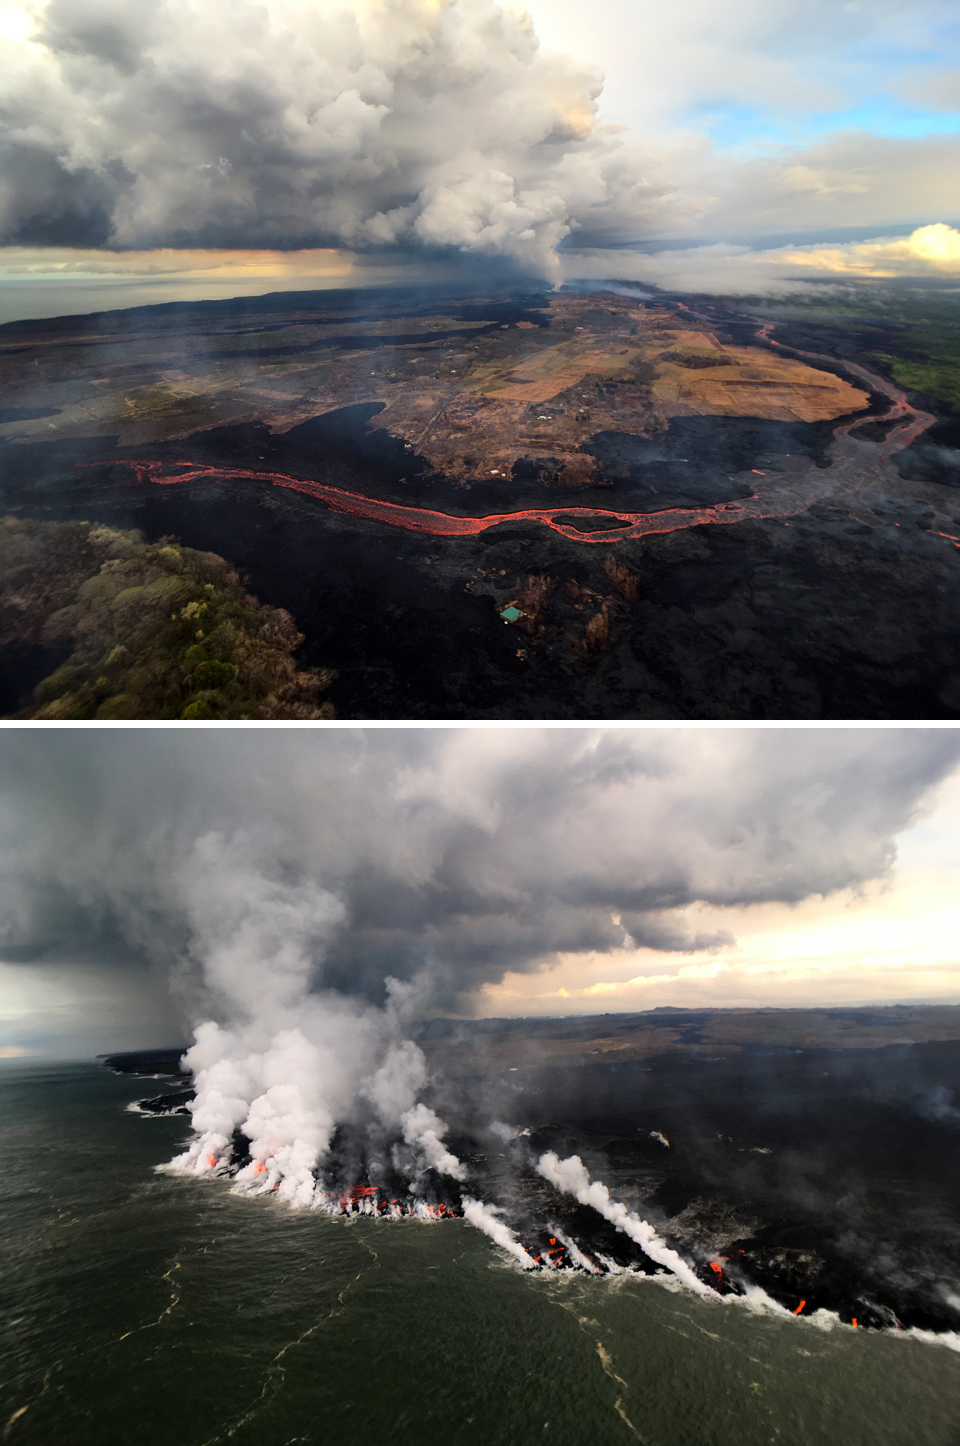
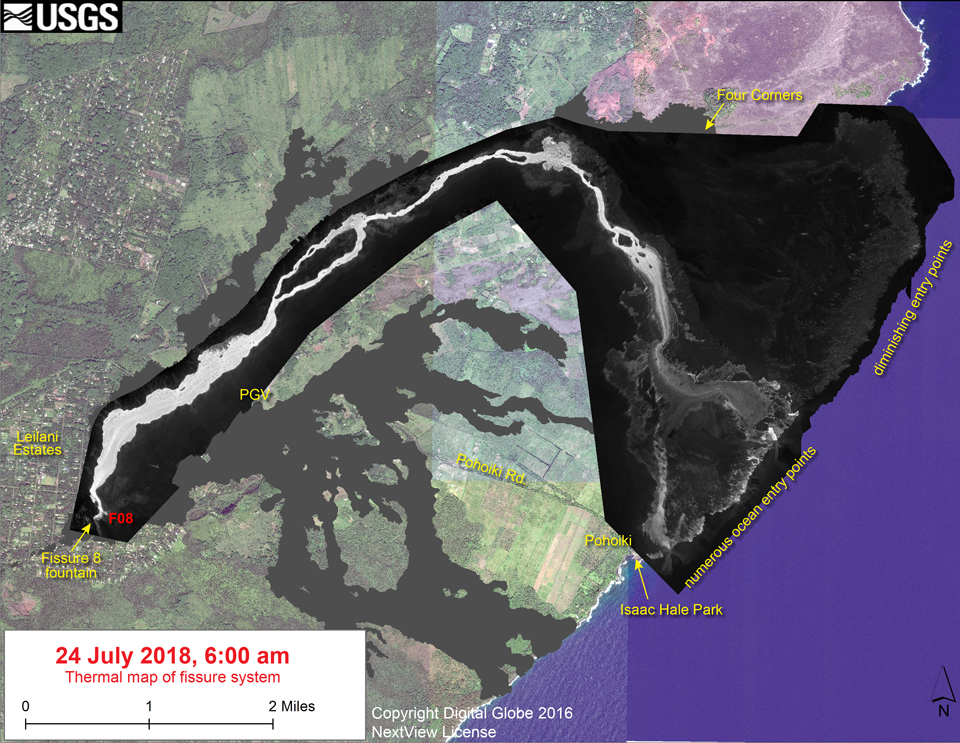
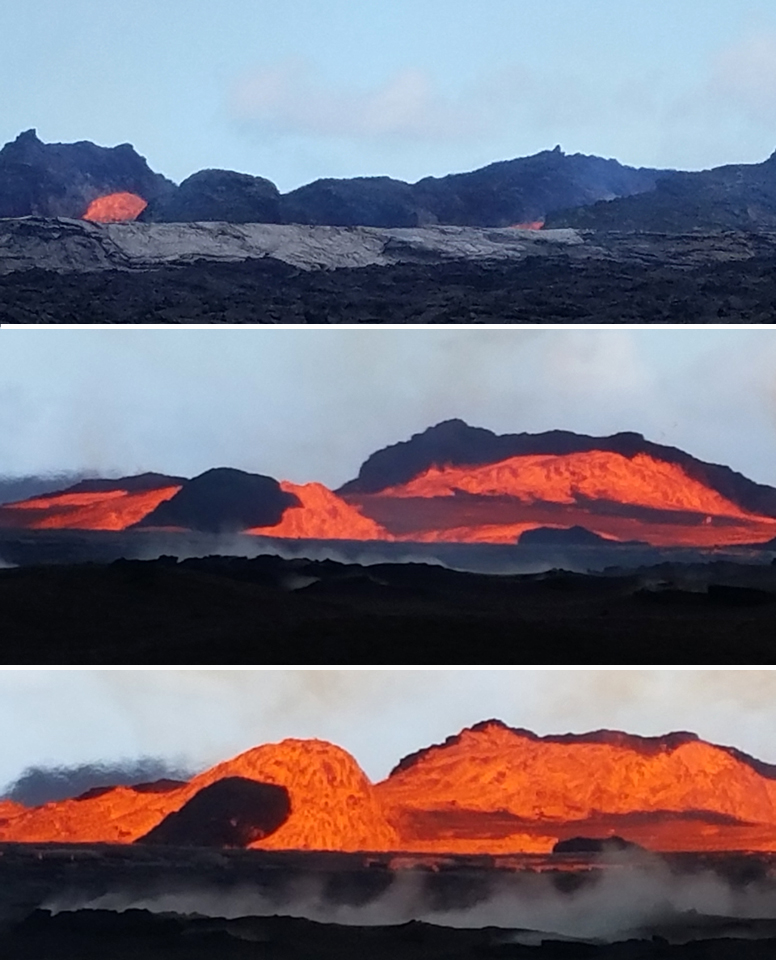
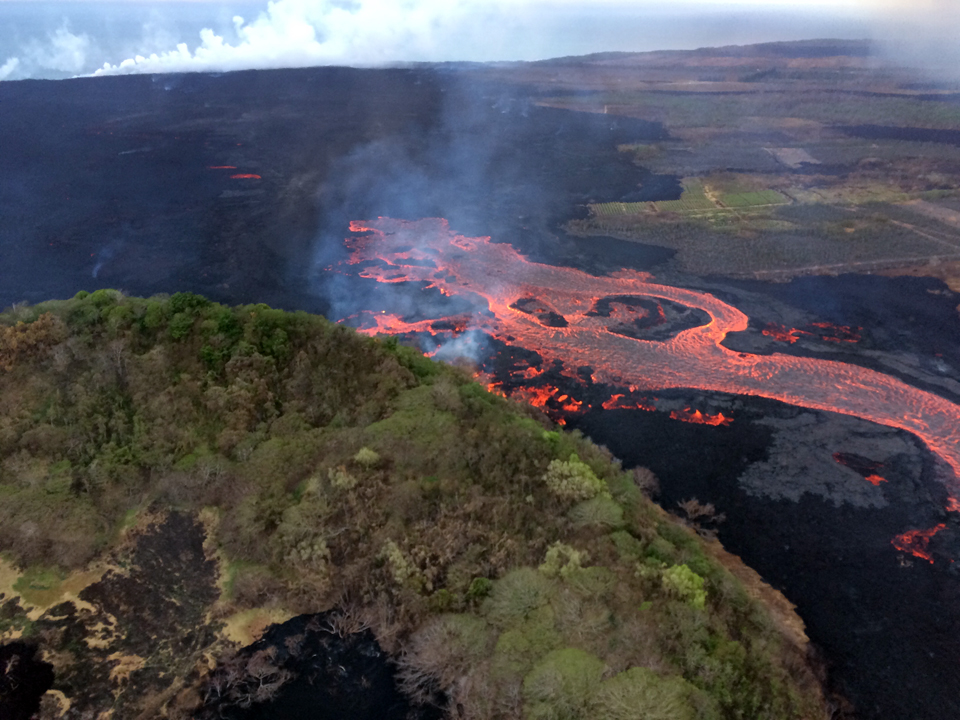
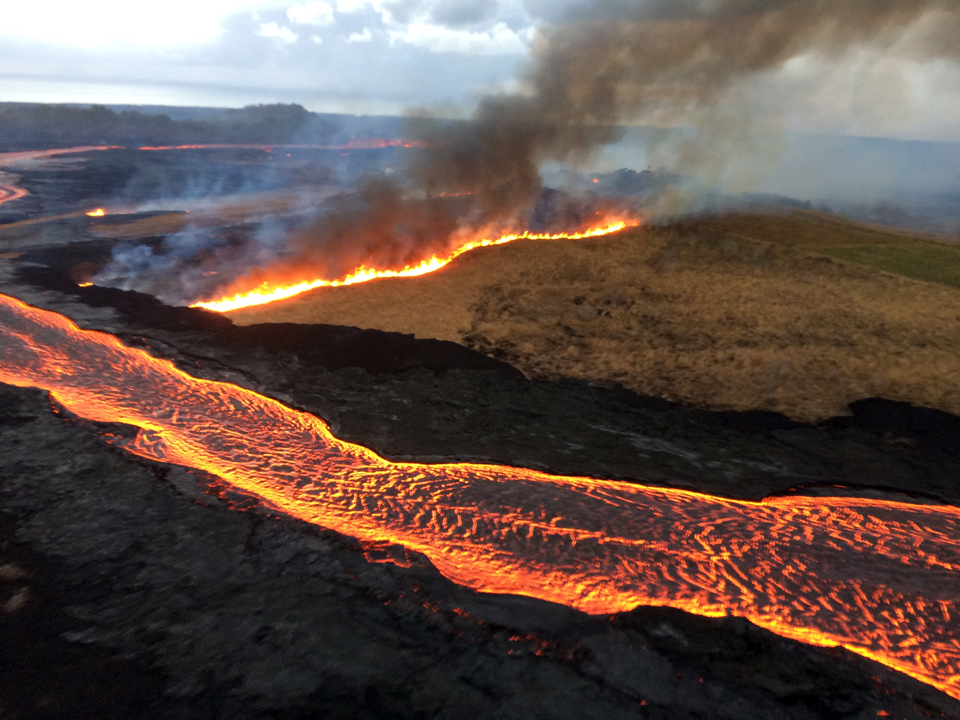
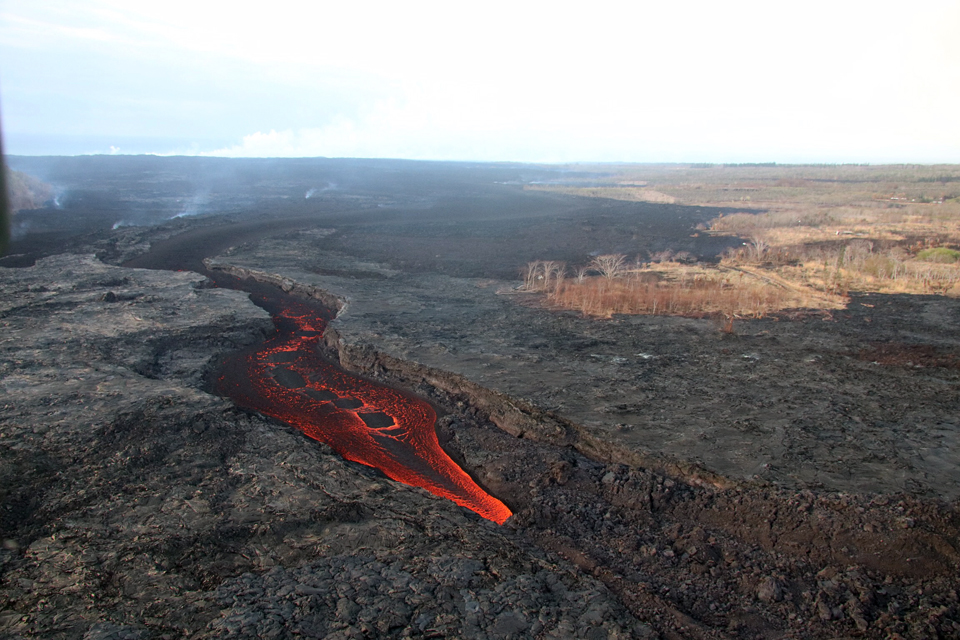
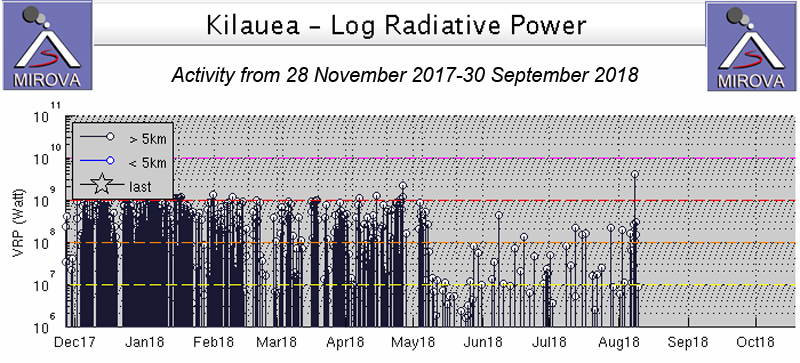
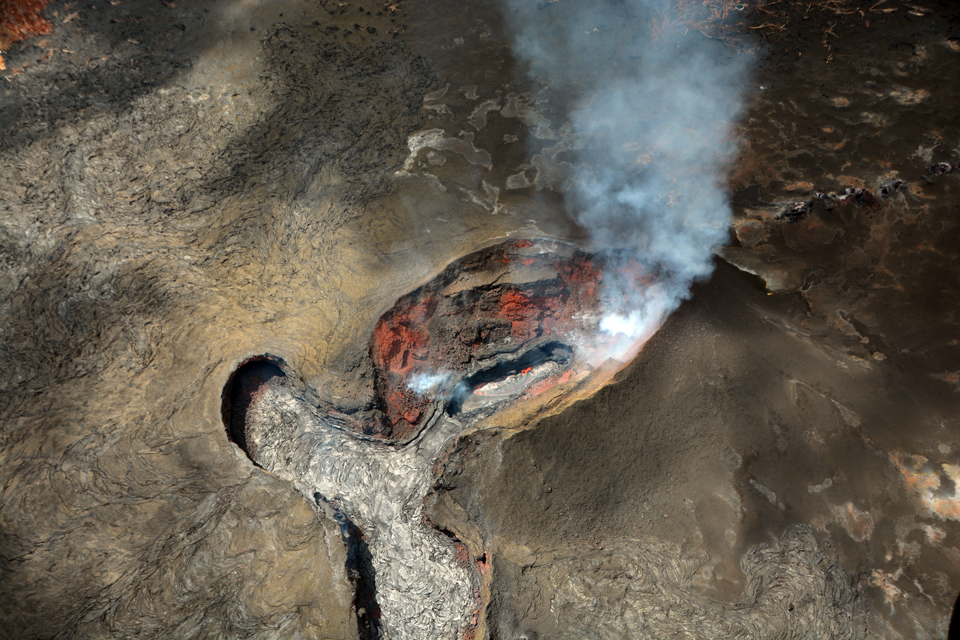
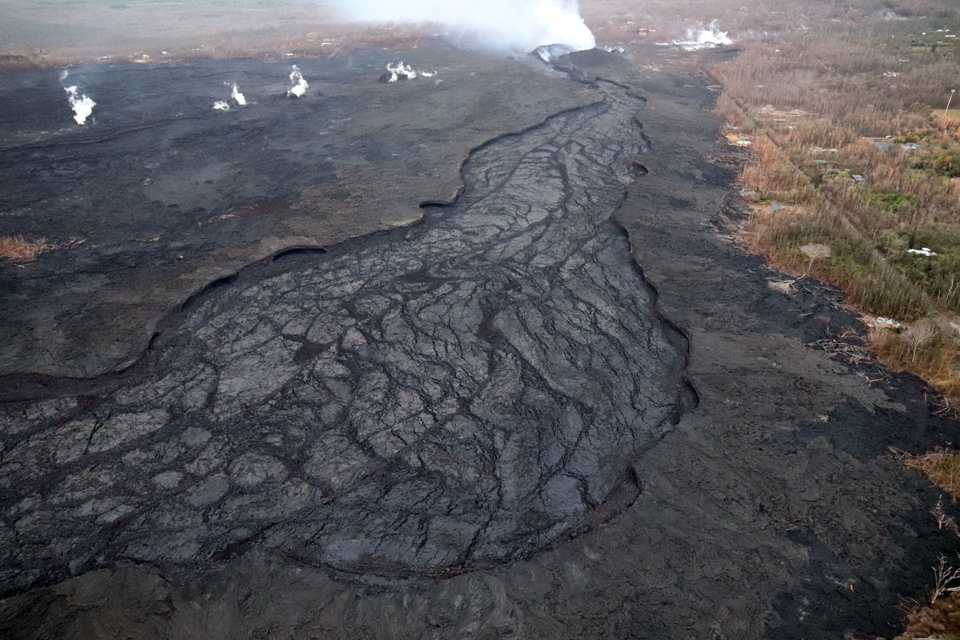
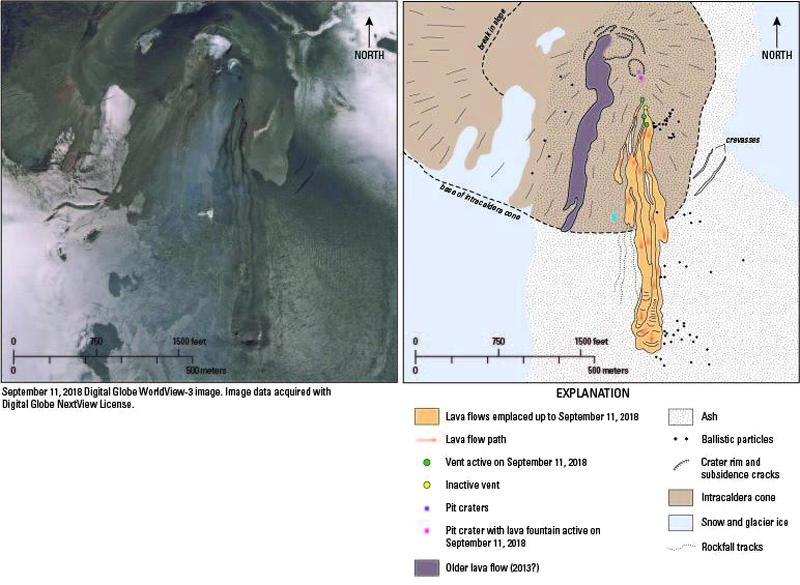
Fissure 8 lava flow continues vigorously until 4 August, ocean entry ends in late August, last activity at fissure 8 cone on 5 September 2018
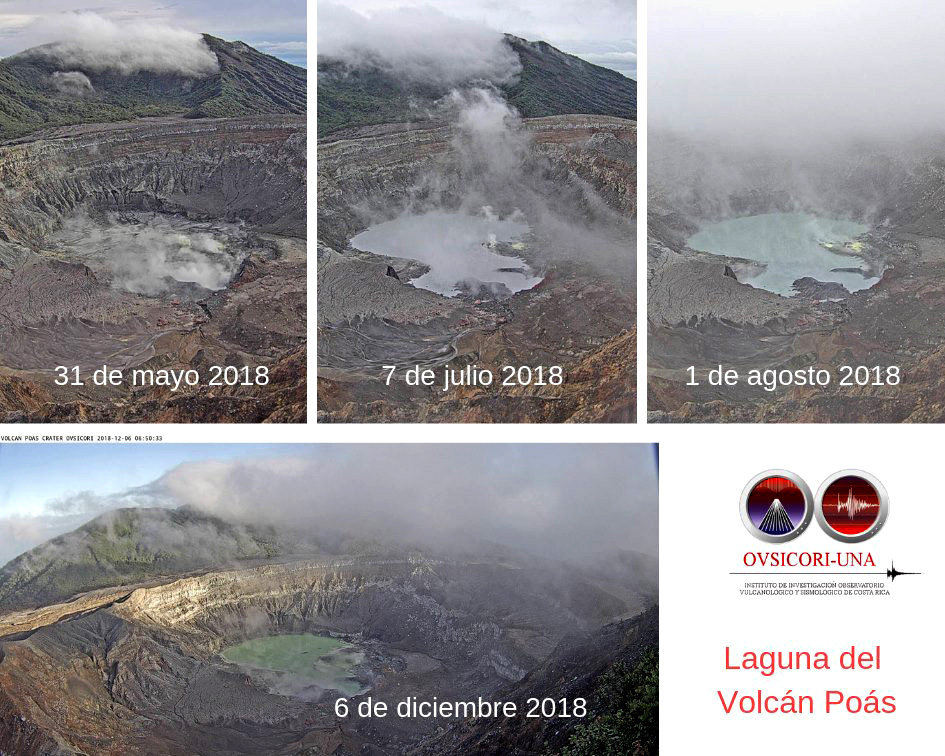
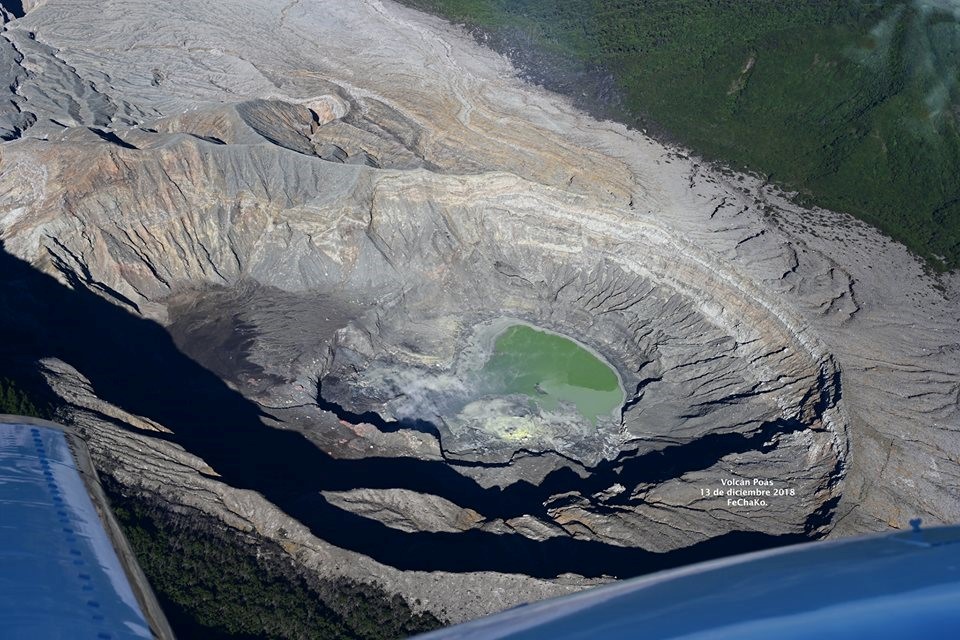
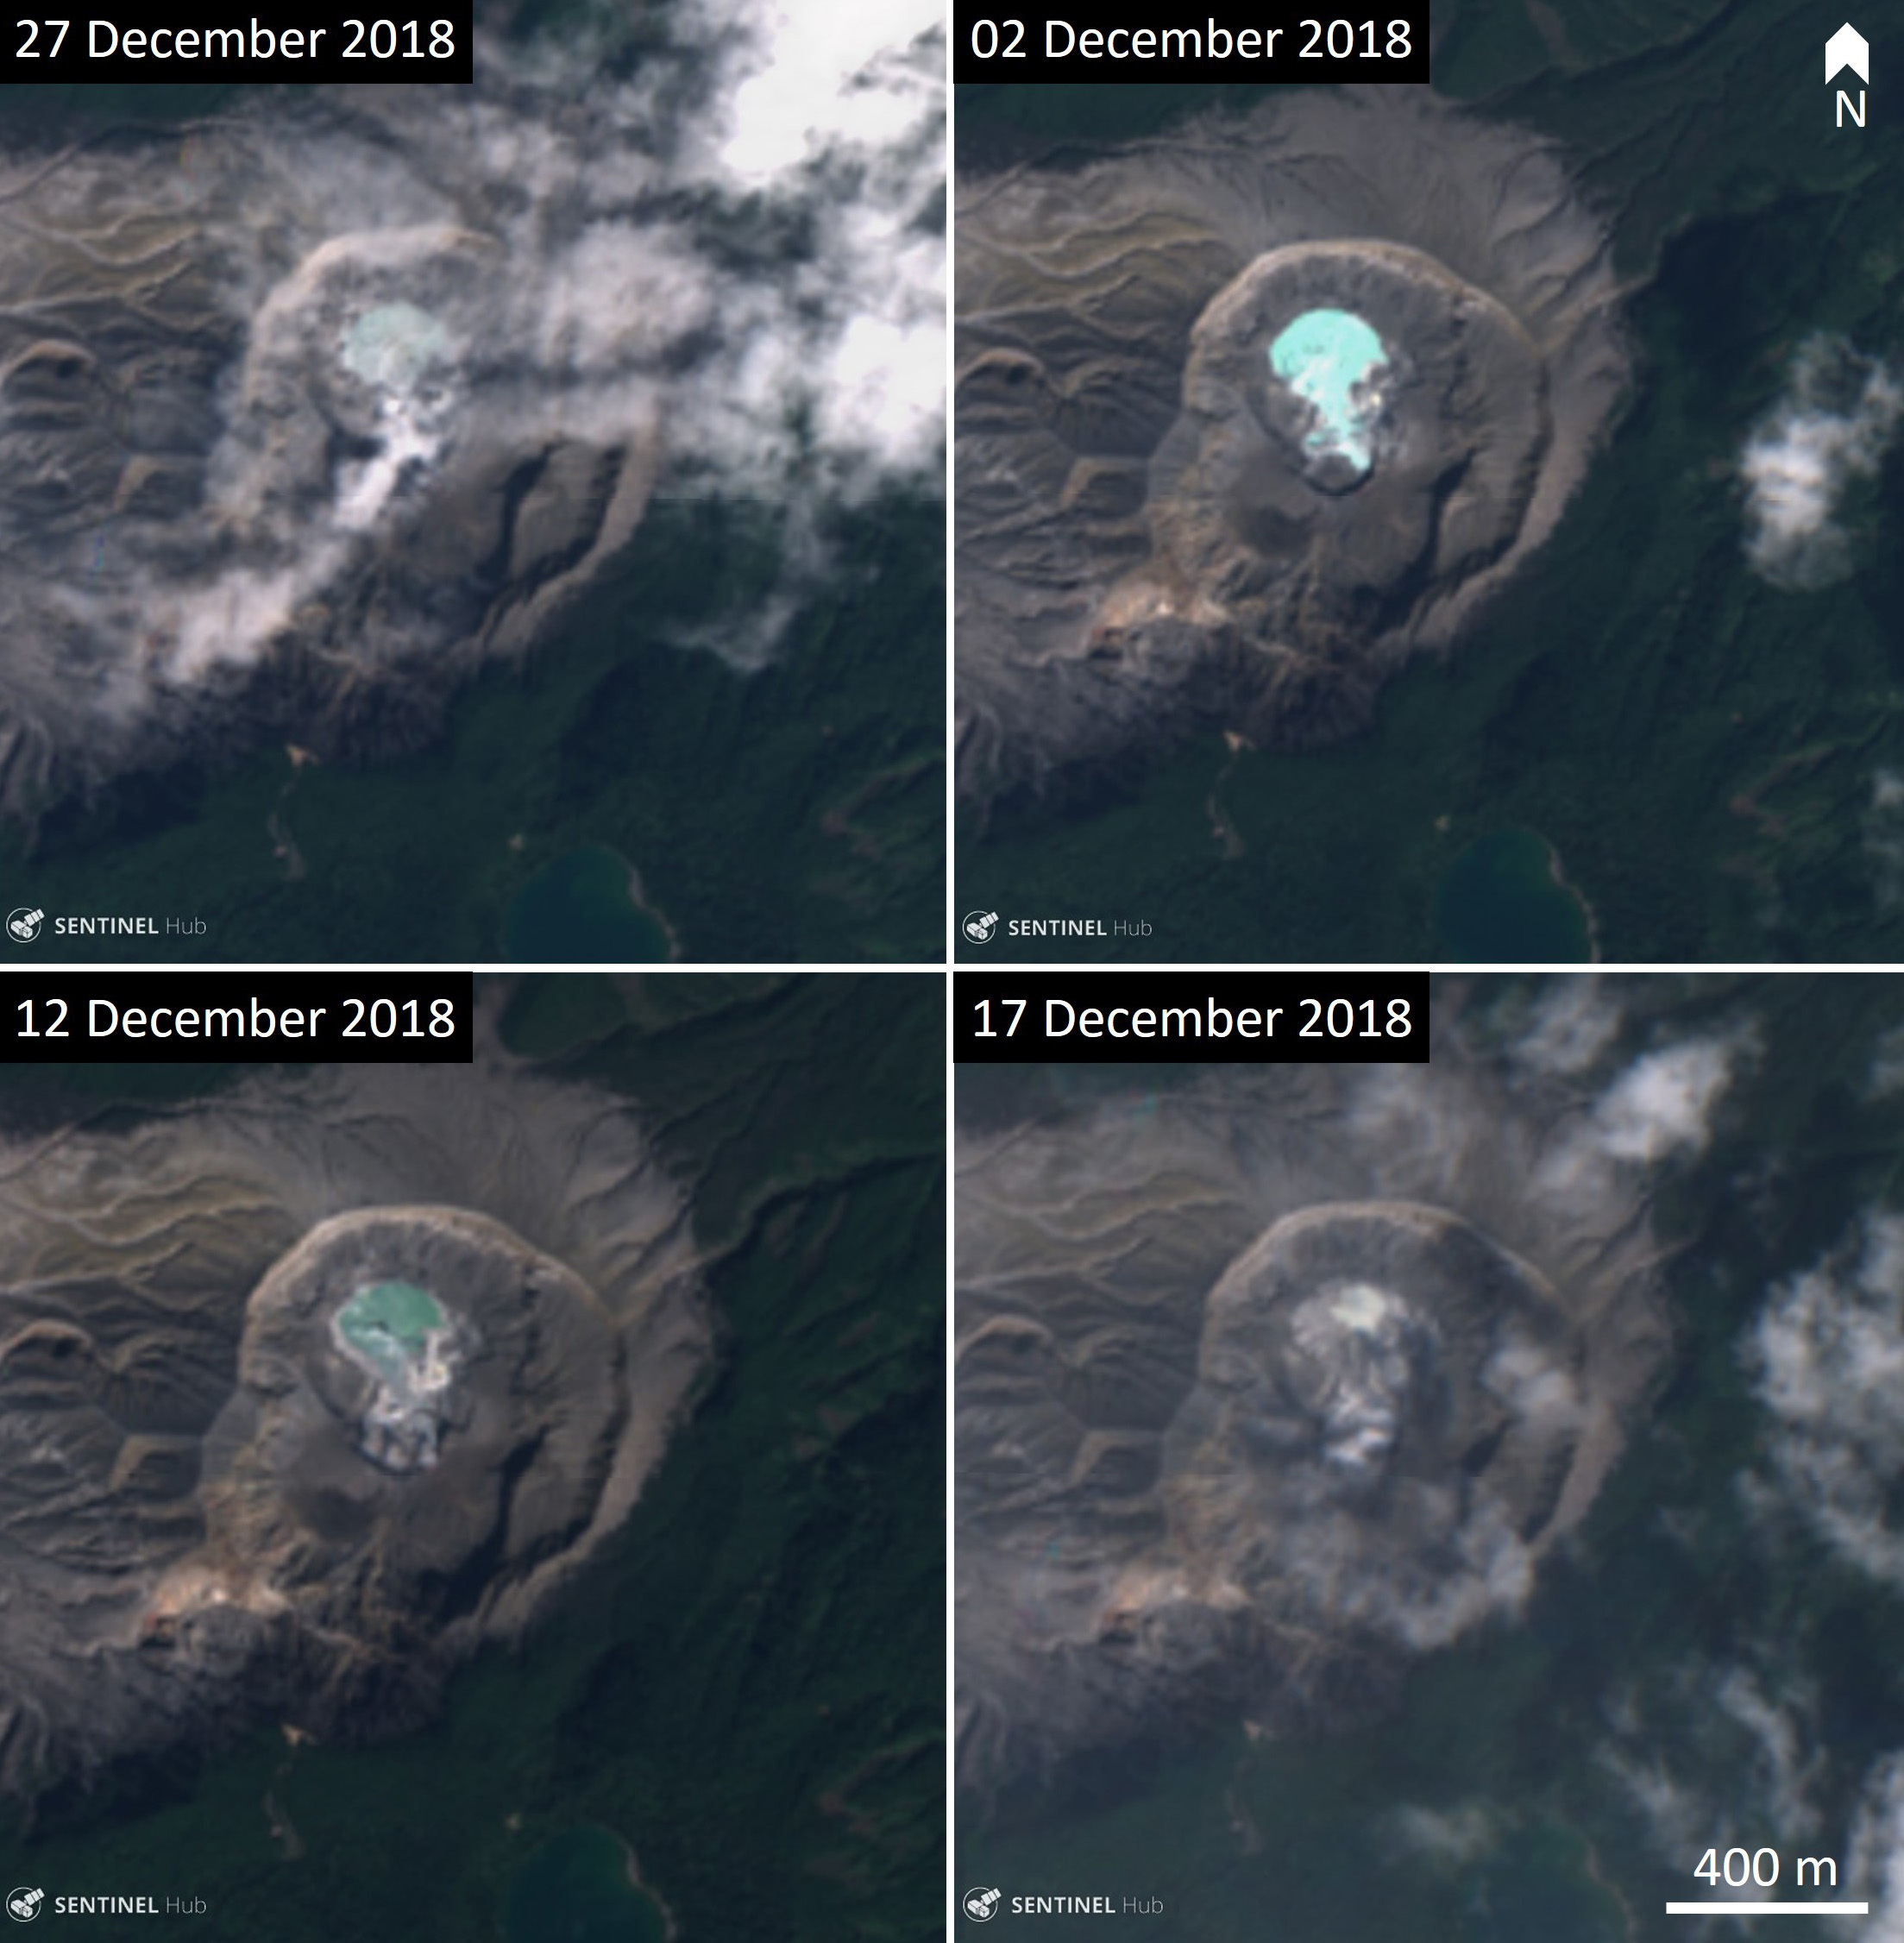
Poas (Costa Rica)
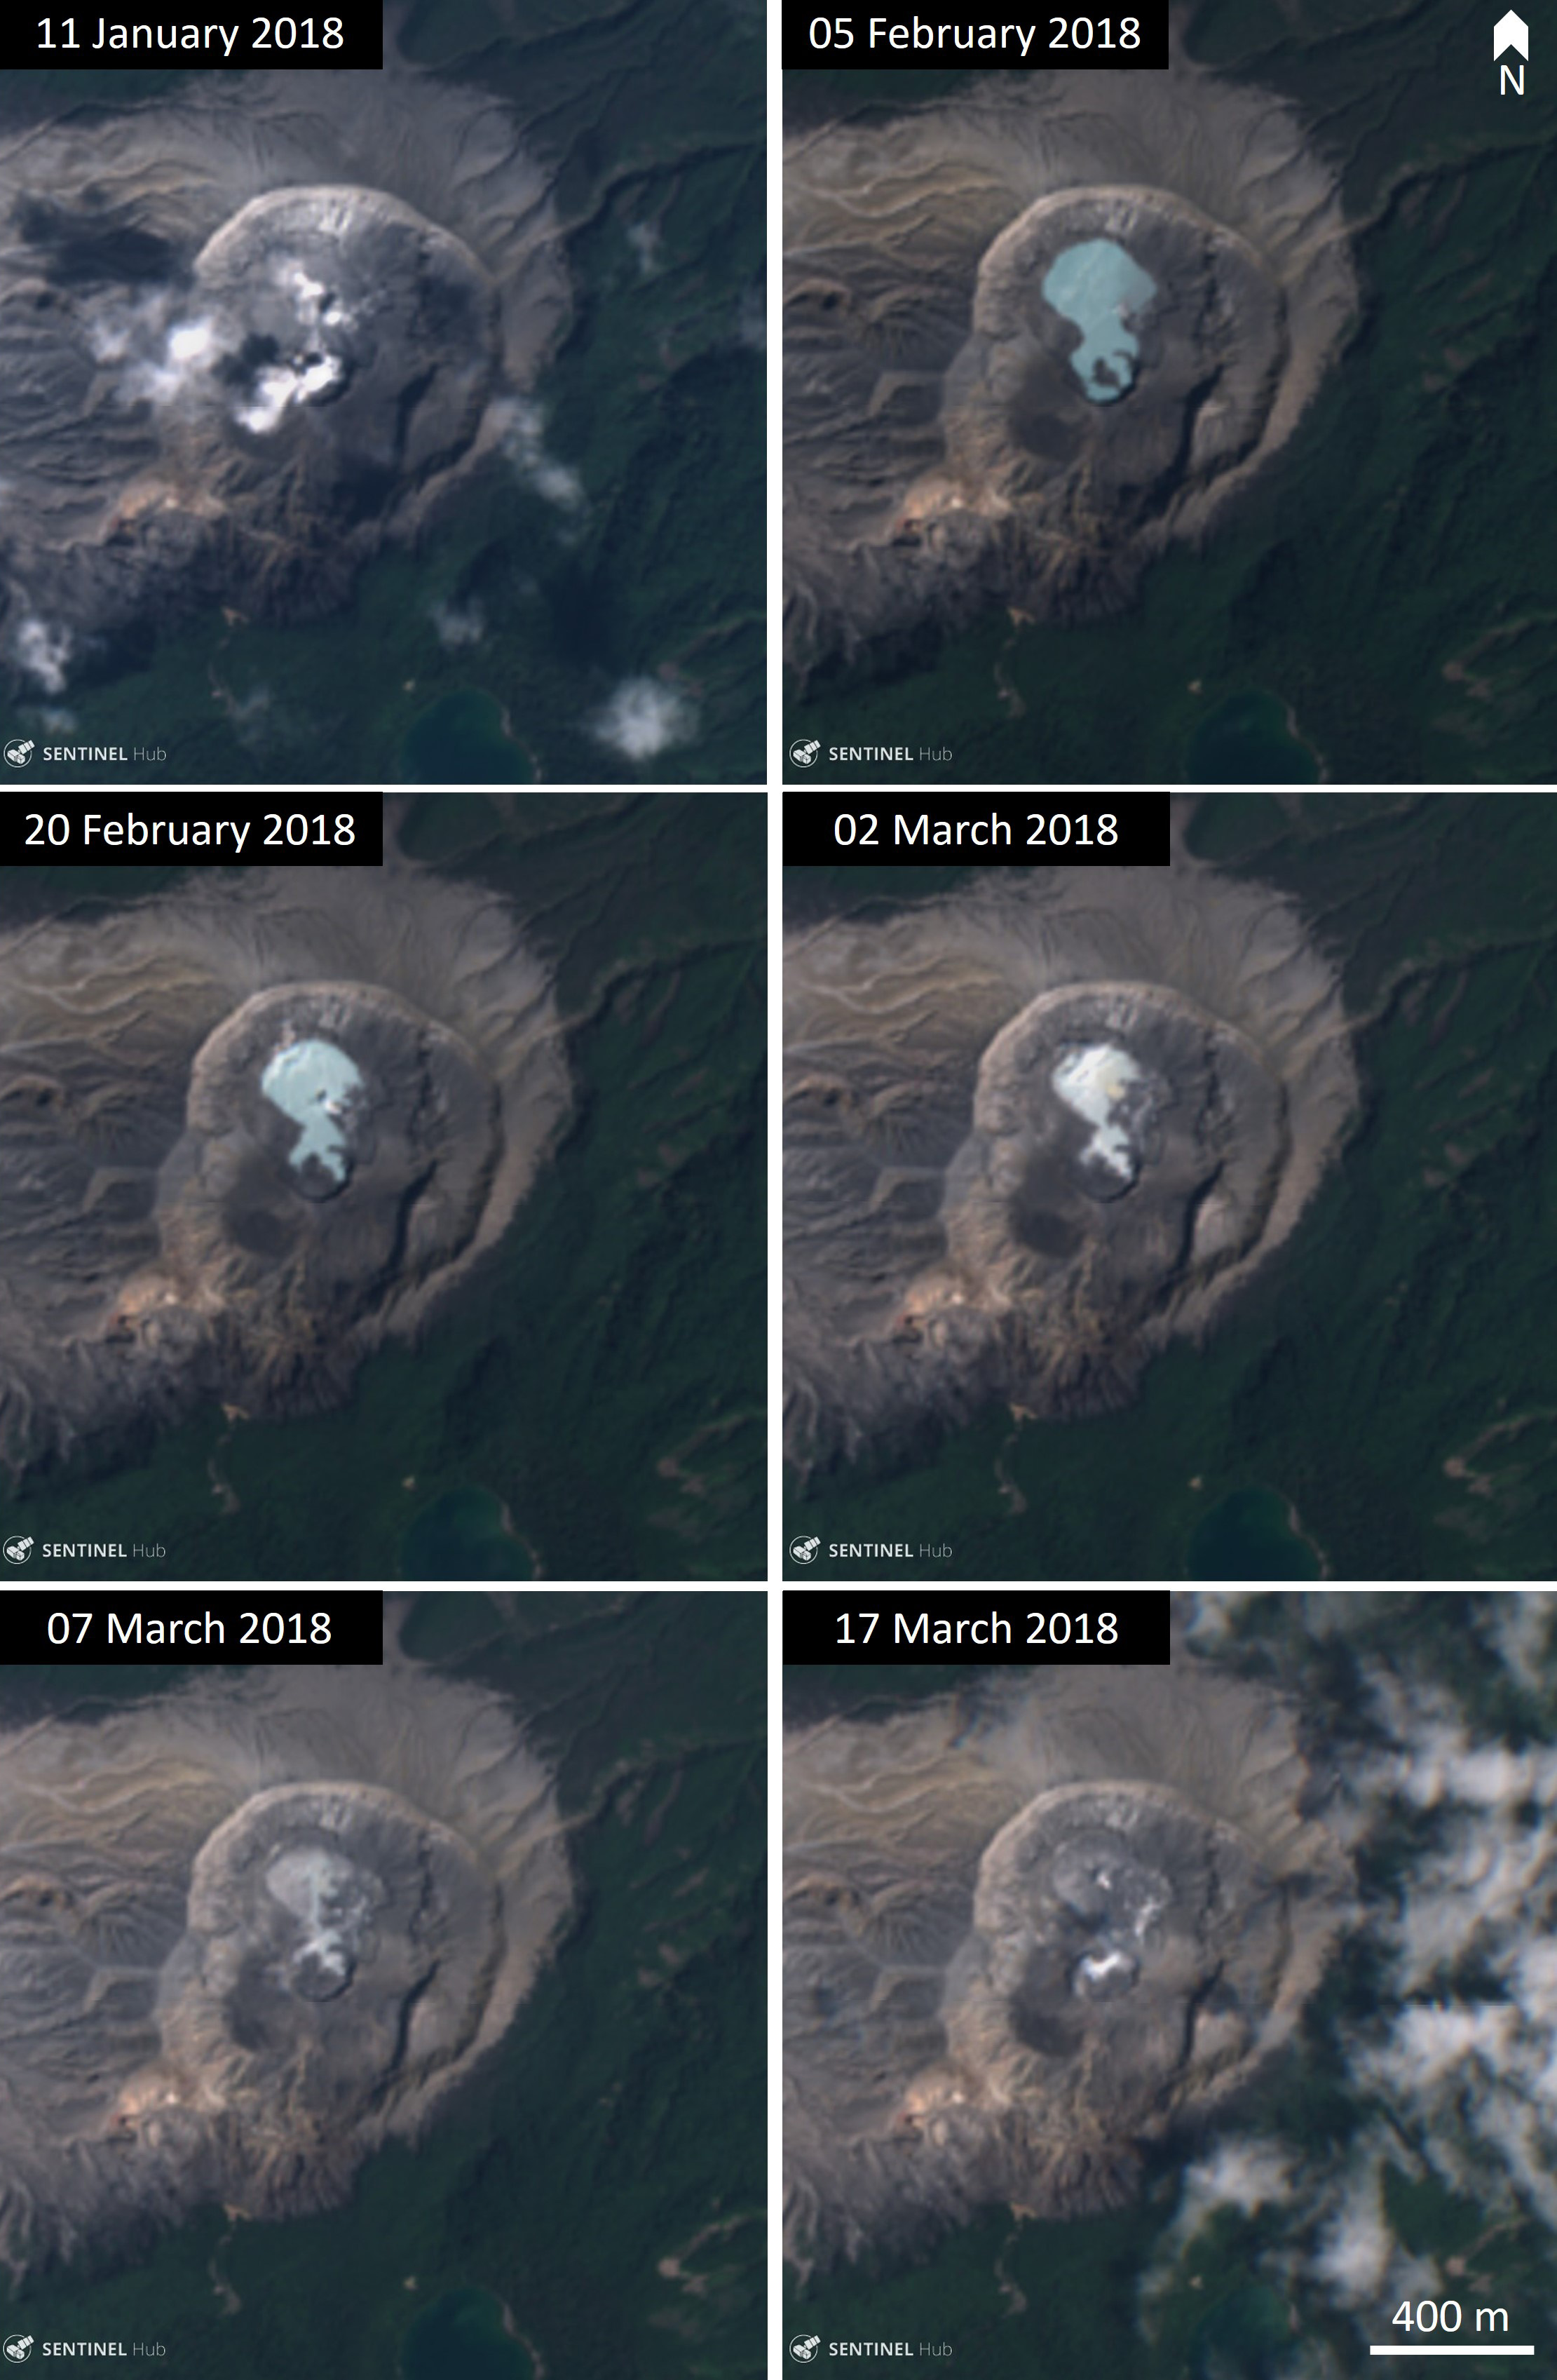
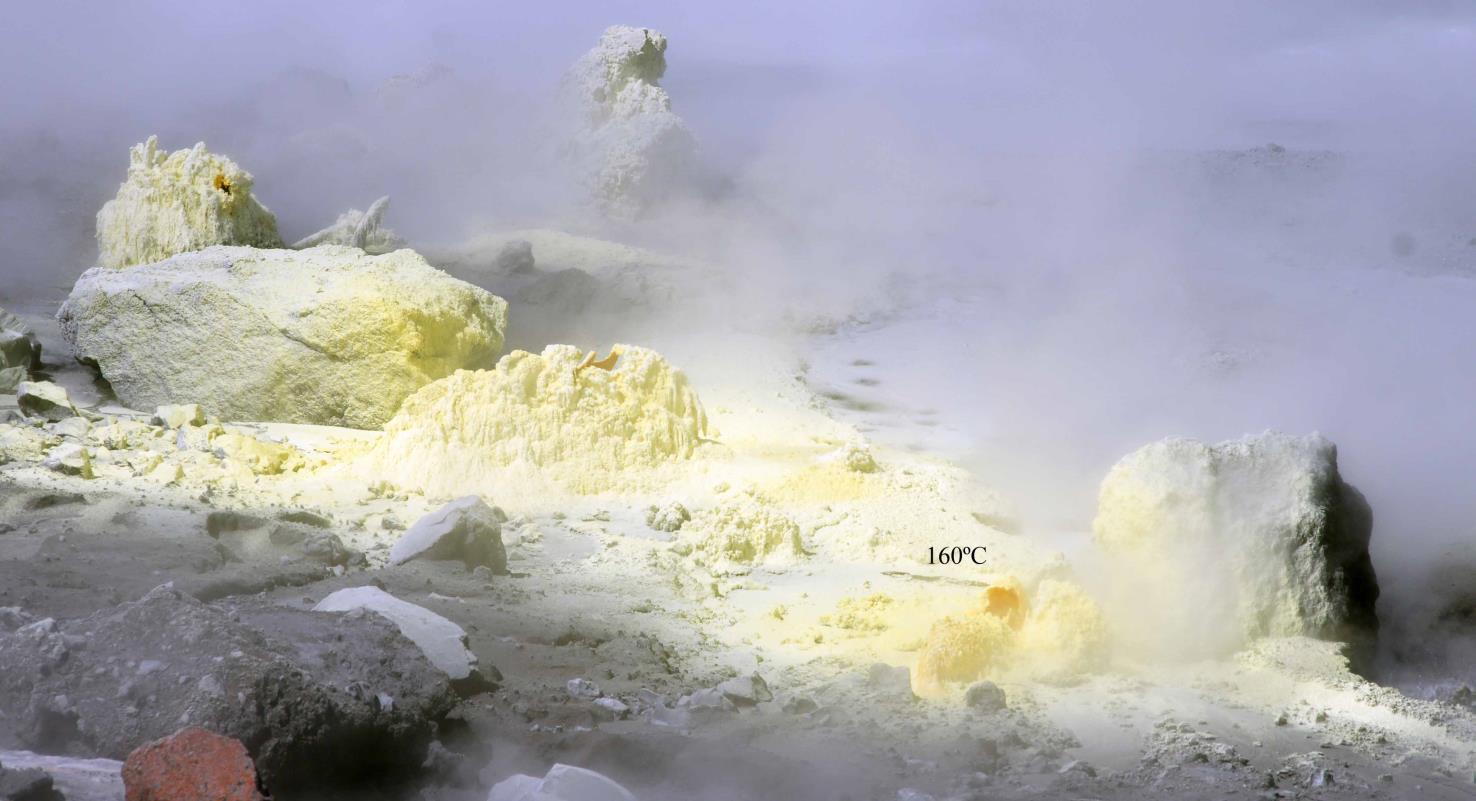
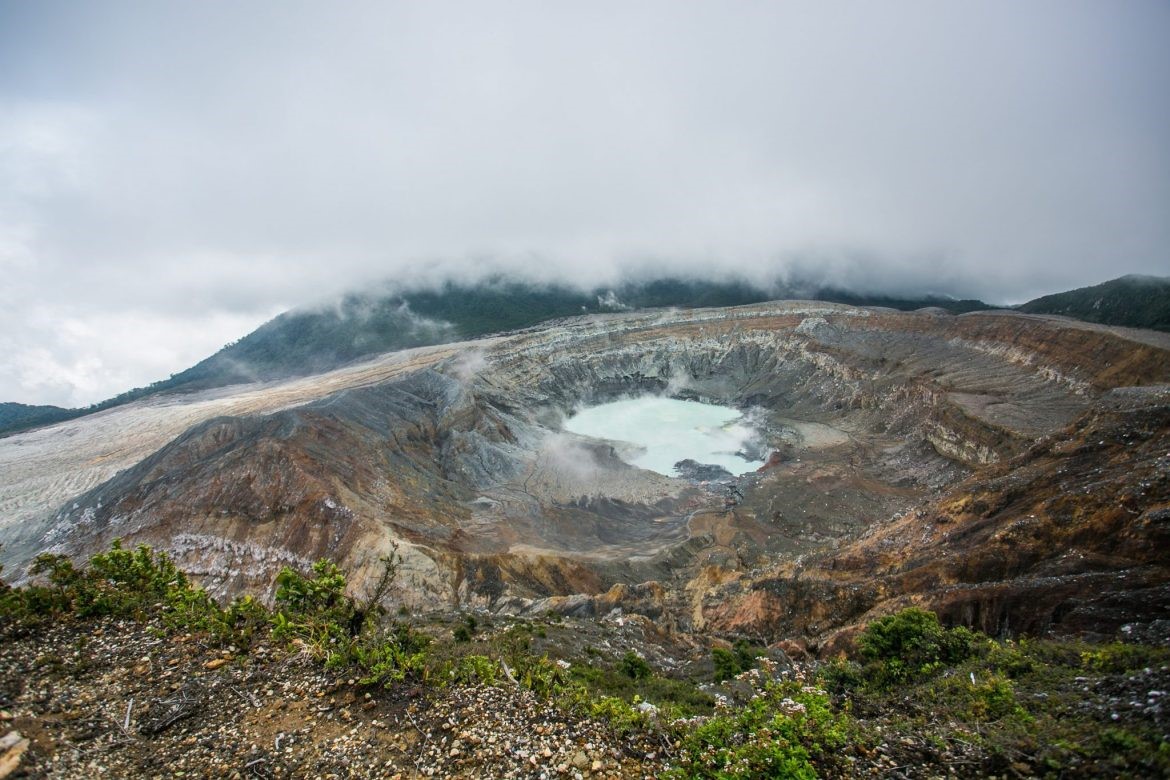
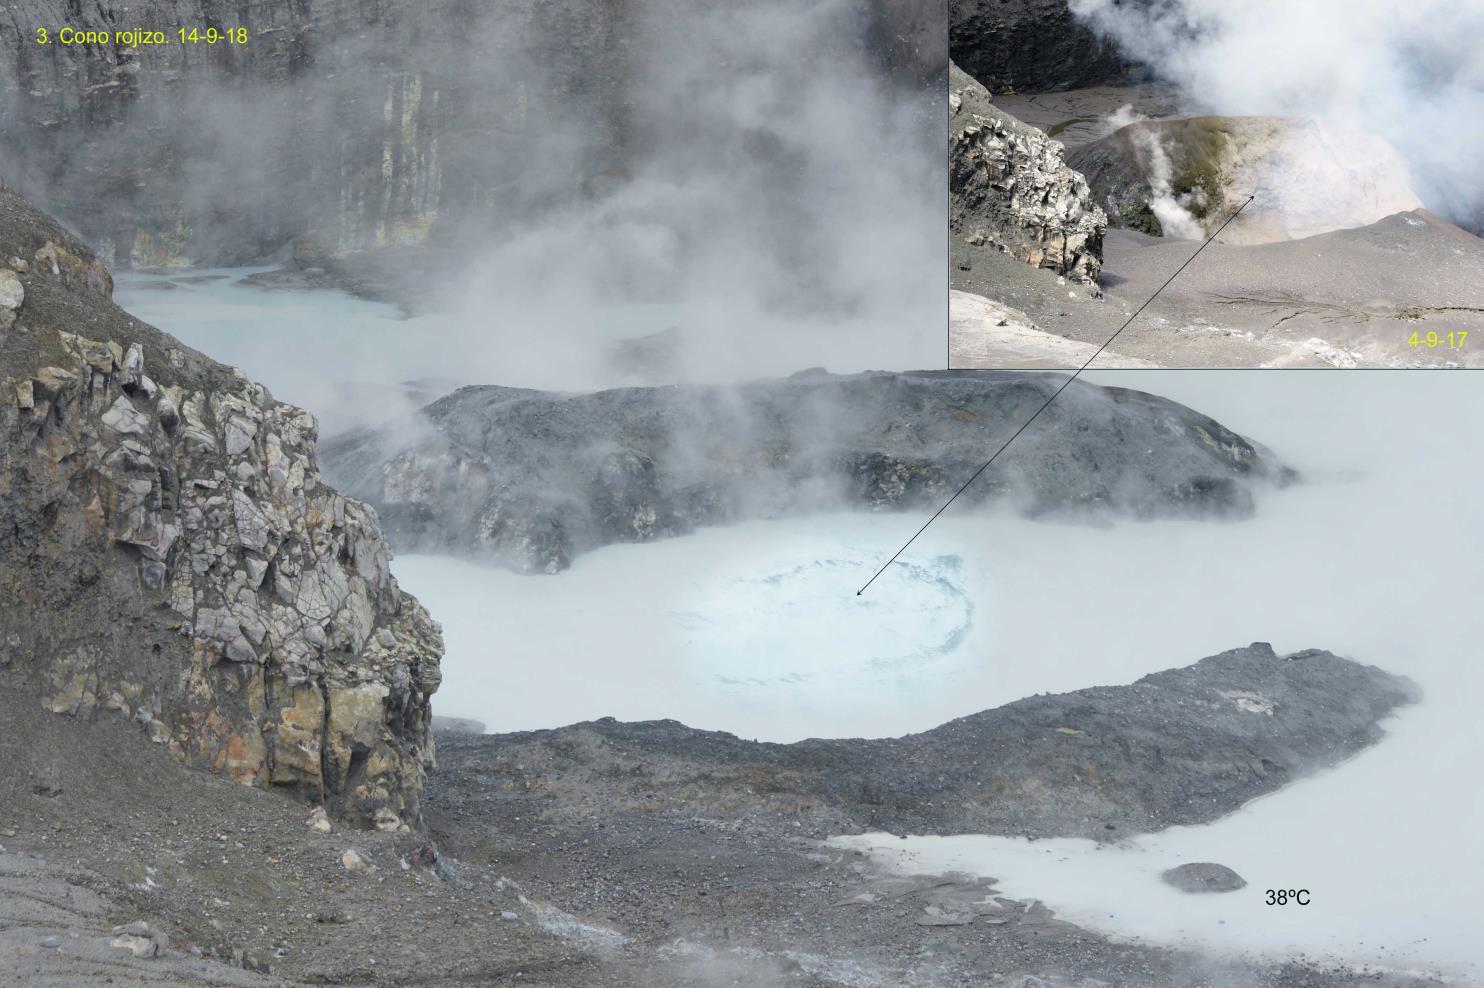
Frequent changes at the crater lake throughout 2018
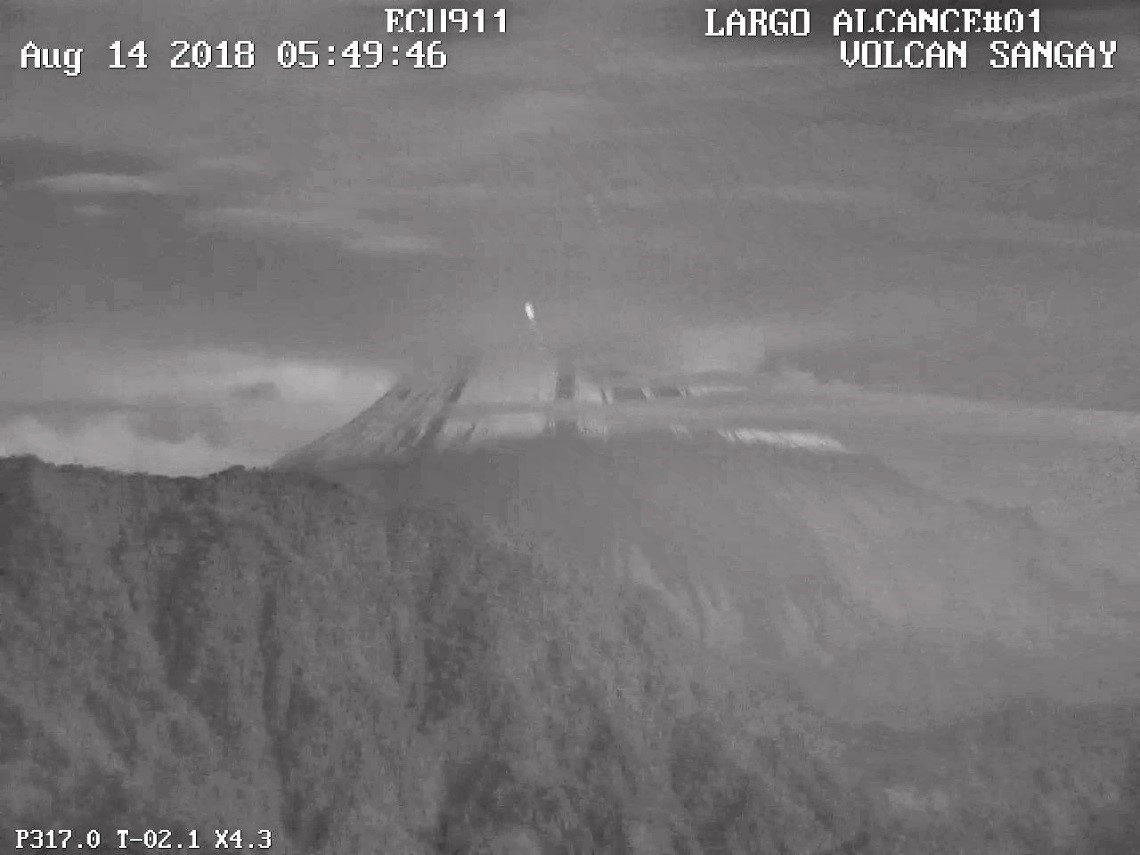
Sangay (Ecuador)
Eruption produced ash plumes, lava flows, and rockfalls during August-December 2018
Soputan (Indonesia)
Ash explosions on 3-4 October and 16 December 2018
Suwanosejima (Japan)
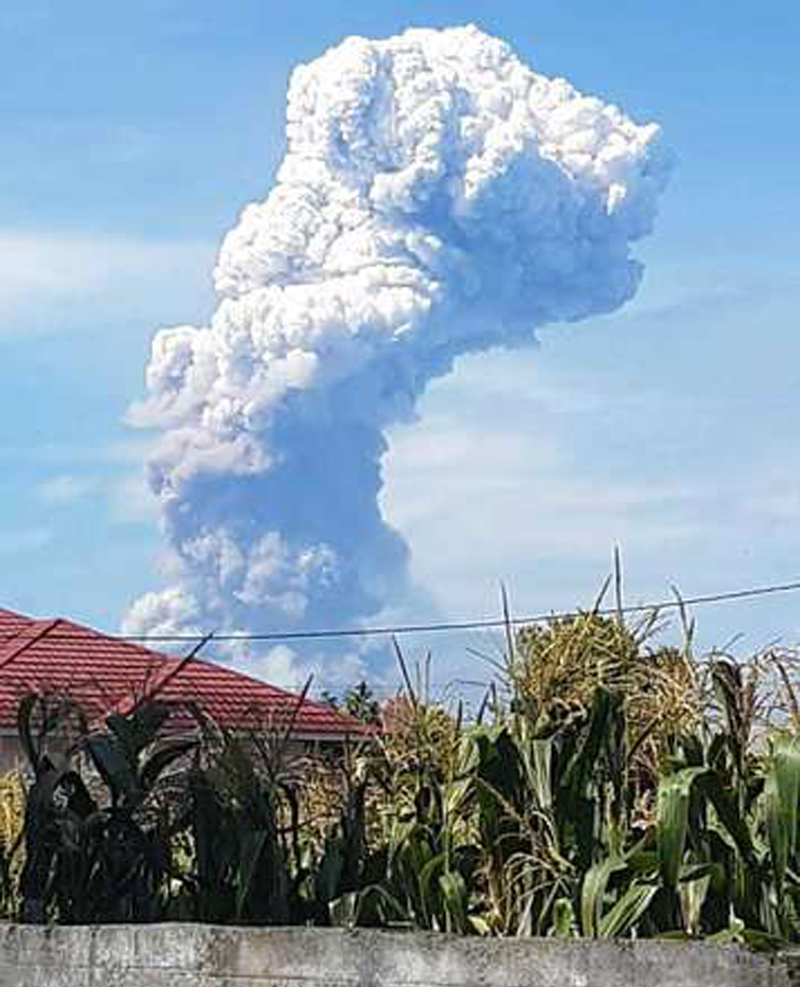
Multiple explosive events with incandescence and ash plumes during November 2018
Veniaminof (United States)
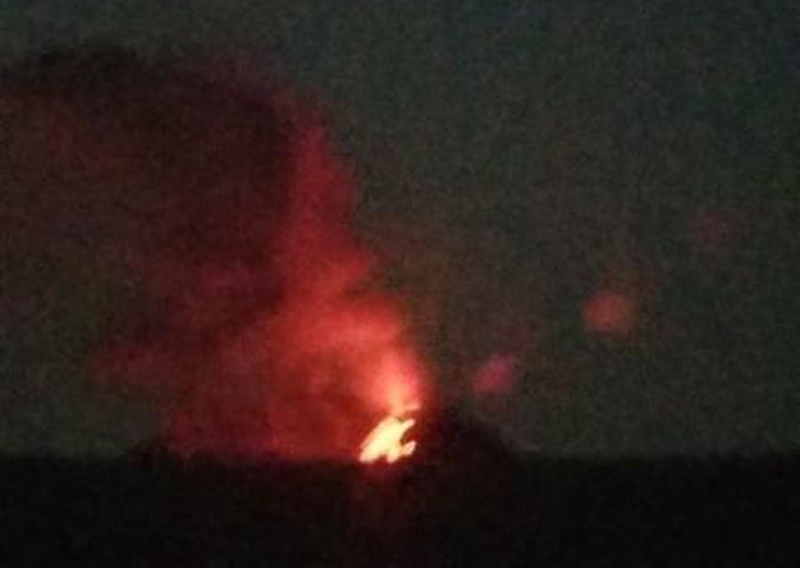
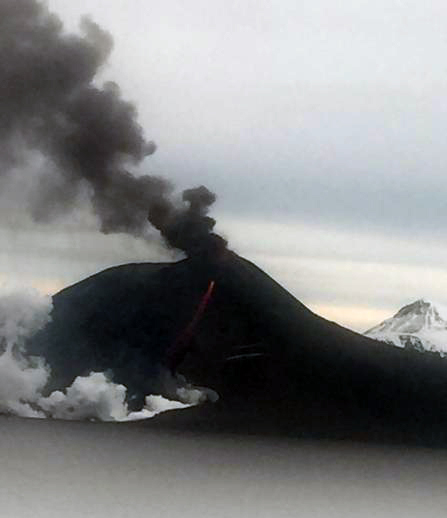
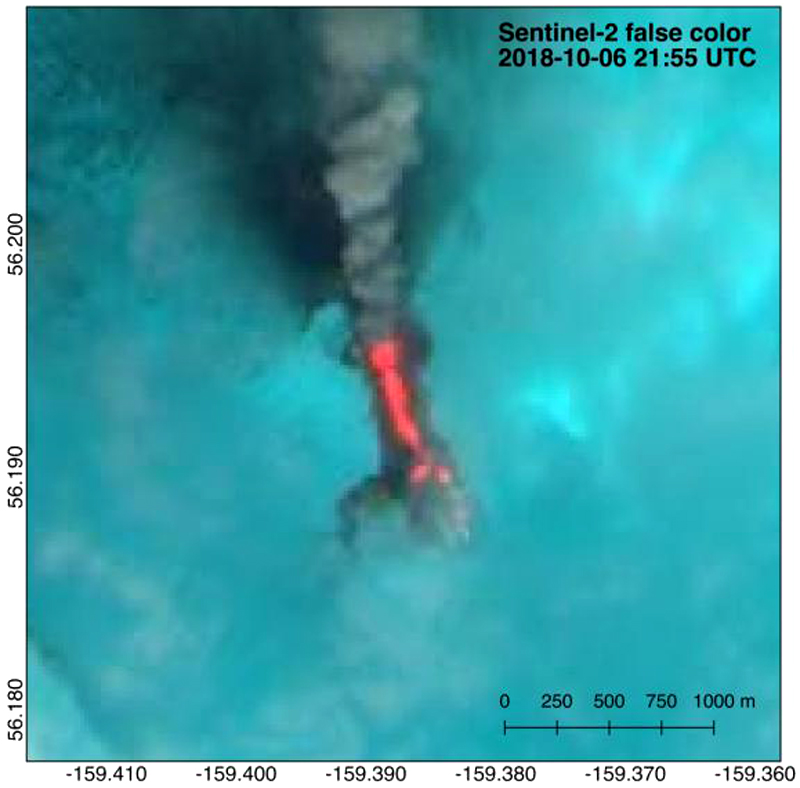
Eruption with lava flows and ash plumes during September-December 2018
Aira
Japan
31.5772°N, 130.6589°E; summit elev. 1117 m
All times are local (unless otherwise noted)
Ash plumes continue at the Minamidake crater from July through December 2018
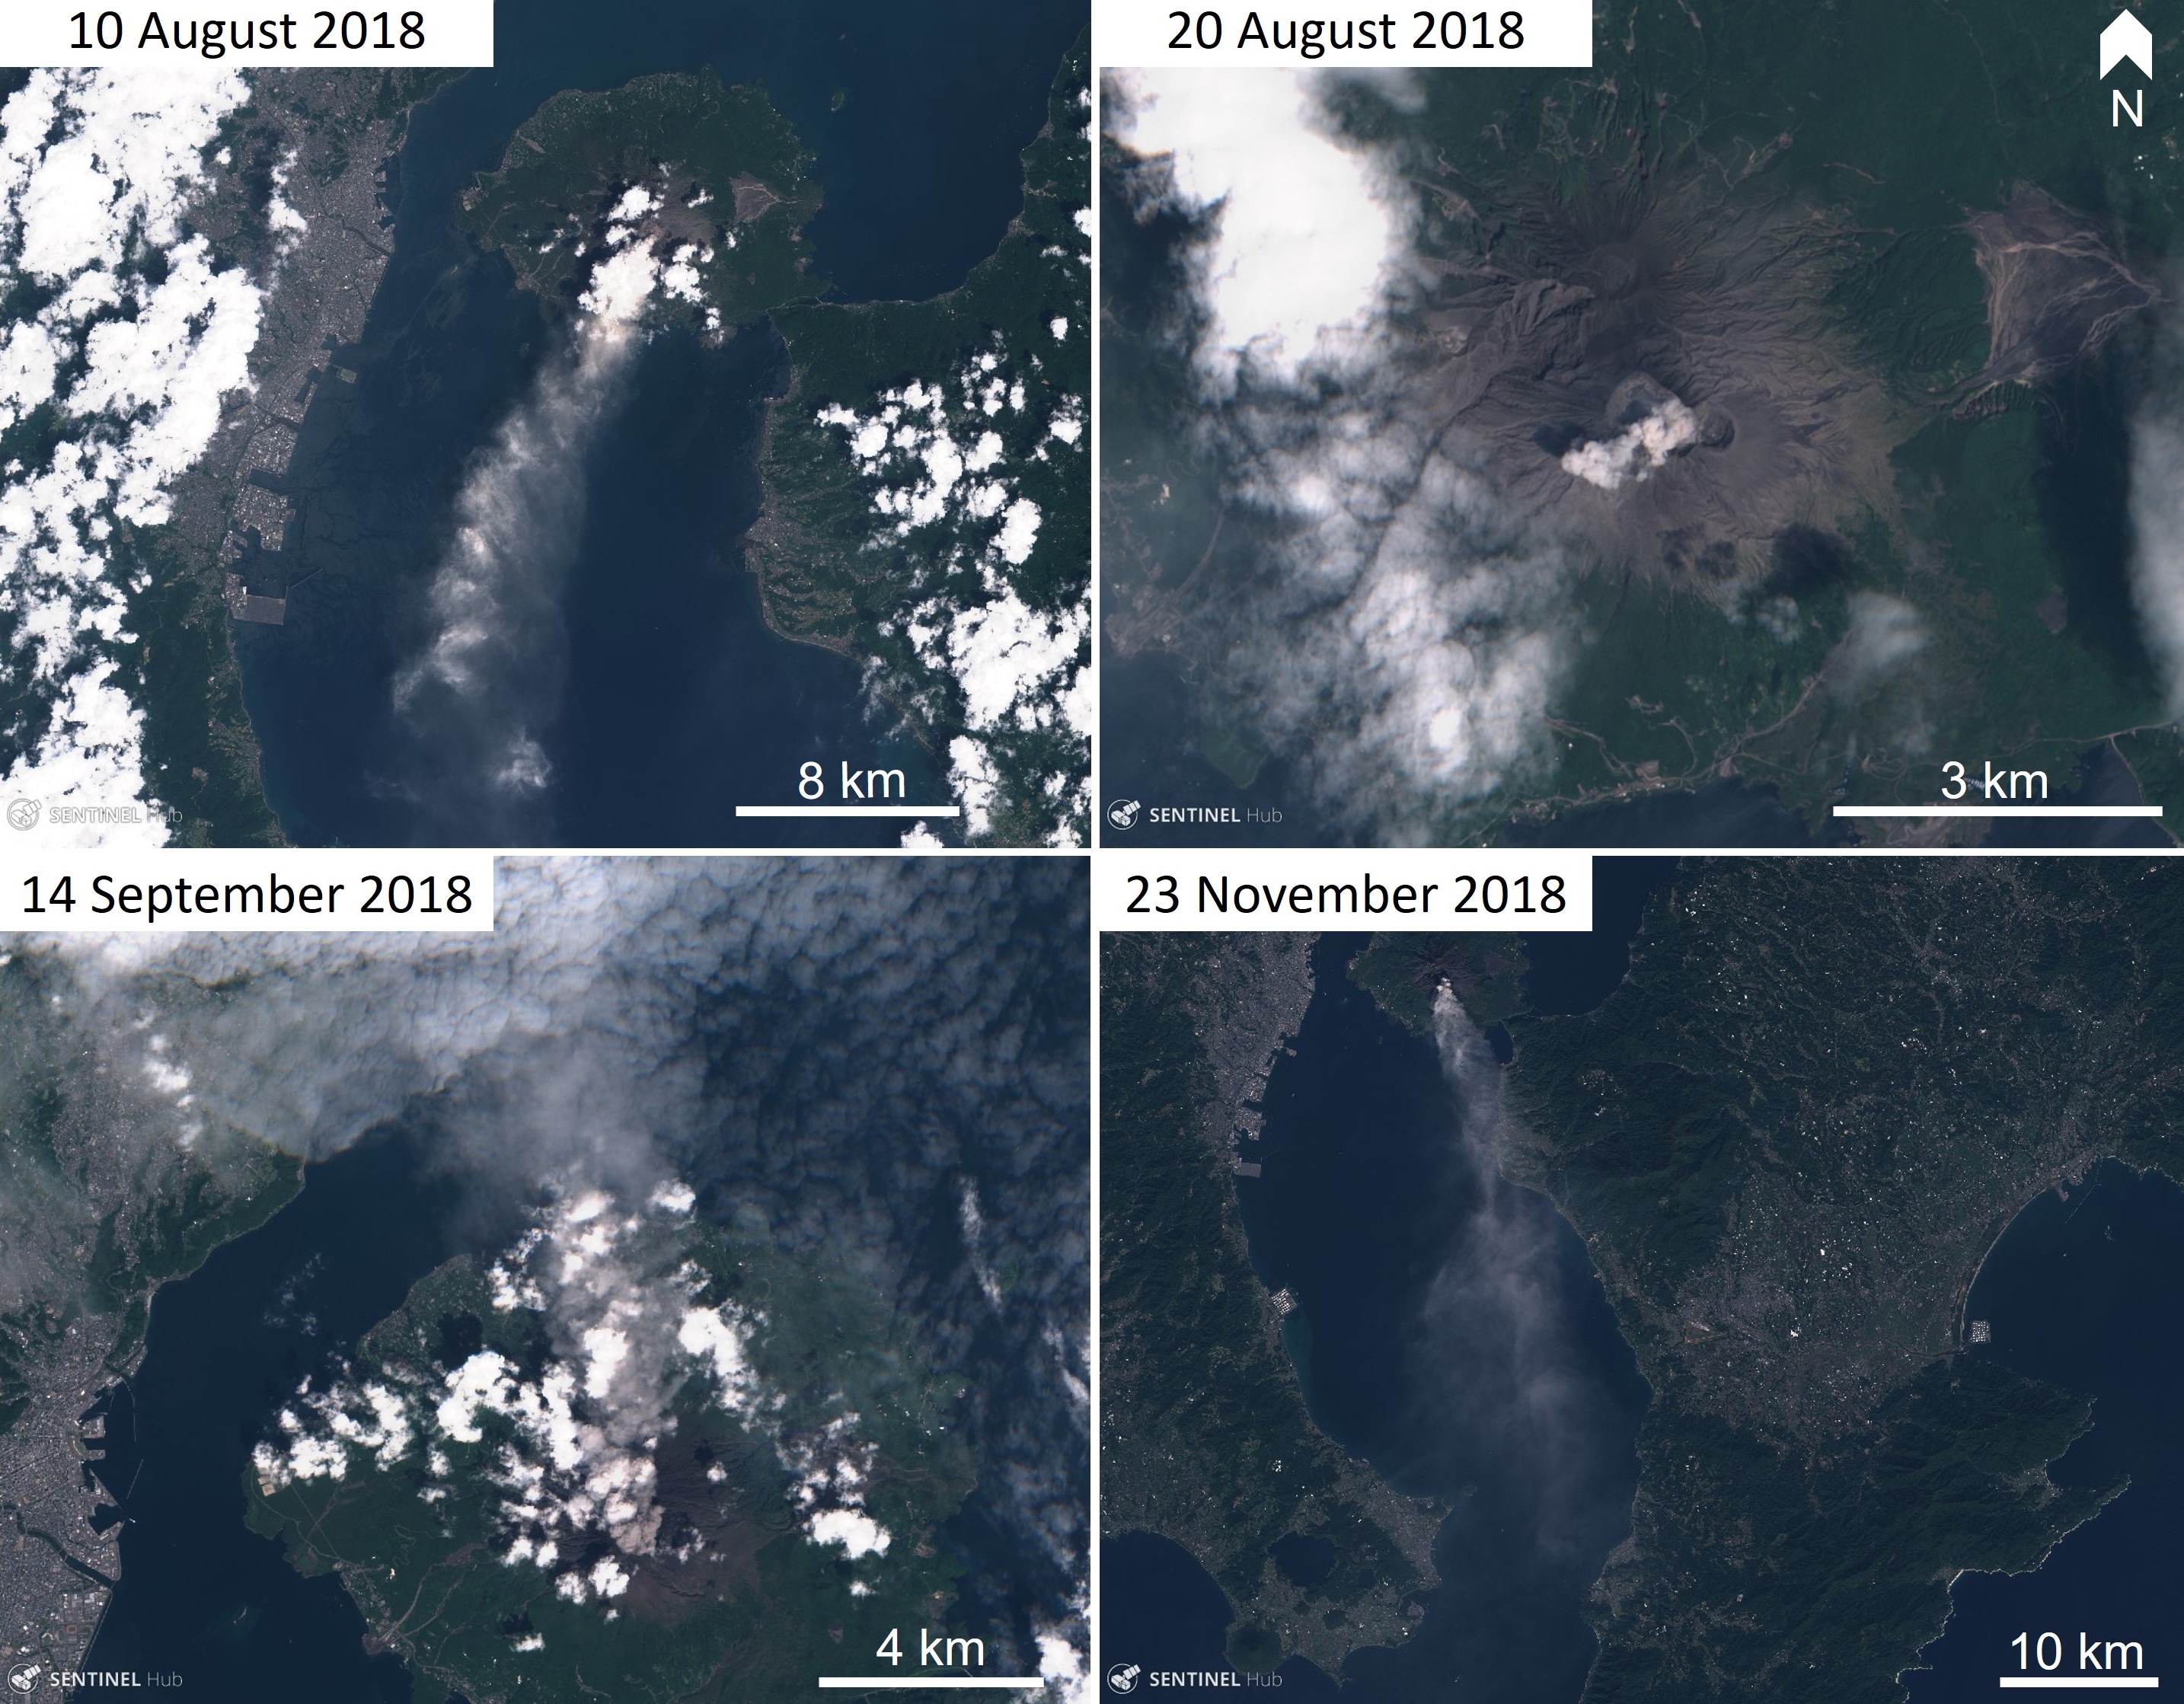
Sakurajima is one of the most active volcanoes in Japan and is situated in the Aira caldera in southern Kyushu. It regularly produces ash plumes and scatters blocks onto the flanks during explosions. This report covers July through December 2018 and describes activity at the Minamidake crater, which has continued with the activity typically observed at Sakurajima volcano. In late 2017 the eruptive activity has migrated from being centered at the Showa crater, to being focused at the Minamidake crater. This change has continued into the later half of 2018. The following activity summarizes information issued by the Japan Meteorological Agency (JMA), the Japan Volcanic Ash Advisory Center (VAAC), and satellite data.
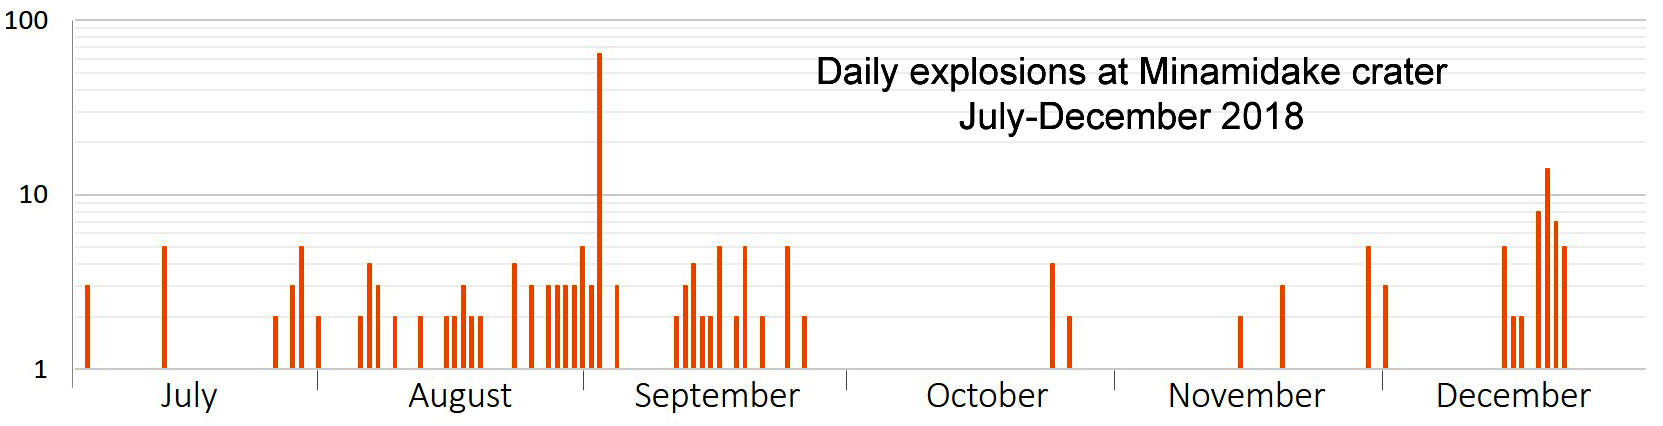
Activity from July through December 2018 was focused at the summit Minamidake crater with 8 to 64 ash emission events per month, with 50-60% being explosive in nature during four of the six months reported (table 20, figure 67). The maximum explosions per day was 64 on 31 August (figure 68). No pyroclastic flows were recorded during this time. Recent activity at the Showa crater has been declining and no activity was observed during the reporting period. Sakurajima has remained on Alert Level 3 on a 5-level scale during this time, reflecting the regular ash plumes and volcanic blocks that erupt out onto the slopes of the volcano during explosive events.
Table 20. Monthly summary of eruptive events recorded at Sakurajima's Minamidake crater in Aira caldera, July-December 2018. The number of events that were explosive in nature are in parentheses. No events were recorded at the Showa crater during this time. Data courtesy of JMA (July to December 2018 monthly reports).
| Month |
Ash emissions (explosive) |
Max. plume height above the crater |
Max. ejecta distance from crater |
| Jul 2018 |
29 (16) |
4.6 km |
1.7 km |
| Aug 2018 |
64 (37) |
2.8 km |
1.3 km |
| Sep 2018 |
44 (22) |
2.3 km |
1.1 km |
| Oct 2018 |
8 (0) |
1.6 km |
-- |
| Nov 2018 |
14 (2) |
4 km |
1.7 km |
| Dec 2018 |
56 (34) |
3 km |
1.3 km |
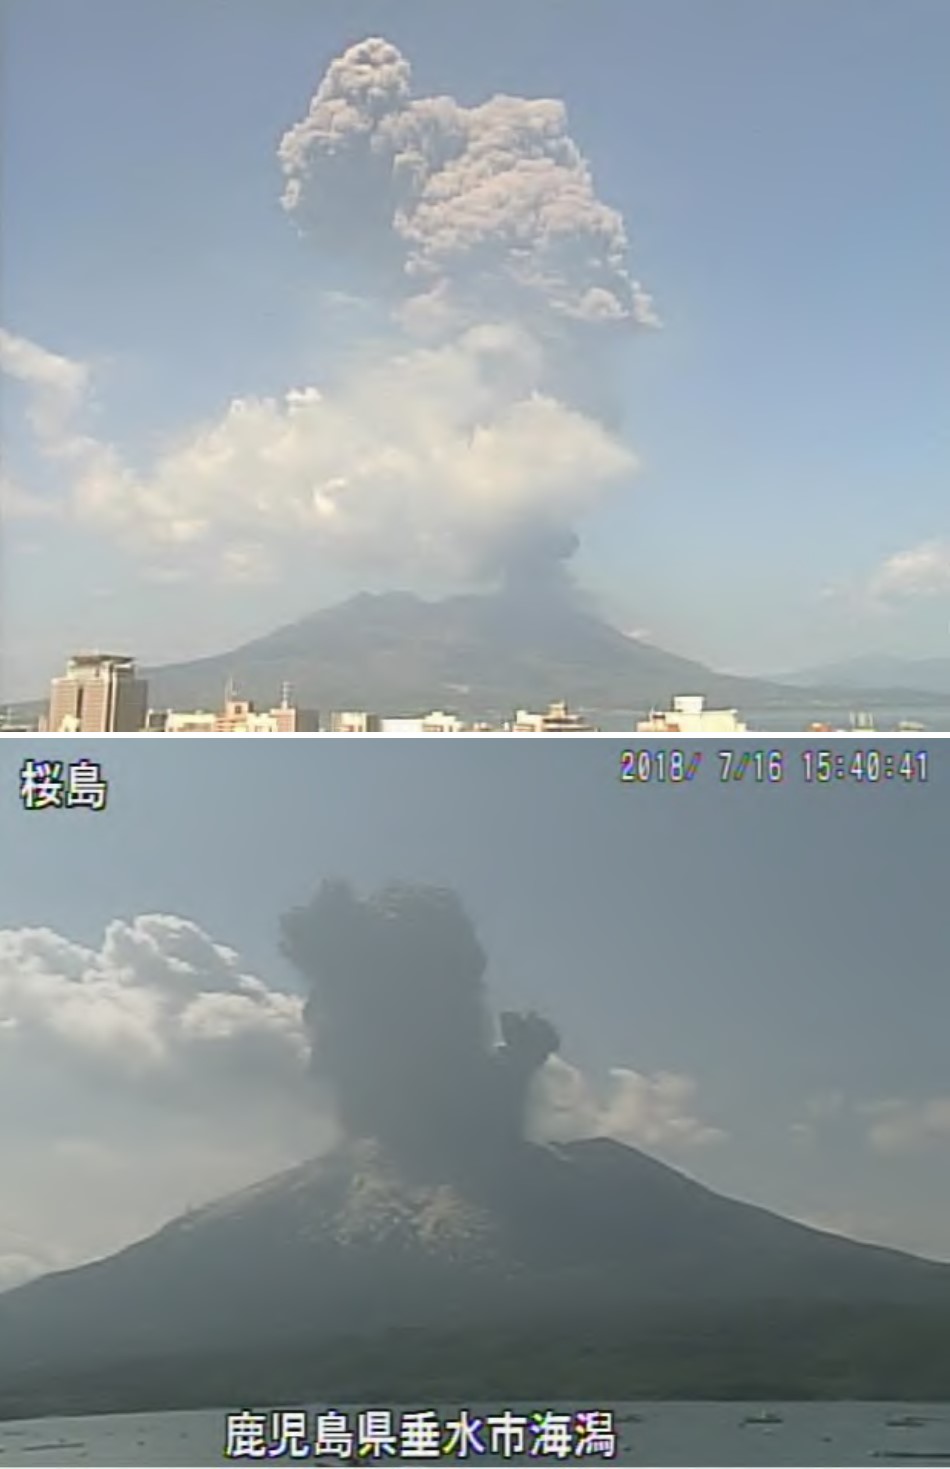
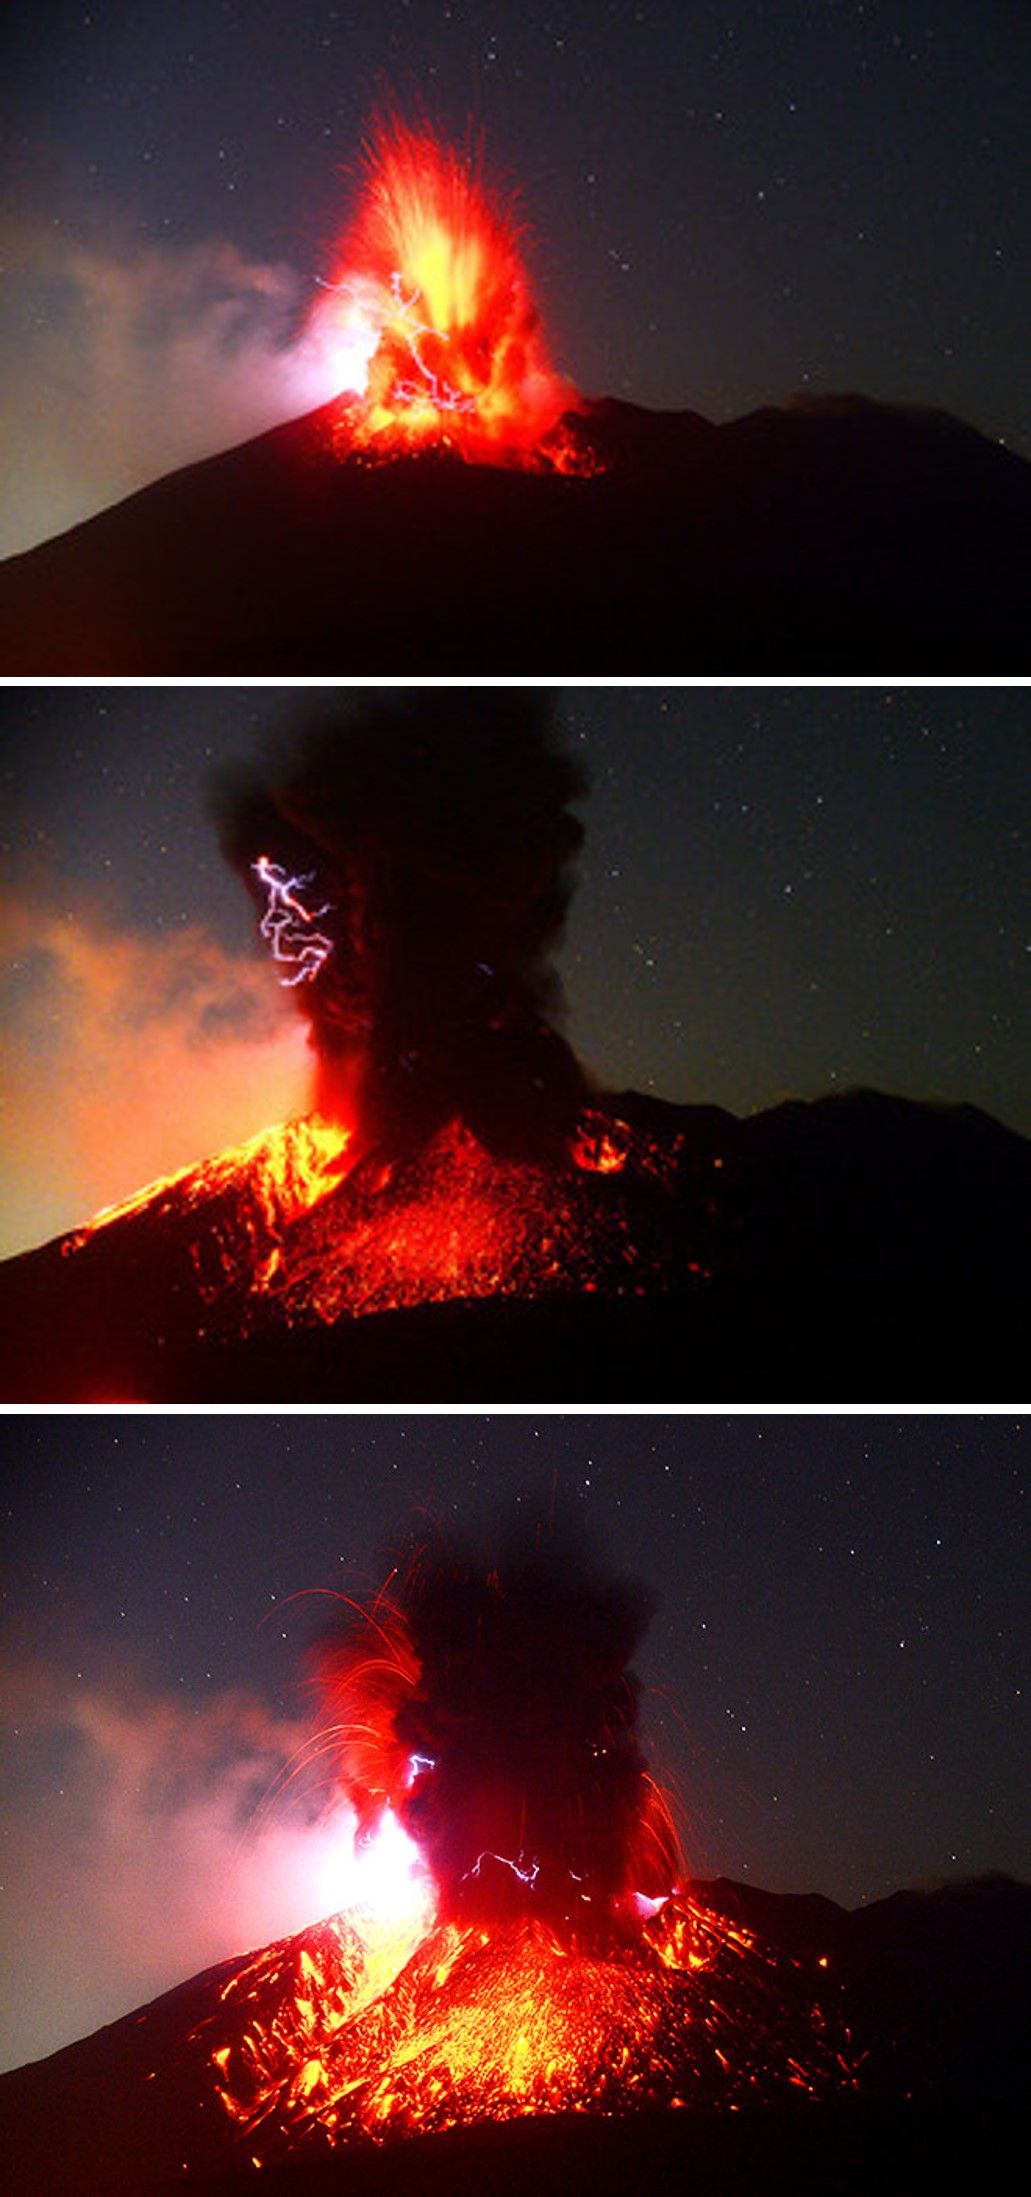
Activity through July consisted of 29 ash emission events (16 of which were explosive) producing ash plumes up to a maximum height of 4.6 km above the crater and ballistic ejecta (blocks) out to 1.7 km from the crater, but ash plumes were more commonly 1.2 to 2.5 km high. The largest explosive event occurred on 16 July, producing an ash plume up to 4.6 km from the vent and ejecting ballistic rocks out to 1.3-1.7 km from the crater (figure 69). On 17 July, sulfur dioxide emissions were measured at 1,300 tons per day, and on 26 July emissions were measured to be 2,100 tons per day.
During August the Minamidake crater produced 64 ash emission events (37 explosive in nature) with a maximum ash plume height of 2.8 km above the crater, and a maximum ballistic ejecta distance of 1.3 km from the crater on 31 August (figure 70). Ash plumes were more commonly up to 1 to 2.1 km above the crater. Sulfur dioxide emissions were very high on 2 August, measured as high as 3,200 tons per day, and was measured at 1,500 tons per day on 27 August.
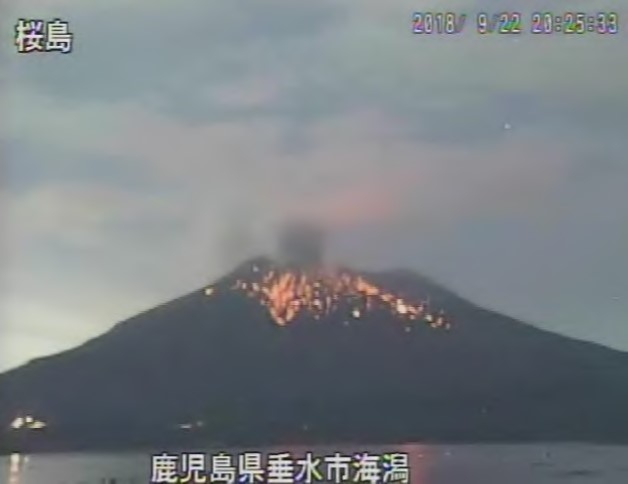
Throughout September 44 ash emission events occurred, with 22 of those being explosive in nature. The Maximum ash plume height reached 2.3 km above the crater, and the maximum ejecta landed out to 1.1 km from the crater. An explosive event on 9 September ejected material out to 700 m away from the crater and on 22 September an event scattered blocks out to 1.1 km from the crater (figure 71).
October and November were relatively quiet with regards to the number of ash emission events with only 22 events over the two months. The maximum ash plume heights reached 1.6 and 4 km, respectively. An observation flight on 22 October showed the currently inactive Showa crater restricted to minor fumarolic degassing, and steam-and-gas and dilute ash plume activity in the Minamidake crater (figure 72). An eruption on 14 November at 0043 local time produced an ash plume to over 4 km above the crater and scattered incandescent blocks out to over 1 km from the crater (figure 73). This was the first ash plume to exceed a height of 4 km since 16 July 2018. Two events occurred during 16-19 November that produced ash plumes up to 1.6 km. Sulfur dioxide measurements were 3,400 tons on 4 October, 400 tons on 17 October, 1,000 tons on 23 October, 1,100 tons on 6 November, and 1,400 tons on 20 November.
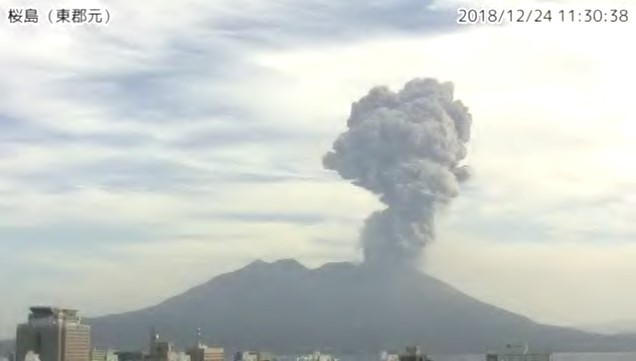
Small ash plumes continued through December with 56 ash emission events, 34 of which were explosive in nature. The maximum ash plume height above the crater reached 3 km, and the maximum distance that ejecta traveled from the vent was 1.3 km, both during an event on 24 December (figure 74). An explosive event produced an ash plume that reached a height of 2.5 km above the crater and scattered ejecta out to 1.1 km from the crater.
Intermittent incandescence was observed at the summit at nighttime throughout the entire reporting period. Areas of elevated thermal energy within the Minamidake crater were visible in cloud-free Sentinel-2 satellite images (figure 75) and elevated temperatures were detected in MIROVA on a few days.
Geologic Background. The Aira caldera in the northern half of Kagoshima Bay contains the post-caldera Sakurajima volcano, one of Japan's most active. Eruption of the voluminous Ito pyroclastic flow accompanied formation of the 17 x 23 km caldera about 22,000 years ago. The smaller Wakamiko caldera was formed during the early Holocene in the NE corner of the caldera, along with several post-caldera cones. The construction of Sakurajima began about 13,000 years ago on the southern rim and built an island that was joined to the Osumi Peninsula during the major explosive and effusive eruption of 1914. Activity at the Kitadake summit cone ended about 4,850 years ago, after which eruptions took place at Minamidake. Frequent eruptions since the 8th century have deposited ash on the city of Kagoshima, located across Kagoshima Bay only 8 km from the summit. The largest recorded eruption took place during 1471-76.
Information Contacts: Japan Meteorological Agency (JMA), Otemachi, 1-3-4, Chiyoda-ku Tokyo 100-8122, Japan (URL: http://www.jma.go.jp/jma/indexe.html); Tokyo Volcanic Ash Advisory Center (VAAC), 1-3-4 Otemachi, Chiyoda-ku, Tokyo, Japan (URL: http://ds.data.jma.go.jp/svd/vaac/data/); Sentinel Hub Playground (URL: https://www.sentinel-hub.com/explore/sentinel-playground); MIROVA (Middle InfraRed Observation of Volcanic Activity), a collaborative project between the Universities of Turin and Florence (Italy) supported by the Centre for Volcanic Risk of the Italian Civil Protection Department (URL: http://www.mirovaweb.it/); The Asahi Shimbun (URL: http://www.asahi.com/ajw/articles/AJ201811140035.html accessed on 12 March 2018).
Ambrym
Vanuatu
16.25°S, 168.12°E; summit elev. 1334 m
All times are local (unless otherwise noted)
Fissure eruption in mid-December 2018 produces fountaining and lava flows; no activity evident in caldera after 17 December
Ambrym is a shield volcano in the Vanuatu archipelago with a 12-km-wide summit caldera containing the persistently active Benbow and Marum craters. These craters are home to multiple active vents that produce episodic lava lakes, explosions, lava flows, ash, and gas emissions. Occasional fissure eruptions occur outside of these main craters. This report covers July to December 2018 and summarizes reports by the Vanuatu Meteorology and Geohazards Department (VMGD), the Wellington Volcanic Ash Advisory Center (VAAC), and multiple sources of satellite data.
As of the beginning of the reporting period, the hazard status at Ambrym had remained at Volcanic Alert Level 2 ("Major unrest") since 7 December 2017. Monthly VMGD activity reports describe the continued activity within the two main craters, consisting of multiple lava lakes, sustained substantial degassing and steam emission, and seismic unrest. Frequent thermal anomalies were detected throughout the reporting period (figure 42). The danger areas were confined to the Permanent Exclusion Zone within a 1 km radius of Benbow crater, and the Permanent Exclusion Zone and Danger Zone A within about a 2.7 km radius of Marum crater (including Maben-Mbwelesu, Niri-Mbwelesu and Mbwelesu, see BGVN 43:07, figure 38).
Observations and seismic data analysis by VMGD confirmed the onset of a small-scale intra-caldera fissure eruption at 0600 local time on 15 December. This new fissure produced lava fountains and lava flows with ash and gas plumes (figure 43). Footage of the eruption by John Tasso shows the fissure eruption to the SE of Marum crater producing lava fountaining. A Sentinel-2 satellite image shows a white eruption plume and two new lava flow lobes (figure 44); the actual fissure vent was hidden by the plume. The northernmost lava flow filled in the 500 x 900 m Lewolembwi crater and a smaller lobe continued to flow towards the E (figure 44). Due to this elevated activity, the Volcanic Alert Level was raised to 3 ("Minor eruption"), with the danger zones increased to a 2 km radius around Benbow crater and a 4 km radius around Marum crater. VMGD warned of additional risk within 3 km of eruptive fissures in the SE caldera area.
Through 16-17 December, ash and gas emission continued from Benbow and Marum craters (figures 45 and 46), accompanied by ongoing localized seismicity; earthquakes with a magnitude greater than five were felt on neighboring islands. The Wellington VAAC issued ash advisories on 16 and 17 December noting maximum cloud altitudes of approximately 8 km.
From 14 to 26 December, the National Volcano Monitoring Network detected over 4,500 earthquakes related to the eruptive activity, but locally felt seismicity decreased. Analysis of satellite imagery confirmed surface deformation associated with the increase in activity. Media reports from Radio New Zealand indicated that seismic activity during December resulted in ground rupture and damage to homes on the island and residents were moved to evacuation centers.
During the reporting period, thermal anomalies were frequently detected by the MODIS satellite instruments and subsequently analyzed using the MODVOLC algorithm, reflecting the lava lake activity in Benbow and Marum craters, as well additional thermal anomalies during the December 2018 fissure eruption and subsequent lava flows to the SE of the main crater area (figures 47 and 48).
As of 7 January 2019, Ambrym remains on Alert Level 3 with continued seismic activity. The MIROVA (Middle InfraRed Observation of Volcanic Activity) system has not detected any recent thermal anomalies, indicating the end of the fissure eruption and a reduction in activity at the main craters.
Geologic Background. Ambrym, a large basaltic volcano with a 12-km-wide caldera, is one of the most active volcanoes of the New Hebrides Arc. A thick, almost exclusively pyroclastic sequence, initially dacitic then basaltic, overlies lava flows of a pre-caldera shield volcano. The caldera was formed during a major Plinian eruption with dacitic pyroclastic flows about 1,900 years ago. Post-caldera eruptions, primarily from Marum and Benbow cones, have partially filled the caldera floor and produced lava flows that ponded on the floor or overflowed through gaps in the caldera rim. Post-caldera eruptions have also formed a series of scoria cones and maars along a fissure system oriented ENE-WSW. Eruptions have apparently occurred almost yearly during historical time from cones within the caldera or from flank vents. However, from 1850 to 1950, reporting was mostly limited to extra-caldera eruptions that would have affected local populations.
Information Contacts: Geo-Hazards Division, Vanuatu Meteorology and Geo-Hazards Department (VMGD), Ministry of Climate Change Adaptation, Meteorology, Geo-Hazards, Energy, Environment and Disaster Management, Private Mail Bag 9054, Lini Highway, Port Vila, Vanuatu (URL: http://www.vmgd.gov.vu/, https://www.facebook.com/VanuatuGeohazardsObservatory/); Hawai'i Institute of Geophysics and Planetology (HIGP) - MODVOLC Thermal Alerts System, School of Ocean and Earth Science and Technology (SOEST), Univ. of Hawai'i, 2525 Correa Road, Honolulu, HI 96822, USA (URL: http://modis.higp.hawaii.edu/); MIROVA (Middle InfraRed Observation of Volcanic Activity), a collaborative project between the Universities of Turin and Florence (Italy) supported by the Centre for Volcanic Risk of the Italian Civil Protection Department (URL: http://www.mirovaweb.it/); NASA Goddard Space Flight Center (NASA/GSFC), Global Sulfur Dioxide Monitoring Page, Atmospheric Chemistry and Dynamics Laboratory, 8800 Greenbelt Road, Goddard, Maryland, USA (URL: https://so2.gsfc.nasa.gov/); Radio New Zealand, 155 The Terrace, Wellington 6011, New Zealand (URL: https://www.radionz.co.nz/); Sentinel Hub Playground (URL: https://www.sentinel-hub.com/explore/sentinel-playground); John Tasso, Vanuatu Island Experience, Port Vatu, West Ambrym, Vanuatu (URL: http://vanuatuislandexperience.com/).
Copahue (Chile-Argentina) — January 2019 Cite this Report
Copahue
Chile-Argentina
37.856°S, 71.183°W; summit elev. 2953 m
All times are local (unless otherwise noted)
Frequent emissions and small ash plumes continue from July through 7 December 2018
Copahue, on the border of Chile and Argentina, has frequent small ash eruptions and gas-and-steam plumes. The volcano alert was raised from Green to Yellow (on a scale going from green, yellow, orange, to red) on 24 March 2018 due to an increase in seismic activity and a phreatic explosion. Copahue has a dozen craters with recent activity focused at the Agrio crater, which contains a persistent fumarole field and a crater lake. This report summarizes activity from July through December 2018 and is based on reports issued by Servicio Nacional de Geología y Minería (SERNAGEOMIN) Observatorio Volcanológico de Los Andes del Sur, (OVDAS), Oficina Nacional de Emergencia - Ministerio del Interior (ONEMI), Buenos Aires Volcanic Ash Advisory Center (VAAC), and satellite data.
Throughout July, Copahue produced gas-and-steam and ash plumes that deposited ash on and away from the slopes of the volcano (figure 19). From 1 to 15 July degassing was continuous with a maximum plume height of 300 m above the crater. A more energetic gas-and-steam plume was produced on 18 July (figure 20). Persistent gas and ash plumes during 16-31 July rose up to 1,500 m above the crater. Nighttime incandescence was present throughout the month.
Throughout August intermittent gas-and-steam and ash plumes continued due to the interaction of the hydrothermal and magmatic system within the volcano (figure 21). Notices were issued by the Buenos Aires VAAC on 14 and 15 August for diffuse steam plumes possibly containing ash up to an altitude on 3.6 km. Constant degassing, intermittent ash plumes, and nighttime incandescence continued through September (figure 22).
During September, October, and November, variable gas-and-steam and ash plumes were accompanied by visible incandescence at night. Continuous ash emission was observed from 16 to 30 November (figure 23); similar activity with plume heights up to 800 m from 1 to 6 December. On 2 December a Buenos Aires VAAC notice was issued for a narrow ash plume that drifted ESE. During 6-7 December an ash plume that rose up to 3 km altitude and drifted towards the SW was accompanied by a seismic swarm. No further ash emissions were noted through the end of the year.
MIROVA (Middle InfraRed Observation of Volcanic Activity) data showed intermittent minor thermal activity at the summit from July through December. There were no thermal anomalies detected by the MODVOLC algorithm for this time period. Twenty cloud-free Sentinel-2 satellite images revealed elevated thermal activity (hotspots) within Agrio crater throughout the reporting period (figure 24).
Geologic Background. Volcán Copahue is an elongated composite cone constructed along the Chile-Argentina border within the 6.5 x 8.5 km wide Trapa-Trapa caldera that formed between 0.6 and 0.4 million years ago near the NW margin of the 20 x 15 km Pliocene Caviahue (Del Agrio) caldera. The eastern summit crater, part of a 2-km-long, ENE-WSW line of nine craters, contains a briny, acidic 300-m-wide crater lake (also referred to as El Agrio or Del Agrio) and displays intense fumarolic activity. Acidic hot springs occur below the eastern outlet of the crater lake, contributing to the acidity of the Río Agrio, and another geothermal zone is located within Caviahue caldera about 7 km NE of the summit. Infrequent mild-to-moderate explosive eruptions have been recorded since the 18th century. Twentieth-century eruptions from the crater lake have ejected pyroclastic rocks and chilled liquid sulfur fragments.
Information Contacts: Servicio Nacional de Geología y Minería (SERNAGEOMIN), Observatorio Volcanológico de Los Andes del Sur (OVDAS), Avda Sta María No. 0104, Santiago, Chile (URL: http://www.sernageomin.cl/); Oficina Nacional de Emergencia - Ministerio del Interior (ONEMI), Beaucheff 1637/1671, Santiago, Chile (URL: http://www.onemi.cl/); Buenos Aires Volcanic Ash Advisory Center (VAAC), Servicio Meteorológico Nacional-Fuerza Aérea Argentina, 25 de mayo 658, Buenos Aires, Argentina (URL: http://www.smn.gov.ar/vaac/buenosaires/inicio.php); Sentinel Hub Playground (URL: https://www.sentinel-hub.com/explore/sentinel-playground); MIROVA (Middle InfraRed Observation of Volcanic Activity), a collaborative project between the Universities of Turin and Florence (Italy) supported by the Centre for Volcanic Risk of the Italian Civil Protection Department (URL: http://www.mirovaweb.it/); Valentina (URL: https://twitter.com/valecaviahue, Twitter: @valecaviahue); Roberto Impaglione (URL: https://twitter.com/robimpaglione, Twitter: @robimpaglione); CultureVolcan (URL: https://twitter.com/CultureVolcan, Twitter: @CultureVolcan).
Erebus (Antarctica) — January 2019 Cite this Report
Erebus
Antarctica
77.53°S, 167.17°E; summit elev. 3794 m
All times are local (unless otherwise noted)
Lava lakes persist through 2017 and 2018
Between the early 1980's through 2016, activity at Erebus was monitored by the Mount Erebus Volcano Observatory (MEVO), using seismometers, infrasonic recordings to measure eruption frequency, and annual scientific site visits. MEVO recorded occasional explosions propelling ash up to 2 km above the summit of this Antarctic volcano and the presence of two, sometimes three, lava lakes (figure 26). However, MEVO closed in 2016 (BGVN 42:06).
Activity at the lava lakes in the summit crater can be detected using MODIS infrared detectors aboard the Aqua and Terra satellites and analyzed using the MODVOLC algorithm. A compilation of thermal alert pixels during 2017-2018 (table 4, a continuation of data in the previous report) shows a wide range of detected activity, with a high of 182 alert pixels in April 2018. Although no MODVOLC anomalies were recorded in January 2017, detectors on the Sentinel-2 satellite imaged two active lava lakes on 25 January.
Table 4. Number of MODVOLC thermal alert pixels recorded per month from 1 January 2017 to 31 December 2018 for Erebus by the University of Hawaii's thermal alert system. Table compiled by GVP from data provided by MODVOLC.
| Year |
Jan |
Feb |
Mar |
Apr |
May |
Jun |
Jul |
Aug |
Sep |
Oct |
Nov |
Dec |
SUM |
| 2017 |
0 |
21 |
9 |
0 |
0 |
1 |
11 |
61 |
76 |
52 |
0 |
3 |
234 |
| 2018 |
0 |
21 |
58 |
182 |
55 |
17 |
137 |
172 |
103 |
29 |
0 |
0 |
774 |
| SUM |
0 |
42 |
67 |
182 |
55 |
18 |
148 |
233 |
179 |
81 |
0 |
3 |
1008 |
Geologic Background. Mount Erebus, the world's southernmost historically active volcano, overlooks the McMurdo research station on Ross Island. It is the largest of three major volcanoes forming the crudely triangular Ross Island. The summit of the dominantly phonolitic volcano has been modified by one or two generations of caldera formation. A summit plateau at about 3,200 m elevation marks the rim of the youngest caldera, which formed during the late-Pleistocene and within which the modern cone was constructed. An elliptical 500 x 600 m wide, 110-m-deep crater truncates the summit and contains an active lava lake within a 250-m-wide, 100-m-deep inner crater; other lava lakes are sometimes present. The glacier-covered volcano was erupting when first sighted by Captain James Ross in 1841. Continuous lava-lake activity with minor explosions, punctuated by occasional larger Strombolian explosions that eject bombs onto the crater rim, has been documented since 1972, but has probably been occurring for much of the volcano's recent history.
Information Contacts: Hawai'i Institute of Geophysics and Planetology (HIGP) - MODVOLC Thermal Alerts System, School of Ocean and Earth Science and Technology (SOEST), Univ. of Hawai'i, 2525 Correa Road, Honolulu, HI 96822, USA (URL: http://modis.higp.hawaii.edu/); Sentinel Hub Playground (URL: https://www.sentinel-hub.com/explore/sentinel-playground).
Kilauea (United States) — January 2019 Cite this Report
Kilauea
United States
19.421°N, 155.287°W; summit elev. 1222 m
All times are local (unless otherwise noted)
Fissure 8 lava flow continues vigorously until 4 August, ocean entry ends in late August, last activity at fissure 8 cone on 5 September 2018
Kīlauea's East Rift Zone (ERZ) has been intermittently active for at least two thousand years. Since the current eruptive period began in 1983 there have been open lava lakes and flows from the summit caldera and the East Rift Zone. A marked increase in seismicity and ground deformation at Pu'u 'O'o Cone on the upper East Rift Zone on 30 April 2018, and the subsequent collapse of its crater floor, marked the beginning of the largest lower East Rift Zone eruptive episode in at least 200 years; the ending of this episode in early September 2018 marked the end of 36 years of continuous activity.
During May 2018, lava moving into the Lower East Rift Zone opened 24 fissures along a 6-km-long NE-trending fracture zone, sending lava flows in multiple directions. As lava emerged from the fissures, the lava lake at Halema'uma'u drained and explosions sent ash plumes to several kilometer's altitude (BGVN 43:10). At the end of May, eruptive activity focused on 60-m-high fountains of lava from fissure 8 that created a rapidly moving flow that progressed 13 km in just five days, entering the ocean at Kapoho Bay and destroying over 500 homes. Throughout June vigorous effusion from fissure 8 created a 50-m-tall cone and a massive lava channel that carried lava to a growing 3-km-wide delta area which spread out into the ocean along the coast (BGVN 43:12). At Halema'uma'u crater, regular collapse explosion events were the response of the crater to the subsidence caused by the magma withdrawal on the lower East Rift Zone. The deepest part of the crater had reached 400 m below the caldera floor by late June. The eruptive events of July-September 2018 (figure 424), the last three months of this episode, are described in this report with information provided primarily from the US Geological Survey's (USGS) Hawaiian Volcano Observatory (HVO) in the form of daily reports, volcanic activity notices, and abundant photo, map, and video data.
Summary of activity, July-September 2018. The lava flow emerging from the fissure 8 cone on the Lower East Rift Zone continued unabated throughout July 2018. Overflows from the open channel were common, and often occurred a few hours after summit collapse events. There were multiple active ocean entry areas along the north, central, and southern portions of the coastal flow front of the fissure 8 flow at various times throughout the month. As the flow approached the delta area, lava spread out over the flow field and was no longer flowing on the surface but continued on the interior of the delta; numerous ocean entry points spanned the growing delta. In mid-July, an overflow diverted the channel W of Kapoho Crater, causing a new channel to the S of the delta that destroyed a park and a school, and increased the width of the delta to 6 km. The near-daily collapse events at Halema'uma'u crater continued until 2 August, transforming the geomorphology of the summit caldera.
Lower lava levels at the fissure 8 channel flow were first reported in early August; a reduced output from the cone was reported on 4 August and the lava level in the cone fell below the spillway the next day, shutting off the lava supply to the channel. The lava channel drained and crusted over during the next few days, but lava continued to enter the ocean at a decreasing rate for the rest of the month; the last ocean entry point had ceased by 29 August. A minor burst of spatter from gas jets inside the cone was noted on 20 August. The last activity was a small flow that covered the floor of the fissure 8 cone and created a small spatter cone during 1-5 September. Incandescence at the crater subsided during the next week until only steam activity was reported on the Lower East Rift Zone by the second half of September 2018.
Activity on the Lower East Rift Zone during 1-12 July 2018. The lava flow emerging from the fissure 8 cone on the Lower East Rift Zone continued unabated during July 2018 (figure 425). Overflows from the open channel were common, sending multiple short streams of lava down the built-up flanks of the channel (figure 426). The fissure 8 lava flow was the most significant activity at the Lower East Rift Zone during July 2018, but it was not the only activity observed by HVO scientists. Fissure 22 was also spattering tephra 50-80 m above a small spatter cone and feeding a short lava flow that was moving slowly NE along the edge of earlier flows during 1-11 July (figures 427 and 428). There were multiple active ocean entry areas along the north, central, and southern portions of the coastal flow front of the fissure 8 flow at various times throughout the month.
The lava channel had begun crusting over near the coast late in June, and the lava was streaming from the flow's molten interior into the ocean at many points along its broad front during the first half of July. The crusted-over area was 0.8 km from the coast on 2 July and had increased to 2 km from the coast on 6 July (figure 429). Temporary channel blockages of the flow caused minor overflows north of Kapoho Crater during 4-6 July. Multiple breakouts fed flows on the N and the SW edge of the main `a`a flow. HVO captured images during an overflight on 8 July of the area where the open channel ended and turned into the broad flow area of the delta (figure 430).
By 9 July the main lava channel had reorganized and was nearly continuous to the ocean on the S side of the flow, expanding the south margin by several hundred meters (figure 431). Lava was also entering the ocean along a 4-km-long line of small entry points across the delta. Early that afternoon observers reported multiple overflows along both sides of the main lava channel in an area just W of Kapoho Crater; small brushfires were reported along the margins. Another flow lobe farther down the channel was moving NE from the main channel. The channel near Four Corners was mostly crusted over, and plumes from the ocean entry were significantly reduced. The dramatic difference in landscapes on the northern and southern sides of the fissure 8 lava channel was readily apparent during a 10 July overflight (figure 432). With dominant trade winds blowing heat and volcanic gases to the SW, the N side of the lava channel remained verdant, while vegetation on the S side was severely impacted and appeared brown and yellow.
A channel blockage just W of Kapoho Crater overnight on 10-11 July sent most of the channel S along the W edge of previous flows on the W side of the crater. By mid-morning this channelized ?a?a flow had advanced to within 0.5 km of the coast at Ahalanui Beach Park. A few houses were also threatened by overflows along the upper channel on 11 July (figure 433). The broad ocean entry area widened as a result and covered nearly 6 km by 12 July (figure 434).
HVO first mentioned a connection between the lava levels in the upper channel of the fissure 8 flow and the collapse-explosion events at the summit on 12 July. They observed a rise in the lava level shortly after each collapse event at the summit for most of the rest of July. Overnight into 12 July, the diverted channelized ?a?a flow W of Kapoho Crater advanced to the ocean destroying the Kua O Ka La Charter School and Ahalanui Count Beach Park and established a robust ocean entry area (figure 435). Despite no visible surface connection to the fissure 8 channel, lava continued to stream out at several points on the 6-km-wide flow front into the ocean. A small island of lava also appeared offshore of the northernmost part of the ocean entry on 12 July (figure 436).
Activity on the LERZ during 13-31 July 2018. As the southern margin of the flow continued to advance slowly south, it reached to within 1 km of the Isaac Hale Park on 14 July and within 750 m on 17 July. An increase in lava supply overnight into 18 July produced several channel overflows threatening homes on Nohea street and also additional overflows downstream on both sides of the channel. The overflows had stalled by mid-morning. South of Kapoho Crater, the surge produced an ?a?a flow that rode over the active southern flow that was still entering the ocean. The southern margin was 500 m from the boat ramp at Isaac Hale Park on 19 July (figure 437).
During the HVO morning overflight on 20 July scientists noted that the channel was incandescent along its entire length from the vent to the ocean entry (figure 438, top). The most vigorous ocean entry was located a few hundred meters NE of the southern flow boundary; a few small pahoehoe flows were also entering the ocean on either side of the channel's main entry point (figure 438, bottom). On 23 July there were overflows just NW of Kapoho Crater following a collapse event at the summit the previous evening. During the day, small breakouts along the edge of the lava flow in the Ahalanui area caused the flow to expand westward. The flow margin was about 175 m from the Pohoiki boat ramp in Isaac Hale Park by the end of 24 July, and the active ocean entry was still a few hundred meters to the E of the lava flow margin. The numerous ocean entry points were concentrated along the southern half of the 6-km-long delta (figure 439).
On 26 July, lava movement in the channel appeared sluggish and levels had dropped in the lower part of the channel compared to previous days. Pulses of lava were recorded every few minutes at the fissure 8 vent (figure 440). HVO suggested that overflows on 28 July may have resulted from a channel surge following a summit collapse event in the morning (figures 441 and 442). Lava was actively entering the ocean along a broad 2 km flow front centered near the former Ahalanui Beach Park, but the edge of the flow remained about 175 m from the Pohoiki boat ramp at Isaac Hale park for the rest of the month. There were a few breakouts to the W that were distant from the coast and not directly threatening Pohoiki. A more minor entry was building a pointed delta near the south edge of the flow. At 2202 on 29 July an earthquake on Kīlauea's south flank was felt as far north as Hilo by a few people. The M 4.1 (NEIC) earthquake was weaker than recent summit earthquakes but it was felt more widely, possibly due to its greater depth of 7 km (compared with 2 km for summit earthquakes).
Activity at Halema'uma'u during July and August 2018. Periodic collapse explosion events with energy equivalents to a M 5.2 or 5.3 earthquake continued on a near daily basis throughout July at Halema'uma'u, enlarging the crater floor inside the Kīlauea caldera and creating large down-dropped blocks and fractures across the caldera (figure 443). Ash-poor plumes occasionally rose a few hundred meters above the caldera floor. Summit seismicity would drop dramatically after each explosion and then gradually increase to 25-35 earthquakes (mostly in the M 2-3 range) prior to the next collapse explosion. The periodicity of the explosion events was consistent until 24 July when a gap of 53 hours occurred until the next event on 26 July, the longest break since early June.
Images of the caldera on 13 July and 1 August demonstrated the unprecedented magnitude of change that affected Kīlauea during the month (figures 444 and 445). The last collapse explosion event, at 1155 HST on 2 August, was reported as a M 5.4 seismic event (figure 446). Seismicity increased after the event as it had after previous events, but after reaching about 30 earthquakes per hour on 4 August, seismicity decreased without a collapse-explosion event occurring. The rate of deformation at the summit as measured by tiltmeter and GPS was also much reduced after 4 August.
Activity on the Lower East Rift Zone during August 2018. Activity continued essentially unchanged on the fissure 8 flow during 1-4 August, although there were reports of somewhat lower lava levels in the channel. Multiple overflows were reported late on 2 August, one of which started a small fire near Noni Farms Road. Other overflows were concentrated in the wide lava field W and SSW of Kapoho Crater, also igniting small fires in adjacent vegetation (figure 447). The south edge of the flow did not advance any closer to the boat ramp in Isaac Hale Park (figure 448). The channel was incandescent at its surface to approximately 4.5 km from the vent (figure 449); lava was still flowing farther beneath the crust to the vicinity of Kapoho Crater where it was seeping out of both sides of the channel. The lower lava channel adjacent to Kapoho Crater shifted W about 0.25 km early on 4 August and was feeding lava into the SW sector of the lower flow field.
The NE half of the flow's ocean-front was inactive with no evidence of effusion into the ocean by 4 August. Field observations and UAS overflight images indicated a reduced output of lava from fissure 8 during the day on 4 August. During the morning helicopter overflight on 5 August geologists confirmed a significant reduction in lava output from fissure 8 that began the previous day. HVO field geologists observed low levels of fountaining within the fissure 8 spatter cone and largely crusted lava in the spillway and channel system downstream (figure 450). The lava level in the channel near Kapoho Crater had dropped substantially on 5 August. (figure 451).
Lava continued to slowly enter the ocean along a broad flow front generally near Pohoiki, but remained about 70 m SE of the boat ramp on 5 August. The next morning's overflight crew saw a weak to moderately active bubbling lava lake within the fissure 8 cone, a weak gas plume, and a completely crusted lava channel. Later in the morning ground crews found the upper channel largely devoid of lava, confirming that the channel was empty to at least the vicinity of Kapoho Crater where a short section of spiny active lava in a channel was present. There were small active breakouts near the coast on the Kapoho Bay and Ahalanui lobes, but the laze plume was greatly diminished. Active lava was close to the Pohoiki boat ramp but had not advanced significantly toward it. A major change in the heat flow recorded by satellite instruments was apparent by the end of the first week in August (figure 452). The MIROVA signal, which had shown a persistent high-intensity thermal signal for several years, recorded an abrupt drop in activity early in May that coincided with the opening of the fissures on the LERZ, and the dropping of the lava lake at Halema'uma'u. The lower levels of heat flow fluctuated from May through early August, and then ended abruptly after the first week of August.
On 7 August the surface of the lava lake was about 5-10 m below the spillway entrance (figure 453) and the upper part of the channel was crusted over (figure 454). There were a diminishing number of small active flow points near the coast on the Kapoho Bay and Ahalanui lobes. By 9 August the overflight crew observed a crusted lava pond deep inside the steaming cone at a level significantly below that seen on 7 August. Up-rift of fissure 8, fissures 9, 10, and 24, and down-rift fissures 13, 23, 3, 21 and 7, continued to steam, but no new activity was observed. Lava was streaming at several points along the Kapoho Bay and Ahalanui coastline, causing wispy laze plumes on 10 August, and only minor areas of incandescence were visible in the lava pond inside the fissure 8 cone (figure 455). The next day the overflight crew noted two small ponds of lava inside the cone; one was crusted over and stagnant, and the other was incandescent and sluggishly convecting. A gas plumed billowed up from fissure 8 and low-level steaming was intermittent from a few of the otherwise inactive fissures.
By 12 August the only incandescent lava visible on the flow field was that entering the ocean between Kapoho Bay and the Ahalanui area. Fresh black sand, created as molten lava is chilled and shattered by the surf, was being transported SW by longshore currents and accumulating in the Pohoiki small boat harbor (figure 456). A sandbar blocked the entrance to the harbor the following day. The westernmost ocean entry of lava was about 1 km from the harbor on 13 August.
By 14 August only a small, crusted over pond of lava deep inside the fissure 8 cone and a few scattered ocean entries were active; there had been no new lava actively flowing in the lower East Rift Zone since 6 August. No collapse events had occurred at the summit since 2 August. Earthquake and deformation data showed no net changes suggesting movement of subsurface magma or pressurization. Sulfur dioxide emission rates at both the summit and LERZ were drastically reduced; the combined rate was lower than at any time since late 2007. As a result of the reduced activity, HVO lowered the Alert Level for ground-based hazards from WARNING to WATCH on 17 August. By 18 August, the only incandescence visible was at the coast near Ahalanui, where there were a few ocean entries and minor laze plumes (figure 457).
Gas jets were throwing spatter, fragments of glassy lava, from small incandescent areas deep within the fissure 8 cone on 20 August (figure 458). The last day that the small lava pond deep within the fissure 8 cone was visible during an overflight was on 25 August; a few ocean entries were still active. A single small lava stream from the Kapoho Bay lobe was the only moving lava noted during an HVO overflight on 27 August (figure 459). Two days later, on 29 August, no lava was entering the ocean.
The fissure 8 lava flow entering the ocean had built a lava delta over 354 hectares (875 acres) in size by the end of August 2018 (figure 460). A sand bar, comprised of black sand and lava fragments carried by longshore currents from the lava delta, completely blocked the boat ramp at Isaac Hale Beach Park on 31 August 2018 (figure 461).
Activity during September 2018. A brief resurgence of minor activity during the first few days of September was the last observed from LERZ fissure 8. Incandescence was noted in the fissure 8 cone on 1 September. There was a persistent spot of spattering, and lava slowly covered the 15 x 65 m crater floor by evening (figure 462). Webcam views showed weak incandescence occasionally reflected on the eastern spillway wall from the crater overnight, suggesting that the lava in the crater remained active. A UAS oblique image the next afternoon showed that the new lava was mostly confined to the crater floor within the cone, although a small amount extended a short distance into the spillway (figure 463). Weak lava activity continued inside the fissure 8 cone for several days; lava filled the small footprint-shaped crater inside the cone as sluggish pahoehoe flows crept across the crater floor but did not flow down the spillway. A small spatter cone ejecting material every few seconds was noted on the floor of the crater on 4 September; observations the next day showed that it had reached an estimated height of around 3-4 m (figure 464). Only a small amount of incandescence was visible overnight on 5-6 September at fissure 8.
Pu'u O'o crater experienced a series of small collapses on 8 September. These produced episodes of visible brown plumes throughout the day and generated small tilt offsets and seismic energy recorded by nearby geophysical instruments. The collapses had no discernable effect on other parts of the rift and continued for several days at a decreasing frequency. Minor amounts of incandescence and fuming continued to be observed on 9 September at the fissure 8 cone. A small collapse pit formed in the cone on 10 September exposing hot material underneath and producing a short-lived increase in incandescence. Minor fuming was visible the next day from the small spatter cone. Incandescence at the collapse pit decreased over the next few days, but a glowing spot just west of the pit appeared on 11 September and grew slowly for a few days before diminishing. HVO interpreted it to be a layer of incandescence exposed in the slowly subsiding lava surface within the fissure 8 cone. Minimal incandescence was visible overnight on 14-15 September. After this, only minor fuming was visible during the day; incandescence was no longer observed for the remainder of the month.
HVO determined that the 2018 Lower East Rift Zone eruptive episode ended on 5 September 2018, bringing with it an end to the lava lake at Halema'uma'u crater and the eruptive activity that had been continuous at either Pu'u O'o or Halema'uma'u since 3 January 1983; a period of more than 36 years. Satellite imagery from early September 2018 demonstrated some of the impact of this last eruptive episode on the region around Kīlauea's lower East Rift Zone since the first fissure opened at the beginning of May 2018 (figures 465 and 466).
Geologic Background. Kilauea overlaps the E flank of the massive Mauna Loa shield volcano in the island of Hawaii. Eruptions are prominent in Polynesian legends; written documentation since 1820 records frequent summit and flank lava flow eruptions interspersed with periods of long-term lava lake activity at Halemaumau crater in the summit caldera until 1924. The 3 x 5 km caldera was formed in several stages about 1,500 years ago and during the 18th century; eruptions have also originated from the lengthy East and Southwest rift zones, which extend to the ocean in both directions. About 90% of the surface of the basaltic shield volcano is formed of lava flows less than about 1,100 years old; 70% of the surface is younger than 600 years. The long-term eruption from the East rift zone between 1983 and 2018 produced lava flows covering more than 100 km2, destroyed hundreds of houses, and added new coastline.
Information Contacts: Hawaiian Volcano Observatory (HVO), U.S. Geological Survey, PO Box 51, Hawai'i National Park, HI 96718, USA (URL: http://hvo.wr.usgs.gov/); MIROVA (Middle InfraRed Observation of Volcanic Activity), a collaborative project between the Universities of Turin and Florence (Italy) supported by the Centre for Volcanic Risk of the Italian Civil Protection Department (URL: http://www.mirovaweb.it/).
Poas (Costa Rica) — January 2019 Cite this Report
Poas
Costa Rica
10.2°N, 84.233°W; summit elev. 2697 m
All times are local (unless otherwise noted)
Frequent changes at the crater lake throughout 2018
After an eruption in April 2017, the hot acidic lake of Poás volcano has been in a state of frequent change, with a fluctuating or absent crater lake and other crater changes. During 2018 low-level activity was dominated by hydrothermal vents and degassing. The crater lake was variable, with changes in water level and complete drying of the lake several times. Seismicity was variable with some periods of increased seismicity, deformation was variable but slight, and gas levels fluctuated through the year (figure 120).
Hydrothermal activity took place during January, with associated low-level gas emissions, and seismicity that reduced later in the month. At the beginning of January the crater lake was absent. After an increase in hydrothermal activity, the lake returned between 18-20 January (figure 121). The lake was measured to be 54°C on 22 January (on the eastern edge) and had a milky blue color with abundant degassing. Temperatures at actively degassing vents reached 97°C. Fumaroles with abundant yellow sulfur deposits were measured to be 160°C (figure 122).
During February, activity remained low with fluctuating levels of CO2, SO2, and seismicity; the level of the lake also fluctuated. Activity remained shallow and related to the hydrothermal system with no magmatic activity. During March the seismicity decreased, coinciding with the disappearance of the crater lake during the March-May dry season. During April there was no change observed at the crater, and gas and seismicity continued to fluctuate within normal levels. Background activity and normal fluctuations continued through May until a phreatic (steam) eruption occurred on 25 May, producing a small gray plume and a larger white steam-and-gas plume (figure 123).
In June there was an increase in activity on the crater floor with increased submarine degassing and an increase in the lake water level. A high flow of SO2 (approximately 500 tons per day) was measured on 22 June. The measured level of SO2 was higher on 27 June, at 1,500 tons per day.
Gas emissions, deformation, and seismicity continued with fluctuations through July and August, with a decrease in SO2 around 30 July. Underwater fumaroles continued to be active. A milky-blue crater lake was present throughout this time (figure 124). During September, seismicity was described as highly variable and the crater lake was present (figure 125). Increased seismicity around 8 October coincided with slight inflation at the surface with an increase in activity through to 16 October. Gas emissions remained variable throughout September and October. A slight increase in seismicity occurred in early November and declined again by 19 November, with all other activity variable and within normal levels.
During December phreatic activity was observed at hydrothermal vents on the 19th (four events) and 20th (three events) that ejected water-saturated material up to 30 m above the vent accompanied by strong degassing and steam plumes. On 20 December it was observed that the lake level had dropped by 1 m and the lake was divided into two bodies of water, Boca A and Boca C. There were also changes in the crater lake color. Starting at the beginning of the month, the lake progressively changed from blue to green, especially visible on 8 December (figures 126, 127, and 128).
Geologic Background. The broad vegetated edifice of Poás, one of the most active volcanoes of Costa Rica, contains three craters along a N-S line. The frequently visited multi-hued summit crater lakes of the basaltic-to-dacitic volcano are easily accessible by vehicle from the nearby capital city of San José. A N-S-trending fissure cutting the complex stratovolcano extends to the lower N flank, where it has produced the Congo stratovolcano and several lake-filled maars. The southernmost of the two summit crater lakes, Botos, last erupted about 7,500 years ago. The more prominent geothermally heated northern lake, Laguna Caliente, is one of the world's most acidic natural lakes, with a pH of near zero. It has been the site of frequent phreatic and phreatomagmatic eruptions since an eruption was reported in 1828. Eruptions often include geyser-like ejections of crater-lake water.
Information Contacts: Observatorio Vulcanologico Sismologica de Costa Rica-Universidad Nacional (OVSICORI-UNA), Apartado 86-3000, Heredia, Costa Rica (URL: http://www.ovsicori.una.ac.cr/); Sentinel Hub Playground (URL: https://www.sentinel-hub.com/explore/sentinel-playground); Costa Rica Gobierno del Bicentenario, Official Website - Presidency of the Republic of Costa Rica, Zapote, San José, Costa Rica (URL: https://presidencia.go.cr/comunicados/2018/08/29-de-agosto-presidente-alvarado-dara-banderazo-de-reapertura-del-volcan-poas/).
Sangay
Ecuador
2.005°S, 78.341°W; summit elev. 5286 m
All times are local (unless otherwise noted)
Eruption produced ash plumes, lava flows, and rockfalls during August-December 2018
Sangay is the southernmost active volcano in Ecuador and has displayed frequent eruptive activity since 1628, producing pyroclastic flows, lava flows, ash plumes, and lahars. An eruption from July through October 2017 produced ash plumes and lava flows on the ESE flank. After nine months of quiescence an eruption occurred from 8 August to 7 December 2018, with four months of continuous activity producing ash plumes, lava flows, and rockfalls. This report covers March through December 2018 and summarizes reports issued by the Instituto Geofisico, the Washington Volcano Ash Advisory Center (VAAC), and satellite data.
There was no reported activity from March through July. After nine months of inactivity a new eruptive phase began on 8 August 2018. On this day the Washington VAAC reported a possible ash plume that rose approximately 500 m above the vent and drifted 28 km WSW. An ash plume on 11 August reached a height of 2.3 km above the crater and moved towards the WSW. Prior to these two events, the last ash plume was detected on 13 October 2017.
The NASA Fire Information for Resource Management System (FIRMS) thermal alert and the first thermal anomaly alert issued by the MODVOLC near-real-time thermal monitoring algorithm for this eruptive episode was on 14 August. The eruption onset was confirmed visually on 14 August when an incandescent lava flow was seen on the upper SE flank on a webcam image (figure 25). Sentinel-2 detected elevated temperatures at the summit and lava effusion on the ESE flank (figure 26).
During 28 August to 3 September ash emissions reached altitudes of 5.8-6.7 km and traveled various directions out to 45 km. Ash plumes on 11, 13, 15, and 17 September reached altitudes of 5.8-6.4 km and drifted to the SW and W. Light ashfall occurred in the city of Guayaquil on 18 September, 170 km W. Ash plumes reached 5.8 to 6.1 km altitude on 19 and 20 September and drifted 37 km to the WNW and W.
Activity continued through October with lava emission. A Sentinel-2 thermal satellite image acquired on 24 October shows the lava flow on the ESE flank, with elevated thermal energy at the central crater and the Ñuñurco dome (figure 27). The final MODVOLC thermal alert was on 30 November 2018. During this time, lava flows were emitted and flowed down the ESE flank, and ash plumes were often produced and traveled to the W and NW (figure 28). From 2 December there was a substantial decrease in seismicity, ten times less than the previous months (figure 29). No further activity was noted in December.
Elevated temperatures on the volcano were detected from 14 August to 30 November (figure 30). During this period the Washington Volcanic Ash Advisory Center (VAAC) issued 164 alerts for ash plumes. The ash plumes occasionally exceeded 2 km above the crater but were typically below 1.4 km, drifting in different directions through time (figures 31 and 32). The continuous emission of lava produced flows that traveled 1-2 km from the vent. Rockfalls and possible small pyroclastic flows produced at the lava flow fronts reached a distance of 7 km from the crater. Due to a decrease in thermal activity, ash plumes, and seismicity, Instituto Geofisico declared the eruption over on 7 December, after 121 days of activity.
Geologic Background. The isolated Sangay volcano, located east of the Andean crest, is the southernmost of Ecuador's volcanoes and its most active. The steep-sided, glacier-covered, dominantly andesitic volcano grew within the open calderas of two previous edifices which were destroyed by collapse to the east, producing large debris avalanches that reached the Amazonian lowlands. The modern edifice dates back to at least 14,000 years ago. It towers above the tropical jungle on the east side; on the other sides flat plains of ash have been eroded by heavy rains into steep-walled canyons up to 600 m deep. The earliest report of an eruption was in 1628. Almost continuous eruptions were reported from 1728 until 1916, and again from 1934 to the present. The almost constant activity has caused frequent changes to the morphology of the summit crater complex.
Information Contacts: Instituto Geofísico (IG-EPN), Escuela Politécnica Nacional, Casilla 17-01-2759, Quito, Ecuador (URL: http://www.igepn.edu.ec); ECU911 - Integrated Security Service ECU 911, ulio Endara street s/n. Sector Parque Itchimbía Quito – Ecuador (URL: http://www.ecu911.gob.ec/servicio-integrado-de-seguridad-ecu-911/); Hawai'i Institute of Geophysics and Planetology (HIGP) - MODVOLC Thermal Alerts System, School of Ocean and Earth Science and Technology (SOEST), Univ. of Hawai'i, 2525 Correa Road, Honolulu, HI 96822, USA (URL: http://modis.higp.hawaii.edu/); MIROVA (Middle InfraRed Observation of Volcanic Activity), a collaborative project between the Universities of Turin and Florence (Italy) supported by the Centre for Volcanic Risk of the Italian Civil Protection Department (URL: http://www.mirovaweb.it/); Sentinel Hub Playground (URL: https://www.sentinel-hub.com/explore/sentinel-playground).
Soputan (Indonesia) — January 2019 Cite this Report
Soputan
Indonesia
1.112°N, 124.737°E; summit elev. 1785 m
All times are local (unless otherwise noted)
Ash explosions on 3-4 October and 16 December 2018
Soputan typically erupts every few years with ash explosions, lava flows, and Strombolian eruptions (SEAN 07:08, BGVN 42:03). After a short eruptive period during January-February 2016, the volcano quieted, with only occasional steam plumes and low seismicity. An ash explosion on 3 October 2018 marked the beginning of a new eruption. The volcano is monitored by the Pusat Vulkanologi dan Mitigasi Bencana Geologi (PVMBG). This report discusses activity during September through December 2018.
According to PVMBG, increased seismicity at Soputan was notable on 2 October 2018, characterized by an increased number of signals indicating emissions and avalanches (which began in September and mid-July, respectively), increased Real-time Seismic-Amplitude Measurement (RSAM) values, and a higher number of volcanic earthquakes (since September). Data from a thermal camera showed increased summit temperatures, interpreted as indicating the presence of lava. The Alert Level was increased to 3 (on a scale of 1-4) on 3 October; people were advised not to approach the craters within a radius of 4 km, with an additional expansion to 6.5 km on the WSW flank due to increased risk from a breach in the crater rim.
An eruption at 0847 on 3 October produced a dense ash plume that rose 4 km above the summit and drifted W and NW (figure 16). Based on seismic data the event lasted six minutes. Events at 1044, 1112, and 1152 produced ash plumes that rose 2, 2.5, and 5 km above the crater rim, respectively. A thermal anomaly identified in satellite data significantly increased, and incandescent ejecta at the summit was clearly observed by residents. Avalanches of material traveled 2.5 km down the NE flank.
Based on satellite images, information from PVMBG, and wind model data, the Darwin Volcanic Ash Advisory Center (VAAC) reported that on 4 October ash plumes rose to an altitude of 4.6 km and drifted W. On 16 October, PVMBG issued a Volcano Observatory Notice for Aviation (VONA) that noted only white emissions; consequently, the Aviation Color Code was lowered to Yellow.
According to PVMBG, seismic activity rapidly and significantly increased at 1700 on 15 December. An eruption began at 0102 on 16 December, though dark and foggy conditions prevented views of emissions. The event lasted for almost 10 minutes, and thunderous sounds were heard at the Soputan Volcano Observation Post located in Silian Raya (about 10 km SW). The conditions improved about two hours later, and a dense ash plume was visible, rising 3 km above the summit and drifting SE. Incandescence from the summit was also visible. An event that began at 0540 produced dense gray-to-black ash plumes that rose as high as 7 km above the summit (summit elevation is 1,785 m) and drifted SE. The event lasted for 6 minutes and 10 seconds based on the seismic network. Ash plumes from events at 0743 and 0857 rose as high as 7.5 km and drifted SW.
Satellite data. Thermal anomalies, based on MODIS satellite instruments analyzed using the MODVOLC algorithm, were observed during two days in September (14 and 30 September), seven days in October, and lastly on 8 November 2018. Pixel numbers peaked during 3-7 October (six pixels on 3 October). The MIROVA (Middle InfraRed Observation of Volcanic Activity) volcano hotspot detection system, also based on analysis of MODIS data, detected numerous hotspots within 5 km of the volcano during the reporting period. Significant sulfur dioxide levels near the volcano were recorded by NASA's satellite-borne ozone instruments on or just after the 3 October and 16 December explosions.
Geologic Background. The Soputan stratovolcano on the southern rim of the Quaternary Tondano caldera on the northern arm of Sulawesi Island is one of Sulawesi's most active volcanoes. The youthful, largely unvegetated volcano is the only active cone in the Sempu-Soputan volcanic complex, which includes the Soputan caldera, Rindengan, and Manimporok (3.5 km ESE). Kawah Masem maar was formed in the W part of the caldera and contains a crater lake; sulfur has been extracted from fumarolic areas in the maar since 1938. Recent eruptions have originated at both the summit crater and Aeseput, a prominent NE-flank vent that formed in 1906 and was the source of intermittent major lava flows until 1924.
Information Contacts: Pusat Vulkanologi dan Mitigasi Bencana Geologi (PVMBG, also known as Indonesian Center for Volcanology and Geological Hazard Mitigation, CVGHM), Jalan Diponegoro 57, Bandung 40122, Indonesia (URL: http://www.vsi.esdm.go.id/); Badan Nasional Penanggulangan Bencana (BNPB), National Disaster Management Agency, Graha BNPB - Jl. Scout Kav.38, East Jakarta 13120, Indonesia (URL: http://www.bnpb.go.id/); Darwin Volcanic Ash Advisory Centre (VAAC), Bureau of Meteorology, Northern Territory Regional Office, PO Box 40050, Casuarina, NT 0811, Australia (URL: http://www.bom.gov.au/info/vaac/); Hawai'i Institute of Geophysics and Planetology (HIGP) - MODVOLC Thermal Alerts System, School of Ocean and Earth Science and Technology (SOEST), Univ. of Hawai'i, 2525 Correa Road, Honolulu, HI 96822, USA (URL: http://modis.higp.hawaii.edu/); MIROVA (Middle InfraRed Observation of Volcanic Activity), a collaborative project between the Universities of Turin and Florence (Italy) supported by the Centre for Volcanic Risk of the Italian Civil Protection Department (URL: http://www.mirovaweb.it/); Global Sulfur Dioxide Monitoring Page, Atmospheric Chemistry and Dynamics Laboratory, NASA Goddard Space Flight Center (NASA/GSFC), 8800 Greenbelt Road, Goddard, Maryland, USA (URL: https://so2.gsfc.nasa.gov/); Associated Press (URL: http://www.ap.org/).
Suwanosejima (Japan) — January 2019 Cite this Report
Suwanosejima
Japan
29.638°N, 129.714°E; summit elev. 796 m
All times are local (unless otherwise noted)
Multiple explosive events with incandescence and ash plumes during November 2018
Suwanosejima, an andesitic stratovolcano in Japan's northern Ryukyu Islands, was intermittently active for much of the 20th century, producing ash plumes, Strombolian explosions, and ash deposits. Continuous activity since October 2004 has produced intermittent explosions, generating ash plumes in most months that rise hundreds of meters above the summit to altitudes between 1 and 3 km. Ongoing activity for the second half of 2018 is covered in this report with information provided by the Japan Meteorological Agency (JMA) and the Tokyo Volcanic Ash Advisory Center (VAAC).
Activity during July-December 2018 was intermittent with explosions reported twice in September and 21 times during November. Incandescent activity was observed a few times each month, increasing significantly during November. Thermal data support a similar pattern of activity; the MIROVA thermal anomaly graph indicated intermittent activity through the period that was most frequent during October and November (figure 33). MODVOLC thermal alerts were issued once in September (9), three times in October (7, 21), and four times on 14 and 15 November.
There were no explosions at Suwanosejima during July or August 2018; steam plumes rose 900-1,000 m above the crater rim and incandescence was intermittently observed on clear nights. During September incandescence was also observed at night; in addition, explosions were reported on 12 and 13 September, with ash plumes rising 1,100 m above the crater rim. October was again quiet with no explosions, only steam plumes rising 800 m, and occasional incandescence at night, although thermal activity increased (figure 33).
More intense activity resumed during November 2018 with 21 explosions reported. On 9 and 14 November tephra was ejected up to 700 m from the Otake crater. The Tokyo VAAC reported an ash plume visible in satellite imagery at 2.4 km altitude moving E on 14 November. The next day, a plume was reported at 2.7 km altitude drifting NW but it was not visible in satellite imagery. JMA reported gray ash plumes that rose up to 2,000 m above the crater rim on 16 and 23 November (figure 34). The ash plume on 23 November was visible in satellite imagery drifting N at 2.7 km altitude. On 30 November the Tokyo VAAC reported an ash plume visible in satellite data drifting SE at 2.4 km altitude. Incandescence was often observed at night from the webcams throughout the month. Ashfall was confirmed in the village 4 km SSW on 14, 17, and 23 November, and sounds were reported on 20 November.
During December 2018, no explosive eruptions were reported, but an ash plume rose 1,800 m above the summit on 26 December. Incandescence was observed on clear nights in the webcam. Throughout 2018, a total of 42 explosive events were reported; 21 of them occurred during November (figure 35).
Geologic Background. The 8-km-long island of Suwanosejima in the northern Ryukyu Islands consists of an andesitic stratovolcano with two active summit craters. The summit is truncated by a large breached crater extending to the sea on the E flank that was formed by edifice collapse. One of Japan's most frequently active volcanoes, it was in a state of intermittent Strombolian activity from Otake, the NE summit crater, between 1949 and 1996, after which periods of inactivity lengthened. The largest recorded eruption took place in 1813-14, when thick scoria deposits covered residential areas, and the SW crater produced two lava flows that reached the western coast. At the end of the eruption the summit of Otake collapsed, forming a large debris avalanche and creating an open collapse scarp extending to the eastern coast. The island remained uninhabited for about 70 years after the 1813-1814 eruption. Lava flows reached the eastern coast of the island in 1884. Only about 50 people live on the island.
Information Contacts: Japan Meteorological Agency (JMA), Otemachi, 1-3-4, Chiyoda-ku Tokyo 100-8122, Japan (URL: http://www.jma.go.jp/jma/indexe.html); Tokyo Volcanic Ash Advisory Center (VAAC), 1-3-4 Otemachi, Chiyoda-ku, Tokyo, Japan (URL: http://ds.data.jma.go.jp/svd/vaac/data/).
Veniaminof (United States) — January 2019 Cite this Report
Veniaminof
United States
56.17°N, 159.38°W; summit elev. 2507 m
All times are local (unless otherwise noted)
Eruption with lava flows and ash plumes during September-December 2018
The most recent eruptive period at Veniaminof began in September 2018 with seismic activity followed by ash emissions and lava flows continuing through mid-December 2018, the end of this reporting period (figure 25). An intracaldera cone has been the source of historic volcanic activity in the last 200 years and more recent activity last reported in June 2013 (BGVN 42:02). Veniaminof is closely monitored by the Alaska Volcanic Observatory (AVO) and the Anchorage Volcanic Ash Advisory Center (VAAC), and is also monitored by a Federal Aviation Administration (FAA) web camera in the town of Perryville, 35 km E.
The most recent Strombolian-type eruptive cycle commenced with increased seismic activity on 2 September 2018. Low-level ash that rose 3 km and pulsatory low-altitude ash emissions were observed in FAA webcam images on 4-6 September. Ash deposits extended onto the snowfield at and below the summit to the SSW and SE, forming a "v" shape downslope from the summit. On 7 September a thermal feature was detected, suggesting lava fountaining at the summit, which was later confirmed by satellite data showing a S-flank lava flow about 800 m long on 9-11 September (figure 26). FAA webcam images on 26 September showed lava fountains issuing from a second vent 75 m N of the first, producing additional lava flows on the S flank (figures 27 and 28). Minor ash emissions associated with lava fountaining possibly rose as high as 4.5 km and quickly dispersed.
The lava flow had traveled 1 km down the S flank of the summit cone by 1 October. Satellite imagery from 6 October showed three lobes of lava flows and a plume over a thin tephra deposit. By 25 October the lava flow had traveled as far as 1.2 km (figures 29 and 30). Fractures in the ice sheet adjacent to the lava flow field continued to grow due to meltwater flowing beneath. Additionally, a persistent and robust steam plume which contained sulfur dioxide was visible from the FAA webcam on 18 October.
Ash emissions significantly increased overnight on 20-21 November, prompting AVO to raise the Aviation Color Code (ACC) to Red and the Alert Level to "Warning" (the highest levels on a four-level scale). The ash emissions rose to below 4.6 km and drifted more than 240 km SE. On 21 November observations and FAA webcam images indicated continuous ash emissions through most of the day as ash plumes drifted SE, extending as far as 400 km (figure 31). A short eruptive pulse was recorded during 1526-1726, and subsequent ash plumes rose to below 3 km with low-altitude ash emissions drifting 100 km S on 22 November (figure 32). Decreased ash emissions prompted AVO to lower the ACC and Alert Level to Orange and "Watch", respectively. However, lava effusion was persistent through 27 November.
During 27-28 November acoustic waves were recorded by regional infrasound sensors. A continuous low-amplitude tremor was recorded until the network went offline following a M 7 earthquake in Anchorage on 30 November. On 6 December seismicity changed from nearly continuous low-level volcanic tremor to intermittent small low-frequency events and short bursts of tremors, possibly indicating that lava effusion had slowed or stopped. Variable seismicity continued through 12 December, though there was no visual confirmation of lava effusion.
Minor ashfall was recorded in Perryville (35 km E) on 25 October and 22 November 2018. Elevated surface temperatures and thermal anomalies were identified in satellite data on 7, 12-26 September, 2-9 and 24-30 October, 7-22 November, and 4-5 December. Nighttime incandescence was visible from the FAA webcam at various times during this reporting period (figure 27). Following 22 November, the ACC remained at Orange and the Volcano Alert Level remained at "Watch."
The MIROVA thermal anomalies detected during this period were reported as having moderate to high radiative power (figure 33). Numerous thermal anomalies identified using the MODVOLC algorithm were also detected during this period, and showed the S-flank lava flows (figure 34).
Geologic Background. Veniaminof, on the Alaska Peninsula, is truncated by a steep-walled, 8 x 11 km, glacier-filled caldera that formed around 3,700 years ago. The caldera rim is up to 520 m high on the north, is deeply notched on the west by Cone Glacier, and is covered by an ice sheet on the south. Post-caldera vents are located along a NW-SE zone bisecting the caldera that extends 55 km from near the Bering Sea coast, across the caldera, and down the Pacific flank. Historical eruptions probably all originated from the westernmost and most prominent of two intra-caldera cones, which rises about 300 m above the surrounding icefield. The other cone is larger, and has a summit crater or caldera that may reach 2.5 km in diameter, but is more subdued and barely rises above the glacier surface.
Information Contacts: Alaska Volcano Observatory (AVO), a cooperative program of a) U.S. Geological Survey, 4200 University Drive, Anchorage, AK 99508-4667 USA (URL: https://avo.alaska.edu/), b) Geophysical Institute, University of Alaska, PO Box 757320, Fairbanks, AK 99775-7320, USA, and c) Alaska Division of Geological & Geophysical Surveys, 794 University Ave., Suite 200, Fairbanks, AK 99709, USA (URL: http://dggs.alaska.gov/); Anchorage Volcanic Ash Advisory Center (VAAC), Alaska Aviation Weather Unit, NWS NOAA US Dept of Commerce, 6930 Sand Lake Road, Anchorage, AK 99502-1845 USA (URL: http://vaac.arh.noaa.gov/); Hawai'i Institute of Geophysics and Planetology (HIGP) - MODVOLC Thermal Alerts System, School of Ocean and Earth Science and Technology (SOEST), Univ. of Hawai'i, 2525 Correa Road, Honolulu, HI 96822, USA (URL: http://modis.higp.hawaii.edu/); MIROVA (Middle InfraRed Observation of Volcanic Activity), a collaborative project between the Universities of Turin and Florence (Italy) supported by the Centre for Volcanic Risk of the Italian Civil Protection Department (URL: http://www.mirovaweb.it/); Sentinel Hub Playground (URL: https://www.sentinel-hub.com/explore/sentinel-playground).