Recently Published Bulletin Reports
Kadovar (Papua New Guinea) An ash plume and weak thermal anomaly during May 2023
San Miguel (El Salvador) Small gas-and-ash explosions during March and May 2023
Ebeko (Russia) Continued explosions, ash plumes, and ashfall during October 2022-May 2023
Home Reef (Tonga) Discolored plumes continued during November 2022-April 2023
Semisopochnoi (United States) Occasional explosions, ash deposits, and gas-and-steam plumes during December 2022-May 2023
Ambae (Vanuatu) New lava flow, ash plumes, and sulfur dioxide plumes during February-May 2023
Ibu (Indonesia) Daily ash explosions continue, along with thermal anomalies in the crater, October 2022-May 2023
Dukono (Indonesia) Continuing ash emissions, SO2 plumes, and thermal signals during October 2022-May 2023
Sabancaya (Peru) Explosions, gas-and-ash plumes, and thermal activity persist during November 2022-April 2023
Sheveluch (Russia) Significant explosions destroyed part of the lava-dome complex during April 2023
Bezymianny (Russia) Explosions, ash plumes, lava flows, and avalanches during November 2022-April 2023
Chikurachki (Russia) New explosive eruption during late January-early February 2023
Kadovar (Papua New Guinea) — June 2023  Cite this Report
Kadovar
Papua New Guinea
3.608°S, 144.588°E; summit elev. 365 m
All times are local (unless otherwise noted)
An ash plume and weak thermal anomaly during May 2023
Kadovar is a 2-km-wide island that is the emergent summit of a Bismarck Sea stratovolcano. It lies off the coast of New Guinea, about 25 km N of the mouth of the Sepik River. Prior to an eruption that began in 2018, a lava dome formed the high point of the volcano, filling an arcuate landslide scarp open to the S. Submarine debris-avalanche deposits occur to the S of the island. The current eruption began in January 2018 and has comprised lava effusion from vents at the summit and at the E coast; more recent activity has consisted of ash plumes, weak thermal activity, and gas-and-steam plumes (BGVN 48:02). This report covers activity during February through May 2023 using information from the Darwin Volcanic Ash Advisory Center (VAAC) and satellite data.
Activity during the reporting period was relatively low and mainly consisted of white gas-and-steam plumes that were visible in natural color satellite images on clear weather days (figure 67). According to a Darwin VAAC report, at 2040 on 6 May an ash plume rose to 4.6 km altitude and drifted W; by 2300 the plume had dissipated. MODIS satellite instruments using the MODVOLC thermal algorithm detected a single thermal hotspot on the SE side of the island on 7 May. Weak thermal activity was also detected in a satellite image on the E side of the island on 14 May, accompanied by a white gas-and-steam plume that drifted SE (figure 68).
Geologic Background. The 2-km-wide island of Kadovar is the emergent summit of a Bismarck Sea stratovolcano of Holocene age. It is part of the Schouten Islands, and lies off the coast of New Guinea, about 25 km N of the mouth of the Sepik River. Prior to an eruption that began in 2018, a lava dome formed the high point of the andesitic volcano, filling an arcuate landslide scarp open to the south; submarine debris-avalanche deposits occur in that direction. Thick lava flows with columnar jointing forms low cliffs along the coast. The youthful island lacks fringing or offshore reefs. A period of heightened thermal phenomena took place in 1976. An eruption began in January 2018 that included lava effusion from vents at the summit and at the E coast.
Information Contacts: Darwin Volcanic Ash Advisory Centre (VAAC), Bureau of Meteorology, Northern Territory Regional Office, PO Box 40050, Casuarina, NT 0811, Australia (URL: http://www.bom.gov.au/info/vaac/); Hawai'i Institute of Geophysics and Planetology (HIGP) - MODVOLC Thermal Alerts System, School of Ocean and Earth Science and Technology (SOEST), Univ. of Hawai'i, 2525 Correa Road, Honolulu, HI 96822, USA (URL: http://modis.higp.hawaii.edu/); Copernicus Browser, Copernicus Data Space Ecosystem, European Space Agency (URL: https://dataspace.copernicus.eu/browser/).
San Miguel (El Salvador) — June 2023 Cite this Report
San Miguel
El Salvador
13.434°N, 88.269°W; summit elev. 2130 m
All times are local (unless otherwise noted)
Small gas-and-ash explosions during March and May 2023
San Miguel in El Salvador is a broad, deep crater complex that has been frequently modified by eruptions recorded since the early 16th century and consists of the summit known locally as Chaparrastique. Flank eruptions have produced lava flows that extended to the N, NE, and SE during the 17-19th centuries. The most recent activity has consisted of minor ash eruptions from the summit crater. The current eruption period began in November 2022 and has been characterized by frequent phreatic explosions, gas-and-ash emissions, and sulfur dioxide plumes (BGVN 47:12). This report describes small gas-and-ash explosions during December 2022 through May 2023 based on special reports from the Ministero de Medio Ambiente y Recursos Naturales (MARN).
Activity has been relatively low since the last recorded explosions on 29 November 2022. Seismicity recorded by the San Miguel Volcano Station (VSM) located on the N flank at 1.7 km elevation had decreased by 7 December. Sulfur dioxide gas measurements taken with DOAS (Differential Optical Absorption Spectroscopy) mobile equipment were below typical previously recorded values: 300 tons per day (t/d). During December, small explosions were recorded by the seismic network and manifested as gas-and-steam emissions.
Gas-and-ash explosions in the crater occurred during January 2023, which were recorded by the seismic network. Sulfur dioxide values remained low, between 300-400 t/d through 10 March. At 0817 on 14 January a gas-and-ash emission was visible in webcam images, rising just above the crater rim. Some mornings during February, small gas-and-steam plumes were visible in the crater. On 7 March at 2252 MARN noted an increase in degassing from the central crater; gas emissions were constantly observed through the early morning hours on 8 March. During the early morning of 8 March through the afternoon on 9 March, 12 emissions were registered, some accompanied by ash. The last gas-and-ash emission was recorded at 1210 on 9 March; very fine ashfall was reported in El Tránsito (10 km S), La Morita (6 km W), and La Piedrita (3 km W). The smell of sulfur was reported in Piedra Azul (5 km SW). On 16 March MARN reported that gas-and-steam emissions decreased.
Low degassing and very low seismicity were reported during April; no explosions have been detected between 9 March and 27 May. The sulfur dioxide emissions remained between 350-400 t/d; during 13-20 April sulfur dioxide values fluctuated between 30-300 t/d. Activity remained low through most of May; on 23 May seismicity increased. An explosion was detected at 1647 on 27 May generated a gas-and-ash plume that rose 700 m high (figure 32); a decrease in seismicity and gas emissions followed. The DOAS station installed on the W flank recorded sulfur dioxide values that reached 400 t/d on 27 May; subsequent measurements showed a decrease to 268 t/d on 28 May and 100 t/d on 29 May.
Geologic Background. The symmetrical cone of San Miguel, one of the most active volcanoes in El Salvador, rises from near sea level to form one of the country's most prominent landmarks. A broad, deep, crater complex that has been frequently modified by eruptions recorded since the early 16th century caps the truncated unvegetated summit, also known locally as Chaparrastique. Flanks eruptions of the basaltic-andesitic volcano have produced many lava flows, including several during the 17th-19th centuries that extended to the N, NE, and SE. The SE-flank flows are the largest and form broad, sparsely vegetated lava fields crossed by highways and a railroad skirting the base of the volcano. Flank vent locations have migrated higher on the edifice during historical time, and the most recent activity has consisted of minor ash eruptions from the summit crater.
Information Contacts: Ministero de Medio Ambiente y Recursos Naturales (MARN), Km. 5½ Carretera a Nueva San Salvador, Avenida las Mercedes, San Salvador, El Salvador (URL: http://www.snet.gob.sv/ver/vulcanologia).
Ebeko
Russia
50.686°N, 156.014°E; summit elev. 1103 m
All times are local (unless otherwise noted)
Continued explosions, ash plumes, and ashfall during October 2022-May 2023
Ebeko, located on the N end of Paramushir Island in the Kuril Islands, consists of three summit craters along a SSW-NNE line at the northern end of a complex of five volcanic cones. Eruptions date back to the late 18th century and have been characterized as small-to-moderate explosions from the summit crater, accompanied by intense fumarolic activity. The current eruption period began in June 2022 and has recently consisted of frequent explosions, ash plumes, and thermal activity (BGVN 47:10). This report covers similar activity during October 2022 through May 2023, based on information from the Kamchatka Volcanic Eruptions Response Team (KVERT) and satellite data.
Activity during October consisted of explosive activity, ash plumes, and occasional thermal anomalies. Visual data by volcanologists from Severo-Kurilsk showed explosions producing ash clouds up to 2.1-3 km altitude which drifted E, N, NE, and SE during 1-8, 10, 16, and 18 October. KVERT issued several Volcano Observatory Notices for Aviation (VONA) on 7, 13-15, and 27 October 2022, stating that explosions generated ash plumes that rose to 2.3-4 km altitude and drifted 5 km E, NE, and SE. Ashfall was reported in Severo-Kurilsk (Paramushir Island, about 7 km E) on 7 and 13 October. Satellite data showed a thermal anomaly over the volcano on 15-16 October. Visual data showed ash plumes rising to 2.5-3.6 km altitude on 22, 25-29, and 31 October and moving NE due to constant explosions.
Similar activity continued during November, with explosions, ash plumes, and ashfall occurring. KVERT issued VONAs on 1-2, 4, 6-7, 9, 13, and 16 November that reported explosions and resulting ash plumes that rose to 1.7-3.6 km altitude and drifted 3-5 km SE, ESE, E, and NE. On 1 November ash plumes extended as far as 110 km SE. On 5, 8, 12, and 24-25 November explosions and ash plumes rose to 2-3.1 km altitude and drifted N and E. Ashfall was observed in Severo-Kurilsk on 7 and 16 November. A thermal anomaly was visible during 1-4, 16, and 20 November. Explosions during 26 November rose as high as 2.7 km altitude and drifted NE (figure 45).
Explosions and ash plumes continued to occur in December. During 1-2 and 4 December volcanologists from Severo-Kurilsk observed explosions that sent ash to 1.9-2.5 km altitude and drifted NE and SE (figure 46). VONAs were issued on 5, 9, and 16 December reporting that explosions generated ash plumes rising to 1.9 km, 2.6 km, and 2.4 km altitude and drifted 5 km SE, E, and NE, respectively. A thermal anomaly was visible in satellite imagery on 16 December. On 18 and 27-28 December explosions produced ash plumes that rose to 2.5 km altitude and drifted NE and SE. On 31 December an ash plume rose to 2 km altitude and drifted NE.
Explosions continued during January 2023, based on visual observations by volcanologists from Severo-Kurilsk. During 1-7 January explosions generated ash plumes that rose to 4 km altitude and drifted NE, E, W, and SE. According to VONAs issued by KVERT on 2, 4, 10, and 23 January, explosions produced ash plumes that rose to 2-4 km altitude and drifted 5 km N, NE, E, and ENE; the ash plume that rose to 4 km altitude occurred on 10 January (figure 47). Satellite data showed a thermal anomaly during 3-4, 10, 13, 16, 21, 22, and 31 January. KVERT reported that an ash cloud on 4 January moved 12 km NE. On 6 and 9-11 January explosions sent ash plumes to 4.5 km altitude and drifted W and ESE. On 13 January an ash plume rose to 3 km altitude and drifted SE. During 20-24 January ash plumes from explosions rose to 3.7 km altitude and drifted SE, N, and NE. On 21 January the ash plume drifted as far as 40 km NE. During 28-29 and 31 January and 1 February ash plumes rose to 4 km altitude and drifted NE.
During February, explosions, ash plumes, and ashfall were reported. During 1, 4-5 and 7-8 February explosions generated ash plumes that rose to 4.5 km altitude and drifted E and NE; ashfall was observed on 5 and 8 February. On 6 February an explosion produced an ash plume that rose to 3 km altitude and drifted 7 km E, causing ashfall in Severo-Kurilsk. A thermal anomaly was visible in satellite data on 8, 9, 13, and 21 February. Explosions on 9 and 12-13 February produced ash plumes that rose to 4 km altitude and drifted E and NE; the ash cloud on 12 February extended as far as 45 km E. On 22 February explosions sent ash to 3 km altitude that drifted E. During 24 and 26-27 February ash plumes rose to 4 km altitude and drifted E. On 28 February an explosion sent ash to 2.5-3 km altitude and drifted 5 km E; ashfall was observed in Severo-Kurilsk.
Activity continued during March; visual observations showed that explosions generated ash plumes that rose to 3.6 km altitude on 3, 5-7, and 9-12 March and drifted E, NE, and NW. Thermal anomalies were visible on 10, 13, and 29-30 March in satellite imagery. On 18, 21-23, 26, and 29-30 March explosions produced ash plumes that rose to 2.8 km altitude and drifted NE and E; the ash plumes during 22-23 March extended up to 76 km E. A VONA issued on 21 March reported an explosion that produced an ash plume that rose to 2.8 km altitude and drifted 5 km E. Another VONA issued on 23 March reported that satellite data showed an ash plume rising to 3 km altitude and drifted 14 km E.
Explosions during April continued to generate ash plumes. On 1 and 4 April an ash plume rose to 2.8-3.5 km altitude and drifted SE and NE. A thermal anomaly was visible in satellite imagery during 1-6 April. Satellite data showed ash plumes and clouds rising to 2-3 km altitude and drifting up to 12 km SW and E on 3 and 6 April (figure 48). KVERT issued VONAs on 3, 5, 14, 16 April describing explosions that produced ash plumes rising to 3 km, 3.5 km, 3.5 km, and 3 km altitude and drifting 5 km S, 5 km NE and SE, 72 km NNE, and 5 km NE, respectively. According to satellite data, the resulting ash cloud from the explosion on 14 April was 25 x 7 km in size and drifted 72-104 km NNE during 14-15 April. According to visual data by volcanologists from Severo-Kurilsk explosions sent ash up to 3.5 km altitude that drifted NE and E during 15-16, 22, 25-26, and 29 April.
The explosive eruption continued during May. Explosions during 3-4, 6-7, and 9-10 May generated ash plumes that rose to 4 km altitude and drifted SW and E. Satellite data showed a thermal anomaly on 3, 9, 13-14, and 24 May. During 12-16, 23-25, and 27-28 May ash plumes rose to 3.5 km altitude and drifted in different directions due to explosions. Two VONA notices were issued on 16 and 25 May, describing explosions that generated ash plumes rising to 3 km and 3.5 km altitude, respectively and extending 5 km E. The ash cloud on 25 May drifted 75 km SE.
Thermal activity in the summit crater, occasionally accompanied by ash plumes and ash deposits on the SE and E flanks due to frequent explosions, were visible in infrared and true color satellite images (figure 49).
Geologic Background. The flat-topped summit of the central cone of Ebeko volcano, one of the most active in the Kuril Islands, occupies the northern end of Paramushir Island. Three summit craters located along a SSW-NNE line form Ebeko volcano proper, at the northern end of a complex of five volcanic cones. Blocky lava flows extend west from Ebeko and SE from the neighboring Nezametnyi cone. The eastern part of the southern crater contains strong solfataras and a large boiling spring. The central crater is filled by a lake about 20 m deep whose shores are lined with steaming solfataras; the northern crater lies across a narrow, low barrier from the central crater and contains a small, cold crescentic lake. Historical activity, recorded since the late-18th century, has been restricted to small-to-moderate explosive eruptions from the summit craters. Intense fumarolic activity occurs in the summit craters, on the outer flanks of the cone, and in lateral explosion craters.
Information Contacts: Kamchatka Volcanic Eruptions Response Team (KVERT), Far Eastern Branch, Russian Academy of Sciences, 9 Piip Blvd., Petropavlovsk-Kamchatsky, 683006, Russia (URL: http://www.kscnet.ru/ivs/kvert/); MIROVA (Middle InfraRed Observation of Volcanic Activity), a collaborative project between the Universities of Turin and Florence (Italy) supported by the Centre for Volcanic Risk of the Italian Civil Protection Department (URL: http://www.mirovaweb.it/); Copernicus Browser, Copernicus Data Space Ecosystem, European Space Agency (URL: https://dataspace.copernicus.eu/browser/).
Home Reef
Tonga
18.992°S, 174.775°W; summit elev. -10 m
All times are local (unless otherwise noted)
Discolored plumes continued during November 2022-April 2023
Home Reef is a submarine volcano located in the central Tonga islands between Lateiki (Metis Shoal) and Late Island. The first recorded eruption occurred in the mid-19th century, when an ephemeral island formed. An eruption in 1984 produced a 12-km-high eruption plume, a large volume of floating pumice, and an ephemeral island 500 x 1,500 m wide, with cliffs 30-50 m high that enclosed a water-filled crater. Another island-forming eruption in 2006 produced widespread pumice rafts that drifted as far as Australia; by 2008 the island had eroded below sea level. The previous eruption occurred during October 2022 and was characterized by a new island-forming eruption, lava effusion, ash plumes, discolored water, and gas-and-steam plumes (BGVN 47:11). This report covers discolored water plumes during November 2022 through April 2023 using satellite data.
Discolored plumes continued during the reporting period and were observed in true color satellite images on clear weather days. Satellite images show light green-yellow discolored water extending W on 8 and 28 November 2022 (figure 31), and SW on 18 November. Light green-yellow plumes extended W on 3 December, S on 13 December, SW on 18 December, and W and S on 23 December (figure 31). On 12 January 2023 discolored green-yellow plumes extended to the NE, E, SE, and N. The plume moved SE on 17 January and NW on 22 January. Faint discolored water in February was visible moving NE on 1 February. A discolored plume extended NW on 8 and 28 March and NW on 13 March (figure 31). During April, clear weather showed green-blue discolored plumes moving S on 2 April, W on 7 April, and NE and S on 12 April. A strong green-yellow discolored plume extended E and NE on 22 April for several kilometers (figure 31).
Geologic Background. Home Reef, a submarine volcano midway between Metis Shoal and Late Island in the central Tonga islands, was first reported active in the mid-19th century, when an ephemeral island formed. An eruption in 1984 produced a 12-km-high eruption plume, large amounts of floating pumice, and an ephemeral 500 x 1,500 m island, with cliffs 30-50 m high that enclosed a water-filled crater. In 2006 an island-forming eruption produced widespread dacitic pumice rafts that drifted as far as Australia. Another island was built during a September-October 2022 eruption.
Information Contacts: Copernicus Browser, Copernicus Data Space Ecosystem, European Space Agency (URL: https://dataspace.copernicus.eu/browser/).
Semisopochnoi (United States) — June 2023 Cite this Report
Semisopochnoi
United States
51.93°N, 179.58°E; summit elev. 1221 m
All times are local (unless otherwise noted)
Occasional explosions, ash deposits, and gas-and-steam plumes during December 2022-May 2023
Semisopochnoi is located in the western Aleutians, is 20-km-wide at sea level, and contains an 8-km-wide caldera. The three-peaked Mount Young (formerly Cerberus) was constructed within the caldera during the Holocene. Each of these peaks contains a summit crater; the lava flows on the N flank appear younger than those on the S side. The current eruption period began in early February 2021 and has more recently consisted of intermittent explosions and ash emissions (BGVN 47:12). This report updates activity during December 2022 through May 2023 using daily, weekly, and special reports from the Alaska Volcano Observatory (AVO). AVO monitors the volcano using local seismic and infrasound sensors, satellite data, web cameras, and remote infrasound and lightning networks.
Activity during most of December 2022 was relatively quiet; according to AVO no eruptive or explosive activity was observed since 7 November 2022. Intermittent tremor and occasional small earthquakes were observed in geophysical data. Continuous gas-and-steam emissions were observed from the N crater of Mount Young in webcam images on clear weather days (figure 25). On 24 December, there was a slight increase in earthquake activity and several small possible explosion signals were detected in infrasound data. Eruptive activity resumed on 27 December at the N crater of Mount Young; AVO issued a Volcano Activity Notice (VAN) that reported minor ash deposits on the flanks of Mount Young that extended as far as 1 km from the vent, according to webcam images taken during 27-28 December (figure 26). No ash plumes were observed in webcam or satellite imagery, but a persistent gas-and-steam plume that might have contained some ash rose to 1.5 km altitude. As a result, AVO raised the Aviation Color Code (ACC) to Orange (the second highest level on a four-color scale) and the Volcano Alert Level (VAL) to Watch (the second highest level on a four-level scale). Possible explosions were detected during 21 December 2022 through 1 January 2023 and seismic tremor was recorded during 30-31 December.
During January 2023 eruptive activity continued at the active N crater of Mount Young. Minor ash deposits were observed on the flanks, extending about 2 km SSW, based on webcam images from 1 and 3 January. A possible explosion occurred during 1-2 January based on elevated seismicity recorded on local seismometers and an infrasound signal recorded minutes later by an array at Adak. Though no ash plumes were observed in webcam or satellite imagery, a persistent gas-and-steam plume rose to 1.5 km altitude that might have carried minor traces of ash. Ash deposits were accompanied by periods of elevated seismicity and infrasound signals from the local geophysical network, which AVO reported were likely due to weak explosive activity. Low-level explosive activity was also detected during 2-3 January, with minor gas-and-steam emissions and a new ash deposit that was visible in webcam images. Low-level explosive activity was detected in geophysical data during 4-5 January, with elevated seismicity and infrasound signals observed on local stations. Volcanic tremor was detected during 7-9 January and very weak explosive activity was detected in seismic and infrasound data on 9 January. Weak seismic and infrasound signals were recorded on 17 January, which indicated minor explosive activity, but no ash emissions were observed in clear webcam images; a gas-and-steam plume continued to rise to 1.5 km altitude. During 29-30 January, ash deposits near the summit were observed on fresh snow, according to webcam images.
The active N cone at Mount Young continued to produce a gas-and-steam plume during February, but no ash emissions or explosive events were detected. Seismicity remained elevated with faint tremor during early February. Gas-and-steam emissions from the N crater were observed in clear webcam images on 11-13 and 16 February; no explosive activity was detected in seismic, infrasound, or satellite data. Seismicity has also decreased, with no significant seismic tremor observed since 25 January. Therefore, the ACC was lowered to Yellow (the second lowest level on a four-color scale) and the VAL was lowered to Advisory (the second lowest level on a four-color scale) on 22 February.
Gas-and-steam emissions persisted during March from the N cone of Mount Young, based on clear webcam images. A few brief episodes of weak tremor were detected in seismic data, although seismicity decreased over the month. A gas-and-steam plume detected in satellite data extended 150 km on 18 March. Low-level ash emissions from the N cone at Mount Young were observed in several webcam images during 18-19 March, in addition to small explosions and volcanic tremor. The ACC was raised to Orange and the VAL increased to Watch on 19 March. A small explosion was detected in seismic and infrasound data on 21 March.
Low-level unrest continued during April, although cloudy weather often obscured views of the summit; periods of seismic tremor and local earthquakes were recorded. During 3-4 April a gas-and-steam plume was visible traveling more than 200 km overnight; no ash was evident in the plume, according to AVO. A gas-and-steam plume was observed during 4-6 April that extended 400 km but did not seem to contain ash. Small explosions were detected in seismic and infrasound data on 5 April. Occasional clear webcam images showed continuing gas-and-steam emissions rose from Mount Young, but no ash deposits were observed on the snow. On 19 April small explosions and tremor were detected in seismic and infrasound data. A period of seismic tremor was detected during 22-25 April, with possible weak explosions on 25 April. Ash deposits were visible near the crater rim, but it was unclear if these deposits were recent or due to older deposits.
Occasional small earthquakes were recorded during May, but there were no signs of explosive activity seen in geophysical data. Gas-and-steam emissions continued from the N crater of Mount Young, based on webcam images, and seismicity remained slightly elevated. A new, light ash deposit was visible during the morning of 5 May on fresh snow on the NW flank of Mount Young. During 10 May periods of volcanic tremor were observed. The ACC was lowered to Yellow and the VAL to Advisory on 17 May due to no additional evidence of activity.
Geologic Background. Semisopochnoi, the largest subaerial volcano of the western Aleutians, is 20 km wide at sea level and contains an 8-km-wide caldera. It formed as a result of collapse of a low-angle, dominantly basaltic volcano following the eruption of a large volume of dacitic pumice. The high point of the island is Anvil Peak, a double-peaked late-Pleistocene cone that forms much of the island's northern part. The three-peaked Mount Cerberus (renamed Mount Young in 2023) was constructed within the caldera during the Holocene. Each of the peaks contains a summit crater; lava flows on the N flank appear younger than those on the south side. Other post-caldera volcanoes include the symmetrical Sugarloaf Peak SSE of the caldera and Lakeshore Cone, a small cinder cone at the edge of Fenner Lake in the NE part of the caldera. Most documented eruptions have originated from Young, although Coats (1950) considered that both Sugarloaf and Lakeshore Cone could have been recently active.
Information Contacts: Alaska Volcano Observatory (AVO), a cooperative program of a) U.S. Geological Survey, 4200 University Drive, Anchorage, AK 99508-4667 USA (URL: https://avo.alaska.edu/), b) Geophysical Institute, University of Alaska, PO Box 757320, Fairbanks, AK 99775-7320, USA, and c) Alaska Division of Geological & Geophysical Surveys, 794 University Ave., Suite 200, Fairbanks, AK 99709, USA (URL: http://dggs.alaska.gov/).
Ambae
Vanuatu
15.389°S, 167.835°E; summit elev. 1496 m
All times are local (unless otherwise noted)
New lava flow, ash plumes, and sulfur dioxide plumes during February-May 2023
Ambae, also known as Aoba, is a large basaltic shield volcano in Vanuatu. A broad pyroclastic cone containing three crater lakes (Manaro Ngoru, Voui, and Manaro Lakua) is located at the summit within the youngest of at least two nested calderas. Periodic phreatic and pyroclastic explosions have been reported since the 16th century. A large eruption more than 400 years ago resulted in a volcanic cone within the summit crater that is now filled by Lake Voui; the similarly sized Lake Manaro fills the western third of the caldera. The previous eruption ended in August 2022 that was characterized by gas-and-steam and ash emissions and explosions of wet tephra (BGVN 47:10). This report covers a new eruption during February through May 2023 that consisted of a new lava flow, ash plumes, and sulfur dioxide emissions, using information from the Vanuatu Meteorology and Geo-Hazards Department (VMGD) and satellite data.
During the reporting period, the Alert Level remained at a 2 (on a scale of 0-5), which has been in place since December 2021. Activity during October 2022 through March 2023 remained relatively low and mostly consisted of gas-and-steam emissions in Lake Voui. VMGD reported that at 1300 on 15 November a satellite image captured a strong amount of sulfur dioxide rising above the volcano (figure 99), and that seismicity slightly increased. The southern and northern part of the island reported a strong sulfur dioxide smell and heard explosions. On 20 February 2023 a gas-and-ash plume rose 1.3 km above the summit and drifted SSW, according to a webcam image (figure 100). Gas-and-steam and possibly ash emissions continued on 23 February and volcanic earthquakes were recorded by the seismic network.
During April, volcanic earthquakes and gas-and-steam and ash emissions were reported from the cone in Lake Voui. VMGD reported that activity increased during 5-7 April; high gas-and-steam and ash plumes were visible, accompanied by nighttime incandescence. According to a Wellington VAAC report, a low-level ash plume rose as high as 2.5 km above the summit and drifted W and SW on 5 April, based on satellite imagery. Reports in Saratamata stated that a dark ash plume drifted to the WSW, but no loud explosion was heard. Webcam images from 2100 showed incandescence above the crater and reflected in the clouds. According to an aerial survey, field observations, and satellite data, water was no longer present in the lake. A lava flow was reported effusing from the vent and traveling N into the dry Lake Voui, which lasted three days. The next morning at 0745 on 6 April a gas-and-steam and ash plume rose 5.4 km above the summit and drifted ESE, based on information from VMGD (figure 101). The Wellington VAAC also reported that light ashfall was observed on the island. Intermittent gas-and-steam and ash emissions were visible on 7 April, some of which rose to an estimated 3 km above the summit and drifted E. Webcam images during 0107-0730 on 7 April showed continuing ash emissions. A gas-and-steam and ash plume rose 695 m above the summit crater at 0730 on 19 April and drifted ESE, based on a webcam image (figure 102).
According to visual and infrared satellite data, water was visible in Lake Voui as late as 24 March 2023 (figure 103). The vent in the caldera showed a gas-and-steam plume drifted SE. On 3 April thermal activity was first detected, accompanied by a gas-and-ash plume that drifted W (figure 103). The lava flow moved N within the dry lake and was shown cooling by 8 April. By 23 April much of the water in the lake had returned. Occasional sulfur dioxide plumes were detected by the TROPOMI instrument on the Sentinel-5P satellite that exceeded 2 Dobson Units (DU) and drifted in different directions (figure 104).
Geologic Background. The island of Ambae, also known as Aoba, is a massive 2,500 km3 basaltic shield that is the most voluminous volcano of the New Hebrides archipelago. A pronounced NE-SW-trending rift zone with numerous scoria cones gives the 16 x 38 km island an elongated form. A broad pyroclastic cone containing three crater lakes (Manaro Ngoru, Voui, and Manaro Lakua) is located at the summit within the youngest of at least two nested calderas, the largest of which is 6 km in diameter. That large central edifice is also called Manaro Voui or Lombenben volcano. Post-caldera explosive eruptions formed the summit craters about 360 years ago. A tuff cone was constructed within Lake Voui (or Vui) about 60 years later. The latest known flank eruption, about 300 years ago, destroyed the population of the Nduindui area near the western coast.
Information Contacts: Geo-Hazards Division, Vanuatu Meteorology and Geo-Hazards Department (VMGD), Ministry of Climate Change Adaptation, Meteorology, Geo-Hazards, Energy, Environment and Disaster Management, Private Mail Bag 9054, Lini Highway, Port Vila, Vanuatu (URL: http://www.vmgd.gov.vu/, https://www.facebook.com/VanuatuGeohazardsObservatory/); Wellington Volcanic Ash Advisory Centre (VAAC), Meteorological Service of New Zealand Ltd (MetService), PO Box 722, Wellington, New Zealand (URL: http://www.metservice.com/vaac/, http://www.ssd.noaa.gov/VAAC/OTH/NZ/messages.html); MIROVA (Middle InfraRed Observation of Volcanic Activity), a collaborative project between the Universities of Turin and Florence (Italy) supported by the Centre for Volcanic Risk of the Italian Civil Protection Department (URL: http://www.mirovaweb.it/); Global Sulfur Dioxide Monitoring Page, Atmospheric Chemistry and Dynamics Laboratory, NASA Goddard Space Flight Center (NASA/GSFC), 8800 Greenbelt Road, Goddard, Maryland, USA (URL: https://so2.gsfc.nasa.gov/); Copernicus Browser, Copernicus Data Space Ecosystem, European Space Agency (URL: https://dataspace.copernicus.eu/browser/).
Ibu
Indonesia
1.488°N, 127.63°E; summit elev. 1325 m
All times are local (unless otherwise noted)
Daily ash explosions continue, along with thermal anomalies in the crater, October 2022-May 2023
Persistent eruptive activity since April 2008 at Ibu, a stratovolcano on Indonesian’s Halmahera Island, has consisted of daily explosive ash emissions and plumes, along with observations of thermal anomalies (BGVN 47:04). The current eruption continued during October 2022-May 2023, described below, based on advisories issued by the Pusat Vulkanologi dan Mitigasi Bencana Geologi (PVMBG, also known as Indonesian Center for Volcanology and Geological Hazard Mitigation, CVGHM), daily reports by MAGMA Indonesia (a PVMBG platform), and the Darwin Volcanic Ash Advisory Centre (VAAC), and various satellite data. The Alert Level during the reporting period remained at 2 (on a scale of 1-4), except raised briefly to 3 on 27 May, and the public was warned to stay at least 2 km away from the active crater and 3.5 km away on the N side of the volcano.
According to MAGMA Indonesia, during October 2022-May 2023, daily gray-and-white ash plumes of variable densities rose 200-1,000 m above the summit and drifted in multiple directions. On 30 October and 11 November, plumes rose a maximum of 2 km and 1.5 km above the summit, respectively (figures 42 and 43). According to the Darwin VAAC, discrete ash emissions on 13 November rose to 2.1 km altitude, or 800 m above the summit, and drifted W, and multiple ash emissions on 15 November rose 1.4 km above the summit and drifted NE. Occasional larger ash explosions through May 2023 prompted PVMBG to issue Volcano Observatory Notice for Aviation (VONA) alerts (table 6); the Aviation Color Code remained at Orange throughout this period.
Table 6. Volcano Observatory Notice for Aviation (VONA) ash plume alerts for Ibu issued by PVMBG during October 2022-May 2023. Maximum height above the summit was estimated by a ground observer. VONAs in January-May 2023 all described the ash plumes as dense.
| Date |
Time (local) |
Max height above summit |
Direction |
| 17 Oct 2022 |
0858 |
800 m |
SW |
| 18 Oct 2022 |
1425 |
800 m |
S |
| 19 Oct 2022 |
2017 |
600 m |
SW |
| 21 Oct 2022 |
0916 |
800 m |
NW |
| 16 Jan 2023 |
1959 |
600 m |
NE |
| 22 Jan 2023 |
0942 |
1,000 m |
E |
| 29 Jan 2023 |
2138 |
1,000 m |
E |
| 10 May 2023 |
0940 |
800 m |
NW |
| 10 May 2023 |
2035 |
600 m |
E |
| 21 May 2023 |
2021 |
600 m |
W |
| 21 May 2023 |
2140 |
1,000 m |
W |
| 29 May 2023 |
1342 |
800 m |
N |
| 31 May 2023 |
1011 |
1,000 m |
SW |
Sentinel-2 L1C satellite images throughout the reporting period show two, sometimes three persistent thermal anomalies in the summit crater, with the most prominent hotspot from the top of a cone within the crater. Clear views were more common during March-April 2023, when a vent and lava flows on the NE flank of the intra-crater cone could be distinguished (figure 44). White-to-grayish emissions were also observed during brief periods when weather clouds allowed clear views.
The MIROVA space-based volcano hotspot detection system recorded almost daily thermal anomalies throughout the reporting period, though cloud cover often interfered with detections. Data from imaging spectroradiometers aboard NASA’s Aqua and Terra satellites and processed using the MODVOLC algorithm (MODIS-MODVOLC) recorded hotspots on one day during October 2022 and December 2022, two days in April 2023, three days in November 2022 and May 2023, and four days in March 2023.
Geologic Background. The truncated summit of Gunung Ibu stratovolcano along the NW coast of Halmahera Island has large nested summit craters. The inner crater, 1 km wide and 400 m deep, has contained several small crater lakes. The 1.2-km-wide outer crater is breached on the N, creating a steep-walled valley. A large cone grew ENE of the summit, and a smaller one to the WSW has fed a lava flow down the W flank. A group of maars is located below the N and W flanks. The first observed and recorded eruption was a small explosion from the summit crater in 1911. Eruptive activity began again in December 1998, producing a lava dome that eventually covered much of the floor of the inner summit crater along with ongoing explosive ash emissions.
Information Contacts: Pusat Vulkanologi dan Mitigasi Bencana Geologi (PVMBG, also known as Indonesian Center for Volcanology and Geological Hazard Mitigation, CVGHM), Jalan Diponegoro 57, Bandung 40122, Indonesia (URL: http://www.vsi.esdm.go.id/); MAGMA Indonesia (Multiplatform Application for Geohazard Mitigation and Assessment in Indonesia), Kementerian Energi dan Sumber Daya Mineral (URL: https://magma.esdm.go.id/v1); Copernicus Browser, Copernicus Data Space Ecosystem, European Space Agency (URL: https://dataspace.copernicus.eu/browser/); MIROVA (Middle InfraRed Observation of Volcanic Activity), a collaborative project between the Universities of Turin and Florence (Italy) supported by the Centre for Volcanic Risk of the Italian Civil Protection Department (URL: http://www.mirovaweb.it/); Hawai'i Institute of Geophysics and Planetology (HIGP) - MODVOLC Thermal Alerts System, School of Ocean and Earth Science and Technology (SOEST), Univ. of Hawai'i, 2525 Correa Road, Honolulu, HI 96822, USA (URL: http://modis.higp.hawaii.edu/).
Dukono
Indonesia
1.6992°N, 127.8783°E; summit elev. 1273 m
All times are local (unless otherwise noted)
Continuing ash emissions, SO2 plumes, and thermal signals during October 2022-May 2023
Dukono, a remote volcano on Indonesia’s Halmahera Island, has been erupting continuously since 1933, with frequent ash explosions and sulfur dioxide plumes (BGVN 46:11, 47:10). This activity continued during October 2022 through May 2023, based on reports from the Pusat Vulkanologi dan Mitigasi Bencana Geologi (PVMBG; also known as Indonesian Center for Volcanology and Geological Hazard Mitigation, CVGHM), the Darwin Volcanic Ash Advisory Centre (VAAC), and satellite data. During this period, the Alert Level remained at 2 (on a scale of 1-4) and the public was warned to remain outside of the 2-km exclusion zone. The highest reported plume of the period reached 9.4 km above the summit on 14 November 2022.
According to MAGMA Indonesia (a platform developed by PVMBG), white, gray, or dark plumes of variable densities were observed almost every day during the reporting period, except when fog obscured the volcano (figure 33). Plumes generally rose 25-450 m above the summit, but rose as high as 700-800 m on several days, somewhat lower than the maximum heights reached earlier in 2022 when plumes reached as high as 1 km. However, the Darwin VAAC reported that on 14 November 2022, a discrete ash plume rose 9.4 km above the summit (10.7 km altitude), accompanied by a strong hotspot and a sulfur dioxide signal observed in satellite imagery; a continuous ash plume that day and through the 15th rose to 2.1-2.4 km altitude and drifted NE.
Sentinel-2 images were obscured by weather clouds almost every viewing day during the reporting period. However, the few reasonably clear images showed a hotspot and white or gray emissions and plumes. Strong SO2 plumes from Dukono were present on many days during October 2022-May 2023, as detected using the TROPOMI instrument on the Sentinel-5P satellite (figure 34).
Geologic Background. Reports from this remote volcano in northernmost Halmahera are rare, but Dukono has been one of Indonesia's most active volcanoes. More-or-less continuous explosive eruptions, sometimes accompanied by lava flows, have occurred since 1933. During a major eruption in 1550 CE, a lava flow filled in the strait between Halmahera and the N-flank Gunung Mamuya cone. This complex volcano presents a broad, low profile with multiple summit peaks and overlapping craters. Malupang Wariang, 1 km SW of the summit crater complex, contains a 700 x 570 m crater that has also been active during historical time.
Information Contacts: Pusat Vulkanologi dan Mitigasi Bencana Geologi (PVMBG, also known as Indonesian Center for Volcanology and Geological Hazard Mitigation, CVGHM), Jalan Diponegoro 57, Bandung 40122, Indonesia (URL: http://www.vsi.esdm.go.id/); MAGMA Indonesia (Multiplatform Application for Geohazard Mitigation and Assessment in Indonesia), Kementerian Energi dan Sumber Daya Mineral (URL: https://magma.esdm.go.id/v1); Darwin Volcanic Ash Advisory Centre (VAAC), Bureau of Meteorology, Northern Territory Regional Office, PO Box 40050, Casuarina, NT 0811, Australia (URL: http://www.bom.gov.au/info/vaac/); NASA Global Sulfur Dioxide Monitoring Page, Atmospheric Chemistry and Dynamics Laboratory, NASA Goddard Space Flight Center (NASA/GSFC), 8800 Greenbelt Road, Goddard, Maryland, USA (URL: https://so2.gsfc.nasa.gov/); Sentinel Hub Playground (URL: https://www.sentinel-hub.com/explore/sentinel-playground).
Sabancaya
Peru
15.787°S, 71.857°W; summit elev. 5960 m
All times are local (unless otherwise noted)
Explosions, gas-and-ash plumes, and thermal activity persist during November 2022-April 2023
Sabancaya is located in Peru, NE of Ampato and SE of Hualca Hualca. Eruptions date back to 1750 and have been characterized by explosions, phreatic activity, ash plumes, and ashfall. The current eruption period began in November 2016 and has more recently consisted of daily explosions, gas-and-ash plumes, and thermal activity (BGVN 47:11). This report updates activity during November 2022 through April 2023 using information from Instituto Geophysico del Peru (IGP) that use weekly activity reports and various satellite data.
Intermittent low-to-moderate power thermal anomalies were reported by the MIROVA project during November 2022 through April 2023 (figure 119). There were few short gaps in thermal activity during mid-December 2022, late December-to-early January 2023, late January to mid-February, and late February. According to data recorded by the MODVOLC thermal algorithm, there were a total of eight thermal hotspots: three in November 2022, three in February 2023, one in March, and one in April. On clear weather days, some of this thermal anomaly was visible in infrared satellite imagery showing the active lava dome in the summit crater (figure 120). Almost daily moderate-to-strong sulfur dioxide plumes were recorded during the reporting period by the TROPOMI instrument on the Sentinel-5P satellite (figure 121). Many of these plumes exceeded 2 Dobson Units (DU) and drifted in multiple directions.
IGP reported that moderate activity during November and December 2022 continued; during November, an average number of explosions were reported each week: 30, 33, 36, and 35, and during December, it was 32, 40, 47, 52, and 67. Gas-and-ash plumes in November rose 3-3.5 km above the summit and drifted E, NE, SE, S, N, W, and SW. During December the gas-and-ash plumes rose 2-4 km above the summit and drifted in different directions. There were 1,259 volcanic earthquakes recorded during November and 1,693 during December. Seismicity also included volcano-tectonic-type events that indicate rock fracturing events. Slight inflation was observed in the N part of the volcano near Hualca Hualca (4 km N). Thermal activity was frequently reported in the crater at the active lava dome (figure 120).
Explosive activity continued during January and February 2023. The average number of explosions were reported each week during January (51, 50, 60, and 59) and February (43, 54, 51, and 50). Gas-and-ash plumes rose 1.6-2.9 km above the summit and drifted NW, SW, and W during January and rose 1.4-2.8 above the summit and drifted W, SW, E, SE, N, S, NW, and NE during February. IGP also detected 1,881 volcanic earthquakes during January and 1,661 during February. VT-type earthquakes were also reported. Minor inflation persisted near Hualca Hualca. Satellite imagery showed continuous thermal activity in the crater at the lava dome (figure 120).
During March, the average number of explosions each week was 46, 48, 31, 35, and 22 and during April, it was 29, 41, 31, and 27. Accompanying gas-and-ash plumes rose 1.7-2.6 km above the summit crater and drifted W, SW, NW, S, and SE during March. According to a Buenos Aires Volcano Ash Advisory Center (VAAC) notice, on 22 March at 1800 through 23 March an ash plume rose to 7 km altitude and drifted NW. By 0430 an ash plume rose to 7.6 km altitude and drifted W. On 24 and 26 March continuous ash emissions rose to 7.3 km altitude and drifted SW and on 28 March ash emissions rose to 7.6 km altitude. During April, gas-and-ash plumes rose 1.6-2.5 km above the summit and drifted W, SW, S, NW, NE, and E. Frequent volcanic earthquakes were recorded, with 1,828 in March and 1,077 in April, in addition to VT-type events. Thermal activity continued to be reported in the summit crater at the lava dome (figure 120).
Geologic Background. Sabancaya, located in the saddle NE of Ampato and SE of Hualca Hualca volcanoes, is the youngest of these volcanic centers and the only one to have erupted in historical time. The oldest of the three, Nevado Hualca Hualca, is of probable late-Pliocene to early Pleistocene age. The name Sabancaya (meaning "tongue of fire" in the Quechua language) first appeared in records in 1595 CE, suggesting activity prior to that date. Holocene activity has consisted of Plinian eruptions followed by emission of voluminous andesitic and dacitic lava flows, which form an extensive apron around the volcano on all sides but the south. Records of historical eruptions date back to 1750.
Information Contacts: Instituto Geofisico del Peru (IGP), Centro Vulcanológico Nacional (CENVUL), Calle Badajoz N° 169 Urb. Mayorazgo IV Etapa, Ate, Lima 15012, Perú (URL: https://www.igp.gob.pe/servicios/centro-vulcanologico-nacional/inicio); Buenos Aires Volcanic Ash Advisory Center (VAAC), Servicio Meteorológico Nacional-Fuerza Aérea Argentina, 25 de mayo 658, Buenos Aires, Argentina (URL: http://www.smn.gov.ar/vaac/buenosaires/inicio.php); MIROVA (Middle InfraRed Observation of Volcanic Activity), a collaborative project between the Universities of Turin and Florence (Italy) supported by the Centre for Volcanic Risk of the Italian Civil Protection Department (URL: http://www.mirovaweb.it/); Hawai'i Institute of Geophysics and Planetology (HIGP) - MODVOLC Thermal Alerts System, School of Ocean and Earth Science and Technology (SOEST), Univ. of Hawai'i, 2525 Correa Road, Honolulu, HI 96822, USA (URL: http://modis.higp.hawaii.edu/); NASA Global Sulfur Dioxide Monitoring Page, Atmospheric Chemistry and Dynamics Laboratory, NASA Goddard Space Flight Center (NASA/GSFC), 8800 Greenbelt Road, Goddard MD 20771, USA (URL: https://so2.gsfc.nasa.gov/); Copernicus Browser, Copernicus Data Space Ecosystem, European Space Agency (URL: https://dataspace.copernicus.eu/browser/).
Sheveluch
Russia
56.653°N, 161.36°E; summit elev. 3283 m
All times are local (unless otherwise noted)
Significant explosions destroyed part of the lava-dome complex during April 2023
Sheveluch (also spelled Shiveluch) in Kamchatka, has had at least 60 large eruptions during the last 10,000 years. The summit is truncated by a broad 9-km-wide caldera that is breached to the S, and many lava domes occur on the outer flanks. The lava dome complex was constructed within the large open caldera. Frequent collapses of the dome complex have produced debris avalanches; the resulting deposits cover much of the caldera floor. A major south-flank collapse during a 1964 Plinian explosion produced a scarp in which a “Young Sheveluch” dome began to form in 1980. Repeated episodes of dome formation and destruction since then have produced major and minor ash plumes, pyroclastic flows, block-and-ash flows, and “whaleback domes” of spine-like extrusions in 1993 and 2020 (BGVN 45:11). The current eruption period began in August 1999 and has more recently consisted of lava dome growth, explosions, ash plumes, and avalanches (BGVN 48:01). This report covers a significant explosive eruption during early-to-mid-April 2023 that generated a 20 km altitude ash plume, produced a strong sulfur dioxide plume, and destroyed part of the lava-dome complex; activity described during January through April 2023 use information primarily from the Kamchatka Volcanic Eruptions Response Team (KVERT) and various satellite data.
Satellite data. Activity during the majority of this reporting period was characterized by continued lava dome growth, strong fumarole activity, explosions, and hot avalanches. According to the MODVOLC Thermal Alerts System, 140 hotspots were detected through the reporting period, with 33 recorded in January 2023, 29 in February, 44 in March, and 34 in April. Frequent strong thermal activity was recorded during January 2023 through April, according to the MIROVA (Middle InfraRed Observation of Volcanic Activity) graph and resulted from the continuously growing lava dome (figure 94). A slightly stronger pulse in thermal activity was detected in early-to-mid-April, which represented the significant eruption that destroyed part of the lava-dome complex. Thermal anomalies were also visible in infrared satellite imagery at the summit crater (figure 95).
During January 2023 KVERT reported continued growth of the lava dome, accompanied by strong fumarolic activity, incandescence from the lava dome, explosions, ash plumes, and avalanches. Satellite data showed a daily thermal anomaly over the volcano. Video data showed ash plumes associated with collapses at the dome that generated avalanches that in turn produced ash plumes rising to 3.5 km altitude and drifting 40 km W on 4 January and rising to 7-7.5 km altitude and drifting 15 km SW on 5 January. A gas-and-steam plume containing some ash that was associated with avalanches rose to 5-6 km altitude and extended 52-92 km W on 7 January. Explosions that same day produced ash plumes that rose to 7-7.5 km altitude and drifted 10 km W. According to a Volcano Observatory Notice for Aviation (VONA) issued at 1344 on 19 January, explosions produced an ash cloud that was 15 x 25 km in size and rose to 9.6-10 km altitude, drifting 21-25 km W; as a result, the Aviation Color Code (ACC) was raised to Red (the highest level on a four-color scale). Another VONA issued at 1635 reported that no more ash plumes were observed, and the ACC was lowered to Orange (the second highest level on a four-color scale). On 22 January an ash plume from collapses and avalanches rose to 5 km altitude and drifted 25 km NE and SW; ash plumes associated with collapses extended 70 km NE on 27 and 31 January.
Lava dome growth, fumarolic activity, dome incandescence, and occasional explosions and avalanches continued during February and March. A daily thermal anomaly was visible in satellite data. Explosions on 1 February generated ash plumes that rose to 6.3-6.5 km altitude and extended 15 km NE. Video data showed an ash cloud from avalanches rising to 5.5 km altitude and drifting 5 km SE on 2 February. Satellite data showed gas-and-steam plumes containing some ash rose to 5-5.5 km altitude and drifted 68-110 km ENE and NE on 6 February, to 4.5-5 km altitude and drifted 35 km WNW on 22 February, and to 3.7-4 km altitude and drifted 47 km NE on 28 February. Scientists from the Kamchatka Volcanological Station (KVS) went on a field excursion on 25 February to document the growing lava dome, and although it was cloudy most of the day, nighttime incandescence was visible. Satellite data showed an ash plume extending up to 118 km E during 4-5 March. Video data from 1150 showed an ash cloud from avalanches rose to 3.7-5.5 km altitude and drifted 5-10 km ENE and E on 5 March. On 11 March an ash plume drifted 62 km E. On 27 March ash plumes rose to 3.5 km altitude and drifted 100 km E. Avalanches and constant incandescence at the lava dome was focused on the E and NE slopes on 28 March. A gas-and-steam plume containing some ash rose to 3.5 km altitude and moved 40 km E on 29 March. Ash plumes on 30 March rose to 3.5-3.7 km altitude and drifted 70 km NE.
Similar activity continued during April, with lava dome growth, strong fumarolic activity, incandescence in the dome, occasional explosions, and avalanches. A thermal anomaly persisted throughout the month. During 1-4 April weak ash plumes rose to 2.5-3 km altitude and extended 13-65 km SE and E.
Activity during 11 April 2023. The Institute of Volcanology and Seismology, Far Eastern Branch, Russian Academy of Sciences (IVS FEB RAS) reported a significant increase in seismicity around 0054 on 11 April, as reported by strong explosions detected on 11 April beginning at 0110 that sent ash plumes up to 7-10 km altitude and extended 100-435 km W, WNW, NNW, WSW, and SW. According to a Tokyo VAAC report the ash plume rose to 15.8 km altitude. By 0158 the plume extended over a 75 x 100 km area. According to an IVS FEB RAS report, the eruptive column was not vertical: the initial plume at 0120 on 11 April deviated to the NNE, at 0000 on 12 April, it drifted NW, and by 1900 it drifted SW. KVS reported that significant pulses of activity occurred at around 0200, 0320, and then a stronger phase around 0600. Levin Dmitry took a video from near Békés (3 km away) at around 0600 showing a rising plume; he also reported that a pyroclastic flow traveled across the road behind him as he left the area. According to IVS FEB RAS, the pyroclastic flow traveled several kilometers SSE, stopping a few hundred meters from a bridge on the road between Klyuchi and Petropavlovsk-Kamchatsky.
Ashfall was first observed in Klyuchi (45 km SW) at 0630, and a large, black ash plume blocked light by 0700. At 0729 KVERT issued a Volcano Observatory Notice for Aviation (VONA) raising the Aviation Color Code to Red (the highest level on a four-color scale). It also stated that a large ash plume had risen to 10 km altitude and drifted 100 km W. Near-constant lightning strikes were reported in the plume and sounds like thunderclaps were heard until about 1000. According to IVS FEB RAS the cloud was 200 km long and 76 km wide by 0830, and was spreading W at altitudes of 6-12 km. In the Klyuchi Village, the layer of both ash and snow reached 8.5 cm (figure 96); ashfall was also reported in Kozyrevsk (112 km SW) at 0930, Mayskoye, Anavgay, Atlasovo, Lazo, and Esso. Residents in Klyuchi reported continued darkness and ashfall at 1100. In some areas, ashfall was 6 cm deep and some residents reported dirty water coming from their plumbing. According to IVS FEB RAS, an ash cloud at 1150 rose to 5-20 km altitude and was 400 km long and 250 km wide, extending W. A VONA issued at 1155 reported that ash had risen to 10 km and drifted 340 km NNW and 240 km WSW. According to Simon Carn (Michigan Technological University), about 0.2 Tg of sulfur dioxide in the plume was measured in a satellite image from the TROPOMI instrument on the Sentinel-5P satellite acquired at 1343 that covered an area of about 189,000 km2 (figure 97). Satellite data at 1748 showed an ash plume that rose to 8 km altitude and drifted 430 km WSW and S, according to a VONA.
Activity during 12-15 April 2023. On 12 April at 0730 satellite images showed ash plumes rose to 7-8 km altitude and extended 600 km SW, 1,050 km ESE, and 1,300-3,000 km E. By 1710 that day, the explosions weakened. According to news sources, the ash-and-gas plumes drifted E toward the Aleutian Islands and reached the Gulf of Alaska by 13 April, causing flight disruptions. More than 100 flights involving Alaska airspace were cancelled due to the plume. Satellite data showed ash plumes rising to 4-5.5 km altitude and drifted 400-415 km SE and ESE on 13 April. KVS volcanologists observed the pyroclastic flow deposits and noted that steam rose from downed, smoldering trees. They also noted that the deposits were thin with very few large fragments, which differed from previous flows. The ash clouds traveled across the Pacific Ocean. Flight cancellations were also reported in NW Canada (British Columbia) during 13-14 April. During 14-15 April ash plumes rose to 6 km altitude and drifted 700 km NW.
Alaskan flight schedules were mostly back to normal by 15 April, with only minor delays and far less cancellations; a few cancellations continued to be reported in Canada. Clear weather on 15 April showed that most of the previous lava-dome complex was gone and a new crater roughly 1 km in diameter was observed (figure 98); gas-and-steam emissions were rising from this crater. Evidence suggested that there had been a directed blast to the SE, and pyroclastic flows traveled more than 20 km. An ash plume rose to 4.5-5.2 km altitude and drifted 93-870 km NW on 15 April.
Activity during 16-30 April 2023. Resuspended ash was lifted by the wind from the slopes and rose to 4 km altitude and drifted 224 km NW on 17 April. KVERT reported a plume of resuspended ash from the activity during 10-13 April on 19 April that rose to 3.5-4 km altitude and drifted 146-204 km WNW. During 21-22 April a plume stretched over the Scandinavian Peninsula. A gas-and-steam plume containing some ash rose to 3-3.5 km altitude and drifted 60 km SE on 30 April. A possible new lava dome was visible on the W slope of the volcano on 29-30 April (figure 99); satellite data showed two thermal anomalies, a bright one over the existing lava dome and a weaker one over the possible new one.
References. Girina, O., Loupian, E., Horvath, A., Melnikov, D., Manevich, A., Nuzhdaev, A., Bril, A., Ozerov, A., Kramareva, L., Sorokin, A., 2023, Analysis of the development of the paroxysmal eruption of Sheveluch volcano on April 10–13, 2023, based on data from various satellite systems, ??????????? ???????? ??? ?? ???????, 20(2).
Geologic Background. The high, isolated massif of Sheveluch volcano (also spelled Shiveluch) rises above the lowlands NNE of the Kliuchevskaya volcano group. The 1,300 km3 andesitic volcano is one of Kamchatka's largest and most active volcanic structures, with at least 60 large eruptions during the Holocene. The summit of roughly 65,000-year-old Stary Shiveluch is truncated by a broad 9-km-wide late-Pleistocene caldera breached to the south. Many lava domes occur on its outer flanks. The Molodoy Shiveluch lava dome complex was constructed during the Holocene within the large open caldera; Holocene lava dome extrusion also took place on the flanks of Stary Shiveluch. Widespread tephra layers from these eruptions have provided valuable time markers for dating volcanic events in Kamchatka. Frequent collapses of dome complexes, most recently in 1964, have produced debris avalanches whose deposits cover much of the floor of the breached caldera.
Information Contacts: Kamchatka Volcanic Eruptions Response Team (KVERT), Far Eastern Branch, Russian Academy of Sciences, 9 Piip Blvd., Petropavlovsk-Kamchatsky, 683006, Russia (URL: http://www.kscnet.ru/ivs/kvert/); Institute of Volcanology and Seismology, Far Eastern Branch, Russian Academy of Sciences (IVS FEB RAS), 9 Piip Blvd., Petropavlovsk-Kamchatsky 683006, Russia (URL: http://www.kscnet.ru/ivs/eng/); Kamchatka Volcanological Station, Kamchatka Branch of Geophysical Survey, (KB GS RAS), Klyuchi, Kamchatka Krai, Russia (URL: http://volkstat.ru/); Hawai'i Institute of Geophysics and Planetology (HIGP) - MODVOLC Thermal Alerts System, School of Ocean and Earth Science and Technology (SOEST), Univ. of Hawai'i, 2525 Correa Road, Honolulu, HI 96822, USA (URL: http://modis.higp.hawaii.edu/); MIROVA (Middle InfraRed Observation of Volcanic Activity), a collaborative project between the Universities of Turin and Florence (Italy) supported by the Centre for Volcanic Risk of the Italian Civil Protection Department (URL: http://www.mirovaweb.it/); Copernicus Browser, Copernicus Data Space Ecosystem, European Space Agency (URL: https://dataspace.copernicus.eu/browser/); Kam 24 News Agency, 683032, Kamchatka Territory, Petropavlovsk-Kamchatsky, Vysotnaya St., 2A (URL: https://kam24.ru/news/main/20230411/96657.html#.Cj5Jrky6.dpuf); Simon Carn, Geological and Mining Engineering and Sciences, Michigan Technological University, 1400 Townsend Drive, Houghton, MI 49931, USA (URL: http://www.volcarno.com/, Twitter: @simoncarn).
Bezymianny
Russia
55.972°N, 160.595°E; summit elev. 2882 m
All times are local (unless otherwise noted)
Explosions, ash plumes, lava flows, and avalanches during November 2022-April 2023
Bezymianny is located on the Kamchatka Peninsula of Russia as part of the Klyuchevskoy volcano group. Historic eruptions began in 1955 and have been characterized by dome growth, explosions, pyroclastic flows, ash plumes, and ashfall. During the 1955-56 eruption a large open crater was formed by collapse of the summit and an associated lateral blast. Subsequent episodic but ongoing lava-dome growth, accompanied by intermittent explosive activity and pyroclastic flows, has largely filled the 1956 crater. The current eruption period began in December 2016 and more recent activity has consisted of strong explosions, ash plumes, and thermal activity (BGVN 47:11). This report covers activity during November 2022 through April 2023, based on weekly and daily reports from the Kamchatka Volcano Eruptions Response Team (KVERT) and satellite data.
Activity during November and March 2023 was relatively low and mostly consisted of gas-and-steam emissions, occasional small collapses that generated avalanches along the lava dome slopes, and a persistent thermal anomaly over the volcano that was observed in satellite data on clear weather days. According to the Tokyo VAAC and KVERT, an explosion produced an ash plume that rose to 6 km altitude and drifted 25 km NE at 1825 on 29 March.
Gas-and-steam emissions, collapses generating avalanches, and thermal activity continued during April. According to two Volcano Observatory Notice for Aviation (VONA) issued on 2 and 6 April (local time) ash plumes rose to 3 km and 3.5-3.8 km altitude and drifted 35 km E and 140 km E, respectively. Satellite data from KVERT showed weak ash plumes extending up to 550 km E on 2 and 5-6 April.
A VONA issued at 0843 on 7 April described an ash plume that rose to 4.5-5 km altitude and drifted 250 km ESE. Later that day at 1326 satellite data showed an ash plume that rose to 5.5-6 km altitude and drifted 150 km ESE. A satellite image from 1600 showed an ash plume extending as far as 230 km ESE; KVERT noted that ash emissions were intensifying, likely due to avalanches from the growing lava dome. The Aviation Color Code (ACC) was raised to Red (the highest level on a four-color scale). At 1520 satellite data showed an ash plume rising to 5-5.5 km altitude and drifting 230 km ESE. That same day, Kamchatka Volcanological Station (KVS) volcanologists traveled to Ambon to collect ash; they reported that a notable eruption began at 1730, and within 20 minutes a large ash plume rose to 10 km altitude and drifted NW. KVERT reported that the strong explosive phase began at 1738. Video and satellite data taken at 1738 showed an ash plume that rose to 10-12 km altitude and drifted up to 2,800 km SE and E. Explosions were clearly audible 20 km away for 90 minutes, according to KVS. Significant amounts of ash fell at the Apakhonchich station, which turned the snow gray; ash continued to fall until the morning of 8 April. In a VONA issued at 0906 on 8 April, KVERT stated that the explosive eruption had ended; ash plumes had drifted 2,000 km E. The ACC was lowered to Orange (the third highest level on a four-color scale). The KVS team saw a lava flow on the active dome once the conditions were clear that same day (figure 53). On 20 April lava dome extrusion was reported; lava flows were noted on the flanks of the dome, and according to KVERT satellite data, a thermal anomaly was observed in the area. The ACC was lowered to Yellow (the second lowest on a four-color scale).
Satellite data showed an increase in thermal activity beginning in early April 2023. A total of 31 thermal hotspots were detected by the MODVOLC thermal algorithm on 4, 5, 7, and 12 April 2023. The elevated thermal activity resulted from an increase in explosive activity and the start of an active lava flow. The MIROVA (Middle InfraRed Observation of Volcanic Activity) volcano hotspot detection system based on the analysis of MODIS data also showed a pulse in thermal activity during the same time (figure 54). Infrared satellite imagery captured a continuous thermal anomaly at the summit crater, often accompanied by white gas-and-steam emissions (figure 55). On 4 April 2023 an active lava flow was observed descending the SE flank.
Geologic Background. The modern Bezymianny, much smaller than its massive neighbors Kamen and Kliuchevskoi on the Kamchatka Peninsula, was formed about 4,700 years ago over a late-Pleistocene lava-dome complex and an edifice built about 11,000-7,000 years ago. Three periods of intensified activity have occurred during the past 3,000 years. The latest period, which was preceded by a 1,000-year quiescence, began with the dramatic 1955-56 eruption. This eruption, similar to that of St. Helens in 1980, produced a large open crater that was formed by collapse of the summit and an associated lateral blast. Subsequent episodic but ongoing lava-dome growth, accompanied by intermittent explosive activity and pyroclastic flows, has largely filled the 1956 crater.
Information Contacts: Kamchatka Volcanic Eruptions Response Team (KVERT), Far Eastern Branch, Russian Academy of Sciences, 9 Piip Blvd., Petropavlovsk-Kamchatsky, 683006, Russia (URL: http://www.kscnet.ru/ivs/kvert/); Kamchatka Volcanological Station, Kamchatka Branch of Geophysical Survey, (KB GS RAS), Klyuchi, Kamchatka Krai, Russia (URL: http://volkstat.ru/); Hawai'i Institute of Geophysics and Planetology (HIGP) - MODVOLC Thermal Alerts System, School of Ocean and Earth Science and Technology (SOEST), Univ. of Hawai'i, 2525 Correa Road, Honolulu, HI 96822, USA (URL: http://modis.higp.hawaii.edu/); MIROVA (Middle InfraRed Observation of Volcanic Activity), a collaborative project between the Universities of Turin and Florence (Italy) supported by the Centre for Volcanic Risk of the Italian Civil Protection Department (URL: http://www.mirovaweb.it/); Copernicus Browser, Copernicus Data Space Ecosystem, European Space Agency (URL: https://dataspace.copernicus.eu/browser/).
Chikurachki
Russia
50.324°N, 155.461°E; summit elev. 1781 m
All times are local (unless otherwise noted)
New explosive eruption during late January-early February 2023
Chikurachki, located on Paramushir Island in the northern Kuriles, has had Plinian eruptions during the Holocene. Lava flows have reached the sea and formed capes on the NW coast; several young lava flows are also present on the E flank beneath a scoria deposit. Reported eruptions date back to 1690, with the most recent eruption period occurring during January through October 2022, characterized by occasional explosions, ash plumes, and thermal activity (BGVN 47:11). This report covers a new eruptive period during January through February 2023 that consisted of ash explosions and ash plumes, based on information from the Kamchatka Volcanic Eruptions Response Team (KVERT) and satellite data.
According to reports from KVERT, an explosive eruption began around 0630 on 29 January. Explosions generated ash plumes that rose to 3-3.5 km altitude and drifted 6-75 km SE and E, based on satellite data. As a result, the Aviation Color Code (ACC) was raised to Orange (the second highest level on a four-color scale). At 1406 and 1720 ash plumes were identified in satellite images that rose to 4.3 km altitude and extended 70 km E. By 2320 the ash plume had dissipated. A thermal anomaly was visible at the volcano on 31 January, according to a satellite image, and an ash plume was observed drifting 66 km NE.
Occasional explosions and ash plumes continued during early February. At 0850 on 1 February an ash plume rose to 3.5 km altitude and drifted 35 km NE. Satellite data showed an ash plume that rose to 3.2-3.5 km altitude and drifted 50 km NE at 1222 later that day (figure 22). A thermal anomaly was detected over the volcano during 5-6 February and ash plumes drifted as far as 125 km SE, E, and NE. Explosive events were reported at 0330 on 6 February that produced ash plumes rising to 4-4.5 km altitude and drifting 72-90 km N, NE, and ENE. KVERT noted that the last gas-and steam plume that contained some ash was observed on 8 February and drifted 55 km NE before the explosive eruption ended. The ACC was lowered to Yellow and then Green (the lowest level on a four-color scale) on 18 February.
Geologic Background. Chikurachki, the highest volcano on Paramushir Island in the northern Kuriles, is a relatively small cone constructed on a high Pleistocene edifice. Oxidized basaltic-to-andesitic scoria deposits covering the upper part of the young cone give it a distinctive red color. Frequent basaltic Plinian eruptions have occurred during the Holocene. Lava flows have reached the sea and formed capes on the NW coast; several young lava flows are also present on the E flank beneath a scoria deposit. The Tatarinov group of six volcanic centers is located immediately to the south, and the Lomonosov cinder cone group, the source of an early Holocene lava flow that reached the saddle between it and Fuss Peak to the west, lies at the southern end of the N-S-trending Chikurachki-Tatarinov complex. In contrast to the frequently active Chikurachki, the Tatarinov centers are extensively modified by erosion and have a more complex structure. Tephrochronology gives evidence of an eruption around 1690 CE from Tatarinov, although its southern cone contains a sulfur-encrusted crater with fumaroles that were active along the margin of a crater lake until 1959.
Information Contacts: Kamchatka Volcanic Eruptions Response Team (KVERT), Far East Division, Russian Academy of Sciences, 9 Piip Blvd., Petropavlovsk-Kamchatsky, 683006, Russia (URL: http://www.kscnet.ru/ivs/); Copernicus Browser, Copernicus Data Space Ecosystem, European Space Agency (URL: https://dataspace.copernicus.eu/browser/).
Search Bulletin Archive by Publication Date
Select a month and year from the drop-downs and click "Show Issue" to have that issue displayed in this tab.
The default month and year is the latest issue available.
Bulletin of the Global Volcanism Network - Volume 44, Number 03 (March 2019)
Managing Editor: Edward Venzke
Krakatau (Indonesia)
Ash plumes, ballistic ejecta, and lava extrusion during October-December; partial collapse and tsunami in late December; Surtseyan activity in December-January 2019
Kuchinoerabujima (Japan)
Weak explosions and ash plumes beginning 21 October 2018
Masaya (Nicaragua)
Lava lake persists with decreased thermal output, November 2018-February 2019
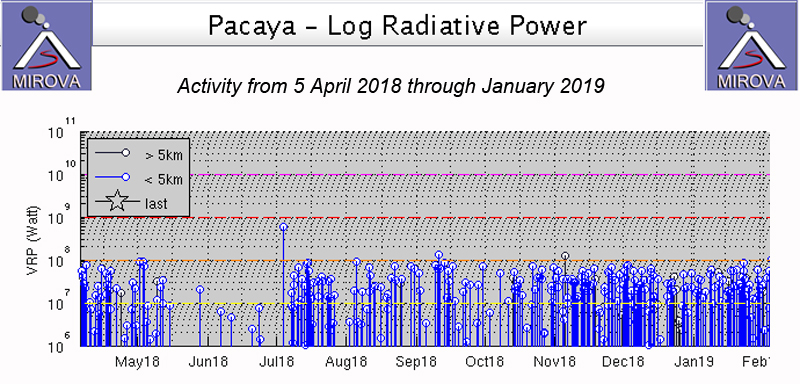
Pacaya (Guatemala)
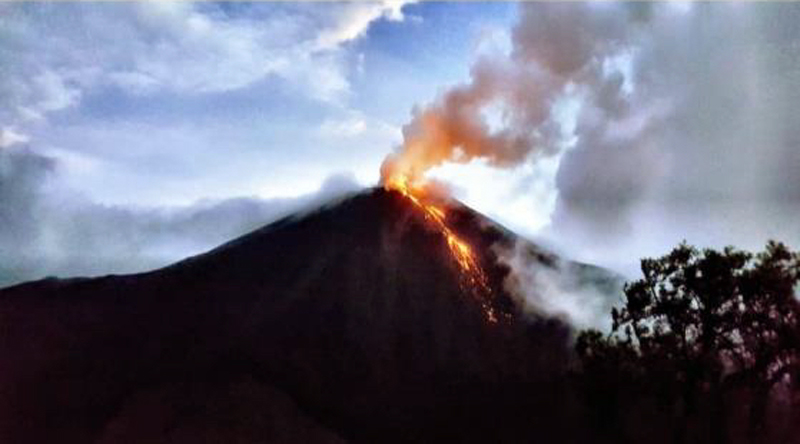
Continuous activity from the cone in Mackenney crater; daily lava flows on the NW flank during October 2018-January 2019
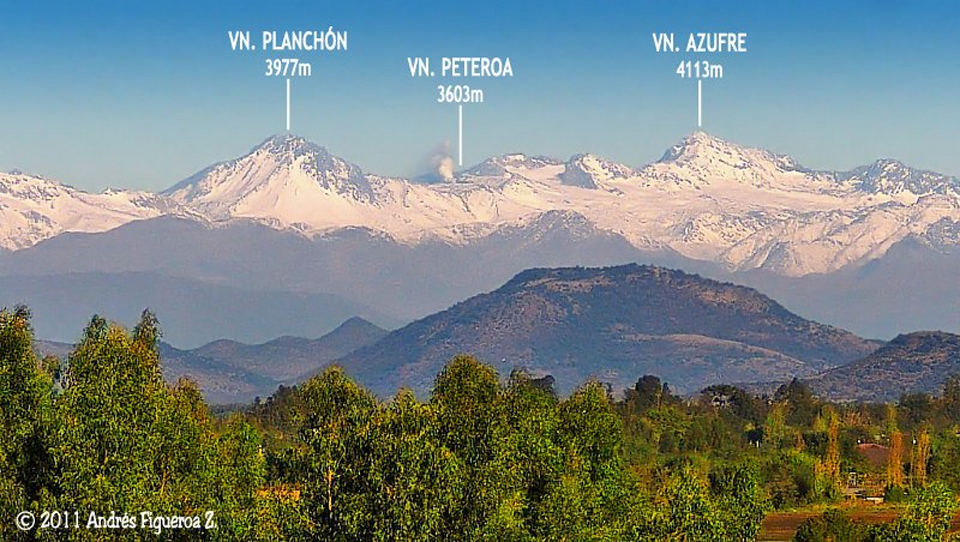
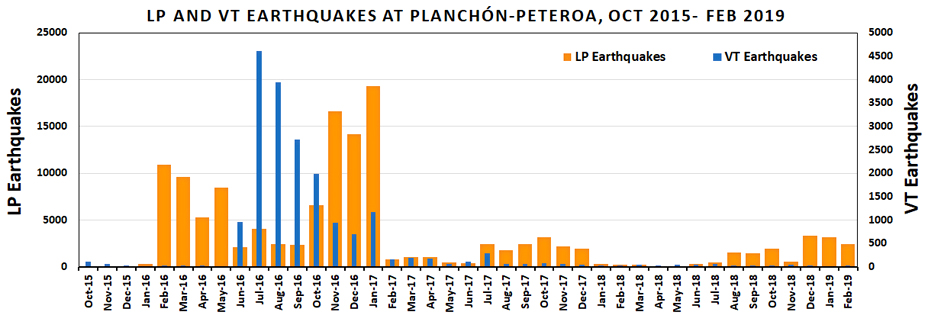
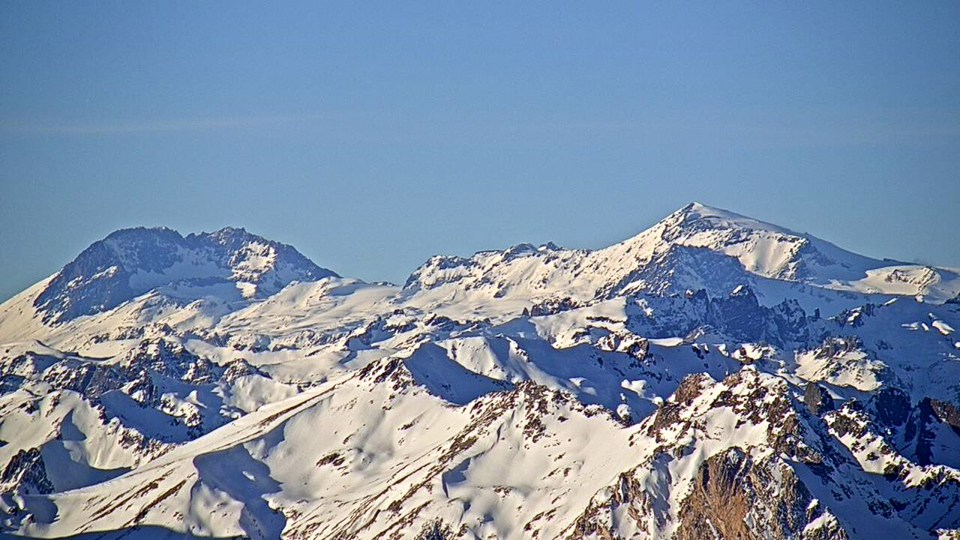
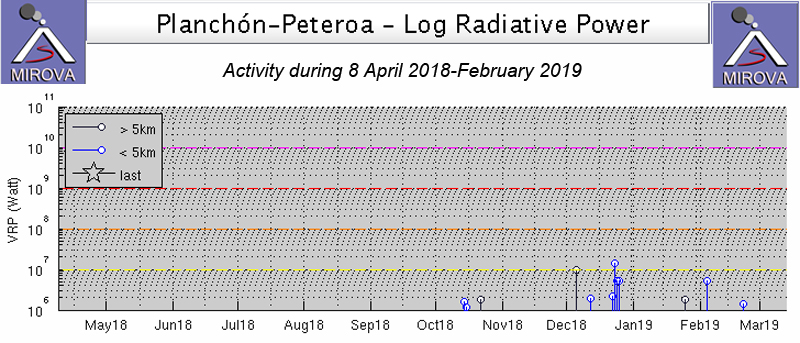
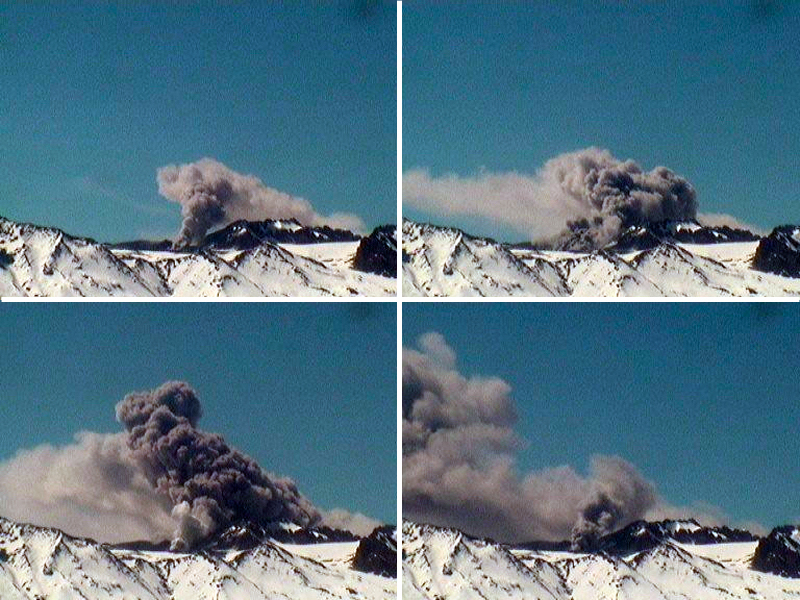
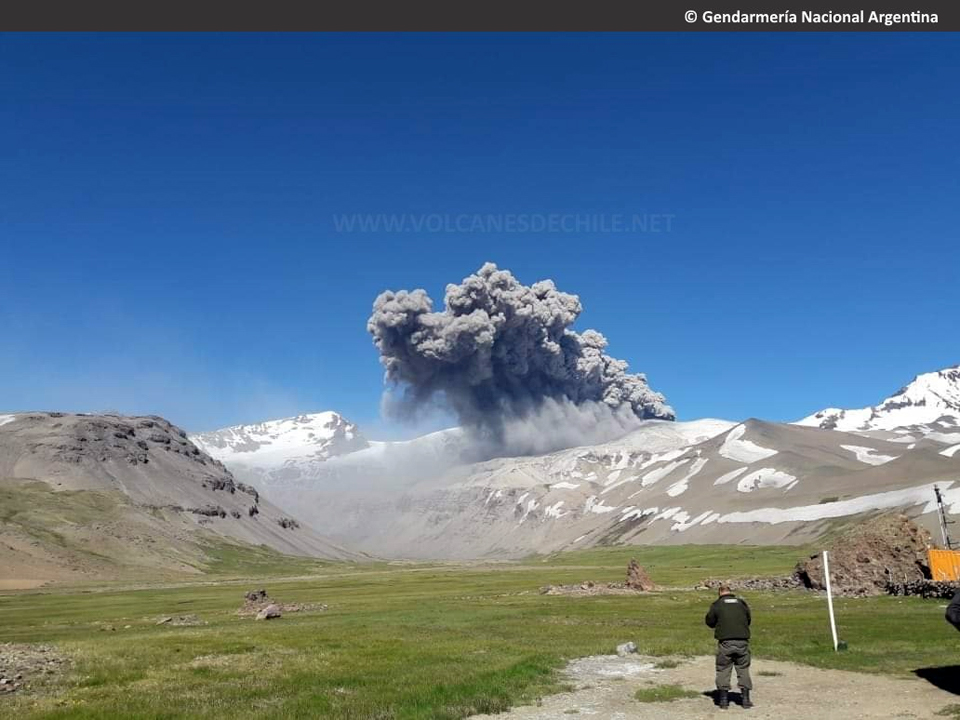
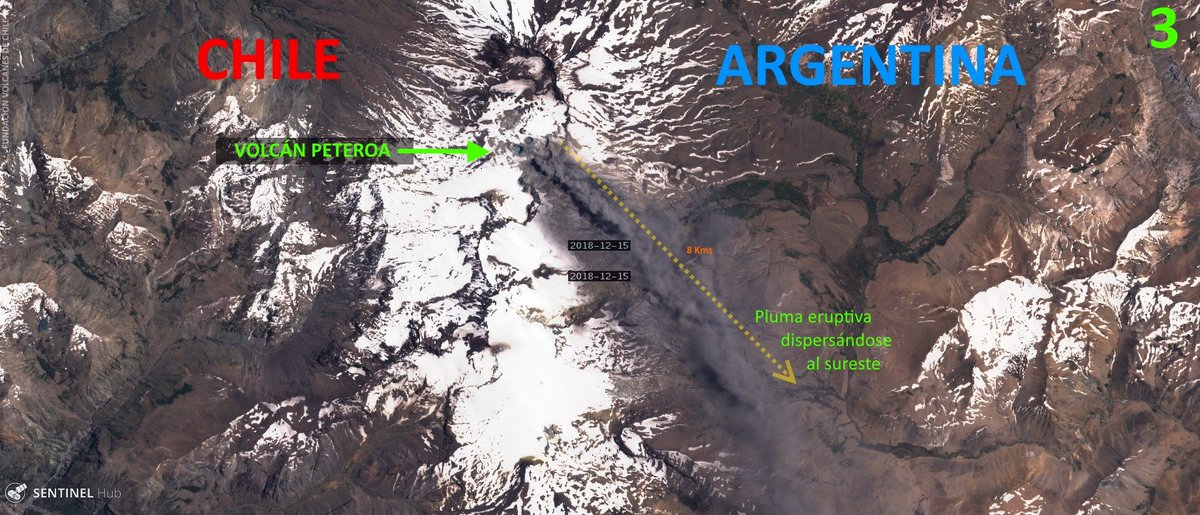
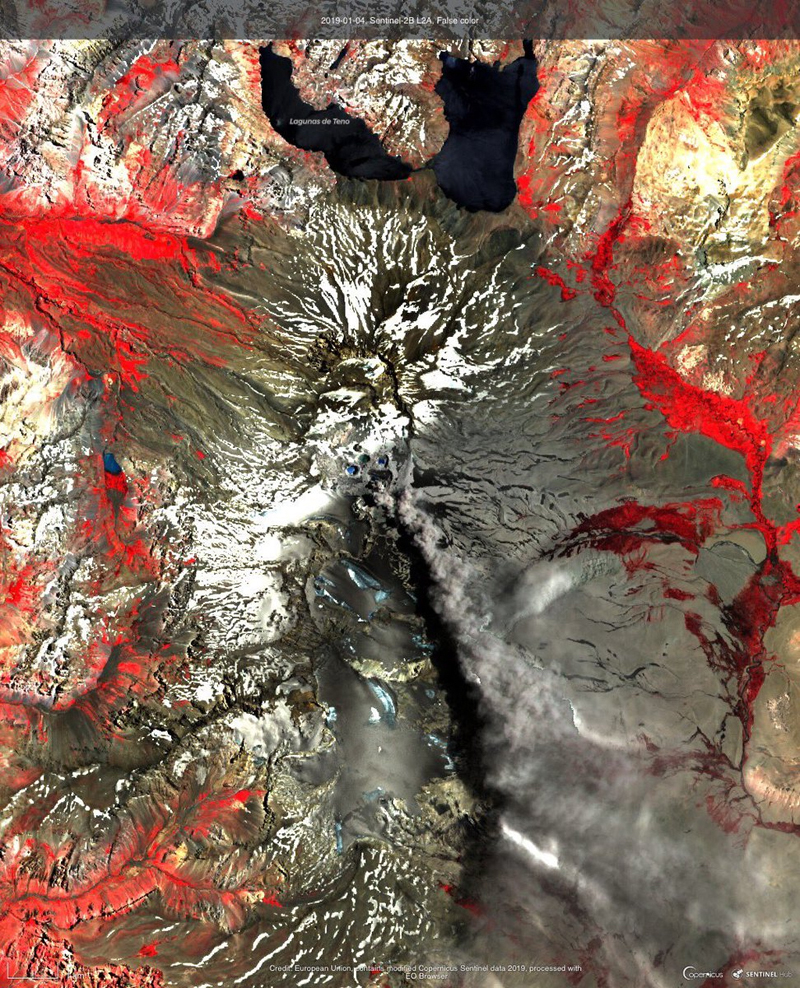
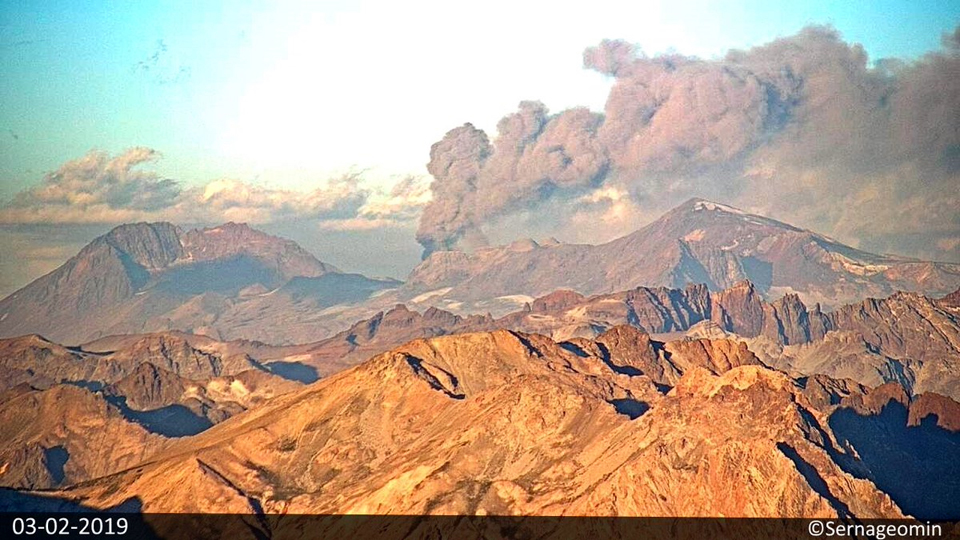
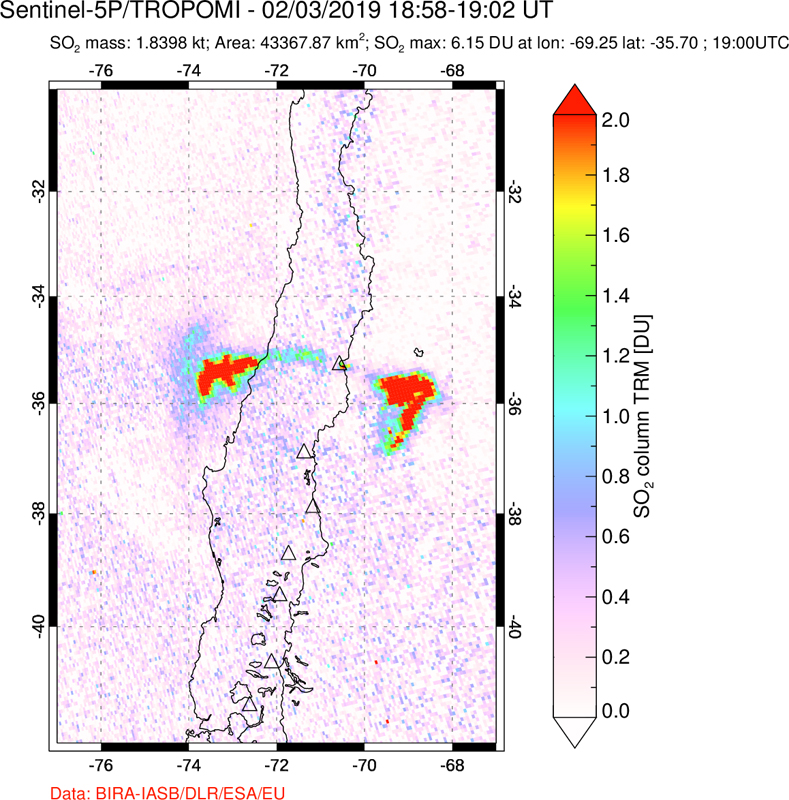
Planchon-Peteroa (Chile)
New eruption begins in September 2018; continuous ash emissions and intermittent explosions December 2018-February 2019
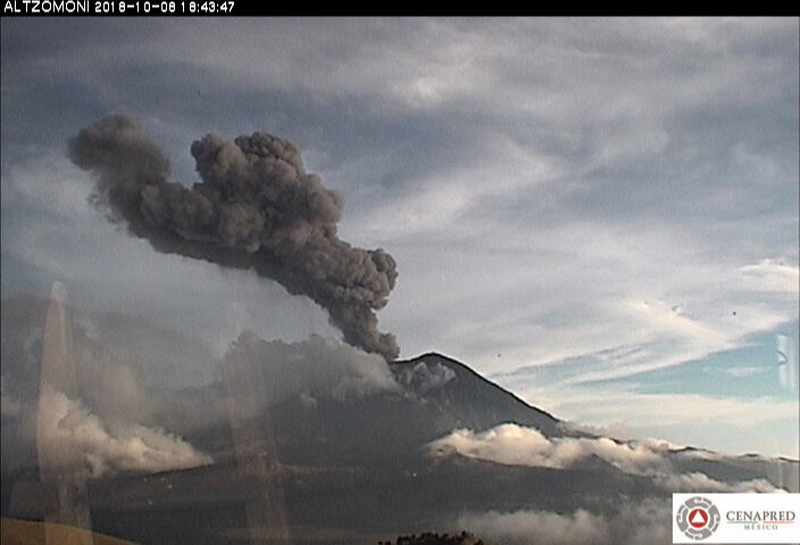
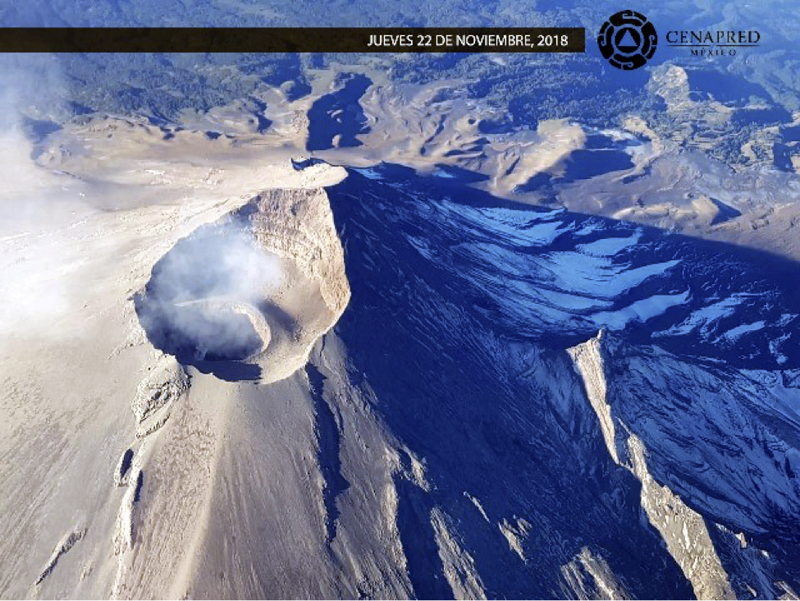
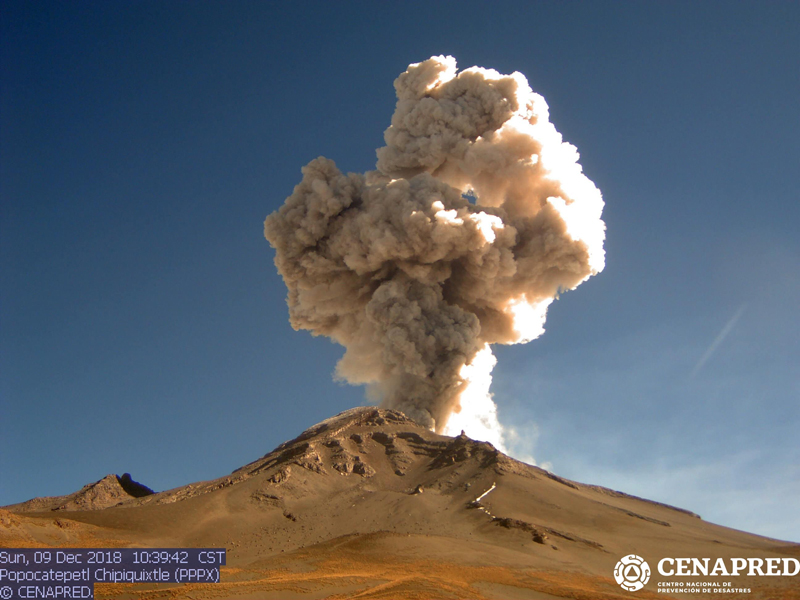
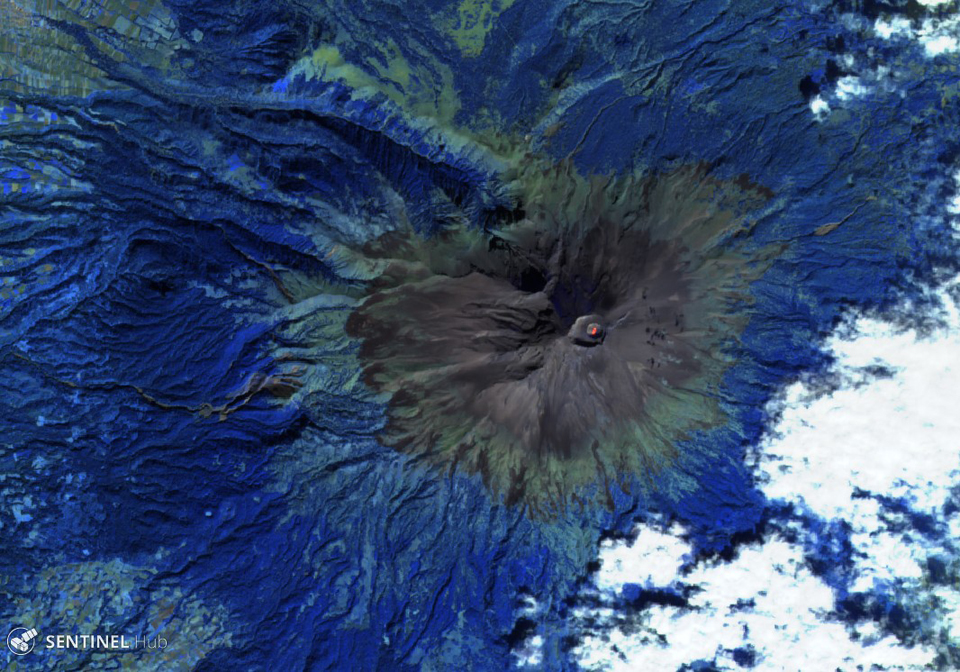
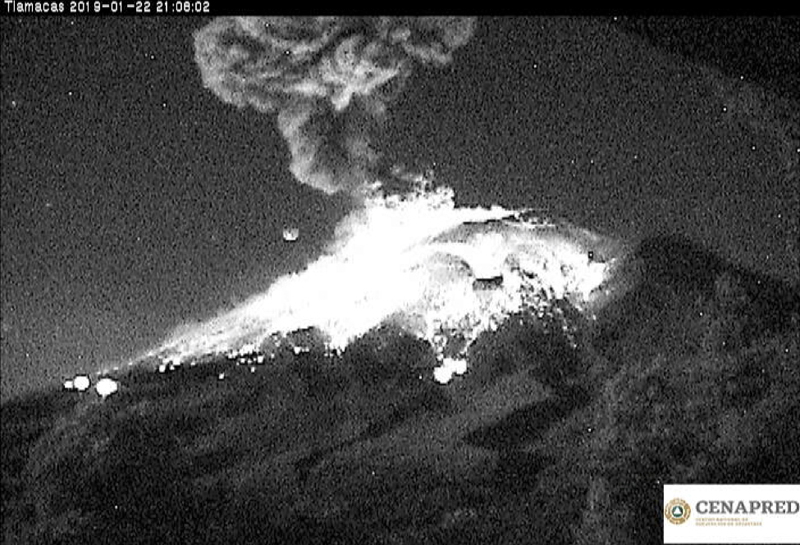
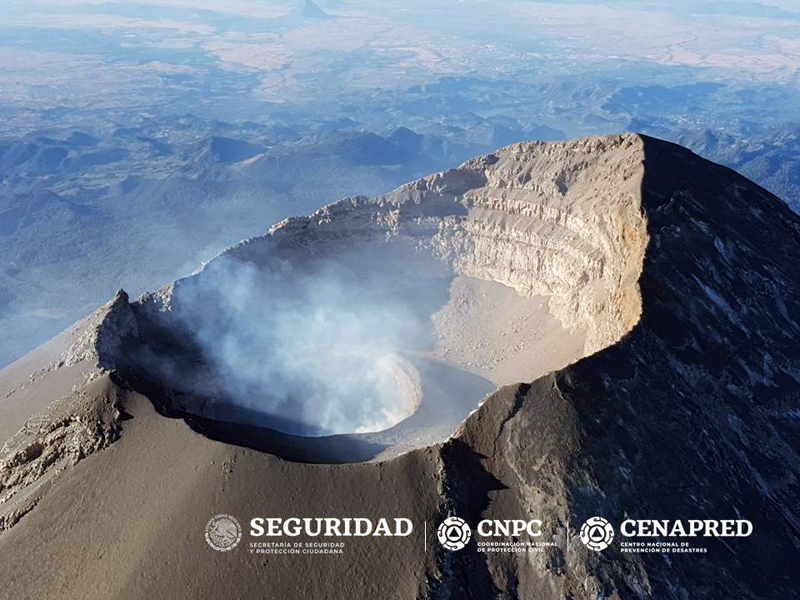
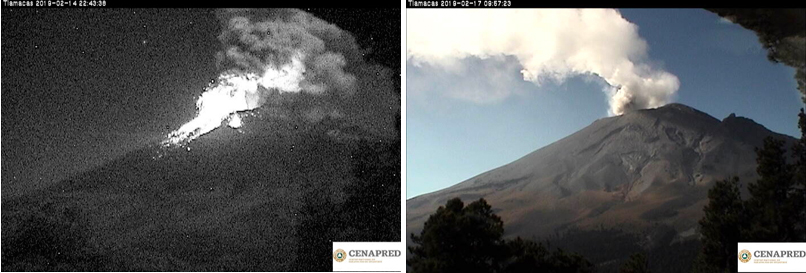
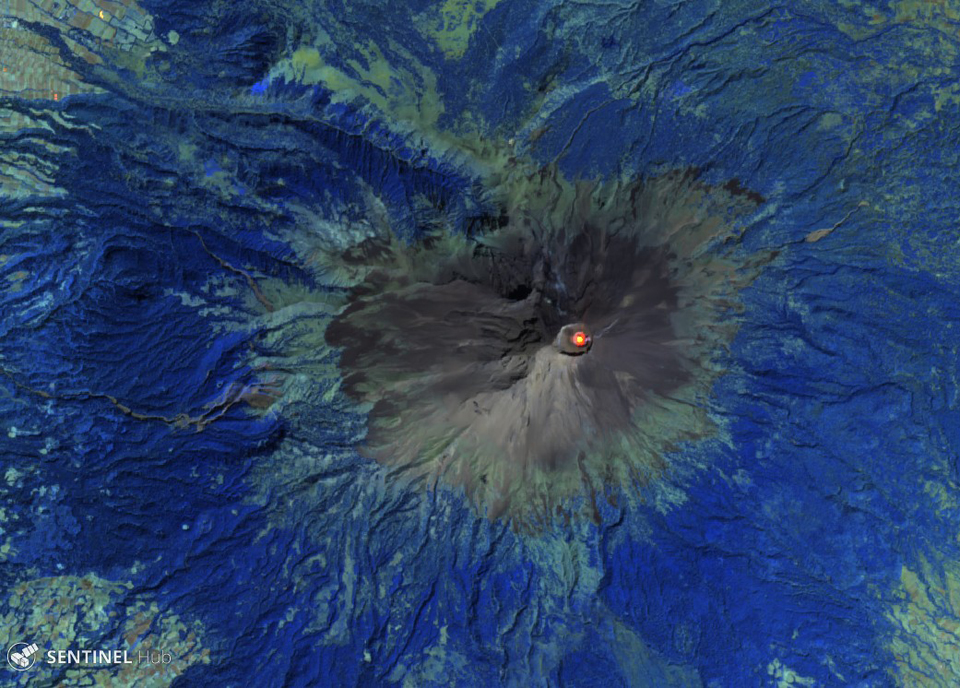
Popocatepetl (Mexico)
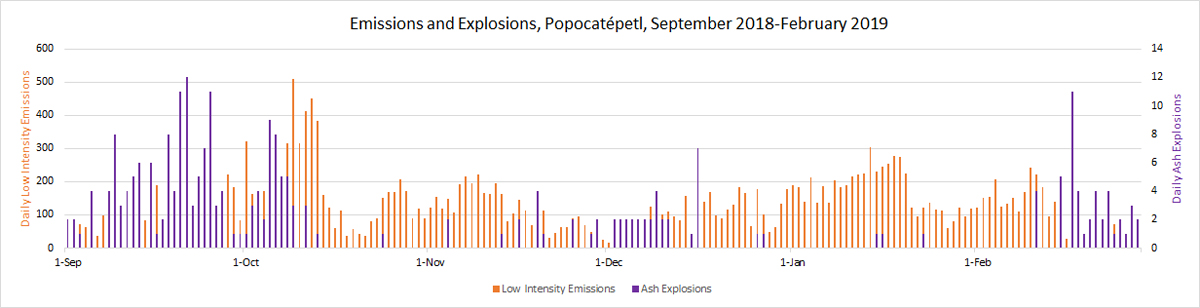
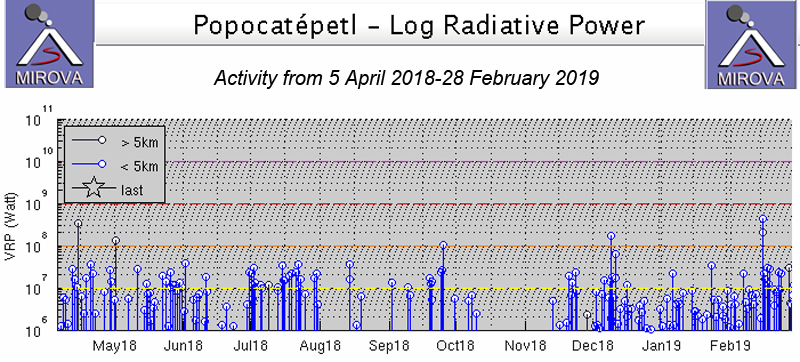
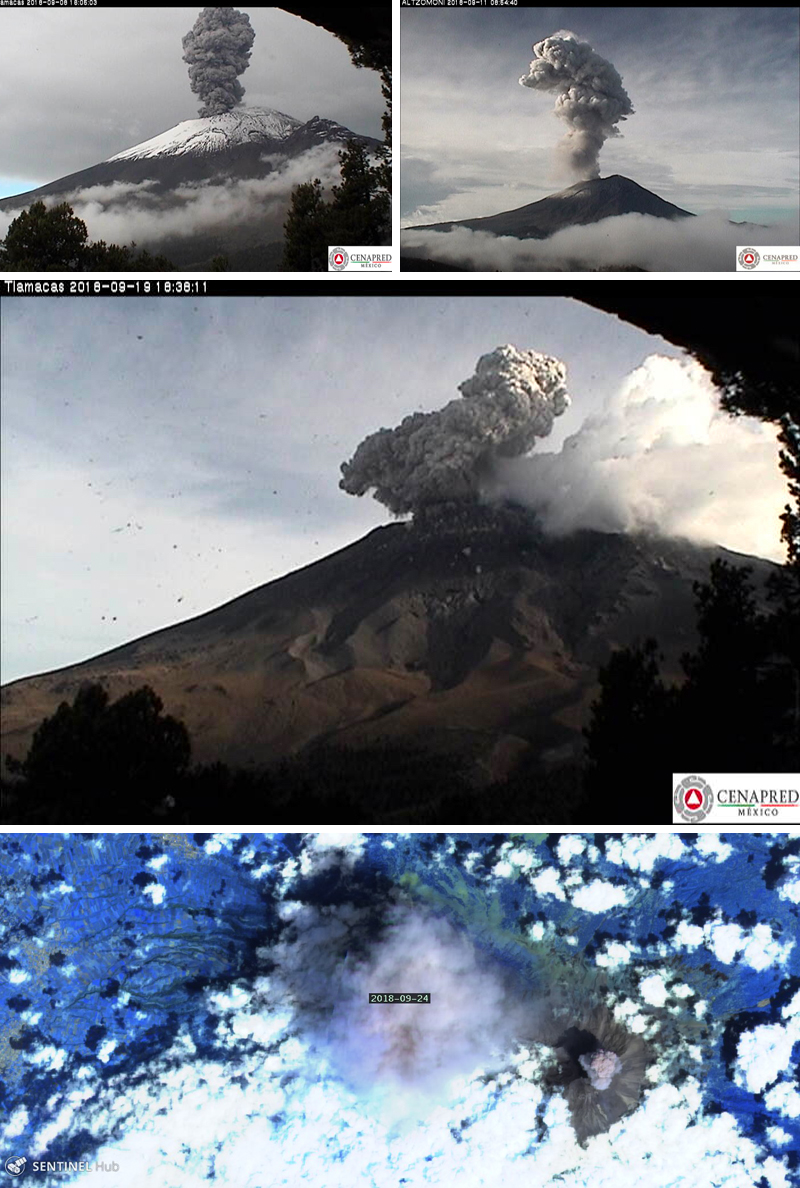
Explosions with ash plumes and incandescent ejecta continue during September 2018-February 2019
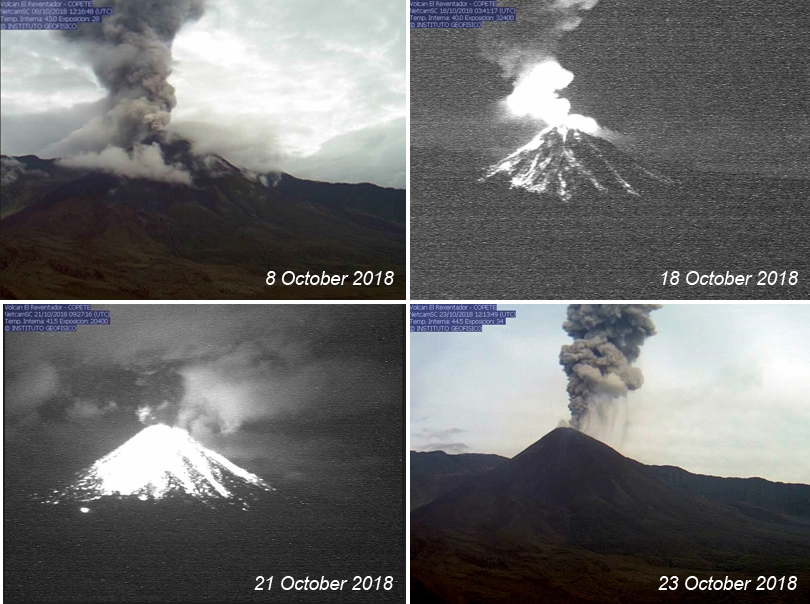
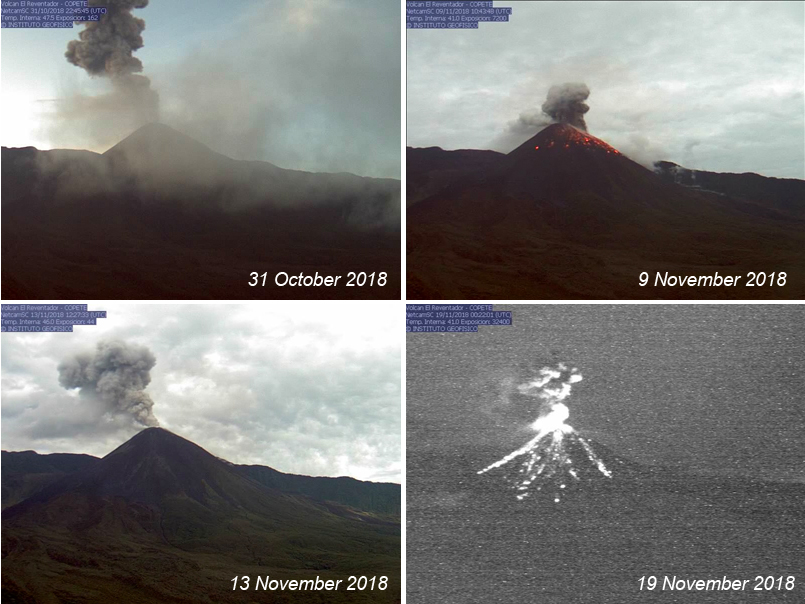
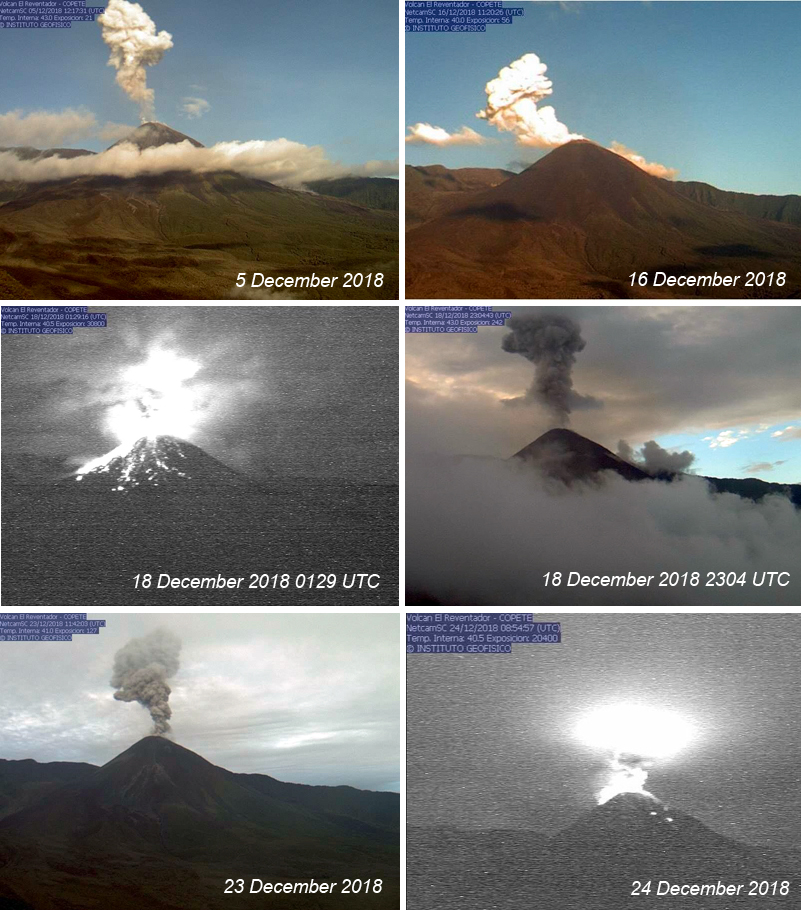
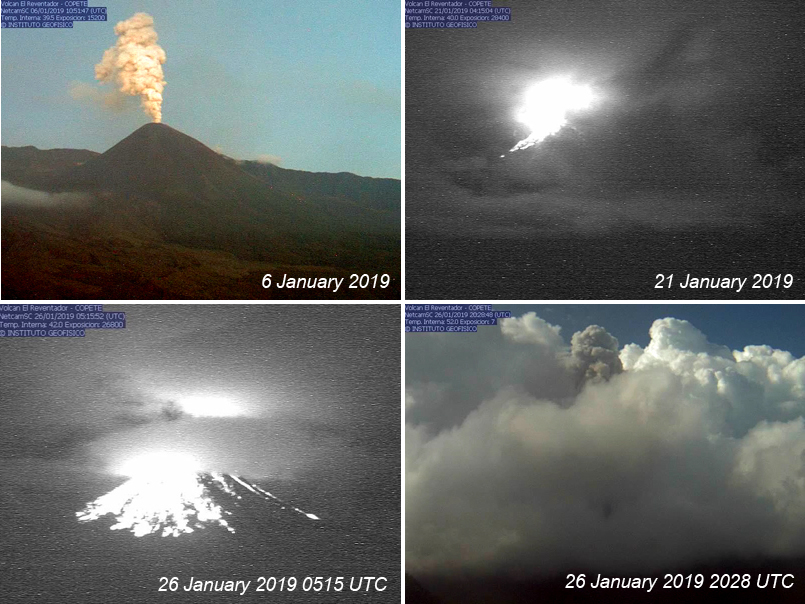
Reventador (Ecuador)
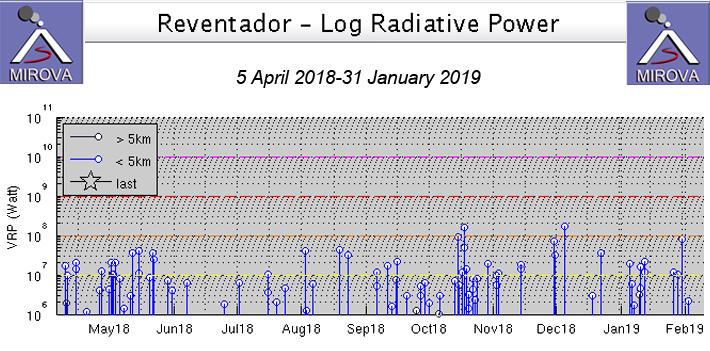
Multiple daily explosions with ash plumes and incandescent blocks rolling down the flanks, October 2018-January 2019
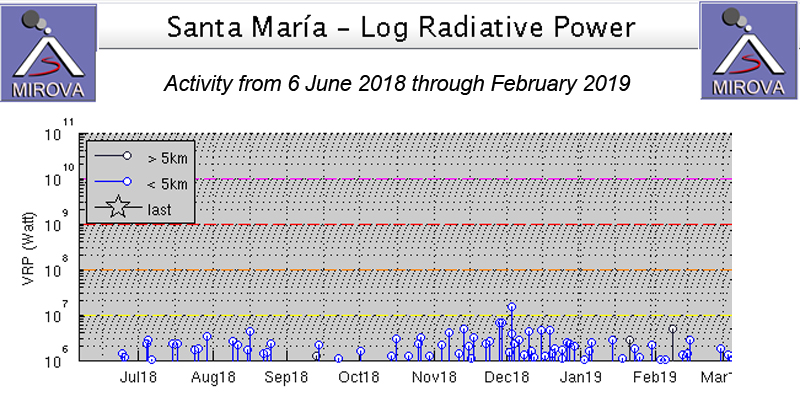
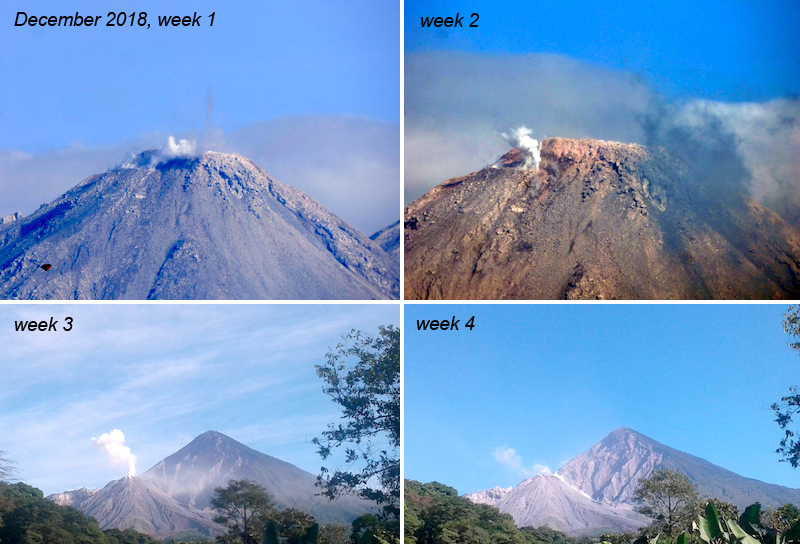
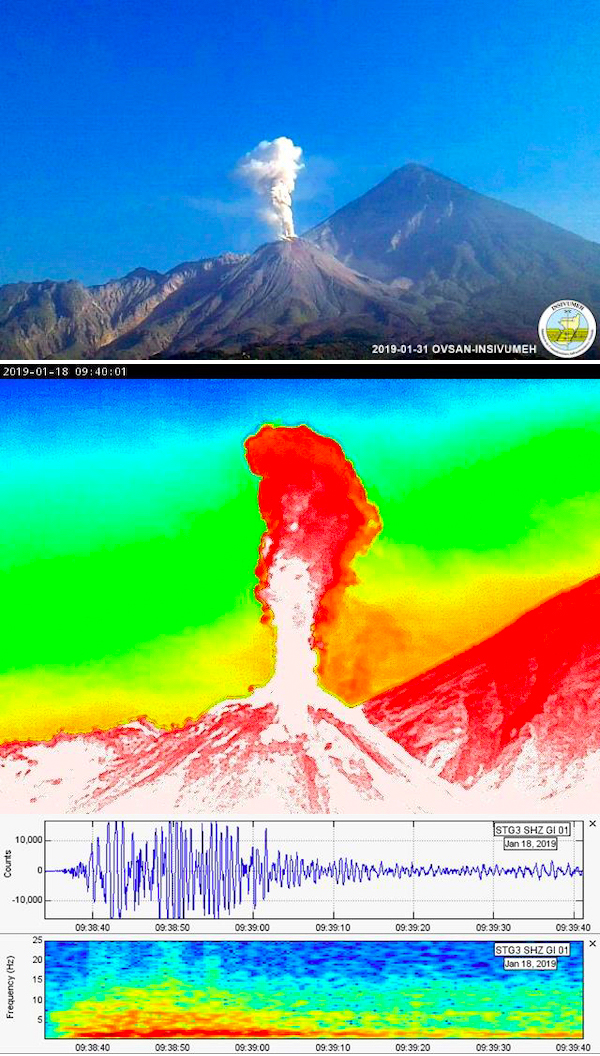
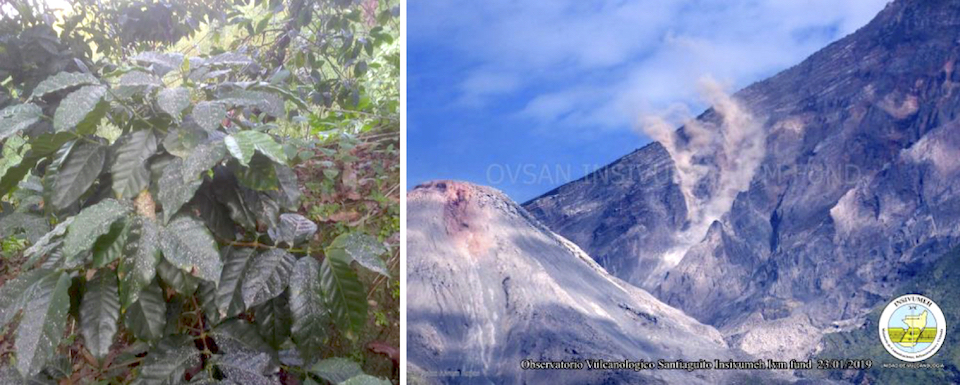
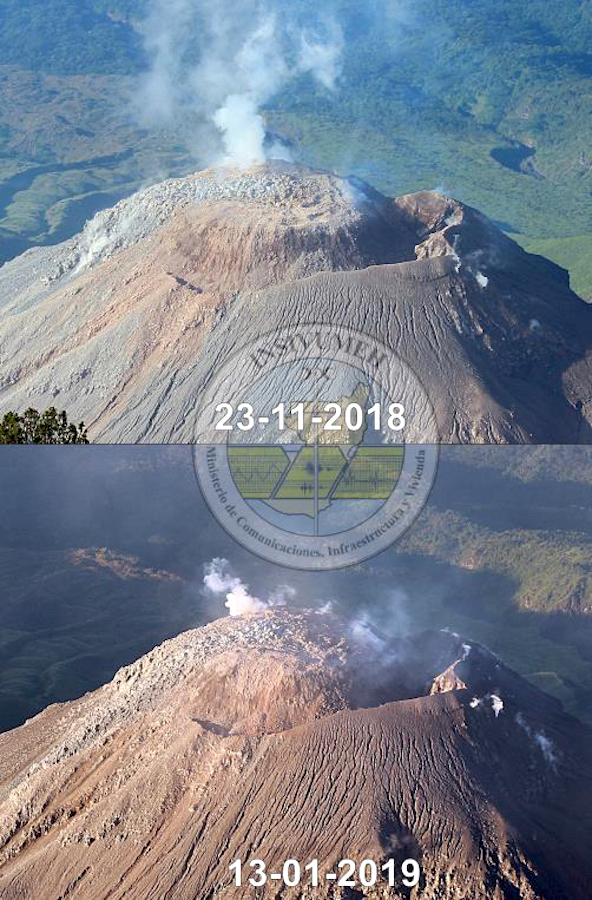
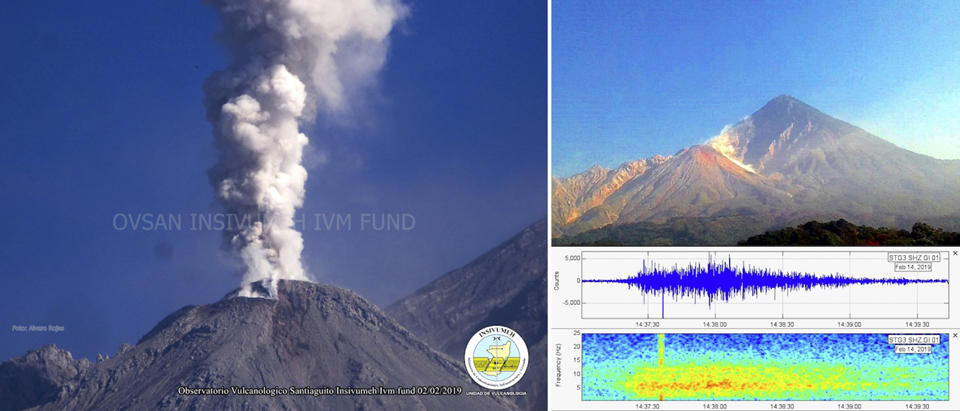
Santa Maria (Guatemala)
Daily explosions cause steam-and-ash plumes and block avalanches, November 2018-February 2019
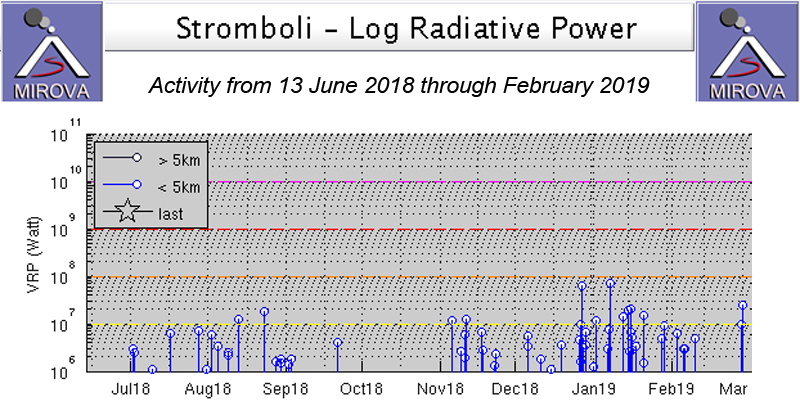
Stromboli (Italy)
Constant explosions from both crater areas during November 2018-February 2019
Villarrica (Chile)
Intermittent Strombolian activity ejects incandescent bombs around crater rim, September 2018-February 2019
Krakatau (Indonesia) — March 2019 Cite this Report
Krakatau
Indonesia
6.1009°S, 105.4233°E; summit elev. 285 m
All times are local (unless otherwise noted)
Ash plumes, ballistic ejecta, and lava extrusion during October-December; partial collapse and tsunami in late December; Surtseyan activity in December-January 2019
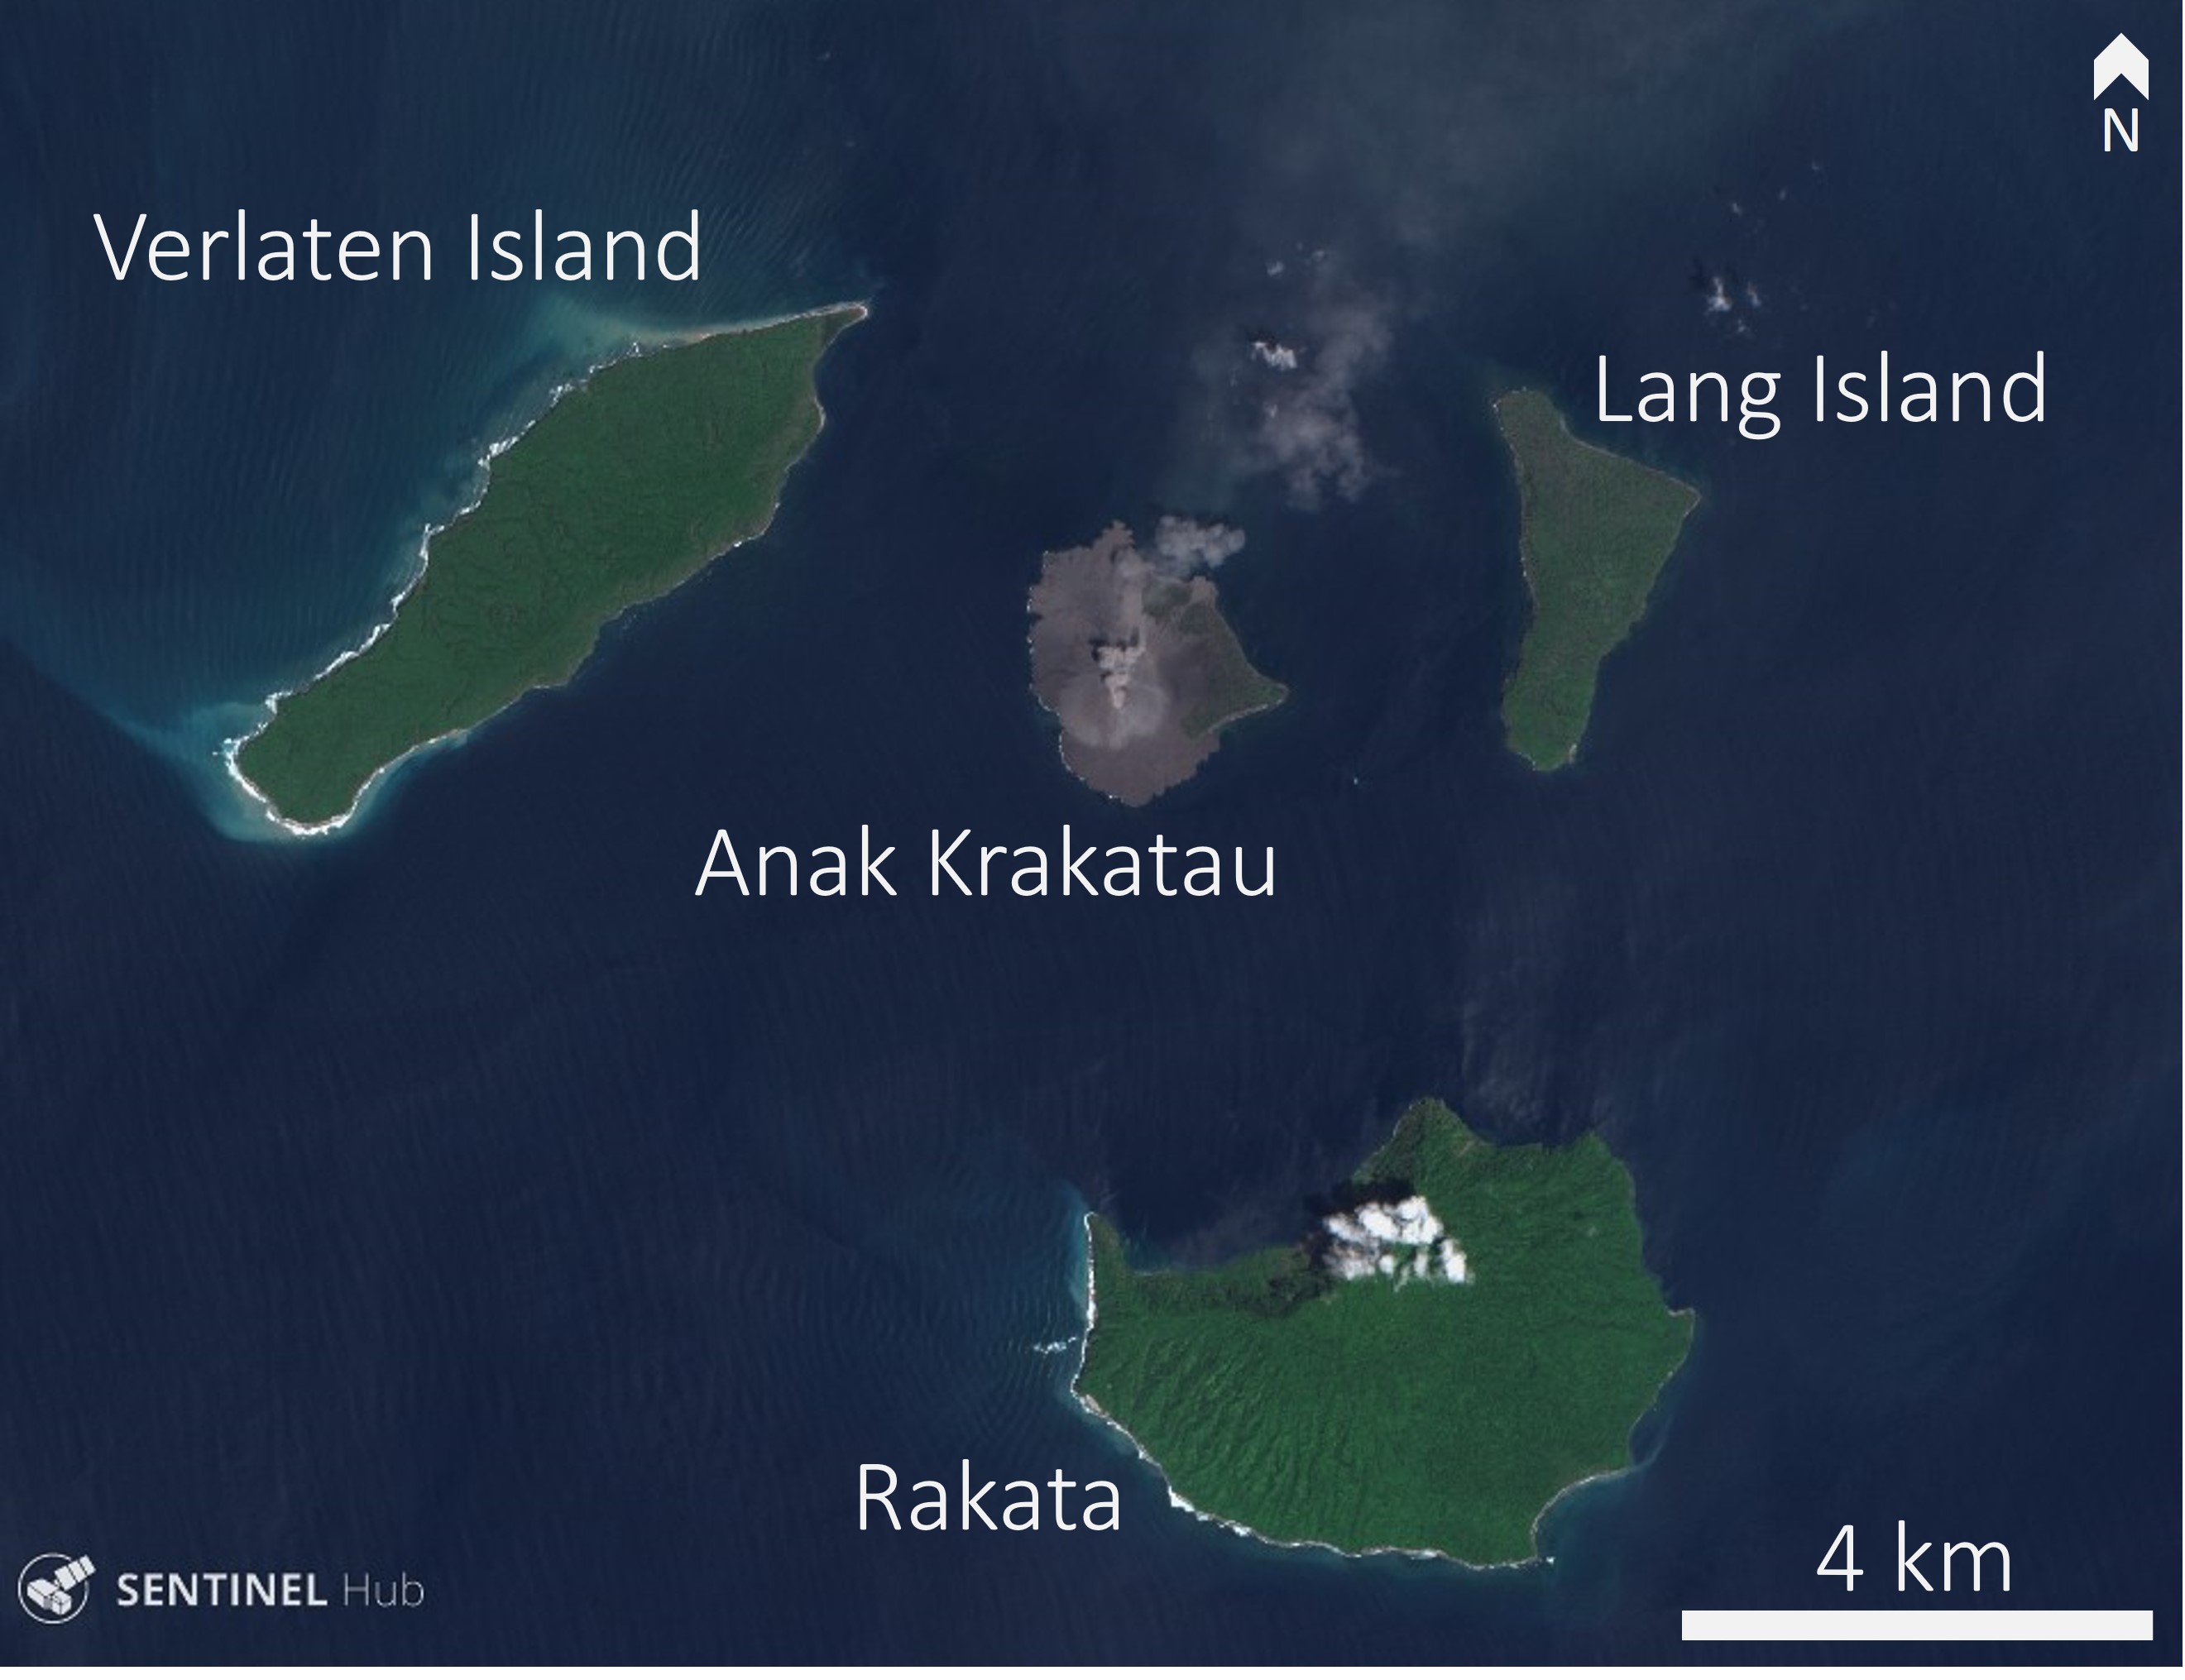
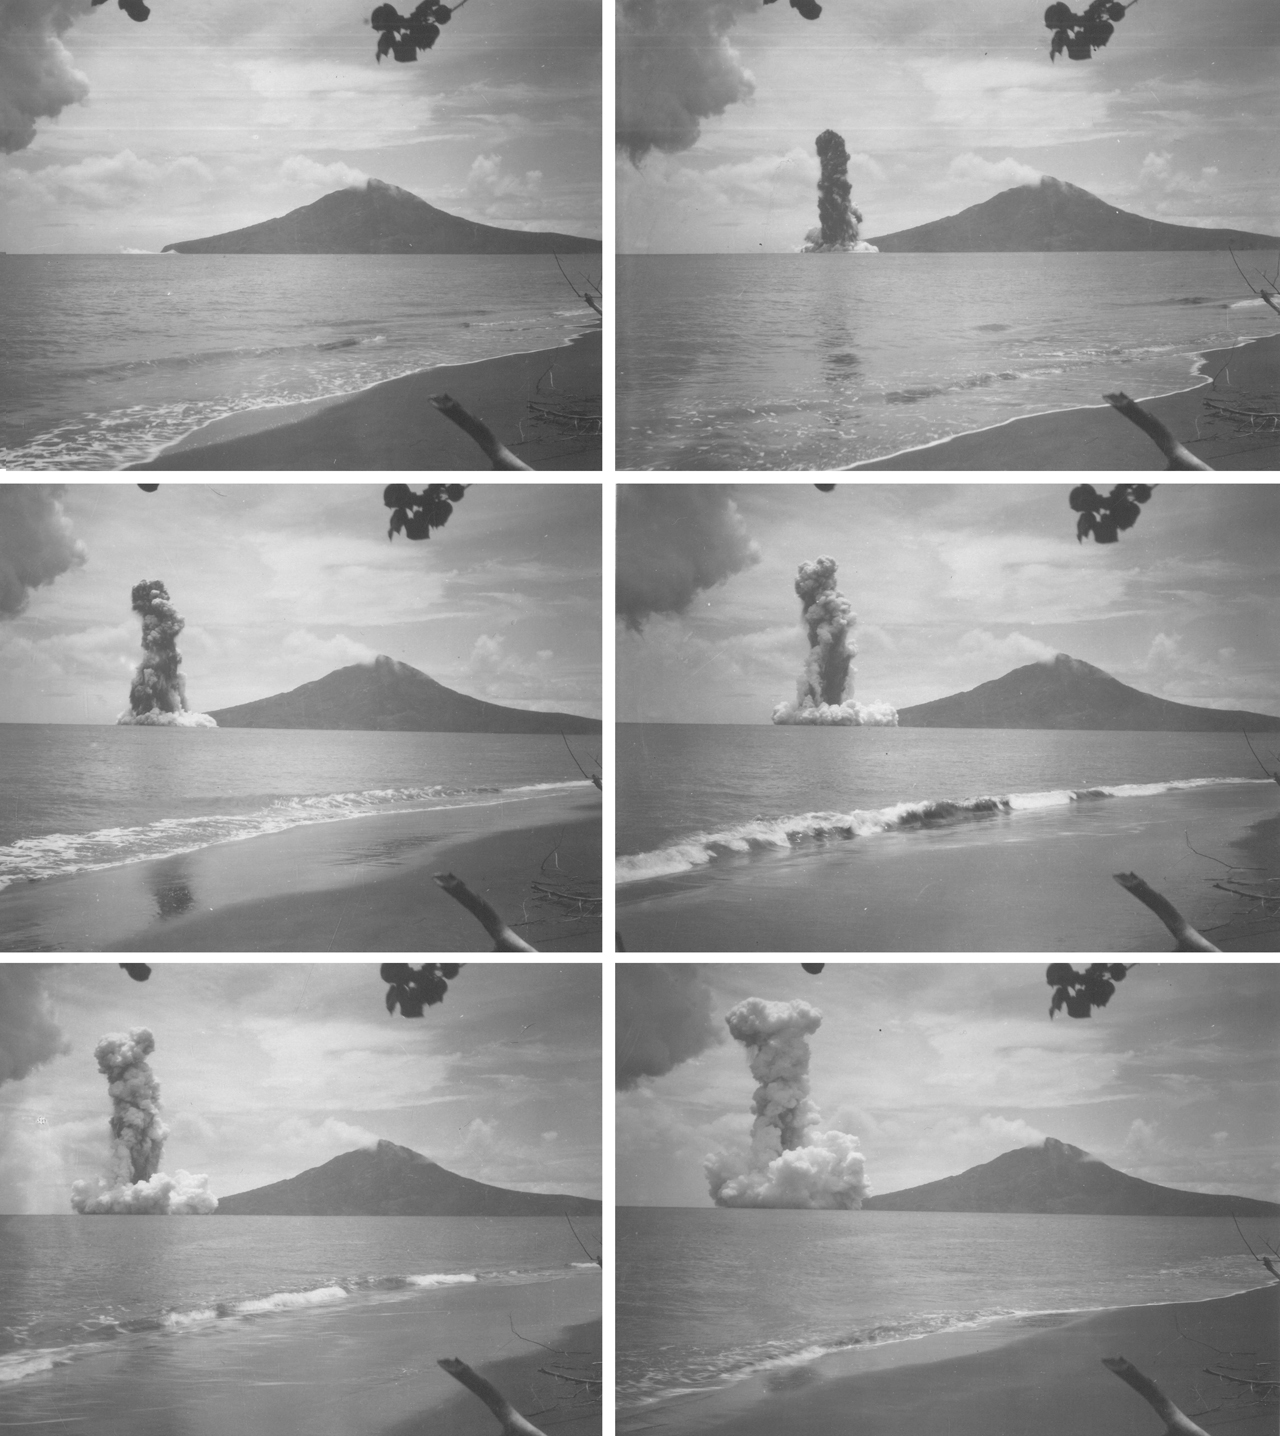
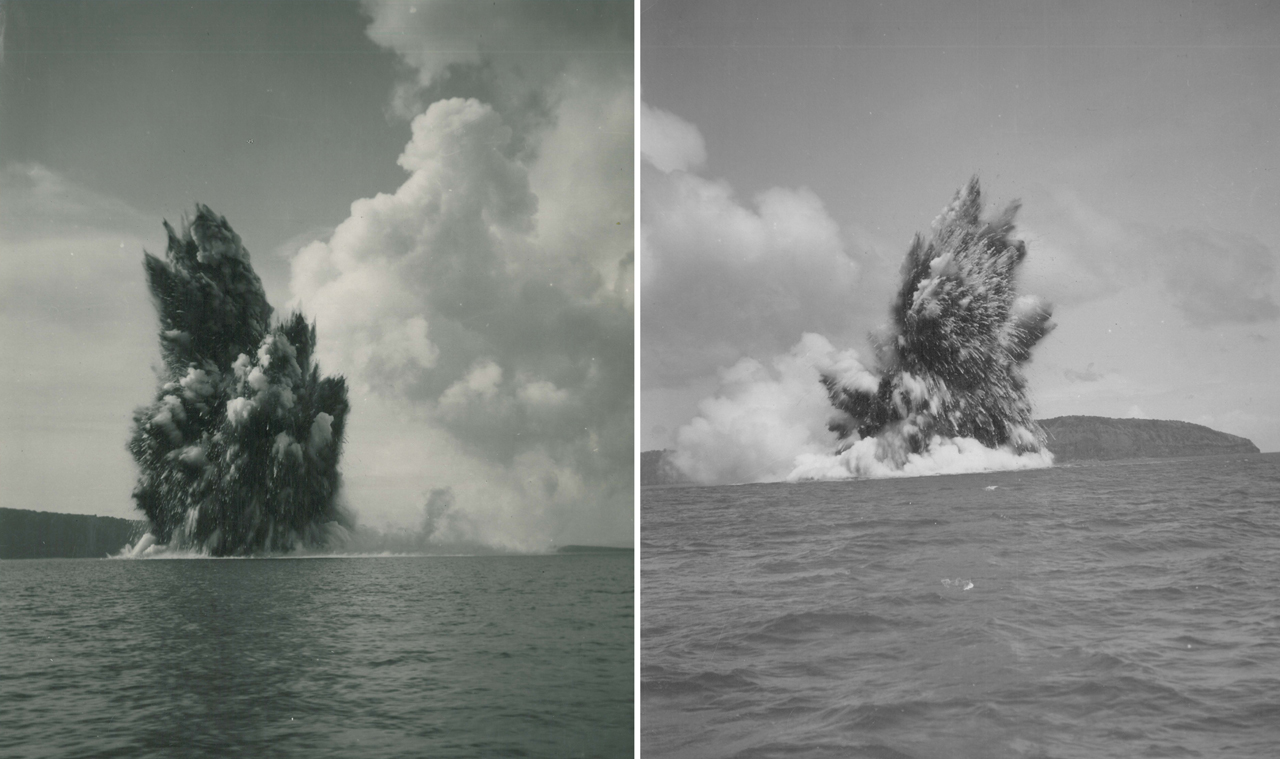
Krakatau volcano, between Java in Sumatra in the Sunda Straight of Indonesia, is known for its catastrophic collapse in 1883 that produced far-reaching pyroclastic flows, ashfall, and tsunami. The pre-1883 edifice had grown within an even older collapse caldera that formed around 535 CE, resulting in a 7-km-wide caldera and the three surrounding islands of Verlaten, Lang, and Rakata (figure 55). Eruptions that began in late December 1927 (figures 56 and 57) built the Anak Krakatau cone above sea level (Sudradjat, 1982; Simkin and Fiske, 1983). Frequent smaller eruptions since that time, over 40 short episodes consisting of ash plumes, incandescent blocks and bombs, and lava flows, constructed an island reaching 338 m elevation.
Historically there has been a lot of confusion about the name and preferred spelling of this volcano. Some have incorrectly made a distinction between the pre-1883 edifice being called "Krakatoa" and then using "Krakatau" for the current volcano. Anak Krakatau is the name of the active cone, but the overall volcano name is simply Krakatau. Simkin and Fiske (1983) explained as follows: "Krakatau was the accepted spelling for the volcano in 1883 and remains the accepted spelling in modern Indonesia. In the original manuscript copy submitted to the printers of the 1888 Royal Society Report, now in the archives of the Royal Society, this spelling has been systematically changed by a neat red line through the final 'au' and the replacement 'oa' entered above; a late policy change that, from some of the archived correspondence, saddened several contributors to the volume."
After 15 months of quiescence Krakatau began a new eruption phase on 21 June 2018, characterized by ash plumes, ballistic ejecta, Strombolian activity, and lava flows. Ash plumes reached 4.9 km and a lava flow traveled down the SE flank and entered the ocean. This report summarizes the activity from October 2018 to January 2019 based on reports by Pusat Vulkanologi dan Mitigasi Bencana Geologi (PVMBG), also known as the Indonesian Center for Volcanology and Geological Hazard Mitigation (CVGHM), MAGMA Indonesia, the National Board for Disaster Management - Badan Nasional Penanggulangan Bencana (BNPB), the Darwin Volcanic Ash Advisory Center (VAAC), satellite data, and eye witness accounts.
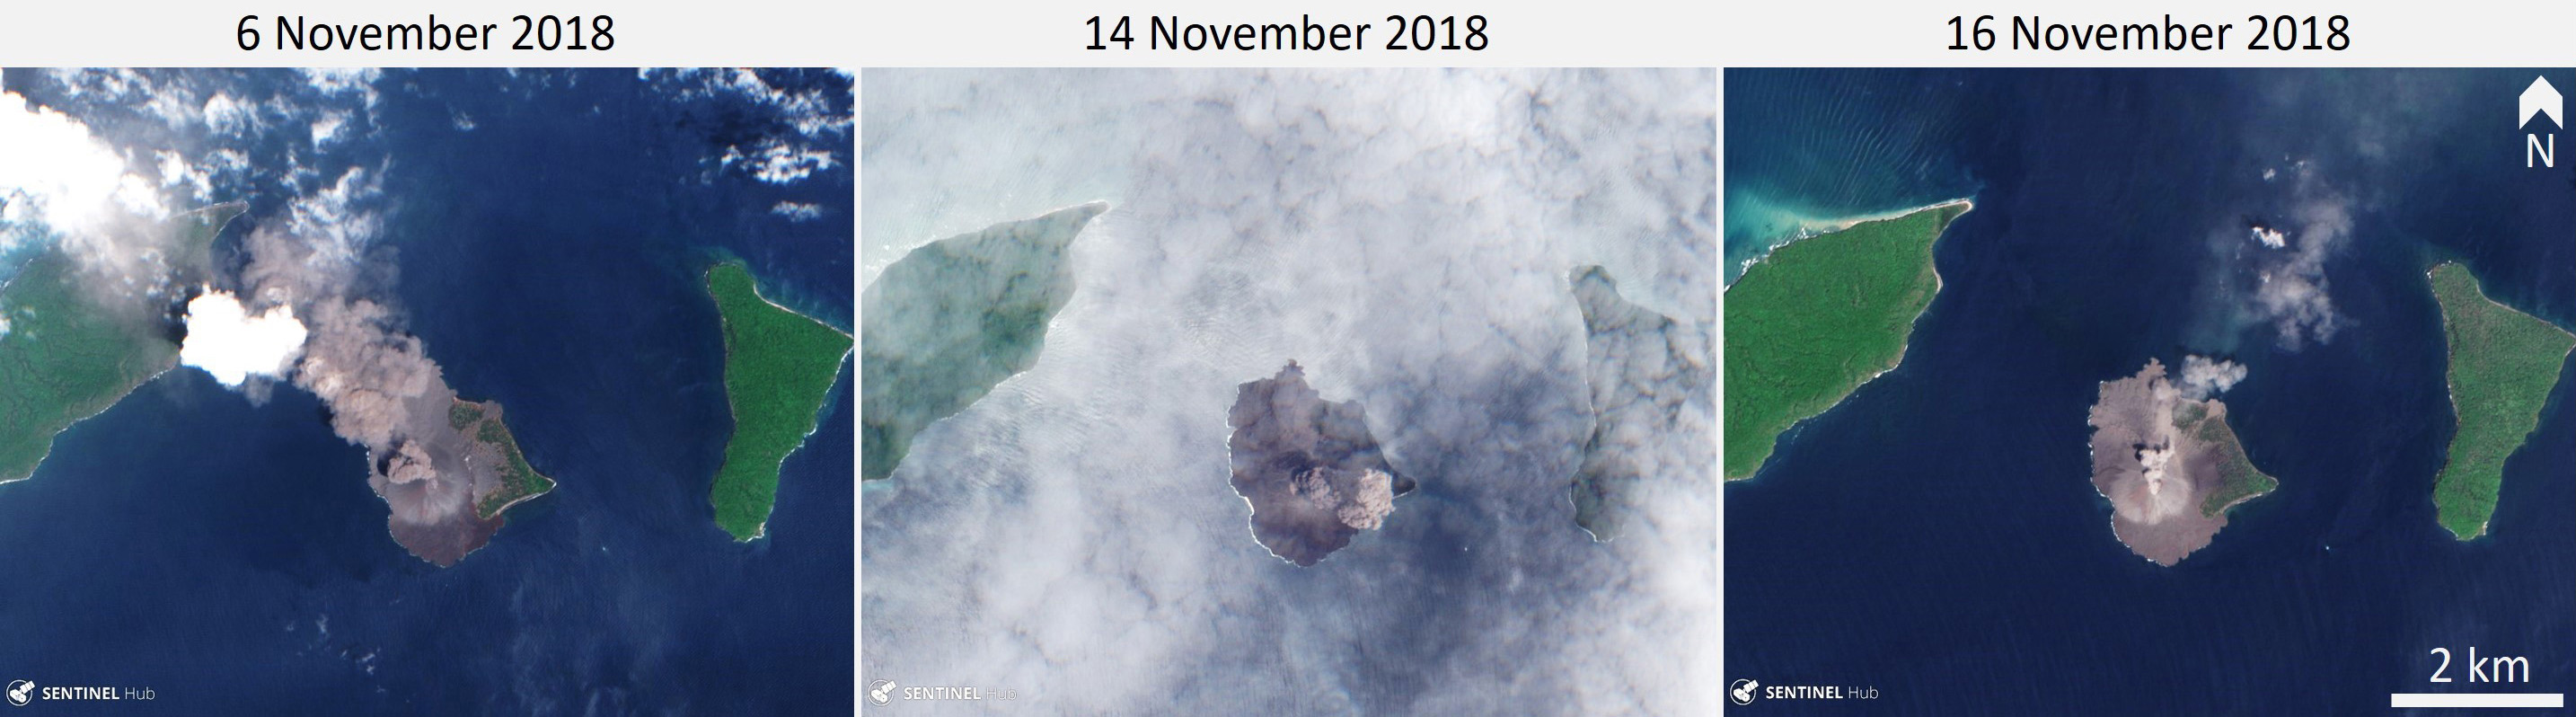
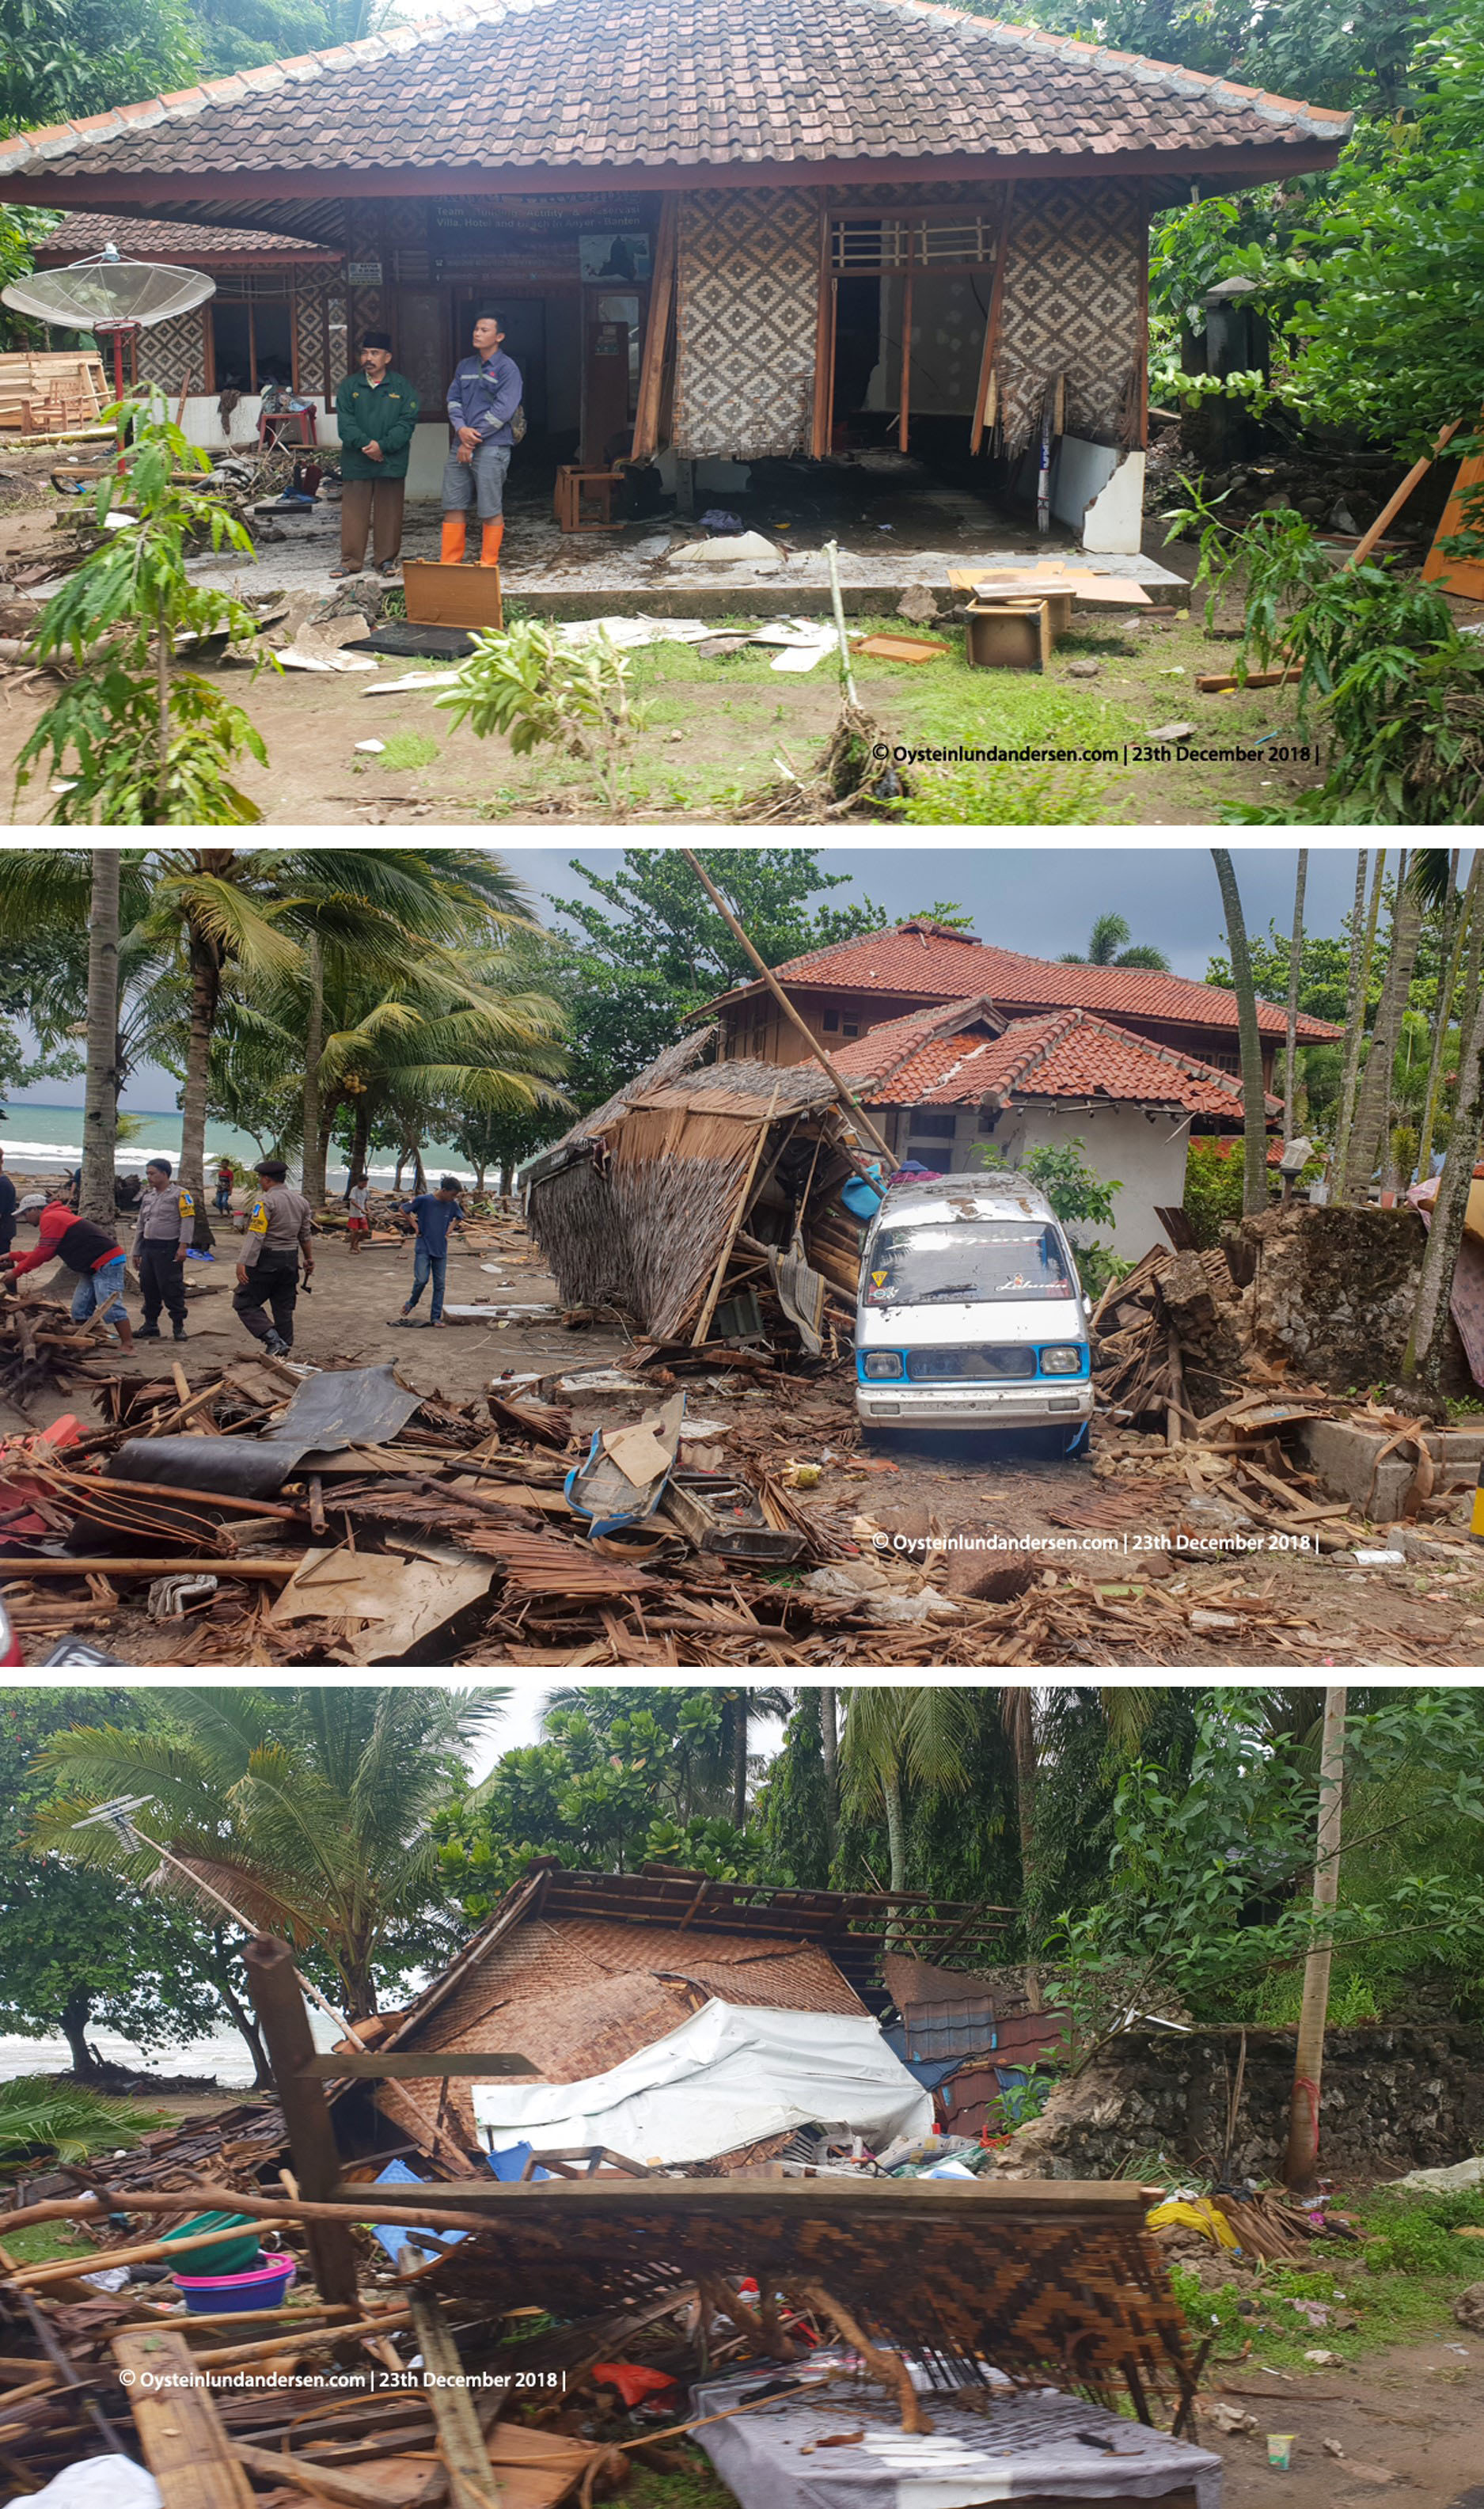
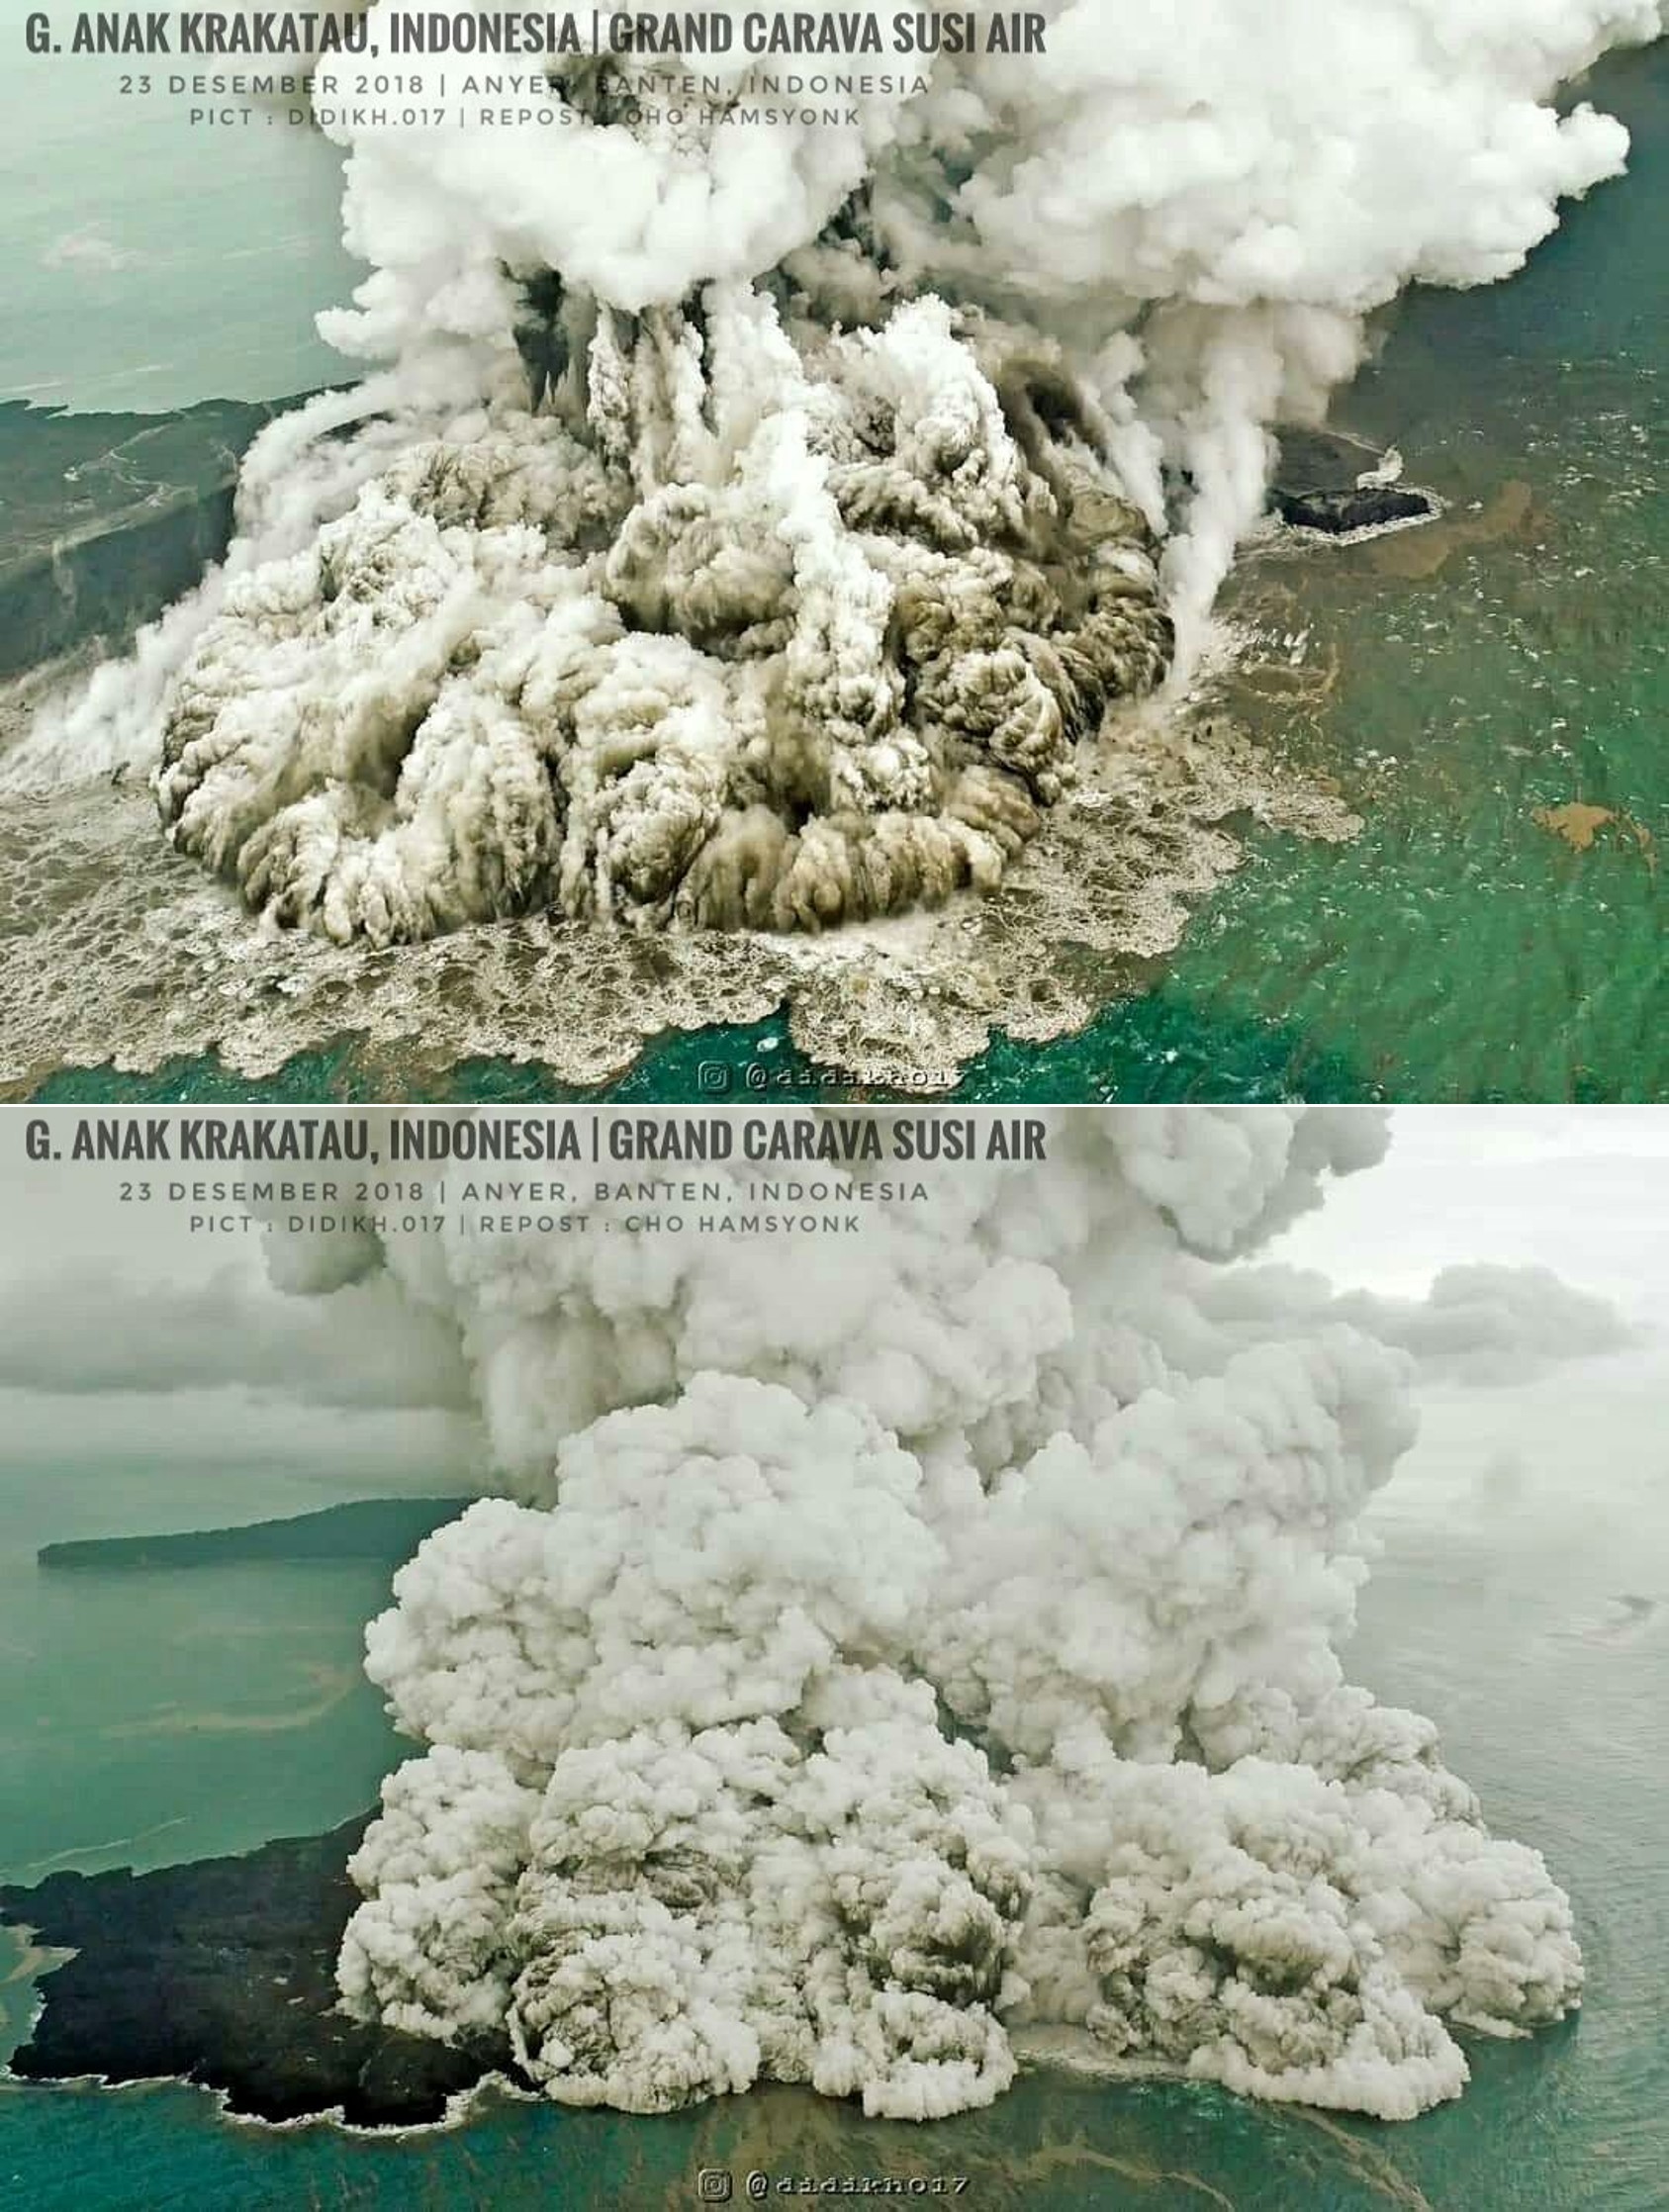
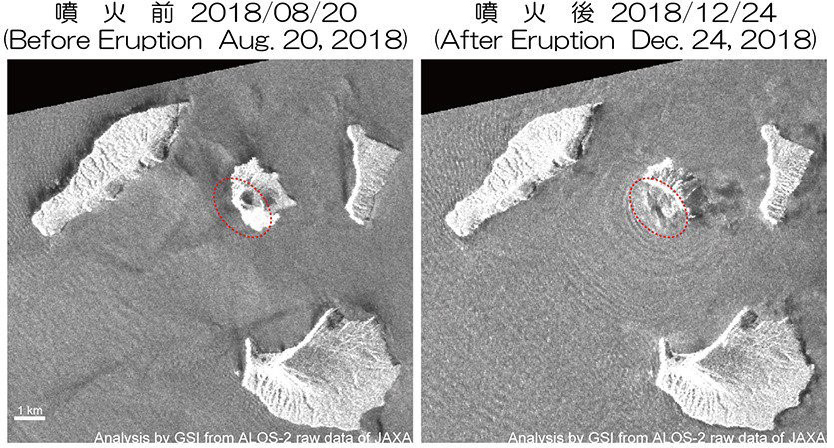
Activity during October-21 December 2018. The eruption continued to eject incandescent ballistic ejecta, ash plumes, and lava flows in October through December 2018. On 22 December a partial collapse of Anak Krakatau began, dramatically changing the morphology of the island and triggering a deadly tsunami that impacted coastlines around the Sunda Straight. Following the collapse the vent was located below sea level and Surtseyan activity produced steam plumes, ash plumes, and volcanic lightning.
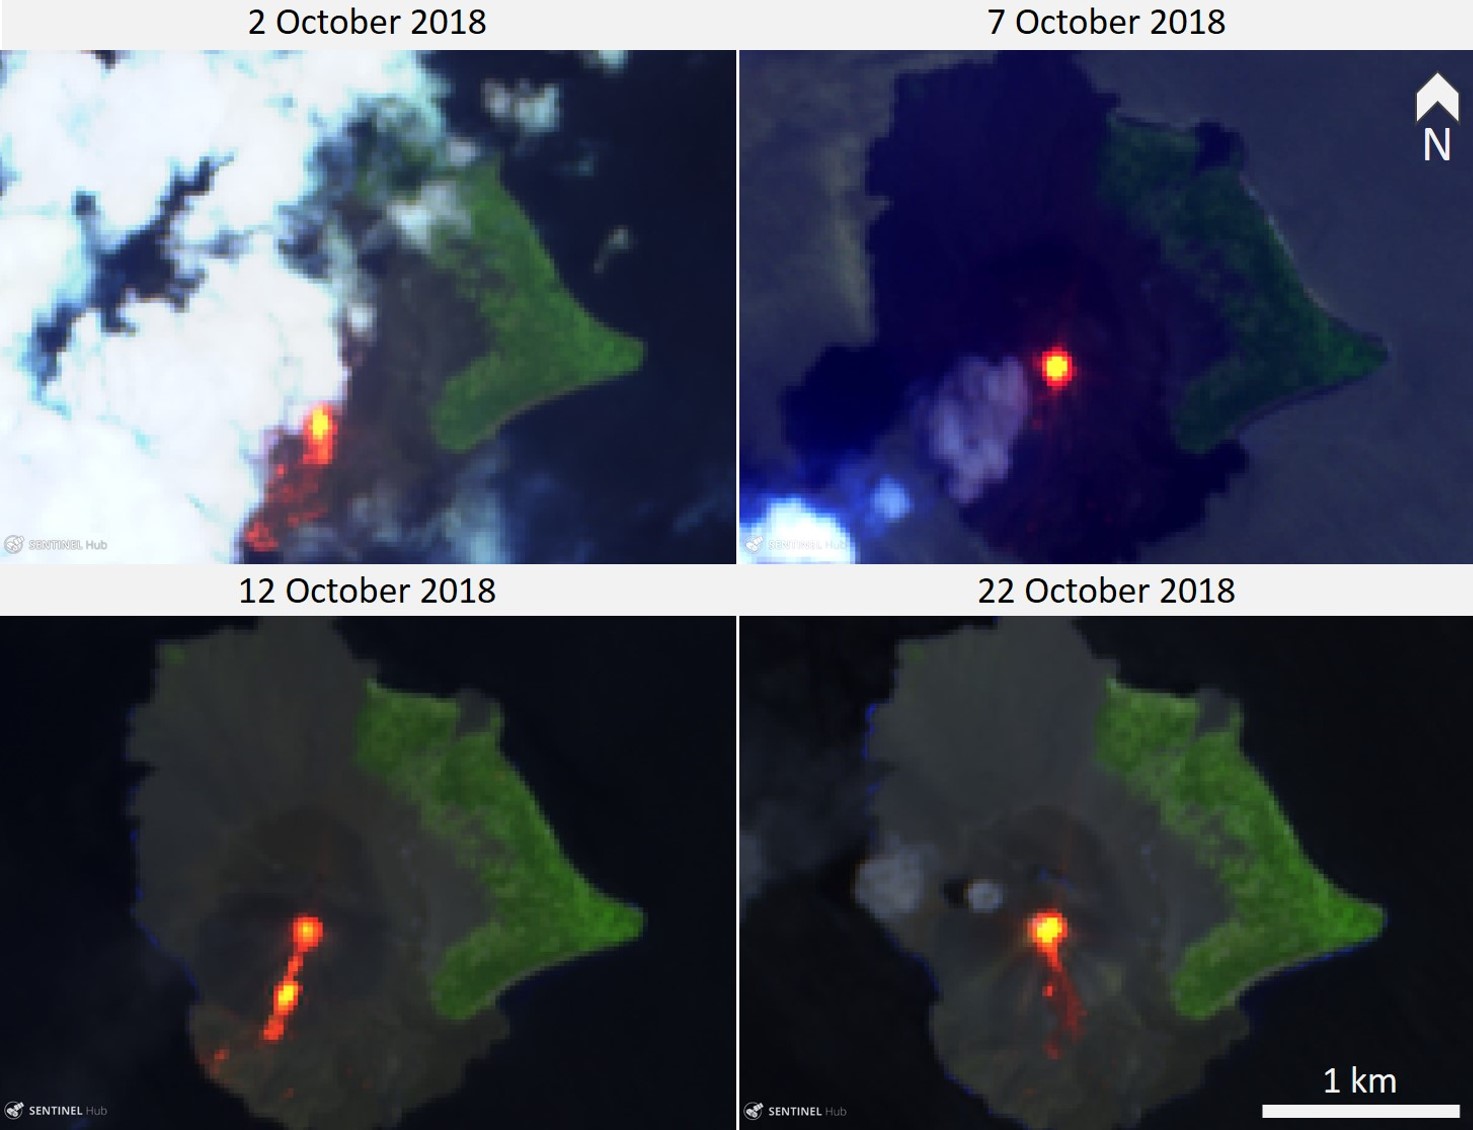
Sentinel-2 satellite images acquired through October show incandescence in the crater, lava flows on the SW flank, and incandescent material to the S to SE of the crater (figure 58). This correlates with eyewitness accounts of explosions ejecting incandescent ballistic ejecta, and Volcano Observatory Notice for Aviation (VONA) ash plume reports. The Darwin VAAC reported ash plumes to 1.5-2.4 km altitude that drifted in multiple directions during 17-19 October, but throughout most of October visual observations were limited due to fog. A video shared by Sutopo on 24 October shows ash emission and lava fountaining producing a lava flow that entered the ocean, resulting in a white plume. Video by Richard Roscoe of Photovolcanica shows explosions ejecting incandescent blocks onto the flanks and ash plumes accompanied by volcanic lightning on 25 October.
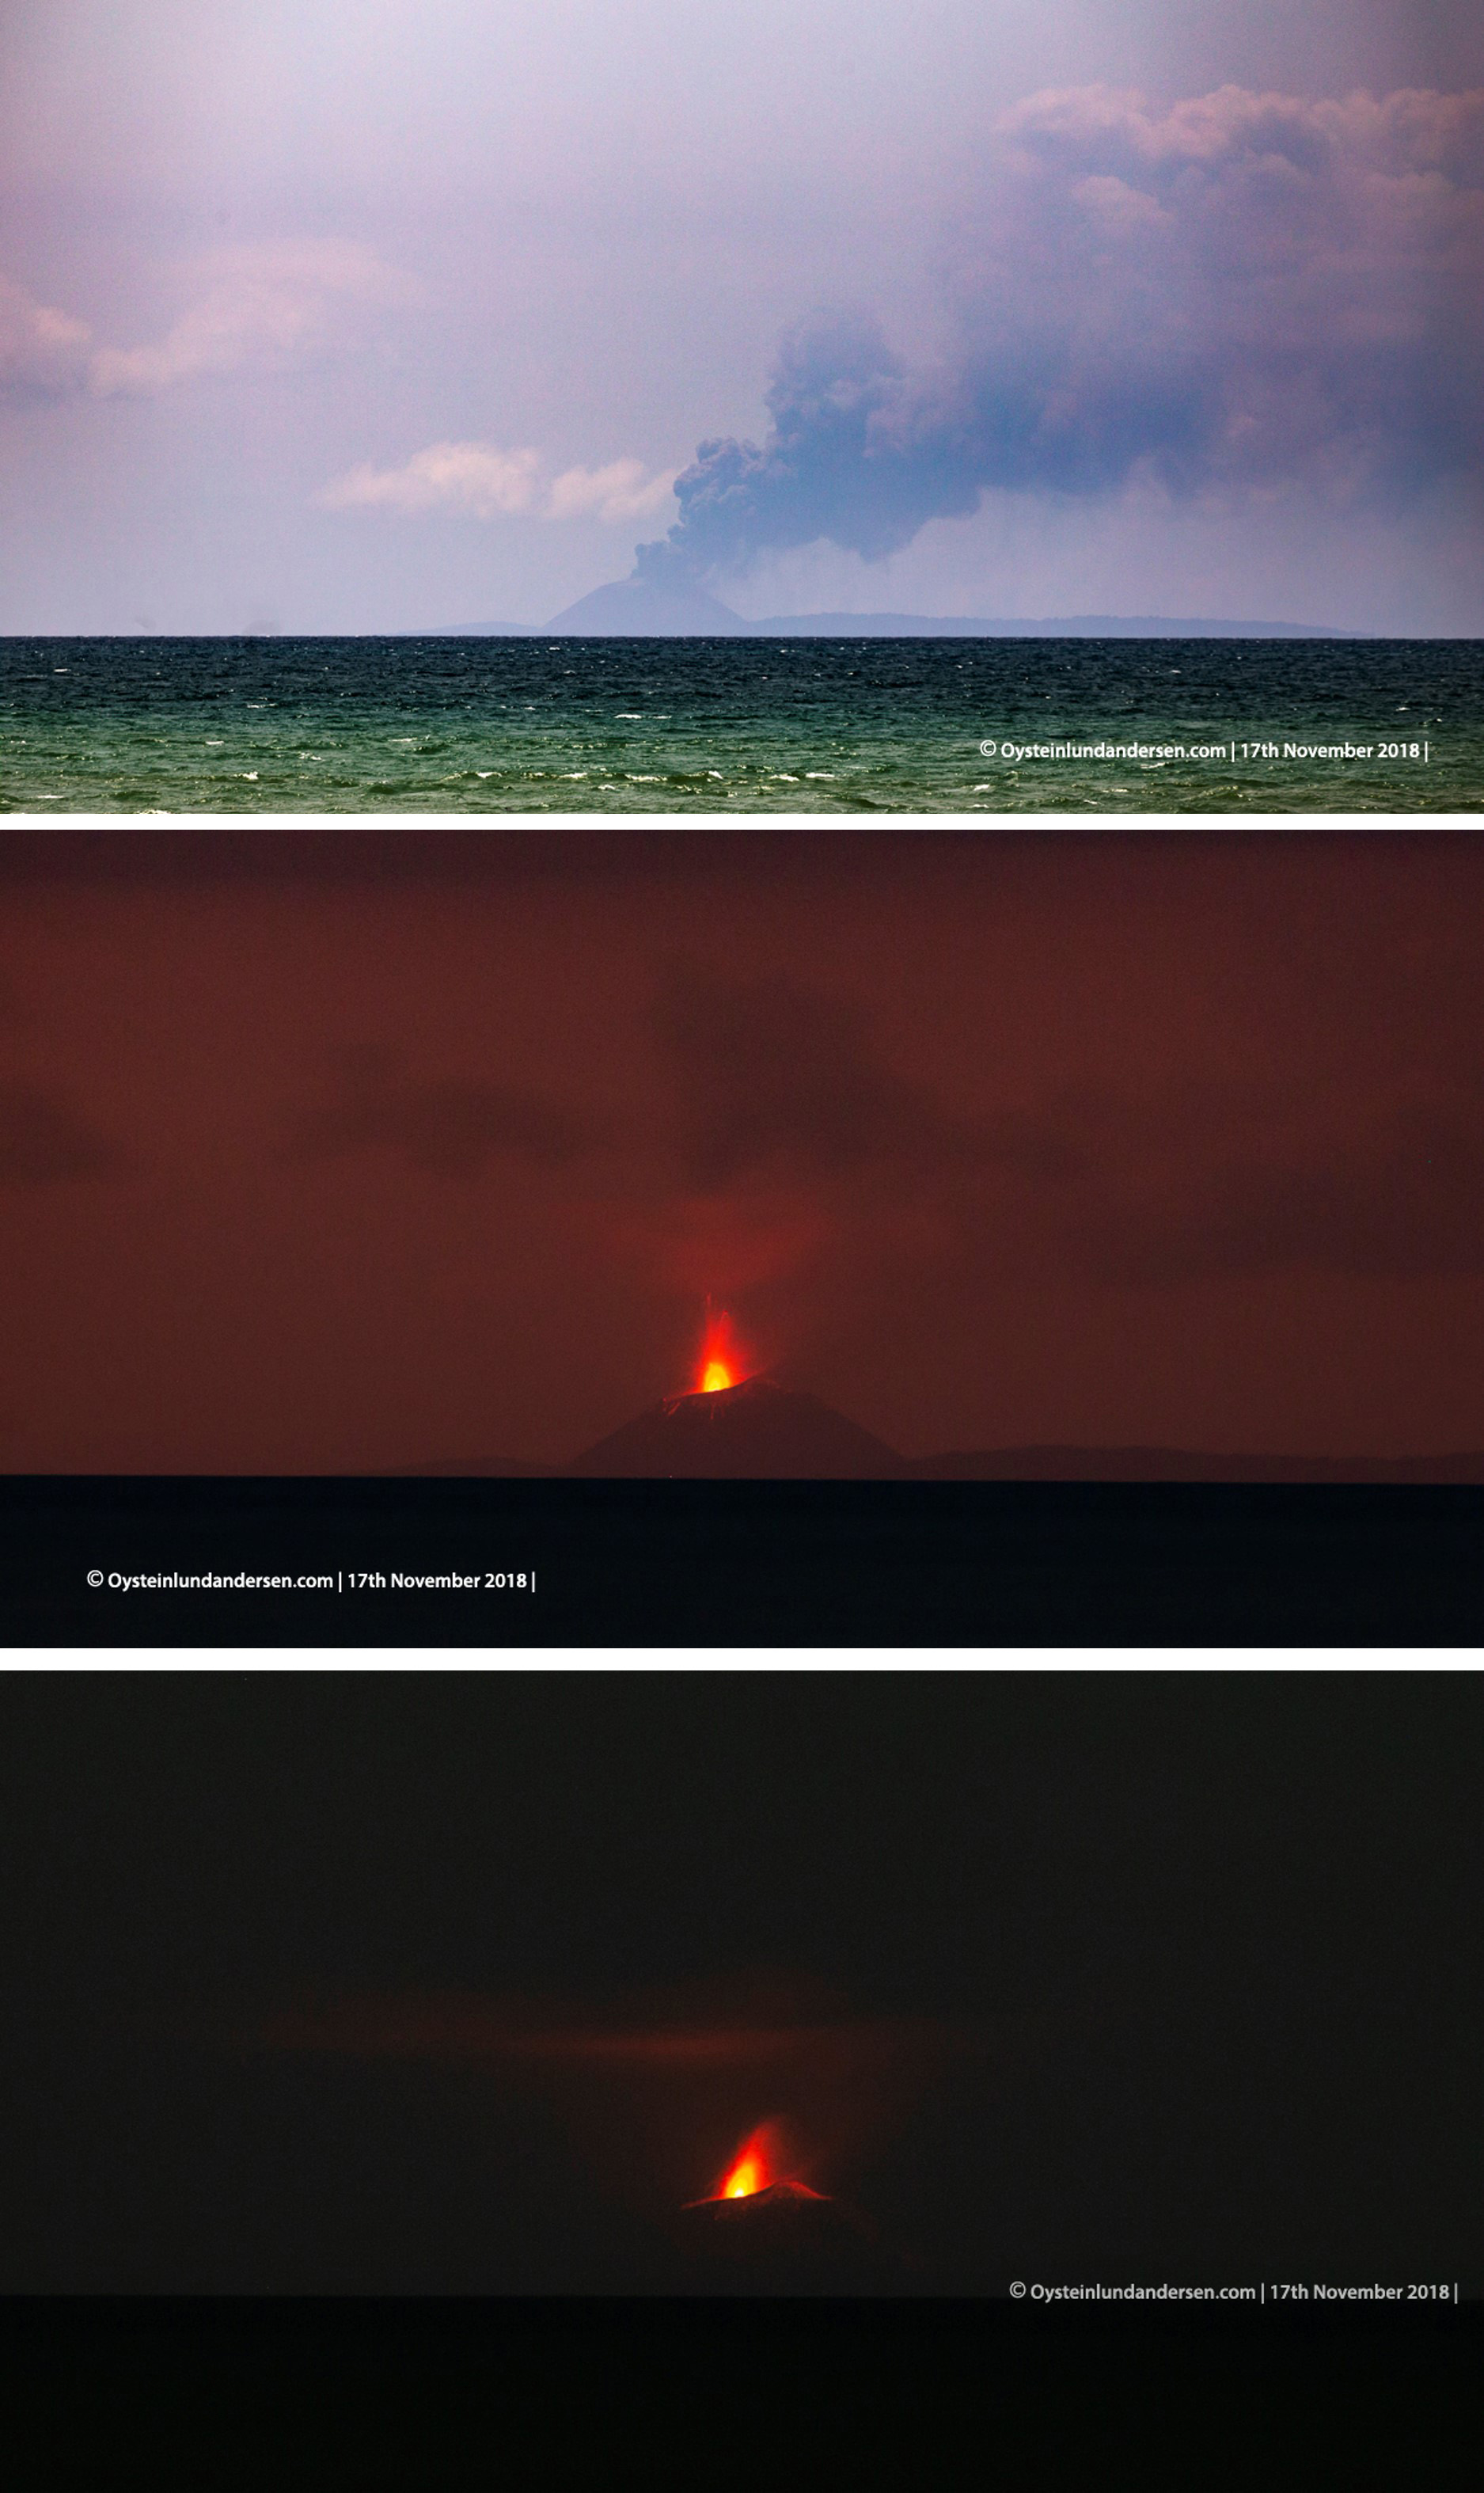
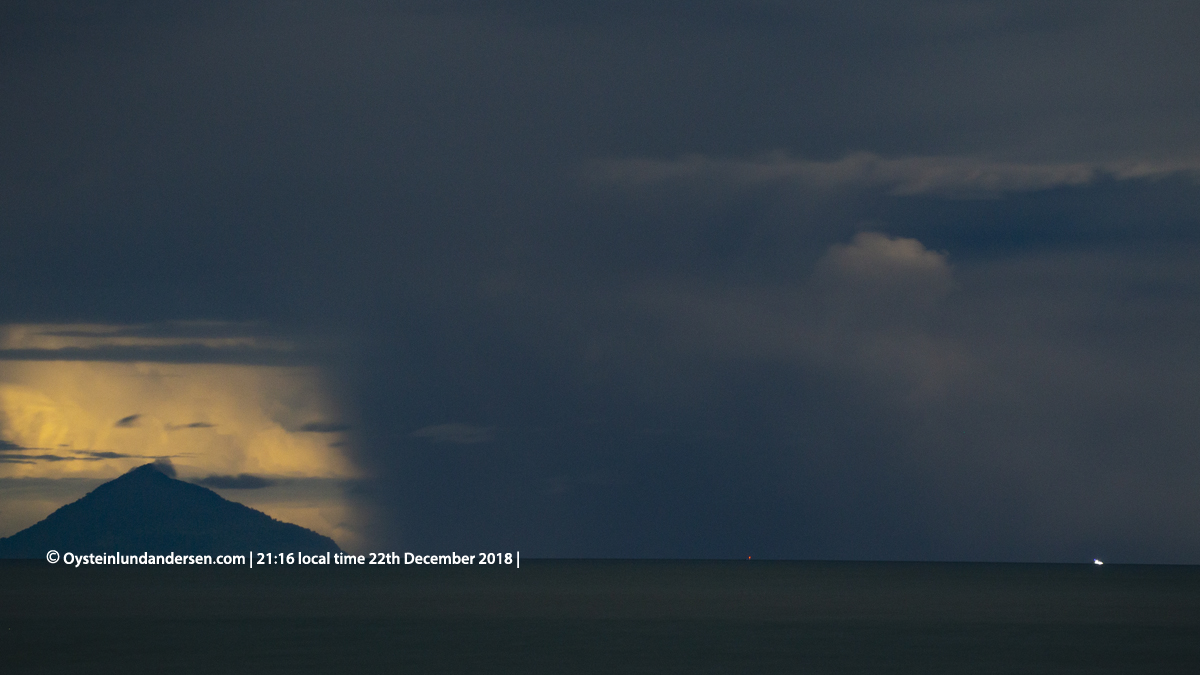
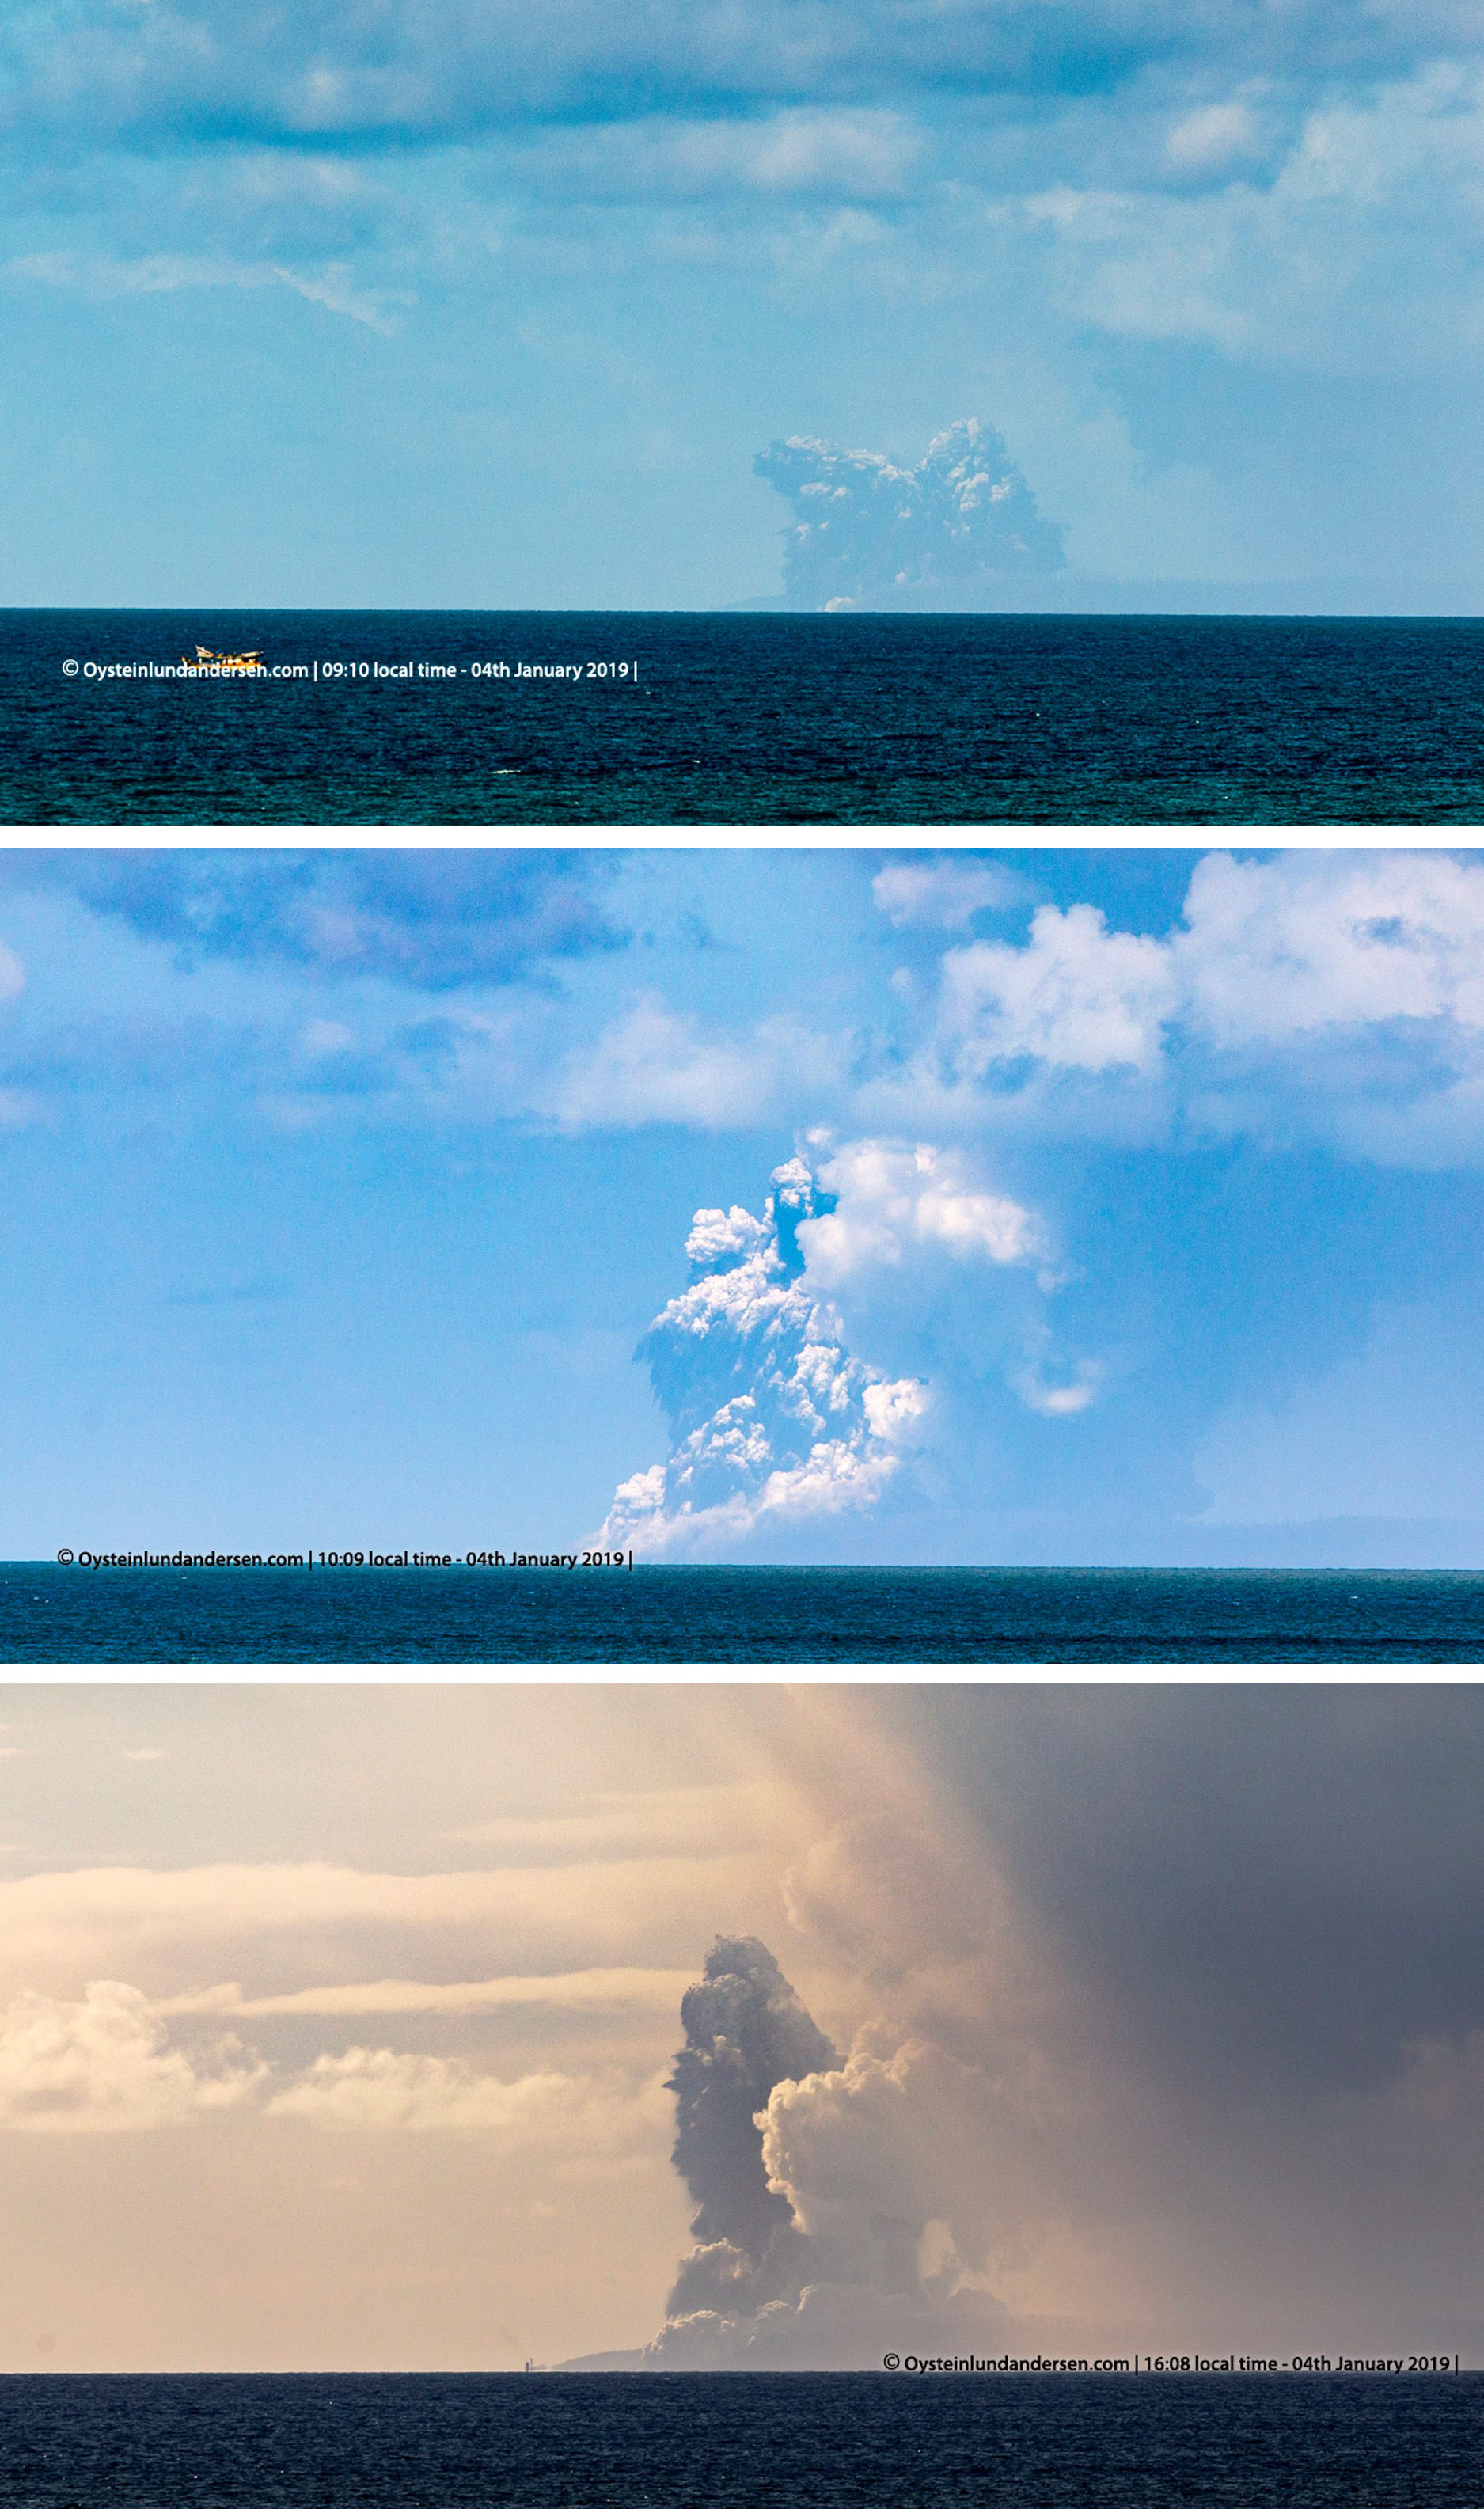
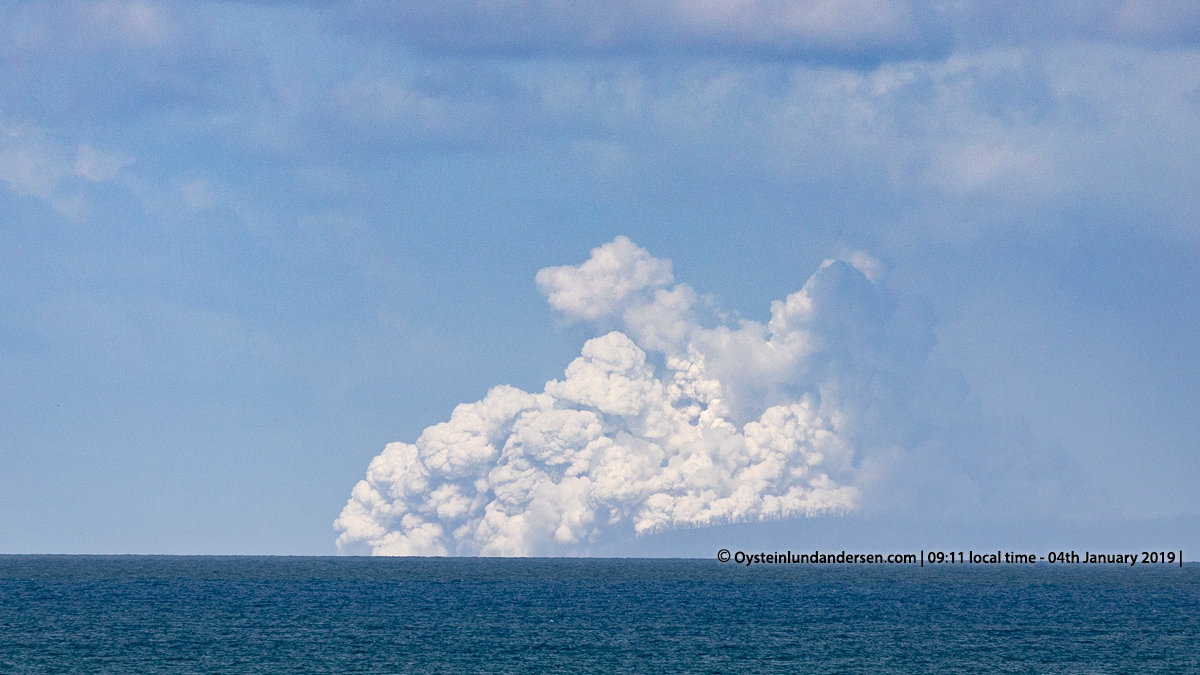
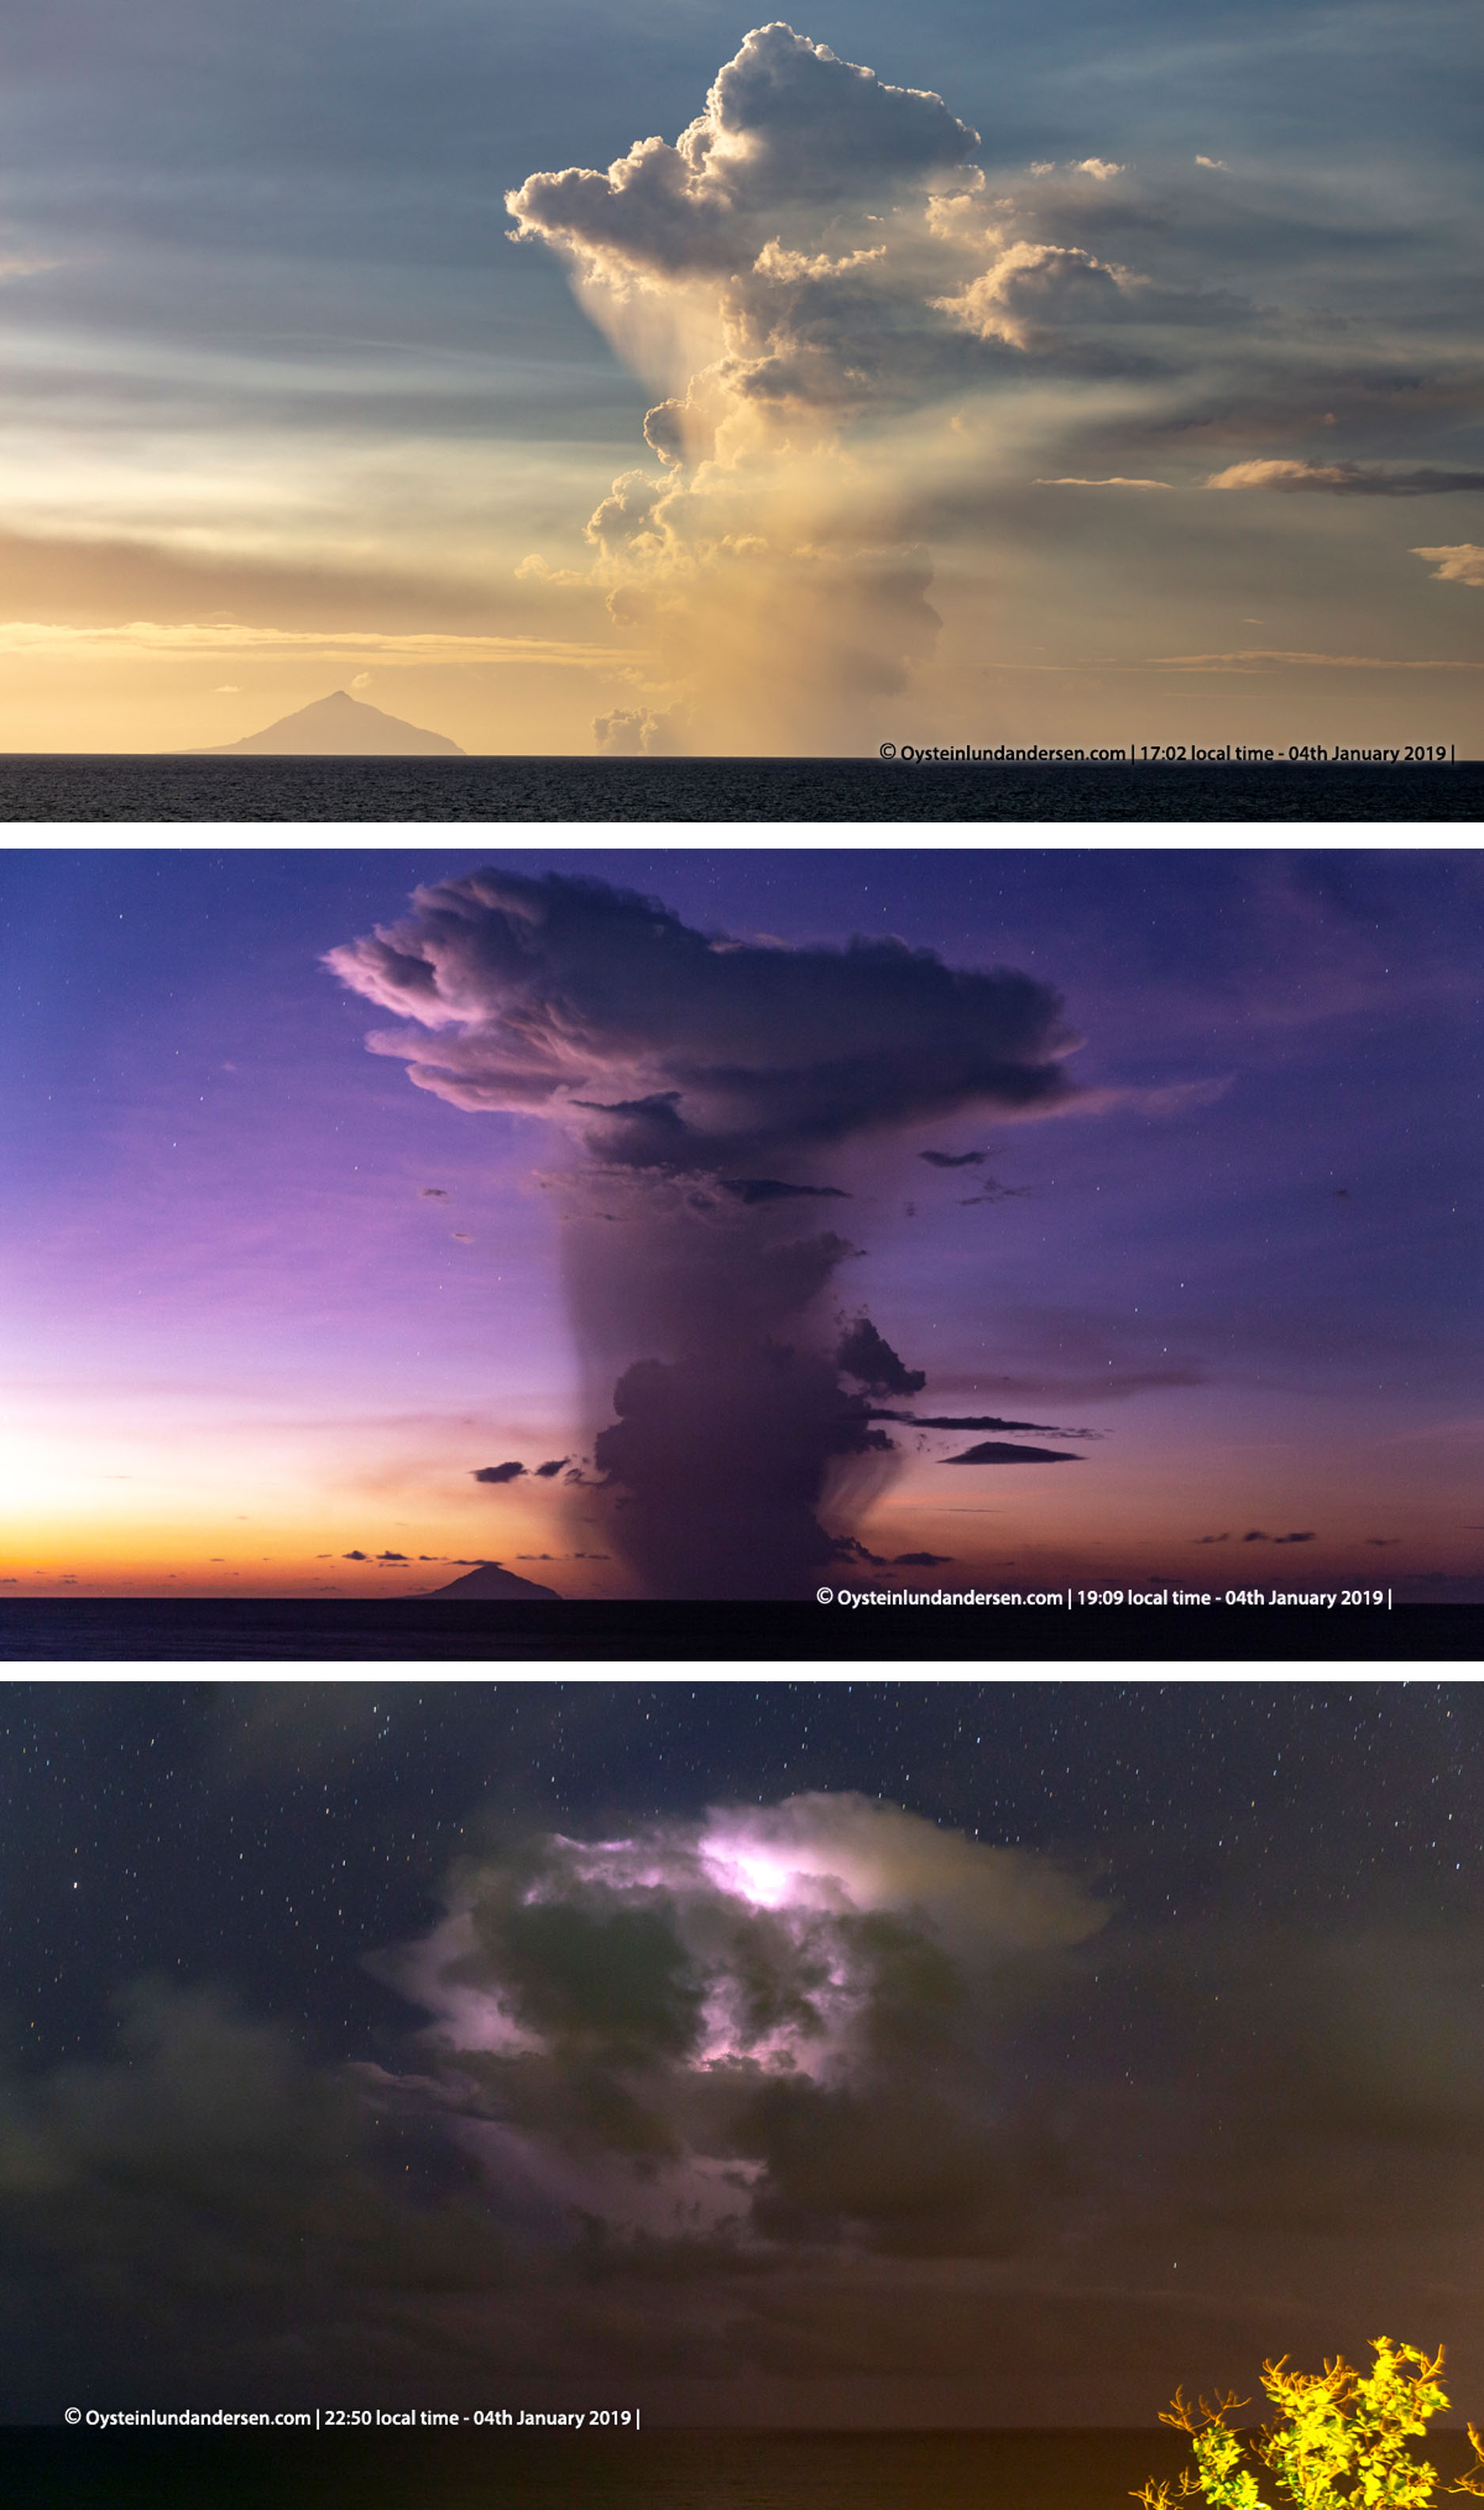
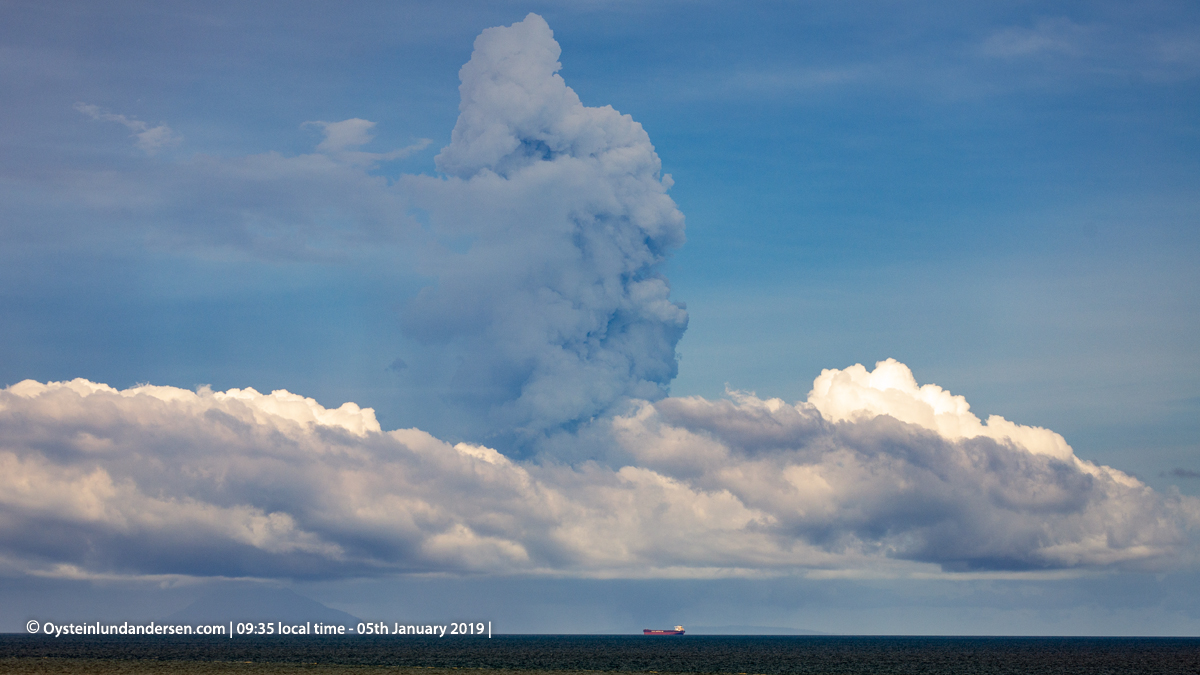
Throughout November frequent ash plumes rose to 0.3-1.3 km altitude, with explosion durations spanning 29-212 seconds (figure 59). Observations by Øystein Lund Andersen describe explosions ejecting incandescent material with ash plumes and some associated lightning on 17 November (figure 60).
During 1-21 December intermittent explosions lasting 46-776 seconds produced ash plumes that rose up to 1 km altitude. Thermal signatures were sporadically detected by various satellite thermal infrared sensors during this time. On 22 December ash plumes reached 0.3-1.5 km through the day and continuous tremor was recorded.
Activity and events during 22-28 December 2018. The following events during the evening of the 22nd were recorded by Øystein Lund Andersen, who was photographing the eruption from the Anyer-Carita area in Java, approximately 47 km from Anak Krakatau. Starting at 1429 local time, incandescence and ash plumes were observed and the eruption could be heard as intermittent 'cannon-fire' sounds, sometimes shaking walls and windows. An increase in intensity was noted at around 1700, when the ash column increased in height and was accompanied by volcanic lightning, and eruption sounds became more frequent (figure 61). A white steam plume began to rise from the shore of the southern flank. After sunset incandescent ballistic blocks were observed impacting the flanks, with activity intensity peaking around 1830 with louder eruption sounds and a higher steam plume from the ocean (figure 62).
PVMBG recorded an eruption at 2103. When viewed at 2105 by Øystein Lund Andersen, a dark plume across the area blocked observations of Anak Krakatau and any incandescence (figure 63). At 2127-2128 the first tsunami wave hit the shore and traveled approximately 15 m inland (matching the BNPB determined time of 2127). At approximately 2131 the sound of the ocean ceased and was soon replaced by a rumbling sound and the second, larger tsunami wave impacted the area and traveled further inland, where it reached significant depths and caused extensive damage (figures 64 and 65). After the tsunami, eruption activity remained high and the eruption was heard again during intervals from 0300 through to early afternoon.
Observations on 23 December reveal steam-rich ash plumes and base surge traveling along the water, indicative of the shallow-water Surtseyan eruption (figure 66). Ashfall was reported on the 26th in several regions including Cilegon, Anyer, and Serang. The first radar observations of Krakatau were on 24 December and showed a significant removal of material from the island (figure 67). At 0600 on the 27th the volcanic alert level was increased from II to III (on a scale of I-IV) and a VONA with Aviation Color Code Red reported an ash plume to approximately 7 km altitude that dispersed to the NE. When Anak Krakatau was visible, Surtseyan activity and plumes were observed through the end of December. On 28 December, plumes reached 200-3000 m. At 0418 the eruption paused and the first observation of the post-collapse edifice was made. The estimated removed volume (above sea level) was 150-180 million m3, leaving a remaining volume of 40-70 million m3. The summit of the pre-collapse cone was 338 m, while the highest point post-collapse was reduced to 110 m. Hundreds of thousands of lightning strokes were detected during 22-28 December with varying intensity (figure 68).
Damage resulting from the 22 December tsunami. On the 29 December the damage reported by BNPB was 1,527 heavily damaged housing units, 70 with moderate damage, 181 with light damage, 78 damaged lodging and warung units, 434 damaged boats and ships and some damage to public facilities. Damage was recorded in the five regencies of Pandenglang, Serang, South Lampung, Pesawaran and Tanggamus. A BNPB report on 14 January gave the following figures: 437 fatalities, 10 people missing, 31,943 people injured, and 16,198 people evacuated (figure 69). The eruption and tsunami resulted in damage to the surrounding islands, with scouring on the Anak-Krakatau-facing slope of Rakata and damage to vegetation on Kecil island (figure 70 and 71).
Activity during January 2019. Surtseyan activity continued into January 2019. Øystein Lund Andersen observed the eruption on 4-5 January. Activity on 4 January was near-continuous. The photographs show black cock's-tail jets that rose a few hundred meters before collapsing (figure 72), accompanied by white lateral base surge that spread from the vent across the ocean (figure 73), and white steam plumes that were visible from Anyer-Carita, West Java. In the evening the ash-and-steam plume was much higher (figure 74). It was also noted that older pumice had washed ashore at this location and a coating of sulfur was present along the beach and some of the water surface. Activity decreased again on the 5th (figure 75) with a VONA reporting an ash plume to 1.5 km towards the WSW. SO2 plumes were dispersed to the NE, E, and S during this time (figure 76).
During 5-9 January intermittent explosions lasting 20 seconds to 13 minutes produced ash plumes rising up to 1.2 km and dispersing E. From 11 to 19 January white plumes were observed up to 500 m. Observations were prevented due to fog during 20-31 January. MIROVA thermal data show elevated thermal anomalies from July through January, with a decrease in energy in November through January (figure 77). The radiative power detected in December-January was the lowest since June 2018.
Morphological changes to Anak Krakatau. Images taken before and after the collapse event show changes in the shoreline, destruction of vegetation, and removal of the cone (figure 78). A TerraSAR-X image acquired on 29 January shows that in the location where the cone and active vent was, a bay had formed, opening to the W (figure 79). These changes are also visible in Sentinel-2 satellite images, with the open bay visible through light cloud cover on 29 December (figure 80).
By 9 January a rim had formed, closing off the bay to the ocean and forming a circular crater lake. Photos by James Reynolds on 11 January show a new crater rim to the W of the vent, which was filled with water (figure 81). Steam and/or gas emissions were emanating from the surface in that area. The southern lava delta surface was covered with tephra, and part of the lava delta had been removed, leaving a smooth coastline. By the time these images were taken there was already extensive erosion of the fresh deposits around the island. Fresh material extended the coast in places and filled in bays to produce a more even shoreline.
References. Simkin, T., and Fiske, R.S., 1983, Krakatau 1883: the volcanic eruption and its effects: Smithsonian Institution Press, Washington DC, 464 p. ISBN 0-87474-841-0.
Sudradjat (Sumartadipura), A., 1982. The morphological development of Anak Krakatau Volcano, Sunda Straight. Geologi Indonesia, 9(1):1-11.
Geologic Background. The renowned Krakatau (frequently mis-named as Krakatoa) volcano lies in the Sunda Strait between Java and Sumatra. Collapse of an older edifice, perhaps in 416 or 535 CE, formed a 7-km-wide caldera. Remnants of that volcano are preserved in Verlaten and Lang Islands; subsequently the Rakata, Danan, and Perbuwatan cones were formed, coalescing to create the pre-1883 Krakatau Island. Caldera collapse during the catastrophic 1883 eruption destroyed Danan and Perbuwatan, and left only a remnant of Rakata. This eruption caused more than 36,000 fatalities, most as a result of tsunamis that swept the adjacent coastlines of Sumatra and Java. Pyroclastic surges traveled 40 km across the Sunda Strait and reached the Sumatra coast. After a quiescence of less than a half century, the post-collapse cone of Anak Krakatau (Child of Krakatau) was constructed within the 1883 caldera at a point between the former Danan and Perbuwatan cones. Anak Krakatau has been the site of frequent eruptions since 1927.
Information Contacts: Badan Nasional Penanggulangan Bencana (BNPB), National Disaster Management Agency, Graha BNPB - Jl. Scout Kav.38, East Jakarta 13120, Indonesia (URL: http://www.bnpb.go.id/); Sutopo Purwo Nugroho, BNPB (Twitter: @Sutopo_PN, URL: https://twitter.com/Sutopo_PN ); Geospatial Information Authority of Japan (GSI), 1 Kitasato, Tsukuba, Ibaraki 305-0811, Japan (URL: http://www.gsi.go.jp/ENGLISH/index.html); Badan Informasi Geospasial (BIG), Jl. Raya Jakarta - Bogor KM. 46 Cibinong 16911, Indonesia (URL: http://www.big.go.id/atlas-administrasi/); NASA Goddard Space Flight Center (NASA/GSFC), Global Sulfur Dioxide Monitoring Page, Atmospheric Chemistry and Dynamics Laboratory, 8800 Greenbelt Road, Goddard, Maryland, USA (URL: https://so2.gsfc.nasa.gov/); JAXA | Japan Aerospace Exploration Agency, 7-44-1 Jindaiji Higashi-machi, Chofu-shi, Tokyo 182-8522, Japan (URL: https://global.jaxa.jp/); MIROVA (Middle InfraRed Observation of Volcanic Activity), a collaborative project between the Universities of Turin and Florence (Italy) supported by the Centre for Volcanic Risk of the Italian Civil Protection Department (URL: http://www.mirovaweb.it/); Sentinel Hub Playground (URL: https://www.sentinel-hub.com/explore/sentinel-playground); Øystein Lund Andersen (Twitter: @OysteinLAnderse, https://twitter.com/OysteinLAnderse, URL: https://www.oysteinlundandersen.com/krakatau-volcano-witnessing-the-eruption-tsunami-22december2018/); James Reynolds, Earth Uncut TV (Twitter: @EarthUncutTV, URL: https://www.earthuncut.tv/, YouTube: https://www.youtube.com/channel/UCLKYsEXfI0PGXeKYL1KV7qA); Chris Vagasky, Vaisala Inc., Louisville, Colorado, USA (URL: https://www.vaisala.com/en?type=1, Twitter: @COweatherman, URL: https://twitter.com/COweatherman).
Kuchinoerabujima (Japan) — March 2019 Cite this Report
Kuchinoerabujima
Japan
30.443°N, 130.217°E; summit elev. 657 m
All times are local (unless otherwise noted)
Weak explosions and ash plumes beginning 21 October 2018
Activity at Kuchinoerabujima is exemplified by interim explosions and periods of high seismicity. A weak explosion occurred on 3 August 2014, the first since 1980, and was followed by several others during 29 May-19 June 2015 (BGVN 42:03). This report describes events through February 2019. Information is based on monthly and annual reports from the Japan Meteorological Agency (JMA) and advisories from the Tokyo Volcanic Ash Advisory Center (VAAC). Activity has been limited to Kuchinoerabujima's Shindake Crater.
Activity during 2016-2018. According to JMA, between July 2016 and August 2018, the volcano was relatively quiet. Deflation had occurred since January 2016. On 18 April 2018 the Alert Level was lowered from 3 to 2 (on a scale of 1-5). A low-temperature thermal anomaly persisted near the W fracture in Shindake crater. During January-March 2018, both the number of volcanic earthquakes (generally numerous and typically shallow) and sulfur dioxide flux remained slightly above baselines levels in August 2014 (60-500 tons/day compared tp generally less than 100 tons/day in August 2014).
JMA reported that on 15 August 2018 a swarm of deep volcanic earthquakes was recorded, prompting an increase in the Alert Level to 4. The earthquake hypocenters were about 5 km deep, below the SW flanks of Shindake, and the maximum magnitude was 1.9. They occurred at about the same place as the swarm that occurred just before the May 2015 eruption. Sulfur dioxide emissions had increased since the beginning of August; they were 1,600, 1,000, and 1,200 tons/day on 11, 13, and 17 August, respectively. No surficial changes in gas emissions or thermal areas were observed during 16-20 August. On 29 August, JMA downgraded the Alert Level to 3, after no further SO2 flux increase had occurred in recent days and GNSS measurements had not changed.
A very weak explosion was recorded at 1831 on 21 October, with additional activity between 2110 on 21 October and 1350 on 22 October; plumes rose 200 m above the crater rim. During an overflight on 22 October, observers noted ash in the emissions, though no morphological changes to the crater nor ash deposits were seen. Based on satellite images and information from JMA, the Tokyo VAAC reported that during 24-28 October ash plumes rose to altitudes of 0.9-1.5 km and drifted in multiple directions. During a field observation on 28 October, JMA scientists did not observe any changes in the thermal anomalies at the crater.
JMA reported that during 31 October-5 November 2018, very small events released plumes that rose 500-1,200 m above the crater rim. On 6 November, crater incandescence began to be periodically visible. During 12-19 November, ash plumes rose as high as 1.2 km above the crater rim and, according to the Tokyo VAAC, drifted in multiple directions. Observers doing fieldwork on 14 and 15 November noted that thermal measurements in the crater had not changed. Intermittent explosions during 22-26 November generated plumes that rose as high as 2.1 km above the crater rim. During 28 November-3 December the plumes rose as high as 1.5 km above the rim.
JMA reported that at 1637 on 18 December an explosion produced an ash plume that rose 2 km and then disappeared into a weather cloud. The event ejected material that fell in the crater area, and generated a pyroclastic flow that traveled 1 km W and 500 m E of the crater. Another weak explosion occurred on 28 December, scattering large cinders up to 500 m from the crater.
The Tokyo VAAC did not issue any ash advisories for aviation until 21 October 2018, when it issued at least one report every day through 13 December. It also issued advisories on 18-20 and 28 December.
Activity during January-early February 2019. JMA reported that at 0919 local time on 17 January 2019 an explosion generated a pyroclastic flow that reached about 1.9 km NW and 1 km E of the crater. It was the strongest explosion since October 2018. In addition, "large cinders" fell about 1-1.8 km from the crater.
Tokyo VAAC ash advisories were issued on 1, 17, 20, and 29 January 2018. An explosion at 1713-1915 on 29 January produced an ash plume that rose 4 km above the crater rim and drifted E, along with a pyroclastic flow. Ash fell in parts of Yakushima. During 30 January-1 February and 3-5 February, white plumes rose as high as 600 m. On 2 February, an explosion at 1141-1300 generated a plume that rose 600 m. No additional activity during February was reported by JMA. The Alert Level remained at 3.
Geologic Background. A group of young stratovolcanoes forms the eastern end of the irregularly shaped island of Kuchinoerabujima in the northern Ryukyu Islands, 15 km W of Yakushima. The Furudake, Shindake, and Noikeyama cones were erupted from south to north, respectively, forming a composite cone with multiple craters. All historical eruptions have occurred from Shindake, although a lava flow from the S flank of Furudake that reached the coast has a very fresh morphology. Frequent explosive eruptions have taken place from Shindake since 1840; the largest of these was in December 1933. Several villages on the 4 x 12 km island are located within a few kilometers of the active crater and have suffered damage from eruptions.
Information Contacts: Japan Meteorological Agency (JMA), Otemachi, 1-3-4, Chiyoda-ku Tokyo 100-8122, Japan (URL: http://www.jma.go.jp/); Tokyo Volcanic Ash Advisory Center (VAAC), 1-3-4 Otemachi, Chiyoda-ku, Tokyo, Japan (URL: http://ds.data.jma.go.jp/svd/vaac/data/).
Masaya
Nicaragua
11.9844°N, 86.1688°W; summit elev. 594 m
All times are local (unless otherwise noted)
Lava lake persists with decreased thermal output, November 2018-February 2019
Nicaragua's Volcan Masaya has an intermittent lava lake that has attracted visitors since the time of the Spanish Conquistadores; tephrochronology has dated eruptions back several thousand years. The unusual basaltic caldera has had historical explosive eruptions in addition to lava flows and an actively circulating lava lake. An explosion in 2012 ejected ash to several hundred meters above the volcano, bombs as large as 60 cm fell around the crater, and ash fell to a thickness of 2 mm in some areas of the park. The reemergence of the lava lake inside Santiago crater was reported in December 2015. By late March 2016 the lava lake had grown and intensified enough to generate a significant thermal anomaly signature which has varied in strength but continued at a moderate level into early 2019. Information for this report, which covers the period from November 2018 through February 2019, is provided by the Instituto Nicareguense de Estudios Territoriales (INETER) and satellite -based imagery and thermal data.
The lava lake in Santiago Crater remained visible and active throughout November 2018 to February 2019 with little change from the previous few months (figure 70). Seismic amplitude RSAM values remained steady, oscillating between 10 and 40 RSAM units during the period.
Every few months INETER carries out SO2 measurements by making a transect using a mobile DOAS spectrometer that samples for gases downwind of the volcano. Transects were done on 9-10 October 2018, 21-24 January 2019, and 18-21 February 2019 (figure 71). Average values during the October transect were 1,454 tons per day, in January they were 1,007 tons per day, and in February they averaged 1,318 tons per day, all within a typical range of values for the last several months.
During a visit by INETER technicians in early November 2018, the lens of the Mirador 1 webcam, that had water inside it and had been damaged by gases, was cleaned and repaired. During 21-24 January 2019 INETER made a site visit with scientists from the University of Johannes Gutenberg in Mainz, Germany, to measure halogen species in gas plumes, and to test different sampling techniques for volcanic gases, including through spectroscopic observations with DOAS equipment, in-situ gas sampling (MultiGAS, denuders, alkaline traps), and using a Quadcopter UAV (drone) sampling system.
Periodic measurements of CO2 from the El Comalito crater have been taken by INETER for many years. The most recent observations on 19 February 2019 indicated an emission rate of 46 ± 3 tons per day of CO2, only slightly higher than the average value over 16 measurements between 2008 and 2019 (figure 72).
Satellite imagery (figure 73) and in-situ thermal measurements during November 2018-February 2019 indicated constant activity at the lava lake and no significant changes during the period. On 14 January 2019 temperatures were measured with the FLIR SC620 thermal camera, along with visual observations of the crater; abundant gas was noted, and no explosions from the lake were heard. The temperature at the lava lake was measured at 107°C, much cooler than the 340°C measured in September 2018 (figure 74).
Thermal anomaly data from satellite instruments also confirmed moderate levels of ongoing thermal activity. The MIROVA project plot indicated activity throughout the period (figure 75), and a plot of the number of MODVOLC thermal alerts by month since the lava lake first appeared in December 2015 suggests constant activity at a reduced thermal output level from the higher values in early 2017 (figure 76).
Geologic Background. Masaya volcano in Nicaragua has erupted frequently since the time of the Spanish Conquistadors, when an active lava lake prompted attempts to extract the volcano's molten "gold" until it was found to be basalt rock upon cooling. It lies within the massive Pleistocene Las Sierras caldera and is itself a broad, 6 x 11 km basaltic caldera with steep-sided walls up to 300 m high. The caldera is filled on its NW end by more than a dozen vents that erupted along a circular, 4-km-diameter fracture system. The Nindirí and Masaya cones, the source of observed eruptions, were constructed at the southern end of the fracture system and contain multiple summit craters, including the currently active Santiago crater. A major basaltic Plinian tephra erupted from Masaya about 6,500 years ago. Recent lava flows cover much of the caldera floor and there is a lake at the far eastern end. A lava flow from the 1670 eruption overtopped the north caldera rim. Periods of long-term vigorous gas emission at roughly quarter-century intervals have caused health hazards and crop damage.
Information Contacts: Instituto Nicaragüense de Estudios Territoriales (INETER), Apartado Postal 2110, Managua, Nicaragua (URL: http://www.ineter.gob.ni/); MIROVA (Middle InfraRed Observation of Volcanic Activity), a collaborative project between the Universities of Turin and Florence (Italy) supported by the Centre for Volcanic Risk of the Italian Civil Protection Department (URL: http://www.mirovaweb.it/); Hawai'i Institute of Geophysics and Planetology (HIGP) - MODVOLC Thermal Alerts System, School of Ocean and Earth Science and Technology (SOEST), Univ. of Hawai'i, 2525 Correa Road, Honolulu, HI 96822, USA (URL: http://modis.higp.hawaii.edu/); Sentinel Hub Playground (URL: https://www.sentinel-hub.com/explore/sentinel-playground); Alun Ebenezer (Twitter: @AlunEbenezer, URL: https://twitter.com/AlunEbenezer).
Pacaya
Guatemala
14.382°N, 90.601°W; summit elev. 2569 m
All times are local (unless otherwise noted)
Continuous activity from the cone in Mackenney crater; daily lava flows on the NW flank during October 2018-January 2019
Extensive lava flows, bomb-laden Strombolian explosions, and ash plumes emerging from MacKenney crater have characterized the persistent activity at Pacaya since 1961. The latest eruptive episode began with intermittent ash plumes and incandescence in June 2015; the growth of a new pyroclastic cone inside the summit crater was confirmed in mid-December 2015. The pyroclastic cone has continued to grow, rising above the crater rim in late 2017 and sending numerous flows down the flanks of the crater throughout 2018 (BGVN 43:11). Similar activity continued during October 2018-January 2019, covered in this report, with information provided primarily by Guatemala's Instituto Nacional de Sismologia, Vulcanologia, Meteorologia e Hydrologia (INSIVUMEH).
There were few variations in the eruptive activity at Pacaya during October 2018-January 2019. Virtually constant Strombolian activity from the summit of the pyroclastic cone within Mackenney crater produced ejecta that rose 5-30 m daily. Periods of increased activity occasionally increased the height of the ejecta to 50 m. Lava flows descended the NW flank of Mackenney cone towards Cerro Chino crater, usually one or two a day, sometimes three or four. They travelled 50-300 m down the flank; the longest reached 600 m in mid-October and 500 m at the end of January. Steam and gas plumes persisted from the summit; a single VAAC report mentioned dilute ash in mid-October. Plumes generally rose a few hundred meters above the summit, occasionally reaching 700-800 m. Incandescent avalanche blocks at the heads of the flows were sometimes as large as a meter in diameter and traveled far down the flanks.
Constant Strombolian activity during October 2018 from the pyroclastic cone within Mackenney crater was ejected up to 30 m above the summit of the cone throughout the month, with occasional more intense episodes rising 50 m. Lava flows were reported daily by INSIVUMEH on the NW flank from 50 to 300 m long. White and blue gas-and-steam emissions generally rose a few hundred meters from the summit of the pyroclastic cone and usually drifted S or N. The highest rose 800 m on 26 and 27 October. In a special report issued late on 12 October INSIVUMEH noted that seismicity had increased during the day; Strombolian explosions also increased and ejected material 25-50 m above the summit, producing block avalanches in the vicinity of the flows (figure 103). The cone within Mackenney crater continued to grow, reaching 75 m above the rim and nearly filling the crater at its base. According to the Washington VAAC, on 14 October a pilot reported minor ash emissions moving W at an estimated 650 m above the summit. Multi-spectral imagery showed a faint ash plume moving W at 3.4 km altitude, and a well-defined hotspot was seen in short-wave infrared imagery.
Similar activity persisted throughout November 2018 (figures 104 and 105). The Strombolian activity usually rose 5-30 m high; on 24 November INSIVUMEH reported ejecta 75 m high and the presence of four lava flows on the NW flank that traveled distances ranging from 50 to 200 m. Steam-and-gas emissions rose no more than 500 m above the summit. On 24 and 28 November incandescent avalanche blocks were observed at the fronts of the lava flows.
During December 2018, continuous Strombolian activity was observed 25 m high. Incandescent avalanche blocks were noted at the fronts of the lava flows more frequently than in previous months. One to three lava flows extending 50-300 m down the NW flank towards Cerro Chino were reported every day that the flanks were visible (figure 106). Late on 13 December INSIVUMEH released a special bulletin noting that explosions were heard as far as 8 km from Mackenney crater, and Strombolian activity rose 25-50 m. Constant tremor activity had been produced from the ongoing lava flows descending the flank; the incandescent avalanche blocks up to 1 m in diameter were falling from the front of the flows. By the end of December, the growing pyroclastic cone had filled the inside of Mackenney crater, reaching 75-100 m above the crater rim. In a special information report on 28 December, INSIVUMEH noted that changes in the eruptive patterns included an increase in seismic tremor along with more persistent and higher energy Strombolian activity from the active cone, which frequently sent material outside of the crater onto the flanks.
There were no significant changes in activity during January 2019. Constant Strombolian activity rose 5-30 m above the summit; INSIVUMEH reported the height at 50 m on 7 January. Large incandescent avalanche blocks were noted at the front of the lava flows several times; one or two flows daily reached lengths of 100-300 m. The flow reported on 29 January reached 500 m, traveling down the NW flank towards Cerro Chino. Steam plumes, sometimes with bluish gas, rose generally to around 100 m above the summit, occasionally higher. Growth and destruction of the pyroclastic cone inside Mackenney crater continued as it had for the previous several months. The persistent Strombolian and lava flow activity was responsible for a strong thermal signature recorded in satellite data and plotted by the MIROVA project during the period (figure 107).
Geologic Background. Eruptions from Pacaya are frequently visible from Guatemala City, the nation's capital. This complex basaltic volcano was constructed just outside the southern topographic rim of the 14 x 16 km Pleistocene Amatitlán caldera. A cluster of dacitic lava domes occupies the southern caldera floor. The post-caldera Pacaya massif includes the older Pacaya Viejo and Cerro Grande stratovolcanoes and the currently active Mackenney stratovolcano. Collapse of Pacaya Viejo between 600 and 1,500 years ago produced a debris-avalanche deposit that extends 25 km onto the Pacific coastal plain and left an arcuate scarp inside which the modern Pacaya volcano (Mackenney cone) grew. The NW-flank Cerro Chino crater was last active in the 19th century. During the past several decades, activity has consisted of frequent Strombolian eruptions with intermittent lava flow extrusion that has partially filled in the caldera moat and covered the flanks of Mackenney cone, punctuated by occasional larger explosive eruptions that partially destroy the summit.
Information Contacts: Instituto Nacional de Sismologia, Vulcanologia, Meteorologia e Hydrologia (INSIVUMEH), Unit of Volcanology, Geologic Department of Investigation and Services, 7a Av. 14-57, Zona 13, Guatemala City, Guatemala (URL: http://www.insivumeh.gob.gt/); Coordinadora Nacional para la Reducción de Desastres (CONRED), Av. Hincapié 21-72, Zona 13, Guatemala City, Guatemala (URL: http://conred.gob.gt/www/index.php); MIROVA (Middle InfraRed Observation of Volcanic Activity), a collaborative project between the Universities of Turin and Florence (Italy) supported by the Centre for Volcanic Risk of the Italian Civil Protection Department (URL: http://www.mirovaweb.it/); Carlos Barrios (Twitter: @shekano, URL: https://twitter.com/shekano).
Planchon-Peteroa (Chile) — March 2019 Cite this Report
Planchon-Peteroa
Chile
35.223°S, 70.568°W; summit elev. 3977 m
All times are local (unless otherwise noted)
New eruption begins in September 2018; continuous ash emissions and intermittent explosions December 2018-February 2019
Planchón-Peteroa, a large basaltic to dacitic volcanic complex, lies on the remote Chile-Argentina border roughly 200 km S of Santiago, Chile. Its intermittent eruptive history has been characterized by short-lived explosive events with gas and ash plumes from active craters around the Volcán Peteroa area (figure 10). The most recent eruption, from February-June 2011, was a series of sporadic ash and gas plumes which rose as high as 5.5 km altitude and produced ashfall as far as 70 km away (BGVN 38:11). After seven years of little surface activity, a new series of ash emissions and explosive activity began in September 2018; a major seismic swarm in 2016 did not result in surface activity. Information for this report, covering through February 2019, was provided primarily by Servicio Nacional de Geología y Minería (SERNAGEOMIN), Observatorio Volcanológico de Los Andes del Sur (OVDAS) and the Buenos Aires Volcanic Ash Advisory Center (VAAC).
Planchón-Peteroa remained quiet during 2014 and 2015. A significant seismic swarm during 2016 led SERNAGEOMIN to raise the alert level for nearly the entire year, although no surface eruptive activity took place. A smaller seismic event in 2017 also did not include surface activity. Increased emissions that included particulate material were first reported in September 2018; the first explosions with ash took place in early November 2018. Persistent emissions with dense plumes of ash began in mid-December and continued through February 2019; intermittent pulses and explosions during that time coincided with increased seismic and thermal activity.
Activity during 2014-2015. Background levels of volcano-tectonic (VT) and long-period (LP) earthquakes were reported by SERNAGEOMIN throughout 2014 and 2015. A single seismic event greater than M 3.0 was reported on 11 May 2014, located within 1 km of the crater. Inclinometer, SO2, and thermal data all indicated no significant changes during the period. During March-July 2015 sporadic fumaroles were observed rising less than 200 m from the active crater.
Activity during 2016. An increase in LP seismic events from a few to several hundred per month was noted by SERNAGEOMIN beginning in January 2016. As a result, they increased the Alert Level of the volcano from Green to Yellow on 22 January. The webcam revealed degassing of mainly water vapor reaching close to 200 m above the active crater. During the first two weeks of February 2016 the number of LP events increased ten-fold from 328 in January to 3,634; all the events were smaller than M 1.1. The rate of LP seismicity increased further during the last two weeks of February to 7,301 events, and the steam plumes reached 400 m above the crater. LP seismicity remained high during March with 9,627 measured events; similar numbers of events were sustained through May 2016 (figure 11).
LP seismicity decreased substantially to only 470 events during the first two weeks of June 2016, leading SERNAGEOMIN to reduce the Alert Level to Green. However, during the second half of June a spike in the VT events from 8 during the first half of the month to 944 caused authorities to raise the Alert Level back to Yellow. This increase in VT seismic events was also accompanied by an increase in the number and spectral frequency of the LP events. They changed from having dominant frequencies between 1.9 and 2 Hz to 4-5 Hz, with a location that moved closer to the crater zone than before, and occurred at depths of around 1.5 km. On 28 June a M 3.4 VT event occurred 4.3 km NNE of the crater at a depth of 4.8 km. LP events numbered between 2,100 and 4,100 events monthly during June-September.
VT seismic events increased to their highest levels of 2016 during July (4,609 events) before beginning a gradual decline through the end of the year, ending with about 700 events in December (figure 11). A strong steam plume rose 550 m above the crater on 4 July 2016 and was accompanied by 400 VT events. The number of LP events increased significantly for the second time during the year beginning in October and remained over 14,000 events through January 2017. Three seismic events with local magnitude (ML) greater than M 3.0 were recorded on 7, 12, and 16 October; the locations of the events were approximately 3 km NNW at an average depth of 5 km. A M 3.4 event was recorded on 19 November. Low-level steam plumes did not rise more than 200 m above the crater for the remainder of the year. SERNAGEOMIN installed two new seismic stations, on 29 November and 15 December 2016.
Activity during 2017. Levels of both VT and LP seismic events declined during January-May 2017. A M 3.5 VT earthquake on 19 February was located 3.7 km NNW of the crater and 4.5 km deep. On 28 March, a M 3.6 event occurred in a similar location. Steam plumes occasionally rose as high as 200 m during the period. SERNAGEOMIN lowered the Alert Level to Green on 17 May 2017 based on the gradual decrease in seismicity to baseline levels accompanied by little to no surface activity.
A seismic swarm of 39 events on 15 June was located 14 km SE and 8-10 km deep. VT seismic events during the first half of July 2017 were located 4-7 km deep under the summit craters and included a M 4.0 event on 8 July. An increase in both VT and LP seismicity in early July led SERNAGEOMIN to raise the Alert Level to Yellow on 10 July (figure 11). The monthly number of VT events dropped below 100 in August and remained low for the rest of the year. A M 3.5 VT event was reported on 5 November, located 6.5 km E and 6 km deep. On 14 November seismometers recorded a 30-minute tremor event. A brief increase in degassing began on 23 November; steam plumes reached 600 m the next day but returned to less than 150 m by the end of the month. SERNAGEOMIN lowered the Alert Level to Green in mid-December 2017 as a result of decreased surface and seismic activity.
Activity during 2018. Low levels of surface and seismic activity persisted into early June 2018. Steam plumes rose no more than 500 m above the crater, numbers of VT events remained low, and the numbers of LP events decreased steadily. In mid-May the amplitude of continuous tremor events began to increase. The frequency of the tremor events had been around 1-2 Hz earlier in the year, but beginning on 21 June they increased to around 5 Hz; this was accompanied by an oscillating amplitude seismic signal referred to as "banded tremor." SERNAGEOMIN interpreted the increase in amplitude and the banded tremor as an indication of increased heat in the system, and as a result raised the Alert Level to Yellow on 6 July 2018. The number of LP seismic events increased steadily beginning in June, along with the amplitude of the seismic events, although there were no apparent changes in surface activity (figure 12). Weak thermal anomalies were first detected in satellite data in mid-August. SERNAGEOMIN noted that the locations of the seismic events were migrating closer to the crater, and the depths were shallowing from June to August 2018.
SERNAGEOMIN first reported the presence of particulate material in the persistent degassing from the active crater on 21 September 2018, noting that the degassing steam turned "slightly gray" but plumes did not rise more than 600 m above the crater. Mostly-white emissions continued during October, although they specifically mentioned emissions of low-intensity particulate material observed during 13-15 October, rising 600 m above the crater. Three MIROVA thermal alerts appeared on 14 October, the first over 1 MW to be recorded (figure 13). During the second half of October, SERNAGEOMIN noted persistent mostly-white degassing in the webcam that rose up to 700 m above the crater. They also reported webcam images in the second half of October that showed ash emissions rising a short distance above the crater, generally drifting SE, although they did not specify certain dates
SERNAGEOMIN reported an explosion with an ash emission visible in the webcam on 7 November 2018; they reported the plume height at about 1,000 m above the crater (figure 14). The Buenos Aires VAAC reported the ash plume drifting SE visible in satellite imagery at 4.3 km altitude. Low-altitude ash emissions were observed in the webcam multiple additional times during November. In a special report issued on 7 December, SERNAGEOMIN reported a 1,300-m-high ash emission that dispersed ESE. The Buenos Aires VAAC reported continuous ash emissions beginning on 14 December that lasted through the rest of the month (figure 15).
Plumes generally drifted SE at 4.6-4.9 km altitude during December, with occasional stronger puffs that were reported as high as 5.8 km altitude (figure 16). On 16 December the webcam recorded high-intensity pulsating ash emissions that drifted 20 km SE. Incandescence was visible around the crater that night. Webcam images showed dark gray plumes during the second half of December, suggesting a high concentration of ash; the pulsating nature of the emissions was observed in the webcam again during 24-27 December, reaching 1,600 m above the crater. Multiple thermal alerts were reported during the second half of the month.
Activity during January-February 2019. Dense ash plumes were reported daily during January and February 2019 by both SERNAGEOMIN and the Buenos Aires VAAC; plumes heights were generally between 400 m and 1 km above the active crater (figure 17). Higher plumes that reached 2 km above the crater and drifted E were reported on 1 and 3 February (figure 18). SERNAGEOMIN noted that the first of these events was accompanied by an increase in very low frequency seismic activity (VLP).
Satellite-based SO2 instruments also detected a significant gas plume on 3 February (figure 19). SERNAGEOMIN reported a tremor signal on 14 February 2019 associated with a dense ash plume that rose to 2 km above the summit and drifted NE. Webcam images during the second half of February showed constant degassing; gray plumes drifted mostly SE about 2 km above the summit (figure 20).
Geologic Background. Planchón-Peteroa is an elongated complex volcano along the Chile-Argentina border with several overlapping calderas. Activity began in the Pleistocene with construction of the basaltic-andesite to dacitic Volcán Azufre, followed by formation of basaltic and basaltic-andesite Volcán Planchón, 6 km to the north. About 11,500 years ago, much of Azufre and part of Planchón collapsed, forming the massive Río Teno debris avalanche, which traveled 95 km to reach Chile's Central Valley. Subsequently, Volcán Planchón II was formed. The youngest volcano, andesitic and basaltic-andesite Volcán Peteroa, consists of scattered vents between Azufre and Planchón. Peteroa has been active into historical time and contains a small steaming crater lake. Historical eruptions from the complex have been dominantly explosive, although lava flows were erupted in 1837 and 1937.
Information Contacts: Servicio Nacional de Geología y Minería (SERNAGEOMIN), Observatorio Volcanológico de Los Andes del Sur (OVDAS), Avda Sta María No. 0104, Santiago, Chile (URL: http://www.sernageomin.cl/); Buenos Aires Volcanic Ash Advisory Center (VAAC), Servicio Meteorológico Nacional-Fuerza Aérea Argentina, 25 de mayo 658, Buenos Aires, Argentina (URL: http://www.smn.gov.ar/vaac/buenosaires/inicio.php); MIROVA (Middle InfraRed Observation of Volcanic Activity), a collaborative project between the Universities of Turin and Florence (Italy) supported by the Centre for Volcanic Risk of the Italian Civil Protection Department (URL: http://www.mirovaweb.it/); NASA Goddard Space Flight Center (NASA/GSFC), Global Sulfur Dioxide Monitoring Page, Atmospheric Chemistry and Dynamics Laboratory, 8800 Greenbelt Road, Goddard, Maryland, USA (URL: https://so2.gsfc.nasa.gov/); Servicio Geológico Minero Argentino (SEGEMAR), Av. General Paz 5445 (colectora), Parque Tecnológico Miguelete, Edificio 14 y Edificio 25, San Martín (B1650 WAB) (URL: http://www.segemar.gov.ar/); Sentinel Hub Playground (URL: https://www.sentinel-hub.com/explore/sentinel-playground); Cumbres y Montañas de O'Higgins (URL: https://www.facebook.com/cymohiggins/); Volcanes de Chile (URL: https://www.volcanesdechile.net/, Twitter: @volcanesdechile); Felipe Aguilera Volcanes (Twitter: @FelipeVolcanes, URL: https://twitter.com/FelipeVolcanes).
Popocatepetl (Mexico) — March 2019 Cite this Report
Popocatepetl
Mexico
19.023°N, 98.622°W; summit elev. 5393 m
All times are local (unless otherwise noted)
Explosions with ash plumes and incandescent ejecta continue during September 2018-February 2019
Frequent historical eruptions have been reported from Mexico's Popocatépetl going back to the 14th century. Activity increased in the mid-1990s after about 50 years of quiescence, and the current eruption, ongoing since January 2005, has included numerous episodes of lava-dome growth and destruction within the 500-m-wide summit caldera. Multiple emissions of steam and gas occur daily, rising generally 1-3 km above the 5.4-km-elevation summit; many contain small amounts of ash. Larger, more explosive events with ash plumes and incandescent ejecta landing on the flanks usually occur several times every week.
Activity through August 2018 was typical of the ongoing eruption with near-constant emissions of water vapor, gas, and minor ash, as well as multiple explosions every week with ash-plumes and incandescent blocks scattered on the flanks (BGVN 43:11). This report covers similar activity from September 2018 through February 2019. Information about Popocatépetl comes from daily reports provided by México's Centro Nacional de Prevención de Desastres (CENAPRED); ash emissions are also reported by the Washington Volcanic Ash Advisory Center (VAAC). Satellite visible and thermal imagery and SO2 data also provide helpful observations of activity.
Near-constant emissions of steam and gas, often with minor ash content, were typical activity throughout September 2018-February 2019. Intermittent larger explosions with plumes of moderate ash content that generated ashfall in nearby communities were reported each month except November. Periods with increased explosive activity that consisted of multiple daily explosions included all of September into early October, early December 2018, and the second half of February 2019 (figure 116). Increased observations of incandescence at the summit generally coincided with increases in explosive activity. Increases in thermal anomalies measured by the MIROVA project during this time also correlated with times of increased explosive activity as reported by CENAPRED (figure 117).
Activity during September 2018. Multiple explosions with ash plumes were reported nearly every day in September (figure 118). The Washington VAAC reported an ash plume visible in satellite imagery 15 km NW of the summit at 7.6 km altitude on 4 September. Most plumes reported by the VAAC during the month rose to 6.1-7.6 km and drifted up to 40 km in multiple directions. Two small episodes of ash emissions with tremor on 16 September were followed the next day by a series of emissions, explosions, and tremor that lasted for over six hours; incandescent blocks were visible on the flanks in the early morning. An increase in activity late on 18 September produced Strombolian eruptions that lasted for nearly eight hours along with ash emissions and incandescent blocks on the flanks. A plume on 19 September still had detectable ash 150 km NE of the summit; a smaller plume drifting E was responsible for ashfall reported in Tlaxcala.
Discrete puffs of ash were observed by the Washington VAAC on 20 September moving WSW extending around 200 km from the summit. Three explosions on 21 September ejected incandescent blocks onto the NE flank. During an overflight on 21 September, CENAPRED observed dome number 80, partly destroyed by the recent explosions (figure 119). The Washington VAAC reported an ash plume at 8.8 km altitude on 21 September 30 km WSW from the summit. Ashfall was reported by CENACOM (Mexican National Communications Center) on 29 September in Atlautla, Tehuixtitlan, and Cuecuecuautitla in the State of Mexico, and in the Tláhuac Delegation, Iztapalapa, and Xochimilco in Mexico City.
Activity during October and November 2018. The Washington VAAC reported an ash plume at 7 km altitude on 2 October, 35 km W of the summit. Numerous smaller plumes were reported by the VAAC during both months at about 6 km altitude drifting in multiple directions. Two larger explosions on 8 October produced ash plumes that rose to 3.5 and 2.4 km, respectively, above the summit, and drifted NE (figure 120). As a result, ashfall was reported at the Puebla airport. On 10 and 12 October, extended periods of LP tremor were accompanied by gas emissions, but otherwise lower levels of activity were noted for much of the month. An ash plume extended over 80 km NE at 7.6 km altitude on 10 November. An explosion on 13 November produced incandescent fragments on the flanks. During 19-21 November episodes of LP seismicity and tremors produced gas and ash emissions; some of the episodes lasted for as long as 13 hours; incandescent fragments were observed on the upper slopes during the more intense periods. On 22 November scientists on an overflight by CENAPRED observed dome 81 with a diameter of 175 m and an estimated depth of 30 m (figure 121).
Activity during December 2018. Increased ash emissions were reported in early December 2018, producing ash plumes that rose at least 1 km above the crater and drifted mostly E; incandescent blocks ejected on 5 December fell mostly back into the crater. Multiple explosions on 6 and 7 December produced ash plumes that rose as high as 2.5 km above the crater and resulted in ashfall in Amecameca and Tlalmanalco; they also produced incandescent blocks that traveled as far at 2.5 km from the crater, according to CENAPRED. An explosion on 9 December produced a 2-km-high ash plume that drifted NE (figure 122). Satellite images captured during clear skies on 18 December showed incandescence at the dome inside the summit crater, and dark ash and ejecta covering much of the upper flanks (figure 123). An ash plume was centered about 100 km NE of the summit on 24 December at 7.6 km altitude, and dissipating rapidly, according to the Washington VAAC. Incandescent blocks were ejected onto the flanks on 26 December during an evening explosion.
Activity during January 2019. An explosion in the early morning of 16 January 2019 produced incandescent blocks that traveled 1.5 km down the slopes. It also produced an ash emission that lasted for 25 minutes; the seismic signal associated with the event was a mixture of harmonic tremor and high-frequency low-amplitude earthquakes. In the first minutes the height of the column reached 1,000 m above the crater, later it decreased to 500 m; ash was dispersed ENE. Late on 22 January a large explosion produced an ash plume that rose 3.5 km above the crater and numerous incandescent blocks that were observed as far as 2 km from the summit (figure 124); ashfall was reported in Santa Isabel Cholula, Santa Ana Xalmimilulco, Domingo Arenas, San Martin Texmelucan, Tlalancaleca, San Salvador el Verde, San Andres Calpan, San Nicolás de los Ranchos, and Huejotzingo, all in the state of Puebla. A large discrete ash plume was observed in satellite imagery by the Washington VAAC on 24 January at 6.7 km altitude moving NE to about 35 km distance before dissipating. In an overflight on 27 January CENAPRED noted that the internal crater remained about 300 m wide and 150 m deep, and no dome was visible (figure 125).
Activity during February 2019. Several days of increased activity of harmonic tremor and explosions were reported during 14-19 February 2019 (figure 126). Incandescent blocks from Strombolian activity appeared on the flanks late on 14 February traveling as far as 1.5 km, along with a continuous stream of ash and gas that drifted SW for seven hours. The initial ash plume rose 800 m, but by early the next day had risen to 2 km. Ashfall was reported in the communities of Hueyapan, Tetela del Volcán, Zacualpan, Temoac, Jantetelco, Cuautla, Ocuituco, and Yecapixtla, in the state of Morelos, and in Tochimilco, Puebla, on 15 February.
A new episode of Strombolian activity early on 16 February lasted for six hours and produced 2-km-high ash plumes that drifted SE. Later that afternoon, a new harmonic tremor episode, again lasting about six hours, was accompanied by water vapor and gas emissions that drifted NE and incandescent blocks ejected 400 m down the flanks. A Sentinel-2 satellite image that day recorded a significant thermal signature from the summit dome (figure 127).
Satellite instruments recorded a strong SO2 signature from the volcano during 15-18 February (figure 128). Multi-hour periods of harmonic tremor were recorded during 17-19 February, accompanied by gas-and-ash emissions. Ash plume heights were between 1 and 2 km above the crater, and minor ashfall was reported in Tlaxco and Xalostoc in Nativitas, and Hueyotlipan, Amaxac de Guerrero, Tepetitla de Lardizábal, and Texoloc in Tlaxcala, on 18 February. Two overflights on 18 and 19 February confirmed the formation of dome 82 inside the summit crater, estimated to be 200 m in diameter (figure 129).
Geologic Background. Volcán Popocatépetl, whose name is the Aztec word for smoking mountain, rises 70 km SE of Mexico City to form North America's 2nd-highest volcano. The glacier-clad stratovolcano contains a steep-walled, 400 x 600 m wide crater. The generally symmetrical volcano is modified by the sharp-peaked Ventorrillo on the NW, a remnant of an earlier volcano. At least three previous major cones were destroyed by gravitational failure during the Pleistocene, producing massive debris-avalanche deposits covering broad areas to the south. The modern volcano was constructed south of the late-Pleistocene to Holocene El Fraile cone. Three major Plinian eruptions, the most recent of which took place about 800 CE, have occurred since the mid-Holocene, accompanied by pyroclastic flows and voluminous lahars that swept basins below the volcano. Frequent historical eruptions, first recorded in Aztec codices, have occurred since Pre-Columbian time.
Information Contacts: Centro Nacional de Prevención de Desastres (CENAPRED), Av. Delfín Madrigal No.665. Coyoacan, México D.F. 04360, México (URL: http://www.cenapred.unam.mx/); Washington Volcanic Ash Advisory Center (VAAC), Satellite Analysis Branch (SAB), NOAA/NESDIS OSPO, NOAA Science Center Room 401, 5200 Auth Rd, Camp Springs, MD 20746, USA (URL: www.ospo.noaa.gov/Products/atmosphere/vaac, archive at: http://www.ssd.noaa.gov/VAAC/archive.html); MIROVA (Middle InfraRed Observation of Volcanic Activity), a collaborative project between the Universities of Turin and Florence (Italy) supported by the Centre for Volcanic Risk of the Italian Civil Protection Department (URL: http://www.mirovaweb.it/); Sentinel Hub Playground (URL: https://www.sentinel-hub.com/explore/sentinel-playground); Global Sulfur Dioxide Monitoring Page, Atmospheric Chemistry and Dynamics Laboratory, NASA Goddard Space Flight Center (NASA/GSFC), 8800 Greenbelt Road, Goddard, Maryland, USA (URL: https://so2.gsfc.nasa.gov/).
Reventador (Ecuador) — March 2019 Cite this Report
Reventador
Ecuador
0.077°S, 77.656°W; summit elev. 3562 m
All times are local (unless otherwise noted)
Multiple daily explosions with ash plumes and incandescent blocks rolling down the flanks, October 2018-January 2019
The andesitic Volcán El Reventador lies well east of the main volcanic axis of the Cordillera Real in Ecuador and has historical eruptions with numerous lava flows and explosive events going back to the 16th century. The eruption in November 2002 generated a 17-km-high eruption cloud, pyroclastic flows that traveled 8 km, and several lava flows. Eruptive activity has been continuous since 2008. Daily explosions with ash emissions and ejecta of incandescent blocks rolling hundreds of meters down the flanks have been typical for many years. Activity continued during October 2018-January 2019, the period covered in this report, with information provided by Ecuador's Instituto Geofisico (IG-EPN), the Washington Volcano Ash Advisory Center (VAAC), and infrared satellite data.
Multiple daily reports were issued from the Washington VAAC throughout the entire October 2018-January 2019 period. Plumes of ash and gas usually rose to altitudes of 4.3-6.1 km and drifted about 20 km in prevailing wind directions before either dissipating or being obscured by meteoric clouds. The average number of daily explosions reported by IG-EPN for the second half of 2018 was more than 20 per day (figure 104). The many explosions during the period originated from multiple vents within a large scarp that formed on the W flank in mid-April (BGVN 43:11, figure 95) (figure 105). Incandescent blocks were observed often in the IG webcams; they traveled 400-1,000 m down the flanks.
Activity during October 2018-January 2019. During most days of October 2018 plumes of gas, steam, and ash rose over 1,000 m above the summit of Reventador, and most commonly drifted W or NW. Incandescence was observed on all nights that were not cloudy; incandescent blocks rolled 400-800 m down the flanks during half of the nights. During episodes of increased activity, ash plumes rose over 1,200 m (8, 10-11, 18-19 October) and incandescent blocks rolled down multiple flanks (figure 106).
Similar activity continued during November. IG reported 17 days of the month with steam, gas, and ash emissions rising more than 1,000 m above the summit. The other days were either cloudy or had emissions rising between 500 and 1,000 m. Incandescent blocks were usually observed on the S or SE flanks, generally travelling 400-600 m down the flanks. The Washington VAAC reported a discrete ash plume at 6.1 km altitude drifting WNW about 35 km from the summit on 15 November. The next day, intermittent puffs were noted moving W, and a bright hotspot at the summit was visible in satellite imagery. During the most intense activity of the month, incandescent blocks traveled 800 m down all the flanks (17-19 November) and ash plumes rose over 1,200 m (23 November) (figure 107).
Steam, gas, and ash plumes rose over 1,200 m above the summit on 1 December. The next day, there were reports of ashfall in San Rafael and Hosteria El Hotelito, where they reported an ash layer about 1 mm thick was deposited on vehicles during the night. Ash emissions exceeded 1,200 m above the summit on 5 and 6 December as well. Incandescent blocks traveled 800 m down all the flanks on 11, 22, 24, and 26 December, and reached 900 m on 21 December. Ash emissions rising 500 to over 1,000 m above the summit were a daily occurrence, and incandescent blocks descended 500 m or more down the flanks most days during the second half of the month (figure 108).
During the first few days of January 2019 the ash and steam plumes did not rise over 800 m, and incandescent blocks were noted 300-500 m down the S flank. An increase in activity on 6 January sent ash-and-gas plumes over 1,000 m, drifting W, and incandescent blocks 1,000 m down many flanks. For multiple days in the middle of the month the volcano was completely obscured by clouds; only occasional observations of plumes of ash and steam were made, incandescence seen at night through the clouds confirmed ongoing activity. The Washington VAAC reported continuous ash emissions moving SE extending more than 100 km on 12 January. A significant explosion late on 20 January sent incandescent blocks 800 m down the S flank; although it was mostly cloudy for much of the second half of January, brief glimpses of ash plumes rising over 1,000 m and incandescent blocks traveling up to 800 m down numerous flanks were made almost daily (figure 109).
Visual evidence from the webcams supports significant thermal activity at Reventador. Atmospheric conditions are often cloudy and thus the thermal signature recorded by satellite instruments is frequently diminished. In spite of this, the MODVOLC thermal alert system recorded seven thermal alerts on three days in October, four alerts on two days in November, six alerts on two days in December and three alerts on three days in January 2019. In addition, the MIROVA system measured moderate levels of radiative power intermittently throughout the period; the most intense anomalies of 2018 were recorded on 15 October and 6 December (figure 110).
Geologic Background. Volcán El Reventador is the most frequently active of a chain of Ecuadorian volcanoes in the Cordillera Real, well east of the principal volcanic axis. The forested, dominantly andesitic stratovolcano has 4-km-wide avalanche scarp open to the E formed by edifice collapse. A young, unvegetated, cone rises from the amphitheater floor to a height comparable to the rim. It has been the source of numerous lava flows as well as explosive eruptions visible from Quito, about 90 km ESE. Frequent lahars in this region of heavy rainfall have left extensive deposits on the scarp slope. The largest recorded eruption took place in 2002, producing a 17-km-high eruption column, pyroclastic flows that traveled up to 8 km, and lava flows from summit and flank vents.
Information Contacts: Instituto Geofísico (IG-EPN), Escuela Politécnica Nacional, Casilla 17-01-2759, Quito, Ecuador (URL: http://www.igepn.edu.ec); Washington Volcanic Ash Advisory Center (VAAC), Satellite Analysis Branch (SAB), NOAA/NESDIS OSPO, NOAA Science Center Room 401, 5200 Auth Rd, Camp Springs, MD 20746, USA (URL: www.ospo.noaa.gov/Products/atmosphere/vaac, archive at: http://www.ssd.noaa.gov/VAAC/archive.html); MIROVA (Middle InfraRed Observation of Volcanic Activity), a collaborative project between the Universities of Turin and Florence (Italy) supported by the Centre for Volcanic Risk of the Italian Civil Protection Department (URL: http://www.mirovaweb.it/); Hawai'i Institute of Geophysics and Planetology (HIGP) - MODVOLC Thermal Alerts System, School of Ocean and Earth Science and Technology (SOEST), Univ. of Hawai'i, 2525 Correa Road, Honolulu, HI 96822, USA (URL: http://modis.higp.hawaii.edu/).
Santa Maria (Guatemala) — March 2019 Cite this Report
Santa Maria
Guatemala
14.757°N, 91.552°W; summit elev. 3745 m
All times are local (unless otherwise noted)
Daily explosions cause steam-and-ash plumes and block avalanches, November 2018-February 2019
The dacitic Santiaguito lava-dome complex on the W flank of Guatemala's Santa María volcano has been growing and actively erupting since 1922. The youngest of the four vents in the complex, Caliente, has been erupting with ash explosions, pyroclastic, and lava flows for more than 40 years. A lava dome that appeared within the summit crater of Caliente in October 2016 has continued to grow, producing frequent block avalanches down the flanks. Daily explosions of steam and ash also continued during November 2018-February 2019, the period covered in this report, with information primarily from Guatemala's INSIVUMEH (Instituto Nacional de Sismologia, Vulcanologia, Meterologia e Hidrologia) and the Washington VAAC (Volcanic Ash Advisory Center).
Activity at Santa Maria continued with little variation from previous months during November 2018-February 2019. Plumes of steam with minor magmatic gases rose continuously from the Caliente crater 100-500 m above the summit, generally drifting SW or SE before dissipating. In addition, daily explosions with varying amounts of ash rose to altitudes of around 2.8-3.5 km and usually extended 20-30 km before dissipating. Most of the plumes drifted SW or SE; minor ashfall occurred in the adjacent hills almost daily and was reported at the fincas located within 15 km in those directions several times each month. Continued growth of the Caliente lava dome resulted in daily block avalanches descending its flanks. The MIROVA plot of thermal energy during this time shows a consistent level of heat flow with minor variations throughout the period (figure 89).
During November 2018 steam plumes rose to altitudes of 2.8-3.2 km from Caliente summit, usually drifting SW, sometimes SE. Several ash-bearing explosions were reported daily, rising to 3-3.2 km altitude and also drifting SW or SE. The highest plume reported by INSIVUMEH rose to 3.4 km on 25 November and drifted SW. The Washington VAAC reported an ash emission on 9 November that rose to 4.3 km altitude and drifted W; it dissipated within a few hours about 35 km from the summit. On 11 November another plume rose to 4.9 km altitude and drifted NW. INSIVUMEH issued a special report on 2 November noting an increase in block avalanches on the S and SE flanks, many of which traveled from the crater dome to the base of the volcano. Nearly constant avalanche blocks descended the SE flank of the dome and occasionally traveled down the other flanks as well throughout the month. They reached the bottom of the cone again on 29 November. Ashfall was reported around the flanks more than once every week and at Finca Florida on 12 November. Finca San Jose reported ashfall on 11, 13, and 23 November, and Parcelamiento Monte Claro reported ashfall on 15, 24, 25, and 27 November.
Constant degassing from the Caliente dome during December 2018 formed white plumes of mostly steam that rose to 2.6-3.0 km altitude during the month. Weak explosions averaging 9-13 per day produced gray ash plumes that rose to 2.8-3.4 km altitude. The Washington VAAC reported an ash emission on 4 December that extended 25 km SW of the summit at 3.0 km altitude and dissipated quickly. Small ash plumes were visible in satellite imagery a few kilometers WNW on 8, 12, 30, and 31 December at 4.3 km altitude; they each dissipated within a few hours. Ashfall was reported in Finca Monte Claro on 1 and 4 December, and in San Marcos Palajunoj on 26 and 30 December along with Loma Linda. On 28 December ashfall on the E flank affected the communities of Las Marías, Calahuache, and El Nuevo Palmar. Block avalanches occurred daily, sending large blocks to the base of the volcano that often stirred up small plumes of ash in the vicinity (figure 90).
Multiple explosions daily during January 2019 produced steam-and-ash plumes (figure 91). Constant degassing rising 10-500 m emerged from the SSE part of the Caliente dome, and ashfall, mainly on the W and SW rim of the cone, was a daily feature. Seismic station STG-3 detected 10-18 explosions per day that produced ash plumes, which rose to between 2.7 and 3.5 km altitude. The Washington VAAC noted a faint ash emission in satellite imagery on 1 January that was about 25 km W of the summit at 4.3 km altitude. A new emission appeared at the same altitude on 4 January about 15 km NW of the summit. A low-density emission around midday on 5 January produced an ash plume that drifted NNE at 4.6 km altitude. Ash plumes drifted W at 4.3 km altitude on 11 and 14 January for short periods of time before dissipating.
Ash drifted mainly towards the W, SW, and S, causing ashfall in the villages of San Marcos Palajunoj, Loma Linda, Monte Bello, El Patrocinio, La Florida, El Faro, Patzulín and a few others several times during the month. The main places where daily ashfall was reported were near the complex, in the hilly crop areas of the El Faro and San José Patzulín farms (figure 92). Blocks up to 3 m in diameter reached the base of the complex, stirring up ash plumes that settled on the immediate flanks. Juvenile material continued to appear at the summit of the dome during January; the dome had risen above the edge of the crater created by the explosions of 2016. Changes in the size and shape of the dome between 23 November 2018 and 13 January 2019 showed the addition of material on the E and SE side of the dome, as well as a new effusive flow that travelled 200-300 m down the E flank (figure 93).
Persistent steam rising 50-150 m above the crater was typical during February 2019 and accompanied weak and moderate explosions that averaged 12 per day throughout the month. White and gray ash plumes from the explosions rose to 2.8-3.3 km altitude; daily block avalanches usually reached the base of the dome (figure 94). Ashfall occurred around the complex, mainly on the W, SW, and NE flanks on a daily basis, but communities farther away were affected as well. The Washington VAAC reported an ash plume on 7 February in visible satellite imagery moving SW from the summit at 4.9 km altitude. The next day a new ash plume was located about 20 km W of the summit, dissipating rapidly, at 4.3 km altitude. Ashfall drifting SW affected Palajuno Monte Claro on 5, 9, 15, and 16 February. Ash drifting E and SE affected Calaguache, Las Marías and surrounding farms on 14 and 17 February, and fine-grained ash drifting SE was reported at finca San José on 21 February.
Geologic Background. Symmetrical, forest-covered Santa María volcano is part of a chain of large stratovolcanoes that rise above the Pacific coastal plain of Guatemala. The sharp-topped, conical profile is cut on the SW flank by a 1.5-km-wide crater. The oval-shaped crater extends from just below the summit to the lower flank, and was formed during a catastrophic eruption in 1902. The renowned Plinian eruption of 1902 that devastated much of SW Guatemala followed a long repose period after construction of the large basaltic-andesite stratovolcano. The massive dacitic Santiaguito lava-dome complex has been growing at the base of the 1902 crater since 1922. Compound dome growth at Santiaguito has occurred episodically from four vents, with activity progressing E towards the most recent, Caliente. Dome growth has been accompanied by almost continuous minor explosions, with periodic lava extrusion, larger explosions, pyroclastic flows, and lahars.
Information Contacts: Instituto Nacional de Sismologia, Vulcanologia, Meteorologia e Hydrologia (INSIVUMEH), Unit of Volcanology, Geologic Department of Investigation and Services, 7a Av. 14-57, Zona 13, Guatemala City, Guatemala (URL: http://www.insivumeh.gob.gt/); Washington Volcanic Ash Advisory Center (VAAC), Satellite Analysis Branch (SAB), NOAA/NESDIS OSPO, NOAA Science Center Room 401, 5200 Auth Rd, Camp Springs, MD 20746, USA (URL: www.ospo.noaa.gov/Products/atmosphere/vaac, archive at: http://www.ssd.noaa.gov/VAAC/archive.html); MIROVA (Middle InfraRed Observation of Volcanic Activity), a collaborative project between the Universities of Turin and Florence (Italy) supported by the Centre for Volcanic Risk of the Italian Civil Protection Department (URL: http://www.mirovaweb.it/).
Stromboli
Italy
38.789°N, 15.213°E; summit elev. 924 m
All times are local (unless otherwise noted)
Constant explosions from both crater areas during November 2018-February 2019
Nearly constant fountains of lava at Stromboli have served as a natural beacon in the Tyrrhenian Sea for at least 2,000 years. Eruptive activity at the summit consistently occurs from multiple vents at both a north crater area (N Area) and a southern crater group (CS Area) on the Terrazza Craterica at the head of the Sciara del Fuoco, a large scarp that runs from the summit down the NW side of the island. Thermal and visual cameras that monitor activity at the vents are located on the nearby Pizzo Sopra La Fossa, above the Terrazza Craterica, and at a location closer to the summit craters.
Eruptive activity from November 2018 to February 2019 was consistent in terms of explosion intensities and rates from both crater areas at the summit, and similar to activity of the past few years (table 5). In the North Crater area, both vents N1 and N2 emitted a mixture of coarse (lapilli and bombs) and fine (ash) ejecta; most explosions rose less than 80 m above the vents, some reached 150 m. Average explosion rates ranged from 4 to 21 per hour. In the CS crater area continuous degassing and occasional intense spattering were typical at vent C, vent S1 was a low-intensity incandescent jet throughout the period. Explosions from vent S2 produced 80-150 m high ejecta of ash, lapilli and bombs at average rates of 3-16 per hour. Thermal activity at Stromboli was actually higher during November 2018-February 2019 than it had been in previous months as recorded in the MIROVA Log Radiative Power data from MODIS infrared satellite information (figure 139).
Table 5. Summary of activity levels at Stromboli, November 2018-February 2019. Low intensity activity indicates ejecta rising less than 80 m and medium intensity is ejecta rising less than 150 m. Data courtesy of INGV.
| Month |
N Area Activity |
CS Area Activity |
| Nov 2018 |
Low- to medium-intensity explosions at both N1 and N2, lapilli and bombs mixed with ash, explosion rates of 6-16 per hour. |
Continuous degassing at C; intense spattering on 26 Nov. Low- to medium-intensity incandescent jetting at S1. Low- to medium-intensity explosions at S2 with a mix of coarse and fine ejecta and explosion rates of 3-18 per hour. |
| Dec 2018 |
Low- to medium-intensity explosions at both N1 and N2, coarse and fine ejecta, explosion rates of 4-21 per hour. Three days of intense spattering at N2. |
Continuous degassing at C; intense spattering 1-2 Dec. Low- to medium-intensity incandescent jets at S1, low and medium-intensity explosions of coarse and fine material at S2. Average explosion raters were 10-18 per hour at the beginning of the month, 3-4 per hour during last week. |
| Jan 2019 |
Low- to medium-intensity explosions at N1, coarse ejecta. Low- to medium-intensity and spattering at N2, coarse and fine ejecta. Explosion rates of 9-16 per hour. |
Continuous degassing and low-intensity explosions of coarse ejecta at C. Low-intensity incandescent jets at S1. Low- and medium-intensity explosions of coarse and fine ejecta at S2. |
| Feb 2019 |
Medium-intensity explosions with coarse ejecta at N1. Low-intensity explosions with fine ash at N2. Explosion rates of 4-11 per hour. |
Continuous degassing and low-intensity explosions with coarse and fine ejecta at C and S2. Low intensity incandescent jets at S1. Explosion rates of 2-13 per hour. |
Activity at the N area was very consistent during November 2018 (figure 140). Explosions of low-intensity (less than 80 m high) to medium-intensity (less than 150 m high) occurred at both the N1 and N2 vents and produced coarse material (lapilli and bombs) mixed with ash, at rates averaging 6-16 explosions per hour. In the SC area continuous degassing was reported from vent C with a brief period of intense spattering on 26 November. At vent S1 low- to medium-intensity incandescent jetting was reported. At vent S2, low- and medium-intensity explosive activity produced a mixture of coarse and fine (ash) material at a frequency of 3-18 events per hour.
Similar activity continued during December at both crater areas, although there were brief periods of more intense activity. Low- to medium-intensity explosions at both N area vents produced a mixture of coarse and fine-grained material at rates averaging 4-21 per hour. During 6-7 December ejecta from the N vents fell onto the upper part of the Sciara del Fuoco and rolled down the gullies to the coast, producing tongues of debris (figure 141). An explosion at N1 on 12 December produced a change in the structure of the crater area. During 10-16 December the ejecta from the N area landed outside the crater on the Sciara del Fuoco. Intense spattering was observed from N2 on 18, 22, and 31 December. In the CS area, continuous degassing took place at vent C, along with a brief period of intense spattering on 1-2 December. Low to medium intensity incandescent jets persisted at S1 along with low-and medium-intensity explosions of coarse and fine-grained material at vent S2. Rates of explosion at the CS area were higher at the beginning of December (10-18 per hour) and lower during the last week of the month (3-4 per hour).
Explosive intensity was low (ejecta less than 80 m high) at vent N1 at the beginning of January 2019 and increased to medium (ejecta less than 150 m high) during the second half of the month, producing coarse ejecta of lapilli and bombs. Intensity at vent N2 was low to medium throughout the month with both coarse- and fine-grained material ejected. Explosions from N2 sent large blocks onto the Sciara del Fuoco several times throughout the month and usually was accompanied by intense spattering. Explosion rates varied, with averages of 9 to 16 per hour, throughout the month in the N area. In the CS area continuous degassing occurred at vent C, and low-intensity explosions of coarse-grained material were reported during the second half of the month. Low-intensity incandescent jets at S1 along with low- and medium-intensity explosions of coarse and fine-grained material at S2 persisted throughout the month.
A helicopter overflight of Stromboli on 8 January 2019 allowed for detailed visual and thermal observations of activity and of the morphology of the vents at the summit (figure 142). Vent C had two small hornitos, and a small scoria cone was present in vent S1, while a larger crater was apparent at S2. In the N crater area vent N2 had a large scoria cone that faced the Sciara del Fuoco to the north; three narrow gullies were visible at the base of the cone (figure 143). Vent S1 was a large crater containing three small vents aligned in a NW-SE trend; INGV scientists concluded the vents formed as a result of the 12 December 2018 explosion. Thermal images showed relatively low temperatures at all fumaroles compared with earlier visits.
Activity during February 2019 declined slightly from the previous few months. Explosions at vent N1 were of medium-intensity and produced coarse material (lapilli and bombs). At N2, low-intensity explosions produced fine ash. Average explosion rates in the N area ranged from 4-11 per hour. At the CS area, continuous degassing and low-intensity explosions produced coarse and fine-grained material from vents C and S2 while low-intensity incandescent jets were active at S1. The explosion rates at the CS area averaged 2-13 per hour.
Geologic Background. Spectacular incandescent nighttime explosions at Stromboli have long attracted visitors to the "Lighthouse of the Mediterranean" in the NE Aeolian Islands. This volcano has lent its name to the frequent mild explosive activity that has characterized its eruptions throughout much of historical time. The small island is the emergent summit of a volcano that grew in two main eruptive cycles, the last of which formed the western portion of the island. The Neostromboli eruptive period took place between about 13,000 and 5,000 years ago. The active summit vents are located at the head of the Sciara del Fuoco, a prominent scarp that formed about 5,000 years ago due to a series of slope failures which extends to below sea level. The modern volcano has been constructed within this scarp, which funnels pyroclastic ejecta and lava flows to the NW. Essentially continuous mild Strombolian explosions, sometimes accompanied by lava flows, have been recorded for more than a millennium.
Information Contacts: Istituto Nazionale di Geofisica e Vulcanologia (INGV), Sezione di Catania, Piazza Roma 2, 95123 Catania, Italy, (URL: http://www.ct.ingv.it/en/); MIROVA (Middle InfraRed Observation of Volcanic Activity), a collaborative project between the Universities of Turin and Florence (Italy) supported by the Centre for Volcanic Risk of the Italian Civil Protection Department (URL: http://www.mirovaweb.it/).
Villarrica
Chile
39.42°S, 71.93°W; summit elev. 2847 m
All times are local (unless otherwise noted)
Intermittent Strombolian activity ejects incandescent bombs around crater rim, September 2018-February 2019
Historical eruptions at Chile's Villarrica, documented since 1558, have consisted largely of mild-to-moderate explosive activity with occasional lava effusion. An intermittently active lava lake at the summit has been the source of explosive activity, incandescence, and thermal anomalies for several decades. Sporadic Strombolian activity at the lava lake and small ash emissions have continued since the last large explosion on 3 March 2015. Similar continuing activity during September 2018-February 2019 is covered in this report, with information provided primarily by the Southern Andes Volcano Observatory (Observatorio Volcanológico de Los Andes del Sur, OVDAS), part of Chile's National Service of Geology and Mining (Servicio Nacional de Geología y Minería, SERNAGEOMIN), and Projecto Observación Villarrica Internet (POVI), part of the Fundacion Volcanes de Chile, a research group that studies volcanoes across Chile.
After ash emissions during July 2018 and an increase in of thermal activity from late July through early September 2018 (BGVN 43:10), Villarrica was much quieter through February 2019. Steam plumes rose no more than a few hundred meters above the summit and the number of thermal alerts decreased steadily. Intermittent Strombolian activity sent ejecta a few tens of meters above the summit crater, with larger bombs landing outside the crater rim. A small pyroclastic cone appeared at the surface of the lava lake, about 70 m below the rim, in November. The largest lava fountain rose 35 m above the crater rim in late January 2019.
Steam plumes rose no more than 300 m above the crater during September 2018 and were less than 150 m high in October; incandescence at the summit was visible during clear nights, although a gradual decrease in activity suggested a lowering of the lake level to SERNAGEOMIN. SERNAGEOMIN attributed an increase in LP seismic events from 1,503 in September to 5,279 in October to dynamics of the lava lake inside the summit crater; counts decreased gradually in the following months.
POVI reported webcam evidence of Strombolian activity with ejecta around the crater several times during November 2018. On 5 November the webcam captured an image of an incandescent bomb, more than a meter in diameter, that landed on the NW flank. The next day, explosions sent ejecta 50 m above the edge of the crater, and pyroclastic debris landed around the perimeter. Significant Strombolian explosions on 16 November sent incandescent bombs toward the W rim of the crater (figure 70). The POVI webcam in Pucón captured incandescent ejecta landing on the crater rim on 23 November. POVI scientists observed a small pyroclastic cone, about 10-12 m in diameter, at the bottom of the summit crater on 19 November (figure 71); it was still visible on 25 November.
During December 2018 webcam images showed steam plumes rising less than 350 m above the crater. Infrasound instruments identified two small explosions related to lava lake surface activity. SERNAGEOMIN noted a minor variation in the baseline of the inclinometers; continued monitoring indicated the variation was seasonal. A compilation by POVI of images of the summit crater during 2018 showed the evolution of the lava lake level during the year. It had dropped out of sight early in the year, rose to its highest level in July, and then lowered slightly, remaining stable for the last several months of the year (figure 72).
Between 25 December 2018 and 15 January 2019, financed with funds contributed by the Fundación Volcanes de Chile, POVI was able to install new HD webcams with continuous daily image recording, greatly improving the level of detail data available of the activity at the summit. POVI reported that after a five-week break, Strombolian explosions resumed on 3 January 2019; the lava fountains rose 20 m above the crater rim, and pyroclastic ejecta fell to the E. On 24 January the Strombolian explosions ejected ash, lapilli, and bombs up to 15 cm in diameter; the lava fountain was about 35 m high.
An explosion on 7 February reached about 29 m above the crater's edge; on 9 February a lava fountain three meters in diameter rose 17 m above the crater rim. Sporadic explosions were imaged on 12 February as well (figure 73). During a reconnaissance overflight on 24 February 2019, POVI scientists observed part of the lava pit at the bottom of the crater (figure 74). As of 28 February they noted a slight but sustained increase in the energy of the explosions. SERNAGEOMIN noted that steam plumes rose 400 m in January and 150 m during February, and incandescence was visible on clear nights during both months.
Geologic Background. The glacier-covered Villarrica stratovolcano, in the northern Lakes District of central Chile, is ~15 km south of the city of Pucon. A 2-km-wide caldera that formed about 3,500 years ago is located at the base of the presently active, dominantly basaltic to basaltic-andesite cone at the NW margin of a 6-km-wide Pleistocene caldera. More than 30 scoria cones and fissure vents are present on the flanks. Plinian eruptions and pyroclastic flows that have extended up to 20 km from the volcano were produced during the Holocene. Lava flows up to 18 km long have issued from summit and flank vents. Eruptions documented since 1558 CE have consisted largely of mild-to-moderate explosive activity with occasional lava effusion. Glaciers cover 40 km2 of the volcano, and lahars have damaged towns on its flanks.
Information Contacts: Servicio Nacional de Geología y Minería (SERNAGEOMIN), Observatorio Volcanológico de Los Andes del Sur (OVDAS), Avda Sta María No. 0104, Santiago, Chile (URL: http://www.sernageomin.cl/); Proyecto Observación Villarrica Internet (POVI) (URL: http://www.povi.cl/).