Recently Published Bulletin Reports
Kadovar (Papua New Guinea) An ash plume and weak thermal anomaly during May 2023
San Miguel (El Salvador) Small gas-and-ash explosions during March and May 2023
Ebeko (Russia) Continued explosions, ash plumes, and ashfall during October 2022-May 2023
Home Reef (Tonga) Discolored plumes continued during November 2022-April 2023
Semisopochnoi (United States) Occasional explosions, ash deposits, and gas-and-steam plumes during December 2022-May 2023
Ambae (Vanuatu) New lava flow, ash plumes, and sulfur dioxide plumes during February-May 2023
Ibu (Indonesia) Daily ash explosions continue, along with thermal anomalies in the crater, October 2022-May 2023
Dukono (Indonesia) Continuing ash emissions, SO2 plumes, and thermal signals during October 2022-May 2023
Sabancaya (Peru) Explosions, gas-and-ash plumes, and thermal activity persist during November 2022-April 2023
Sheveluch (Russia) Significant explosions destroyed part of the lava-dome complex during April 2023
Bezymianny (Russia) Explosions, ash plumes, lava flows, and avalanches during November 2022-April 2023
Chikurachki (Russia) New explosive eruption during late January-early February 2023
Kadovar (Papua New Guinea) — June 2023  Cite this Report
Kadovar
Papua New Guinea
3.608°S, 144.588°E; summit elev. 365 m
All times are local (unless otherwise noted)
An ash plume and weak thermal anomaly during May 2023
Kadovar is a 2-km-wide island that is the emergent summit of a Bismarck Sea stratovolcano. It lies off the coast of New Guinea, about 25 km N of the mouth of the Sepik River. Prior to an eruption that began in 2018, a lava dome formed the high point of the volcano, filling an arcuate landslide scarp open to the S. Submarine debris-avalanche deposits occur to the S of the island. The current eruption began in January 2018 and has comprised lava effusion from vents at the summit and at the E coast; more recent activity has consisted of ash plumes, weak thermal activity, and gas-and-steam plumes (BGVN 48:02). This report covers activity during February through May 2023 using information from the Darwin Volcanic Ash Advisory Center (VAAC) and satellite data.
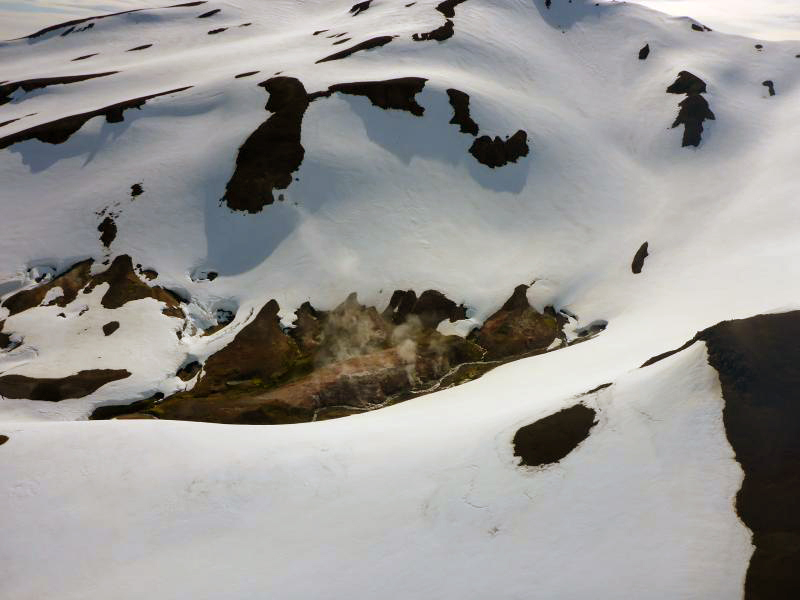
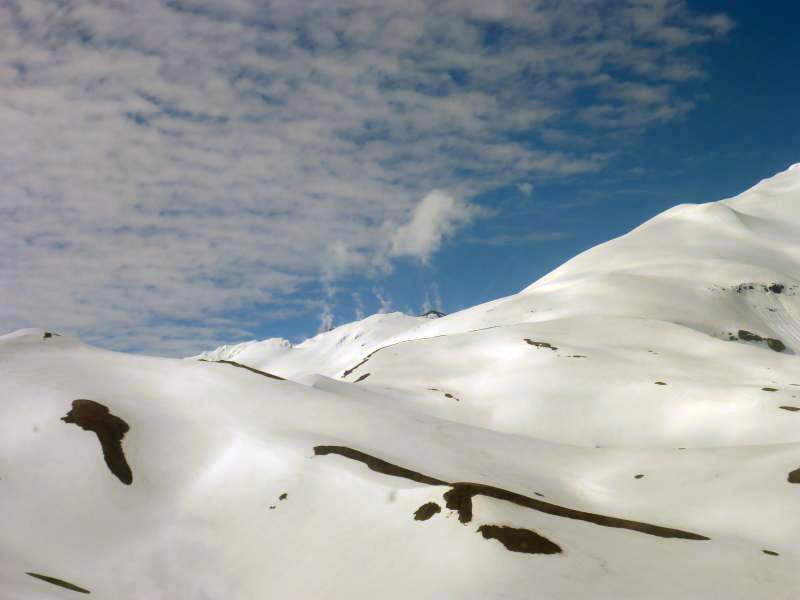
Activity during the reporting period was relatively low and mainly consisted of white gas-and-steam plumes that were visible in natural color satellite images on clear weather days (figure 67). According to a Darwin VAAC report, at 2040 on 6 May an ash plume rose to 4.6 km altitude and drifted W; by 2300 the plume had dissipated. MODIS satellite instruments using the MODVOLC thermal algorithm detected a single thermal hotspot on the SE side of the island on 7 May. Weak thermal activity was also detected in a satellite image on the E side of the island on 14 May, accompanied by a white gas-and-steam plume that drifted SE (figure 68).
Geologic Background. The 2-km-wide island of Kadovar is the emergent summit of a Bismarck Sea stratovolcano of Holocene age. It is part of the Schouten Islands, and lies off the coast of New Guinea, about 25 km N of the mouth of the Sepik River. Prior to an eruption that began in 2018, a lava dome formed the high point of the andesitic volcano, filling an arcuate landslide scarp open to the south; submarine debris-avalanche deposits occur in that direction. Thick lava flows with columnar jointing forms low cliffs along the coast. The youthful island lacks fringing or offshore reefs. A period of heightened thermal phenomena took place in 1976. An eruption began in January 2018 that included lava effusion from vents at the summit and at the E coast.
Information Contacts: Darwin Volcanic Ash Advisory Centre (VAAC), Bureau of Meteorology, Northern Territory Regional Office, PO Box 40050, Casuarina, NT 0811, Australia (URL: http://www.bom.gov.au/info/vaac/); Hawai'i Institute of Geophysics and Planetology (HIGP) - MODVOLC Thermal Alerts System, School of Ocean and Earth Science and Technology (SOEST), Univ. of Hawai'i, 2525 Correa Road, Honolulu, HI 96822, USA (URL: http://modis.higp.hawaii.edu/); Copernicus Browser, Copernicus Data Space Ecosystem, European Space Agency (URL: https://dataspace.copernicus.eu/browser/).
San Miguel (El Salvador) — June 2023 Cite this Report
San Miguel
El Salvador
13.434°N, 88.269°W; summit elev. 2130 m
All times are local (unless otherwise noted)
Small gas-and-ash explosions during March and May 2023
San Miguel in El Salvador is a broad, deep crater complex that has been frequently modified by eruptions recorded since the early 16th century and consists of the summit known locally as Chaparrastique. Flank eruptions have produced lava flows that extended to the N, NE, and SE during the 17-19th centuries. The most recent activity has consisted of minor ash eruptions from the summit crater. The current eruption period began in November 2022 and has been characterized by frequent phreatic explosions, gas-and-ash emissions, and sulfur dioxide plumes (BGVN 47:12). This report describes small gas-and-ash explosions during December 2022 through May 2023 based on special reports from the Ministero de Medio Ambiente y Recursos Naturales (MARN).
Activity has been relatively low since the last recorded explosions on 29 November 2022. Seismicity recorded by the San Miguel Volcano Station (VSM) located on the N flank at 1.7 km elevation had decreased by 7 December. Sulfur dioxide gas measurements taken with DOAS (Differential Optical Absorption Spectroscopy) mobile equipment were below typical previously recorded values: 300 tons per day (t/d). During December, small explosions were recorded by the seismic network and manifested as gas-and-steam emissions.
Gas-and-ash explosions in the crater occurred during January 2023, which were recorded by the seismic network. Sulfur dioxide values remained low, between 300-400 t/d through 10 March. At 0817 on 14 January a gas-and-ash emission was visible in webcam images, rising just above the crater rim. Some mornings during February, small gas-and-steam plumes were visible in the crater. On 7 March at 2252 MARN noted an increase in degassing from the central crater; gas emissions were constantly observed through the early morning hours on 8 March. During the early morning of 8 March through the afternoon on 9 March, 12 emissions were registered, some accompanied by ash. The last gas-and-ash emission was recorded at 1210 on 9 March; very fine ashfall was reported in El Tránsito (10 km S), La Morita (6 km W), and La Piedrita (3 km W). The smell of sulfur was reported in Piedra Azul (5 km SW). On 16 March MARN reported that gas-and-steam emissions decreased.
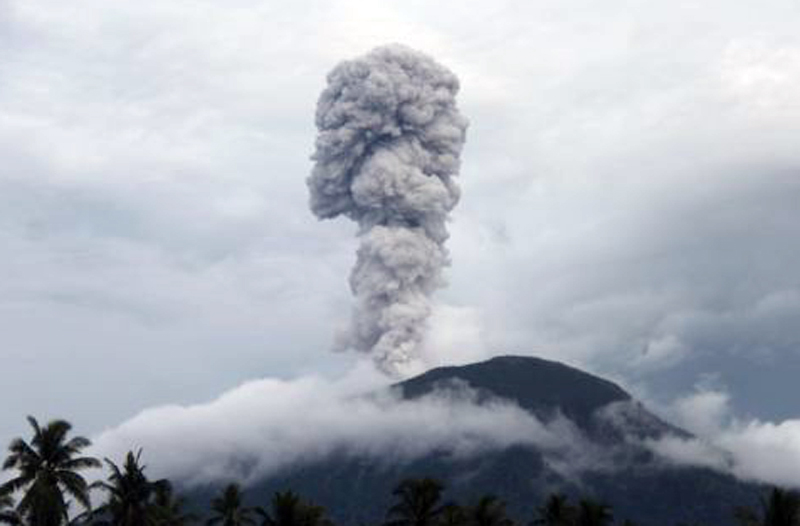
Low degassing and very low seismicity were reported during April; no explosions have been detected between 9 March and 27 May. The sulfur dioxide emissions remained between 350-400 t/d; during 13-20 April sulfur dioxide values fluctuated between 30-300 t/d. Activity remained low through most of May; on 23 May seismicity increased. An explosion was detected at 1647 on 27 May generated a gas-and-ash plume that rose 700 m high (figure 32); a decrease in seismicity and gas emissions followed. The DOAS station installed on the W flank recorded sulfur dioxide values that reached 400 t/d on 27 May; subsequent measurements showed a decrease to 268 t/d on 28 May and 100 t/d on 29 May.
Geologic Background. The symmetrical cone of San Miguel, one of the most active volcanoes in El Salvador, rises from near sea level to form one of the country's most prominent landmarks. A broad, deep, crater complex that has been frequently modified by eruptions recorded since the early 16th century caps the truncated unvegetated summit, also known locally as Chaparrastique. Flanks eruptions of the basaltic-andesitic volcano have produced many lava flows, including several during the 17th-19th centuries that extended to the N, NE, and SE. The SE-flank flows are the largest and form broad, sparsely vegetated lava fields crossed by highways and a railroad skirting the base of the volcano. Flank vent locations have migrated higher on the edifice during historical time, and the most recent activity has consisted of minor ash eruptions from the summit crater.
Information Contacts: Ministero de Medio Ambiente y Recursos Naturales (MARN), Km. 5½ Carretera a Nueva San Salvador, Avenida las Mercedes, San Salvador, El Salvador (URL: http://www.snet.gob.sv/ver/vulcanologia).
Ebeko
Russia
50.686°N, 156.014°E; summit elev. 1103 m
All times are local (unless otherwise noted)
Continued explosions, ash plumes, and ashfall during October 2022-May 2023
Ebeko, located on the N end of Paramushir Island in the Kuril Islands, consists of three summit craters along a SSW-NNE line at the northern end of a complex of five volcanic cones. Eruptions date back to the late 18th century and have been characterized as small-to-moderate explosions from the summit crater, accompanied by intense fumarolic activity. The current eruption period began in June 2022 and has recently consisted of frequent explosions, ash plumes, and thermal activity (BGVN 47:10). This report covers similar activity during October 2022 through May 2023, based on information from the Kamchatka Volcanic Eruptions Response Team (KVERT) and satellite data.
Activity during October consisted of explosive activity, ash plumes, and occasional thermal anomalies. Visual data by volcanologists from Severo-Kurilsk showed explosions producing ash clouds up to 2.1-3 km altitude which drifted E, N, NE, and SE during 1-8, 10, 16, and 18 October. KVERT issued several Volcano Observatory Notices for Aviation (VONA) on 7, 13-15, and 27 October 2022, stating that explosions generated ash plumes that rose to 2.3-4 km altitude and drifted 5 km E, NE, and SE. Ashfall was reported in Severo-Kurilsk (Paramushir Island, about 7 km E) on 7 and 13 October. Satellite data showed a thermal anomaly over the volcano on 15-16 October. Visual data showed ash plumes rising to 2.5-3.6 km altitude on 22, 25-29, and 31 October and moving NE due to constant explosions.
Similar activity continued during November, with explosions, ash plumes, and ashfall occurring. KVERT issued VONAs on 1-2, 4, 6-7, 9, 13, and 16 November that reported explosions and resulting ash plumes that rose to 1.7-3.6 km altitude and drifted 3-5 km SE, ESE, E, and NE. On 1 November ash plumes extended as far as 110 km SE. On 5, 8, 12, and 24-25 November explosions and ash plumes rose to 2-3.1 km altitude and drifted N and E. Ashfall was observed in Severo-Kurilsk on 7 and 16 November. A thermal anomaly was visible during 1-4, 16, and 20 November. Explosions during 26 November rose as high as 2.7 km altitude and drifted NE (figure 45).
Explosions and ash plumes continued to occur in December. During 1-2 and 4 December volcanologists from Severo-Kurilsk observed explosions that sent ash to 1.9-2.5 km altitude and drifted NE and SE (figure 46). VONAs were issued on 5, 9, and 16 December reporting that explosions generated ash plumes rising to 1.9 km, 2.6 km, and 2.4 km altitude and drifted 5 km SE, E, and NE, respectively. A thermal anomaly was visible in satellite imagery on 16 December. On 18 and 27-28 December explosions produced ash plumes that rose to 2.5 km altitude and drifted NE and SE. On 31 December an ash plume rose to 2 km altitude and drifted NE.
Explosions continued during January 2023, based on visual observations by volcanologists from Severo-Kurilsk. During 1-7 January explosions generated ash plumes that rose to 4 km altitude and drifted NE, E, W, and SE. According to VONAs issued by KVERT on 2, 4, 10, and 23 January, explosions produced ash plumes that rose to 2-4 km altitude and drifted 5 km N, NE, E, and ENE; the ash plume that rose to 4 km altitude occurred on 10 January (figure 47). Satellite data showed a thermal anomaly during 3-4, 10, 13, 16, 21, 22, and 31 January. KVERT reported that an ash cloud on 4 January moved 12 km NE. On 6 and 9-11 January explosions sent ash plumes to 4.5 km altitude and drifted W and ESE. On 13 January an ash plume rose to 3 km altitude and drifted SE. During 20-24 January ash plumes from explosions rose to 3.7 km altitude and drifted SE, N, and NE. On 21 January the ash plume drifted as far as 40 km NE. During 28-29 and 31 January and 1 February ash plumes rose to 4 km altitude and drifted NE.
During February, explosions, ash plumes, and ashfall were reported. During 1, 4-5 and 7-8 February explosions generated ash plumes that rose to 4.5 km altitude and drifted E and NE; ashfall was observed on 5 and 8 February. On 6 February an explosion produced an ash plume that rose to 3 km altitude and drifted 7 km E, causing ashfall in Severo-Kurilsk. A thermal anomaly was visible in satellite data on 8, 9, 13, and 21 February. Explosions on 9 and 12-13 February produced ash plumes that rose to 4 km altitude and drifted E and NE; the ash cloud on 12 February extended as far as 45 km E. On 22 February explosions sent ash to 3 km altitude that drifted E. During 24 and 26-27 February ash plumes rose to 4 km altitude and drifted E. On 28 February an explosion sent ash to 2.5-3 km altitude and drifted 5 km E; ashfall was observed in Severo-Kurilsk.
Activity continued during March; visual observations showed that explosions generated ash plumes that rose to 3.6 km altitude on 3, 5-7, and 9-12 March and drifted E, NE, and NW. Thermal anomalies were visible on 10, 13, and 29-30 March in satellite imagery. On 18, 21-23, 26, and 29-30 March explosions produced ash plumes that rose to 2.8 km altitude and drifted NE and E; the ash plumes during 22-23 March extended up to 76 km E. A VONA issued on 21 March reported an explosion that produced an ash plume that rose to 2.8 km altitude and drifted 5 km E. Another VONA issued on 23 March reported that satellite data showed an ash plume rising to 3 km altitude and drifted 14 km E.
Explosions during April continued to generate ash plumes. On 1 and 4 April an ash plume rose to 2.8-3.5 km altitude and drifted SE and NE. A thermal anomaly was visible in satellite imagery during 1-6 April. Satellite data showed ash plumes and clouds rising to 2-3 km altitude and drifting up to 12 km SW and E on 3 and 6 April (figure 48). KVERT issued VONAs on 3, 5, 14, 16 April describing explosions that produced ash plumes rising to 3 km, 3.5 km, 3.5 km, and 3 km altitude and drifting 5 km S, 5 km NE and SE, 72 km NNE, and 5 km NE, respectively. According to satellite data, the resulting ash cloud from the explosion on 14 April was 25 x 7 km in size and drifted 72-104 km NNE during 14-15 April. According to visual data by volcanologists from Severo-Kurilsk explosions sent ash up to 3.5 km altitude that drifted NE and E during 15-16, 22, 25-26, and 29 April.
The explosive eruption continued during May. Explosions during 3-4, 6-7, and 9-10 May generated ash plumes that rose to 4 km altitude and drifted SW and E. Satellite data showed a thermal anomaly on 3, 9, 13-14, and 24 May. During 12-16, 23-25, and 27-28 May ash plumes rose to 3.5 km altitude and drifted in different directions due to explosions. Two VONA notices were issued on 16 and 25 May, describing explosions that generated ash plumes rising to 3 km and 3.5 km altitude, respectively and extending 5 km E. The ash cloud on 25 May drifted 75 km SE.
Thermal activity in the summit crater, occasionally accompanied by ash plumes and ash deposits on the SE and E flanks due to frequent explosions, were visible in infrared and true color satellite images (figure 49).
Geologic Background. The flat-topped summit of the central cone of Ebeko volcano, one of the most active in the Kuril Islands, occupies the northern end of Paramushir Island. Three summit craters located along a SSW-NNE line form Ebeko volcano proper, at the northern end of a complex of five volcanic cones. Blocky lava flows extend west from Ebeko and SE from the neighboring Nezametnyi cone. The eastern part of the southern crater contains strong solfataras and a large boiling spring. The central crater is filled by a lake about 20 m deep whose shores are lined with steaming solfataras; the northern crater lies across a narrow, low barrier from the central crater and contains a small, cold crescentic lake. Historical activity, recorded since the late-18th century, has been restricted to small-to-moderate explosive eruptions from the summit craters. Intense fumarolic activity occurs in the summit craters, on the outer flanks of the cone, and in lateral explosion craters.
Information Contacts: Kamchatka Volcanic Eruptions Response Team (KVERT), Far Eastern Branch, Russian Academy of Sciences, 9 Piip Blvd., Petropavlovsk-Kamchatsky, 683006, Russia (URL: http://www.kscnet.ru/ivs/kvert/); MIROVA (Middle InfraRed Observation of Volcanic Activity), a collaborative project between the Universities of Turin and Florence (Italy) supported by the Centre for Volcanic Risk of the Italian Civil Protection Department (URL: http://www.mirovaweb.it/); Copernicus Browser, Copernicus Data Space Ecosystem, European Space Agency (URL: https://dataspace.copernicus.eu/browser/).
Home Reef
Tonga
18.992°S, 174.775°W; summit elev. -10 m
All times are local (unless otherwise noted)
Discolored plumes continued during November 2022-April 2023
Home Reef is a submarine volcano located in the central Tonga islands between Lateiki (Metis Shoal) and Late Island. The first recorded eruption occurred in the mid-19th century, when an ephemeral island formed. An eruption in 1984 produced a 12-km-high eruption plume, a large volume of floating pumice, and an ephemeral island 500 x 1,500 m wide, with cliffs 30-50 m high that enclosed a water-filled crater. Another island-forming eruption in 2006 produced widespread pumice rafts that drifted as far as Australia; by 2008 the island had eroded below sea level. The previous eruption occurred during October 2022 and was characterized by a new island-forming eruption, lava effusion, ash plumes, discolored water, and gas-and-steam plumes (BGVN 47:11). This report covers discolored water plumes during November 2022 through April 2023 using satellite data.
Discolored plumes continued during the reporting period and were observed in true color satellite images on clear weather days. Satellite images show light green-yellow discolored water extending W on 8 and 28 November 2022 (figure 31), and SW on 18 November. Light green-yellow plumes extended W on 3 December, S on 13 December, SW on 18 December, and W and S on 23 December (figure 31). On 12 January 2023 discolored green-yellow plumes extended to the NE, E, SE, and N. The plume moved SE on 17 January and NW on 22 January. Faint discolored water in February was visible moving NE on 1 February. A discolored plume extended NW on 8 and 28 March and NW on 13 March (figure 31). During April, clear weather showed green-blue discolored plumes moving S on 2 April, W on 7 April, and NE and S on 12 April. A strong green-yellow discolored plume extended E and NE on 22 April for several kilometers (figure 31).
Geologic Background. Home Reef, a submarine volcano midway between Metis Shoal and Late Island in the central Tonga islands, was first reported active in the mid-19th century, when an ephemeral island formed. An eruption in 1984 produced a 12-km-high eruption plume, large amounts of floating pumice, and an ephemeral 500 x 1,500 m island, with cliffs 30-50 m high that enclosed a water-filled crater. In 2006 an island-forming eruption produced widespread dacitic pumice rafts that drifted as far as Australia. Another island was built during a September-October 2022 eruption.
Information Contacts: Copernicus Browser, Copernicus Data Space Ecosystem, European Space Agency (URL: https://dataspace.copernicus.eu/browser/).
Semisopochnoi (United States) — June 2023 Cite this Report
Semisopochnoi
United States
51.93°N, 179.58°E; summit elev. 1221 m
All times are local (unless otherwise noted)
Occasional explosions, ash deposits, and gas-and-steam plumes during December 2022-May 2023
Semisopochnoi is located in the western Aleutians, is 20-km-wide at sea level, and contains an 8-km-wide caldera. The three-peaked Mount Young (formerly Cerberus) was constructed within the caldera during the Holocene. Each of these peaks contains a summit crater; the lava flows on the N flank appear younger than those on the S side. The current eruption period began in early February 2021 and has more recently consisted of intermittent explosions and ash emissions (BGVN 47:12). This report updates activity during December 2022 through May 2023 using daily, weekly, and special reports from the Alaska Volcano Observatory (AVO). AVO monitors the volcano using local seismic and infrasound sensors, satellite data, web cameras, and remote infrasound and lightning networks.
Activity during most of December 2022 was relatively quiet; according to AVO no eruptive or explosive activity was observed since 7 November 2022. Intermittent tremor and occasional small earthquakes were observed in geophysical data. Continuous gas-and-steam emissions were observed from the N crater of Mount Young in webcam images on clear weather days (figure 25). On 24 December, there was a slight increase in earthquake activity and several small possible explosion signals were detected in infrasound data. Eruptive activity resumed on 27 December at the N crater of Mount Young; AVO issued a Volcano Activity Notice (VAN) that reported minor ash deposits on the flanks of Mount Young that extended as far as 1 km from the vent, according to webcam images taken during 27-28 December (figure 26). No ash plumes were observed in webcam or satellite imagery, but a persistent gas-and-steam plume that might have contained some ash rose to 1.5 km altitude. As a result, AVO raised the Aviation Color Code (ACC) to Orange (the second highest level on a four-color scale) and the Volcano Alert Level (VAL) to Watch (the second highest level on a four-level scale). Possible explosions were detected during 21 December 2022 through 1 January 2023 and seismic tremor was recorded during 30-31 December.
During January 2023 eruptive activity continued at the active N crater of Mount Young. Minor ash deposits were observed on the flanks, extending about 2 km SSW, based on webcam images from 1 and 3 January. A possible explosion occurred during 1-2 January based on elevated seismicity recorded on local seismometers and an infrasound signal recorded minutes later by an array at Adak. Though no ash plumes were observed in webcam or satellite imagery, a persistent gas-and-steam plume rose to 1.5 km altitude that might have carried minor traces of ash. Ash deposits were accompanied by periods of elevated seismicity and infrasound signals from the local geophysical network, which AVO reported were likely due to weak explosive activity. Low-level explosive activity was also detected during 2-3 January, with minor gas-and-steam emissions and a new ash deposit that was visible in webcam images. Low-level explosive activity was detected in geophysical data during 4-5 January, with elevated seismicity and infrasound signals observed on local stations. Volcanic tremor was detected during 7-9 January and very weak explosive activity was detected in seismic and infrasound data on 9 January. Weak seismic and infrasound signals were recorded on 17 January, which indicated minor explosive activity, but no ash emissions were observed in clear webcam images; a gas-and-steam plume continued to rise to 1.5 km altitude. During 29-30 January, ash deposits near the summit were observed on fresh snow, according to webcam images.
The active N cone at Mount Young continued to produce a gas-and-steam plume during February, but no ash emissions or explosive events were detected. Seismicity remained elevated with faint tremor during early February. Gas-and-steam emissions from the N crater were observed in clear webcam images on 11-13 and 16 February; no explosive activity was detected in seismic, infrasound, or satellite data. Seismicity has also decreased, with no significant seismic tremor observed since 25 January. Therefore, the ACC was lowered to Yellow (the second lowest level on a four-color scale) and the VAL was lowered to Advisory (the second lowest level on a four-color scale) on 22 February.
Gas-and-steam emissions persisted during March from the N cone of Mount Young, based on clear webcam images. A few brief episodes of weak tremor were detected in seismic data, although seismicity decreased over the month. A gas-and-steam plume detected in satellite data extended 150 km on 18 March. Low-level ash emissions from the N cone at Mount Young were observed in several webcam images during 18-19 March, in addition to small explosions and volcanic tremor. The ACC was raised to Orange and the VAL increased to Watch on 19 March. A small explosion was detected in seismic and infrasound data on 21 March.
Low-level unrest continued during April, although cloudy weather often obscured views of the summit; periods of seismic tremor and local earthquakes were recorded. During 3-4 April a gas-and-steam plume was visible traveling more than 200 km overnight; no ash was evident in the plume, according to AVO. A gas-and-steam plume was observed during 4-6 April that extended 400 km but did not seem to contain ash. Small explosions were detected in seismic and infrasound data on 5 April. Occasional clear webcam images showed continuing gas-and-steam emissions rose from Mount Young, but no ash deposits were observed on the snow. On 19 April small explosions and tremor were detected in seismic and infrasound data. A period of seismic tremor was detected during 22-25 April, with possible weak explosions on 25 April. Ash deposits were visible near the crater rim, but it was unclear if these deposits were recent or due to older deposits.
Occasional small earthquakes were recorded during May, but there were no signs of explosive activity seen in geophysical data. Gas-and-steam emissions continued from the N crater of Mount Young, based on webcam images, and seismicity remained slightly elevated. A new, light ash deposit was visible during the morning of 5 May on fresh snow on the NW flank of Mount Young. During 10 May periods of volcanic tremor were observed. The ACC was lowered to Yellow and the VAL to Advisory on 17 May due to no additional evidence of activity.
Geologic Background. Semisopochnoi, the largest subaerial volcano of the western Aleutians, is 20 km wide at sea level and contains an 8-km-wide caldera. It formed as a result of collapse of a low-angle, dominantly basaltic volcano following the eruption of a large volume of dacitic pumice. The high point of the island is Anvil Peak, a double-peaked late-Pleistocene cone that forms much of the island's northern part. The three-peaked Mount Cerberus (renamed Mount Young in 2023) was constructed within the caldera during the Holocene. Each of the peaks contains a summit crater; lava flows on the N flank appear younger than those on the south side. Other post-caldera volcanoes include the symmetrical Sugarloaf Peak SSE of the caldera and Lakeshore Cone, a small cinder cone at the edge of Fenner Lake in the NE part of the caldera. Most documented eruptions have originated from Young, although Coats (1950) considered that both Sugarloaf and Lakeshore Cone could have been recently active.
Information Contacts: Alaska Volcano Observatory (AVO), a cooperative program of a) U.S. Geological Survey, 4200 University Drive, Anchorage, AK 99508-4667 USA (URL: https://avo.alaska.edu/), b) Geophysical Institute, University of Alaska, PO Box 757320, Fairbanks, AK 99775-7320, USA, and c) Alaska Division of Geological & Geophysical Surveys, 794 University Ave., Suite 200, Fairbanks, AK 99709, USA (URL: http://dggs.alaska.gov/).
Ambae
Vanuatu
15.389°S, 167.835°E; summit elev. 1496 m
All times are local (unless otherwise noted)
New lava flow, ash plumes, and sulfur dioxide plumes during February-May 2023
Ambae, also known as Aoba, is a large basaltic shield volcano in Vanuatu. A broad pyroclastic cone containing three crater lakes (Manaro Ngoru, Voui, and Manaro Lakua) is located at the summit within the youngest of at least two nested calderas. Periodic phreatic and pyroclastic explosions have been reported since the 16th century. A large eruption more than 400 years ago resulted in a volcanic cone within the summit crater that is now filled by Lake Voui; the similarly sized Lake Manaro fills the western third of the caldera. The previous eruption ended in August 2022 that was characterized by gas-and-steam and ash emissions and explosions of wet tephra (BGVN 47:10). This report covers a new eruption during February through May 2023 that consisted of a new lava flow, ash plumes, and sulfur dioxide emissions, using information from the Vanuatu Meteorology and Geo-Hazards Department (VMGD) and satellite data.
During the reporting period, the Alert Level remained at a 2 (on a scale of 0-5), which has been in place since December 2021. Activity during October 2022 through March 2023 remained relatively low and mostly consisted of gas-and-steam emissions in Lake Voui. VMGD reported that at 1300 on 15 November a satellite image captured a strong amount of sulfur dioxide rising above the volcano (figure 99), and that seismicity slightly increased. The southern and northern part of the island reported a strong sulfur dioxide smell and heard explosions. On 20 February 2023 a gas-and-ash plume rose 1.3 km above the summit and drifted SSW, according to a webcam image (figure 100). Gas-and-steam and possibly ash emissions continued on 23 February and volcanic earthquakes were recorded by the seismic network.
During April, volcanic earthquakes and gas-and-steam and ash emissions were reported from the cone in Lake Voui. VMGD reported that activity increased during 5-7 April; high gas-and-steam and ash plumes were visible, accompanied by nighttime incandescence. According to a Wellington VAAC report, a low-level ash plume rose as high as 2.5 km above the summit and drifted W and SW on 5 April, based on satellite imagery. Reports in Saratamata stated that a dark ash plume drifted to the WSW, but no loud explosion was heard. Webcam images from 2100 showed incandescence above the crater and reflected in the clouds. According to an aerial survey, field observations, and satellite data, water was no longer present in the lake. A lava flow was reported effusing from the vent and traveling N into the dry Lake Voui, which lasted three days. The next morning at 0745 on 6 April a gas-and-steam and ash plume rose 5.4 km above the summit and drifted ESE, based on information from VMGD (figure 101). The Wellington VAAC also reported that light ashfall was observed on the island. Intermittent gas-and-steam and ash emissions were visible on 7 April, some of which rose to an estimated 3 km above the summit and drifted E. Webcam images during 0107-0730 on 7 April showed continuing ash emissions. A gas-and-steam and ash plume rose 695 m above the summit crater at 0730 on 19 April and drifted ESE, based on a webcam image (figure 102).
According to visual and infrared satellite data, water was visible in Lake Voui as late as 24 March 2023 (figure 103). The vent in the caldera showed a gas-and-steam plume drifted SE. On 3 April thermal activity was first detected, accompanied by a gas-and-ash plume that drifted W (figure 103). The lava flow moved N within the dry lake and was shown cooling by 8 April. By 23 April much of the water in the lake had returned. Occasional sulfur dioxide plumes were detected by the TROPOMI instrument on the Sentinel-5P satellite that exceeded 2 Dobson Units (DU) and drifted in different directions (figure 104).
Geologic Background. The island of Ambae, also known as Aoba, is a massive 2,500 km3 basaltic shield that is the most voluminous volcano of the New Hebrides archipelago. A pronounced NE-SW-trending rift zone with numerous scoria cones gives the 16 x 38 km island an elongated form. A broad pyroclastic cone containing three crater lakes (Manaro Ngoru, Voui, and Manaro Lakua) is located at the summit within the youngest of at least two nested calderas, the largest of which is 6 km in diameter. That large central edifice is also called Manaro Voui or Lombenben volcano. Post-caldera explosive eruptions formed the summit craters about 360 years ago. A tuff cone was constructed within Lake Voui (or Vui) about 60 years later. The latest known flank eruption, about 300 years ago, destroyed the population of the Nduindui area near the western coast.
Information Contacts: Geo-Hazards Division, Vanuatu Meteorology and Geo-Hazards Department (VMGD), Ministry of Climate Change Adaptation, Meteorology, Geo-Hazards, Energy, Environment and Disaster Management, Private Mail Bag 9054, Lini Highway, Port Vila, Vanuatu (URL: http://www.vmgd.gov.vu/, https://www.facebook.com/VanuatuGeohazardsObservatory/); Wellington Volcanic Ash Advisory Centre (VAAC), Meteorological Service of New Zealand Ltd (MetService), PO Box 722, Wellington, New Zealand (URL: http://www.metservice.com/vaac/, http://www.ssd.noaa.gov/VAAC/OTH/NZ/messages.html); MIROVA (Middle InfraRed Observation of Volcanic Activity), a collaborative project between the Universities of Turin and Florence (Italy) supported by the Centre for Volcanic Risk of the Italian Civil Protection Department (URL: http://www.mirovaweb.it/); Global Sulfur Dioxide Monitoring Page, Atmospheric Chemistry and Dynamics Laboratory, NASA Goddard Space Flight Center (NASA/GSFC), 8800 Greenbelt Road, Goddard, Maryland, USA (URL: https://so2.gsfc.nasa.gov/); Copernicus Browser, Copernicus Data Space Ecosystem, European Space Agency (URL: https://dataspace.copernicus.eu/browser/).
Ibu
Indonesia
1.488°N, 127.63°E; summit elev. 1325 m
All times are local (unless otherwise noted)
Daily ash explosions continue, along with thermal anomalies in the crater, October 2022-May 2023
Persistent eruptive activity since April 2008 at Ibu, a stratovolcano on Indonesian’s Halmahera Island, has consisted of daily explosive ash emissions and plumes, along with observations of thermal anomalies (BGVN 47:04). The current eruption continued during October 2022-May 2023, described below, based on advisories issued by the Pusat Vulkanologi dan Mitigasi Bencana Geologi (PVMBG, also known as Indonesian Center for Volcanology and Geological Hazard Mitigation, CVGHM), daily reports by MAGMA Indonesia (a PVMBG platform), and the Darwin Volcanic Ash Advisory Centre (VAAC), and various satellite data. The Alert Level during the reporting period remained at 2 (on a scale of 1-4), except raised briefly to 3 on 27 May, and the public was warned to stay at least 2 km away from the active crater and 3.5 km away on the N side of the volcano.
According to MAGMA Indonesia, during October 2022-May 2023, daily gray-and-white ash plumes of variable densities rose 200-1,000 m above the summit and drifted in multiple directions. On 30 October and 11 November, plumes rose a maximum of 2 km and 1.5 km above the summit, respectively (figures 42 and 43). According to the Darwin VAAC, discrete ash emissions on 13 November rose to 2.1 km altitude, or 800 m above the summit, and drifted W, and multiple ash emissions on 15 November rose 1.4 km above the summit and drifted NE. Occasional larger ash explosions through May 2023 prompted PVMBG to issue Volcano Observatory Notice for Aviation (VONA) alerts (table 6); the Aviation Color Code remained at Orange throughout this period.
Table 6. Volcano Observatory Notice for Aviation (VONA) ash plume alerts for Ibu issued by PVMBG during October 2022-May 2023. Maximum height above the summit was estimated by a ground observer. VONAs in January-May 2023 all described the ash plumes as dense.
| Date |
Time (local) |
Max height above summit |
Direction |
| 17 Oct 2022 |
0858 |
800 m |
SW |
| 18 Oct 2022 |
1425 |
800 m |
S |
| 19 Oct 2022 |
2017 |
600 m |
SW |
| 21 Oct 2022 |
0916 |
800 m |
NW |
| 16 Jan 2023 |
1959 |
600 m |
NE |
| 22 Jan 2023 |
0942 |
1,000 m |
E |
| 29 Jan 2023 |
2138 |
1,000 m |
E |
| 10 May 2023 |
0940 |
800 m |
NW |
| 10 May 2023 |
2035 |
600 m |
E |
| 21 May 2023 |
2021 |
600 m |
W |
| 21 May 2023 |
2140 |
1,000 m |
W |
| 29 May 2023 |
1342 |
800 m |
N |
| 31 May 2023 |
1011 |
1,000 m |
SW |
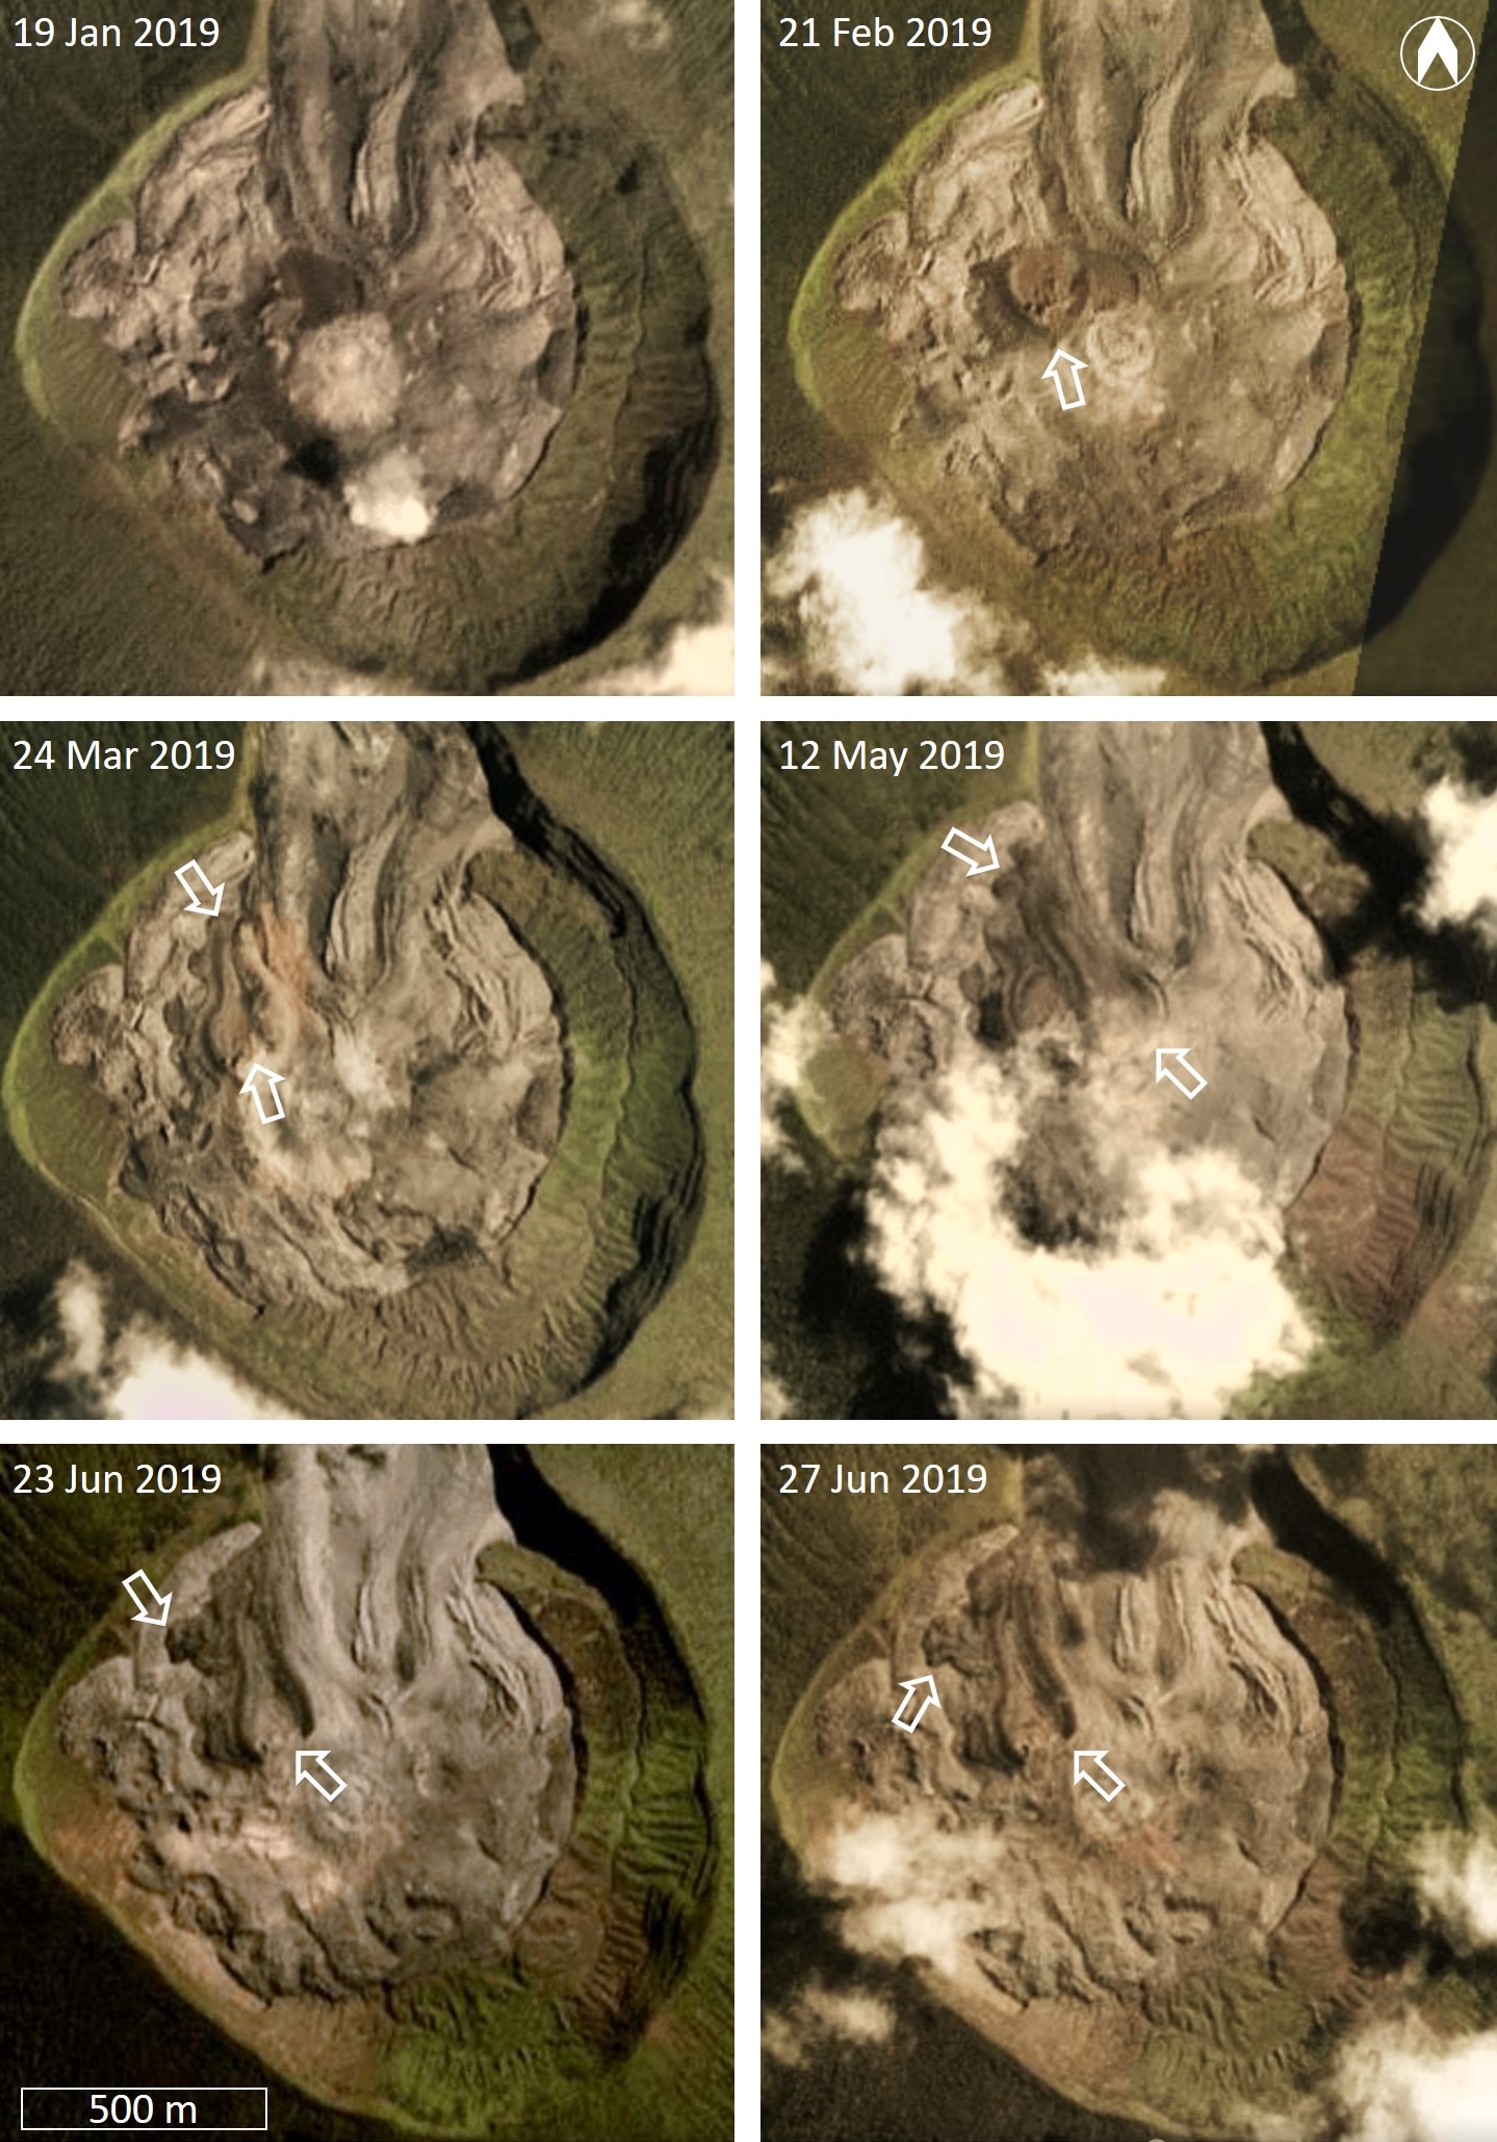
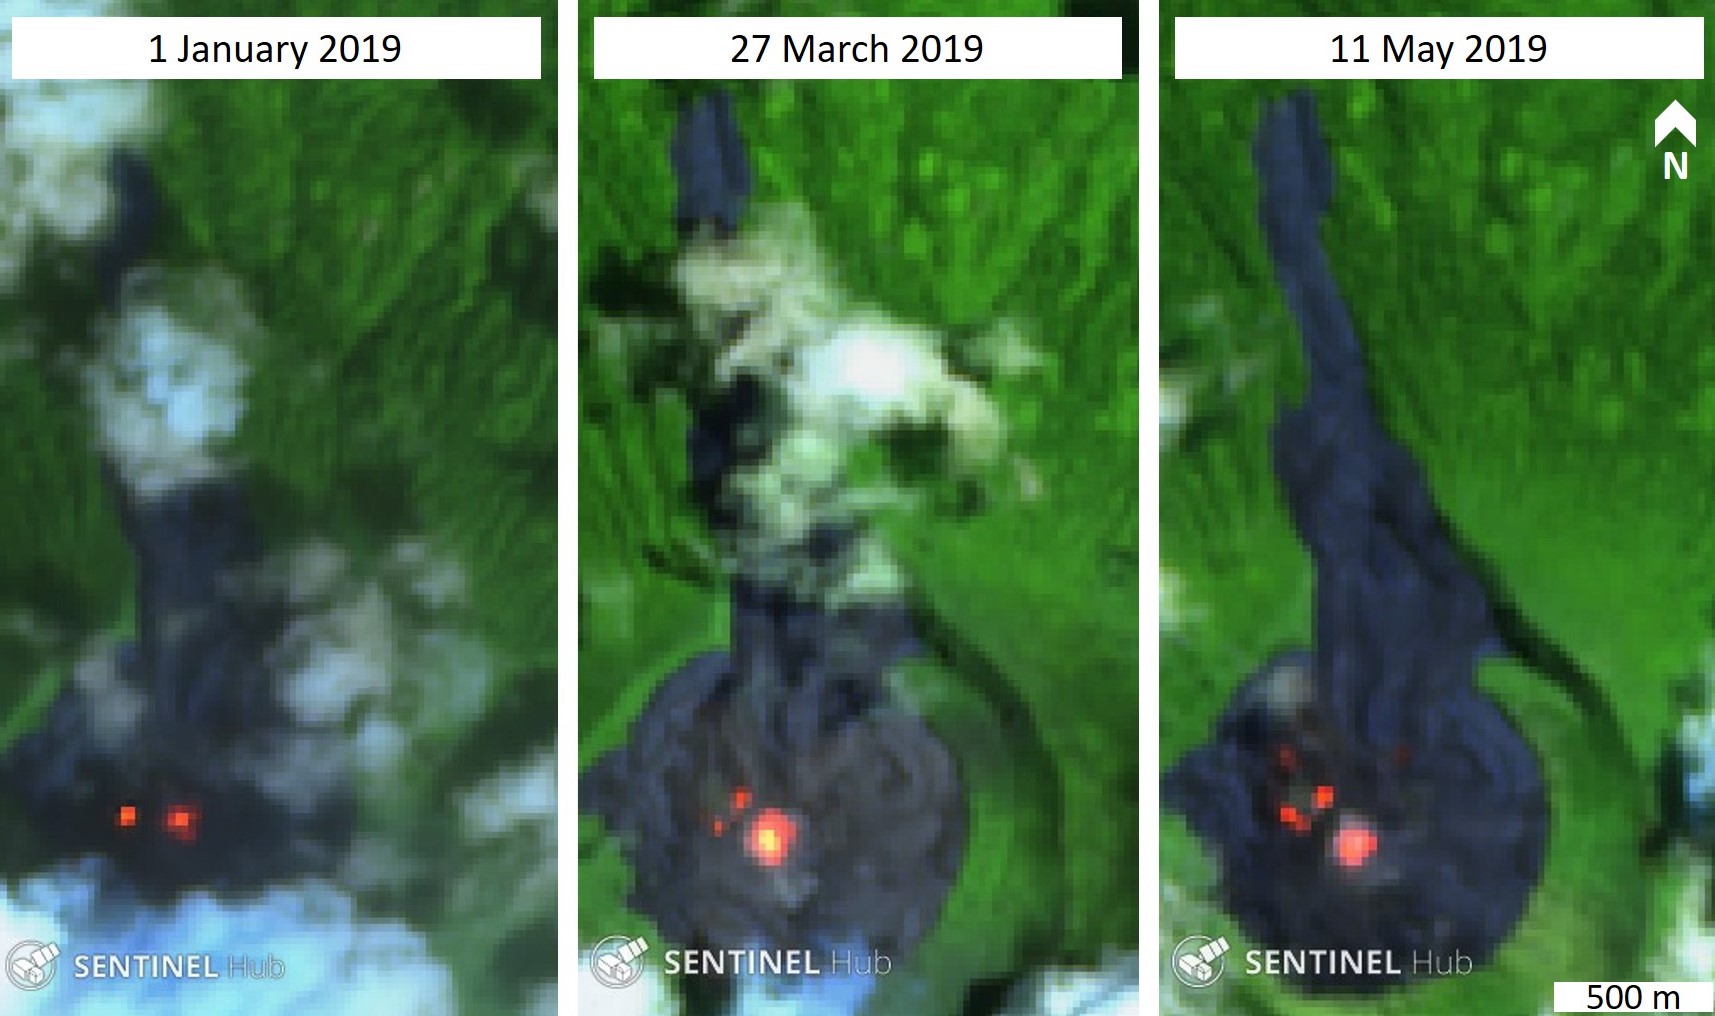
Sentinel-2 L1C satellite images throughout the reporting period show two, sometimes three persistent thermal anomalies in the summit crater, with the most prominent hotspot from the top of a cone within the crater. Clear views were more common during March-April 2023, when a vent and lava flows on the NE flank of the intra-crater cone could be distinguished (figure 44). White-to-grayish emissions were also observed during brief periods when weather clouds allowed clear views.
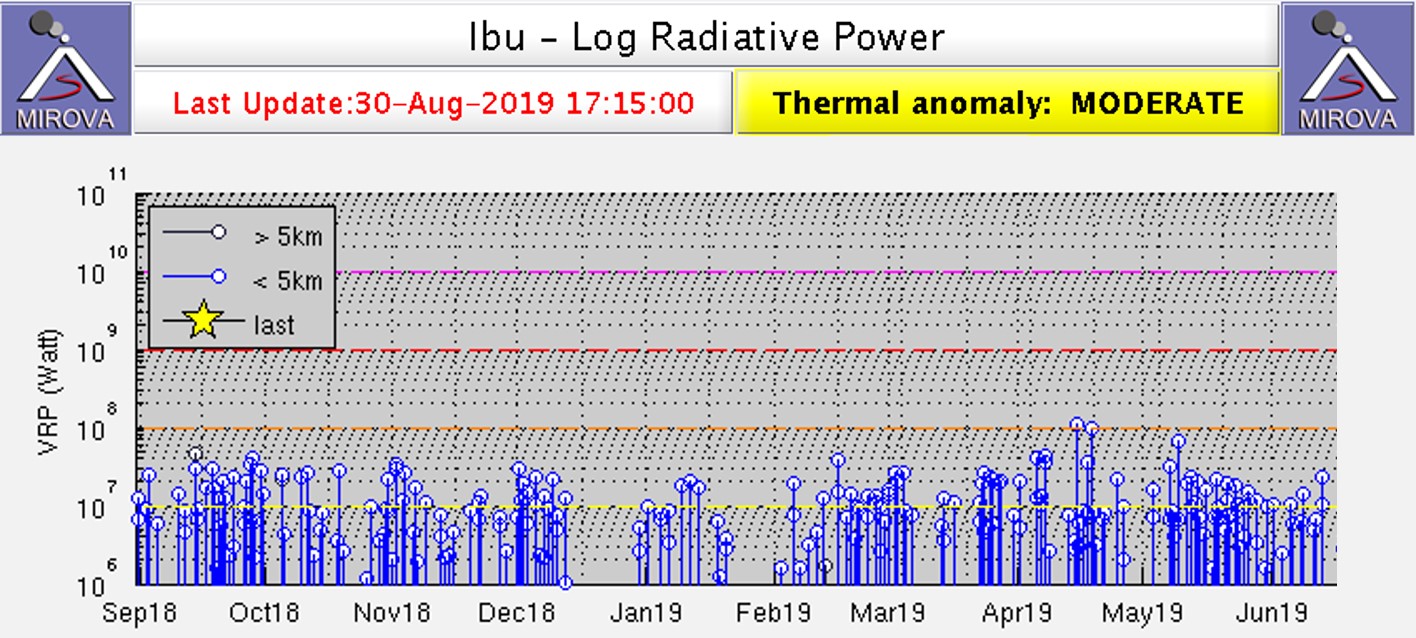
The MIROVA space-based volcano hotspot detection system recorded almost daily thermal anomalies throughout the reporting period, though cloud cover often interfered with detections. Data from imaging spectroradiometers aboard NASA’s Aqua and Terra satellites and processed using the MODVOLC algorithm (MODIS-MODVOLC) recorded hotspots on one day during October 2022 and December 2022, two days in April 2023, three days in November 2022 and May 2023, and four days in March 2023.
Geologic Background. The truncated summit of Gunung Ibu stratovolcano along the NW coast of Halmahera Island has large nested summit craters. The inner crater, 1 km wide and 400 m deep, has contained several small crater lakes. The 1.2-km-wide outer crater is breached on the N, creating a steep-walled valley. A large cone grew ENE of the summit, and a smaller one to the WSW has fed a lava flow down the W flank. A group of maars is located below the N and W flanks. The first observed and recorded eruption was a small explosion from the summit crater in 1911. Eruptive activity began again in December 1998, producing a lava dome that eventually covered much of the floor of the inner summit crater along with ongoing explosive ash emissions.
Information Contacts: Pusat Vulkanologi dan Mitigasi Bencana Geologi (PVMBG, also known as Indonesian Center for Volcanology and Geological Hazard Mitigation, CVGHM), Jalan Diponegoro 57, Bandung 40122, Indonesia (URL: http://www.vsi.esdm.go.id/); MAGMA Indonesia (Multiplatform Application for Geohazard Mitigation and Assessment in Indonesia), Kementerian Energi dan Sumber Daya Mineral (URL: https://magma.esdm.go.id/v1); Copernicus Browser, Copernicus Data Space Ecosystem, European Space Agency (URL: https://dataspace.copernicus.eu/browser/); MIROVA (Middle InfraRed Observation of Volcanic Activity), a collaborative project between the Universities of Turin and Florence (Italy) supported by the Centre for Volcanic Risk of the Italian Civil Protection Department (URL: http://www.mirovaweb.it/); Hawai'i Institute of Geophysics and Planetology (HIGP) - MODVOLC Thermal Alerts System, School of Ocean and Earth Science and Technology (SOEST), Univ. of Hawai'i, 2525 Correa Road, Honolulu, HI 96822, USA (URL: http://modis.higp.hawaii.edu/).
Dukono
Indonesia
1.6992°N, 127.8783°E; summit elev. 1273 m
All times are local (unless otherwise noted)
Continuing ash emissions, SO2 plumes, and thermal signals during October 2022-May 2023
Dukono, a remote volcano on Indonesia’s Halmahera Island, has been erupting continuously since 1933, with frequent ash explosions and sulfur dioxide plumes (BGVN 46:11, 47:10). This activity continued during October 2022 through May 2023, based on reports from the Pusat Vulkanologi dan Mitigasi Bencana Geologi (PVMBG; also known as Indonesian Center for Volcanology and Geological Hazard Mitigation, CVGHM), the Darwin Volcanic Ash Advisory Centre (VAAC), and satellite data. During this period, the Alert Level remained at 2 (on a scale of 1-4) and the public was warned to remain outside of the 2-km exclusion zone. The highest reported plume of the period reached 9.4 km above the summit on 14 November 2022.
According to MAGMA Indonesia (a platform developed by PVMBG), white, gray, or dark plumes of variable densities were observed almost every day during the reporting period, except when fog obscured the volcano (figure 33). Plumes generally rose 25-450 m above the summit, but rose as high as 700-800 m on several days, somewhat lower than the maximum heights reached earlier in 2022 when plumes reached as high as 1 km. However, the Darwin VAAC reported that on 14 November 2022, a discrete ash plume rose 9.4 km above the summit (10.7 km altitude), accompanied by a strong hotspot and a sulfur dioxide signal observed in satellite imagery; a continuous ash plume that day and through the 15th rose to 2.1-2.4 km altitude and drifted NE.
Sentinel-2 images were obscured by weather clouds almost every viewing day during the reporting period. However, the few reasonably clear images showed a hotspot and white or gray emissions and plumes. Strong SO2 plumes from Dukono were present on many days during October 2022-May 2023, as detected using the TROPOMI instrument on the Sentinel-5P satellite (figure 34).
Geologic Background. Reports from this remote volcano in northernmost Halmahera are rare, but Dukono has been one of Indonesia's most active volcanoes. More-or-less continuous explosive eruptions, sometimes accompanied by lava flows, have occurred since 1933. During a major eruption in 1550 CE, a lava flow filled in the strait between Halmahera and the N-flank Gunung Mamuya cone. This complex volcano presents a broad, low profile with multiple summit peaks and overlapping craters. Malupang Wariang, 1 km SW of the summit crater complex, contains a 700 x 570 m crater that has also been active during historical time.
Information Contacts: Pusat Vulkanologi dan Mitigasi Bencana Geologi (PVMBG, also known as Indonesian Center for Volcanology and Geological Hazard Mitigation, CVGHM), Jalan Diponegoro 57, Bandung 40122, Indonesia (URL: http://www.vsi.esdm.go.id/); MAGMA Indonesia (Multiplatform Application for Geohazard Mitigation and Assessment in Indonesia), Kementerian Energi dan Sumber Daya Mineral (URL: https://magma.esdm.go.id/v1); Darwin Volcanic Ash Advisory Centre (VAAC), Bureau of Meteorology, Northern Territory Regional Office, PO Box 40050, Casuarina, NT 0811, Australia (URL: http://www.bom.gov.au/info/vaac/); NASA Global Sulfur Dioxide Monitoring Page, Atmospheric Chemistry and Dynamics Laboratory, NASA Goddard Space Flight Center (NASA/GSFC), 8800 Greenbelt Road, Goddard, Maryland, USA (URL: https://so2.gsfc.nasa.gov/); Sentinel Hub Playground (URL: https://www.sentinel-hub.com/explore/sentinel-playground).
Sabancaya
Peru
15.787°S, 71.857°W; summit elev. 5960 m
All times are local (unless otherwise noted)
Explosions, gas-and-ash plumes, and thermal activity persist during November 2022-April 2023
Sabancaya is located in Peru, NE of Ampato and SE of Hualca Hualca. Eruptions date back to 1750 and have been characterized by explosions, phreatic activity, ash plumes, and ashfall. The current eruption period began in November 2016 and has more recently consisted of daily explosions, gas-and-ash plumes, and thermal activity (BGVN 47:11). This report updates activity during November 2022 through April 2023 using information from Instituto Geophysico del Peru (IGP) that use weekly activity reports and various satellite data.
Intermittent low-to-moderate power thermal anomalies were reported by the MIROVA project during November 2022 through April 2023 (figure 119). There were few short gaps in thermal activity during mid-December 2022, late December-to-early January 2023, late January to mid-February, and late February. According to data recorded by the MODVOLC thermal algorithm, there were a total of eight thermal hotspots: three in November 2022, three in February 2023, one in March, and one in April. On clear weather days, some of this thermal anomaly was visible in infrared satellite imagery showing the active lava dome in the summit crater (figure 120). Almost daily moderate-to-strong sulfur dioxide plumes were recorded during the reporting period by the TROPOMI instrument on the Sentinel-5P satellite (figure 121). Many of these plumes exceeded 2 Dobson Units (DU) and drifted in multiple directions.
IGP reported that moderate activity during November and December 2022 continued; during November, an average number of explosions were reported each week: 30, 33, 36, and 35, and during December, it was 32, 40, 47, 52, and 67. Gas-and-ash plumes in November rose 3-3.5 km above the summit and drifted E, NE, SE, S, N, W, and SW. During December the gas-and-ash plumes rose 2-4 km above the summit and drifted in different directions. There were 1,259 volcanic earthquakes recorded during November and 1,693 during December. Seismicity also included volcano-tectonic-type events that indicate rock fracturing events. Slight inflation was observed in the N part of the volcano near Hualca Hualca (4 km N). Thermal activity was frequently reported in the crater at the active lava dome (figure 120).
Explosive activity continued during January and February 2023. The average number of explosions were reported each week during January (51, 50, 60, and 59) and February (43, 54, 51, and 50). Gas-and-ash plumes rose 1.6-2.9 km above the summit and drifted NW, SW, and W during January and rose 1.4-2.8 above the summit and drifted W, SW, E, SE, N, S, NW, and NE during February. IGP also detected 1,881 volcanic earthquakes during January and 1,661 during February. VT-type earthquakes were also reported. Minor inflation persisted near Hualca Hualca. Satellite imagery showed continuous thermal activity in the crater at the lava dome (figure 120).
During March, the average number of explosions each week was 46, 48, 31, 35, and 22 and during April, it was 29, 41, 31, and 27. Accompanying gas-and-ash plumes rose 1.7-2.6 km above the summit crater and drifted W, SW, NW, S, and SE during March. According to a Buenos Aires Volcano Ash Advisory Center (VAAC) notice, on 22 March at 1800 through 23 March an ash plume rose to 7 km altitude and drifted NW. By 0430 an ash plume rose to 7.6 km altitude and drifted W. On 24 and 26 March continuous ash emissions rose to 7.3 km altitude and drifted SW and on 28 March ash emissions rose to 7.6 km altitude. During April, gas-and-ash plumes rose 1.6-2.5 km above the summit and drifted W, SW, S, NW, NE, and E. Frequent volcanic earthquakes were recorded, with 1,828 in March and 1,077 in April, in addition to VT-type events. Thermal activity continued to be reported in the summit crater at the lava dome (figure 120).
Geologic Background. Sabancaya, located in the saddle NE of Ampato and SE of Hualca Hualca volcanoes, is the youngest of these volcanic centers and the only one to have erupted in historical time. The oldest of the three, Nevado Hualca Hualca, is of probable late-Pliocene to early Pleistocene age. The name Sabancaya (meaning "tongue of fire" in the Quechua language) first appeared in records in 1595 CE, suggesting activity prior to that date. Holocene activity has consisted of Plinian eruptions followed by emission of voluminous andesitic and dacitic lava flows, which form an extensive apron around the volcano on all sides but the south. Records of historical eruptions date back to 1750.
Information Contacts: Instituto Geofisico del Peru (IGP), Centro Vulcanológico Nacional (CENVUL), Calle Badajoz N° 169 Urb. Mayorazgo IV Etapa, Ate, Lima 15012, Perú (URL: https://www.igp.gob.pe/servicios/centro-vulcanologico-nacional/inicio); Buenos Aires Volcanic Ash Advisory Center (VAAC), Servicio Meteorológico Nacional-Fuerza Aérea Argentina, 25 de mayo 658, Buenos Aires, Argentina (URL: http://www.smn.gov.ar/vaac/buenosaires/inicio.php); MIROVA (Middle InfraRed Observation of Volcanic Activity), a collaborative project between the Universities of Turin and Florence (Italy) supported by the Centre for Volcanic Risk of the Italian Civil Protection Department (URL: http://www.mirovaweb.it/); Hawai'i Institute of Geophysics and Planetology (HIGP) - MODVOLC Thermal Alerts System, School of Ocean and Earth Science and Technology (SOEST), Univ. of Hawai'i, 2525 Correa Road, Honolulu, HI 96822, USA (URL: http://modis.higp.hawaii.edu/); NASA Global Sulfur Dioxide Monitoring Page, Atmospheric Chemistry and Dynamics Laboratory, NASA Goddard Space Flight Center (NASA/GSFC), 8800 Greenbelt Road, Goddard MD 20771, USA (URL: https://so2.gsfc.nasa.gov/); Copernicus Browser, Copernicus Data Space Ecosystem, European Space Agency (URL: https://dataspace.copernicus.eu/browser/).
Sheveluch
Russia
56.653°N, 161.36°E; summit elev. 3283 m
All times are local (unless otherwise noted)
Significant explosions destroyed part of the lava-dome complex during April 2023
Sheveluch (also spelled Shiveluch) in Kamchatka, has had at least 60 large eruptions during the last 10,000 years. The summit is truncated by a broad 9-km-wide caldera that is breached to the S, and many lava domes occur on the outer flanks. The lava dome complex was constructed within the large open caldera. Frequent collapses of the dome complex have produced debris avalanches; the resulting deposits cover much of the caldera floor. A major south-flank collapse during a 1964 Plinian explosion produced a scarp in which a “Young Sheveluch” dome began to form in 1980. Repeated episodes of dome formation and destruction since then have produced major and minor ash plumes, pyroclastic flows, block-and-ash flows, and “whaleback domes” of spine-like extrusions in 1993 and 2020 (BGVN 45:11). The current eruption period began in August 1999 and has more recently consisted of lava dome growth, explosions, ash plumes, and avalanches (BGVN 48:01). This report covers a significant explosive eruption during early-to-mid-April 2023 that generated a 20 km altitude ash plume, produced a strong sulfur dioxide plume, and destroyed part of the lava-dome complex; activity described during January through April 2023 use information primarily from the Kamchatka Volcanic Eruptions Response Team (KVERT) and various satellite data.
Satellite data. Activity during the majority of this reporting period was characterized by continued lava dome growth, strong fumarole activity, explosions, and hot avalanches. According to the MODVOLC Thermal Alerts System, 140 hotspots were detected through the reporting period, with 33 recorded in January 2023, 29 in February, 44 in March, and 34 in April. Frequent strong thermal activity was recorded during January 2023 through April, according to the MIROVA (Middle InfraRed Observation of Volcanic Activity) graph and resulted from the continuously growing lava dome (figure 94). A slightly stronger pulse in thermal activity was detected in early-to-mid-April, which represented the significant eruption that destroyed part of the lava-dome complex. Thermal anomalies were also visible in infrared satellite imagery at the summit crater (figure 95).
During January 2023 KVERT reported continued growth of the lava dome, accompanied by strong fumarolic activity, incandescence from the lava dome, explosions, ash plumes, and avalanches. Satellite data showed a daily thermal anomaly over the volcano. Video data showed ash plumes associated with collapses at the dome that generated avalanches that in turn produced ash plumes rising to 3.5 km altitude and drifting 40 km W on 4 January and rising to 7-7.5 km altitude and drifting 15 km SW on 5 January. A gas-and-steam plume containing some ash that was associated with avalanches rose to 5-6 km altitude and extended 52-92 km W on 7 January. Explosions that same day produced ash plumes that rose to 7-7.5 km altitude and drifted 10 km W. According to a Volcano Observatory Notice for Aviation (VONA) issued at 1344 on 19 January, explosions produced an ash cloud that was 15 x 25 km in size and rose to 9.6-10 km altitude, drifting 21-25 km W; as a result, the Aviation Color Code (ACC) was raised to Red (the highest level on a four-color scale). Another VONA issued at 1635 reported that no more ash plumes were observed, and the ACC was lowered to Orange (the second highest level on a four-color scale). On 22 January an ash plume from collapses and avalanches rose to 5 km altitude and drifted 25 km NE and SW; ash plumes associated with collapses extended 70 km NE on 27 and 31 January.
Lava dome growth, fumarolic activity, dome incandescence, and occasional explosions and avalanches continued during February and March. A daily thermal anomaly was visible in satellite data. Explosions on 1 February generated ash plumes that rose to 6.3-6.5 km altitude and extended 15 km NE. Video data showed an ash cloud from avalanches rising to 5.5 km altitude and drifting 5 km SE on 2 February. Satellite data showed gas-and-steam plumes containing some ash rose to 5-5.5 km altitude and drifted 68-110 km ENE and NE on 6 February, to 4.5-5 km altitude and drifted 35 km WNW on 22 February, and to 3.7-4 km altitude and drifted 47 km NE on 28 February. Scientists from the Kamchatka Volcanological Station (KVS) went on a field excursion on 25 February to document the growing lava dome, and although it was cloudy most of the day, nighttime incandescence was visible. Satellite data showed an ash plume extending up to 118 km E during 4-5 March. Video data from 1150 showed an ash cloud from avalanches rose to 3.7-5.5 km altitude and drifted 5-10 km ENE and E on 5 March. On 11 March an ash plume drifted 62 km E. On 27 March ash plumes rose to 3.5 km altitude and drifted 100 km E. Avalanches and constant incandescence at the lava dome was focused on the E and NE slopes on 28 March. A gas-and-steam plume containing some ash rose to 3.5 km altitude and moved 40 km E on 29 March. Ash plumes on 30 March rose to 3.5-3.7 km altitude and drifted 70 km NE.
Similar activity continued during April, with lava dome growth, strong fumarolic activity, incandescence in the dome, occasional explosions, and avalanches. A thermal anomaly persisted throughout the month. During 1-4 April weak ash plumes rose to 2.5-3 km altitude and extended 13-65 km SE and E.
Activity during 11 April 2023. The Institute of Volcanology and Seismology, Far Eastern Branch, Russian Academy of Sciences (IVS FEB RAS) reported a significant increase in seismicity around 0054 on 11 April, as reported by strong explosions detected on 11 April beginning at 0110 that sent ash plumes up to 7-10 km altitude and extended 100-435 km W, WNW, NNW, WSW, and SW. According to a Tokyo VAAC report the ash plume rose to 15.8 km altitude. By 0158 the plume extended over a 75 x 100 km area. According to an IVS FEB RAS report, the eruptive column was not vertical: the initial plume at 0120 on 11 April deviated to the NNE, at 0000 on 12 April, it drifted NW, and by 1900 it drifted SW. KVS reported that significant pulses of activity occurred at around 0200, 0320, and then a stronger phase around 0600. Levin Dmitry took a video from near Békés (3 km away) at around 0600 showing a rising plume; he also reported that a pyroclastic flow traveled across the road behind him as he left the area. According to IVS FEB RAS, the pyroclastic flow traveled several kilometers SSE, stopping a few hundred meters from a bridge on the road between Klyuchi and Petropavlovsk-Kamchatsky.
Ashfall was first observed in Klyuchi (45 km SW) at 0630, and a large, black ash plume blocked light by 0700. At 0729 KVERT issued a Volcano Observatory Notice for Aviation (VONA) raising the Aviation Color Code to Red (the highest level on a four-color scale). It also stated that a large ash plume had risen to 10 km altitude and drifted 100 km W. Near-constant lightning strikes were reported in the plume and sounds like thunderclaps were heard until about 1000. According to IVS FEB RAS the cloud was 200 km long and 76 km wide by 0830, and was spreading W at altitudes of 6-12 km. In the Klyuchi Village, the layer of both ash and snow reached 8.5 cm (figure 96); ashfall was also reported in Kozyrevsk (112 km SW) at 0930, Mayskoye, Anavgay, Atlasovo, Lazo, and Esso. Residents in Klyuchi reported continued darkness and ashfall at 1100. In some areas, ashfall was 6 cm deep and some residents reported dirty water coming from their plumbing. According to IVS FEB RAS, an ash cloud at 1150 rose to 5-20 km altitude and was 400 km long and 250 km wide, extending W. A VONA issued at 1155 reported that ash had risen to 10 km and drifted 340 km NNW and 240 km WSW. According to Simon Carn (Michigan Technological University), about 0.2 Tg of sulfur dioxide in the plume was measured in a satellite image from the TROPOMI instrument on the Sentinel-5P satellite acquired at 1343 that covered an area of about 189,000 km2 (figure 97). Satellite data at 1748 showed an ash plume that rose to 8 km altitude and drifted 430 km WSW and S, according to a VONA.
Activity during 12-15 April 2023. On 12 April at 0730 satellite images showed ash plumes rose to 7-8 km altitude and extended 600 km SW, 1,050 km ESE, and 1,300-3,000 km E. By 1710 that day, the explosions weakened. According to news sources, the ash-and-gas plumes drifted E toward the Aleutian Islands and reached the Gulf of Alaska by 13 April, causing flight disruptions. More than 100 flights involving Alaska airspace were cancelled due to the plume. Satellite data showed ash plumes rising to 4-5.5 km altitude and drifted 400-415 km SE and ESE on 13 April. KVS volcanologists observed the pyroclastic flow deposits and noted that steam rose from downed, smoldering trees. They also noted that the deposits were thin with very few large fragments, which differed from previous flows. The ash clouds traveled across the Pacific Ocean. Flight cancellations were also reported in NW Canada (British Columbia) during 13-14 April. During 14-15 April ash plumes rose to 6 km altitude and drifted 700 km NW.
Alaskan flight schedules were mostly back to normal by 15 April, with only minor delays and far less cancellations; a few cancellations continued to be reported in Canada. Clear weather on 15 April showed that most of the previous lava-dome complex was gone and a new crater roughly 1 km in diameter was observed (figure 98); gas-and-steam emissions were rising from this crater. Evidence suggested that there had been a directed blast to the SE, and pyroclastic flows traveled more than 20 km. An ash plume rose to 4.5-5.2 km altitude and drifted 93-870 km NW on 15 April.
Activity during 16-30 April 2023. Resuspended ash was lifted by the wind from the slopes and rose to 4 km altitude and drifted 224 km NW on 17 April. KVERT reported a plume of resuspended ash from the activity during 10-13 April on 19 April that rose to 3.5-4 km altitude and drifted 146-204 km WNW. During 21-22 April a plume stretched over the Scandinavian Peninsula. A gas-and-steam plume containing some ash rose to 3-3.5 km altitude and drifted 60 km SE on 30 April. A possible new lava dome was visible on the W slope of the volcano on 29-30 April (figure 99); satellite data showed two thermal anomalies, a bright one over the existing lava dome and a weaker one over the possible new one.
References. Girina, O., Loupian, E., Horvath, A., Melnikov, D., Manevich, A., Nuzhdaev, A., Bril, A., Ozerov, A., Kramareva, L., Sorokin, A., 2023, Analysis of the development of the paroxysmal eruption of Sheveluch volcano on April 10–13, 2023, based on data from various satellite systems, ??????????? ???????? ??? ?? ???????, 20(2).
Geologic Background. The high, isolated massif of Sheveluch volcano (also spelled Shiveluch) rises above the lowlands NNE of the Kliuchevskaya volcano group. The 1,300 km3 andesitic volcano is one of Kamchatka's largest and most active volcanic structures, with at least 60 large eruptions during the Holocene. The summit of roughly 65,000-year-old Stary Shiveluch is truncated by a broad 9-km-wide late-Pleistocene caldera breached to the south. Many lava domes occur on its outer flanks. The Molodoy Shiveluch lava dome complex was constructed during the Holocene within the large open caldera; Holocene lava dome extrusion also took place on the flanks of Stary Shiveluch. Widespread tephra layers from these eruptions have provided valuable time markers for dating volcanic events in Kamchatka. Frequent collapses of dome complexes, most recently in 1964, have produced debris avalanches whose deposits cover much of the floor of the breached caldera.
Information Contacts: Kamchatka Volcanic Eruptions Response Team (KVERT), Far Eastern Branch, Russian Academy of Sciences, 9 Piip Blvd., Petropavlovsk-Kamchatsky, 683006, Russia (URL: http://www.kscnet.ru/ivs/kvert/); Institute of Volcanology and Seismology, Far Eastern Branch, Russian Academy of Sciences (IVS FEB RAS), 9 Piip Blvd., Petropavlovsk-Kamchatsky 683006, Russia (URL: http://www.kscnet.ru/ivs/eng/); Kamchatka Volcanological Station, Kamchatka Branch of Geophysical Survey, (KB GS RAS), Klyuchi, Kamchatka Krai, Russia (URL: http://volkstat.ru/); Hawai'i Institute of Geophysics and Planetology (HIGP) - MODVOLC Thermal Alerts System, School of Ocean and Earth Science and Technology (SOEST), Univ. of Hawai'i, 2525 Correa Road, Honolulu, HI 96822, USA (URL: http://modis.higp.hawaii.edu/); MIROVA (Middle InfraRed Observation of Volcanic Activity), a collaborative project between the Universities of Turin and Florence (Italy) supported by the Centre for Volcanic Risk of the Italian Civil Protection Department (URL: http://www.mirovaweb.it/); Copernicus Browser, Copernicus Data Space Ecosystem, European Space Agency (URL: https://dataspace.copernicus.eu/browser/); Kam 24 News Agency, 683032, Kamchatka Territory, Petropavlovsk-Kamchatsky, Vysotnaya St., 2A (URL: https://kam24.ru/news/main/20230411/96657.html#.Cj5Jrky6.dpuf); Simon Carn, Geological and Mining Engineering and Sciences, Michigan Technological University, 1400 Townsend Drive, Houghton, MI 49931, USA (URL: http://www.volcarno.com/, Twitter: @simoncarn).
Bezymianny
Russia
55.972°N, 160.595°E; summit elev. 2882 m
All times are local (unless otherwise noted)
Explosions, ash plumes, lava flows, and avalanches during November 2022-April 2023
Bezymianny is located on the Kamchatka Peninsula of Russia as part of the Klyuchevskoy volcano group. Historic eruptions began in 1955 and have been characterized by dome growth, explosions, pyroclastic flows, ash plumes, and ashfall. During the 1955-56 eruption a large open crater was formed by collapse of the summit and an associated lateral blast. Subsequent episodic but ongoing lava-dome growth, accompanied by intermittent explosive activity and pyroclastic flows, has largely filled the 1956 crater. The current eruption period began in December 2016 and more recent activity has consisted of strong explosions, ash plumes, and thermal activity (BGVN 47:11). This report covers activity during November 2022 through April 2023, based on weekly and daily reports from the Kamchatka Volcano Eruptions Response Team (KVERT) and satellite data.
Activity during November and March 2023 was relatively low and mostly consisted of gas-and-steam emissions, occasional small collapses that generated avalanches along the lava dome slopes, and a persistent thermal anomaly over the volcano that was observed in satellite data on clear weather days. According to the Tokyo VAAC and KVERT, an explosion produced an ash plume that rose to 6 km altitude and drifted 25 km NE at 1825 on 29 March.
Gas-and-steam emissions, collapses generating avalanches, and thermal activity continued during April. According to two Volcano Observatory Notice for Aviation (VONA) issued on 2 and 6 April (local time) ash plumes rose to 3 km and 3.5-3.8 km altitude and drifted 35 km E and 140 km E, respectively. Satellite data from KVERT showed weak ash plumes extending up to 550 km E on 2 and 5-6 April.
A VONA issued at 0843 on 7 April described an ash plume that rose to 4.5-5 km altitude and drifted 250 km ESE. Later that day at 1326 satellite data showed an ash plume that rose to 5.5-6 km altitude and drifted 150 km ESE. A satellite image from 1600 showed an ash plume extending as far as 230 km ESE; KVERT noted that ash emissions were intensifying, likely due to avalanches from the growing lava dome. The Aviation Color Code (ACC) was raised to Red (the highest level on a four-color scale). At 1520 satellite data showed an ash plume rising to 5-5.5 km altitude and drifting 230 km ESE. That same day, Kamchatka Volcanological Station (KVS) volcanologists traveled to Ambon to collect ash; they reported that a notable eruption began at 1730, and within 20 minutes a large ash plume rose to 10 km altitude and drifted NW. KVERT reported that the strong explosive phase began at 1738. Video and satellite data taken at 1738 showed an ash plume that rose to 10-12 km altitude and drifted up to 2,800 km SE and E. Explosions were clearly audible 20 km away for 90 minutes, according to KVS. Significant amounts of ash fell at the Apakhonchich station, which turned the snow gray; ash continued to fall until the morning of 8 April. In a VONA issued at 0906 on 8 April, KVERT stated that the explosive eruption had ended; ash plumes had drifted 2,000 km E. The ACC was lowered to Orange (the third highest level on a four-color scale). The KVS team saw a lava flow on the active dome once the conditions were clear that same day (figure 53). On 20 April lava dome extrusion was reported; lava flows were noted on the flanks of the dome, and according to KVERT satellite data, a thermal anomaly was observed in the area. The ACC was lowered to Yellow (the second lowest on a four-color scale).
Satellite data showed an increase in thermal activity beginning in early April 2023. A total of 31 thermal hotspots were detected by the MODVOLC thermal algorithm on 4, 5, 7, and 12 April 2023. The elevated thermal activity resulted from an increase in explosive activity and the start of an active lava flow. The MIROVA (Middle InfraRed Observation of Volcanic Activity) volcano hotspot detection system based on the analysis of MODIS data also showed a pulse in thermal activity during the same time (figure 54). Infrared satellite imagery captured a continuous thermal anomaly at the summit crater, often accompanied by white gas-and-steam emissions (figure 55). On 4 April 2023 an active lava flow was observed descending the SE flank.
Geologic Background. The modern Bezymianny, much smaller than its massive neighbors Kamen and Kliuchevskoi on the Kamchatka Peninsula, was formed about 4,700 years ago over a late-Pleistocene lava-dome complex and an edifice built about 11,000-7,000 years ago. Three periods of intensified activity have occurred during the past 3,000 years. The latest period, which was preceded by a 1,000-year quiescence, began with the dramatic 1955-56 eruption. This eruption, similar to that of St. Helens in 1980, produced a large open crater that was formed by collapse of the summit and an associated lateral blast. Subsequent episodic but ongoing lava-dome growth, accompanied by intermittent explosive activity and pyroclastic flows, has largely filled the 1956 crater.
Information Contacts: Kamchatka Volcanic Eruptions Response Team (KVERT), Far Eastern Branch, Russian Academy of Sciences, 9 Piip Blvd., Petropavlovsk-Kamchatsky, 683006, Russia (URL: http://www.kscnet.ru/ivs/kvert/); Kamchatka Volcanological Station, Kamchatka Branch of Geophysical Survey, (KB GS RAS), Klyuchi, Kamchatka Krai, Russia (URL: http://volkstat.ru/); Hawai'i Institute of Geophysics and Planetology (HIGP) - MODVOLC Thermal Alerts System, School of Ocean and Earth Science and Technology (SOEST), Univ. of Hawai'i, 2525 Correa Road, Honolulu, HI 96822, USA (URL: http://modis.higp.hawaii.edu/); MIROVA (Middle InfraRed Observation of Volcanic Activity), a collaborative project between the Universities of Turin and Florence (Italy) supported by the Centre for Volcanic Risk of the Italian Civil Protection Department (URL: http://www.mirovaweb.it/); Copernicus Browser, Copernicus Data Space Ecosystem, European Space Agency (URL: https://dataspace.copernicus.eu/browser/).
Chikurachki
Russia
50.324°N, 155.461°E; summit elev. 1781 m
All times are local (unless otherwise noted)
New explosive eruption during late January-early February 2023
Chikurachki, located on Paramushir Island in the northern Kuriles, has had Plinian eruptions during the Holocene. Lava flows have reached the sea and formed capes on the NW coast; several young lava flows are also present on the E flank beneath a scoria deposit. Reported eruptions date back to 1690, with the most recent eruption period occurring during January through October 2022, characterized by occasional explosions, ash plumes, and thermal activity (BGVN 47:11). This report covers a new eruptive period during January through February 2023 that consisted of ash explosions and ash plumes, based on information from the Kamchatka Volcanic Eruptions Response Team (KVERT) and satellite data.
According to reports from KVERT, an explosive eruption began around 0630 on 29 January. Explosions generated ash plumes that rose to 3-3.5 km altitude and drifted 6-75 km SE and E, based on satellite data. As a result, the Aviation Color Code (ACC) was raised to Orange (the second highest level on a four-color scale). At 1406 and 1720 ash plumes were identified in satellite images that rose to 4.3 km altitude and extended 70 km E. By 2320 the ash plume had dissipated. A thermal anomaly was visible at the volcano on 31 January, according to a satellite image, and an ash plume was observed drifting 66 km NE.
Occasional explosions and ash plumes continued during early February. At 0850 on 1 February an ash plume rose to 3.5 km altitude and drifted 35 km NE. Satellite data showed an ash plume that rose to 3.2-3.5 km altitude and drifted 50 km NE at 1222 later that day (figure 22). A thermal anomaly was detected over the volcano during 5-6 February and ash plumes drifted as far as 125 km SE, E, and NE. Explosive events were reported at 0330 on 6 February that produced ash plumes rising to 4-4.5 km altitude and drifting 72-90 km N, NE, and ENE. KVERT noted that the last gas-and steam plume that contained some ash was observed on 8 February and drifted 55 km NE before the explosive eruption ended. The ACC was lowered to Yellow and then Green (the lowest level on a four-color scale) on 18 February.
Geologic Background. Chikurachki, the highest volcano on Paramushir Island in the northern Kuriles, is a relatively small cone constructed on a high Pleistocene edifice. Oxidized basaltic-to-andesitic scoria deposits covering the upper part of the young cone give it a distinctive red color. Frequent basaltic Plinian eruptions have occurred during the Holocene. Lava flows have reached the sea and formed capes on the NW coast; several young lava flows are also present on the E flank beneath a scoria deposit. The Tatarinov group of six volcanic centers is located immediately to the south, and the Lomonosov cinder cone group, the source of an early Holocene lava flow that reached the saddle between it and Fuss Peak to the west, lies at the southern end of the N-S-trending Chikurachki-Tatarinov complex. In contrast to the frequently active Chikurachki, the Tatarinov centers are extensively modified by erosion and have a more complex structure. Tephrochronology gives evidence of an eruption around 1690 CE from Tatarinov, although its southern cone contains a sulfur-encrusted crater with fumaroles that were active along the margin of a crater lake until 1959.
Information Contacts: Kamchatka Volcanic Eruptions Response Team (KVERT), Far East Division, Russian Academy of Sciences, 9 Piip Blvd., Petropavlovsk-Kamchatsky, 683006, Russia (URL: http://www.kscnet.ru/ivs/); Copernicus Browser, Copernicus Data Space Ecosystem, European Space Agency (URL: https://dataspace.copernicus.eu/browser/).
Search Bulletin Archive by Publication Date
Select a month and year from the drop-downs and click "Show Issue" to have that issue displayed in this tab.
The default month and year is the latest issue available.
Bulletin of the Global Volcanism Network - Volume 44, Number 07 (July 2019)
Managing Editor: Edward Venzke
Aira (Japan)
Explosions with ejecta and ash plumes continue weekly during January-June 2019
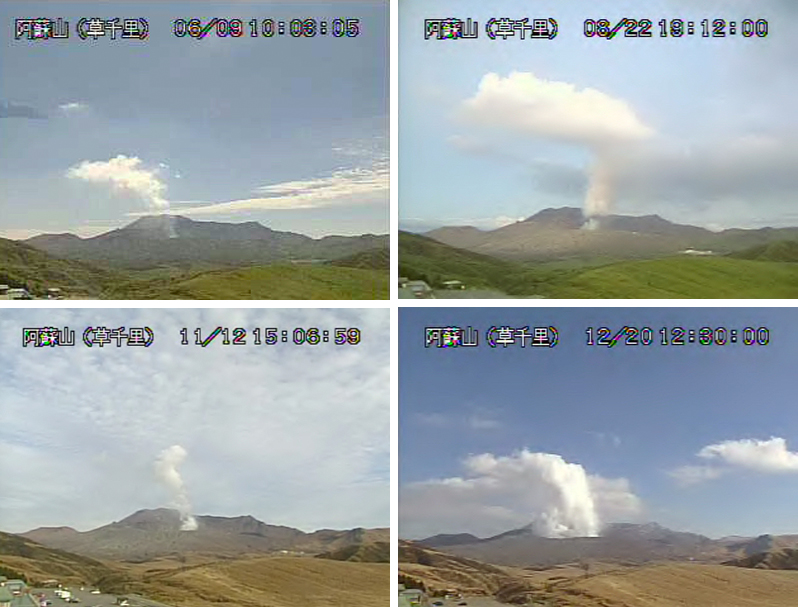
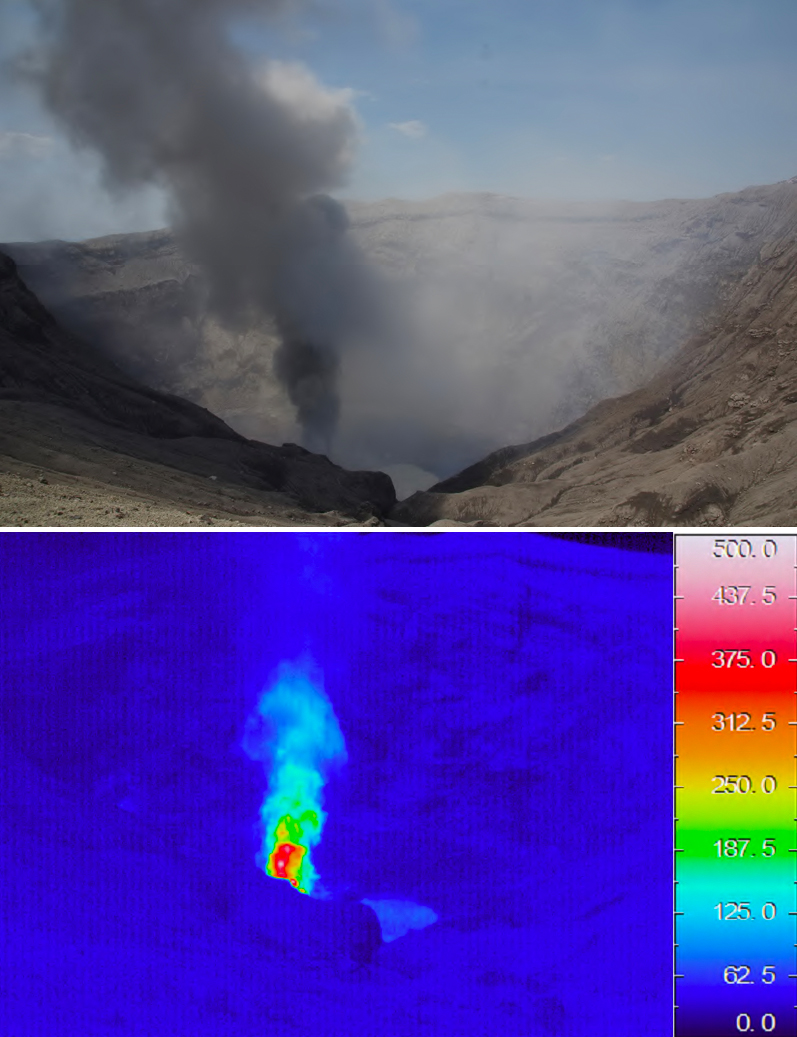
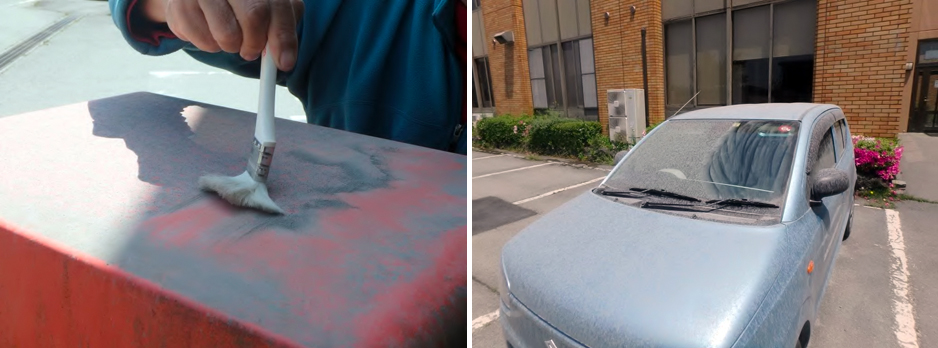
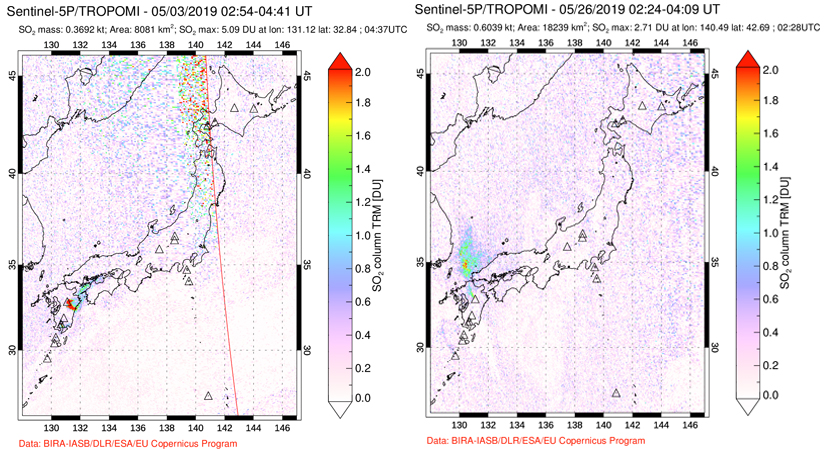
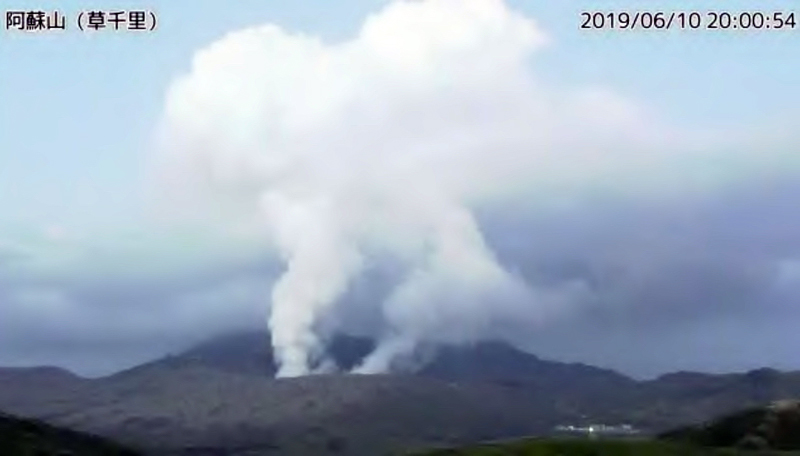
Asosan (Japan)
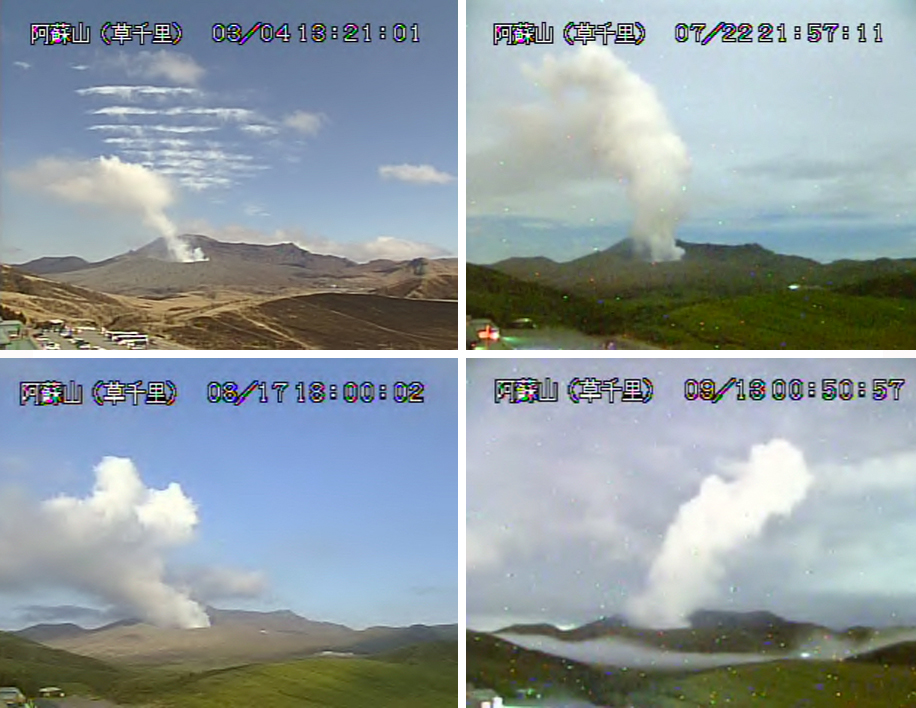
Multiple brief ash emission events during April and May 2019; minor ashfall in adjacent villages
Ebeko (Russia)
Continuing frequent moderate explosions though May 2019; ashfall in Severo-Kurilsk
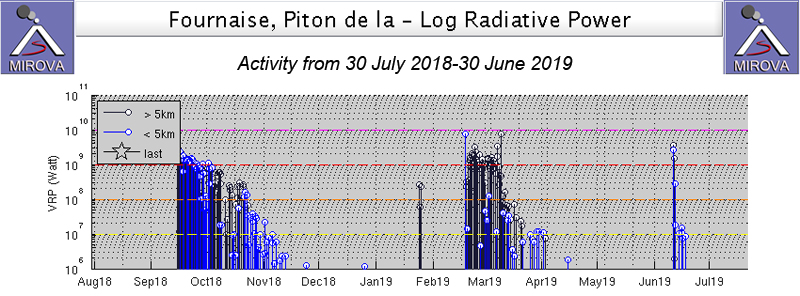
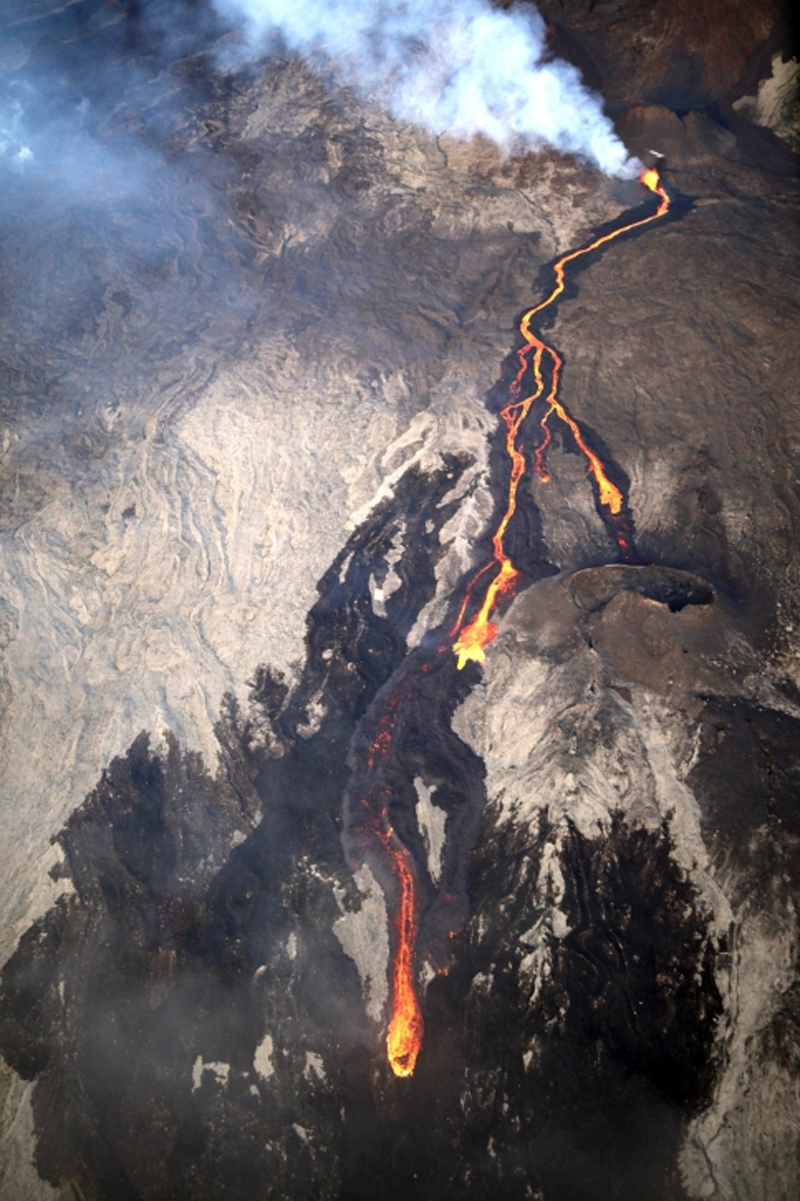
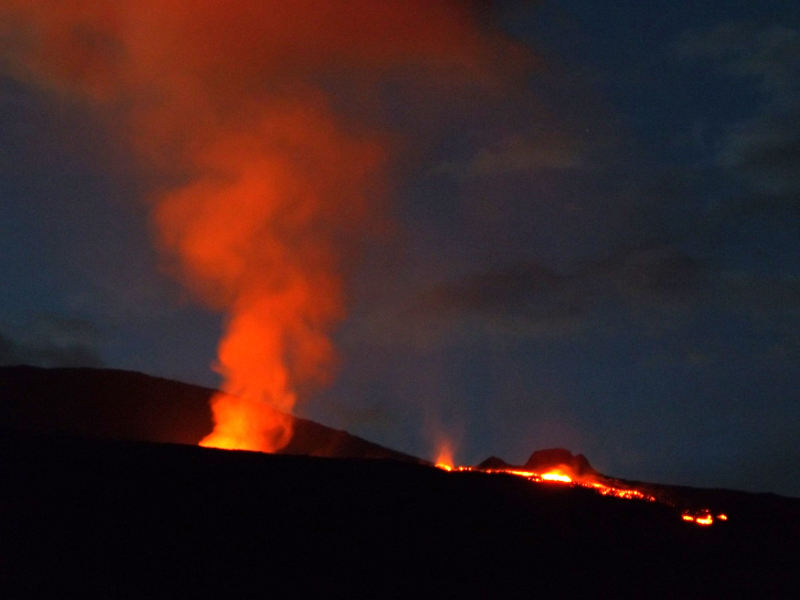
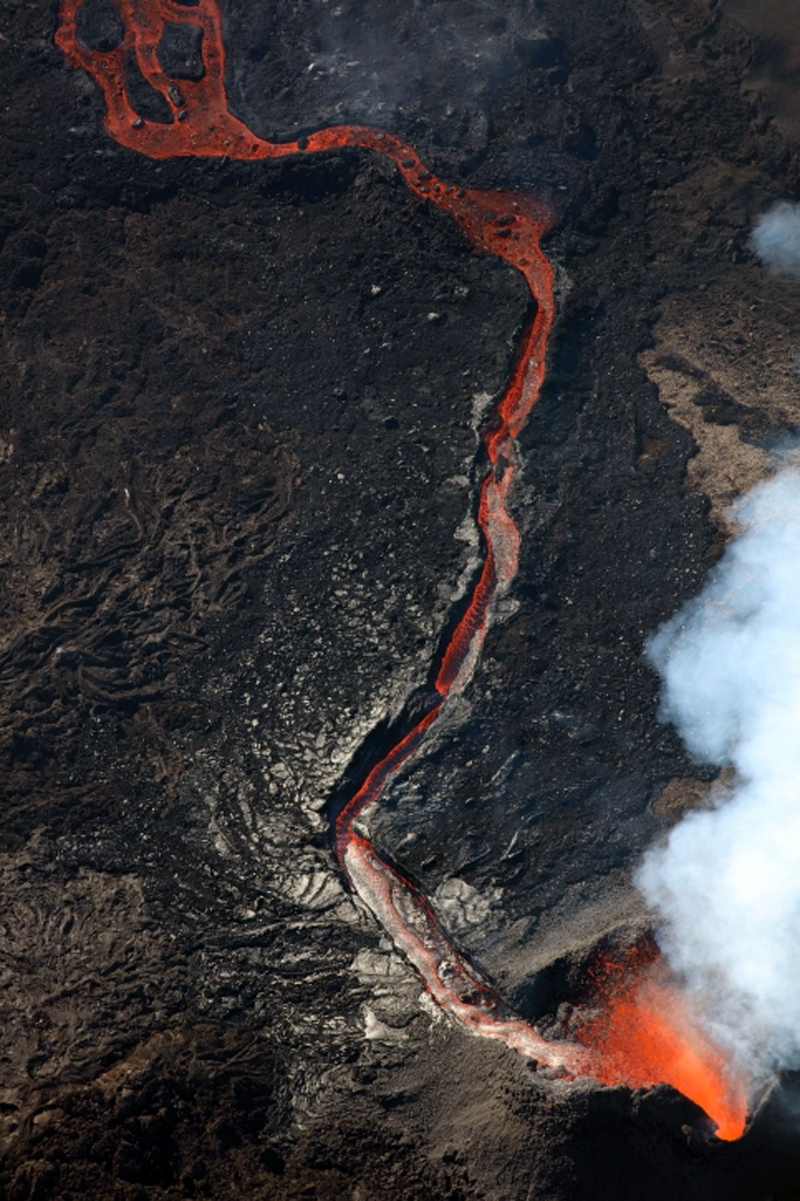
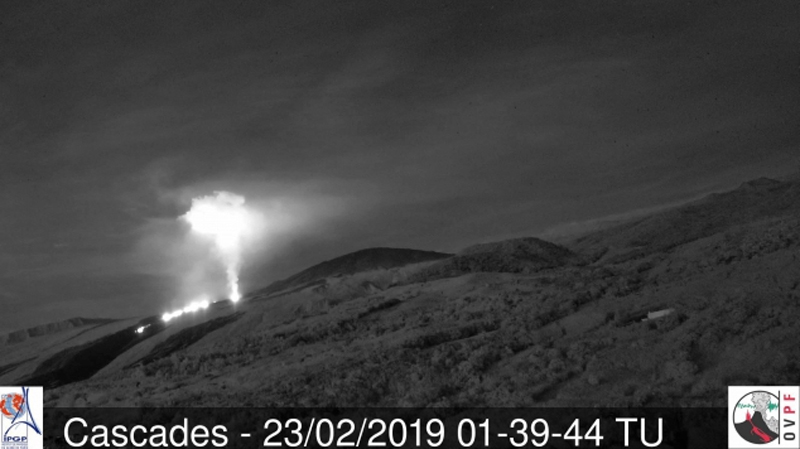
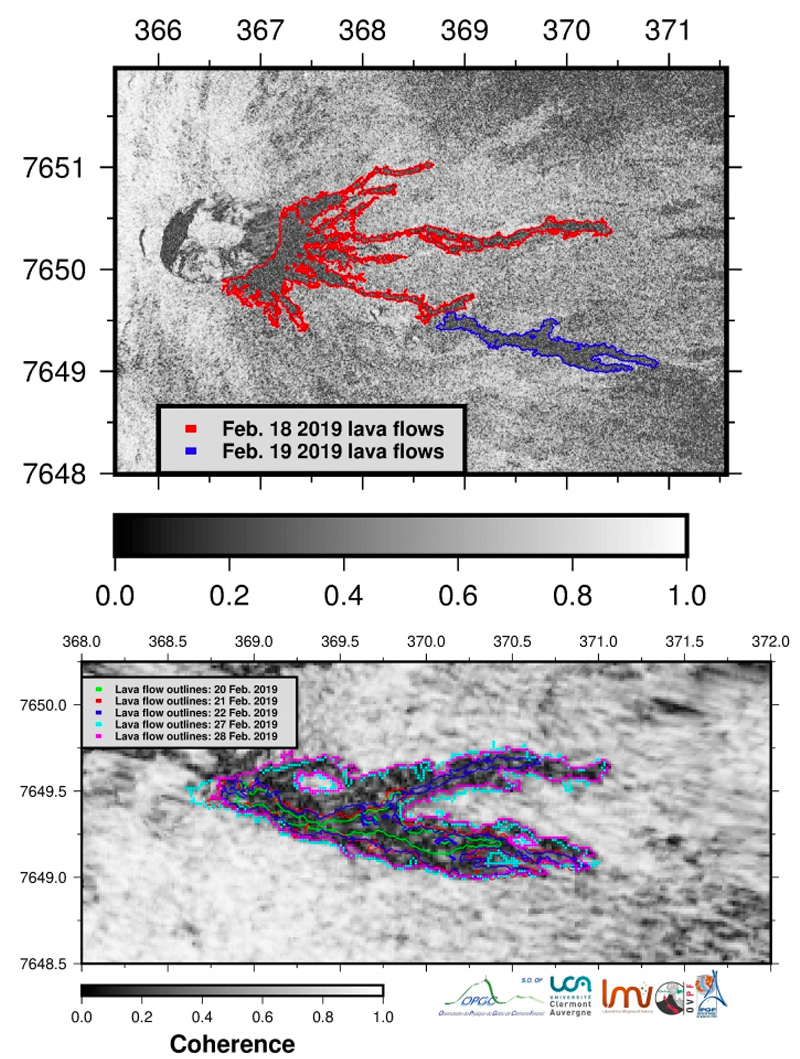
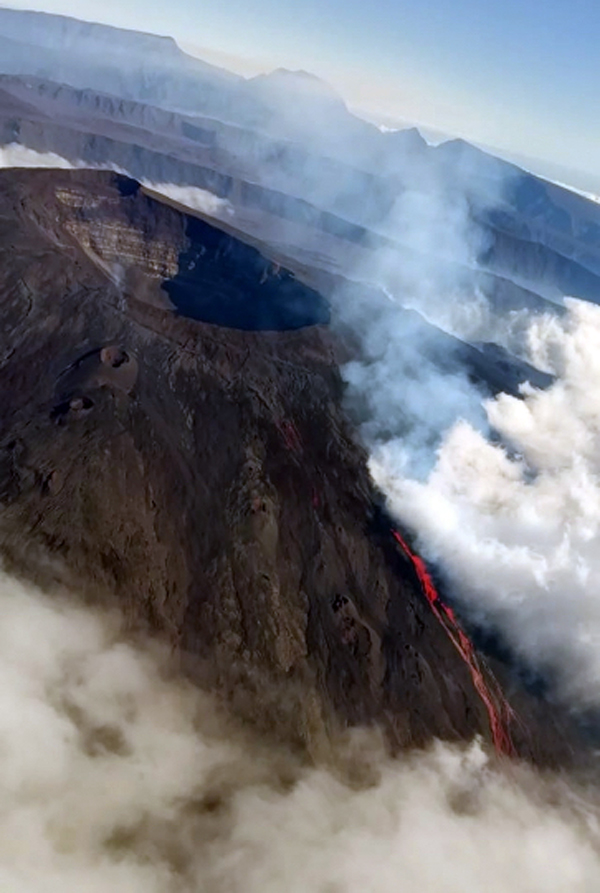
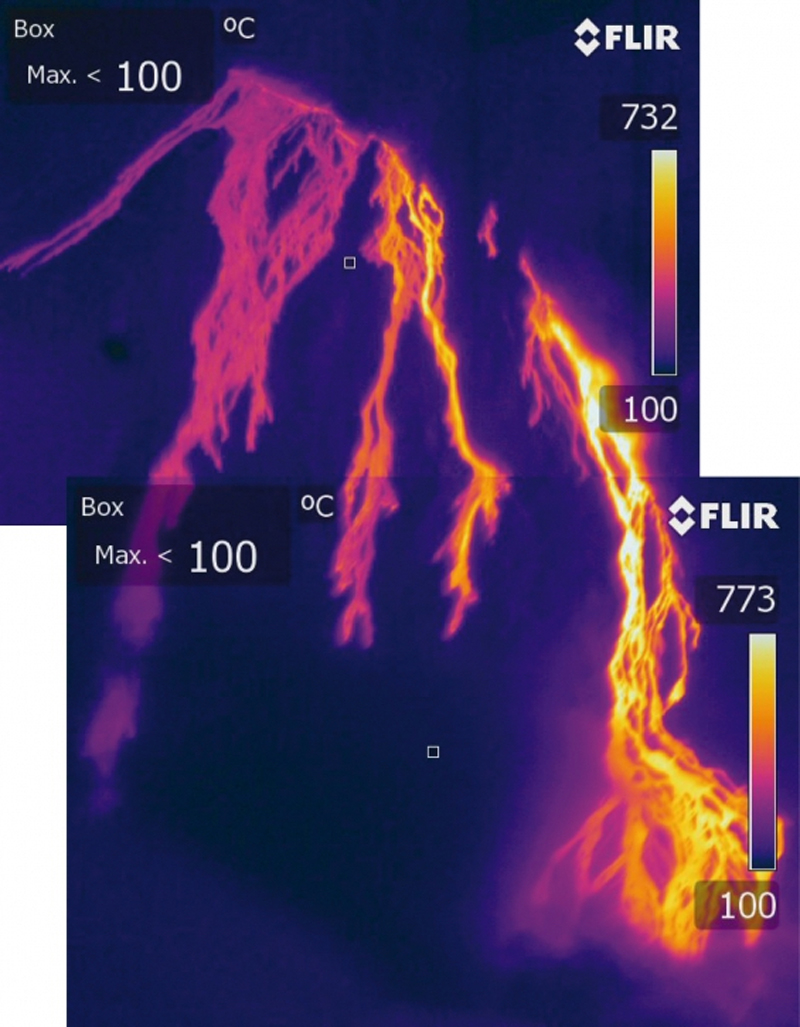
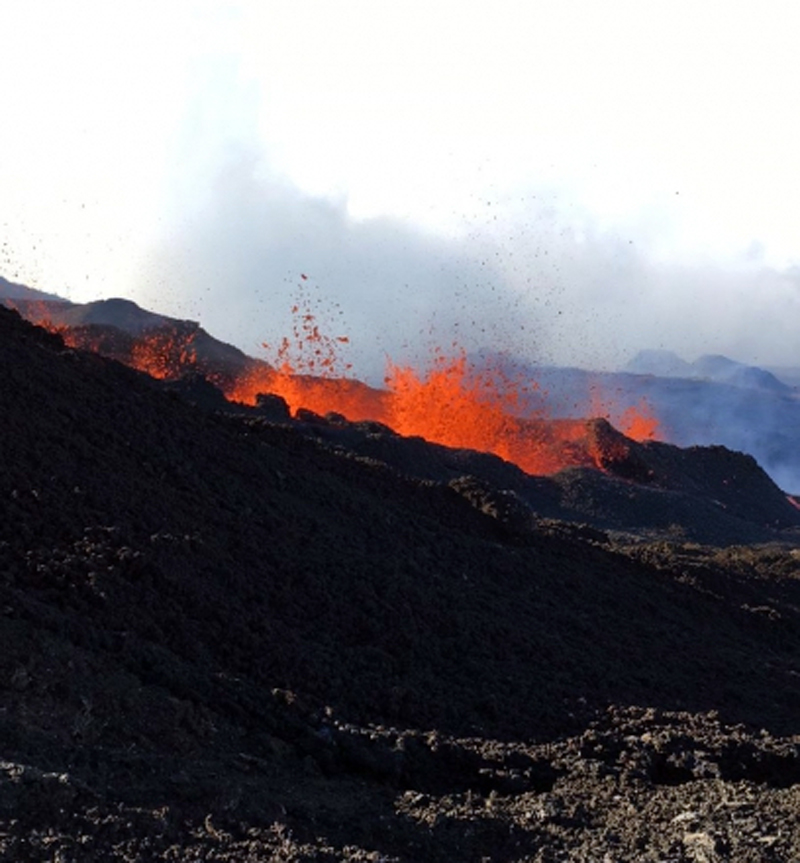
Fournaise, Piton de la (France)
Eruptive episodes in February-March and June 2019; multiple fissures and lava flows
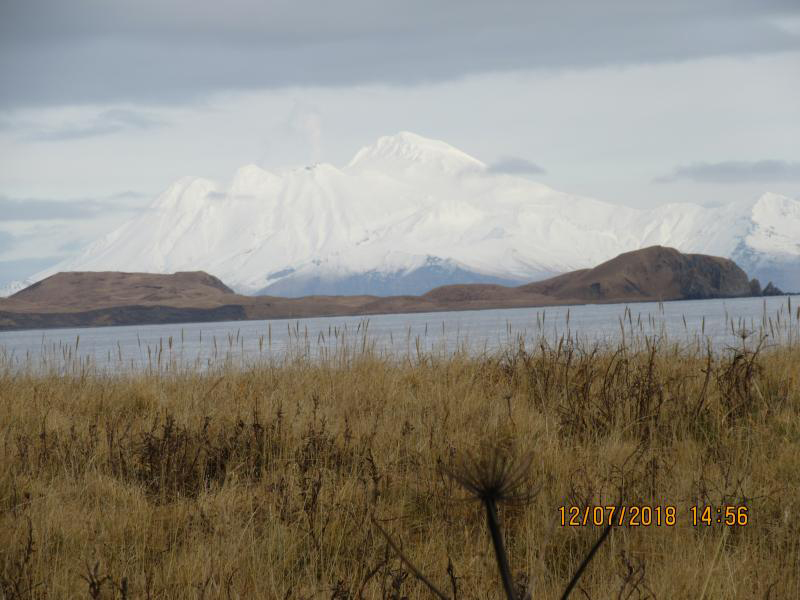
Great Sitkin (United States)
Small steam explosions in early June 2019
Ibu (Indonesia)
Frequent ash plumes and small lava flows active in the crater through June 2019
Klyuchevskoy (Russia)
Weak thermal anomalies and moderate Strombolian-type eruptions in September 2018-June 2019
Sangay (Ecuador)
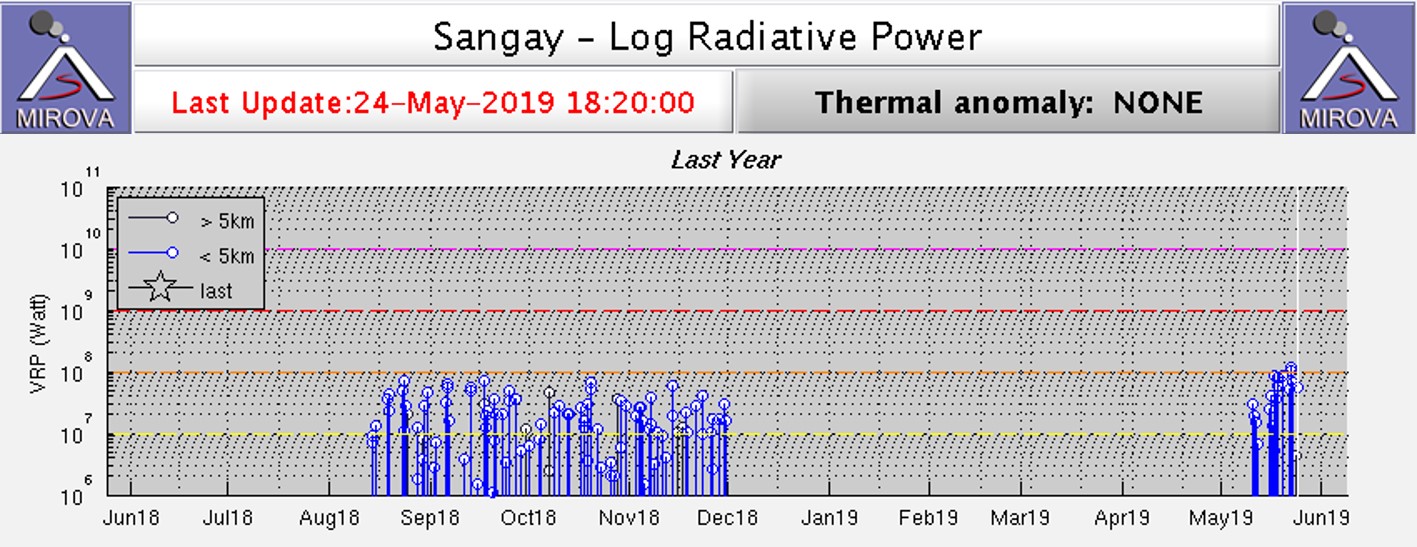
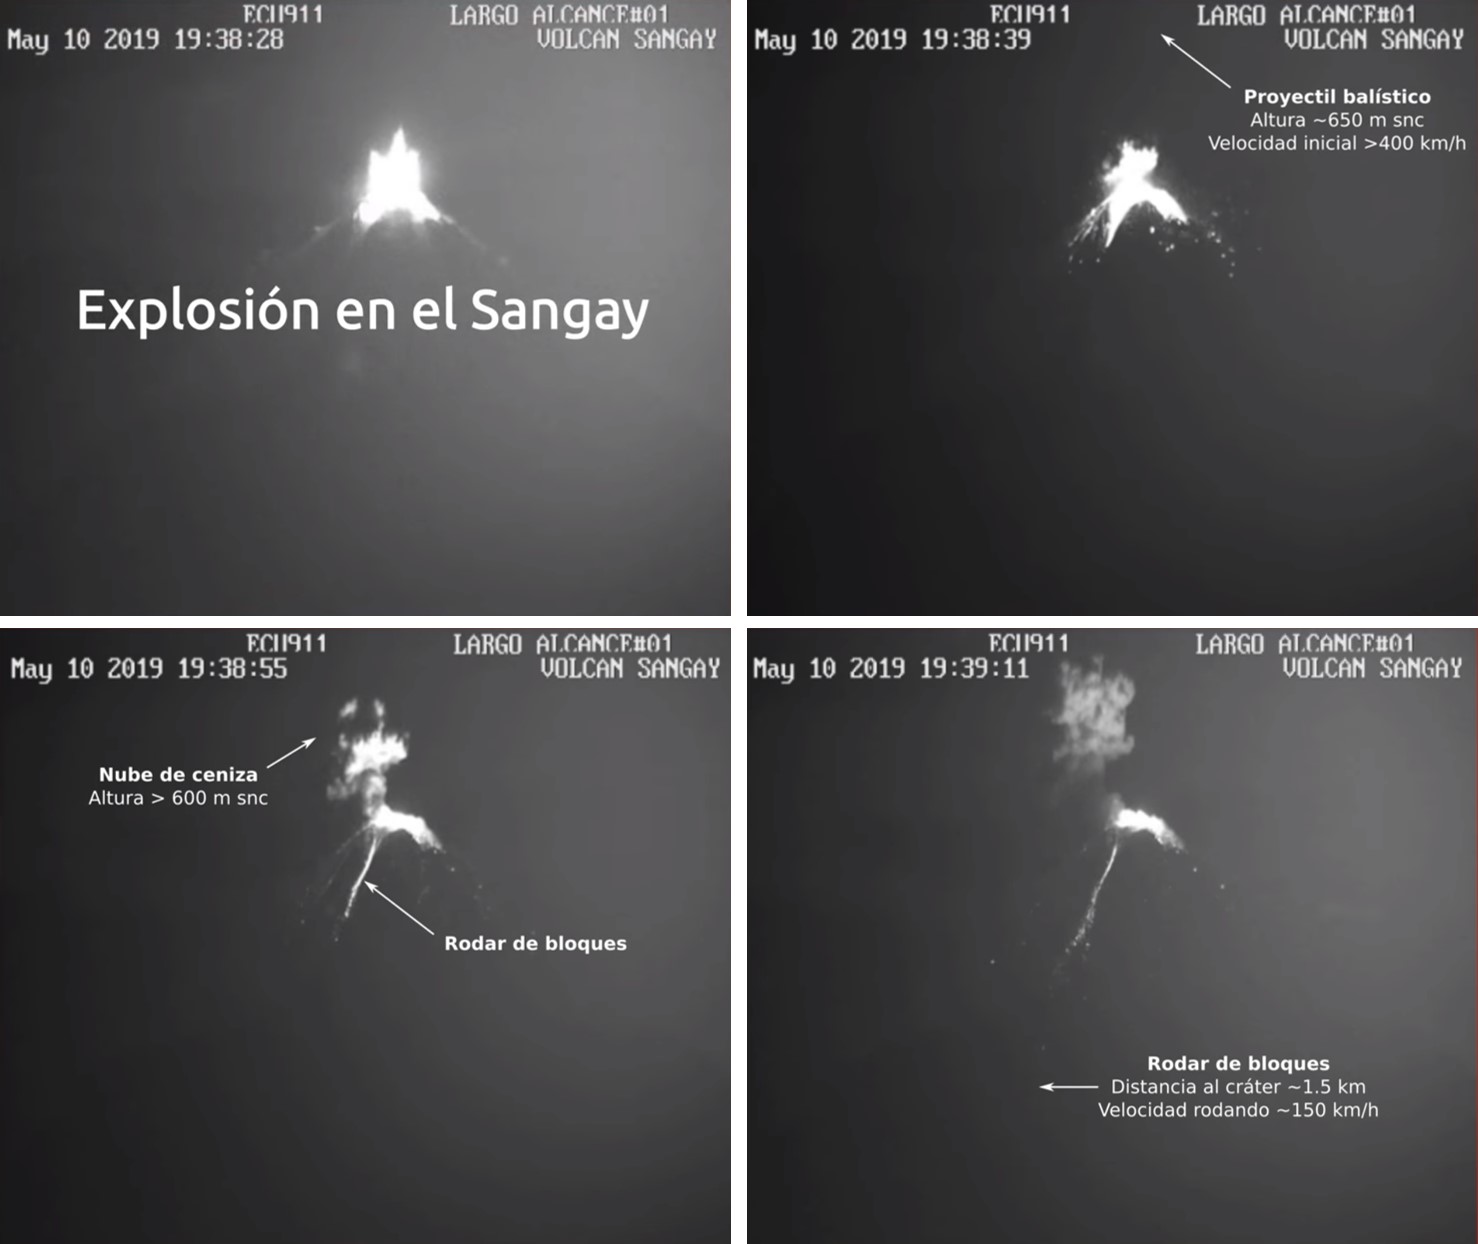
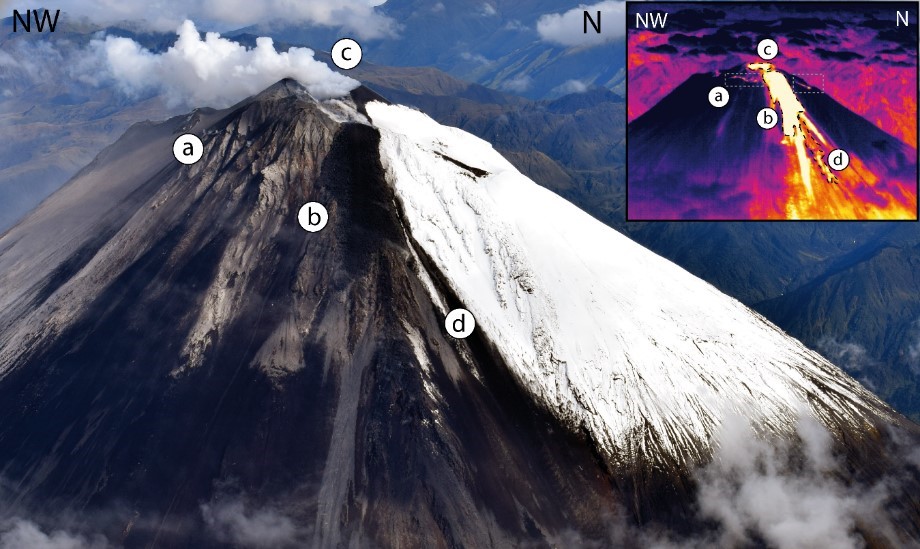
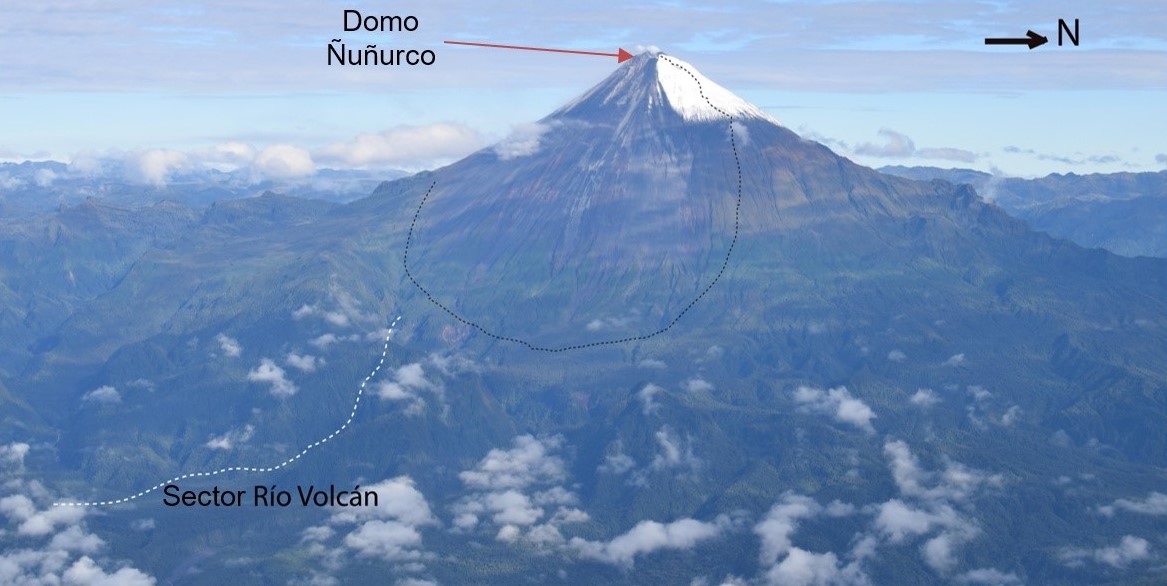
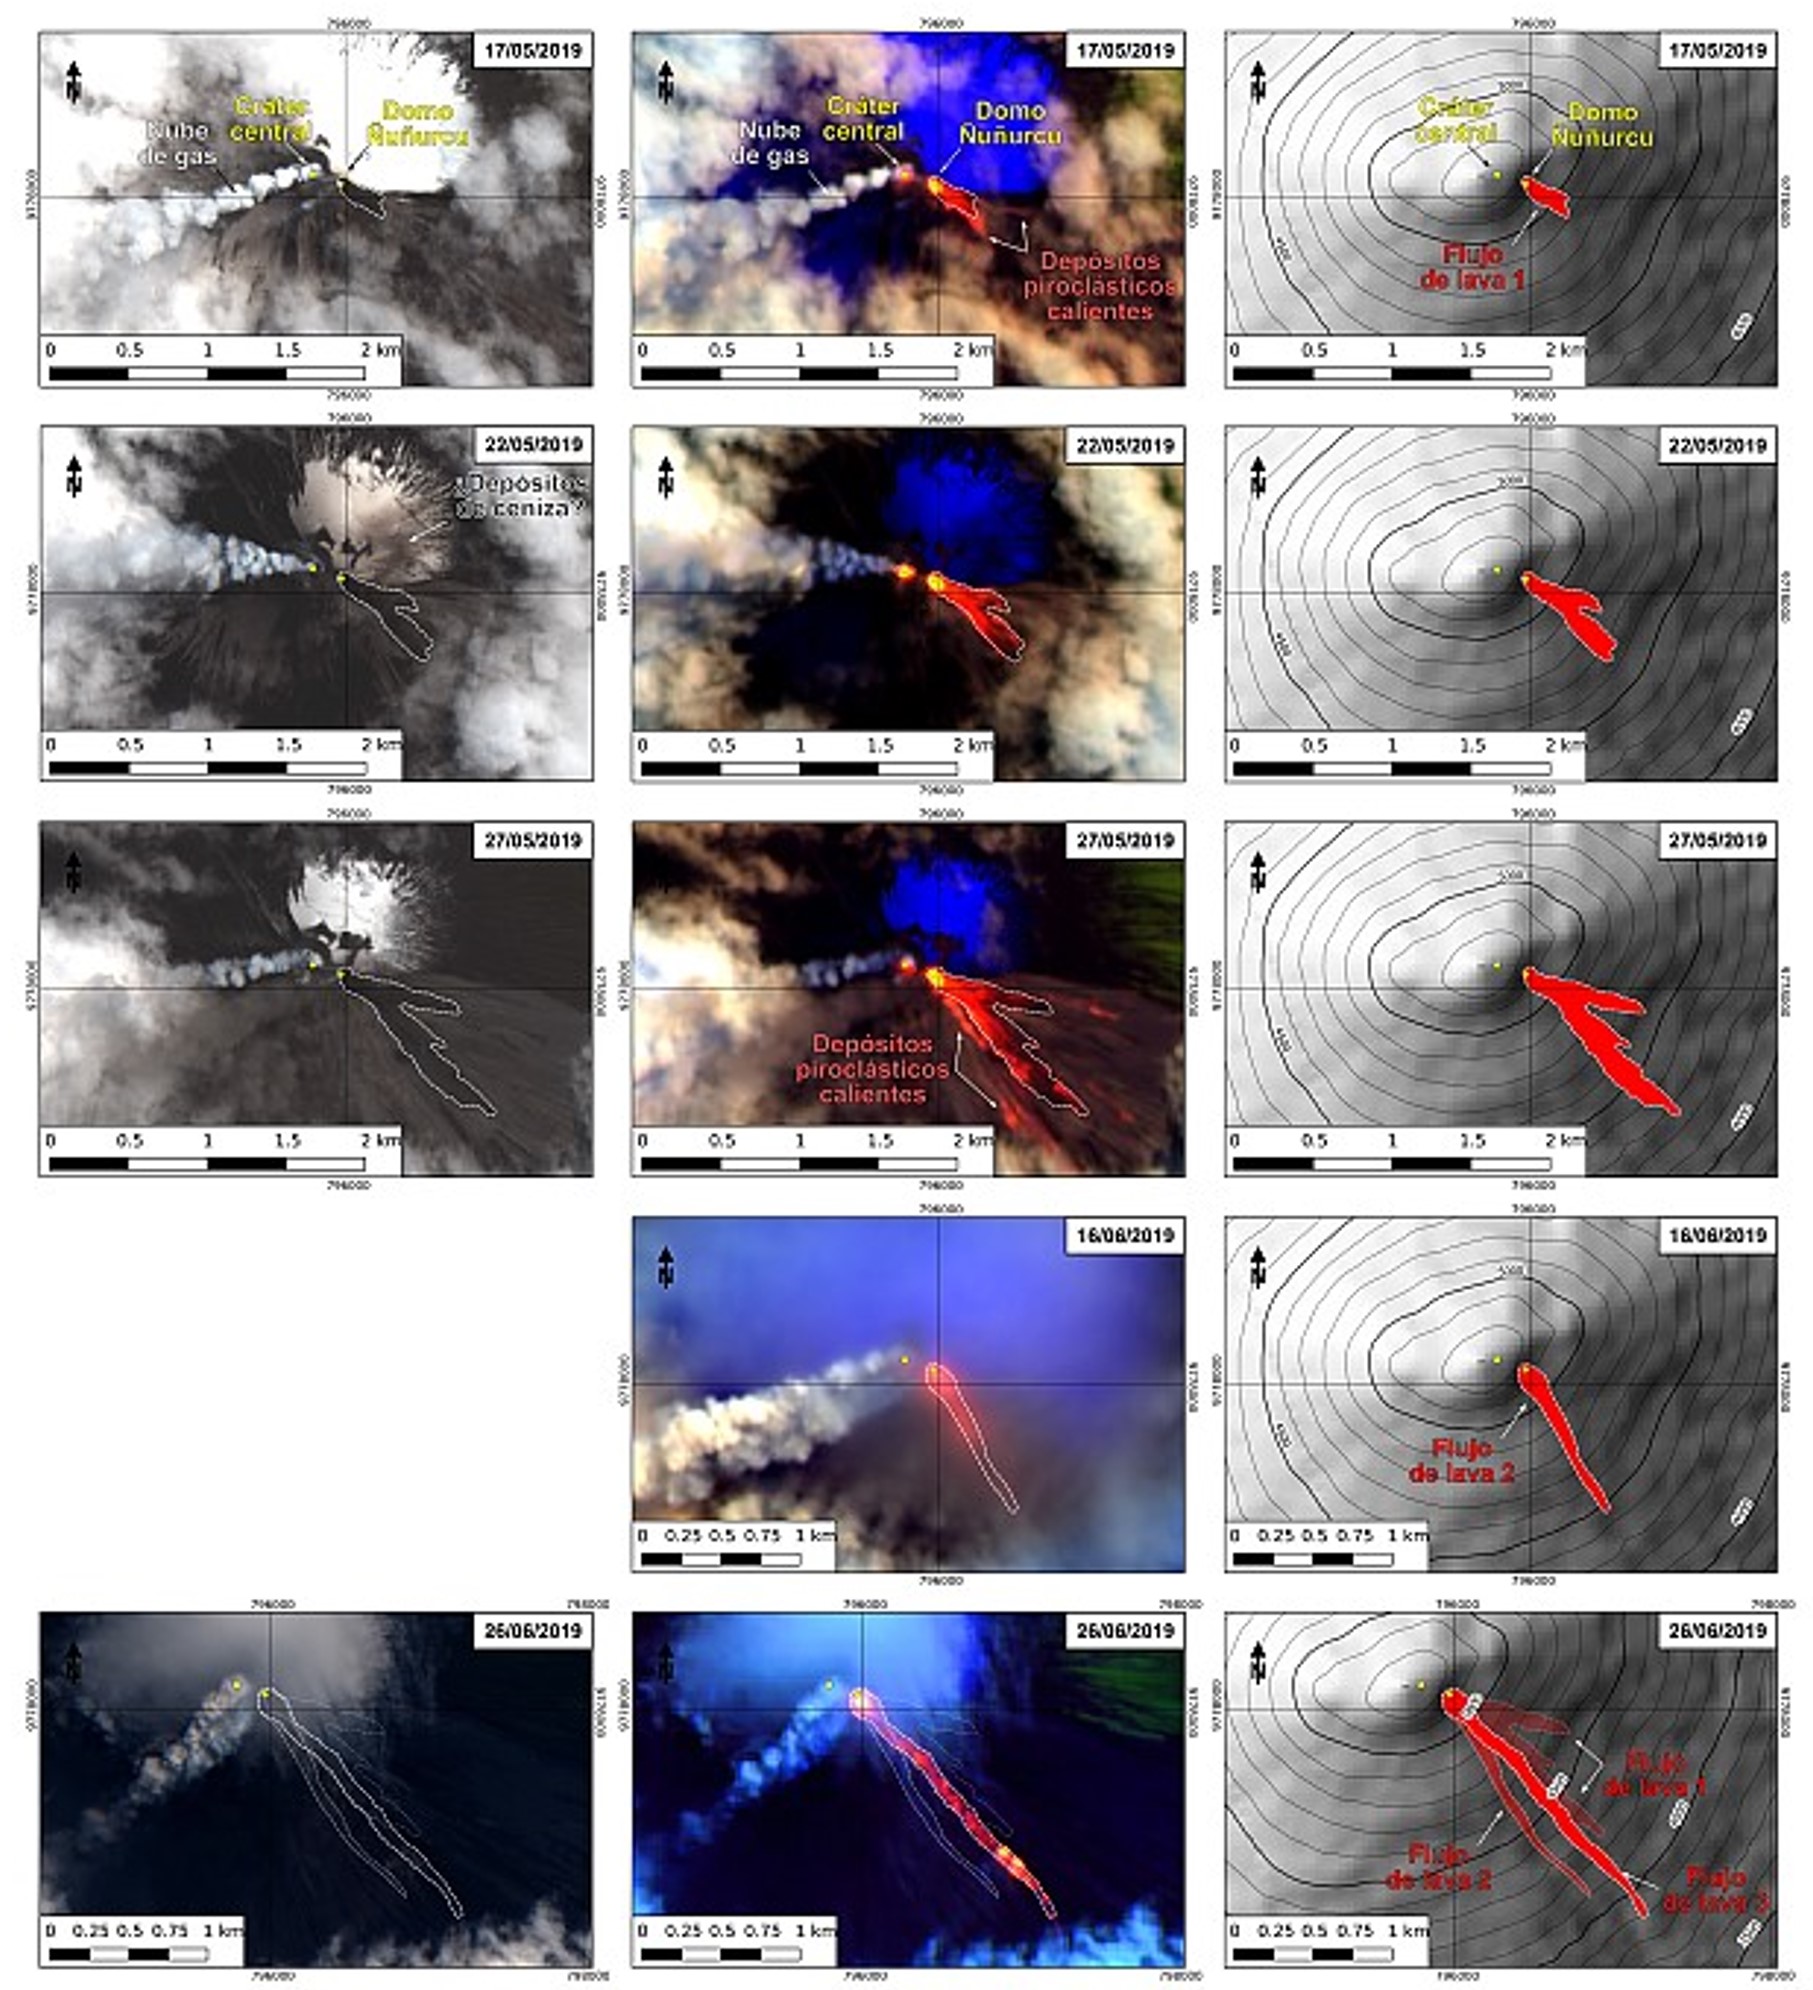
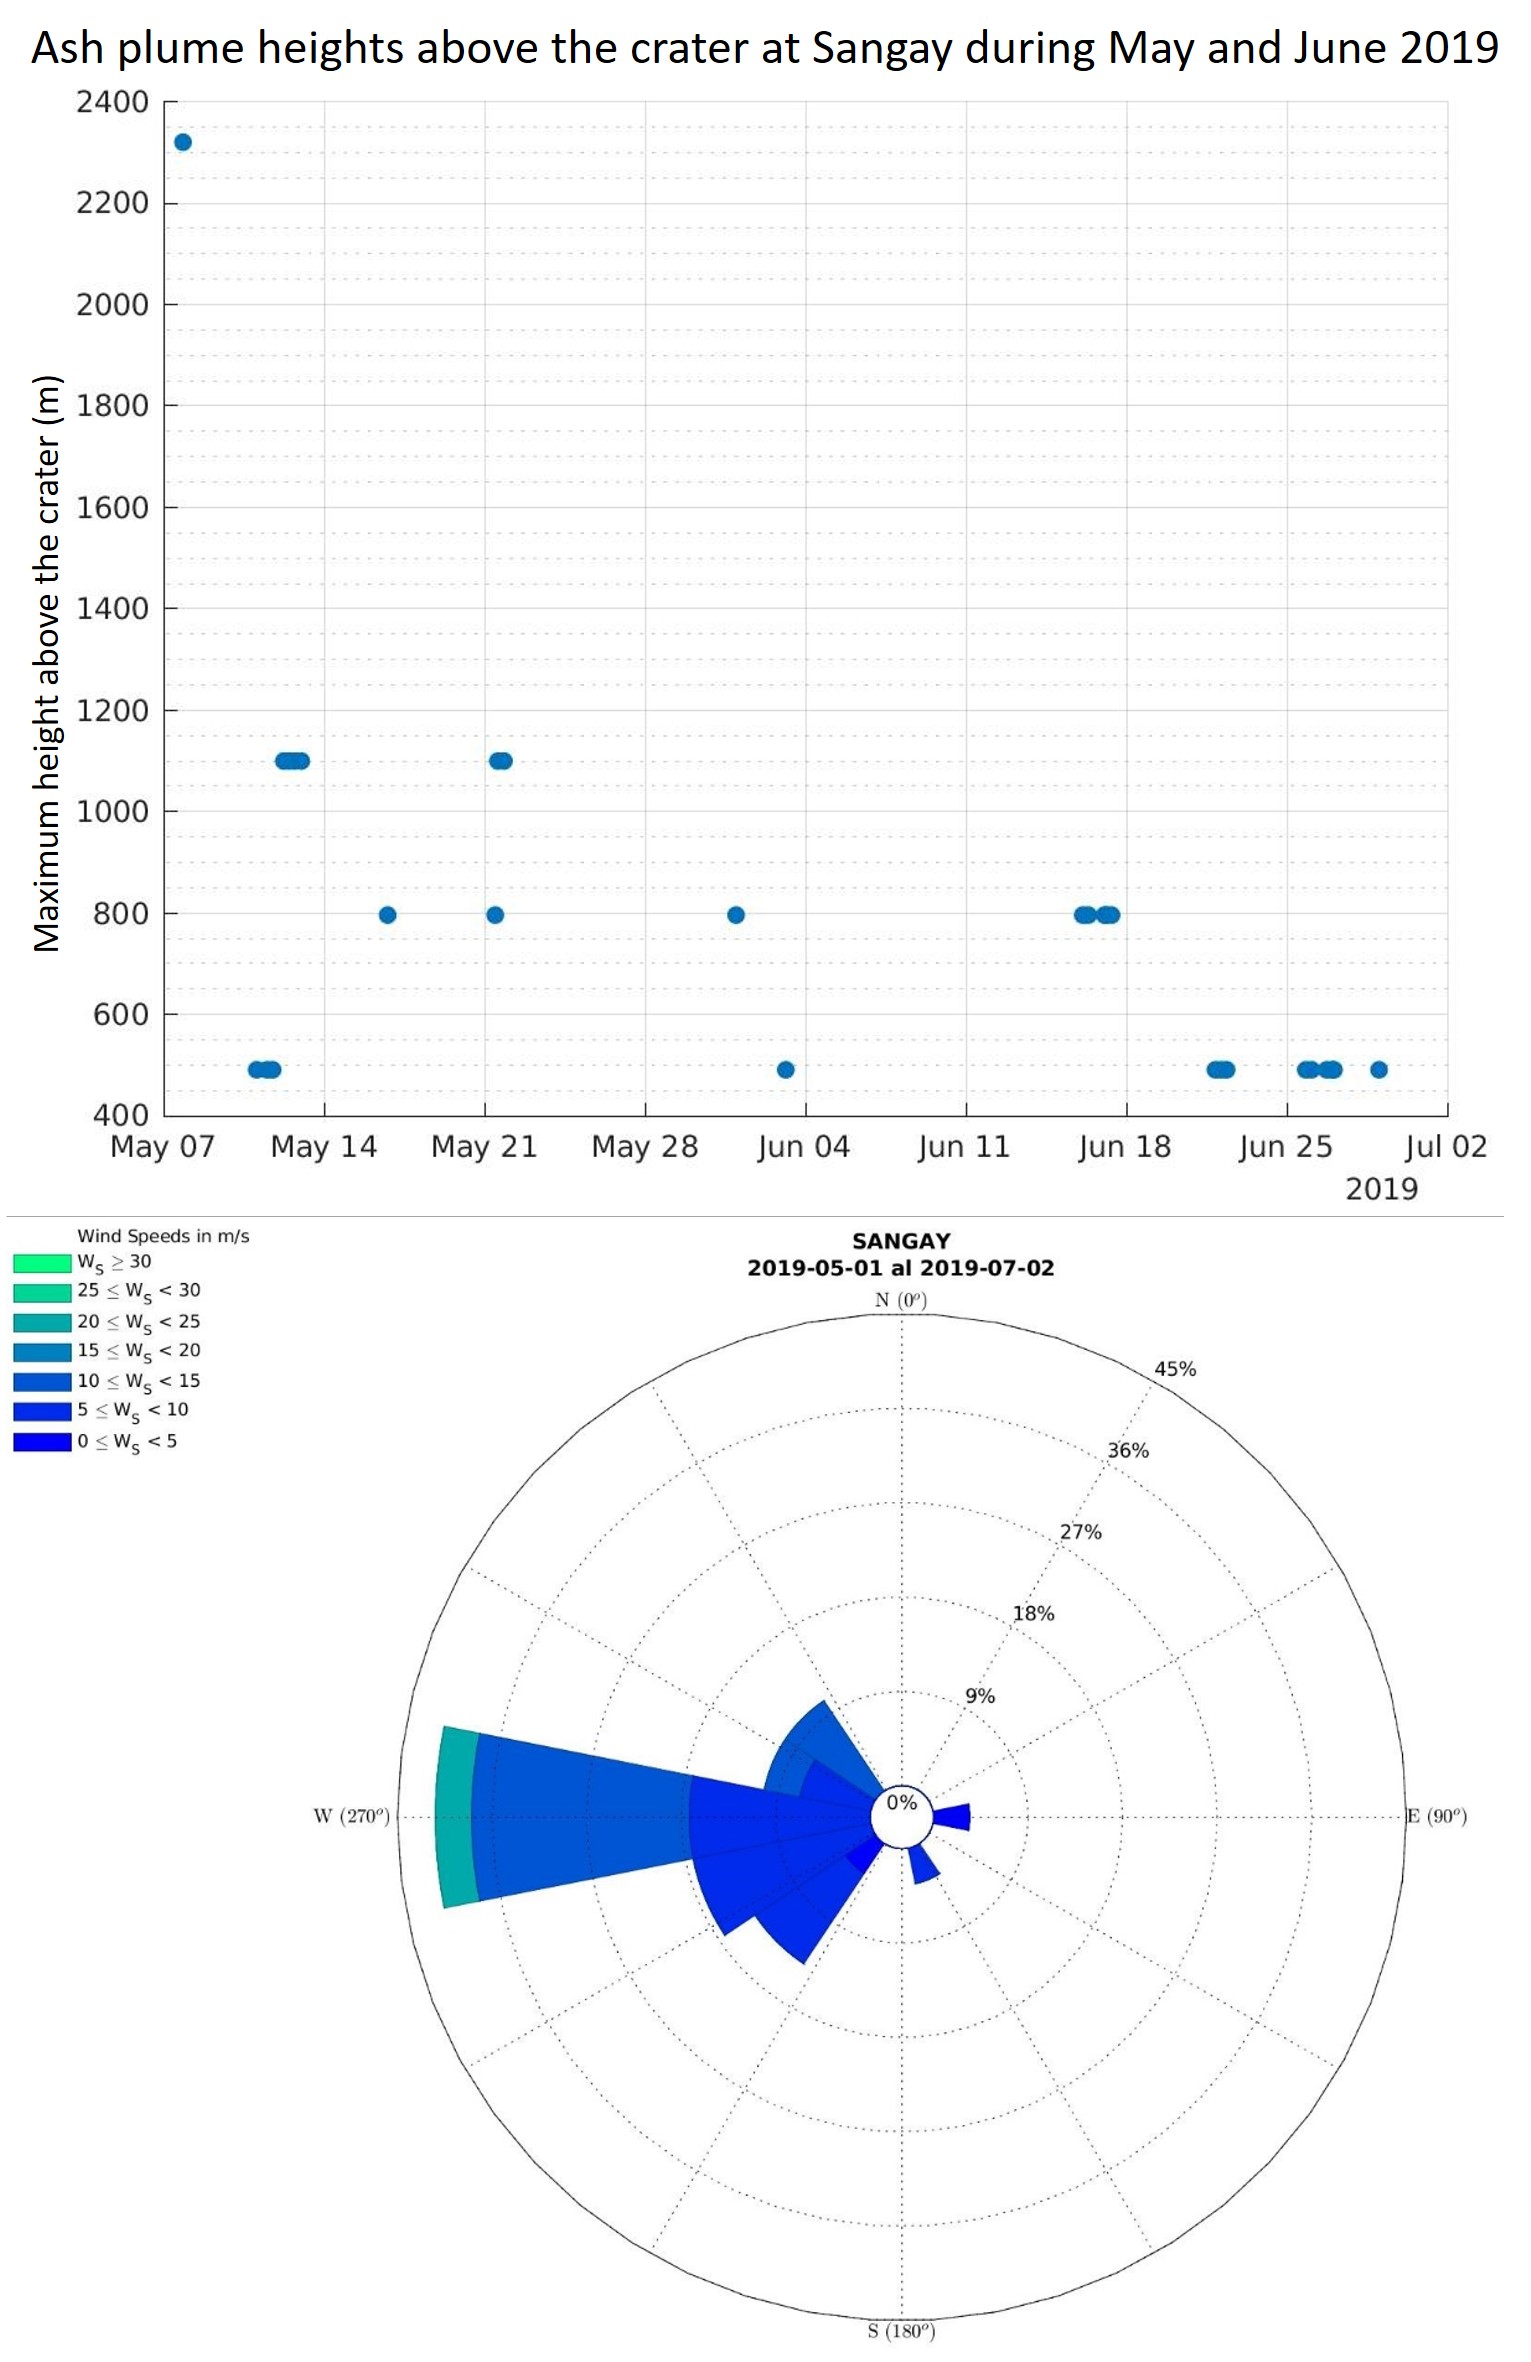
Explosion on 26 March 2019; activity from 10 May through June produced ash plumes, lava flows, and pyroclastic flows
Suwanosejima (Japan)
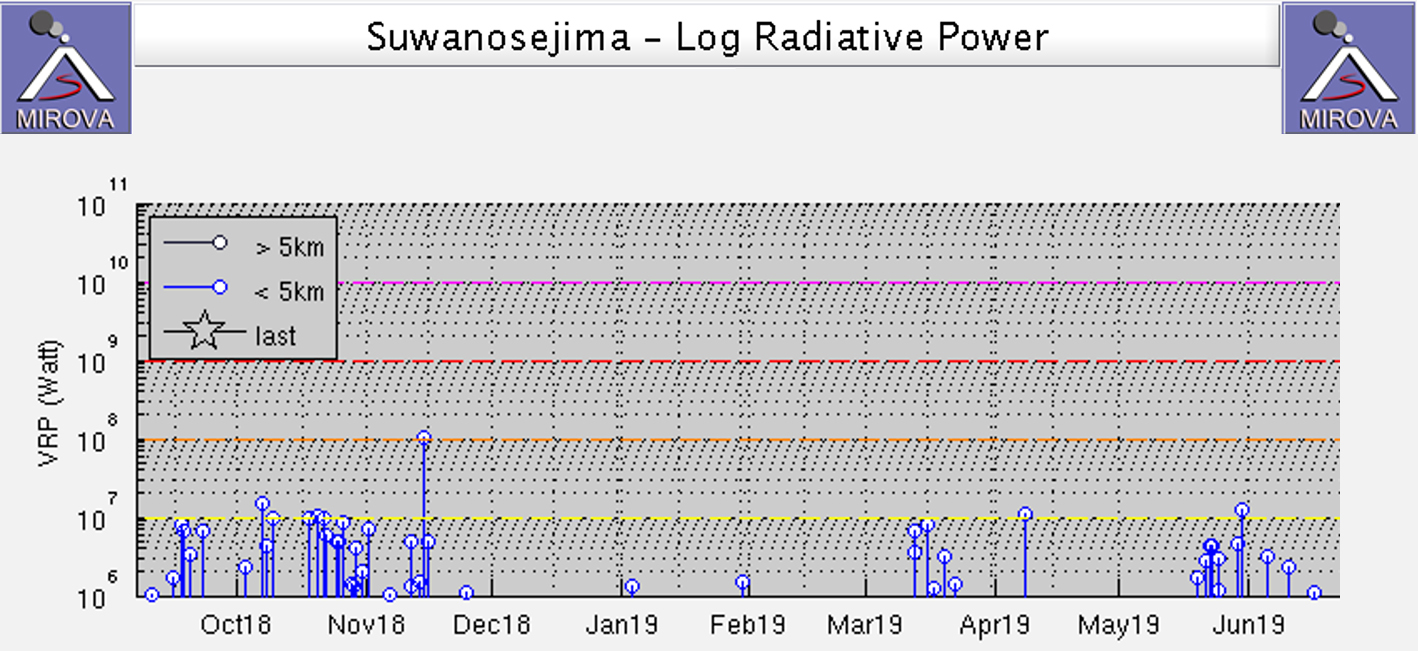
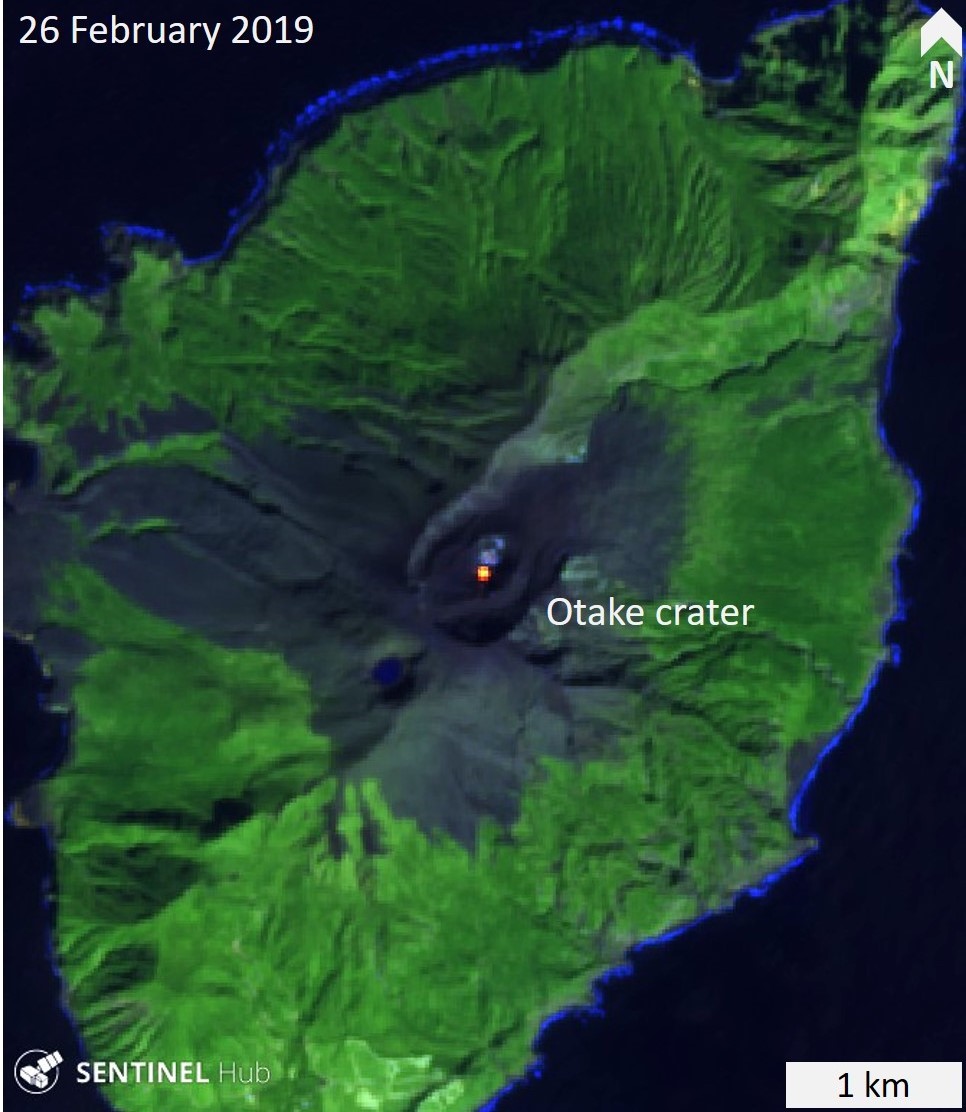
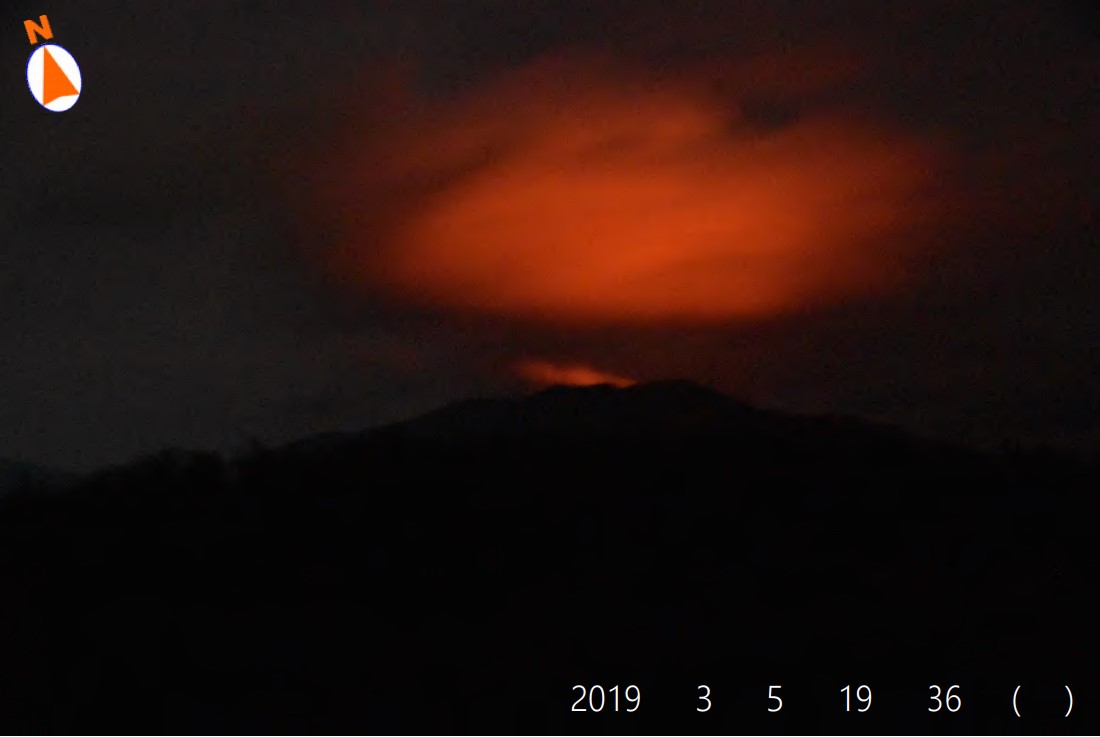
Small ash plumes continued during January through June 2019
Tinakula (Solomon Islands)
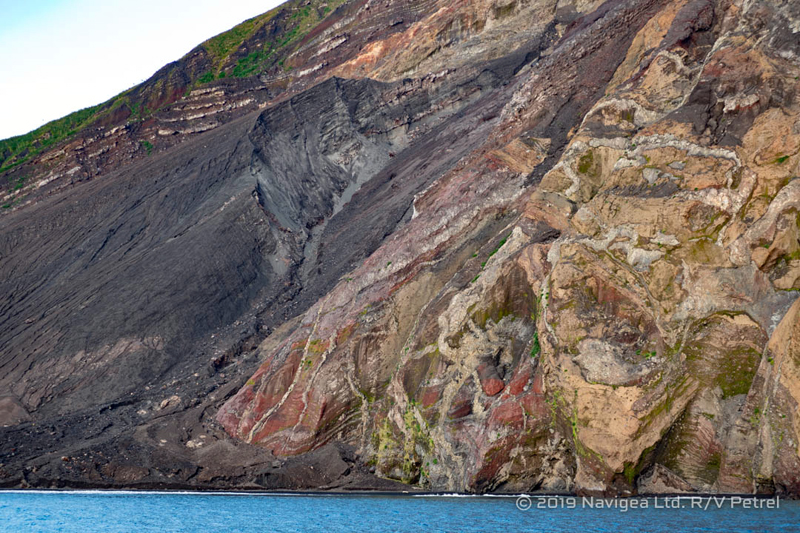
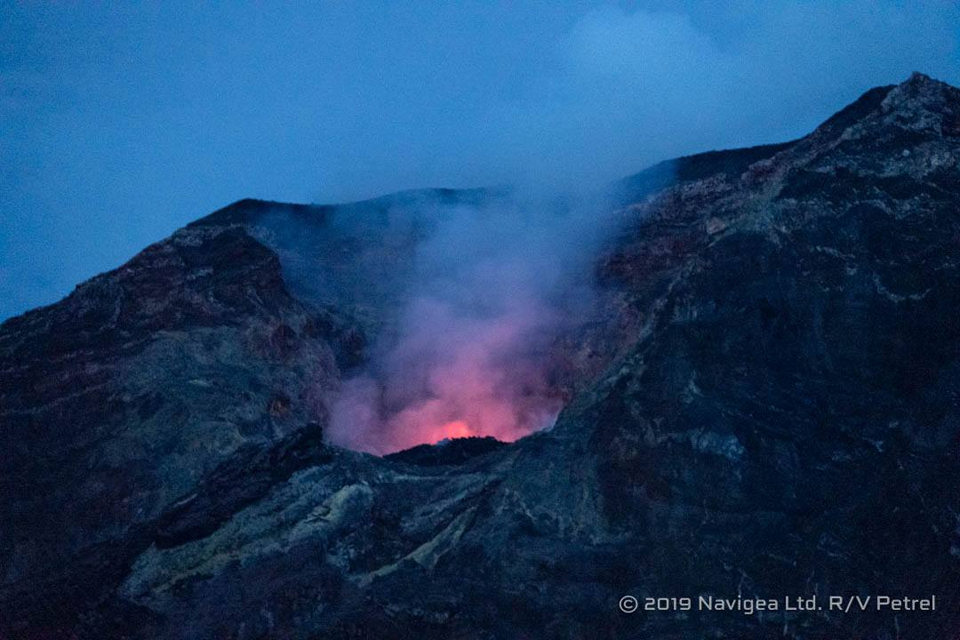
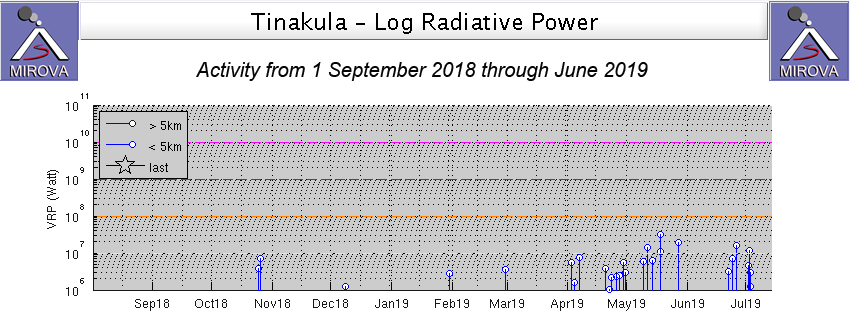
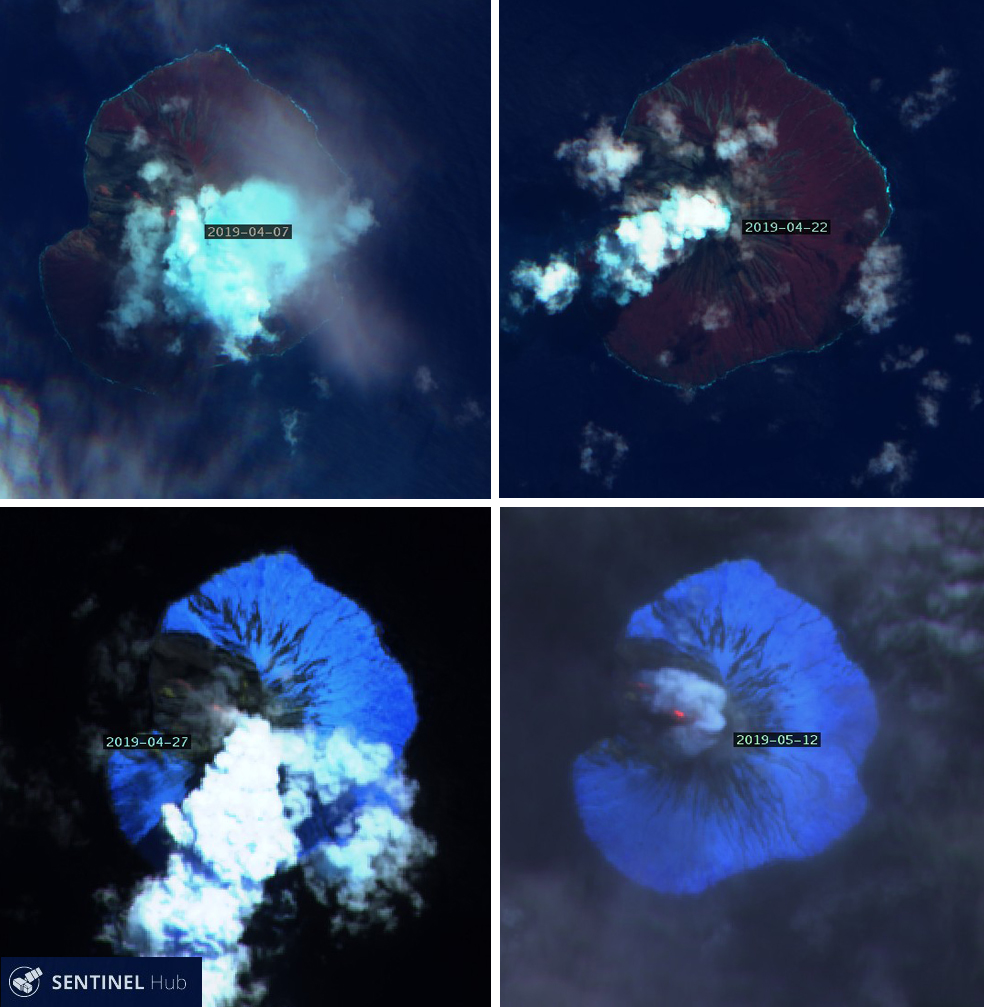
Thermal anomalies in satellite data December 2018-June 2019; ship visit January 2019
Aira
Japan
31.5772°N, 130.6589°E; summit elev. 1117 m
All times are local (unless otherwise noted)
Explosions with ejecta and ash plumes continue weekly during January-June 2019
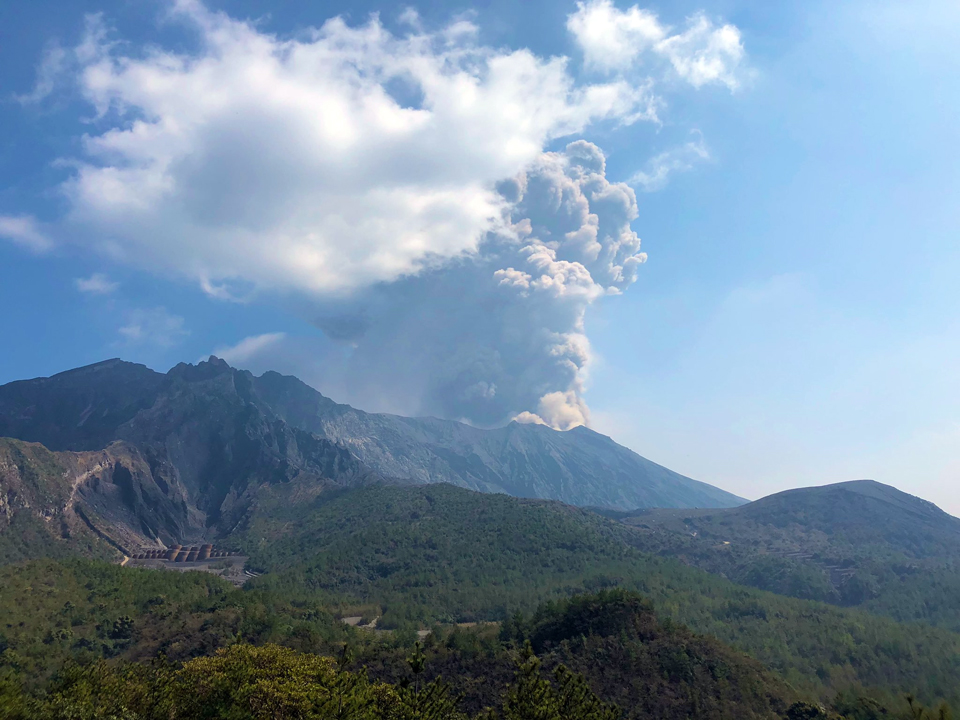
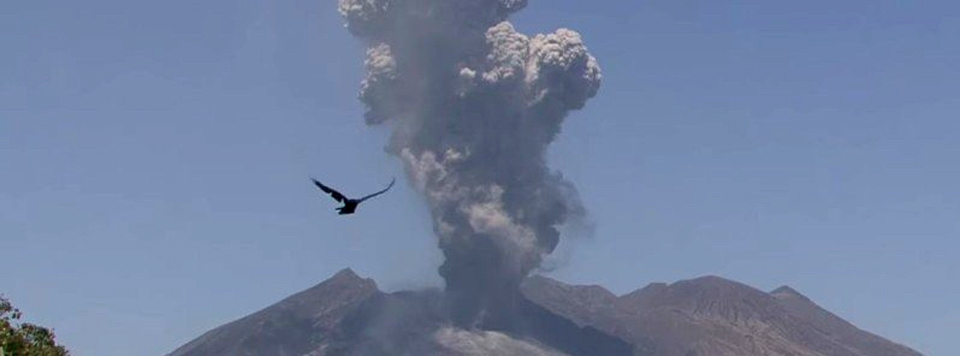
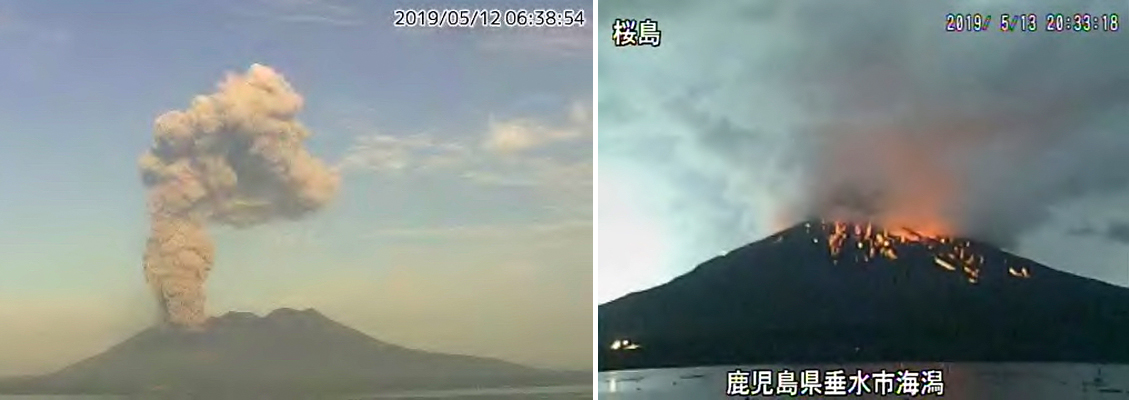
Sakurajima rises from Kagoshima Bay, which fills the Aira Caldera near the southern tip of Japan's Kyushu Island. Frequent explosive and occasional effusive activity has been ongoing for centuries. The Minamidake summit cone has been the location of persistent activity since 1955; the Showa crater on its E flank has also been intermittently active since 2006. Numerous explosions and ash-bearing emissions have been occurring each month at either Minamidake or Showa crater since the latest eruptive episode began in late March 2017. This report covers ongoing activity from January through June 2019; the Japan Meteorological Agency (JMA) provides regular reports on activity, and the Tokyo VAAC (Volcanic Ash Advisory Center) issues tens of reports each month about the frequent ash plumes.
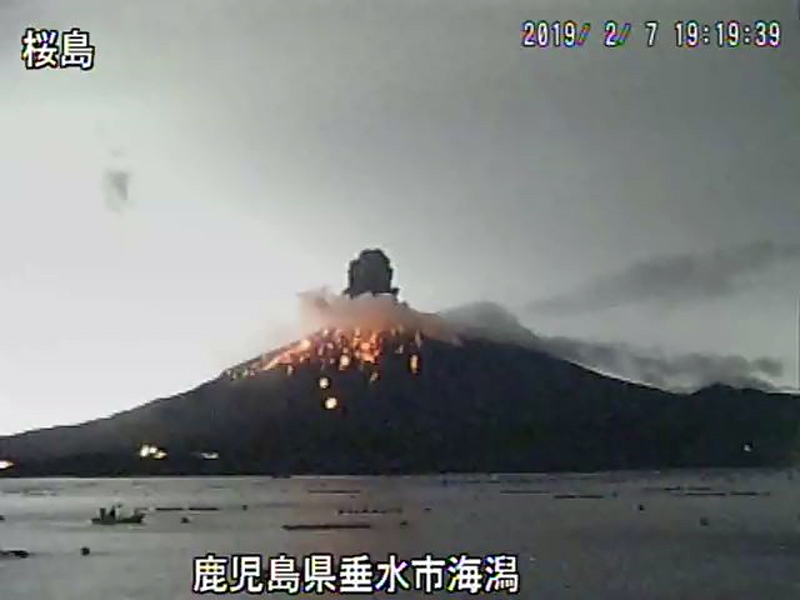
From January to June 2019, ash plumes and explosions were usually reported multiple times each week. The quietest month was June with only five eruptive events; the most active was March with 29 (table 21). Ash plumes rose from a few hundred meters to 3,500 m above the summit during the period. Large blocks of incandescent ejecta traveled as far as 1,700 m from the Minamidake crater during explosions in February and April. All the activity originated in the Minamidake crater; the adjacent Showa crater only had a mild thermal anomaly and fumarole throughout the period. Satellite imagery identified thermal anomalies inside the Minamidake crater several times each month.
Table 21. Monthly summary of eruptive events recorded at Sakurajima's Minamidake crater in Aira caldera, January-June 2019. The number of events that were explosive in nature are in parentheses. No events were recorded at the Showa crater during this time. Data courtesy of JMA (January to June 2019 monthly reports).
| Month |
Ash emissions (explosive) |
Max. plume height above crater |
Max. ejecta distance from crater |
| Jan 2019 |
8 (6) |
2.1 km |
1.1 km |
| Feb 2019 |
15 (11) |
2.3 km |
1.7 km |
| Mar 2019 |
29 (12) |
3.5 km |
1.3 km |
| Apr 2019 |
10 (5) |
2.2 km |
1.7 km |
| May 2019 |
15 (9) |
2.9 km |
1.3 km |
| Jun 2019 |
5 (2) |
2.2 km |
1.3 km |
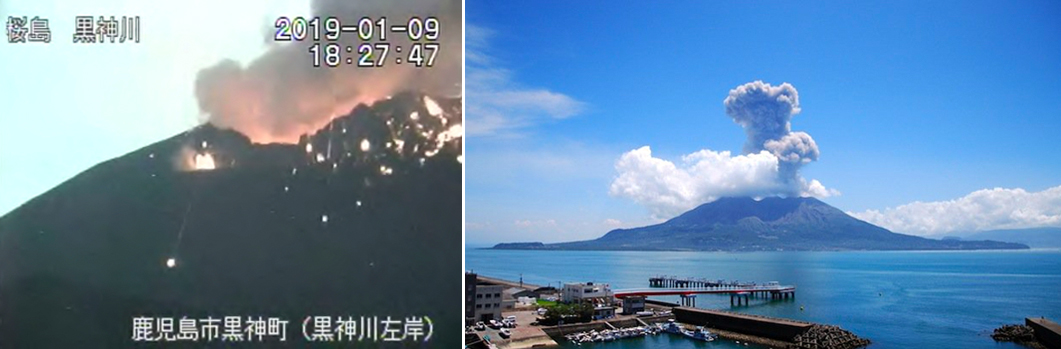
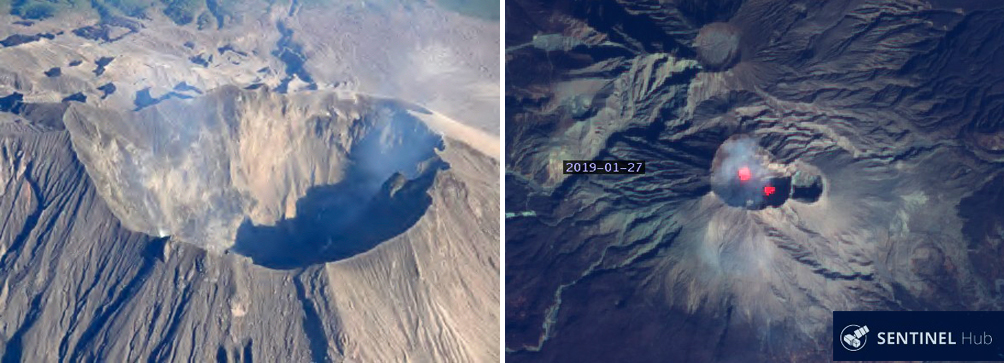
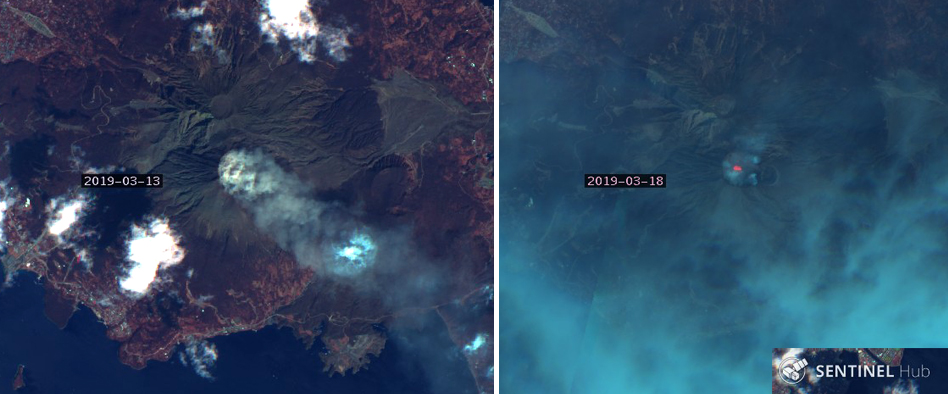
There were eight eruptive events reported by JMA during January 2019 at the Minamidake summit crater of Sakurajima. They occurred on 3, 6, 7, 9, 17, and 19 January (figure 76). Ash plume heights ranged from 600 to 2,100 m above the summit. The largest explosion, on 9 January, generated an ash plume that rose 2,100 m above the summit crater and drifted E. In addition, incandescent ejecta was sent 800-1,100 m from the summit. Incandescence was visible at the summit on most clear nights. During an overflight on 18 January no significant changes were noted at the crater (figure 77). Infrared thermal imaging done on 29 January indicated a weak thermal anomaly in the vicinity of the Showa crater on the SE side of Minamidake crater. The Kagoshima Regional Meteorological Observatory (KRMO) (11 km WSW) recorded ashfall there during four days of the month. Satellite imagery indicated thermal anomalies inside Minamidake on 7 and 27 January (figure 77).
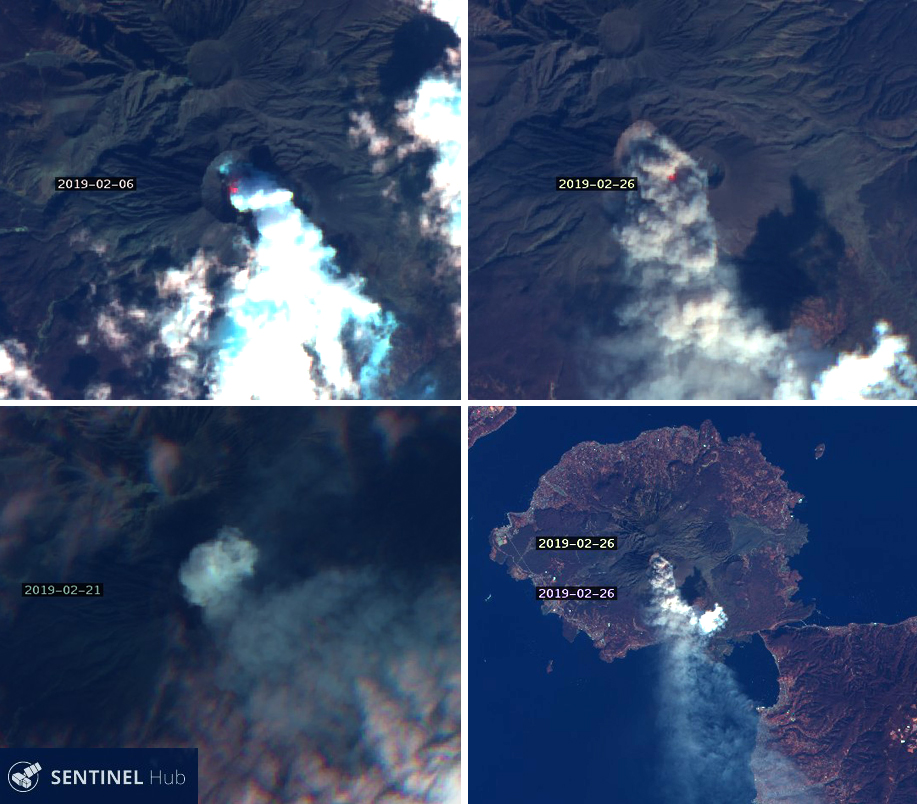
Activity increased during February 2019, with 15 eruptive events reported on days 1, 3, 7, 8, 10, 13, 14, 17, 22, 24, and 27. Ash plume heights ranged from 600-2,300 m above the summit, and ejecta was reported 300 to 1,700 m from the crater in various events (figure 78). KRMO reported two days of ashfall during February. Satellite imagery identified thermal anomalies at the crater on 6 and 26 February, and ash plumes on 21 and 26 February (figure 79).
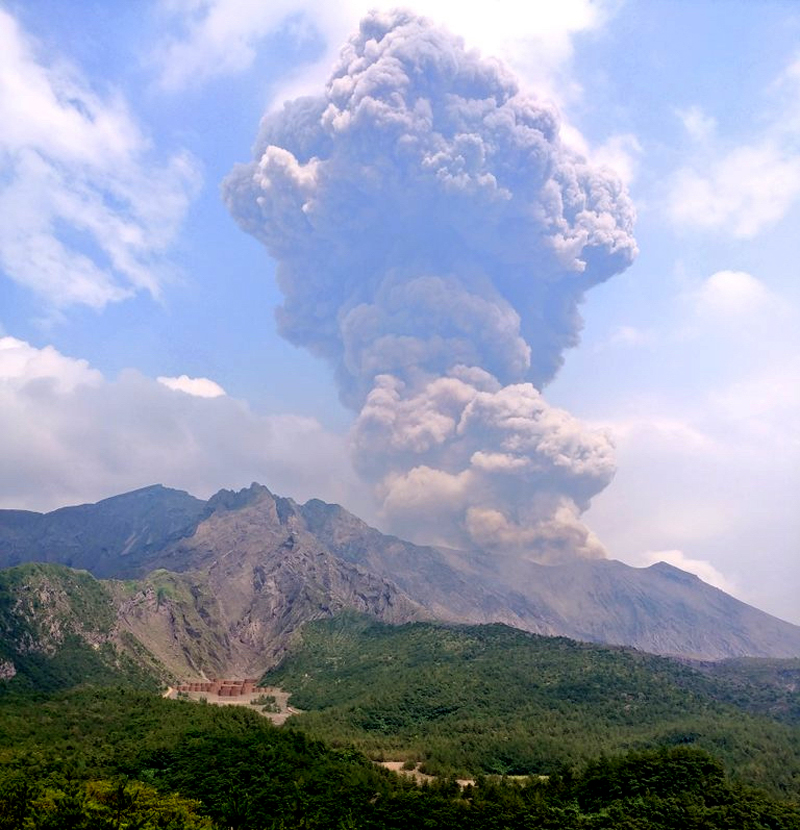
The number of eruptive events continued to increase during March 2019; there were 29 events reported on numerous days (figures 80 and 81). An explosion on 14 March produced an ash plume that rose 3,500 m above the summit and drifted E. It also produced ejecta that landed 800-1,100 m from the crater. During an overflight on 26 March a fumarole was the only activity in Showa crater. KRMO reported 14 days of ashfall during the month. Satellite imagery identified an ash plume on 13 March and a thermal anomaly on 18 March (figure 82).
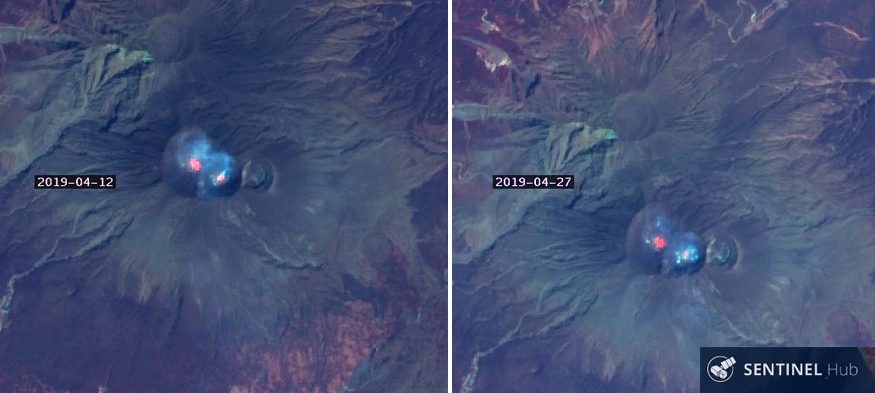
A decline in activity to only ten eruptive events on days 7, 13, 17, 22, and 25 was reported by JMA for April 2019. An explosion on 7 April sent ejecta up to 1,700 m from the crater. Another explosion on 13 April produced an ash plume that rose 2,200 m above the summit. Most of the eruptive events at Sakurajima last for less than 30 minutes; on 22 April two events lasted for almost an hour each producing ash plumes that rose 1,400 m above the summit. Ashfall at KRMO was reported during seven days in April. Two distinct thermal anomalies were visible inside the Minamidake crater on both 12 and 27 April (figure 83).
There were 15 eruptive events during May 2019. An event that lasted for two hours on 12 May produced an ash plume that rose 2,900 m from the summit and drifted NE (figure 84). The Meteorological Observatory reported 14 days with ashfall during the month. Two thermal anomalies were present in satellite imagery in the Minamidake crater on both 17 and 22 May.
During June 2019 five eruptive events were reported, on 11, 13, and 24 June; the event on 11 June lasted for almost two hours, sent ash 2,200 m above the summit, and produced ejecta that landed up to 1,100 m from the crater (figure 85). Five days of ashfall were reported by KRMO.
Geologic Background. The Aira caldera in the northern half of Kagoshima Bay contains the post-caldera Sakurajima volcano, one of Japan's most active. Eruption of the voluminous Ito pyroclastic flow accompanied formation of the 17 x 23 km caldera about 22,000 years ago. The smaller Wakamiko caldera was formed during the early Holocene in the NE corner of the caldera, along with several post-caldera cones. The construction of Sakurajima began about 13,000 years ago on the southern rim and built an island that was joined to the Osumi Peninsula during the major explosive and effusive eruption of 1914. Activity at the Kitadake summit cone ended about 4,850 years ago, after which eruptions took place at Minamidake. Frequent eruptions since the 8th century have deposited ash on the city of Kagoshima, located across Kagoshima Bay only 8 km from the summit. The largest recorded eruption took place during 1471-76.
Information Contacts: Japan Meteorological Agency (JMA), Otemachi, 1-3-4, Chiyoda-ku Tokyo 100-8122, Japan (URL: http://www.jma.go.jp/jma/indexe.html); Tokyo Volcanic Ash Advisory Center (VAAC), 1-3-4 Otemachi, Chiyoda-ku, Tokyo, Japan (URL: http://ds.data.jma.go.jp/svd/vaac/data/); Sentinel Hub Playground (URL: https://www.sentinel-hub.com/explore/sentinel-playground); Mike Day, Minnesota, Twitter (URL: https://twitter.com/MikeDaySMM, photo at https://twitter.com/MikeDaySMM/status/1083489400451989505/photo/1); Kratü, Twitter (URL: https://twitter.com/TalesOfKratue, photo at https://twitter.com/TalesOfKratue/status/1101469595414589441/photo/1); Tim Board, Japan, Twitter (URL: https://twitter.com/Hawkworld_, photo at https://twitter.com/Hawkworld_/status/1107789108754038789); Aone Wakatsuke, Twitter (URL: https://twitter.com/AoneWakatsuki, photo at https://twitter.com/AoneWakatsuki/status/1138420031258210305/photo/3).
Asosan
Japan
32.8849°N, 131.085°E; summit elev. 1592 m
All times are local (unless otherwise noted)
Multiple brief ash emission events during April and May 2019; minor ashfall in adjacent villages
Japan's 24-km-wide Asosan caldera on the island of Kyushu has been active throughout the Holocene. Nakadake has been the most active of 17 central cones within the caldera for 2,000 years. Historical eruptions have been primarily basaltic to basaltic-andesitic ash eruptions, with periodic Strombolian activity, all from Nakadake Crater 1. The most recent major eruptive episode began in late November 2014 and continued through 1 May 2016. Another eruption, with the largest ash plume in 20 years, occurred on 8 October 2016. Asosan remained quiet until renewed activity from Crater 1 began in mid-April 2019; it is covered in this report, through the end of June 2019. The Japan Meteorological Agency (JMA) provides monthly reports of activity; the Tokyo Volcanic Ash Advisory Center (VAAC) issues aviation alerts reporting on possible ash plumes.
Asosan remained quiet during 2017 and 2018 with steam plumes rising a few hundred meters from Crater 1 and low levels of SO2 emissions; a warm acidic lake was present within the crater. Fumarolic activity from two areas on the S and SW wall of the crater rim generated occasional thermal anomalies in satellite data and incandescence at night. A brief period of increased seismicity was reported in mid-March 2019. An increase in seismic amplitude on 14 April 2019 preceded a small explosion on 16 April; it produced an ash plume which rose 200 m above the crater rim and drifted NW. It was followed by additional small explosions on 19 April. A new explosion on 3 May produced minor ashfall in adjacent communities; ash emissions were reported multiple times during May with plumes reaching 1,400 m above the crater rim. No additional ash emissions were reported in June.
Activity during 2017 and 2018. JMA reported that no eruptions occurred during 2017. Amplitudes of volcanic tremor increased somewhat during March but were generally low for the rest of the year. The earthquake hypocenters were mostly located near the active crater at around sea level. SO2 emissions were slightly less than 1,000 tons per day (t/d) from January through April; for the rest of the year they ranged from 600 to 2,500 t/d. The Alert Level had been lowered from 2 to 1 on 7 February 2017 where it remained throughout the year. Steam plumes generally rose no more than 600 m above the active crater rim (figure 42). JMA noted that from January to June they often observed crater incandescence at night with a high-sensitivity surveillance camera; Sentinel-2 satellite images also captured thermal anomalies a few times (figure 43). The green lake inside the crater persisted throughout the year with water temperatures of 50-60°C. Two fumaroles were present with high-temperature gas emissions on the SW and S crater walls. Temperatures at the S crater wall were over 600°C from February to May; they decreased to 320-560°C during the rest of the year (figure 44). Sulfur deposits were visible around the SW crater wall fumarole during July.
The Alert Level did not change at Asosan during 2018, and no eruptions were reported. Sulfur dioxide emissions fluctuated between 400 and 1,800 t/d throughout the year. Steam plumes generally rose less than 500 m above the active crater (figure 45); incandescence was observed at night during May-October and sometimes observed in satellite imagery as thermal anomalies (figure 46). The temperature of the green lake inside the crater ranged from 58 to 75°C throughout the year. The thermal anomaly on the S wall of the crater was consistently in the 300-500°C range, and had a high temperature in April of 580°C; in December the high temperature had risen to 738°C (figure 47). A brief increase in the number of isolated tremors occurred during March, with 1,044 reported on 4 March, exceeding the previous maximum of 1,000 on 27 October 2014. Seismicity also increased briefly during June, with more than 400 events reported each day on 8, 18, and 20 June. The Minami Aso village Yoshioka fumarole zone, located about 5 km W of Nakadake Crater 1, continued to produce modest steam plumes throughout 2017 and 2018 (figure 48).
Activity during January-June 2019. Steam plumes rose to 800 m above the crater rim during January 2019. Overall activity increased slightly during February; SO2 emissions peaked at 2,200 t/d early in the month; they ranged from 800 to 1,800 t/d for most of the month. The amplitude of volcanic tremor also increased slightly during February. A further increase in tremor amplitude on 11 March 2019 prompted JMA to raise the Alert Level from 1 to 2 the following morning. Volcanic tremor amplitude decreased on 15 March; JMA determined that activity had decreased, and the Alert Level was lowered back to 1 on 29 March 2019. The amount of water in the crater decreased significantly between 27 February and 20 March, exposing part of the crater floor.
The surface temperature of the lake rose during the first part of 2019; it was 78°C in February and 84°C in March. Steam plumes rose to 1,200 m above the crater rim during March and April. SO2 emissions rose to 4,500 t/d on 12 March but dropped to a lower range of 1,300-2,400 for the rest of the month. Another surge in SO2 emissions on 12 April 2019 to 3,600 t/d prompted a special report from JMA the following day. SO2 emissions varied from about 1,700 to 4,100 t/d during the month; values remained high during the second half of the month. JMA noted that the color of the water in the lake inside Nakadake Crater 1 changed from green to gray after 4 April. Fountains of muddy water were periodically observed; they reached 15 m high on 9 April. The temperatures of both the lake (82°C) and around the two fumarole areas (S area about 530°C, SW area about 310°C) remained constant during April and similar to March.
A large increase in the amplitude of volcanic tremor early on 14 April 2019 prompted JMA to raise the Alert Level from 1 to 2 later in the day. The epicenters of the earthquakes were very shallow, located within 1 km beneath the crater. A small eruption occurred at 1828 on 16 April at Nakadake Crater 1; it produced a gray and white plume that rose 200 m above the crater rim and was the first eruption since 8 October 2016 (figure 49). Incandescence was observed inside the crater on 3 and 17 April. The amplitude of seismic tremors decreased on 18 April. Three very small eruptions on 19 April produced ash and steam plumes that rose 500 m above the crater rim. During a site visit that day JMA measured a high-temperature area that produced incandescence from the bottom of the crater at night (figure 50).
A new eruption began at 1540 on 3 May that lasted until 0620 on 5 May (figure 51). Initially the ash plume rose 600 m above the crater rim, but a few hours later the volume of ash increased, and the plume reached 2 km above the crater rim for a brief period. Incandescence was visible from the webcam. The Tokyo VAAC reported the ash plume at 3 km altitude drifting SE on 3 May. Later in the day it rose to 3.7 km altitude and drifted SW. During a field survey the following day (4 May) JMA reported a steam and ash plume rising from the center of the active crater. The infrared thermal imaging camera recorded the temperature of the plume at about 500°C (figure 52).
Ash fell on the S flank, and a small amount of ashfall on 4 May was confirmed by evidence on a car windshield in Takamori Town (6 km S), Kumamoto Prefecture (figure 53). Ashfall was also reported in Takamori-machi, Minami Aso village (9 km SW), and part of Yamato-cho (25 km SW), also in the Kumamoto Prefecture. SO2 emissions were measured as high as 4,000 t/d on 4 May. Additional explosions with ash plumes were reported from Asosan on 9, 12-16, 29, and 31 May; the plumes rose from 200 to 1,400 m above the crater rim but were not visible in satellite imagery. The TROPOMI instrument on the Sentinel-5 satellite captured SO2 plumes on 3 and 26 May 2019 (figure 54).
Steam plumes rose to 1,700 m above the crater rim during June 2019 (figure 55). During field visits on 6 and 25 June diffuse ash emissions were observed rising from the center of the active crater, but they did not extend significantly above the crater rim (figure 56). The maximum temperature of the plume was measured at about 340°C with a thermal imaging camera. Almost all of the water in the crater bottom had evaporated since early May; incandescence continued to be observed within the crater at night with the high-resolution webcam (figure 57).
Geologic Background. The 24-km-wide Asosan caldera was formed during four major explosive eruptions from 300,000 to 90,000 years ago. These produced voluminous pyroclastic flows that covered much of Kyushu. The last of these, the Aso-4 eruption, produced more than 600 km3 of airfall tephra and pyroclastic-flow deposits. A group of 17 central cones was constructed in the middle of the caldera, one of which, Nakadake, is one of Japan's most active volcanoes. It was the location of Japan's first documented historical eruption in 553 CE. The Nakadake complex has remained active throughout the Holocene. Several other cones have been active during the Holocene, including the Kometsuka scoria cone as recently as about 210 CE. Historical eruptions have largely consisted of basaltic to basaltic-andesite ash emission with periodic strombolian and phreatomagmatic activity. The summit crater of Nakadake is accessible by toll road and cable car, and is one of Kyushu's most popular tourist destinations.
Information Contacts: Japan Meteorological Agency (JMA), Otemachi, 1-3-4, Chiyoda-ku Tokyo 100-8122, Japan (URL: http://www.jma.go.jp/jma/indexe.html); Tokyo Volcanic Ash Advisory Center (VAAC), 1-3-4 Otemachi, Chiyoda-ku, Tokyo, Japan (URL: http://ds.data.jma.go.jp/svd/vaac/data/); Sentinel Hub Playground (URL: https://www.sentinel-hub.com/explore/sentinel-playground); Global Sulfur Dioxide Monitoring Page, Atmospheric Chemistry and Dynamics Laboratory, NASA Goddard Space Flight Center (NASA/GSFC), 8800 Greenbelt Road, Goddard, Maryland, USA (URL: https://so2.gsfc.nasa.gov/).
Ebeko
Russia
50.686°N, 156.014°E; summit elev. 1103 m
All times are local (unless otherwise noted)
Continuing frequent moderate explosions though May 2019; ashfall in Severo-Kurilsk
The Ebeko volcano, located on the northern end of the Paramushir Island in the Kuril Islands, consists of many craters, lakes, and thermal features and has been frequently erupting since late February 2017. Typical activity includes ash plumes, explosive eruptions, and gas-and-steam activity. The previous report through November 2018 (BGVN 43:12) described frequent ash explosions that sometimes caused ashfall in Severo-Kurilsk (7 km E). The primary source of information is the Kamchatka Volcanic Eruptions Response Team (KVERT). This report updates the volcanic activity at Ebeko for December 2018 through May 2019.
Frequent moderate explosive activity continued after November 2018. Volcanologists in Severo-Kurilsk observed explosions sending up ash, which drifted N, NE, and E, resulting in ash falls on Severo-Kurilsk on 28 different days between December 2018 and March 2019. On 25 December 2018 an explosion sent ash up to a maximum altitude of 4.5 km and then drifted N for about 5 km. Explosions occurring on 8-10 March 2019 sent ash up to an altitude of 4 km, resulting in ashfall on Severo-Kurilsk on 9-10 March 2019. An ash plume from these explosions rose to a height of 2.5 km and drifted to a maximum distance of 30 km ENE.
Satellite data analyzed by KVERT registered 12 thermal anomalies from December 2018 through May 2019. According to satellite data analyzed by MIROVA (Middle InfraRed Observation of Volcanic Activity), only one thermal anomaly was recorded from December 2018-May 2019, and no hotspot pixels were recognized using satellite thermal data from the MODVOLC algorithm.
Geologic Background. The flat-topped summit of the central cone of Ebeko volcano, one of the most active in the Kuril Islands, occupies the northern end of Paramushir Island. Three summit craters located along a SSW-NNE line form Ebeko volcano proper, at the northern end of a complex of five volcanic cones. Blocky lava flows extend west from Ebeko and SE from the neighboring Nezametnyi cone. The eastern part of the southern crater contains strong solfataras and a large boiling spring. The central crater is filled by a lake about 20 m deep whose shores are lined with steaming solfataras; the northern crater lies across a narrow, low barrier from the central crater and contains a small, cold crescentic lake. Historical activity, recorded since the late-18th century, has been restricted to small-to-moderate explosive eruptions from the summit craters. Intense fumarolic activity occurs in the summit craters, on the outer flanks of the cone, and in lateral explosion craters.
Information Contacts: Kamchatka Volcanic Eruptions Response Team (KVERT), Far Eastern Branch, Russian Academy of Sciences, 9 Piip Blvd., Petropavlovsk-Kamchatsky, 683006, Russia (URL: http://www.kscnet.ru/ivs/kvert/); MIROVA (Middle InfraRed Observation of Volcanic Activity), a collaborative project between the Universities of Turin and Florence (Italy) supported by the Centre for Volcanic Risk of the Italian Civil Protection Department (URL: http://www.mirovaweb.it/); Hawai'i Institute of Geophysics and Planetology (HIGP) - MODVOLC Thermal Alerts System, School of Ocean and Earth Science and Technology (SOEST), Univ. of Hawai'i, 2525 Correa Road, Honolulu, HI 96822, USA (URL: http://modis.higp.hawaii.edu/).
Piton de la Fournaise (France) — July 2019 Cite this Report
Piton de la Fournaise
France
21.244°S, 55.708°E; summit elev. 2632 m
All times are local (unless otherwise noted)
Eruptive episodes in February-March and June 2019; multiple fissures and lava flows
Short pulses of intermittent eruptive activity have characterized Piton de la Fournaise, the large basaltic shield volcano on La Réunion Island in the western Indian Ocean, for several thousand years. For the last 20 years, frequent effusive basaltic eruptions have occurred on average twice per year. The activity is characterized by lava fountains and lava flows, and occasional explosive eruptions that shower blocks over the summit area and produce ash plumes. Almost all of the recent activity has occurred within the Enclos Fouqué caldera, although past eruptions in 1977, 1986, and 1998 have occurred at vents outside of the caldera. Four separate eruptive episodes were reported during 2018; from 3-4 April, 27 April-1 June, 13 July, and 15 September-1 November (BGVN 43:12, 43:09). Two episodes from 2019 during February-March and June are covered in this report, with information provided primarily by the Observatoire Volcanologique du Piton de la Fournaise (OVPF) as well as satellite instruments.
Piton de la Fournaise experienced two eruptions during November 2018-June 2019. The first lasted from 18 February to 10 March 2019, and the second episode was 11-13 June. The episode in February-March consisted of multiple fissures opening on the E flank of the Dolomieu crater on 18 February with lava flows that traveled several hundred meters. After a brief pause, one new fissure opened nearby on 19 February and produced up to 3 million m3 of lava in a little over four days. Although the flow rate then declined, the eruption continued until 10 March. During the last three days, 7-10 March, two new fissures opened nearby and produced large volumes of lava, bringing the total eruptive volume to about 14.5 million m3. After little activity during April and May, a small eruption occurred on the SSE outer slope of Dolomieu crater that lasted for about 48 hours on 11-13 June; multiple small flows traveled about 1,000 m down the steep flank before ceasing. The MIROVA thermal anomaly graph of log radiative power clearly showed the abruptness of the beginning and ends of the last three eruptive episodes at Piton de la Fournaise from August 2018 through June 2019 (figure 165).
Activity during November 2018-March 2019. Following the end of the 15 September-1 November 2018 eruption, seismic activity immediately below the summit remained low (with only 20 shallow and two deep earthquakes during November). The inflationary signal recorded since the beginning of September stopped, and the OVPF deformation networks did not record any significant deformation. There were 35 shallow earthquakes (0-2 km depth) below the summit crater during December, and one deep earthquake. Only 12 shallow earthquakes and one deep earthquake (greater than 2 km below the surface) were reported in January.
OVPF reported an increase in CO2 concentrations beginning in December 2018, and noted the beginning of inflation on 13 February 2019. A seismic swarm of 379 earthquakes accompanied by minor but rapid deformation (less than 1 cm) was reported on 16 February 2019. A new seismic swarm of 208 earthquakes began early on 18 February with a much larger ground deformation (10 cm of elongation of the summit zone). A volcanic tremor indicative of the arrival of magma near the surface began at 0948 that morning. Webcams indicated that eruptive fissures had opened in the NE part of the Enclos Fouqué caldera. The onset of the eruption was marked by a sudden drop in CO2 flux which then stabilized. The eruptive sites were confirmed visually around 1130. Three fissures with actively flowing lava opened on the E flank of Dolomieu Crater; the fountains of lava were less than 30 m high. The front of the longest flow had reached 1,900 m elevation after one hour. The eruption lasted a little over 12 hours and was over by 2200 that evening; it covered about 150-200 m of the hiking trail to the summit.
Seismicity remained high after the event ended, and at 1500 on 19 February 2019 another seismic swarm of 511 deep earthquakes located under the E flank at about 2.5 km depth occurred. It was not accompanied by a significant amount of deformation. At 1710 tremor signals appeared on the observatory seismographs and the first gas plumes and lava ejection were observed at 1750 and 1912, respectively. During an overflight the next day (20 February), OVPF team members observed the new eruptive site at an elevation of 1,800 m at the foot of Piton Madoré. One fissure and one fountain were active at 0620 on 20 February and the flow front was at 1,300 m elevation (figure 166). During the night of 20-21 February the flow front crossed over the "Grandes Pentes" area in the eastern half of the Enclos Fouque (figure 167).
OVPF reported on 22 February 2019 that 22 shallow earthquakes had been reported since the eruption began on 19 February. Surface flow rates estimated from satellite data, via the HOTVOLC system (OPGC - University of Auvergne), were between 2.5 and 15 m3/s. The quantity of lava emitted between 19 and 22 February was between 1 and 3 million m3. OVPF observed the growth of an eruptive cone that was filled with a small lava lake producing ejecta during a morning overflight on 22 February. A channelized flow moved downstream from the cone and split into two lobes about 1 km from (and 200 m below) the cone (figure 168). The split in the flow occurred near the Guyanin crater. The N flowing lobe, about 50 m wide, had an actively flowing front located at 1,320 m elevation; the incandescent flow was travelling over a recent flow (likely from the previous night). The S-flowing lobe spread to 200 m wide and split into two tongues 300 m SE of Guyanin crater.
Incandescent ejecta from the cone was captured in a webcam image overnight on 22-23 February 2019 (figure 169). The rate of advance of the flow slowed significantly by 24 February, but the intensity of the eruptive tremor remained relatively constant. Mapping of the lava flow on 28 February carried out by the OI2 platform (OPGC - University Clermont Auvergne) from satellite data confirmed the slow progress of the flow after 24 February (300 m in 5 days) (figure 170). The flow front was located at 1,200 m elevation, and only the N arm was active; the lava had traveled about 2.2 km from the vent by 28 February.
Between 28 February and 1 March 2019 a third lobe of lava appeared flowing NE from the vent on the N side of the new flow area; it split into two lobes sometime on 1 March. Very little new lava was recorded on the other lobes. By 4 March the flow rate estimated by satellite data was about 7.5 m3/s. During a site visit on the morning of 5 March OVPF scientists sampled the N lobe of the flow and bombs and tephra near the cone, and acquired infrared and visible images. They noted the continued growth of the cone which still had an open vent at the summit and a base 100 m in diameter. It was 25 m high with a 50-m-wide eruptive vent at the top (figure 171). High-temperature gas emissions and strong Strombolian activity issued from the vent. Steam emissions were present around the base of the cone, suggesting the presence of lava tunnels. A single lobe of lava flowed N from the cone.
A new fissure that opened about 150 m from the main vent on the NW flank of Piton Madoré was first observed on the morning of 6 March (figure 172); OVPF concluded that it had opened late on 5 March. A small cone was forming and a new flow traveled N from the main eruptive site. At least six new emission points were noted the following morning (7 March) around the Piton Madoré. Poor weather prevented confirmation by aerial reconnaissance that day, but in a site visit on 8 March OVPF scientists determined that the new fissure from 5 March remained active; a small cone about 10 m high had two flow lobes on the W and N sides (figure 173). A fissure that opened on 7 March was located 300 m S of the 19 February vent and oriented E-W. It was very active on the morning of 8 March with two 50-m-high lava fountains (figure 174). Samples collected by OVPF indicated that the vents of 5 and 7 March produced lava of different compositions.
There was a strong increase in the eruptive tremor intensity on 7 March, related to the opening of the two new fissures on 5 and 7 March (figure 175). As a result, the surface flow estimates made from satellite data increased significantly to high values greater than 50 m3/s, with the average values on 7-8 March of around 20-25 m3/s. The increased flow rates resulted in the flows traveling much greater distances. By the morning of 9 March the active flow had reached 650-700 m above sea level. The flow front had traveled about 1 km in 24 hours. Strong seismicity had been increasing under the summit zone for the previous 48 hours. After a phase of very strong surface activity observed overnight on 9-10 March that included lava fountains 50-100 m high (figure 176), surface activity ceased around 0630 on 10 March, and seismic activity decreased significantly. OVPF noted that sudden increases in seismicity and flow rates near the end of an eruption have occurred at about half of the eruptions at Piton de la Fournaise in recent years. Lava volumes emitted on the surface between 18 February and 10 March 2019 were estimated at about 14.5 million m3 (figure 177).
Significant SO2 plumes were captured by the TROPOMI instrument on the Sentinel 5-P satellite throughout the 18 February-10 March eruption (figure 178). After the surface eruption ceased, shallow seismicity continued at a lower rate of about 12 earthquakes per day. The end of the eruption (7-10 March) was accompanied by a marked deflation, interpreted by OVPF as the rapid emptying of the magma reservoir. Following the end of the eruption, inflation resumed for the rest of March but then ceased. Seismicity continued at a lower level during April with an average of six shallow earthquakes per day.
Activity during May-June 2019. OVPF reported slight inflation near the summit beginning in early May, and an increase in CO2 concentration in the soil near Plaine des Cafres and Plaine des Palmistes. Strong shallow seismicity reappeared on 27 May 2019 and recurred on 30 and 31 May. Two small seismic swarms were measured on 31 May in the early morning. A new seismic swarm beginning at 0603 on 11 June accompanied by rapid deformation suggested a new eruption was imminent. A tremor near the summit area was first noted at 0635 local time; the webcams indicated a plume of gas, but poor visibility prevented evidence of fresh lava. Around 0930 that morning OVPF confirmed that five fissures had opened on the outer SSE slope of Dolomieu crater at elevations ranging from 2480 to 2025 m (figure 179). The flow fronts were not visible due to weather. Lava fountains under 30 m in height and lava flows were present in the three lowest fissures. The flows traveled rapidly down the steep flank of the crater (figure 180).
The intensity of the eruptive tremor decreased throughout the day, and by 1530 only the lowest elevation fissure was still active (figure 181). The next afternoon (12 June) images in the OVPF webcam located in Piton des Cascades indicated the flow front was at about 1,200-1,300 m elevation. Seismographs indicated that the eruption stopped around 1200 on 13 June. Poor weather obscured visibility of the flow activity. Seismic activity decreased following the eruption, but appeared to increase again beginning on 21 June, with 10 events detected on 30 June. SO2 plumes were recorded in satellite data on 11 and 12 June 2019.
Geologic Background. Piton de la Fournaise is a massive basaltic shield volcano on the French island of Réunion in the western Indian Ocean. Much of its more than 530,000-year history overlapped with eruptions of the deeply dissected Piton des Neiges shield volcano to the NW. Three scarps formed at about 250,000, 65,000, and less than 5,000 years ago by progressive eastward slumping, leaving caldera-sized embayments open to the E and SE. Numerous pyroclastic cones are present on the floor of the scarps and their outer flanks. Most recorded eruptions have originated from the summit and flanks of Dolomieu, a 400-m-high lava shield that has grown within the youngest scarp, which is about 9 km wide and about 13 km from the western wall to the ocean on the E side. More than 150 eruptions, most of which have produced fluid basaltic lava flows, have occurred since the 17th century. Only six eruptions, in 1708, 1774, 1776, 1800, 1977, and 1986, have originated from fissures outside the scarps.
Information Contacts: Observatoire Volcanologique du Piton de la Fournaise, Institut de Physique du Globe de Paris, 14 route nationale 3, 27 ème km, 97418 La Plaine des Cafres, La Réunion, France (URL: http://www.ipgp.fr/fr); MIROVA (Middle InfraRed Observation of Volcanic Activity), a collaborative project between the Universities of Turin and Florence (Italy) supported by the Centre for Volcanic Risk of the Italian Civil Protection Department (URL: http://www.mirovaweb.it/); Global Sulfur Dioxide Monitoring Page, Atmospheric Chemistry and Dynamics Laboratory, NASA Goddard Space Flight Center (NASA/GSFC), 8800 Greenbelt Road, Goddard, Maryland, USA (URL: https://so2.gsfc.nasa.gov/).
Great Sitkin (United States) — July 2019 Cite this Report
Great Sitkin
United States
52.076°N, 176.13°W; summit elev. 1740 m
All times are local (unless otherwise noted)
Small steam explosions in early June 2019
The Great Sitkin volcano is located about 40 km NE of Adak Island in the Aleutian Islands and has had a few short-lived eruptions over the past 100 years. Prior to the latest activity in early June 2019 described below, small phreatic explosions occurred in June and August 2018 (BGVN 43:09). An eruption in 1974 produced a lava dome in the center of the crater. The Alaska Volcano Observatory (AVO) is the primary source of information for this September 2018-June 2019 reporting period.
Low-level unrest occurred from September 2018 through February 2019 with slightly elevated seismic activity (figure 6). Small explosions were seismically detected by AVO on 30 October, 5 and 16 November, and 11 December 2018, but they were not seen in regional infrasound data and satellite data did not show an ash cloud.
On 1, 7, and 9 June 2019, AVO reported small steam explosions as well as slightly elevated seismic activity. Steam plumes and surficial evidence of an explosion were not observed during these events. On 18 June 2019 weakly elevated surface temperatures were recorded, field crews working on Adak observed some steam emissions, and a gas flight was conducted. Elevated concentrations of carbon dioxide detected above the lava dome were likely associated with the steam explosions earlier in the month (figures 7 and 8). From 23 June through the end of the month seismicity began to decline back to background levels.
Geologic Background. The Great Sitkin volcano forms much of the northern side of Great Sitkin Island. A younger volcano capped by a small, 0.8 x 1.2 km ice-filled summit caldera was constructed within a large late-Pleistocene or early Holocene scarp formed by massive edifice failure that truncated an older edifice and produced a submarine debris avalanche. Deposits from this and an even older debris avalanche from a source to the south cover a broad area of the ocean floor north of the volcano. The summit lies along the eastern rim of the younger collapse scarp. Deposits from an earlier caldera-forming eruption of unknown age cover the flanks of the island to a depth up to 6 m. The small younger caldera was partially filled by lava domes emplaced in 1945 and 1974, and five small older flank lava domes, two of which lie on the coastline, were constructed along northwest- and NNW-trending lines. Hot springs, mud pots, and fumaroles occur near the head of Big Fox Creek, south of the volcano. Eruptions have been recorded since the late-19th century.
Information Contacts: Alaska Volcano Observatory (AVO), a cooperative program of a) U.S. Geological Survey, 4200 University Drive, Anchorage, AK 99508-4667 USA (URL: https://avo.alaska.edu/), b) Geophysical Institute, University of Alaska, PO Box 757320, Fairbanks, AK 99775-7320, USA, and c) Alaska Division of Geological & Geophysical Surveys, 794 University Ave., Suite 200, Fairbanks, AK 99709, USA (URL: http://dggs.alaska.gov/).
Ibu
Indonesia
1.488°N, 127.63°E; summit elev. 1325 m
All times are local (unless otherwise noted)
Frequent ash plumes and small lava flows active in the crater through June 2019
Ibu volcano on Halmahera island in Indonesia began the current eruption episode on 5 April 2008. Since then, activity has largely consisted of small ash plumes with less frequent lava flows, lava dome growth, avalanches, and larger ash plumes up to 5.5 km above the crater. This report summarizes activity during December 2018 through June 2019 and is based on Volcano Observatory Notice for Aviation (VONA) reports by MAGMA Indonesia, reports by Pusat Vulkanologi dan Mitigasi Bencana Geologi (PVMBG) and Badan Nasional Penanggulangan Bencana (BNPB), and various satellite data.
During December PVMBG reported ash plumes ranging from 200 to 800 m above the crater. There were 11 MODVOLC thermal alerts that registered during 1-12 December. An explosion on 12 January 2019 produced an ash plume that reached 800 m above the crater and dispersed to the S (figure 15). A report released for this event by Sutopo at BNPB said that Ibu had erupted almost every day over the past three months; an example given was of activity on 10 January consisting of 80 explosions. There were four MODVOLC thermal alerts through the month.
Throughout February explosions frequently produced ash plumes as high as 800 m above the crater, and nine MODVOLC thermal alerts were issued. Daily reports showed variable plume heights of 200-800 m most days throughout the month. Wind directions varied and dispersed the plumes in all directions. A VONA released at 1850 on 6 February reported an ash plume that rose to 1,925 m altitude (around 600 m above the summit) and dispersed S. Activity continued through March with the Darwin VAAC and PVMBG reporting explosions producing ash plumes to heights of 200-800 m above the crater and dispersing in various directions. There were ten MODVOLC alerts through the month.
Similar activity continued through April, May, and June, with ash plumes reaching 200-800 m above the crater. There were 12, 6, and 15 MODVOLC Alerts in April, May, and June, respectively.
Planet Scope satellite images show activity at a two vents near the center of the crater that were producing small lava flows from February through June (figure 16). Thermal anomalies were frequent during December 2018 through June 2019 across MODVOLC, MIROVA, and Sentinel-2 infrared data (figures 17 and 18). Sentinel-2 data showed minor variation in the location of thermal anomalies within the crater, possibly indicating lava flow activity, and MIROVA data showed relatively constant activity with a few reductions in thermal activity during January and February.
Geologic Background. The truncated summit of Gunung Ibu stratovolcano along the NW coast of Halmahera Island has large nested summit craters. The inner crater, 1 km wide and 400 m deep, has contained several small crater lakes. The 1.2-km-wide outer crater is breached on the N, creating a steep-walled valley. A large cone grew ENE of the summit, and a smaller one to the WSW has fed a lava flow down the W flank. A group of maars is located below the N and W flanks. The first observed and recorded eruption was a small explosion from the summit crater in 1911. Eruptive activity began again in December 1998, producing a lava dome that eventually covered much of the floor of the inner summit crater along with ongoing explosive ash emissions.
Information Contacts: Pusat Vulkanologi dan Mitigasi Bencana Geologi (PVMBG, also known as Indonesian Center for Volcanology and Geological Hazard Mitigation, CVGHM), Jalan Diponegoro 57, Bandung 40122, Indonesia (URL: http://www.vsi.esdm.go.id/); Badan Nasional Penanggulangan Bencana (BNPB), National Disaster Management Agency, Graha BNPB - Jl. Scout Kav.38, East Jakarta 13120, Indonesia (URL: http://www.bnpb.go.id/); MAGMA Indonesia, Kementerian Energi dan Sumber Daya Mineral (URL: https://magma.vsi.esdm.go.id/); Darwin Volcanic Ash Advisory Centre (VAAC), Bureau of Meteorology, Northern Territory Regional Office, PO Box 40050, Casuarina, NT 0811, Australia (URL: http://www.bom.gov.au/info/vaac/); Hawai'i Institute of Geophysics and Planetology (HIGP) - MODVOLC Thermal Alerts System, School of Ocean and Earth Science and Technology (SOEST), Univ. of Hawai'i, 2525 Correa Road, Honolulu, HI 96822, USA (URL: http://modis.higp.hawaii.edu/); MIROVA (Middle InfraRed Observation of Volcanic Activity), a collaborative project between the Universities of Turin and Florence (Italy) supported by the Centre for Volcanic Risk of the Italian Civil Protection Department (URL: http://www.mirovaweb.it/); Sentinel Hub Playground (URL: https://www.sentinel-hub.com/explore/sentinel-playground); Planet Labs, Inc. (URL: https://www.planet.com/).
Klyuchevskoy (Russia) — July 2019 Cite this Report
Klyuchevskoy
Russia
56.056°N, 160.642°E; summit elev. 4754 m
All times are local (unless otherwise noted)
Weak thermal anomalies and moderate Strombolian-type eruptions in September 2018-June 2019
Klyuchevskoy has had alternating eruptive and less active periods since August 2015. Activity has included lava flows, a growing cinder cone, thermal anomalies, gas-and-steam plumes, and ash explosions. Though some eruptions occur near the summit crater, major explosive and effusive eruptions have also occurred from flank craters (BGVN 42:04 and 43:05). Intermittent moderate gas-and-steam and ash emissions were previously reported from mid-February to mid-August 2018. The Kamchatka Volcanic Eruptions Response Team (KVERT) is the primary source of information for this September 2018-June 2019 reporting period.
KVERT reported that moderate gas-and-steam activity and weak thermal anomalies occurred intermittently from the beginning of September 2018 through mid-April 2019. [On 9 April a small ash plume was observed, according to KVERT. The Tokyo VAAC reported an ash plume on 12 April that rose 5.2 km altitude and extended NE.] On 21-22 April webcam data showed a gas-and-steam plume extending about 160 km SE (figure 31). Moderate Strombolian-type volcanism began late April 2019 and continued intermittently through June 2019. On 11-12 June webcam data showed explosions that sent ash up to a maximum altitude of 6 km, with the resulting ash plume extending about 200 km WNW.
Thermal anomalies were noted by KVERT during two days in September 2018, six days in April 2019, eleven days in May 2019, and six days in June 2019. MIROVA (Middle InfraRed Observation of Volcanic Activity) analysis of MODIS satellite data showed infrequent weak thermal anomalies December 2018 through early May 2019.
Geologic Background. Klyuchevskoy (also spelled Kliuchevskoi) is Kamchatka's highest and most active volcano. Since its origin about 6000 years ago, the beautifully symmetrical, 4835-m-high basaltic stratovolcano has produced frequent moderate-volume explosive and effusive eruptions without major periods of inactivity. It rises above a saddle NE of sharp-peaked Kamen volcano and lies SE of the broad Ushkovsky massif. More than 100 flank eruptions have occurred during the past roughly 3000 years, with most lateral craters and cones occurring along radial fissures between the unconfined NE-to-SE flanks of the conical volcano between 500 m and 3600 m elevation. The morphology of the 700-m-wide summit crater has been frequently modified by historical eruptions, which have been recorded since the late-17th century. Historical eruptions have originated primarily from the summit crater, but have also included numerous major explosive and effusive eruptions from flank craters.
Information Contacts: Kamchatka Volcanic Eruptions Response Team (KVERT), Far Eastern Branch, Russian Academy of Sciences, 9 Piip Blvd., Petropavlovsk-Kamchatsky, 683006, Russia (URL: http://www.kscnet.ru/ivs/kvert/); Tokyo Volcanic Ash Advisory Center (VAAC), 1-3-4 Otemachi, Chiyoda-ku, Tokyo 100-8122, Japan (URL: http://ds.data.jma.go.jp/svd/vaac/data/); MIROVA (Middle InfraRed Observation of Volcanic Activity), a collaborative project between the Universities of Turin and Florence (Italy) supported by the Centre for Volcanic Risk of the Italian Civil Protection Department (URL: http://www.mirovaweb.it/).
Sangay
Ecuador
2.005°S, 78.341°W; summit elev. 5286 m
All times are local (unless otherwise noted)
Explosion on 26 March 2019; activity from 10 May through June produced ash plumes, lava flows, and pyroclastic flows
Sangay is the southernmost active volcano in Ecuador, with confirmed historical eruptions going back to 1628. The previous eruption occurred during August and December and was characterized by ash plumes reaching 2,500 m above the crater. Lava flows and pyroclastic flows descended the eastern and southern flanks. This report summarizes activity during January through July 2019 and is based on reports by Instituto Geofísico (IG-EPN), Washington Volcanic Ash Advisory Center (VAAC), and various satellite data.
After the December 2018 eruption there was a larger reduction in seismicity, down to one event per day. During January, February, and most of March there was no recorded activity and low seismicity until the Washington VAAC reported an ash plume at 0615 on 26 March. The ash plume rose to a height of around 1 km and dispersed to the SW as seen in GOES 16 satellite imagery as a dark plume within white meteorological clouds. There was no seismic data available due to technical problems with the station.
More persistent eruptive activity began on 10 May with thermal alerts (figure 33) and an ash plume at 0700 that dispersed to the W. An explosion was recorded at 1938 on 11 May, producing an ash plume and incandescent material down the flank (figure 34). Two M 2 earthquakes were detected between 3.5 and 9 km below the crater on 10 May, possibly corresponding to explosive activity. By 17 May there were two active eruptive centers, the central crater and the Ñuñurcu dome (figure 35).
Activity at the central crater by 21 May was characterized by sporadic explosive eruptions that ejected hot ballistic ejecta (blocks) with velocities over 400 km/hour; after landing on the flanks the blocks travelled out to 2.5 km from the crater. Ash plumes reached heights between 0.9-2.3 km above the crater and dispersed mainly to the W and NW; gas plumes also dispersed to the W. The Ñuñurcu dome is located around 190 m SSE of the central crater and by 21 May had produced a lava flow over 470 m long with a maximum width of 175 m and an estimated minimum volume of 300,000 to 600,000 m3. Small pyroclastic flows and rockfalls resulted from collapse of the lava flow front, depositing material over a broad area on the E-SE flanks (figure 36). One pyroclastic flow reached 340 m and covered an area of 14,300 m2. During the 17 May observation flight the lava flow surface reached 277°C.
At the end of June activity was continuing at the central crater and Ñuñurco Dome. At least three lava flows had been generated from the dome down the SE flank and pyroclastic flows continued to form from the flow fronts (figure 37). Pyroclastic material had been washed into the Upano river and steam was observed in the Volcán River possibly due to the presence of hot rocks. Ash plumes continued through June reaching heights of 800 m above the crater (figure 38), but no ashfall had been reported in nearby communities.
Geologic Background. The isolated Sangay volcano, located east of the Andean crest, is the southernmost of Ecuador's volcanoes and its most active. The steep-sided, glacier-covered, dominantly andesitic volcano grew within the open calderas of two previous edifices which were destroyed by collapse to the east, producing large debris avalanches that reached the Amazonian lowlands. The modern edifice dates back to at least 14,000 years ago. It towers above the tropical jungle on the east side; on the other sides flat plains of ash have been eroded by heavy rains into steep-walled canyons up to 600 m deep. The earliest report of an eruption was in 1628. Almost continuous eruptions were reported from 1728 until 1916, and again from 1934 to the present. The almost constant activity has caused frequent changes to the morphology of the summit crater complex.
Information Contacts: Instituto Geofísico (IG-EPN), Escuela Politécnica Nacional, Casilla 17-01-2759, Quito, Ecuador (URL: http://www.igepn.edu.ec); Washington Volcanic Ash Advisory Center (VAAC), Satellite Analysis Branch (SAB), NOAA/NESDIS OSPO, NOAA Science Center Room 401, 5200 Auth Rd, Camp Springs, MD 20746, USA (URL: www.ospo.noaa.gov/Products/atmosphere/vaac, archive at: http://www.ssd.noaa.gov/VAAC/archive.html); Hawai'i Institute of Geophysics and Planetology (HIGP) - MODVOLC Thermal Alerts System, School of Ocean and Earth Science and Technology (SOEST), Univ. of Hawai'i, 2525 Correa Road, Honolulu, HI 96822, USA (URL: http://modis.higp.hawaii.edu/); MIROVA (Middle InfraRed Observation of Volcanic Activity), a collaborative project between the Universities of Turin and Florence (Italy) supported by the Centre for Volcanic Risk of the Italian Civil Protection Department (URL: http://www.mirovaweb.it/); Sentinel Hub Playground (URL: https://www.sentinel-hub.com/explore/sentinel-playground).
Suwanosejima (Japan) — July 2019 Cite this Report
Suwanosejima
Japan
29.638°N, 129.714°E; summit elev. 796 m
All times are local (unless otherwise noted)
Small ash plumes continued during January through June 2019
Suwanosejima is an active volcanic island south of Japan in the Ryuku islands with recent activity centered at Otake crater. The current eruption began in October 2004 and activity has mostly consisted of small ash plumes, ballistic ejecta, and visible incandescence at night. This report summarizes activity during January through June 2019 and is based on reports by the Japan Meteorological Agency (JMA), and various satellite data.
Thermal activity recorded by the MIROVA system was low through January and February after a decline in November (figure 36), shown in Sentined-2 thermal infrared imagery as originating at a vent in the Otake crater (figure 37). During January an explosive event was observed at 1727 on the 3rd, producing a gray plume that rose 600 m above the crater. A white gas-and-steam plume rose to 1.5 km above the crater and nighttime incandescence was observed throughout the month. Reduced activity continued through February with no reported explosive eruptions and light gray plumes up to 900 m above the crater. Incandescence continued to be recorded at night using a sensitive surveillance camera.
There was an increase in thermal energy detected by the MIROVA system in mid-March and there was a MODVOLC thermal alert on the 15th. Occasional small explosions occurred but no larger explosive events were recorded. A white plume was noted on the 27th rising to 900 m above the crater and an event at 1048 on the 30th produced a light-gray plume that rose to 800 m. Incandescence was only observed using a sensitive camera at night (figure 38).
No explosive events were observed through April. A white gas-and-steam plume rose to 1,200 m above the crater on the 19th and incandescence continued intermittently. Minor explosions were recorded on 5, 30, and 31 May, but no larger explosive events were observed during the month. The event on the 30th produced ash plume that reached 1.1 km above the crater. Similar activity continued through June with one explosive event occurring on the 2nd. Overall, there was a reduction in the number of ash plumes erupted during this period compared to previous months (figure 39).
Geologic Background. The 8-km-long island of Suwanosejima in the northern Ryukyu Islands consists of an andesitic stratovolcano with two active summit craters. The summit is truncated by a large breached crater extending to the sea on the E flank that was formed by edifice collapse. One of Japan's most frequently active volcanoes, it was in a state of intermittent Strombolian activity from Otake, the NE summit crater, between 1949 and 1996, after which periods of inactivity lengthened. The largest recorded eruption took place in 1813-14, when thick scoria deposits covered residential areas, and the SW crater produced two lava flows that reached the western coast. At the end of the eruption the summit of Otake collapsed, forming a large debris avalanche and creating an open collapse scarp extending to the eastern coast. The island remained uninhabited for about 70 years after the 1813-1814 eruption. Lava flows reached the eastern coast of the island in 1884. Only about 50 people live on the island.
Information Contacts: Japan Meteorological Agency (JMA), Otemachi, 1-3-4, Chiyoda-ku Tokyo 100-8122, Japan (URL: http://www.jma.go.jp/jma/indexe.html); Hawai'i Institute of Geophysics and Planetology (HIGP) - MODVOLC Thermal Alerts System, School of Ocean and Earth Science and Technology (SOEST), Univ. of Hawai'i, 2525 Correa Road, Honolulu, HI 96822, USA (URL: http://modis.higp.hawaii.edu/); MIROVA (Middle InfraRed Observation of Volcanic Activity), a collaborative project between the Universities of Turin and Florence (Italy) supported by the Centre for Volcanic Risk of the Italian Civil Protection Department (URL: http://www.mirovaweb.it/); Sentinel Hub Playground (URL: https://www.sentinel-hub.com/explore/sentinel-playground).
Tinakula (Solomon Islands) — July 2019 Cite this Report
Tinakula
Solomon Islands
10.386°S, 165.804°E; summit elev. 796 m
All times are local (unless otherwise noted)
Thermal anomalies in satellite data December 2018-June 2019; ship visit January 2019
Remote Tinakula lies 100 km NE of the Solomon Trench at the N end of the Santa Cruz Islands, which are part of the country of the Solomon Islands located 400 km to the W. It has been uninhabited since an eruption with lava flows and ash explosions in 1971 when the small population was evacuated (CSLP 87-71). The nearest communities live on Te Motu (Trevanion) Island (about 30 km S), Nupani (40 km N), and the Reef Islands (60 km E); residents occasionally report noises from explosions at Tinakula. Ashfall from larger explosions has historically reached these islands. The most recent eruptive episode was a large ash explosion and substantial SO2 plume during 21-26 October 2017; satellite imagery suggested that a flow of some type traveled down the scarp on the W flank. Renewed thermal activity that was recognized in satellite imagery beginning in December 2018 continued intermittently through June 2019 and is covered in this report. Satellite imagery and thermal data are the primary sources of information for this volcano. It is occasionally visited by members of the National Disaster Management Office (NDMO) of the Solomon Islands Government, tourists, and research vessels who are able to capture ground-based information.
Satellite images from December 2018 to February 2019 show thermal anomalies at the summit vent. Excellent ship-based photographs of the island on 24-25 January 2019 provided by a crewmember from the R/V Petrel identify numerous volcanic features and show a steam-and-gas plume at the vent. Satellite images from April and May 2019 show thermal anomalies at both the summit vent and along the W flank scarp suggesting flow activity during that time.
A stream of incandescence on the NW flank of Tinakula in a Sentinel 2 satellite image on 24 October 2017 confirmed that some type of high-temperature flow accompanied the explosions and eruptive activity of 21-25 October 2017 (BGVN 43:02). Satellite imagery during most of 2018 recorded steam plumes drifting in several directions from the summit, but no thermal activity (figure 24). There was no further evidence of activity in satellite visible or thermal data until almost exactly one year later when the MIROVA project recorded two thermal alerts in the third week of October 2018 (figure 25). Satellite images from that week were cloudy and did not confirm any surface activity.
The first satellite imagery confirming renewed thermal activity appeared on 8 December 2018, around the same time as a small MIROVA anomaly. After that, several images during January and February 2019 confirmed moderately strong thermal activity at the summit (figure 26). Whether the anomalies were the result of active lava effusion or strong incandescent gases from the summit vent is uncertain.
Visual confirmation of activity at Tinakula is rare, but the research vessel R/V Petrel sailed past the volcano on 24 and 25 January 2019 and a crewmember provided detailed images of the W flank and vent area. The summit vent is located at the top of a W facing scarp, and steam is frequently observed rising from the vent (figures 27). Recent flows and volcaniclastic deposits were visible in the ravine on the W flank (figures 28 and 29). Fresh-looking lava was also visible near the summit vent on top of older deposits (figure 30). Eroded volcaniclastic deposits near the base of the scarp on the W flank were visible on top of older veined and layered volcanic rocks (figure 31). Crewmembers on the vessel R/V Petrel could clearly see an incandescent glow from the summit crater at night (figure 32).
During April and May 2019, both the MIROVA project and MODVOLC measured a number of thermal anomalies (figure 33) using MODIS satellite data. MODVOLC alerts were issued on 4 and 20 April, and 11, 18, and 27 May. Sentinel-2 satellite images during the period confirmed that a flow on the W flank was a likely source of the thermal energy in addition to the summit vent (figure 34). Thermal anomalies appeared again at the end of June in MIROVA data, but no satellite images showed anomalies at that time.
Geologic Background. The small 3.5-km-wide island of Tinakula is the exposed summit of a massive stratovolcano at the NW end of the Santa Cruz islands. It has a breached summit crater that extends from the summit to below sea level. Landslides enlarged this scarp in 1965, creating an embayment on the NW coast. The Mendana cone is located on the SE side. The dominantly andesitic volcano has frequently been observed in eruption since the era of Spanish exploration began in 1595. In about 1840, an explosive eruption apparently produced pyroclastic flows that swept all sides of the island, killing its inhabitants. Recorded eruptions have frequently originated from a cone constructed within the large breached crater. These have left the upper flanks and the steep apron of lava flows and volcaniclastic debris within the breach unvegetated.
Information Contacts: MIROVA (Middle InfraRed Observation of Volcanic Activity), a collaborative project between the Universities of Turin and Florence (Italy) supported by the Centre for Volcanic Risk of the Italian Civil Protection Department (URL: http://www.mirovaweb.it/); Hawai'i Institute of Geophysics and Planetology (HIGP) - MODVOLC Thermal Alerts System, School of Ocean and Earth Science and Technology (SOEST), Univ. of Hawai'i, 2525 Correa Road, Honolulu, HI 96822, USA (URL: http://modis.higp.hawaii.edu/); Sentinel Hub Playground (URL: https://www.sentinel-hub.com/explore/sentinel-playground); Vulcan Inc. (URL: https://www.vulcan.com/), additional details about the R/V Petrel (URL: https://www.paulallen.com/).