Recently Published Bulletin Reports
Manam (Papua New Guinea) Few ash plumes during November-December 2022
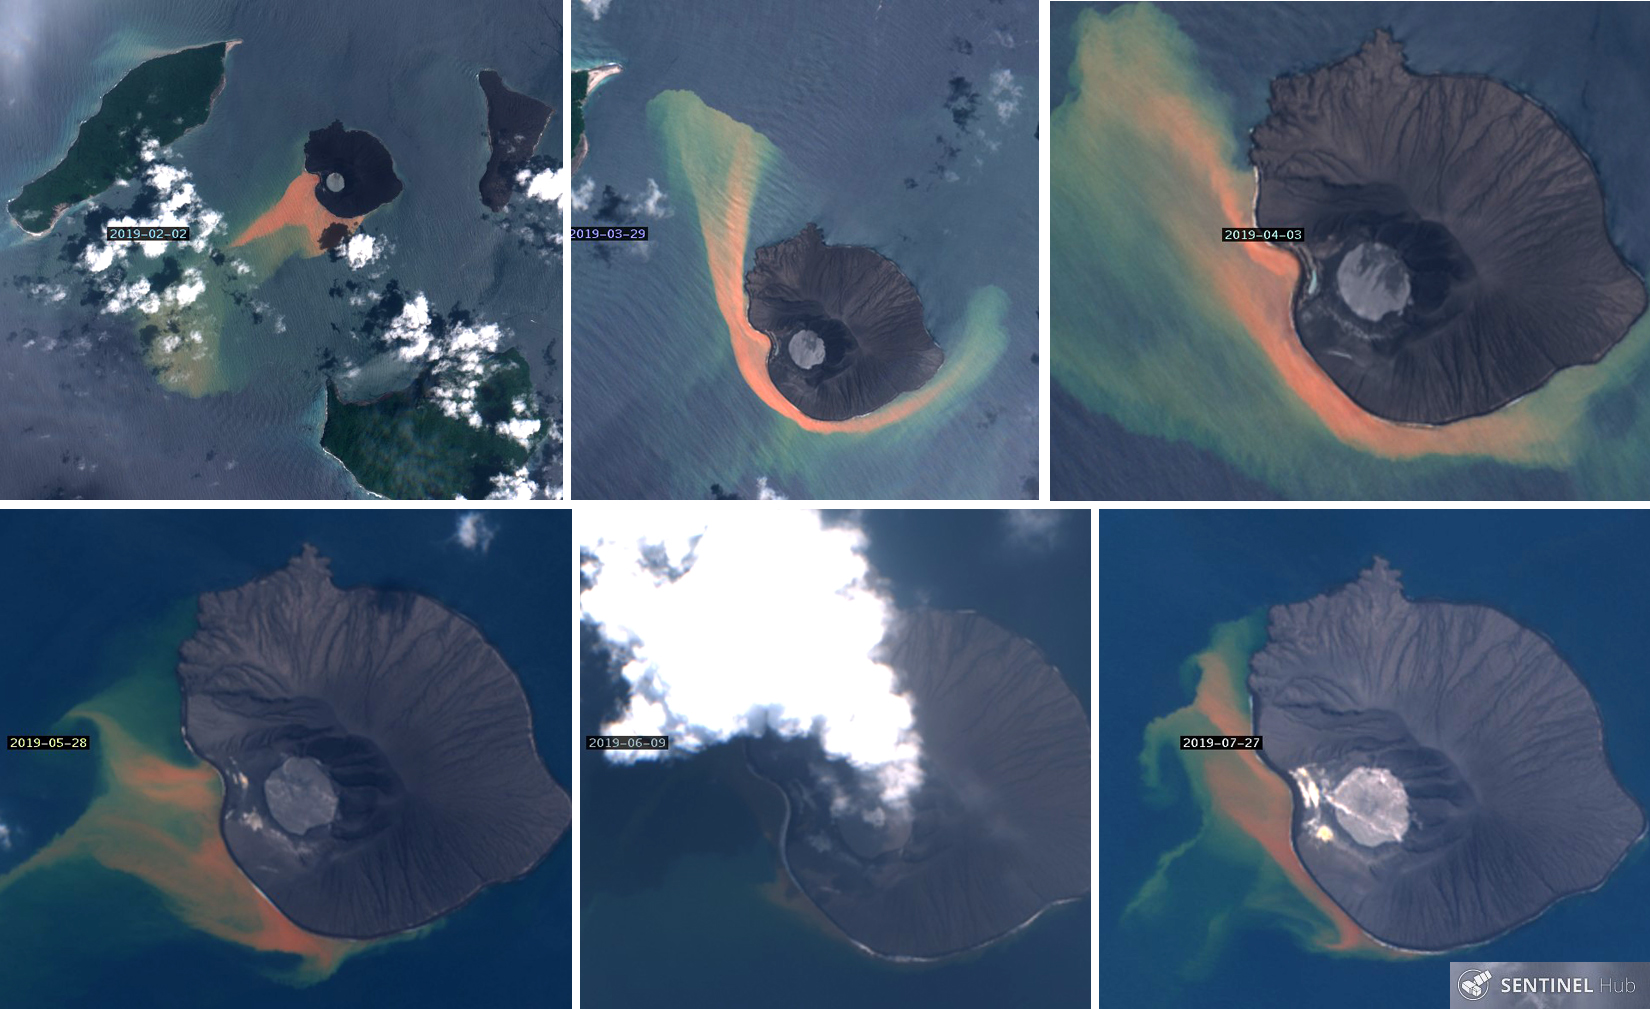
Krakatau (Indonesia) Strombolian activity and ash plumes during November 2022-April 2023
Stromboli (Italy) Strombolian explosions and lava flows continue during January-April 2023
Nishinoshima (Japan) Small ash plumes and fumarolic activity during November 2022 through April 2023
Karangetang (Indonesia) Lava flows, incandescent avalanches, and ash plumes during January-June 2023
Ahyi (United States) Intermittent hydroacoustic signals and discolored plumes during November 2022-June 2023
Kadovar (Papua New Guinea) An ash plume and weak thermal anomaly during May 2023
San Miguel (El Salvador) Small gas-and-ash explosions during March and May 2023
Semisopochnoi (United States) Occasional explosions, ash deposits, and gas-and-steam plumes during December 2022-May 2023
Ebeko (Russia) Continued explosions, ash plumes, and ashfall during October 2022-May 2023
Home Reef (Tonga) Discolored plumes continued during November 2022-April 2023
Ambae (Vanuatu) New lava flow, ash plumes, and sulfur dioxide plumes during February-May 2023
Manam (Papua New Guinea) — July 2023  Cite this Report
Manam
Papua New Guinea
4.08°S, 145.037°E; summit elev. 1807 m
All times are local (unless otherwise noted)
Few ash plumes during November-December 2022
Manam is a 10-km-wide island that consists of two active summit craters: the Main summit crater and the South summit crater and is located 13 km off the northern coast of mainland Papua New Guinea. Frequent mild-to-moderate eruptions have been recorded since 1616. The current eruption period began during June 2014 and has more recently been characterized by intermittent ash plumes and thermal activity (BGVN 47:11). This report updates activity that occurred from November 2022 through May 2023 based on information from the Darwin Volcanic Ash Advisory Center (VAAC) and various satellite data.
Ash plumes were reported during November and December 2022 by the Darwin VAAC. On 7 November an ash plume rose to 2.1 km altitude and drifted NE based on satellite images and weather models. On 14 November an ash plume rose to 2.1 km altitude and drifted W based on RVO webcam images. On 20 November ash plumes rose to 1.8 km altitude and drifted NW. On 26 December an ash plume rose to 3 km altitude and drifted S and SSE.
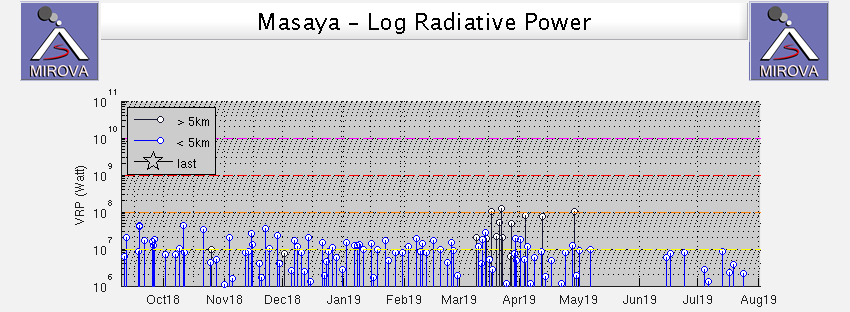
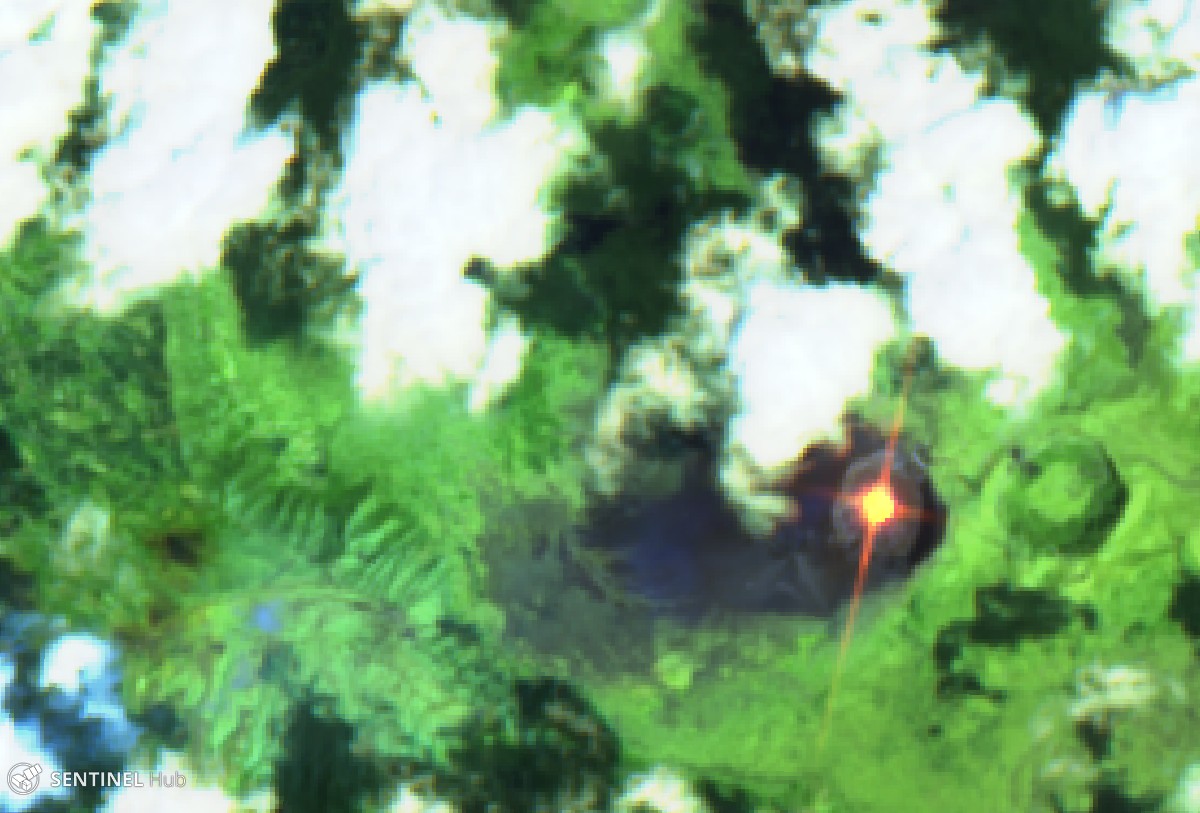
Intermittent sulfur dioxide plumes were detected using the TROPOMI instrument on the Sentinel-5P satellite, some of which exceeded at least two Dobson Units (DU) and drifted in different directions (figure 93). Occasional low-to-moderate power thermal anomalies were recorded by the MIROVA (Middle InfraRed Observation of Volcanic Activity) system; less than five anomalies were recorded each month during November 2022 through May 2023 (figure 94). Two thermal hotspots were detected by the MODVOLC thermal alerts system on 10 December 2022. On clear weather days, thermal activity was also captured in infrared satellite imagery in both the Main and South summit craters, accompanied by gas-and-steam emissions (figure 95).
Geologic Background. The 10-km-wide island of Manam, lying 13 km off the northern coast of mainland Papua New Guinea, is one of the country's most active volcanoes. Four large radial valleys extend from the unvegetated summit of the conical basaltic-andesitic stratovolcano to its lower flanks. These valleys channel lava flows and pyroclastic avalanches that have sometimes reached the coast. Five small satellitic centers are located near the island's shoreline on the northern, southern, and western sides. Two summit craters are present; both are active, although most observed eruptions have originated from the southern crater, concentrating eruptive products during much of the past century into the SE valley. Frequent eruptions, typically of mild-to-moderate scale, have been recorded since 1616. Occasional larger eruptions have produced pyroclastic flows and lava flows that reached flat-lying coastal areas and entered the sea, sometimes impacting populated areas.
Information Contacts: Rabaul Volcano Observatory (RVO), Geohazards Management Division, Department of Mineral Policy and Geohazards Management (DMPGM), PO Box 3386, Kokopo, East New Britain Province, Papua New Guinea; Darwin Volcanic Ash Advisory Centre (VAAC), Bureau of Meteorology, Northern Territory Regional Office, PO Box 40050, Casuarina, NT 0811, Australia (URL: http://www.bom.gov.au/info/vaac/); MIROVA (Middle InfraRed Observation of Volcanic Activity), a collaborative project between the Universities of Turin and Florence (Italy) supported by the Centre for Volcanic Risk of the Italian Civil Protection Department (URL: http://www.mirovaweb.it/); Hawai'i Institute of Geophysics and Planetology (HIGP) - MODVOLC Thermal Alerts System, School of Ocean and Earth Science and Technology (SOEST), Univ. of Hawai'i, 2525 Correa Road, Honolulu, HI 96822, USA (URL: http://modis.higp.hawaii.edu/); NASA Global Sulfur Dioxide Monitoring Page, Atmospheric Chemistry and Dynamics Laboratory, NASA Goddard Space Flight Center (NASA/GSFC), 8800 Greenbelt Road, Goddard, Maryland, USA (URL: https://so2.gsfc.nasa.gov/); Copernicus Browser, Copernicus Data Space Ecosystem, European Space Agency (URL: https://dataspace.copernicus.eu/browser/).
Krakatau (Indonesia) — July 2023 Cite this Report
Krakatau
Indonesia
6.1009°S, 105.4233°E; summit elev. 285 m
All times are local (unless otherwise noted)
Strombolian activity and ash plumes during November 2022-April 2023
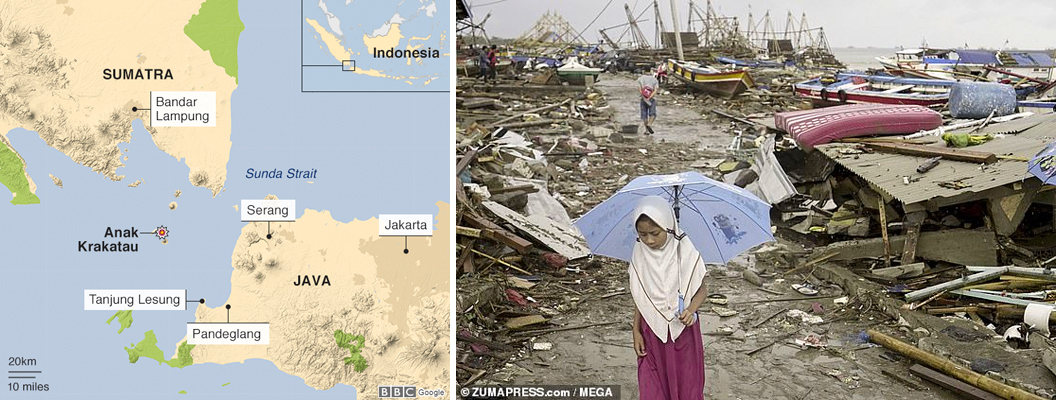
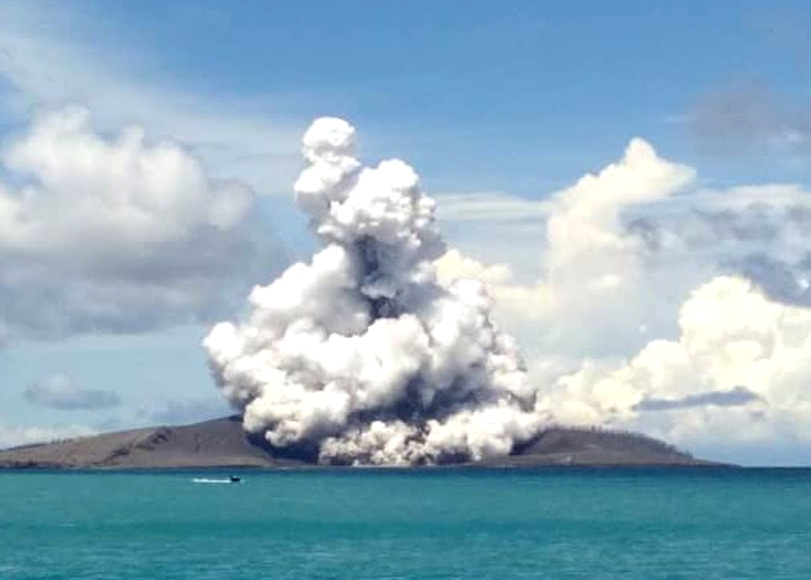
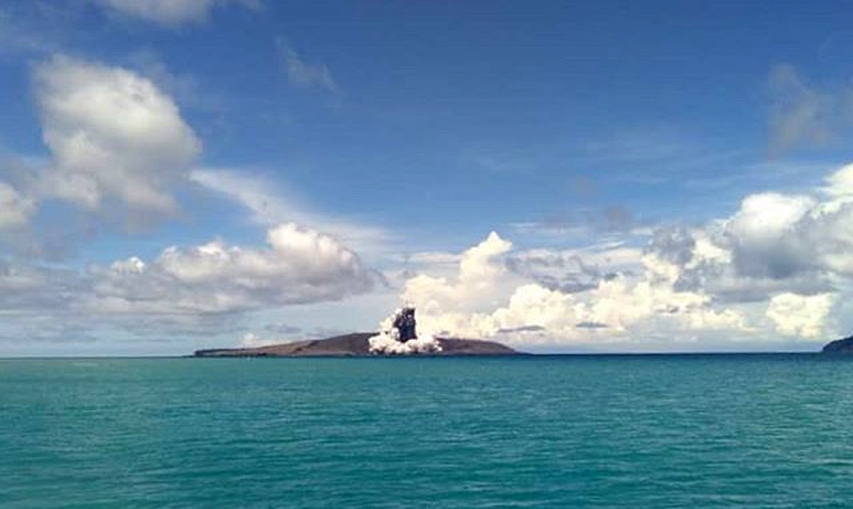
Krakatau is located in the Sunda Strait between Java and Sumatra, Indonesia. Caldera collapse during the catastrophic 1883 eruption destroyed Danan and Perbuwatan cones and left only a remnant of Rakata. The post-collapse cone of Anak Krakatau (Child of Krakatau) was constructed within the 1883 caldera at a point between the former Danan and Perbuwatan cones; it has been the site of frequent eruptions since 1927. The current eruption period began in May 2021 and has recently consisted of explosions, ash plumes, and thermal activity (BGVN 47:11). This report covers activity during November 2022 through April 2023 based on information provided by the Indonesian Center for Volcanology and Geological Hazard Mitigation, referred to as Pusat Vulkanologi dan Mitigasi Bencana Geologi (PVMBG), MAGMA Indonesia, the Darwin Volcanic Ash Advisory Center (VAAC), and several sources of satellite data.
Activity was relatively low during November and December 2022. Daily white gas-and-steam plumes rose 25-100 m above the summit and drifted in different directions. Gray ash plumes rose 200 m above the summit and drifted NE at 1047 and at 2343 on 11 November. On 14 November at 0933 ash plumes rose 300 m above the summit and drifted E. An ash plume was reported at 0935 on 15 December that rose 100 m above the summit and drifted NE. An eruptive event at 1031 later that day generated an ash plume that rose 700 m above the summit and drifted NE. A gray ash plume at 1910 rose 100 m above the summit and drifted E. Incandescent material was ejected above the vent based on an image taken at 1936.
During January 2023 daily white gas-and-steam plumes rose 25-300 m above the summit and drifted in multiple directions. Gray-to-brown ash plumes were reported at 1638 on 3 January, at 1410 and 1509 on 4 January, and at 0013 on 5 January that rose 100-750 m above the summit and drifted NE and E; the gray-to-black ash plume at 1509 on 4 January rose as high as 3 km above the summit and drifted E. Gray ash plumes were recorded at 1754, 2241, and 2325 on 11 January and at 0046 on 12 January and rose 200-300 m above the summit and drifted NE. Toward the end of January, PVMBG reported that activity had intensified; Strombolian activity was visible in webcam images taken at 0041, 0043, and 0450 on 23 January. Multiple gray ash plumes throughout the day rose 200-500 m above the summit and drifted E and SE (figure 135). Webcam images showed progressively intensifying Strombolian activity at 1919, 1958, and 2113 on 24 January; a gray ash plume at 1957 rose 300 m above the summit and drifted E (figure 135). Eruptive events at 0231 and 2256 on 25 January and at 0003 on 26 January ejected incandescent material from the vent, based on webcam images. Gray ash plumes observed during 26-27 January rose 300-500 m above the summit and drifted NE, E, and SE.
Low levels of activity were reported during February and March. Daily white gas-and-steam plumes rose 25-300 m above the summit and drifted in different directions. The Darwin VAAC reported that continuous ash emissions rose to 1.5-1.8 km altitude and drifted W and NW during 1240-1300 on 10 March, based on satellite images, weather models, and PVMBG webcams. White-and-gray ash plumes rose 500 m and 300 m above the summit and drifted SW at 1446 and 1846 on 18 March, respectively. An eruptive event was recorded at 2143, though it was not visible due to darkness. Multiple ash plumes were reported during 27-29 March that rose as high as 2.5 km above the summit and drifted NE, W, and SW (figure 136). Webcam images captured incandescent ejecta above the vent at 0415 and around the summit area at 2003 on 28 March and at 0047 above the vent on 29 March.
Daily white gas-and-steam plumes rose 25-300 m above the summit and drifted in multiple directions during April and May. White-and-gray and black plumes rose 50-300 m above the summit on 2 and 9 April. On 11 May at 1241 a gray ash plume rose 1-3 km above the summit and drifted SW. On 12 May at 0920 a gray ash plume rose 2.5 km above the summit and drifted SW and at 2320 an ash plume rose 1.5 km above the summit and drifted SW. An accompanying webcam image showed incandescent ejecta. On 13 May at 0710 a gray ash plume rose 2 km above the summit and drifted SW (figure 137).
The MIROVA (Middle InfraRed Observation of Volcanic Activity) graph of MODIS thermal anomaly data showed intermittent low-to-moderate power thermal anomalies during November 2022 through April 2023 (figure 138). Some of this thermal activity was also visible in infrared satellite imagery at the crater, accompanied by gas-and-steam and ash plumes that drifted in different directions (figure 139).
Geologic Background. The renowned Krakatau (frequently mis-named as Krakatoa) volcano lies in the Sunda Strait between Java and Sumatra. Collapse of an older edifice, perhaps in 416 or 535 CE, formed a 7-km-wide caldera. Remnants of that volcano are preserved in Verlaten and Lang Islands; subsequently the Rakata, Danan, and Perbuwatan cones were formed, coalescing to create the pre-1883 Krakatau Island. Caldera collapse during the catastrophic 1883 eruption destroyed Danan and Perbuwatan, and left only a remnant of Rakata. This eruption caused more than 36,000 fatalities, most as a result of tsunamis that swept the adjacent coastlines of Sumatra and Java. Pyroclastic surges traveled 40 km across the Sunda Strait and reached the Sumatra coast. After a quiescence of less than a half century, the post-collapse cone of Anak Krakatau (Child of Krakatau) was constructed within the 1883 caldera at a point between the former Danan and Perbuwatan cones. Anak Krakatau has been the site of frequent eruptions since 1927.
Information Contacts: Pusat Vulkanologi dan Mitigasi Bencana Geologi (PVMBG, also known as Indonesian Center for Volcanology and Geological Hazard Mitigation, CVGHM), Jalan Diponegoro 57, Bandung 40122, Indonesia (URL: http://www.vsi.esdm.go.id/); MAGMA Indonesia, Kementerian Energi dan Sumber Daya Mineral (URL: https://magma.esdm.go.id/v1); Darwin Volcanic Ash Advisory Centre (VAAC), Bureau of Meteorology, Northern Territory Regional Office, PO Box 40050, Casuarina, NT 0811, Australia (URL: http://www.bom.gov.au/info/vaac/); MIROVA (Middle InfraRed Observation of Volcanic Activity), a collaborative project between the Universities of Turin and Florence (Italy) supported by the Centre for Volcanic Risk of the Italian Civil Protection Department (URL: http://www.mirovaweb.it/); Copernicus Browser, Copernicus Data Space Ecosystem, European Space Agency (URL: https://dataspace.copernicus.eu/browser/).
Stromboli
Italy
38.789°N, 15.213°E; summit elev. 924 m
All times are local (unless otherwise noted)
Strombolian explosions and lava flows continue during January-April 2023
Stromboli, located in Italy, has exhibited nearly constant lava fountains for the past 2,000 years; recorded eruptions date back to 350 BCE. Eruptive activity occurs at the summit from multiple vents, which include a north crater area (N area) and a central-southern crater (CS area) on a terrace known as the ‘terrazza craterica’ at the head of the Sciara del Fuoco, a large scarp that runs from the summit down the NW side of the volcano-island. Activity typically consists of Strombolian explosions, incandescent ejecta, lava flows, and pyroclastic flows. Thermal and visual monitoring cameras are located on the nearby Pizzo Sopra La Fossa, above the terrazza craterica, and at multiple flank locations. The current eruption period has been ongoing since 1934 and recent activity has consisted of frequent Strombolian explosions and lava flows (BGVN 48:02). This report updates activity during January through April 2023 primarily characterized by Strombolian explosions and lava flows based on reports from Italy's Istituto Nazionale di Geofisica e Vulcanologia (INGV) and various satellite data.
Frequent explosive activity continued throughout the reporting period, generally in the low-to-medium range, based on the number of hourly explosions in the summit crater (figure 253, table 16). Intermittent thermal activity was recorded by the MIROVA (Middle InfraRed Observation of Volcanic Activity) analysis of MODIS satellite data (figure 254). According to data collected by the MODVOLC thermal algorithm, a total of 9 thermal alerts were detected: one on 2 January 2023, one on 1 February, five on 24 March, and two on 26 March. The stronger pulses of thermal activity likely reflected lava flow events. Infrared satellite imagery captured relatively strong thermal hotspots at the two active summit craters on clear weather days, showing an especially strong event on 8 March (figure 255).
Table 16. Summary of type, frequency, and intensity of explosive activity at Stromboli by month during January-April 2023; information from webcam observations. Courtesy of INGV weekly reports.
| Month |
Explosive Activity |
| Jan 2023 |
Typical Strombolian activity with spattering and lava overflows in the N crater area. Explosions were reported from 4 vents in the N area and 1-2 vents in the CS area. The average hourly frequency of explosions was low-to-medium (1-12 events/hour). The intensity of the explosions varied from low (less than 80 m high) to medium (less than 150 m high) in the N crater area and up to high (greater than 150 m high) in the CS crater area. |
| Feb 2023 |
Typical Strombolian activity with spattering in the N crater area. Explosions were reported from 2-3 vents in the N area and 1-4 vents in the CS area. The average hourly frequency of explosions was low-to-medium (1-14 events/hour). The intensity of the explosions varied from low (less than 80 m high) to medium (less than 150 m high) in the N crater area and up to high (greater than 150 m high) in the CS crater area. |
| Mar 2023 |
Typical Strombolian activity with spattering and lava overflows in the N crater area. Explosions were reported from 2-3 vents in the N area and 2-4 vents in the CS area. The average hourly frequency of explosions was low-to-medium (1-18 events/hour). The intensity of the explosions varied from low (less than 80 m high) to medium (less than 150 m high) in the N crater area and up to high (greater than 150 m high) in the CS crater area. |
| Apr 2023 |
Typical Strombolian activity. Explosions were reported from 2 vents in the N area and 2-3 vents in the CS area. The average hourly frequency of explosions was low-to-high (1-16 events/hour). The intensity of the explosions varied from low (less than 80 m high) to medium (less than 150 m high) in both the N and CS crater areas. |
Activity during January-February 2023. Strombolian explosions were reported in the N crater area, as well as lava effusion. Explosive activity in the N crater area ejected coarse material (bombs and lapilli). Intense spattering was observed in both the N1 and N2 craters. In the CS crater area, explosions generally ejected fine material (ash), sometimes to heights greater than 250 m. The intensity of the explosions was characterized as low-to-medium in the N crater and medium-to-high in the CS crater. After intense spattering activity from the N crater area, a lava overflow began at 2136 on 2 January that flowed part way down the Sciara del Fuoco, possibly moving down the drainage that formed in October, out of view from webcams. The flow remained active for a couple of hours before stopping and beginning to cool. A second lava flow was reported at 0224 on 4 January that similarly remained active for a few hours before stopping and cooling. Intense spattering was observed on 11 and 13 January from the N1 crater. After intense spattering activity at the N2 crater at 1052 on 17 January another lava flow started to flow into the upper part of the Sciara del Fuoco (figure 256), dividing into two: one that traveled in the direction of the drainage formed in October, and the other one moving parallel to the point of emission. By the afternoon, the rate of the flow began to decrease, and at 1900 it started to cool. A lava flow was reported at 1519 on 24 January following intense spattering in the N2 area, which began to flow into the upper part of the Sciara del Fuoco. By the morning of 25 January, the lava flow had begun to cool. During 27 January the frequency of eruption in the CS crater area increased to 6-7 events/hour compared to the typical 1-7 events/hour; the following two days showed a decrease in frequency to less than 1 event/hour. Starting at 1007 on 30 January a high-energy explosive sequence was produced by vents in the CS crater area. The sequence began with an initial energetic pulse that lasted 45 seconds, ejecting predominantly coarse products 300 m above the crater that fell in an ESE direction. Subsequent and less intense explosions ejected material 100 m above the crater. The total duration of this event lasted approximately two minutes. During 31 January through 6, 13, and 24 February spattering activity was particularly intense for short periods in the N2 crater.
An explosive sequence was reported on 16 February that was characterized by a major explosion in the CS crater area (figure 257). The sequence began at 1817 near the S2 crater that ejected material radially. A few seconds later, lava fountains were observed in the central part of the crater. Three explosions of medium intensity (material was ejected less than 150 m high) were recorded at the S2 crater. The first part of this sequence lasted approximately one minute, according to INGV, and material rose 300 m above the crater and then was deposited along the Sciara del Fuoco. The second phase began at 1818 at the S1 crater; it lasted seven seconds and material was ejected 150 m above the crater. Another event 20 seconds later lasted 12 seconds, also ejecting material 150 m above the crater. The sequence ended with at least three explosions of mostly fine material from the S1 crater. The total duration of this sequence was about two minutes.
Short, intense spattering activity was noted above the N1 crater on 27 and 28 February. A lava overflow was first reported at 0657 from the N2 crater on 27 February that flowed into the October 2022 drainage. By 1900 the flow had stopped. A second lava overflow also in the N crater area occurred at 2149, which overlapped the first flow and then stopped by 0150 on 28 February. Material detached from both the lava overflows rolled down the Sciara del Fuoco, some of which was visible in webcam images.
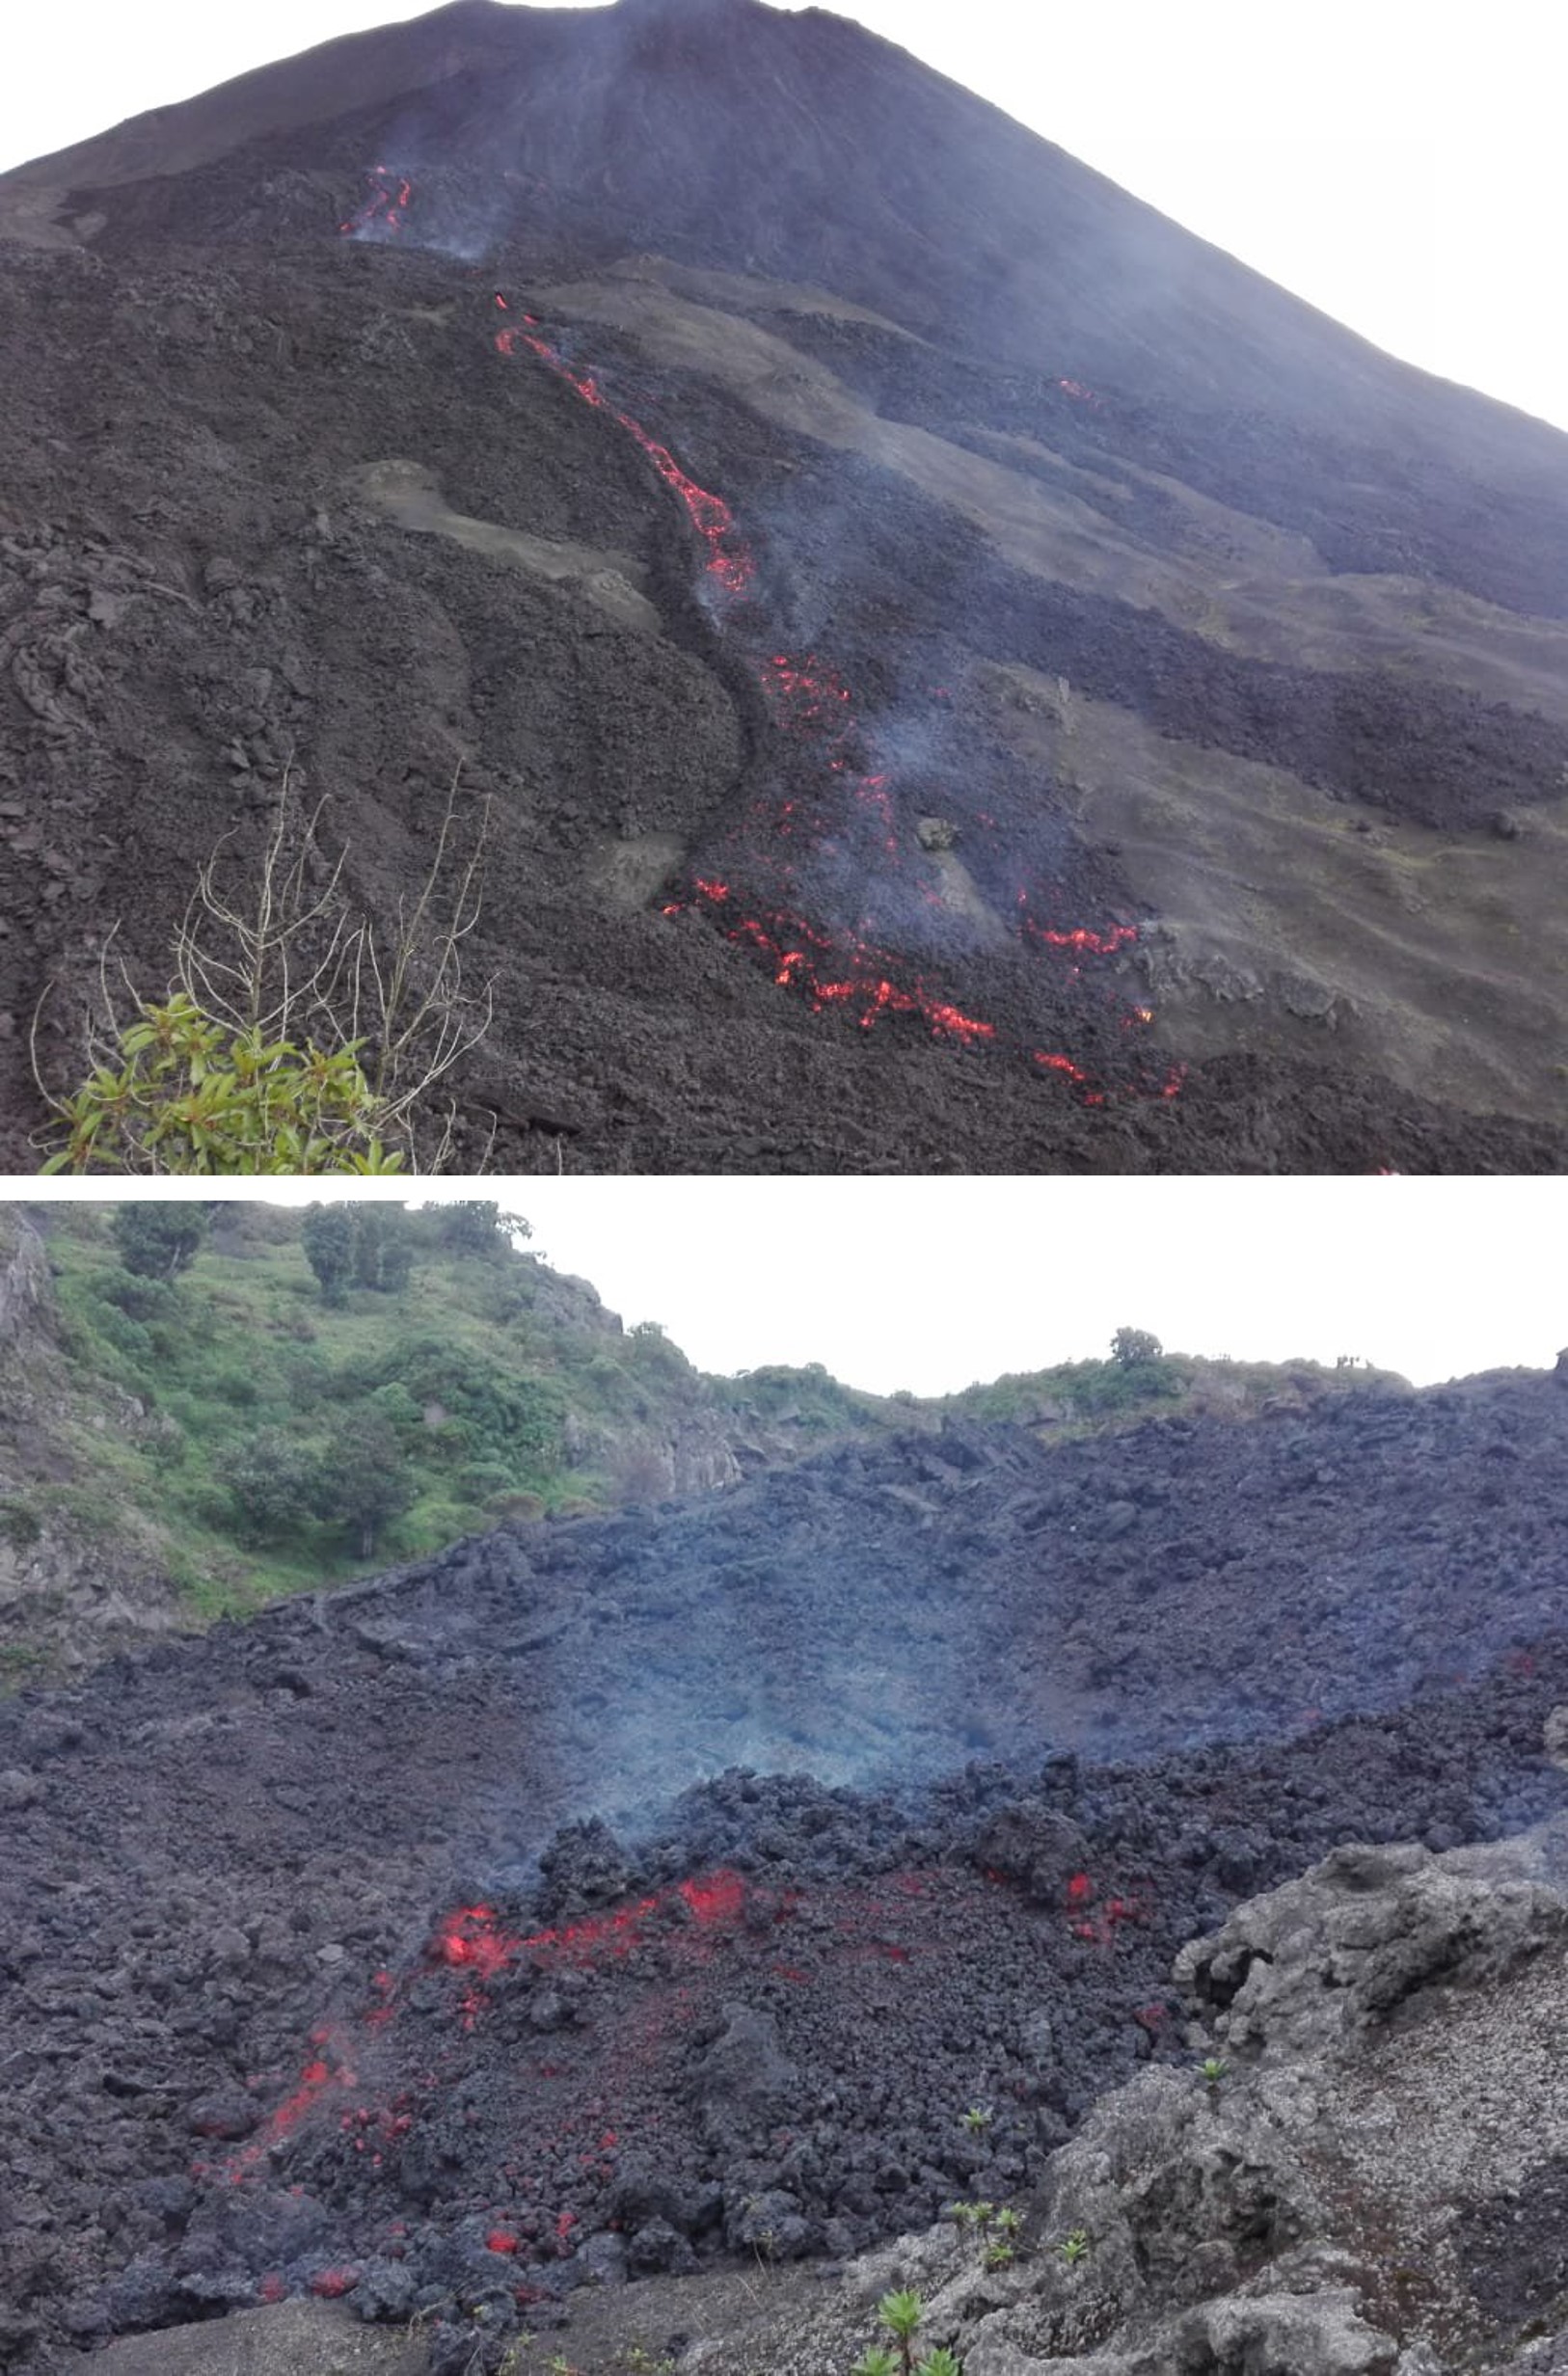
Activity during March-April 2023. Strombolian activity continued with spattering activity and lava overflows in the N crater area during March. Explosive activity at the N crater area varied from low (less than 80 m high) to medium (less than 150 m high) and ejected coarse material, such as bombs and lapilli. Spattering was observed above the N1 crater, while explosive activity at the CS crater area varied from medium to high (greater than 150 m high) and ejected coarse material. Intense spattering activity was observed for short periods on 6 March above the N1 crater. At approximately 0610 a lava overflow was reported around the N2 crater on 8 March, which then flowed into the October 2022 drainage. By 1700 the flow started to cool. A second overflow began at 1712 on 9 March and overlapped the previous flow. It had stopped by 2100. Material from both flows was deposited along the Sciara del Fuoco, though much of the activity was not visible in webcam images. On 11 March a lava overflow was observed at 0215 that overlapped the two previous flows in the October 2022 drainage. By late afternoon on 12 March, it had stopped.
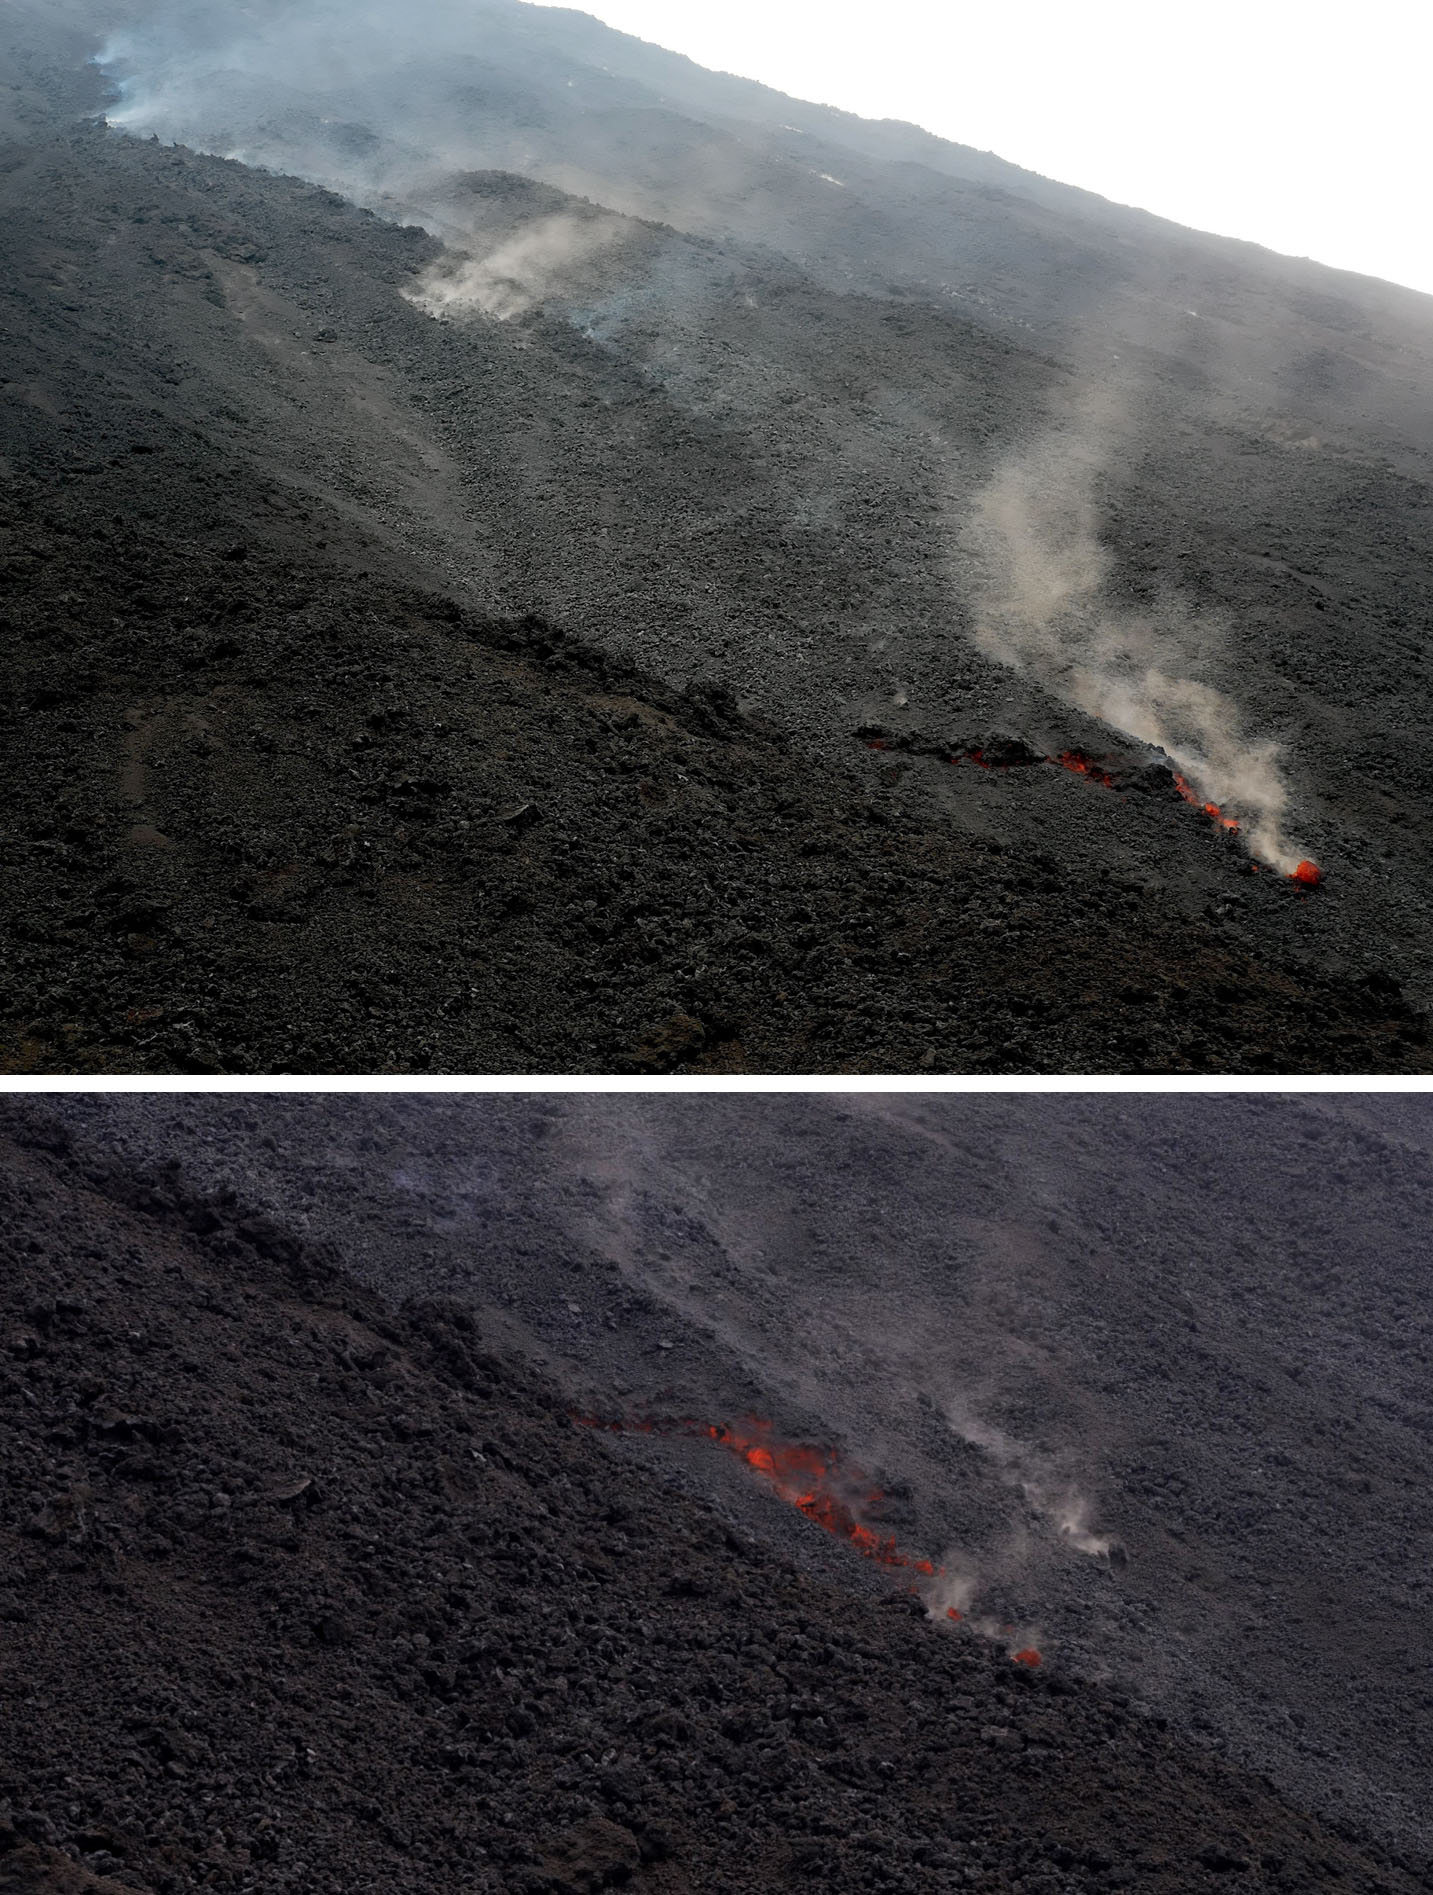
During a field excursion on 16 March, scientists noted that a vent in the central crater area was degassing. Another vent showed occasional Strombolian activity that emitted ash and lapilli. During 1200-1430 low-to-medium intense activity was reported; the N1 crater emitted ash emissions and the N2 crater emitted both ash and coarse material. Some explosions also occurred in the CS crater area that ejected coarse material. The C crater in the CS crater area occasionally showed gas jetting and low intensity explosions on 17 and 22 March; no activity was observed at the S1 crater. Intense, longer periods of spattering were reported in the N1 crater on 19, 24, and 25 March. Around 2242 on 23 March a lava overflow began from the N1 crater that, after about an hour, began moving down the October 2022 drainage and flow along the Sciara del Fuoco (figure 258). Between 0200 and 0400 on 26 March the flow rate increased, which generated avalanches of material from collapses at the advancing flow front. By early afternoon, the flow began to cool. On 25 March at 1548 an explosive sequence began from one of the vents at S2 in the CS crater area (figure 258). Fine ash mixed with coarse material was ejected 300 m above the crater rim and drifted SSE. Some modest explosions around Vent C were detected at 1549 on 25 March, which included an explosion at 1551 that ejected coarse material. The entire explosive sequence lasted approximately three minutes.
During April explosions persisted in both the N and CS crater areas. Fine material was ejected less than 80 m above the N crater rim until 6 April, followed by ejection of coarser material. Fine material was also ejected less than 80 m above the CS crater rim. The C and S2 crater did not show significant eruptive activity. On 7 April an explosive sequence was detected in the CS crater area at 1203 (figure 259). The first explosion lasted approximately 18 seconds and ejected material 400 m above the crater rim, depositing pyroclastic material in the upper part of the Sciara del Fuoco. At 1204 a second, less intense explosion lasted approximately four seconds and deposited pyroclastic products outside the crater area and near Pizzo Sopra La Fossa. A third explosion at 1205 was mainly composed of ash that rose about 150 m above the crater and lasted roughly 20 seconds. A fourth explosion occurred at 1205 about 28 seconds after the third explosion and ejected a mixture of coarse and fine material about 200 m above the crater; the explosion lasted roughly seven seconds. Overall, the entire explosive sequence lasted about two minutes and 20 seconds. After the explosive sequence on 7 April, explosions in both the N and CS crater areas ejected material as high as 150 m above the crater.
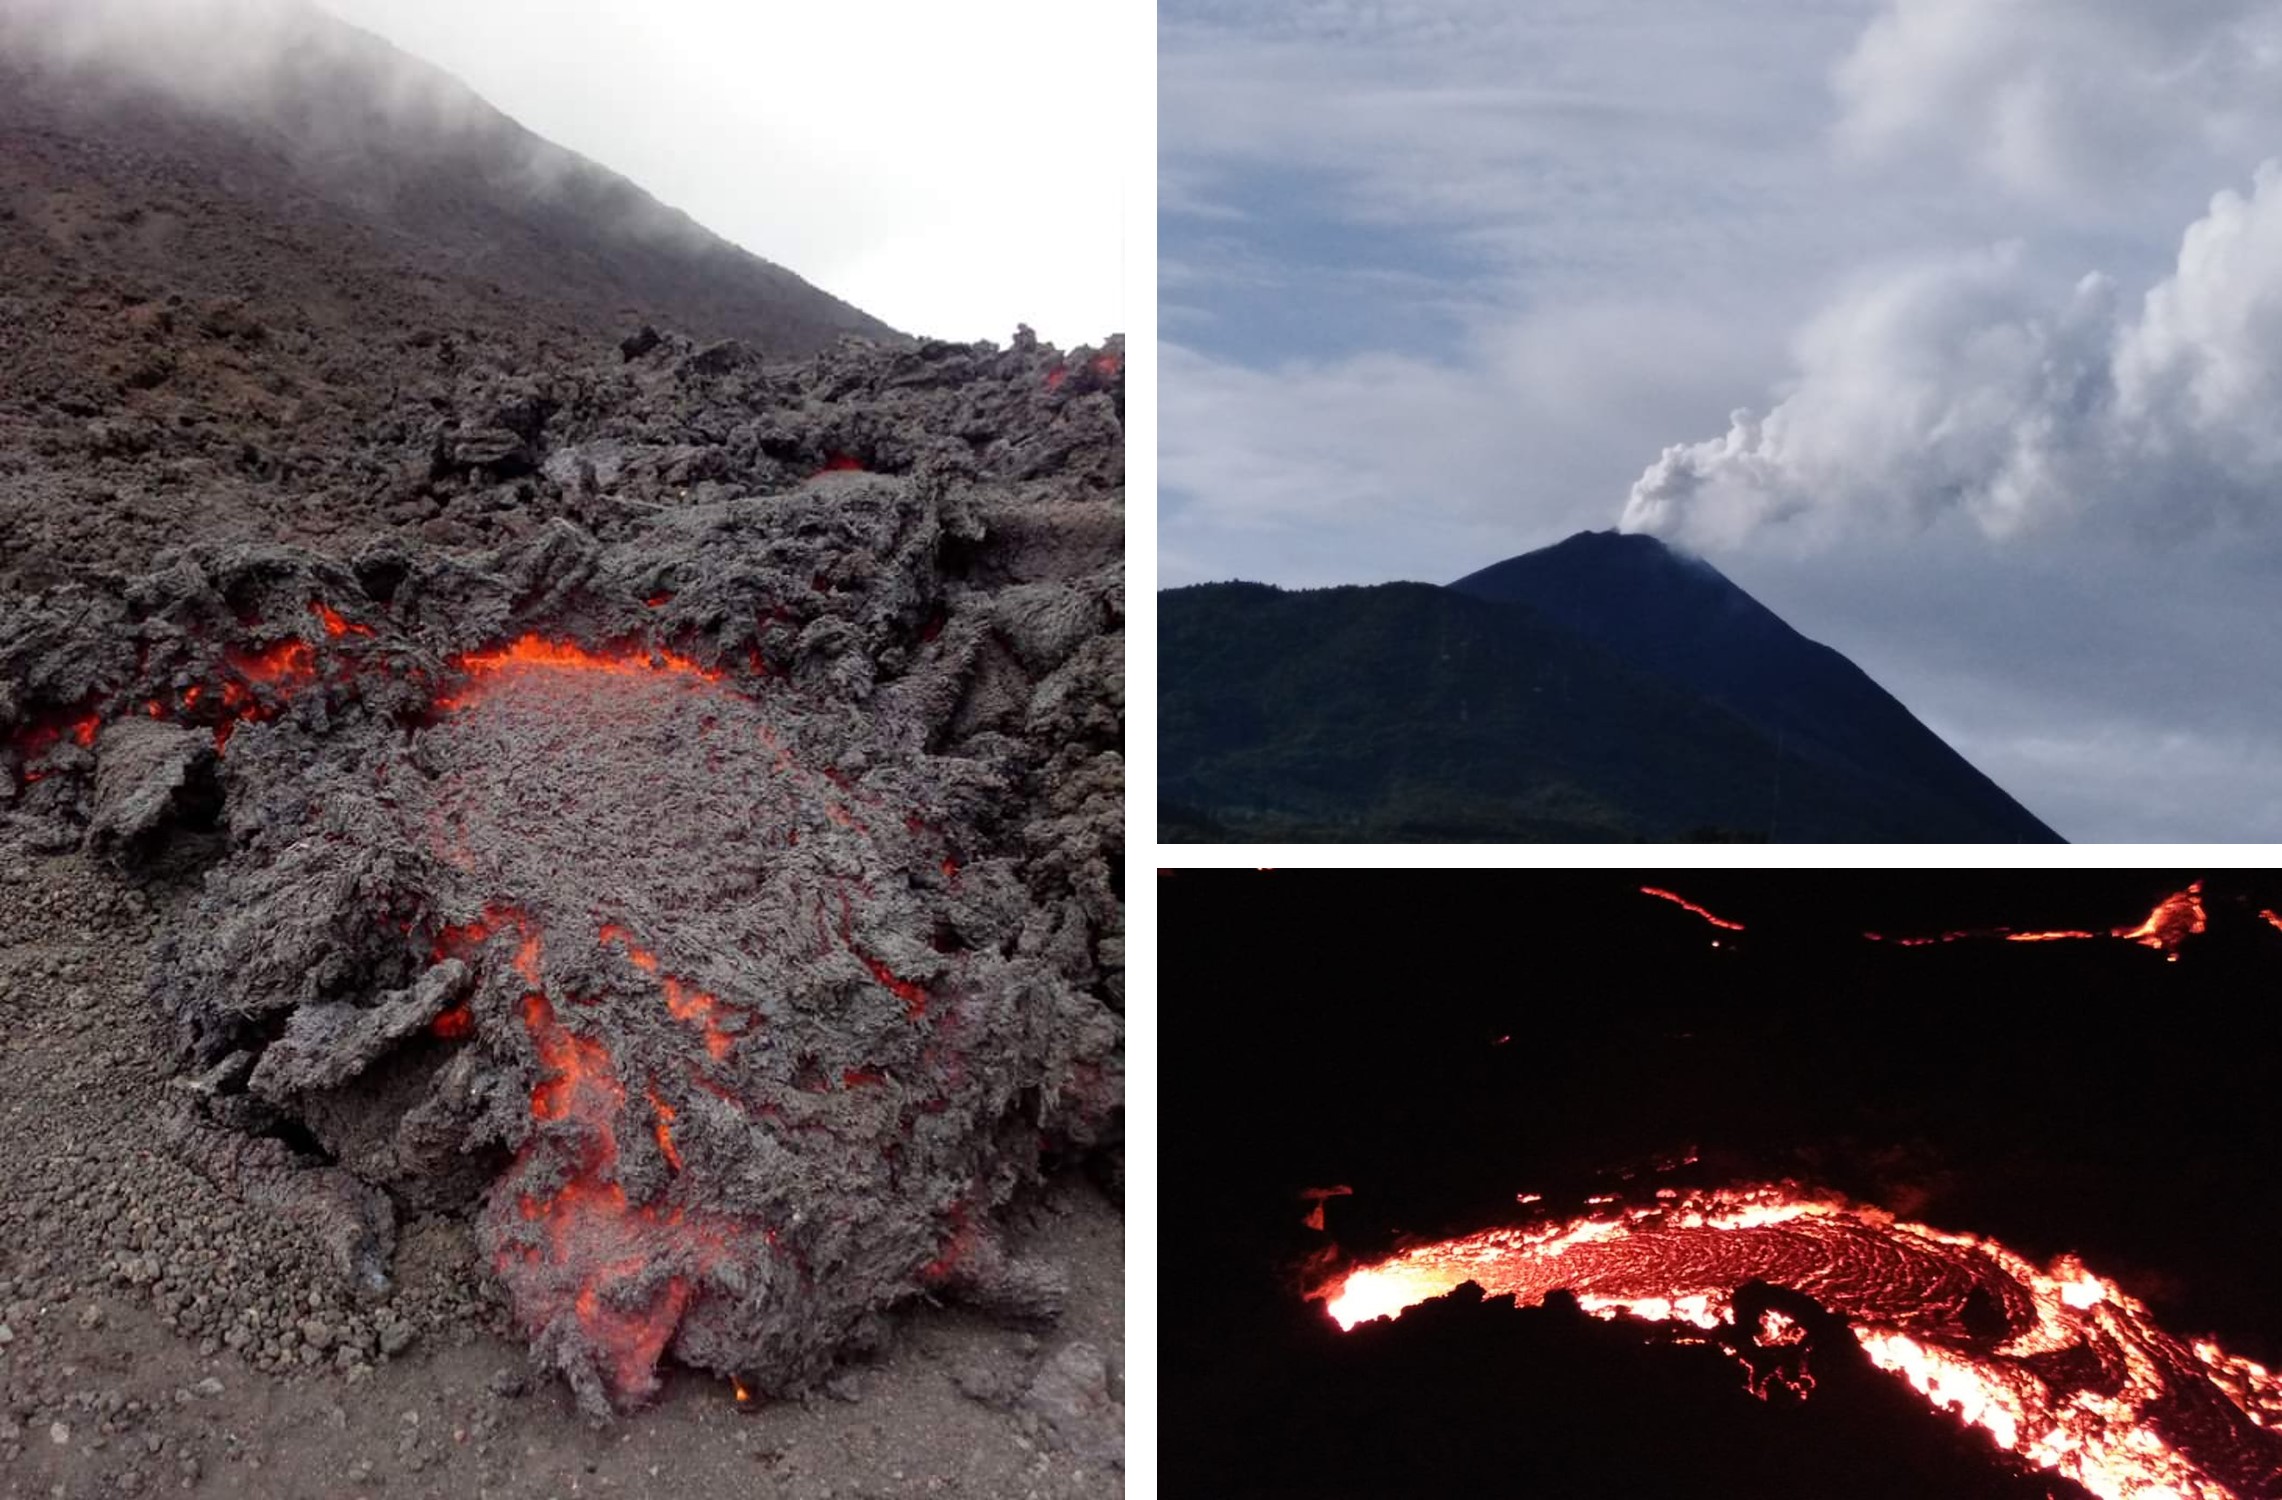
On 21 April research scientists from INGV made field observations in the summit area of Stromboli, and some lapilli samples were collected. In the N crater area near the N1 crater, a small cone was observed with at least two active vents, one of which was characterized by Strombolian explosions. The other vent produced explosions that ejected ash and chunks of cooled lava. At the N2 crater at least one vent was active and frequently emitted ash. In the CS crater area, a small cone contained 2-3 degassing vents and a smaller, possible fissure area also showed signs of degassing close to the Pizzo Sopra La Fossa. In the S part of the crater, three vents were active: a small hornito was characterized by modest and rare explosions, a vent that intermittently produced weak Strombolian explosions, and a vent at the end of the terrace that produced frequent ash emissions. Near the S1 crater there was a hornito that generally emitted weak gas-and-steam emissions, sometimes associated with “gas rings”. On 22 April another field inspection was carried out that reported two large sliding surfaces on the Sciara del Fuoco that showed where blocks frequently descended toward the sea. A thermal anomaly was detected at 0150 on 29 April.
Geologic Background. Spectacular incandescent nighttime explosions at Stromboli have long attracted visitors to the "Lighthouse of the Mediterranean" in the NE Aeolian Islands. This volcano has lent its name to the frequent mild explosive activity that has characterized its eruptions throughout much of historical time. The small island is the emergent summit of a volcano that grew in two main eruptive cycles, the last of which formed the western portion of the island. The Neostromboli eruptive period took place between about 13,000 and 5,000 years ago. The active summit vents are located at the head of the Sciara del Fuoco, a prominent scarp that formed about 5,000 years ago due to a series of slope failures which extends to below sea level. The modern volcano has been constructed within this scarp, which funnels pyroclastic ejecta and lava flows to the NW. Essentially continuous mild Strombolian explosions, sometimes accompanied by lava flows, have been recorded for more than a millennium.
Information Contacts: Istituto Nazionale di Geofisica e Vulcanologia (INGV), Sezione di Catania, Piazza Roma 2, 95123 Catania, Italy, (URL: http://www.ct.ingv.it/en/); MIROVA (Middle InfraRed Observation of Volcanic Activity), a collaborative project between the Universities of Turin and Florence (Italy) supported by the Centre for Volcanic Risk of the Italian Civil Protection Department (URL: http://www.mirovaweb.it/); Hawai'i Institute of Geophysics and Planetology (HIGP) - MODVOLC Thermal Alerts System, School of Ocean and Earth Science and Technology (SOEST), Univ. of Hawai'i, 2525 Correa Road, Honolulu, HI 96822, USA (URL: http://modis.higp.hawaii.edu/); Copernicus Browser, Copernicus Data Space Ecosystem, European Space Agency (URL: https://dataspace.copernicus.eu/browser/).
Nishinoshima (Japan) — July 2023 Cite this Report
Nishinoshima
Japan
27.247°N, 140.874°E; summit elev. 100 m
All times are local (unless otherwise noted)
Small ash plumes and fumarolic activity during November 2022 through April 2023
Nishinoshima is a small island located about 1,000 km S of Tokyo in the Ogasawara Arc in Japan. The island is the summit of a massive submarine volcano that has prominent peaks to the S, W, and NE. Eruptions date back to 1973; the most recent eruption period began in October 2022 and was characterized by ash plumes and fumarolic activity (BGVN 47:12). This report describes ash plumes and fumarolic activity during November 2022 through April 2023 based on monthly reports from the Japan Meteorological Agency (JMA) monthly reports and satellite data.
The most recent eruptive activity prior to the reporting internal occurred on 12 October 2022, when an ash plume rose 3.5 km above the crater rim. An aerial observation conducted by the Japan Coast Guard (JCG) on 25 November reported that white fumaroles rose approximately 200 m above the central crater of a pyroclastic cone (figure 119), and multiple plumes were observed on the ESE flank of the cone. Discolored water ranging from reddish-brown to brown and yellowish-green were visible around the perimeter of the island (figure 119). No significant activity was reported in December.
During an overflight conducted by JCG on 25 January 2023 intermittent activity and small, blackish-gray plumes rose 900 m above the central part of the crater were observed (figure 120). The fumarolic zone of the E flank and base of the cone had expanded and emissions had intensified. Dark brown discolored water was visible around the perimeter of the island.
No significant activity was reported during February through March. Ash plumes at 1050 and 1420 on 11 April rose 1.9 km above the crater rim and drifted NW and N. These were the first ash plumes observed since 12 October 2022. On 14 April JCG carried out an overflight and reported that no further eruptive activity was visible, although white gas-and-steam plumes were visible from the central crater and rose 900 m high (figure 121). Brownish and yellow-green discolored water surrounded the island.
Intermittent low-to-moderate power thermal anomalies were recorded in the MIROVA graph (Middle InfraRed Observation of Volcanic Activity) during November 2022 through April 2023 (figure 123). A cluster of six to eight anomalies were detected during November while a smaller number were detected during the following months: two to three during December, one during mid-January 2023, one during February, five during March, and two during April. Thermal activity was also reflected in infrared satellite data at the summit crater, accompanied by occasional gas-and-steam plumes (figure 124).
Geologic Background. The small island of Nishinoshima was enlarged when several new islands coalesced during an eruption in 1973-74. Multiple eruptions that began in 2013 completely covered the previous exposed surface and continued to enlarge the island. The island is the summit of a massive submarine volcano that has prominent peaks to the S, W, and NE. The summit of the southern cone rises to within 214 m of the ocean surface 9 km SSE.
Information Contacts: Japan Meteorological Agency (JMA), 1-3-4 Otemachi, Chiyoda-ku, Tokyo 100-8122, Japan (URL: http://www.jma.go.jp/jma/indexe.html); MIROVA (Middle InfraRed Observation of Volcanic Activity), a collaborative project between the Universities of Turin and Florence (Italy) supported by the Centre for Volcanic Risk of the Italian Civil Protection Department (URL: http://www.mirovaweb.it/); Copernicus Browser, Copernicus Data Space Ecosystem, European Space Agency (URL: https://dataspace.copernicus.eu/browser/).
Karangetang (Indonesia) — July 2023 Cite this Report
Karangetang
Indonesia
2.781°N, 125.407°E; summit elev. 1797 m
All times are local (unless otherwise noted)
Lava flows, incandescent avalanches, and ash plumes during January-June 2023
Karangetang (also known as Api Siau), at the northern end of the island of Siau, Indonesia, contains five summit craters along a N-S line. More than 40 eruptions have been recorded since 1675; recent eruptions have included frequent explosive activity, sometimes accompanied by pyroclastic flows and lahars. Lava dome growth has occurred in the summit craters and collapses of lava flow fronts have produced pyroclastic flows. The two active summit craters are Kawah Dua (the N crater) and Kawah Utama (the S crater, also referred to as the “Main Crater”). The most recent eruption began in late November 2018 and has more recently consisted of weak thermal activity and gas-and-steam emissions (BGVN 48:01). This report updates activity characterized by lava flows, incandescent avalanches, and ash plumes during January through June 2023 using reports from Pusat Vulkanologi dan Mitigasi Bencana Geologi (PVMBG, also known as CVGHM, or the Center of Volcanology and Geological Hazard Mitigation), MAGMA Indonesia, the Darwin VAAC (Volcano Ash Advisory Center), and satellite data.
Activity during January was relatively low and mainly consisted of white gas-and-steam emissions that rose 25-150 m above Main Crater (S crater) and drifted in different directions. Incandescence was visible from the lava dome in Kawah Dua (the N crater). Weather conditions often prevented clear views of the summit. On 18 January the number of seismic signals that indicated avalanches of material began to increase. In addition, there were a total of 71 earthquakes detected during the month.
Activity continued to increase during the first week of February. Material from Main Crater traveled as far as 800 m down the Batuawang (S) and Batang (W) drainages and as far as 1 km W down the Beha (W) drainage on 4 February. On 6 February 43 earthquake events were recorded, and on 7 February, 62 events were recorded. White gas-and-steam emissions rose 25-250 m above both summit craters throughout the month. PVMBG reported an eruption began during the evening of 8 February around 1700. Photos showed incandescent material at Main Crater. Incandescent material had also descended the flank in at least two unconfirmed directions as far as 2 km from Main Crater, accompanied by ash plumes (figure 60). As a result, PVMBG increased the Volcano Alert Level (VAL) to 3 (the second highest level on a 1-4 scale).
Occasional nighttime webcam images showed three main incandescent lava flows of differing lengths traveling down the S, SW, and W flanks (figure 61). Incandescent rocks were visible on the upper flanks, possibly from ejected or collapsed material from the crater, and incandescence was the most intense at the summit. Based on analyses of satellite imagery and weather models, the Darwin VAAC reported that daily ash plumes during 16-20 February rose to 2.1-3 km altitude and drifted NNE, E, and SE. BNPB reported on 16 February that as many as 77 people were evacuated and relocated to the East Siau Museum. A webcam image taken at 2156 on 17 February possibly showed incandescent material descending the SE flank. Ash plumes rose to 2.1 km altitude and drifted SE during 22-23 February, according to the Darwin VAAC.
Incandescent avalanches of material and summit incandescence at Main Crater continued during March. White gas-and-steam emissions during March generally rose 25-150 m above the summit crater; on 31 March gas-and-steam emissions rose 200-400 m high. An ash plume rose to 2.4 km altitude and drifted S at 1710 on 9 March and a large thermal anomaly was visible in images taken at 0550 and 0930 on 10 March. Incandescent material was visible at the summit and on the flanks based on webcam images taken at 0007 and 2345 on 16 March, at 1828 on 17 March, at 1940 on 18 March, at 2311 on 19 March, and at 2351 on 20 March. Incandescence was most intense on 18 and 20 March and webcam images showed possible Strombolian explosions (figure 62). An ash plume rose to 2.4 km altitude and drifted SW on 18 March, accompanied by a thermal anomaly.
Summit crater incandescence at Main Crater and on the flanks persisted during April. Incandescent material at the S crater and on the flanks was reported at 0016 on 1 April. The lava flows had stopped by 1 April according to PVMBG, although incandescence was still visible up to 10 m high. Seismic signals indicating effusion decreased and by 6 April they were no longer detected. Incandescence was visible from both summit craters. On 26 April the VAL was lowered to 2 (the second lowest level on a 1-4 scale). White gas-and-steam emissions rose 25-200 m above the summit crater.
During May white gas-and-steam emissions generally rose 50-250 m above the summit, though it was often cloudy, which prevented clear views; on 21 May gas-and-steam emissions rose 50-400 m high. Nighttime N summit crater incandescence rose 10-25 m above the lava dome, and less intense incandescence was noted above Main Crater, which reached about 10 m above the dome. Sounds of falling rocks at Main Crater were heard on 15 May and the seismic network recorded 32 rockfall events in the crater on 17 May. Avalanches traveled as far as 1.5 km down the SW and S flanks, accompanied by rumbling sounds on 18 May. Incandescent material descending the flanks was captured in a webcam image at 2025 on 19 May (figure 63) and on 29 May; summit crater incandescence was observed in webcam images at 2332 on 26 May and at 2304 on 29 May. On 19 May the VAL was again raised to 3.
Occasional Main Crater incandescence was reported during June, as well as incandescent material on the flanks. White gas-and-steam emissions rose 10-200 m above the summit crater. Ash plumes rose to 2.1 km altitude and drifted SE and E during 2-4 June, according to the Darwin VAAC. Material on the flanks of Main Crater were observed at 2225 on 7 June, at 2051 on 9 June, at 0007 on 17 June, and at 0440 on 18 June. Webcam images taken on 21, 25, and 27 June showed incandescence at Main Crater and from material on the flanks.
MIROVA (Middle InfraRed Observation of Volcanic Activity) analysis of MODIS satellite data showed strong thermal activity during mid-February through March and mid-May through June, which represented incandescent avalanches and lava flows (figure 64). During April through mid-May the power of the anomalies decreased but frequent anomalies were still detected. Brief gaps in activity occurred during late March through early April and during mid-June. Infrared satellite images showed strong lava flows mainly affecting the SW and S flanks, accompanied by gas-and-steam emissions (figure 65). According to data recorded by the MODVOLC thermal algorithm, there were a total of 79 thermal hotspots detected: 28 during February, 24 during March, one during April, five during May, and 21 during June.
Geologic Background. Karangetang (Api Siau) volcano lies at the northern end of the island of Siau, about 125 km NNE of the NE-most point of Sulawesi. The stratovolcano contains five summit craters along a N-S line. It is one of Indonesia's most active volcanoes, with more than 40 eruptions recorded since 1675 and many additional small eruptions that were not documented (Neumann van Padang, 1951). Twentieth-century eruptions have included frequent explosive activity sometimes accompanied by pyroclastic flows and lahars. Lava dome growth has occurred in the summit craters; collapse of lava flow fronts have produced pyroclastic flows.
Information Contacts: Pusat Vulkanologi dan Mitigasi Bencana Geologi (PVMBG, also known as Indonesian Center for Volcanology and Geological Hazard Mitigation, CVGHM), Jalan Diponegoro 57, Bandung 40122, Indonesia (URL: http://www.vsi.esdm.go.id/); MAGMA Indonesia, Kementerian Energi dan Sumber Daya Mineral (URL: https://magma.esdm.go.id/v1); Badan Nasional Penanggulangan Bencana (BNPB), National Disaster Management Agency, Graha BNPB - Jl. Scout Kav.38, East Jakarta 13120, Indonesia (URL: http://www.bnpb.go.id/); Darwin Volcanic Ash Advisory Centre (VAAC), Bureau of Meteorology, Northern Territory Regional Office, PO Box 40050, Casuarina, NT 0811, Australia (URL: http://www.bom.gov.au/info/vaac/); MIROVA (Middle InfraRed Observation of Volcanic Activity), a collaborative project between the Universities of Turin and Florence (Italy) supported by the Centre for Volcanic Risk of the Italian Civil Protection Department (URL: http://www.mirovaweb.it/); Hawai'i Institute of Geophysics and Planetology (HIGP) - MODVOLC Thermal Alerts System, School of Ocean and Earth Science and Technology (SOEST), Univ. of Hawai'i, 2525 Correa Road, Honolulu, HI 96822, USA (URL: http://modis.higp.hawaii.edu/); Copernicus Browser, Copernicus Data Space Ecosystem, European Space Agency (URL: https://dataspace.copernicus.eu/browser/); IDN Times, Jl. Jend. Gatot Subroto Kav. 27 3rd Floor Kuningan, Jakarta, Indonesia 12950, Status of Karangetang Volcano in Sitaro Islands Increases (URL: https://sulsel.idntimes.com/news/indonesia/savi/status-gunung-api-karangetang-di-kepulauan-sitaro-meningkat?page=all).
Ahyi (United States) — July 2023 Cite this Report
Ahyi
United States
20.42°N, 145.03°E; summit elev. -75 m
All times are local (unless otherwise noted)
Intermittent hydroacoustic signals and discolored plumes during November 2022-June 2023
Ahyi seamount is a large, conical submarine volcano that rises to within 75 m of the ocean surface about 18 km SE of the island of Farallon de Pajaros in the Northern Marianas. The remote location of the seamount has made eruptions difficult to document, but seismic stations installed in the region confirmed an eruption in the vicinity in 2001. No new activity was detected until April-May 2014 when an eruption was detected by NOAA (National Oceanic and Atmospheric Administration) divers, hydroacoustic sensors, and seismic stations (BGVN 42:04). New activity was first detected on 15 November by hydroacoustic sensors that were consistent with submarine volcanic activity. This report covers activity during November 2022 through June 2023 based on daily and weekly reports from the US Geological Survey.
Starting in mid-October, hydroacoustic sensors at Wake Island (2.2 km E) recorded signals consistent with submarine volcanic activity, according to a report from the USGS issued on 15 November 2022. A combined analysis of the hydroacoustic signals and seismic stations located at Guam and Chichijima Island, Japan, suggested that the source of this activity was at or near the Ahyi seamount. After a re-analysis of a satellite image of the area that was captured on 6 November, USGS confirmed that there was no evidence of discoloration at the ocean surface. Few hydroacoustic and seismic signals continued through November, including on 18 November, which USGS suggested signified a decline or pause in unrest. A VONA (Volcano Observatory Notice for Aviation) reported that a discolored water plume was persistently visible in satellite data starting on 18 November (figure 6). Though clouds often obscured clear views of the volcano, another discolored water plume was captured in a satellite image on 26 November. The Aviation Color Code (ACC) was raised to Yellow (the second lowest level on a four-color scale) and the Volcano Alert Level (VAL) was raised to Advisory (the second lowest level on a four-level scale) on 29 November.
During December, occasional detections were recorded on the Wake Island hydrophone sensors and discolored water over the seamount remained visible. During 2-7, 10-12, and 16-31 December possible explosion signals were detected. A small area of discolored water was observed in high-resolution Sentinel-2 satellite images during 1-6 December (figure 7). High-resolution satellite images recorded discolored water plumes on 13 December that originated from the summit region; no observations indicated that activity breached the ocean surface. A possible underwater plume was visible in satellite images on 18 December, and during 19-20 December a definite but diffuse underwater plume located SSE from the main vent was reported. An underwater plume was visible in a satellite image taken on 26 December (figure 7).
Hydrophone sensors continued to detect signals consistent with possible explosions during 1-8 January 2023. USGS reported that the number of detections decreased during 4-5 January. The hydrophone sensors experienced a data outage that started at 0118 on 8 January and continued through 10 January, though according to USGS, possible explosions were recorded prior to the data outage and likely continued during the outage. A discolored water plume originating from the summit region was detected in a partly cloudy satellite image on 8 January. On 11-12 and 15-17 January possible explosion signals were recorded again. One small signal was detected during 22-23 January and several signals were recorded on 25 and 31 January. During 27-31 January a plume of discolored water was observed above the seamount in satellite imagery (figure 8).
Low levels of activity continued during February and March, based on data from pressure sensors on Wake Island. During 1 and 4-6 February activity was reported, and a submarine plume was observed on 4 February (figure 8). Possible explosion signals were detected during 7-8, 10, 13-14, and 24 February. During 1-2 and 3-5 March a plume of discolored water was observed in satellite imagery (figure 8). Almost continuous hydroacoustic signals were detected in remote pressure sensor data on Wake Island 2,270 km E from the volcano during 7-13 March. During 12-13 March water discoloration around the seamount was observed in satellite imagery, despite cloudy weather. By 14 March discolored water extended about 35 km, but no direction was noted. USGS reported that the continuous hydroacoustic signals detected during 13-14 March stopped abruptly on 14 March and no new detections were observed. Three 30 second hydroacoustic detections were reported during 17-19 March, but no activity was visible due to cloudy weather. A data outage was reported during 21-22 March, making pressure sensor data unavailable; a discolored water plume was, however, visible in satellite data. A possible underwater explosion signal was detected by pressure sensors at Wake Island on 26, 29, and 31 March, though the cause and origin of these events were unclear.
Similar low activity continued during April, May, and June. Several signals were detected during 1-3 April in pressure sensors at Wake Island. USGS suggested that these may be related to underwater explosions or earthquakes at the volcano, but no underwater plumes were visible in clear satellite images. The pressure sensors had data outages during 12-13 April and no data were recorded; no underwater plumes were visible in satellite images, although cloudy weather obscured most clear views. Eruptive activity was reported starting at 2210 on 21 May. On 22 May a discolored water plume that extended 4 km was visible in satellite images, though no direction was recorded. During 23-24 May some signals were detected by the underwater pressure sensors. Possible hydroacoustic signals were detected during 2-3 and 6-8 June. Multiple hydroacoustic signals were detected during 9-11 and 16-17 June, although no activity was visible in satellite images. One hydroacoustic signal was detected during 23-24 June, but there was some uncertainty about its association with volcanic activity. A single possible hydroacoustic signal was detected during 30 June to 1 July.
Geologic Background. Ahyi seamount is a large conical submarine volcano that rises to within 75 m of the ocean surface ~18 km SE of the island of Farallon de Pajaros in the northern Marianas. Water discoloration has been observed there, and in 1979 the crew of a fishing boat felt shocks over the summit area, followed by upwelling of sulfur-bearing water. On 24-25 April 2001 an explosive eruption was detected seismically by a station on Rangiroa Atoll, Tuamotu Archipelago. The event was well constrained (+/- 15 km) at a location near the southern base of Ahyi. An eruption in April-May 2014 was detected by NOAA divers, hydroacoustic sensors, and seismic stations.
Information Contacts: US Geological Survey, Volcano Hazards Program (USGS-VHP), 12201 Sunrise Valley Drive, Reston, VA, USA, https://volcanoes.usgs.gov/index.html; Copernicus Browser, Copernicus Data Space Ecosystem, European Space Agency (URL: https://dataspace.copernicus.eu/browser/).
Kadovar (Papua New Guinea) — June 2023 Cite this Report
Kadovar
Papua New Guinea
3.608°S, 144.588°E; summit elev. 365 m
All times are local (unless otherwise noted)
An ash plume and weak thermal anomaly during May 2023
Kadovar is a 2-km-wide island that is the emergent summit of a Bismarck Sea stratovolcano. It lies off the coast of New Guinea, about 25 km N of the mouth of the Sepik River. Prior to an eruption that began in 2018, a lava dome formed the high point of the volcano, filling an arcuate landslide scarp open to the S. Submarine debris-avalanche deposits occur to the S of the island. The current eruption began in January 2018 and has comprised lava effusion from vents at the summit and at the E coast; more recent activity has consisted of ash plumes, weak thermal activity, and gas-and-steam plumes (BGVN 48:02). This report covers activity during February through May 2023 using information from the Darwin Volcanic Ash Advisory Center (VAAC) and satellite data.
Activity during the reporting period was relatively low and mainly consisted of white gas-and-steam plumes that were visible in natural color satellite images on clear weather days (figure 67). According to a Darwin VAAC report, at 2040 on 6 May an ash plume rose to 4.6 km altitude and drifted W; by 2300 the plume had dissipated. MODIS satellite instruments using the MODVOLC thermal algorithm detected a single thermal hotspot on the SE side of the island on 7 May. Weak thermal activity was also detected in a satellite image on the E side of the island on 14 May, accompanied by a white gas-and-steam plume that drifted SE (figure 68).
Geologic Background. The 2-km-wide island of Kadovar is the emergent summit of a Bismarck Sea stratovolcano of Holocene age. It is part of the Schouten Islands, and lies off the coast of New Guinea, about 25 km N of the mouth of the Sepik River. Prior to an eruption that began in 2018, a lava dome formed the high point of the andesitic volcano, filling an arcuate landslide scarp open to the south; submarine debris-avalanche deposits occur in that direction. Thick lava flows with columnar jointing forms low cliffs along the coast. The youthful island lacks fringing or offshore reefs. A period of heightened thermal phenomena took place in 1976. An eruption began in January 2018 that included lava effusion from vents at the summit and at the E coast.
Information Contacts: Darwin Volcanic Ash Advisory Centre (VAAC), Bureau of Meteorology, Northern Territory Regional Office, PO Box 40050, Casuarina, NT 0811, Australia (URL: http://www.bom.gov.au/info/vaac/); Hawai'i Institute of Geophysics and Planetology (HIGP) - MODVOLC Thermal Alerts System, School of Ocean and Earth Science and Technology (SOEST), Univ. of Hawai'i, 2525 Correa Road, Honolulu, HI 96822, USA (URL: http://modis.higp.hawaii.edu/); Copernicus Browser, Copernicus Data Space Ecosystem, European Space Agency (URL: https://dataspace.copernicus.eu/browser/).
San Miguel (El Salvador) — June 2023 Cite this Report
San Miguel
El Salvador
13.434°N, 88.269°W; summit elev. 2130 m
All times are local (unless otherwise noted)
Small gas-and-ash explosions during March and May 2023
San Miguel in El Salvador is a broad, deep crater complex that has been frequently modified by eruptions recorded since the early 16th century and consists of the summit known locally as Chaparrastique. Flank eruptions have produced lava flows that extended to the N, NE, and SE during the 17-19th centuries. The most recent activity has consisted of minor ash eruptions from the summit crater. The current eruption period began in November 2022 and has been characterized by frequent phreatic explosions, gas-and-ash emissions, and sulfur dioxide plumes (BGVN 47:12). This report describes small gas-and-ash explosions during December 2022 through May 2023 based on special reports from the Ministero de Medio Ambiente y Recursos Naturales (MARN).
Activity has been relatively low since the last recorded explosions on 29 November 2022. Seismicity recorded by the San Miguel Volcano Station (VSM) located on the N flank at 1.7 km elevation had decreased by 7 December. Sulfur dioxide gas measurements taken with DOAS (Differential Optical Absorption Spectroscopy) mobile equipment were below typical previously recorded values: 300 tons per day (t/d). During December, small explosions were recorded by the seismic network and manifested as gas-and-steam emissions.
Gas-and-ash explosions in the crater occurred during January 2023, which were recorded by the seismic network. Sulfur dioxide values remained low, between 300-400 t/d through 10 March. At 0817 on 14 January a gas-and-ash emission was visible in webcam images, rising just above the crater rim. Some mornings during February, small gas-and-steam plumes were visible in the crater. On 7 March at 2252 MARN noted an increase in degassing from the central crater; gas emissions were constantly observed through the early morning hours on 8 March. During the early morning of 8 March through the afternoon on 9 March, 12 emissions were registered, some accompanied by ash. The last gas-and-ash emission was recorded at 1210 on 9 March; very fine ashfall was reported in El Tránsito (10 km S), La Morita (6 km W), and La Piedrita (3 km W). The smell of sulfur was reported in Piedra Azul (5 km SW). On 16 March MARN reported that gas-and-steam emissions decreased.
Low degassing and very low seismicity were reported during April; no explosions have been detected between 9 March and 27 May. The sulfur dioxide emissions remained between 350-400 t/d; during 13-20 April sulfur dioxide values fluctuated between 30-300 t/d. Activity remained low through most of May; on 23 May seismicity increased. An explosion was detected at 1647 on 27 May generated a gas-and-ash plume that rose 700 m high (figure 32); a decrease in seismicity and gas emissions followed. The DOAS station installed on the W flank recorded sulfur dioxide values that reached 400 t/d on 27 May; subsequent measurements showed a decrease to 268 t/d on 28 May and 100 t/d on 29 May.
Geologic Background. The symmetrical cone of San Miguel, one of the most active volcanoes in El Salvador, rises from near sea level to form one of the country's most prominent landmarks. A broad, deep, crater complex that has been frequently modified by eruptions recorded since the early 16th century caps the truncated unvegetated summit, also known locally as Chaparrastique. Flanks eruptions of the basaltic-andesitic volcano have produced many lava flows, including several during the 17th-19th centuries that extended to the N, NE, and SE. The SE-flank flows are the largest and form broad, sparsely vegetated lava fields crossed by highways and a railroad skirting the base of the volcano. Flank vent locations have migrated higher on the edifice during historical time, and the most recent activity has consisted of minor ash eruptions from the summit crater.
Information Contacts: Ministero de Medio Ambiente y Recursos Naturales (MARN), Km. 5½ Carretera a Nueva San Salvador, Avenida las Mercedes, San Salvador, El Salvador (URL: http://www.snet.gob.sv/ver/vulcanologia).
Semisopochnoi (United States) — June 2023 Cite this Report
Semisopochnoi
United States
51.93°N, 179.58°E; summit elev. 1221 m
All times are local (unless otherwise noted)
Occasional explosions, ash deposits, and gas-and-steam plumes during December 2022-May 2023
Semisopochnoi is located in the western Aleutians, is 20-km-wide at sea level, and contains an 8-km-wide caldera. The three-peaked Mount Young (formerly Cerberus) was constructed within the caldera during the Holocene. Each of these peaks contains a summit crater; the lava flows on the N flank appear younger than those on the S side. The current eruption period began in early February 2021 and has more recently consisted of intermittent explosions and ash emissions (BGVN 47:12). This report updates activity during December 2022 through May 2023 using daily, weekly, and special reports from the Alaska Volcano Observatory (AVO). AVO monitors the volcano using local seismic and infrasound sensors, satellite data, web cameras, and remote infrasound and lightning networks.
Activity during most of December 2022 was relatively quiet; according to AVO no eruptive or explosive activity was observed since 7 November 2022. Intermittent tremor and occasional small earthquakes were observed in geophysical data. Continuous gas-and-steam emissions were observed from the N crater of Mount Young in webcam images on clear weather days (figure 25). On 24 December, there was a slight increase in earthquake activity and several small possible explosion signals were detected in infrasound data. Eruptive activity resumed on 27 December at the N crater of Mount Young; AVO issued a Volcano Activity Notice (VAN) that reported minor ash deposits on the flanks of Mount Young that extended as far as 1 km from the vent, according to webcam images taken during 27-28 December (figure 26). No ash plumes were observed in webcam or satellite imagery, but a persistent gas-and-steam plume that might have contained some ash rose to 1.5 km altitude. As a result, AVO raised the Aviation Color Code (ACC) to Orange (the second highest level on a four-color scale) and the Volcano Alert Level (VAL) to Watch (the second highest level on a four-level scale). Possible explosions were detected during 21 December 2022 through 1 January 2023 and seismic tremor was recorded during 30-31 December.
During January 2023 eruptive activity continued at the active N crater of Mount Young. Minor ash deposits were observed on the flanks, extending about 2 km SSW, based on webcam images from 1 and 3 January. A possible explosion occurred during 1-2 January based on elevated seismicity recorded on local seismometers and an infrasound signal recorded minutes later by an array at Adak. Though no ash plumes were observed in webcam or satellite imagery, a persistent gas-and-steam plume rose to 1.5 km altitude that might have carried minor traces of ash. Ash deposits were accompanied by periods of elevated seismicity and infrasound signals from the local geophysical network, which AVO reported were likely due to weak explosive activity. Low-level explosive activity was also detected during 2-3 January, with minor gas-and-steam emissions and a new ash deposit that was visible in webcam images. Low-level explosive activity was detected in geophysical data during 4-5 January, with elevated seismicity and infrasound signals observed on local stations. Volcanic tremor was detected during 7-9 January and very weak explosive activity was detected in seismic and infrasound data on 9 January. Weak seismic and infrasound signals were recorded on 17 January, which indicated minor explosive activity, but no ash emissions were observed in clear webcam images; a gas-and-steam plume continued to rise to 1.5 km altitude. During 29-30 January, ash deposits near the summit were observed on fresh snow, according to webcam images.
The active N cone at Mount Young continued to produce a gas-and-steam plume during February, but no ash emissions or explosive events were detected. Seismicity remained elevated with faint tremor during early February. Gas-and-steam emissions from the N crater were observed in clear webcam images on 11-13 and 16 February; no explosive activity was detected in seismic, infrasound, or satellite data. Seismicity has also decreased, with no significant seismic tremor observed since 25 January. Therefore, the ACC was lowered to Yellow (the second lowest level on a four-color scale) and the VAL was lowered to Advisory (the second lowest level on a four-color scale) on 22 February.
Gas-and-steam emissions persisted during March from the N cone of Mount Young, based on clear webcam images. A few brief episodes of weak tremor were detected in seismic data, although seismicity decreased over the month. A gas-and-steam plume detected in satellite data extended 150 km on 18 March. Low-level ash emissions from the N cone at Mount Young were observed in several webcam images during 18-19 March, in addition to small explosions and volcanic tremor. The ACC was raised to Orange and the VAL increased to Watch on 19 March. A small explosion was detected in seismic and infrasound data on 21 March.
Low-level unrest continued during April, although cloudy weather often obscured views of the summit; periods of seismic tremor and local earthquakes were recorded. During 3-4 April a gas-and-steam plume was visible traveling more than 200 km overnight; no ash was evident in the plume, according to AVO. A gas-and-steam plume was observed during 4-6 April that extended 400 km but did not seem to contain ash. Small explosions were detected in seismic and infrasound data on 5 April. Occasional clear webcam images showed continuing gas-and-steam emissions rose from Mount Young, but no ash deposits were observed on the snow. On 19 April small explosions and tremor were detected in seismic and infrasound data. A period of seismic tremor was detected during 22-25 April, with possible weak explosions on 25 April. Ash deposits were visible near the crater rim, but it was unclear if these deposits were recent or due to older deposits.
Occasional small earthquakes were recorded during May, but there were no signs of explosive activity seen in geophysical data. Gas-and-steam emissions continued from the N crater of Mount Young, based on webcam images, and seismicity remained slightly elevated. A new, light ash deposit was visible during the morning of 5 May on fresh snow on the NW flank of Mount Young. During 10 May periods of volcanic tremor were observed. The ACC was lowered to Yellow and the VAL to Advisory on 17 May due to no additional evidence of activity.
Geologic Background. Semisopochnoi, the largest subaerial volcano of the western Aleutians, is 20 km wide at sea level and contains an 8-km-wide caldera. It formed as a result of collapse of a low-angle, dominantly basaltic volcano following the eruption of a large volume of dacitic pumice. The high point of the island is Anvil Peak, a double-peaked late-Pleistocene cone that forms much of the island's northern part. The three-peaked Mount Cerberus (renamed Mount Young in 2023) was constructed within the caldera during the Holocene. Each of the peaks contains a summit crater; lava flows on the N flank appear younger than those on the south side. Other post-caldera volcanoes include the symmetrical Sugarloaf Peak SSE of the caldera and Lakeshore Cone, a small cinder cone at the edge of Fenner Lake in the NE part of the caldera. Most documented eruptions have originated from Young, although Coats (1950) considered that both Sugarloaf and Lakeshore Cone could have been recently active.
Information Contacts: Alaska Volcano Observatory (AVO), a cooperative program of a) U.S. Geological Survey, 4200 University Drive, Anchorage, AK 99508-4667 USA (URL: https://avo.alaska.edu/), b) Geophysical Institute, University of Alaska, PO Box 757320, Fairbanks, AK 99775-7320, USA, and c) Alaska Division of Geological & Geophysical Surveys, 794 University Ave., Suite 200, Fairbanks, AK 99709, USA (URL: http://dggs.alaska.gov/).
Ebeko
Russia
50.686°N, 156.014°E; summit elev. 1103 m
All times are local (unless otherwise noted)
Continued explosions, ash plumes, and ashfall during October 2022-May 2023
Ebeko, located on the N end of Paramushir Island in the Kuril Islands, consists of three summit craters along a SSW-NNE line at the northern end of a complex of five volcanic cones. Eruptions date back to the late 18th century and have been characterized as small-to-moderate explosions from the summit crater, accompanied by intense fumarolic activity. The current eruption period began in June 2022 and has recently consisted of frequent explosions, ash plumes, and thermal activity (BGVN 47:10). This report covers similar activity during October 2022 through May 2023, based on information from the Kamchatka Volcanic Eruptions Response Team (KVERT) and satellite data.
Activity during October consisted of explosive activity, ash plumes, and occasional thermal anomalies. Visual data by volcanologists from Severo-Kurilsk showed explosions producing ash clouds up to 2.1-3 km altitude which drifted E, N, NE, and SE during 1-8, 10, 16, and 18 October. KVERT issued several Volcano Observatory Notices for Aviation (VONA) on 7, 13-15, and 27 October 2022, stating that explosions generated ash plumes that rose to 2.3-4 km altitude and drifted 5 km E, NE, and SE. Ashfall was reported in Severo-Kurilsk (Paramushir Island, about 7 km E) on 7 and 13 October. Satellite data showed a thermal anomaly over the volcano on 15-16 October. Visual data showed ash plumes rising to 2.5-3.6 km altitude on 22, 25-29, and 31 October and moving NE due to constant explosions.
Similar activity continued during November, with explosions, ash plumes, and ashfall occurring. KVERT issued VONAs on 1-2, 4, 6-7, 9, 13, and 16 November that reported explosions and resulting ash plumes that rose to 1.7-3.6 km altitude and drifted 3-5 km SE, ESE, E, and NE. On 1 November ash plumes extended as far as 110 km SE. On 5, 8, 12, and 24-25 November explosions and ash plumes rose to 2-3.1 km altitude and drifted N and E. Ashfall was observed in Severo-Kurilsk on 7 and 16 November. A thermal anomaly was visible during 1-4, 16, and 20 November. Explosions during 26 November rose as high as 2.7 km altitude and drifted NE (figure 45).
Explosions and ash plumes continued to occur in December. During 1-2 and 4 December volcanologists from Severo-Kurilsk observed explosions that sent ash to 1.9-2.5 km altitude and drifted NE and SE (figure 46). VONAs were issued on 5, 9, and 16 December reporting that explosions generated ash plumes rising to 1.9 km, 2.6 km, and 2.4 km altitude and drifted 5 km SE, E, and NE, respectively. A thermal anomaly was visible in satellite imagery on 16 December. On 18 and 27-28 December explosions produced ash plumes that rose to 2.5 km altitude and drifted NE and SE. On 31 December an ash plume rose to 2 km altitude and drifted NE.
Explosions continued during January 2023, based on visual observations by volcanologists from Severo-Kurilsk. During 1-7 January explosions generated ash plumes that rose to 4 km altitude and drifted NE, E, W, and SE. According to VONAs issued by KVERT on 2, 4, 10, and 23 January, explosions produced ash plumes that rose to 2-4 km altitude and drifted 5 km N, NE, E, and ENE; the ash plume that rose to 4 km altitude occurred on 10 January (figure 47). Satellite data showed a thermal anomaly during 3-4, 10, 13, 16, 21, 22, and 31 January. KVERT reported that an ash cloud on 4 January moved 12 km NE. On 6 and 9-11 January explosions sent ash plumes to 4.5 km altitude and drifted W and ESE. On 13 January an ash plume rose to 3 km altitude and drifted SE. During 20-24 January ash plumes from explosions rose to 3.7 km altitude and drifted SE, N, and NE. On 21 January the ash plume drifted as far as 40 km NE. During 28-29 and 31 January and 1 February ash plumes rose to 4 km altitude and drifted NE.
During February, explosions, ash plumes, and ashfall were reported. During 1, 4-5 and 7-8 February explosions generated ash plumes that rose to 4.5 km altitude and drifted E and NE; ashfall was observed on 5 and 8 February. On 6 February an explosion produced an ash plume that rose to 3 km altitude and drifted 7 km E, causing ashfall in Severo-Kurilsk. A thermal anomaly was visible in satellite data on 8, 9, 13, and 21 February. Explosions on 9 and 12-13 February produced ash plumes that rose to 4 km altitude and drifted E and NE; the ash cloud on 12 February extended as far as 45 km E. On 22 February explosions sent ash to 3 km altitude that drifted E. During 24 and 26-27 February ash plumes rose to 4 km altitude and drifted E. On 28 February an explosion sent ash to 2.5-3 km altitude and drifted 5 km E; ashfall was observed in Severo-Kurilsk.
Activity continued during March; visual observations showed that explosions generated ash plumes that rose to 3.6 km altitude on 3, 5-7, and 9-12 March and drifted E, NE, and NW. Thermal anomalies were visible on 10, 13, and 29-30 March in satellite imagery. On 18, 21-23, 26, and 29-30 March explosions produced ash plumes that rose to 2.8 km altitude and drifted NE and E; the ash plumes during 22-23 March extended up to 76 km E. A VONA issued on 21 March reported an explosion that produced an ash plume that rose to 2.8 km altitude and drifted 5 km E. Another VONA issued on 23 March reported that satellite data showed an ash plume rising to 3 km altitude and drifted 14 km E.
Explosions during April continued to generate ash plumes. On 1 and 4 April an ash plume rose to 2.8-3.5 km altitude and drifted SE and NE. A thermal anomaly was visible in satellite imagery during 1-6 April. Satellite data showed ash plumes and clouds rising to 2-3 km altitude and drifting up to 12 km SW and E on 3 and 6 April (figure 48). KVERT issued VONAs on 3, 5, 14, 16 April describing explosions that produced ash plumes rising to 3 km, 3.5 km, 3.5 km, and 3 km altitude and drifting 5 km S, 5 km NE and SE, 72 km NNE, and 5 km NE, respectively. According to satellite data, the resulting ash cloud from the explosion on 14 April was 25 x 7 km in size and drifted 72-104 km NNE during 14-15 April. According to visual data by volcanologists from Severo-Kurilsk explosions sent ash up to 3.5 km altitude that drifted NE and E during 15-16, 22, 25-26, and 29 April.
The explosive eruption continued during May. Explosions during 3-4, 6-7, and 9-10 May generated ash plumes that rose to 4 km altitude and drifted SW and E. Satellite data showed a thermal anomaly on 3, 9, 13-14, and 24 May. During 12-16, 23-25, and 27-28 May ash plumes rose to 3.5 km altitude and drifted in different directions due to explosions. Two VONA notices were issued on 16 and 25 May, describing explosions that generated ash plumes rising to 3 km and 3.5 km altitude, respectively and extending 5 km E. The ash cloud on 25 May drifted 75 km SE.
Thermal activity in the summit crater, occasionally accompanied by ash plumes and ash deposits on the SE and E flanks due to frequent explosions, were visible in infrared and true color satellite images (figure 49).
Geologic Background. The flat-topped summit of the central cone of Ebeko volcano, one of the most active in the Kuril Islands, occupies the northern end of Paramushir Island. Three summit craters located along a SSW-NNE line form Ebeko volcano proper, at the northern end of a complex of five volcanic cones. Blocky lava flows extend west from Ebeko and SE from the neighboring Nezametnyi cone. The eastern part of the southern crater contains strong solfataras and a large boiling spring. The central crater is filled by a lake about 20 m deep whose shores are lined with steaming solfataras; the northern crater lies across a narrow, low barrier from the central crater and contains a small, cold crescentic lake. Historical activity, recorded since the late-18th century, has been restricted to small-to-moderate explosive eruptions from the summit craters. Intense fumarolic activity occurs in the summit craters, on the outer flanks of the cone, and in lateral explosion craters.
Information Contacts: Kamchatka Volcanic Eruptions Response Team (KVERT), Far Eastern Branch, Russian Academy of Sciences, 9 Piip Blvd., Petropavlovsk-Kamchatsky, 683006, Russia (URL: http://www.kscnet.ru/ivs/kvert/); MIROVA (Middle InfraRed Observation of Volcanic Activity), a collaborative project between the Universities of Turin and Florence (Italy) supported by the Centre for Volcanic Risk of the Italian Civil Protection Department (URL: http://www.mirovaweb.it/); Copernicus Browser, Copernicus Data Space Ecosystem, European Space Agency (URL: https://dataspace.copernicus.eu/browser/).
Home Reef
Tonga
18.992°S, 174.775°W; summit elev. -10 m
All times are local (unless otherwise noted)
Discolored plumes continued during November 2022-April 2023
Home Reef is a submarine volcano located in the central Tonga islands between Lateiki (Metis Shoal) and Late Island. The first recorded eruption occurred in the mid-19th century, when an ephemeral island formed. An eruption in 1984 produced a 12-km-high eruption plume, a large volume of floating pumice, and an ephemeral island 500 x 1,500 m wide, with cliffs 30-50 m high that enclosed a water-filled crater. Another island-forming eruption in 2006 produced widespread pumice rafts that drifted as far as Australia; by 2008 the island had eroded below sea level. The previous eruption occurred during October 2022 and was characterized by a new island-forming eruption, lava effusion, ash plumes, discolored water, and gas-and-steam plumes (BGVN 47:11). This report covers discolored water plumes during November 2022 through April 2023 using satellite data.
Discolored plumes continued during the reporting period and were observed in true color satellite images on clear weather days. Satellite images show light green-yellow discolored water extending W on 8 and 28 November 2022 (figure 31), and SW on 18 November. Light green-yellow plumes extended W on 3 December, S on 13 December, SW on 18 December, and W and S on 23 December (figure 31). On 12 January 2023 discolored green-yellow plumes extended to the NE, E, SE, and N. The plume moved SE on 17 January and NW on 22 January. Faint discolored water in February was visible moving NE on 1 February. A discolored plume extended NW on 8 and 28 March and NW on 13 March (figure 31). During April, clear weather showed green-blue discolored plumes moving S on 2 April, W on 7 April, and NE and S on 12 April. A strong green-yellow discolored plume extended E and NE on 22 April for several kilometers (figure 31).
Geologic Background. Home Reef, a submarine volcano midway between Metis Shoal and Late Island in the central Tonga islands, was first reported active in the mid-19th century, when an ephemeral island formed. An eruption in 1984 produced a 12-km-high eruption plume, large amounts of floating pumice, and an ephemeral 500 x 1,500 m island, with cliffs 30-50 m high that enclosed a water-filled crater. In 2006 an island-forming eruption produced widespread dacitic pumice rafts that drifted as far as Australia. Another island was built during a September-October 2022 eruption.
Information Contacts: Copernicus Browser, Copernicus Data Space Ecosystem, European Space Agency (URL: https://dataspace.copernicus.eu/browser/).
Ambae
Vanuatu
15.389°S, 167.835°E; summit elev. 1496 m
All times are local (unless otherwise noted)
New lava flow, ash plumes, and sulfur dioxide plumes during February-May 2023
Ambae, also known as Aoba, is a large basaltic shield volcano in Vanuatu. A broad pyroclastic cone containing three crater lakes (Manaro Ngoru, Voui, and Manaro Lakua) is located at the summit within the youngest of at least two nested calderas. Periodic phreatic and pyroclastic explosions have been reported since the 16th century. A large eruption more than 400 years ago resulted in a volcanic cone within the summit crater that is now filled by Lake Voui; the similarly sized Lake Manaro fills the western third of the caldera. The previous eruption ended in August 2022 that was characterized by gas-and-steam and ash emissions and explosions of wet tephra (BGVN 47:10). This report covers a new eruption during February through May 2023 that consisted of a new lava flow, ash plumes, and sulfur dioxide emissions, using information from the Vanuatu Meteorology and Geo-Hazards Department (VMGD) and satellite data.
During the reporting period, the Alert Level remained at a 2 (on a scale of 0-5), which has been in place since December 2021. Activity during October 2022 through March 2023 remained relatively low and mostly consisted of gas-and-steam emissions in Lake Voui. VMGD reported that at 1300 on 15 November a satellite image captured a strong amount of sulfur dioxide rising above the volcano (figure 99), and that seismicity slightly increased. The southern and northern part of the island reported a strong sulfur dioxide smell and heard explosions. On 20 February 2023 a gas-and-ash plume rose 1.3 km above the summit and drifted SSW, according to a webcam image (figure 100). Gas-and-steam and possibly ash emissions continued on 23 February and volcanic earthquakes were recorded by the seismic network.
During April, volcanic earthquakes and gas-and-steam and ash emissions were reported from the cone in Lake Voui. VMGD reported that activity increased during 5-7 April; high gas-and-steam and ash plumes were visible, accompanied by nighttime incandescence. According to a Wellington VAAC report, a low-level ash plume rose as high as 2.5 km above the summit and drifted W and SW on 5 April, based on satellite imagery. Reports in Saratamata stated that a dark ash plume drifted to the WSW, but no loud explosion was heard. Webcam images from 2100 showed incandescence above the crater and reflected in the clouds. According to an aerial survey, field observations, and satellite data, water was no longer present in the lake. A lava flow was reported effusing from the vent and traveling N into the dry Lake Voui, which lasted three days. The next morning at 0745 on 6 April a gas-and-steam and ash plume rose 5.4 km above the summit and drifted ESE, based on information from VMGD (figure 101). The Wellington VAAC also reported that light ashfall was observed on the island. Intermittent gas-and-steam and ash emissions were visible on 7 April, some of which rose to an estimated 3 km above the summit and drifted E. Webcam images during 0107-0730 on 7 April showed continuing ash emissions. A gas-and-steam and ash plume rose 695 m above the summit crater at 0730 on 19 April and drifted ESE, based on a webcam image (figure 102).
According to visual and infrared satellite data, water was visible in Lake Voui as late as 24 March 2023 (figure 103). The vent in the caldera showed a gas-and-steam plume drifted SE. On 3 April thermal activity was first detected, accompanied by a gas-and-ash plume that drifted W (figure 103). The lava flow moved N within the dry lake and was shown cooling by 8 April. By 23 April much of the water in the lake had returned. Occasional sulfur dioxide plumes were detected by the TROPOMI instrument on the Sentinel-5P satellite that exceeded 2 Dobson Units (DU) and drifted in different directions (figure 104).
Geologic Background. The island of Ambae, also known as Aoba, is a massive 2,500 km3 basaltic shield that is the most voluminous volcano of the New Hebrides archipelago. A pronounced NE-SW-trending rift zone with numerous scoria cones gives the 16 x 38 km island an elongated form. A broad pyroclastic cone containing three crater lakes (Manaro Ngoru, Voui, and Manaro Lakua) is located at the summit within the youngest of at least two nested calderas, the largest of which is 6 km in diameter. That large central edifice is also called Manaro Voui or Lombenben volcano. Post-caldera explosive eruptions formed the summit craters about 360 years ago. A tuff cone was constructed within Lake Voui (or Vui) about 60 years later. The latest known flank eruption, about 300 years ago, destroyed the population of the Nduindui area near the western coast.
Information Contacts: Geo-Hazards Division, Vanuatu Meteorology and Geo-Hazards Department (VMGD), Ministry of Climate Change Adaptation, Meteorology, Geo-Hazards, Energy, Environment and Disaster Management, Private Mail Bag 9054, Lini Highway, Port Vila, Vanuatu (URL: http://www.vmgd.gov.vu/, https://www.facebook.com/VanuatuGeohazardsObservatory/); Wellington Volcanic Ash Advisory Centre (VAAC), Meteorological Service of New Zealand Ltd (MetService), PO Box 722, Wellington, New Zealand (URL: http://www.metservice.com/vaac/, http://www.ssd.noaa.gov/VAAC/OTH/NZ/messages.html); MIROVA (Middle InfraRed Observation of Volcanic Activity), a collaborative project between the Universities of Turin and Florence (Italy) supported by the Centre for Volcanic Risk of the Italian Civil Protection Department (URL: http://www.mirovaweb.it/); Global Sulfur Dioxide Monitoring Page, Atmospheric Chemistry and Dynamics Laboratory, NASA Goddard Space Flight Center (NASA/GSFC), 8800 Greenbelt Road, Goddard, Maryland, USA (URL: https://so2.gsfc.nasa.gov/); Copernicus Browser, Copernicus Data Space Ecosystem, European Space Agency (URL: https://dataspace.copernicus.eu/browser/).
Search Bulletin Archive by Publication Date
Select a month and year from the drop-downs and click "Show Issue" to have that issue displayed in this tab.
The default month and year is the latest issue available.
Bulletin of the Global Volcanism Network - Volume 44, Number 08 (August 2019)
Managing Editor: Edward Venzke
Colima (Mexico)
Renewed volcanism after two years of quiet; explosion on 11 May 2019
Krakatau (Indonesia)
Repeated Surtseyan explosions with ash and steam during February-July 2019
Masaya (Nicaragua)
Lava lake activity declined during March-July 2019
Pacaya (Guatemala)
Lava flows and Strombolian explosions continued during February-July 2019
Raikoke (Russia)
Short-lived series of large explosions 21-23 June 2019; first recorded activity in 95 years
Reventador (Ecuador)
Daily ash emissions and incandescent block avalanches continue, February-July 2019
Rincon de la Vieja (Costa Rica)
Occasional weak phreatic explosions during March-July 2019
Saunders (United Kingdom)
Intermittent activity most months, October 2018-June 2019; photographs during February and May 2019
Sinabung (Indonesia)
Large ash explosions on 25 May and 9 June 2019
Tengger Caldera (Indonesia)
Ash emissions on 19 and 28 July 2019; lahar on the SW flank of Bromo
Colima
Mexico
19.514°N, 103.62°W; summit elev. 3850 m
All times are local (unless otherwise noted)
Renewed volcanism after two years of quiet; explosion on 11 May 2019
Frequent historical eruptions at Volcán de Colima date back to the 16th century and include explosive activity, lava flows, and large debris avalanches. The most recent eruptive episode began in January 2013 and continued through March 2017. Previous reports have covered activity involving ash plumes with extensive ashfall, lava flows, lahars, and pyroclastic flows (BGVN 41:01 and 42:08). In late April 2019, increased seismicity related to volcanic activity began again. This report covers activity through July 2019. The primary source of information was the Centro Universitario de Estudios e Investigaciones de Vulcanologia, Universidad de Colima (CUEIV-UdC).
On 11 May 2019, CUEIV-UdC reported an explosion that was recorded by several monitoring stations. A thermal camera located south of Colima captured thermal anomalies associated with the explosion as well as intermittent degassing, which mainly consisted of water vapor (figure 134). A report from the Unidad Estatal de Protección Civil de Colima (UEPCC), and seismic and infrasound network data from CUEIV-UdC, recorded about 60 high-frequency events, 16 landslides, and 14 low-magnitude explosions occurring on the NE side of the crater during 11-24 May. Drone imagery showed fumarolic activity occurring on the inner wall of this crater on 22 May (figure 135).
Small explosions and gas-and-steam emissions continued intermittently through mid-July 2019 concentrated on the NE side of the crater. An overflight on 9 July 2019 revealed that subsidence from the consistent activity slightly increased the diameter of the vent; other areas within the crater also showed evidence of subsidence and some collapsed material on the outer W wall (figure 136). During the weeks of 19 and 26 July 2019, monitoring cameras and seismic data recorded eight lahars.
Geologic Background. The Colima complex is the most prominent volcanic center of the western Mexican Volcanic Belt. It consists of two southward-younging volcanoes, Nevado de Colima (the high point of the complex) on the north and the historically active Volcán de Colima at the south. A group of late-Pleistocene cinder cones is located on the floor of the Colima graben west and east of the complex. Volcán de Colima (also known as Volcán Fuego) is a youthful stratovolcano constructed within a 5-km-wide scarp, breached to the south, that has been the source of large debris avalanches. Major slope failures have occurred repeatedly from both the Nevado and Colima cones, producing thick debris-avalanche deposits on three sides of the complex. Frequent recorded eruptions date back to the 16th century. Occasional major explosive eruptions have destroyed the summit (most recently in 1913) and left a deep, steep-sided crater that was slowly refilled and then overtopped by lava dome growth.
Information Contacts: Centro Universitario de Estudios e Investigaciones de Vulcanologia, Universidad de Colima (CUEIV-UdC), Colima, Col. 28045, Mexico; Centro Universitario de Estudios Vulcanologicos y Facultad de Ciencias de la Universidad de Colima, Avenida Universidad 333, Colima, Col. 28045, Mexico (URL: http://portal.ucol.mx/cueiv/); Unidad Estatal de Protección Civil, Colima, Roberto Esperón No. 1170 Col. de los Trabajadores, C.P. 28020, Mexico (URL: http://www.proteccioncivil.col.gob.mx/).
Krakatau (Indonesia) — August 2019 Cite this Report
Krakatau
Indonesia
6.1009°S, 105.4233°E; summit elev. 285 m
All times are local (unless otherwise noted)
Repeated Surtseyan explosions with ash and steam during February-July 2019
Krakatau volcano in the Sunda Strait between Java and Sumatra, Indonesia experienced a major caldera collapse around 535 CE; it formed a 7-km-wide caldera ringed by three islands. Remnants of this volcano joined to create the pre-1883 Krakatau Island which collapsed during the major 1883 eruption. Anak Krakatau (Child of Krakatau), constructed beginning in late 1927 within the 1883 caldera (BGVN 44:03, figure 56), was the site of over 40 smaller episodes until 22 December 2018 when a large explosion and tsunami destroyed most of the 338-m-high edifice (BGVN 44:03). Subsequent activity from February-July 2019 is covered in this report with information provided by the Indonesian Center for Volcanology and Geological Hazard Mitigation, referred to as Pusat Vulkanologi dan Mitigasi Bencana Geologi (PVMBG). Aviation reports are provided by the Darwin Volcanic Ash Advisory Center (VAAC), and photographs from several social media sources.
The cyclical nature of the growth and destruction of Krakatau was made apparent again in the explosive events of 22 December 2018-6 January 2019, when much of the island of Anak Krakatau was destroyed in a series of events that included a deadly tsunami from a flank collapse, a Vulcanian explosion, and several days of Surtseyan phreatomagmatic activity (figure 83) (Gouhier and Paris, 2019). Due to the location of the volcano in the middle of Sunda Strait, surrounded by coastal communities, damage from the tsunami was once again significant; over 400 fatalities and 30,000 injuries were reported along with damage to thousands of homes, businesses, and boats (figure 84) (BGVN 44:03). After a small explosion on 8 January 2019, the volcano remained quiet until 14 February when a new seismic event was recorded. Intermittent explosions increased in frequency and continued through July 2019; images of Surtseyan explosions with ejecta and steam rising a few hundred meters were occasionally captured by authorities patrolling the Krakatau Islands Nature Preserve and Marine Nature Reserve (KPHK), and by a newly installed webcam.
Three explosions were reported on 14, 18, and 23 February. No ash plume was observed on 14 February. The event on 18 February produced a dense gray ash plume that rose 720 m and drifted SSW. On 23 February the plume was white and rose 500 m, drifting ENE. During most days, no emissions were observed; occasional plumes of steam rose 50-100 m above the crater. Authorities visited the island on 15 February and observed the new crater lake and ash-covered flank of the remnant cone (figure 85 and 86).
Activity increased during March 2019 with 14 seismic events recorded. Four events on 14 March were reported, with durations ranging from 30 seconds to 4 minutes; neither ash nor steam plumes were reported from these events. Events on 16, 17, and 18 March produced N-drifting white steam plumes that were reported at altitudes of 1.2 km, 650 m, and 350 m, respectively (figure 87). Multiple additional explosions were reported on 24, 30, and 31 March; dense white plumes drifted NE on 30 and 31 March. Nearby rangers for the KPHK who witnessed the explosions on 30 March reported material rising 500-1,000 m above the crater (figure 88). The duration of the seismic events associated with the explosions ranged from 40 seconds to 5 minutes during the second half of March. PVMBG lowered the Alert Level from III to II on 25 March, noting that while explosions continued, the intensity and frequency had decreased; none of the explosions were heard at the Pasauran-Banten (SE) or Kalianda-Lampung (NE) stations that were each about 50 km away.
Although the number of reported seismic events increased significantly during April and May 2019, with 22 VONA's issued during April and 41 during May, only a single event had witnessed evidence of ejecta on 3 April (figure 89). The KPHK patrol that monitors conditions on the islands observed the first plant life returning on Sertung Island (5 km W of Anak Krakatau) on 5 April 2019, emerging through the several centimeters of fresh ash from the explosions and tsunami in late December and early January (figure 90). A 200-m-high steam plume was observed on 14 April, and plumes drifted NE and E on 27 and 29 April.
Members of an expedition to the island on 4 May 2019 photographed the still-steaming lake inside the new crater and the eroding ash-covered slopes (figure 91). Only the explosions on 10 and 17 May produced visible steam plumes that month, to 300-350 m high. By 15 May 2019 a new station had been installed at Anak Krakatau by PVMBG (figure 92). Four separate seismic events were recorded that day. Fog covered the island on a daily basis, and very few visible steam plumes were reported throughout April and May. The durations of the explosion events ranged from 30 seconds to 13 minutes (on 10 May); most of the events lasted for 1-2 minutes.
Nine explosive events were reported during June 2019, but none produced visible steam or ash plumes until 25 June when a PVMBG webcam placed on Anak Krakatau captured a video of a Surtseyan event that lasted for about one minute. Dark gray ejecta shot tens of meters into the air over the lake, accompanied by billowing steam plumes which soon engulfed the webcam (figure 93). The other explosive events during March-July were likely similar, but frequent fog and the short-lived nature of the events made visual evidence scarce from webcams located 50 km away. During July there were 21 VONAs issued reporting similar seismic events that lasted from 30 seconds to 5 minutes; no plumes or sounds were seen or heard.
Satellite imagery provided solid evidence that activity at Anak Krakatau during February-July 2019 included underwater venting. Dark orange submarine plumes were visible drifting away from the SW flank of the volcano near the new crater multiple times each month (figure 94). The patterns of the plumes varied in size and intensity, suggesting repeated injections of material into the water. The thermal activity showed a marked decline from the period prior to the large explosions and tsunami on 22-23 December 2018. Very little thermal activity was reported during January-March 2019, it increased moderately during April-July 2019 (figure 95).
References: Gouhier, M, and Paris, R, 2019, SO2 and tephra emissions during the December 22, 2018 Anak Krakatau flank-collapse eruption, Volcanica 2(2): 91-103. doi: 10.30909/vol.02.02.91103.
Geologic Background. The renowned Krakatau (frequently mis-named as Krakatoa) volcano lies in the Sunda Strait between Java and Sumatra. Collapse of an older edifice, perhaps in 416 or 535 CE, formed a 7-km-wide caldera. Remnants of that volcano are preserved in Verlaten and Lang Islands; subsequently the Rakata, Danan, and Perbuwatan cones were formed, coalescing to create the pre-1883 Krakatau Island. Caldera collapse during the catastrophic 1883 eruption destroyed Danan and Perbuwatan, and left only a remnant of Rakata. This eruption caused more than 36,000 fatalities, most as a result of tsunamis that swept the adjacent coastlines of Sumatra and Java. Pyroclastic surges traveled 40 km across the Sunda Strait and reached the Sumatra coast. After a quiescence of less than a half century, the post-collapse cone of Anak Krakatau (Child of Krakatau) was constructed within the 1883 caldera at a point between the former Danan and Perbuwatan cones. Anak Krakatau has been the site of frequent eruptions since 1927.
Information Contacts: Pusat Vulkanologi dan Mitigasi Bencana Geologi (PVMBG, also known as Indonesian Center for Volcanology and Geological Hazard Mitigation, CVGHM), Jalan Diponegoro 57, Bandung 40122, Indonesia (URL: http://www.vsi.esdm.go.id/); Krakatau Islands KPHK, Conservation Area Region III Lampung, BKSDA Bengkulu-Ministry of LHK, (URL: https://www.instagram.com/krakatau_ca_cal); Sentinel Hub Playground (URL: https://www.sentinel-hub.com/explore/sentinel-playground); MIROVA (Middle InfraRed Observation of Volcanic Activity), a collaborative project between the Universities of Turin and Florence (Italy) supported by the Centre for Volcanic Risk of the Italian Civil Protection Department (URL: http://www.mirovaweb.it/); BBC News, (URL: https://www.bbc.com, article at https://www.bbc.com/news/science-environment-46743362); Planet Labs Inc. (URL: http://www.planet.com/); Sutopo Purwo Nugroho, BNPB (Twitter: @Sutopo_PN, URL: https://twitter.com/Sutopo_PN, image at https://twitter.com/Sutopo_PN/status/1101007655290589185/photo/1); Øystein Lund Andersen? (Twitter: @OysteinLAnderse, https://twitter.com/OysteinLAnderse, URL: http://www.oysteinlundandersen.com, image at https://twitter.com/OysteinLAnderse/status/1107479025126039552/photo/1); Tom Pfeiffer, Volcano Discovery (URL: http://www.volcanodiscovery.com/), images at https://www.volcanodiscovery.com/krakatau/news/80657/Krakatau-volcano-Indonesia-activity-update-and-field-report-increasing-unrest.html; Devy Kamil Syahbana, Volcanologist, Bandung, Indonesia, (URL: https://twitter.com/_elangtimur, video at https://twitter.com/_elangtimur/status/1143372011177033728); The Daily Mail (URL: https://www.dailymail.co.uk, article at https://www.dailymail.co.uk/sciencetech/article-6910895/FORTY-volcanoes-world-potential-Anak-Krakatoa-eruptions.html) published 11 April 2019.
Masaya (Nicaragua) — August 2019 Cite this Report
Masaya
Nicaragua
11.9844°N, 86.1688°W; summit elev. 594 m
All times are local (unless otherwise noted)
Lava lake activity declined during March-July 2019
Masaya, in Nicaragua, contains a lava lake found in the Santiago Crater which has remained active since its return in December 2015 (BGVN 41:08). In addition to this lava lake, previous volcanism included explosive eruptions, lava flows, and gas emissions. Activity generally decreased during March-July 2019, including the number and frequency of thermal anomalies, lava lake levels, and gas emissions. The primary source of information for this report comes from the Instituto Nicareguense de Estudios Territoriales (INETER).
On 21 July 2019 a small explosion in the Santiago Crater resulted in some gas emissions and an ash cloud drifting WNW. In addition to the active lava lake (figure 77), monthly reports from INETER noted that thermal activity and gas emissions (figure 78) were decreasing.
On 15 May and 22 July 2019, INETER scientists used a FLIR SC620 thermal infrared camera to measure temperatures of fumaroles on the Santiago Crater. In May 2019 the temperature of fumaroles had decreased by 48°C since the previous month. Between May and July 2019 fumarole temperatures continued to decline; temperatures ranged from 90° to 136°C (figure 79). Compared to May 2019 these temperatures are 3°C lower. INETER reports that the level of the lava lake has been slowly dropping during this reporting period.
According to MIROVA (Middle InfraRed Observation of Volcanic Activity) data from MODIS satellite instruments, frequent thermal anomalies were recorded from mid-March through early May 2019, with little to no activity from mid-May to July 2019 (figure 80). Sentinel-2 thermal images show high temperatures in the active lava lake on 10 March 2019 (figure 81). Thermal energy detected by the MODVOLC algorithm showed 14 hotspot pixels with the most number of hotspots (7) occurring in March 2019.
Geologic Background. Masaya volcano in Nicaragua has erupted frequently since the time of the Spanish Conquistadors, when an active lava lake prompted attempts to extract the volcano's molten "gold" until it was found to be basalt rock upon cooling. It lies within the massive Pleistocene Las Sierras caldera and is itself a broad, 6 x 11 km basaltic caldera with steep-sided walls up to 300 m high. The caldera is filled on its NW end by more than a dozen vents that erupted along a circular, 4-km-diameter fracture system. The Nindirí and Masaya cones, the source of observed eruptions, were constructed at the southern end of the fracture system and contain multiple summit craters, including the currently active Santiago crater. A major basaltic Plinian tephra erupted from Masaya about 6,500 years ago. Recent lava flows cover much of the caldera floor and there is a lake at the far eastern end. A lava flow from the 1670 eruption overtopped the north caldera rim. Periods of long-term vigorous gas emission at roughly quarter-century intervals have caused health hazards and crop damage.
Information Contacts: Instituto Nicaragüense de Estudios Territoriales (INETER), Apartado Postal 2110, Managua, Nicaragua (URL: http://www.ineter.gob.ni/); MIROVA (Middle InfraRed Observation of Volcanic Activity), a collaborative project between the Universities of Turin and Florence (Italy) supported by the Centre for Volcanic Risk of the Italian Civil Protection Department (URL: http://www.mirovaweb.it/); Hawai'i Institute of Geophysics and Planetology (HIGP) - MODVOLC Thermal Alerts System, School of Ocean and Earth Science and Technology (SOEST), Univ. of Hawai'i, 2525 Correa Road, Honolulu, HI 96822, USA (URL: http://modis.higp.hawaii.edu/); Sentinel Hub Playground (URL: https://www.sentinel-hub.com/explore/sentinel-playground); Sheila DeForest (URL: https://www.facebook.com/sheila.deforest).
Pacaya (Guatemala) — August 2019 Cite this Report
Pacaya
Guatemala
14.382°N, 90.601°W; summit elev. 2569 m
All times are local (unless otherwise noted)
Lava flows and Strombolian explosions continued during February-July 2019
Pacaya is one of the most active volcanoes in Guatemala, with activity largely consisting of frequent lava flows and Strombolian activity at the Mackenney crater. This report summarizes continued activity during February through July 2019 based on reports by Guatemala's Instituto Nacional de Sismologia, Vulcanologia, Meteorologia e Hydrologia (INSIVUMEH) and Sistema de la Coordinadora Nacional para la Reducción de Desastres (CONRED), visiting scientists, and satellite data.
At the beginning of February activity included Strombolian explosions ejecting material up to 5 to 30 m above the Mackenney crater and a degassing plume up to 300 m. Multiple lava flows were observed throughout the month on the N, NW, and W flanks, reaching 350 m from the crater and resulting in avalanches from the flow fronts. Strombolian activity continued with sporadic to continuous explosions ejecting material 5-75 m above the Mackenney crater. Degassing produced plumes up to 300 m above the crater, and incandescence from the crater and lava flows were seen at night. Daniel Sturgess of Bristol University observed activity on the 24th, noting a 70-m-long lava flow with individual blocks from the front of the flow rolling down the flanks (figure 108). He reported that mild Strombolian explosions occurred every 10-20 minutes and ejected blocks, up to approximately 4 m in diameter, as high as 5-30 m above the crater and towards the northern flank.
Similar activity continued through March with multiple lava flows reaching a maximum of 200 m N and NW, and avalanches descending from the flow fronts. Ongoing Strombolian explosions expelled material up to 75 m above the Mackenney crater. Degassing produced a white-blue plume to a maximum of 900 m above the crater (figure 109) and incandescence was noted some nights.
During April lava flows continued on the N and NW flanks, reaching a maximum length of 300 m, with avalanches forming from the flow fronts. Degassing formed plumes up to 600 m above the crater that dispersed with various wind directions. Strombolian activity continued with explosions ejecting material up to 40 m above the crater. On the 2nd and 3rd weak rumbles were heard at distances of 4-5 km. Similar activity continued through May with lava flows reaching 300 m to the N, degassing producing plumes up to 600 m above the crater, and Strombolian explosions ejecting material up to 15 m above the crater.
Lava flows continued out to 300 m in length to the N and NW during June (figures 110 and 111). Strombolian activity ejected material up to 30 m above the crater and degassing resulted in plumes that reached 300 m. During July there were multiple active lava flows that reached a maximum of 300 m in length on the N and NW flanks (figure 112). Avalanches generated by the collapse of material at the front of the lava flows were accompanied by explosions ejecting material up to 30 m above the crater.
During February through July multiple lava flows and crater activity were detected in Sentinel-2 satellite thermal images (figures 113 and 114) and relatively constant thermal energy was detected by the MIROVA system with a slight decrease in the energy and frequency of anomalies during June (figure 115). The thermal anomalies detected by the MODVOLC system for each month from February through July spanned 6-30, with six during June and 30 during April.
Geologic Background. Eruptions from Pacaya are frequently visible from Guatemala City, the nation's capital. This complex basaltic volcano was constructed just outside the southern topographic rim of the 14 x 16 km Pleistocene Amatitlán caldera. A cluster of dacitic lava domes occupies the southern caldera floor. The post-caldera Pacaya massif includes the older Pacaya Viejo and Cerro Grande stratovolcanoes and the currently active Mackenney stratovolcano. Collapse of Pacaya Viejo between 600 and 1,500 years ago produced a debris-avalanche deposit that extends 25 km onto the Pacific coastal plain and left an arcuate scarp inside which the modern Pacaya volcano (Mackenney cone) grew. The NW-flank Cerro Chino crater was last active in the 19th century. During the past several decades, activity has consisted of frequent Strombolian eruptions with intermittent lava flow extrusion that has partially filled in the caldera moat and covered the flanks of Mackenney cone, punctuated by occasional larger explosive eruptions that partially destroy the summit.
Information Contacts: Instituto Nacional de Sismologia, Vulcanologia, Meteorologia e Hydrologia (INSIVUMEH), Unit of Volcanology, Geologic Department of Investigation and Services, 7a Av. 14-57, Zona 13, Guatemala City, Guatemala (URL: http://www.insivumeh.gob.gt/); Coordinadora Nacional para la Reducción de Desastres (CONRED), Av. Hincapié 21-72, Zona 13, Guatemala City, Guatemala (URL: http://conred.gob.gt/www/index.php); MIROVA (Middle InfraRed Observation of Volcanic Activity), a collaborative project between the Universities of Turin and Florence (Italy) supported by the Centre for Volcanic Risk of the Italian Civil Protection Department (URL: http://www.mirovaweb.it/); Hawai'i Institute of Geophysics and Planetology (HIGP) - MODVOLC Thermal Alerts System, School of Ocean and Earth Science and Technology (SOEST), Univ. of Hawai'i, 2525 Correa Road, Honolulu, HI 96822, USA (URL: http://modis.higp.hawaii.edu/); Daniel Sturgess, School of Earth Sciences, University of Bristol, Wills Memorial Building, Queens Road, Bristol BS8 1RJ, United Kingdom (URL: http://www.bristol.ac.uk/earthsciences/); Paul Wallace, Department of Earth, Ocean and Ecological Sciences, University of Liverpool, 4 Brownlow Street, Liverpool L69 3GP, United Kingdom (URL: https://www.liverpool.ac.uk/environmental-sciences/staff/paul-wallace/); Sentinel Hub Playground (URL: https://www.sentinel-hub.com/explore/sentinel-playground).
Raikoke
Russia
48.292°N, 153.25°E; summit elev. 551 m
All times are local (unless otherwise noted)
Short-lived series of large explosions 21-23 June 2019; first recorded activity in 95 years
Raikoke in the central Kuril Islands lies 400 km SW of the southern tip of Russia's Kamchatcka Peninsula. Two significant eruptive events in historical times, including fatalities, have been recorded. In 1778 an eruption killed 15 people "under the hail of bombs" who were under the command of Captain Chernyi, returning from Matua to Kamchatka. This prompted the Russian military to order the first investigation of the volcanic character of the island two years later (Gorshkov, 1970). Tanakadate (1925) reported that travelers on a steamer witnessed an ash plume rising from the island on 15 February 1924, observed that the island was already covered in ash from recent activity, and noted that a dense steam plume was visible for a week rising from the summit crater. The latest eruptive event in June 2019 produced a very large ash plume that covered the island with ash and dispersed ash and gases more than 10 km high into the atmosphere. The volcano is monitored by the Sakhalin Volcanic Eruption Response Team, (SVERT) part of the Institute of Marine Geology and Geophysics, Far Eastern Branch of the Russian Academy of Sciences (IMGG FEB RAS) and the Kamchatka Volcanic Eruption Response Team (KVERT) which is part of the Institute of Volcanology and Seismology, Far Eastern Branch of the Russian Academy of Sciences (IVS FEB RAS).
A brief but intense eruption beginning on 21 June 2019 sent major ash and sulfur dioxide plumes into the stratosphere (figures 1 and 2); the plumes rapidly drifted over 1,000 km from the volcano. Strong explosions with dense ash plumes lasted for less than 48 hours, minor emissions continued for a few more days; the SO2, however, continued to circulate over far eastern Russia and the Bering Sea for more than three weeks after the initial explosion. The eruption covered the island with centimeters to meters of ash and enlarged the summit crater. By the end of July 2019 only minor intermittent steam emissions were observed in satellite imagery.
Summary of 2019 activity. A powerful eruption at Raikoke began at 1805 on 21 June 2019 (UTC). Volcano Observatory Notices for Aviation (VONA's) issued by KVERT described the large ash plume that rapidly rose to 10-13 km altitude and extended for 370 km NE within the first two hours (figure 3). After eight hours, the plume extended 605 km ENE; it had reached 1,160 km E by 13 hours after the first explosion (figure 4). The last strong explosive event, according to KVERT, producing an ash column as high as 10-11 km, occurred at 0540 UTC on 22 June. SVERT reported a series of nine explosions during the eruption. Over 440 lightning events within the ash plume were detected in the first 24 hours by weather-monitoring equipment. The Japanese Ministry of Transportation reported that almost 40 planes were diverted because of the ash plume (figure 5).
On 23 June (local time) the cruise ship Athena approached the island; expedition member Nikolai Pavlov provided an eyewitness account and took remarkable drone photographs of the end of the eruption. The ship approached the W flank of the island in the late afternoon and they were able to launch a drone and photograph the shore and the summit. They noted that the entire surface of the island was covered with a thick layer of light-colored ash up to several tens of centimeters thick (figure 6). Fresh debris up to several meters thick fanned out from the base of the slopes (figure 7). The water had a yellowish-greenish tint and was darker brown closer to the shore. Dark-brown steam explosions occurred when waves flowed over hot areas along the shoreline, now blanketed in pale ash with bands of steam and gas rising from it (figure 8). A dense brown ash plume drifted W from the crater, rising about 1.5 km above the summit (figure 9).
Early on 23 June, the large ash cloud continued to drift E and then NE at an altitude of 10-13 km. At that altitude, the leading edge of the ash cloud became entrained in a large low pressure system and began rotating from SE to NW, centered in the area of the Komandorskiye Islands, 1,200 km NE of Raikoke. By then the farthest edge of ash plume was located about 2,000 km ENE of the volcano. Meanwhile, at the summit and immediately above, the ash plume was drifting NW on 23 June (figures 9 and 10). Ashfall was reported (via Twitter) from a ship in the Pacific Ocean 40 km from Raikoke on 23 June. Weak ashfall was also reported in Paramushir, over 300 km NE the same day. KVERT reported that satellite data from 25 June indicated that a steam and gas plume, possibly with some ash, extended for 60 km NW. They also noted that the high-altitude "aerosol cloud" continued to drift to the N and W, reaching a distance of 1,700 km NW (see SO2 discussion below). By 27 June KVERT reported that the eruption had ended, but the aerosols continued to drift to the NW and E. They lowered the Aviation Alert Level to Green the following day.
Tokyo and Anchorage VAAC Reports. The Tokyo VAAC first observed the ash plume in satellite imagery at 10.4 km altitude at 1850 on 21 June 209, just under an hour after the explosion was first reported by KVERT. About four hours later they updated the altitude to 13.1 km based on satellite data and a pilot report. By the evening of 22 June the high-level ash plume was still drifting ESE at about 13 km altitude while a secondary plume at 4.6 km altitude drifted SE for a few more hours before dissipating. The direction of the high-altitude plume began to shift to the NNW by 0300 on 23 June. By 0900 it had dropped slightly to 12.2 km and was drifting NE. The Anchorage VAAC reported at 2030 that the ash plume was becoming obscured by meteorological clouds around a large and deep low-pressure system in the western Bering Sea. Ash and SO2 signals in satellite imagery remained strong over the region S and W of the Pribilof Islands as well as over the far western Bering Sea adjacent to Russia. By early on 24 June the plume drifted NNW for a few hours before rotating back again to a NE drift direction. By the afternoon of 24 June, the altitude had dropped slightly to 11.6 km as it continued to drift NNE.
The ash plume was still clearly visible in satellite imagery late on 24 June. An aircraft reported SO2 at 14.3 km altitude above the area of the ash plume. The plume then began to move in multiple directions; the northern part moved E, while the southern part moved N. The remainder was essentially stationary, circulating around a closed low-pressure zone in the western Bering Sea. The ash plume remained stationary and slowly dissipated as it circulated around the low through 25 June before beginning to push S (figure 11). By early on 26 June the main area of the ash plume was between 325 km WSW of St. Matthew Island and 500 km NNW of St. Lawrence Island, and moving slowly NW. The Anchorage VAAC could no longer detect the plume in satellite imagery shortly after midnight (UTC) on 27 June, although they noted that areas of aerosol haze and SO2 likely persisted over the western Bering Sea and far eastern Russia.
Sulfur dioxide emissions. A very large SO2 plume was released during the eruption. Preliminary total SO2 mass estimates by Simon Carn taken from both UV and IR sensors suggested around 1.4-1.5 Tg (1 Teragram = 109 Kg) that included SO2 columns within the ash plume with values as high as 1,000 Dobson Units (DU) (figure 12). As the plume drifted on 23 and 24 June, similar to the ash plume as described by the Tokyo VAAC, it moved in a circular flow pattern as a result of being entrained in a low-pressure system in the western Bering Sea (figure 13). By 25 June the NW edge of the SO2 had reached far eastern Russia, 1,700 km from the volcano (as described by KVERT), while the eastern edges reached across Alaska and the Gulf of Alaska to the S. Two days later streams of SO2 from Raikoke were present over far northern Siberia and northern Canada (figure 14). For the following three weeks high levels of SO2 persisted over far eastern Russia and the Bering Sea, demonstrating the close relationship between the prevailing weather patterns and the aerosol concentrations from the volcano (figure 15).
Changes to the island. Since no known activity had occurred at Raikoke for 95 years, the island was well vegetated on most of its slopes and the inner walls of the summit crater before the explosion (figure 16). The first clear satellite image after the explosion, on 30 June 2019, revealed a modest steam plume rising from the summit crater, pale-colored ash surrounding the entire island, and new deposits of debris fans extending out from the NE, SW, and S flanks. Part of a newly enlarged crater was visible at the N edge of the old crater. Two weeks later only a small steam plume was present at the summit, making the outline of the enlarged crater more visible; the extensive shoreline deposits of fresh volcanic material remained. A clear view into the summit crater on 23 July revealed the size and shape of the newly enlarged summit crater (figure 17).
References: Gorshkov G S, 1970, Volcanism and the Upper Mantle; Investigations in the Kurile Island Arc, New York: Plenum Publishing Corp, 385 p.
Tanakadate H, 1925, The volcanic activity in Japan during 1914-1924, Bull Volc. v. 1, no. 3.
Geologic Background. A low truncated volcano forms the small barren Raikoke Island, which lies 16 km across the Golovnin Strait from Matua Island in the central Kuriles. The oval-shaped basaltic island is only 2 x 2.5 km wide and rises above a submarine terrace. An eruption in 1778, during which the upper third of the island was said to have been destroyed, prompted the first volcanological investigation in the Kuril Islands two years later. Incorrect reports of eruptions in 1777 and 1780 were due to misprints and errors in descriptions of the 1778 event (Gorshkov, 1970). Another powerful eruption in 1924 greatly deepened the crater and changed the outline of the island. Prior to a 2019 eruption, the steep-walled crater, highest on the SE side, was 700 m wide and 200 m deep. Lava flows mantle the eastern side of the island.
Information Contacts: Institute of Volcanology and Seismology, Far Eastern Branch, Russian Academy of Sciences (IVS FEB RAS), 9 Piip Blvd., Petropavlovsk-Kamchatsky 683006, Russia (URL: http://www.kscnet.ru/ivs/eng/); Sakhalin Volcanic Eruption Response Team (SVERT), Institute of Marine Geology and Geophysics, Far Eastern Branch, Russian Academy of Science, Nauki st., 1B, Yuzhno-Sakhalinsk, Russia, 693022 (URL: http://www.imgg.ru/en/, http://www.imgg.ru/ru/svert/reports); Kamchatka Volcanic Eruptions Response Team (KVERT), Far Eastern Branch, Russian Academy of Sciences, 9 Piip Blvd., Petropavlovsk-Kamchatsky, 683006, Russia (URL: http://www.kscnet.ru/ivs/kvert/); NASA Earth Observatory, EOS Project Science Office, NASA Goddard Space Flight Center, Goddard, Maryland, USA (URL: http://earthobservatory.nasa.gov/); Global Sulfur Dioxide Monitoring Page, Atmospheric Chemistry and Dynamics Laboratory, NASA Goddard Space Flight Center (NASA/GSFC), 8800 Greenbelt Road, Goddard, Maryland, USA (URL: https://so2.gsfc.nasa.gov/); Sentinel Hub Playground (URL: https://www.sentinel-hub.com/explore/sentinel-playground); NOAA, Cooperative Institute for Meteorological Satellite Studies (CIMSS), Space Science and Engineering Center (SSEC), University of Wisconsin-Madison, 1225 W. Dayton St. Madison, WI 53706, (URL: http://cimss.ssec.wisc.edu/); Simon Carn, Geological and Mining Engineering and Sciences, Michigan Technological University, 1400 Townsend Drive, Houghton, MI 49931, USA (URL: http://www.volcarno.com/, Twitter: @simoncarn); Scott Bachmeier, Cooperative Institute for Meteorological Satellite Studies (CIMSS), Space Science and Engineering Center (SSEC), University of Wisconsin-Madison, 1225 W. Dayton St. Madison, WI 53706; Flightradar24 (URL: https://www.flightradar24.com/51,-2/6); Volcano Discovery (URL: http://www.volcanodiscovery.com/).
Reventador (Ecuador) — August 2019 Cite this Report
Reventador
Ecuador
0.077°S, 77.656°W; summit elev. 3562 m
All times are local (unless otherwise noted)
Daily ash emissions and incandescent block avalanches continue, February-July 2019
The andesitic Volcán El Reventador lies east of the main volcanic axis of the Cordillera Real in Ecuador and has historical eruptions with numerous lava flows and explosive events going back to the 16th century. An eruption in November 2002 generated a 17-km-high eruption cloud, pyroclastic flows that traveled 8 km, and several lava flows. Eruptive activity has been continuous since 2008. Daily explosions with ash emissions and ejecta of incandescent blocks rolling hundreds of meters down the flanks have been typical for many years. Alameida et al. (2019) provide an excellent summary of recent activity (2016-2018) and monitoring. Activity continued during February-July 2019, the period covered in this report, with information provided by Ecuador's Instituto Geofisico (IG-EPN), the Washington Volcano Ash Advisory Center (VAAC), and infrared satellite data.
Persistent thermal activity accompanied daily ash emissions and incandescent block avalanches during February-July 2019 (figure 111). Ash plumes generally rose 600-1,200 m above the summit crater and drifted W or NW; incandescent blocks descended up to 800 m down all the flanks. On 25 February an ash plume reached 9.1 km altitude and drifted SE, causing ashfall in nearby communities. Pyroclastic flows were reported on 18 April and 19 May traveling 500 m down the flanks. Small but distinct SO2 emissions were detectible by satellite instruments a few times during the period (figure 112).
The Washington VAAC issued multiple daily ash advisories on all but two days during February 2019. IGEPN reported daily ash emissions rising from 400 to over 1,000 m above the summit crater. Incandescent block avalanches rolled 400-800 m down the flanks on most nights (figure 113). Late on 8 February the Washington VAAC reported an ash plume moving W at 5.8 km altitude extending 10 km from the summit. Plumes rising more than 1,000 m above the summit were reported on 9, 13, 16, 18, 19, and 25 February. On 25 February the Washington VAAC reported an ash plume visible in satellite imagery drifting SE from the summit at 9.1 km altitude that dissipated quickly, and drifted SSE. It was followed by new ash clouds at 7.6 km altitude that drifted S. Ashfall was reported in San Luis in the Parish of Gonzalo Díaz de Pineda by UMEVA Orellana and the Chaco Fire Department.
Ash plumes exceeded 1,000 m in height above the summit almost every day during March 2019 and generally drifted W or NW. The Washington VAAC reported an ash plume visible above the cloud deck at 6.7 km altitude extending 25 km NW early on 3 March; there were no reports of ashfall nearby. Incandescent block avalanches rolled 800 m down all the flanks the previous night; they were visible moving 300-800 m down the flanks most nights throughout the month (figure 114).
During April 2019 ash plume heights ranged from 600 to over 1,000 m above the summit each day, drifting either W or NW. Incandescent avalanche blocks rolled down all the flanks for hundreds of meters daily; the largest explosions sent blocks 800 m from the summit (figure 115). On 18 April IGEPN reported that a pyroclastic flow the previous afternoon had traveled 500 m down the NE flank.
On most days during May 2019, incandescent block avalanches were observed traveling 700-800 m down all the flanks. Ash plume heights ranged from 600 to 1,200 m above the crater each day of the month (figure 116) they were visible. A pyroclastic flow was reported during the afternoon of 19 May that moved 500 m down the N flank.
Activity diminished somewhat during June 2019. Ash plumes reached 1,200 m above the summit early in June but decreased to 600 m or less for the second half of the month. Meteoric clouds prevented observation for most of the third week of June; VAAC reports indicated ash emissions rose to 5.2 km altitude on 19 June and again on 26 June (about 2 km above the crater). Incandescent blocks were reported traveling down all of the flanks, generally 500-800 m, during about half of the days the mountain was visible (figure 117). Multiple VAAC reports were also issued daily during July 2019. Ash plumes were reported by IGEPN rising over 600 m above the crater every day it was visible and incandescent blocks traveled 400-800 m down the flanks (figure 118). The Darwin VAAC reported an ash emission on 9 July that rose to 4.9 km altitude as multiple puffs that drifted W, extending about 35 km from the summit.
References: Almeida M, Gaunt H E, and Ramón P, 2019, Ecuador's El Reventador volcano continually remakes itself, Eos, 100, https://doi.org/10.1029/2019EO117105. Published on 18 March 2019.
Geologic Background. Volcán El Reventador is the most frequently active of a chain of Ecuadorian volcanoes in the Cordillera Real, well east of the principal volcanic axis. The forested, dominantly andesitic stratovolcano has 4-km-wide avalanche scarp open to the E formed by edifice collapse. A young, unvegetated, cone rises from the amphitheater floor to a height comparable to the rim. It has been the source of numerous lava flows as well as explosive eruptions visible from Quito, about 90 km ESE. Frequent lahars in this region of heavy rainfall have left extensive deposits on the scarp slope. The largest recorded eruption took place in 2002, producing a 17-km-high eruption column, pyroclastic flows that traveled up to 8 km, and lava flows from summit and flank vents.
Information Contacts: Instituto Geofísico (IG-EPN), Escuela Politécnica Nacional, Casilla 17-01-2759, Quito, Ecuador (URL: http://www.igepn.edu.ec ); MIROVA (Middle InfraRed Observation of Volcanic Activity), a collaborative project between the Universities of Turin and Florence (Italy) supported by the Centre for Volcanic Risk of the Italian Civil Protection Department (URL: http://www.mirovaweb.it/); Global Sulfur Dioxide Monitoring Page, Atmospheric Chemistry and Dynamics Laboratory, NASA Goddard Space Flight Center (NASA/GSFC), 8800 Greenbelt Road, Goddard, Maryland, USA (URL: https://so2.gsfc.nasa.gov/).
Rincon de la Vieja (Costa Rica) — August 2019 Cite this Report
Rincon de la Vieja
Costa Rica
10.83°N, 85.324°W; summit elev. 1916 m
All times are local (unless otherwise noted)
Occasional weak phreatic explosions during March-July 2019
The acid lake of Rincón de la Vieja's active crater has generated intermittent weak phreatic explosions regularly since 2011, continuing during the past year through at least August 2019. The volcano is monitored by the Observatorio Vulcanologico Sismologica de Costa Rica-Universidad Nacional (OVSICORI-UNA), and the information below comes from its weekly bulletins between 4 March and 2 September 2019. Clouds often prevented webcam and satellite views. The current report describes activity from March through July 2019.
OVSICORI-UNA reported that weak events occurred on 19 March at 1851 and on 29 March 2019 at 2043. A two-minute-long phreatic explosion on 1 April at 0802 produced a plume that rose 600 m above the crater rim. Continuous emissions were visible during 3-4 April, rising 200 m above the crater rim. On 3 April, at 1437, a small explosion was detected. An explosion on 10 April at 0617 produced a gas-and-steam plume that rose 1 km above the crater rim and drifted SE. On 12 April at 0643, a plume rose 500 m. Another event took place at 0700 on 13 April, although poor weather conditions prevented visual observations. On 14 April, OVSICORI-UNA noted that aerial photographs showed a milky-gray acid lake at a relatively low water level with convection cells of several tens meters of diameter in the center and eastern parts of the lake.
According to an OVSICORI-UNA bulletin, a small phreatic explosion occurred on 1 May. Another explosion on 11 May at 0720 produced a white gas-and-steam plume that rose 600 m above the crater rim. Phreatic explosions were recorded on 14 May at 1703 and on 17 May at 0357, though dense fog prevented visual confirmation of both events with webcams. On 15 May a local observer noted a diffuse plume of steam and gas, material rising from the crater, and photographed milky-gray deposits on the N part of the crater rim ejected from the event the day before. A major explosion occurred on 24 May.
OVSICORI-UNA recorded a significant phreatic 10-minute-long explosion that began on 11 June at 0343, but plumes were not visible due to weather conditions. No further phreatic events were reported in July.
Seismic activity was very low during the reporting period, and there was no significant deformation. Short tremors were frequent toward the end of April, but were only periodic in May and June; tremor almost disappeared in July. A few long-period earthquakes were recorded, and volcano-tectonic earthquakes were even less frequent.
Geologic Background. Rincón de la Vieja, the largest volcano in NW Costa Rica, is a remote volcanic complex in the Guanacaste Range. The volcano consists of an elongated, arcuate NW-SE-trending ridge constructed within the 15-km-wide early Pleistocene Guachipelín caldera, whose rim is exposed on the south side. Sometimes known as the "Colossus of Guanacaste," it has an estimated volume of 130 km3 and contains at least nine major eruptive centers. Activity has migrated to the SE, where the youngest-looking craters are located. The twin cone of Santa María volcano, the highest peak of the complex, is located at the eastern end of a smaller, 5-km-wide caldera and has a 500-m-wide crater. A Plinian eruption producing the 0.25 km3 Río Blanca tephra about 3,500 years ago was the last major magmatic eruption. All subsequent eruptions, including numerous historical eruptions possibly dating back to the 16th century, have been from the prominent active crater containing a 500-m-wide acid lake located ENE of Von Seebach crater.
Information Contacts: Observatorio Vulcanologico Sismologica de Costa Rica-Universidad Nacional (OVSICORI-UNA), Apartado 86-3000, Heredia, Costa Rica (URL: http://www.ovsicori.una.ac.cr/, https://www.facebook.com/OVSICORI/).
Saunders (United Kingdom) — August 2019 Cite this Report
Saunders
United Kingdom
57.8°S, 26.483°W; summit elev. 843 m
All times are local (unless otherwise noted)
Intermittent activity most months, October 2018-June 2019; photographs during February and May 2019
Historical observations of eruptive activity from the glacier-covered Mount Michael stratovolcano on Saunders Island in the South Sandwich Islands were not recorded until the early 19th century at this remote site in the southernmost Atlantic Ocean, and remain extremely rare. With the advent of satellite observation technology, indications of more frequent eruptive activity have become apparent. Vapor emission is frequently reported from the summit crater, and AVHRR and MODIS satellite imagery has revealed evidence for lava lake activity in the summit crater (Lachlan-Cope and others, 2001). Limited thermal anomaly data and satellite imagery indicated at least intermittent activity during May 2000-November 2013, and from November 2014 through April 2018 (Gray and others, 2019). Ongoing observations, including photographs from two site visits in February and May 2019 suggest continued activity at the summit during most months through May 2019, the period covered in this report. Information, in addition to on-site photographs, comes from MIROVA thermal anomaly data, NASA SO2 instruments, and Sentinel-2 and Landsat satellite imagery.
Near-constant cloud coverage for much of the year makes satellite data intermittent and creates difficulty in interpreting the ongoing nature of the activity. Gray and others (2019) concluded recently after a detailed study of shortwave and infrared satellite images that there was continued evidence for the previously identified lava lake on Mount Michael since January 1989. MIROVA thermal anomaly data suggest intermittent pulses of thermal energy in September, November, and December 2018, and April 2019 (figure 17). Satellite imagery confirmed some type of activity, either a dense steam plume, evidence of ash, or a thermal anomaly, each month during December 2018-March 2019. Sulfur dioxide anomalies were recorded in January, February, and March 2019. Photographic evidence of fresh ash was captured in February 2019, and images from May 2019 showed dense steam rising from the summit crater.
After satellite imagery and thermal anomaly data in late September 2018 showed evidence for eruptive activity (BGVN 43:10, figure 16), a single thermal anomaly in MIROVA data was recorded in mid-November 2018 (figure 17). A rare, clear Sentinel-2 image on 2 December revealed a dense steam plume over the active summit crater; the steam obscured the presence of any possible thermal anomalies beneath (figure 18).
Clear evidence of recent activity appeared on 1 January 2019 with both a thermal anomaly at the summit crater and a streak of ash on the snow (figure 19). Steam was also present within the summit crater. A distinct SO2 anomaly appeared in data from the TROPOMI instrument on 14 January (figure 20).
Multiple sources of satellite data and sea-based visual observation confirmed activity during February 2019. SO2 emissions were recorded with the TROPOMI instrument on 10, 11, 15, and 16 February (figure 21). A Landsat image from 10 February showed a dense steam plume drifting NW from the summit crater, with the dark rim of the summit crater well exposed (figure 22). Sentinel-2 images in natural color and atmospheric penetration renderings identified a dense steam plume drifting S and a thermal anomaly within the summit crater on 15 February (figure 23). An expedition to the South Sandwich Islands between 15 February and 8 March 2019 sponsored by the UK government sailed by Saunders in late February and observed a stream of ash on the NNE flank beneath the cloud cover (figure 24).
Faint SO2 emissions were recorded twice during March 2019 (figure 25), and a dense steam plume near the summit crater was visible in Landsat imagery on 23 March (figure 26). Two thermal anomalies were captured in the MIROVA data during April 2019 (figure 17).
A volcano-related research project "SSIVOLC" explored the South Sandwich Islands volcanoes during 15 April-31 May 2019. A major aim of SSIVOLC was to collect photogrammetric data of the glacier-covered Mount Michael (Derrien and others, 2019). A number of still images were acquired on 17 and 22 May 2019 showing various features of the island (figures 27-30). The researchers visually observed brief, recurrent, and very weak glow at the summit of Mount Michael after dark on 17 May, which they interpreted as reflecting light from an active lava lake within the summit crater.
References: Lachlan-Cope T, Smellie J L, Ladkin R, 2001. Discovery of a recurrent lava lake on Saunders Island (South Sandwich Islands) using AVHRR imagery. J. Volcanol. Geotherm. Res., 112: 105-116.
Gray D M, Burton-Johnson A, Fretwell P T, 2019. Evidence for a lava lake on Mt. Michael volcano, Saunders Island (South Sandwich Islands) from Landsat, Sentinel-2 and ASTER satellite imagery. J. Volcanol. Geotherm. Res., 379:60-71. https://doi.org/10.1016/j.volgeores.2019.05.002.
Derrien A, Richter N, Meschede M, Walter T, 2019. Optical DSLR camera- and UAV footage of the remote Mount Michael Volcano, Saunders Island (South Sandwich Islands), acquired in May 2019. GFZ Data Services. http://doi.org/10.5880/GFZ.2.1..2019.003
Geologic Background. Saunders Island consists of a large central volcanic edifice intersected by two seamount chains, as shown by bathymetric mapping (Leat et al., 2013). The young Mount Michael stratovolcano dominates the glacier-covered island, while two submarine plateaus, Harpers Bank and Saunders Bank, extend north. The symmetrical Michael has a 500-m-wide summit crater and a remnant of a somma rim to the SE. Tephra layers visible in ice cliffs surrounding the island are evidence of recent eruptions. Ash clouds were reported from the summit crater in 1819, and an effusive eruption was inferred to have occurred from a N-flank fissure around the end of the 19th century and beginning of the 20th century. A low ice-free lava platform, Blackstone Plain, is located on the north coast, surrounding a group of former sea stacks. A cluster of cones on the SE flank, the Ashen Hills, appear to have been modified since 1820 (LeMasurier and Thomson, 1990). Analysis of satellite imagery available since 1989 (Gray et al., 2019; MODVOLC) suggests frequent eruptive activity (when weather conditions allow), volcanic clouds, steam plumes, and thermal anomalies indicative of a persistent, or at least frequently active, lava lake in the summit crater. Due to this observational bias, there has been a presumption when defining eruptive periods that activity has been ongoing unless there is no evidence for at least 10 months.
Information Contacts: MIROVA (Middle InfraRed Observation of Volcanic Activity), a collaborative project between the Universities of Turin and Florence (Italy) supported by the Centre for Volcanic Risk of the Italian Civil Protection Department (URL: http://www.mirovaweb.it/); Global Sulfur Dioxide Monitoring Page, Atmospheric Chemistry and Dynamics Laboratory, NASA Goddard Space Flight Center (NASA/GSFC), 8800 Greenbelt Road, Goddard, Maryland, USA (URL: https://so2.gsfc.nasa.gov/); Sentinel Hub Playground (URL: https://www.sentinel-hub.com/explore/sentinel-playground); Chris Darby (URL: https://twitter.com/ChrisDDarby, image at https://twitter.com/ChrisDDarby/status/1100686838568812544).
Sinabung (Indonesia) — August 2019 Cite this Report
Sinabung
Indonesia
3.17°N, 98.392°E; summit elev. 2460 m
All times are local (unless otherwise noted)
Large ash explosions on 25 May and 9 June 2019
Indonesia's Sinabung volcano in north Sumatra has been highly active since its first confirmed Holocene eruption during August and September 2010. It remained quiet after the initial eruption until September 2013, when a new eruptive phase began that continued uninterrupted through June 2018. Ash plumes often rose several kilometers, avalanche blocks fell kilometers down the flanks, and deadly pyroclastic flows traveled more than 4 km repeatedly during the eruption. After a pause in eruptive activity from July 2018 through April 2019, explosions took place again during May and June 2019. This report covers activity from July 2018 through July 2019 with information provided by Pusat Vulkanologi dan Mitigasi Bencana Geologi (PVMBG), referred to by some agencies as CVGHM or the Indonesian Center of Volcanology and Geological Hazard Mitigation, the Darwin Volcanic Ash Advisory Centre (VAAC), and the Badan Nacional Penanggulangan Bencana (National Disaster Management Authority, BNPB). Additional information comes from satellite instruments and local news reports.
After the last ash emission observed on 5 July 2018, activity diminished significantly. Occasional thermal anomalies were observed in satellite images in August 2018, and February-March 2019. Seismic evidence of lahars was recorded almost every month from July 2018 through July 2019. Renewed explosions with ash plumes began in early May; two large events, on 24 May and 9 June, produced ash plumes observed in satellite data at altitudes greater than 15 km (table 9).
Table 9. Summary of activity at Sinabung during July 2018-July 2019. Steam plume heights from PVMBG daily reports. VONA reports issued by Sinabung Volcano Observatory, part of PVMBG. Satellite imagery from Sentinel-2. Lahar seismicity from PVMBG daily and weekly reports. Ash plume heights from VAAC reports. Pyroclastic flows from VONA reports.
| Month |
Steam Plume Heights (m) |
Dates of VONA reports |
Satellite Thermal Anomalies (date) |
Seismicity indicating Lahars (date) |
Ash Plume Altitude (date and distance) |
Pyroclastic flows |
| Jul 2018 |
100-700 |
-- |
-- |
-- |
-- |
-- |
| Aug 2018 |
50-700 |
-- |
30 |
1, 20 |
-- |
-- |
| Sep 2018 |
100-500 |
-- |
-- |
1st week, 12, 29 |
-- |
-- |
| Oct 2018 |
50-1,000 |
-- |
-- |
1 |
-- |
-- |
| Nov 2018 |
50-350 |
-- |
-- |
14 |
-- |
-- |
| Dec 2018 |
50-500 |
-- |
-- |
30 |
-- |
-- |
| Jan 2019 |
50-350 |
-- |
-- |
-- |
-- |
-- |
| Feb 2019 |
100-400 |
-- |
6, 21 |
-- |
-- |
-- |
| Mar 2019 |
50-300 |
-- |
3, 8 |
27 |
-- |
-- |
| Apr 2019 |
50-400 |
-- |
-- |
2, 4, 11 |
-- |
-- |
| May 2019 |
200-700 |
7, 11, 12, 24, 26, 27 (2) |
-- |
4, 14 |
7 (4.6 km), 24 (15.2 km), 25 (6.1 km) |
-- |
| June 2019 |
50-600 |
9, 10 |
-- |
-- |
9 (16.8 km), 10 (3.0 km) |
9-3.5 km SE, 3.0 km S |
| July 2019 |
100-700 |
-- |
-- |
10, 12, 14, 16, 4th week |
-- |
-- |
No eruptive activity was reported after 5 July 2018 for several months, however Sentinel-2 thermal imagery on 30 August indicated a hot spot at the summit suggestive of eruptive activity. The next distinct thermal signal appeared on 6 February 2019, with a few more in late February and early March (figure 66, see table 9).
PVMBG reported the first ash emission in 11 months early on 7 May 2019. They noted that an ash plume rose 2 km above the summit and drifted ESE. The Sinabung Volcano Observatory (SVO) issued a VONA (Volcano Observatory Notice for Aviation) that described an eruptive event lasting for a little over 40 minutes. Ashfall was reported in several villages. The Jakarta Post reported that Karo Disaster Mitigation Agency (BPDB) head Martin Sitepu said four districts were affected by the eruption, namely Simpang Empat (7 km SE), Namanteran (5 km NE), Kabanjahe (14 km SE), and Berastadi (12 km E). The Darwin VAAC reported the ash plume at 4.6 km altitude and noted that it dissipated about six hours later (figure 67). The TROPOMI SO2 instrument detected an SO2 plume shortly after the event (figure 68).
On 11 May 2019 SVO issued a VONA reporting a seismic eruption event with a 9 mm amplitude that lasted for about 30 minutes; clouds and fog prevented visual confirmation. Another VONA issued the following day reported an ash emission that lasted for 28 minutes but again was not observed due to fog. The Darwin VAAC did not observe the ash plumes reported on 11 or 12 May; they did report incandescent material observed in the webcam on 11 May. Sutopo Purwo Nugroho of BNPB reported that the 12 May eruption was accompanied by incandescent lava and ash, and the explosion was heard in Rendang (figure 69). The Alert Level had been at Level IV since 2 June 2015. Based on decreased seismicity, a decrease in visual activity (figure 70), stability of deformation data, and a decrease in SO2 flux during the previous 11 months, PVMBG lowered the Alert Level from IV to III on 20 May 2019.
A large explosion was reported by the Darwin VAAC on 24 May 2019 (UTC) that produced a high-altitude ash plume visible in satellite imagery at 15.2 km altitude moving W; the plume was not visible from the ground due to fog. The Sinabung Volcano Observatory reported that the brief explosion lasted for only 7 minutes (figure 71), but the plume detached and drifted NW for about 12 hours before dissipating. The substantial SO2 plume associated with the event was recorded by satellite instruments a few hours later (figure 72, left). Another six-minute explosion late on 26 May (UTC) produced an ash plume that was reported by a ground observer at 4.9 km altitude drifting S (figure 72, right). About an hour after the event, the Darwin VAAC observed the plume drifting S at 6.1 km altitude; it had dissipated four hours later. Sumbul Sembiring, a resident of Kabanjahe, told news outlet Tempo.com that ash had fallen at the settlements. Two more explosions were reported on 27 May; the first lasted for a little over 12 minutes, the second (about 90 minutes later, 28 May local time) lasted for about 2.5 minutes. No ash plumes were visible from the ground or satellite imagery for either event.
An explosion on 9 June 2019 produced an ash plume, estimated from the ground as rising to 9.5 km altitude, that drifted S and E; pyroclastic flows traveled 3.5 km SE and 3 km S down the flanks (figure 73). The explosion was heard at the Sinabung Observatory. The Darwin VAAC reported that the eruption was visible in Himawari-8 satellite imagery, and reported by pilots, at 16.8 km altitude drifting W; about an hour later the VAAC noted that the detached plume continued drifting SW but lower plumes were still present at 9.1 km altitude drifting W and below 4.3 km drifting SE. They also noted that pyroclastic flows moving SSE were sending ash to 4.3 km altitude. Three hours later they reported that both upper level plumes had detached and were moving SW and W. After six hours, the lower altitude plumes at 4.3 and 9.1 km altitudes had dissipated; the higher plume continued moving SW at 12.2 km altitude until it dissipated within the next eight hours. Instruments on the Sentinel-5P satellite captured an SO2 plume from the explosion drifting W across the southern Indian Ocean (figure 74).
The SVO reported continuous ash and gas emissions at 3.0 km altitude moving ESE early on 10 June; it was obscured in satellite imagery by meteoric clouds. There were no additional VONA's or VAAC reports issued for the remainder of June or July 2019. An image on social media from 20 June 2019 shows incandescent blocks near the summit (figure 75). PVMBG reported that emissions on 25 June were white to brownish and rose 200 m above the summit and drifted E and SE.
PVMBG detected seismic signals from lahars several times during the second week of July 2019. News outlets reported lahars damaging villages in the Karo district on 11 and 13 July (figure 76). Detik.com reported that lahars cut off the main access road to Perbaji Village (4 km SW), Kutambaru Village (14 km S), and the Tiganderket connecting road to Kutabuluh (17 km WNW). In addition, Puskesmas Kutambaru was submerged in mud. Images from iNews Malam showed large boulders and rafts of trees in thick layers of mud covering homes and roads. No casualties were reported.
Geologic Background. Gunung Sinabung is a Pleistocene-to-Holocene stratovolcano with many lava flows on its flanks. The migration of summit vents along a N-S line gives the summit crater complex an elongated form. The youngest crater of this conical andesitic-to-dacitic edifice is at the southern end of the four overlapping summit craters. The youngest deposit is a SE-flank pyroclastic flow 14C dated by Hendrasto et al. (2012) at 740-880 CE. An unconfirmed eruption was noted in 1881, and solfataric activity was seen at the summit and upper flanks in 1912. No confirmed historical eruptions were recorded prior to explosive eruptions during August-September 2010 that produced ash plumes to 5 km above the summit.
Information Contacts: Pusat Vulkanologi dan Mitigasi Bencana Geologi (PVMBG, also known as Indonesian Center for Volcanology and Geological Hazard Mitigation, CVGHM), Jalan Diponegoro 57, Bandung 40122, Indonesia (URL: http://www.vsi.esdm.go.id/); MAGMA Indonesia, Kementerian Energi dan Sumber Daya Mineral (URL: https://magma.vsi.esdm.go.id/); Darwin Volcanic Ash Advisory Centre (VAAC), Bureau of Meteorology, Northern Territory Regional Office, PO Box 40050, Casuarina, NT 0811, Australia (URL: http://www.bom.gov.au/info/vaac/); Global Sulfur Dioxide Monitoring Page, Atmospheric Chemistry and Dynamics Laboratory, NASA Goddard Space Flight Center (NASA/GSFC), 8800 Greenbelt Road, Goddard, Maryland, USA (URL: https://so2.gsfc.nasa.gov/); The Jakarta Post (URL: https://www.thejakartapost.com/news/2019/05/07/mount-sinabung-erupts-again.html); Detikcom (URL: https://news.detik.com/berita/d-4619253/hujan-deras-sejumlah-desa-di-sekitar-gunung-sinabung-banjir-lahar-dingin); iNews Malam (URL: https://tv.inews.id/, https://www.youtube.com/watch?v=uAI4CpSb41k); Tempo.com (URL:https://en.tempo.co/read/1209667/mount-sinabung-erupts-on-monday-morning); David de Zabedrosky, Calera de Tango, Chile (Twitter: @deZabedrosky, URL: https://twitter.com/deZabedrosky/status/1125814504867160065/photo/1, https://twitter.com/deZabedrosky/status/1125814504867160065/photo/2); Sutopo Purwo Nugroho, BNPB (Twitter: @Sutopo_PN, URL: https://twitter.com/Sutopo_PN); Tom Pfeiffer, Volcano Discovery (URL: http://www.volcanodiscovery.com/); Øystein Lund Andersen? (Twitter: @OysteinLAnderse, URL: https://twitter.com/OysteinLAnderse, URL: http://www.oysteinlundandersen.com image at https://twitter.com/OysteinLAnderse/status/1132849458142572544); Jaime Sincioco, Phillipines (Twitter: @jaimessincioca, URL: https://twitter.com/jaimessincioco); Annamaria Luongo, University of Padua, Venice, Italy (Twitter: @annamaria_84, URL:https://twitter.com/annamaria_84).
Tengger Caldera (Indonesia) — August 2019 Cite this Report
Tengger Caldera
Indonesia
7.942°S, 112.95°E; summit elev. 2329 m
All times are local (unless otherwise noted)
Ash emissions on 19 and 28 July 2019; lahar on the SW flank of Bromo
The Mount Bromo pyroclastic cone within the Tengger Caldera erupts frequently, typically producing gas-and-steam plumes, ash plumes, and explosions (BGVN 44:05). Information compiled for the reporting period of May-July 2019 is from the Pusat Vulkanologi dan Mitigasi Bencana Geologi (PVMBG, also known as CVGHM) and the Darwin Volcanic Ash Advisory Centre (VAAC).
The eruptive activity at Tengger Caldera that began in mid-February continued through late July 2019, including white-and-brown ash plumes, ash emissions, and tremors. During the months of May through June 2019, white plumes rose between 50 to 600 m above the summit. Satellite imagery captured a small gas-and-steam plume from Bromo on 5 June (figure 18). Low-frequency tremors were recorded by a seismograph from May through July 2019.
According to PVMBG and a Volcano Observatory Notice for Aviation (VONA), an ash eruption occurred on 19 July 2019; however, no ash column was observed due to weather conditions. A seismograph recorded five earthquakes and three shallow volcanic tremors the same day. In addition, rainfall triggered a lahar on the SW flank of Bromo.
On 28 July the Darwin VAAC reported that ash plumes originating from Bromo rose to a maximum altitude of about 3.9 km and drifted NW from the summit, based on webcam images and pilot reports. PVMBG reported that lower altitude ash plumes (2.4 km) on the same day were also recorded by webcam images, satellite imagery (Himawari-8), and weather models.
Geologic Background. The 16-km-wide Tengger caldera is located at the northern end of a volcanic massif extending from Semeru volcano. The massive volcanic complex dates back to about 820,000 years ago and consists of five overlapping stratovolcanoes, each truncated by a caldera. Lava domes, pyroclastic cones, and a maar occupy the flanks of the massif. The Ngadisari caldera at the NE end of the complex formed about 150,000 years ago and is now drained through the Sapikerep valley. The most recent of the calderas is the 9 x 10 km wide Sandsea caldera at the SW end of the complex, which formed incrementally during the late Pleistocene and early Holocene. An overlapping cluster of post-caldera cones was constructed on the floor of the Sandsea caldera within the past several thousand years. The youngest of these is Bromo, one of Java's most active and most frequently visited volcanoes.
Information Contacts: Pusat Vulkanologi dan Mitigasi Bencana Geologi (PVMBG, also known as Indonesian Center for Volcanology and Geological Hazard Mitigation, CVGHM), Jalan Diponegoro 57, Bandung 40122, Indonesia (URL: http://www.vsi.esdm.go.id/); Darwin Volcanic Ash Advisory Centre (VAAC), Bureau of Meteorology, Northern Territory Regional Office, PO Box 40050, Casuarina, NT 0811, Australia (URL: http://www.bom.gov.au/info/vaac/).