Report on Atmospheric Effects (1995-2001) — May 1997

Atmospheric Effects (1995-2001)
Bulletin of the Global Volcanism Network, vol. 22, no. 5 (May 1997)
Managing Editor: Richard Wunderman.
Atmospheric Effects (1995-2001) German lidar data from early 1991 through mid-1997
Please cite this report as:
Global Volcanism Program, 1997. Report on Atmospheric Effects (1995-2001) (Wunderman, R., ed.). Bulletin of the Global Volcanism Network, 22:5. Smithsonian Institution.
Atmospheric Effects (1995-2001)
All times are local (unless otherwise noted)
The Pinatubo aerosol layer at Garmisch-Partenkirchen declined to a minimum in the summer of 1996 (figure 3 and table 11). Since then no further decay was observed. The January-June 1997 average value of the integrated backscatter represents ~70% of 1991 pre-Pinatubo value. It is too early, however, to establish the aerosol load observed since mid-1996 as a new stratospheric background.
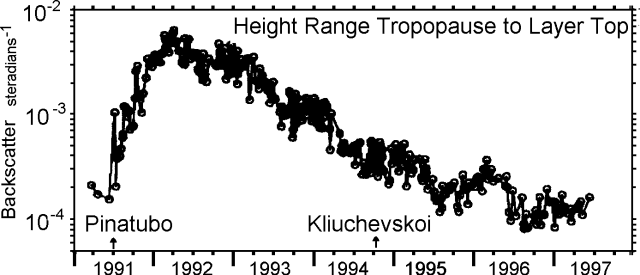 |
Figure 3. Graph showing the log of the lidar backscatter versus time at Garmisch-Partenkirchen, Germany for the latter two-thirds of 1991 through mid-1997. The plotted data are preliminary 532 nm integral values of stratospheric aerosol backscatter (integrated from the tropopause or cirrus to the top of the aerosol layer) versus time. Labeled arrows indicate the eruptions of Pinatubo and Kliuchevskoi. Courtesy of Horst Jager. |
Table 11. Lidar data from Germany (October 1996-June 1997) and Hawaii (July-December 1996) showing altitudes of aerosol layers. Backscattering rations are for the Nd-YAG wavelength of 0.53 um, with equivalent ruby values in parentheses for data from Germany; those from Mauna Loa are for the ruby wavelength of 0.69 um. The integrated value shows total backscatter, expressed in steradians-1, integrated over 300-m intervals from the tropopause to 30 km at Garmisch-Partenkirchen and 15.8-33 km at Hawaii. The "ci" stands for cirrus clouds; their presence in the tropopause region usually obscures the lower boundary of the aerosol layer. Courtesy of Horst Jager and John Barnes.
| DATE | LAYER ALTITUDE (km) (peak) | BACKSCATTERING RATIO | BACKSCATTERING INTEGRATED |
| Garmisch-Partenkirchen, Germany (47.5°N, 11.0°E) | |||
| 03 Oct 1996 | 13-28 (16.3) | 1.08 (1.15) | -- |
| 24 Oct 1996 | 9-27 (19.8) | 1.08 (1.16) | -- |
| 31 Oct 1996 | Ci-26 (15.2) | 1.06 (1.12) | -- |
| 03 Nov 1996 | Ci-30 (14.4) | 1.06 (1.12) | -- |
| 09 Nov 1996 | 12-27 (15.1) | 1.08 (1.15) | -- |
| 22 Nov 1996 | 9-32 (15.2) | 1.08 (1.15) | -- |
| 04 Dec 1996 | Ci-30 (16.7) | 1.08 (1.16) | -- |
| 26 Dec 1996 | 10-30 (23.3) | 1.07 (1.14) | -- |
| 29 Dec 1996 | 9-26 (22.5) | 1.07 (1.13) | -- |
| 12 Jan 1997 | 12-29 (17.5) | 1.09 (1.17) | -- |
| 15 Jan 1997 | 12-29 (22.1) | 1.09 (1.17) | -- |
| 17 Jan 1997 | 10-28 (19.8) | 1.08 (1.15) | -- |
| 30 Jan 1997 | 10-27 (18.7) | 1.09 (1.17) | -- |
| 06 Feb 1997 | 14-28 (22.5) | 1.09 (1.17) | -- |
| 10 Feb 1997 | 11-29 (20.3) | 1.07 (1.13) | -- |
| 22 Feb 1997 | 13-27 (19.8) | 1.08 (1.15) | -- |
| 01 Mar 1997 | 12-26 (20.9) | 1.08 (1.16) | -- |
| 09 Mar 1997 | 11-28 (20.1) | 1.10 (1.20) | -- |
| 12 Mar 1997 | 16-26 (20.6) | 1.07 (1.15) | -- |
| 02 Apr 1997 | 13-26 (22.7) | 1.07 (1.14) | -- |
| 07 Apr 1997 | 12-27 (18.7) | 1.10 (1.20) | -- |
| 17 Apr 1997 | 12-26 (15.9) | 1.06 (1.13) | -- |
| 24 Apr 1997 | 13-30 (18.5) | 1.10 (1.20) | -- |
| 14 May 1997 | Ci-28 (19.7) | 1.08 (1.16) | -- |
| 06 Jun 1997 | Ci-25 (19.9) | 1.08 (1.16) | -- |
| Mauna Loa, Hawaii (19.5°N, 155.6°W) (corrected data) | |||
| 03 Jul 1996 | 16-28 (24.7) | 1.22 | 0.48 x 10⁻⁴ |
| 10 Jul 1996 | 16-33 (24.1) | 1.34 | 0.99 x 10⁻⁴ |
| 17 Jul 1996 | 16-34 (22.0) | 1.29 | 0.83 x 10⁻⁴ |
| 01 Aug 1996 | 16-27 (25.3) | 1.18 | 0.51 x 10⁻⁴ |
| 07 Aug 1996 | 16-32 (24.7) | 1.36 | 0.88 x 10⁻⁴ |
| 20 Aug 1996 | 17-31 (24.4) | 1.34 | 0.91 x 10⁻⁴ |
| 28 Aug 1996 | 16-31 (25.9) | 1.28 | 0.67 x 10⁻⁴ |
| 04 Sep 1996 | 17-29 (23.5) | 1.24 | 0.76 x 10⁻⁴ |
| 11 Sep 1996 | 17-30 (28.0) | 1.40 | 0.88 x 10⁻⁴ |
| 18 Sep 1996 | 17-32 (24.1) | 1.29 | 0.78 x 10⁻⁴ |
| 27 Sep 1996 | 17-32 (24.4) | 1.28 | 0.73 x 10⁻⁴ |
| 02 Oct 1996 | 17-34 (25.3) | 1.36 | 0.84 x 10⁻⁴ |
| 10 Oct 1996 | 16-34 (28.0) | 1.38 | 0.97 x 10⁻⁴ |
| 17 Oct 1996 | 16-33 (25.0) | 1.38 | 0.93 x 10⁻⁴ |
| 31 Oct 1996 | 16-32 (22.1) | 1.30 | 0.95 x 10⁻⁴ |
| 27 Nov 1996 | 15-30 (24.4) | 1.40 | 1.19 x 10⁻⁴ |
| 04 Dec 1996 | 17-34 (23.8) | 1.28 | 0.63 x 10⁻⁴ |
| 10 Dec 1996 | 16-34 (25.0) | 1.37 | 1.00 x 110-4 |
| 18 Dec 1996 | 16-34 (21.7) | 1.45 | 1.20 x 10⁻⁴ |
Correction: Lidar data from Mauna Loa, Hawaii, for July-December 1996 (Bulletin v. 22, no. 3) was incorrect by a factor of 1,000. Corrected data is presented in this issue (table 11).
Information Contacts: Horst Jager, Fraunhofer-Institut fur Atmospharische Umweltforschung, Kreuzeckbahnstrasse 19, D-8100 Garmisch-Partenkirchen, Germany.