Report on Soufriere Hills (United Kingdom) — June 1997
Bulletin of the Global Volcanism Network, vol. 22, no. 6 (June 1997)
Managing Editor: Richard Wunderman.
Soufriere Hills (United Kingdom) Deadly N-directed pyroclastic flows on 25 June; cyclical eruptive behavior
Please cite this report as:
Global Volcanism Program, 1997. Report on Soufriere Hills (United Kingdom) (Wunderman, R., ed.). Bulletin of the Global Volcanism Network, 22:6. Smithsonian Institution. https://doi.org/10.5479/si.GVP.BGVN199706-360050
Soufriere Hills
United Kingdom
16.72°N, 62.18°W; summit elev. 915 m
All times are local (unless otherwise noted)
The following condenses reports from the Montserrat Volcano Observatory (MVO) and stated sources for the period ending 30 June. Although N-flank pyroclastic flows became increasingly common during late May-June (figure 23), the most lethal and destructive eruption in the volcano's historical record traveled N on 25 June (figure 24). That eruption, discussed in MVO Special Report 03 (29 June 1997 draft), sent a plume to ~10-km altitude and produced pyroclastic flows that overran both vacated and partly inhabited NE-flank settlements in the officially evacuated zone. Some flows stopped near the edge of Bramble airport; it has remained closed since that time. Risk associated with repeated pyroclastic flows to the N and W led to a new risk map (figure 25). Early August pyroclastic flows destroyed structures in central Plymouth; details will be provided next month.
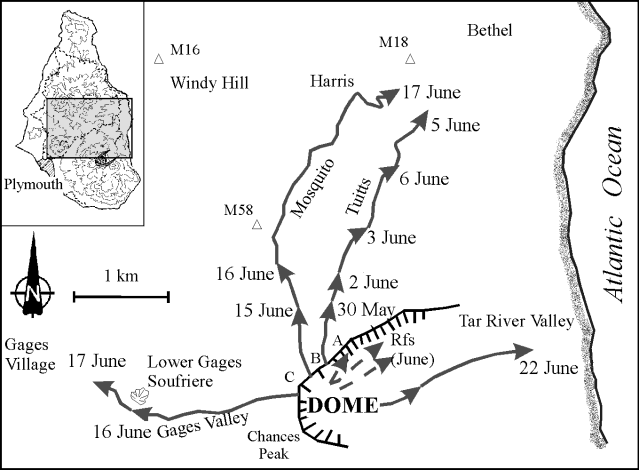 |
Figure 23. Soufriere Hills map showing the runouts of pyroclastic flows during 30 May-25 June 1997. Labels "A," "B," and "C" designate peaks with the same names. Modified from MVO Special Report 03 (29 June 1997). |
 |
Figure 24. Sketch map of the pyroclastic flow and surge deposits laid down at Soufriere Hills on 25 June. Note the arrows showing transport directions and the narrow band of deposits spreading W into the Belham Valley. Modified from MVO Special Report 03 (29 June 1997). |
 |
Figure 25. Risk map for Montserrat as of 4 July 1997. Arrows show distal ends of small pyroclastic flows that occurred through 25 June. Modified from MVO Special Report 03 (29 June 1997). |
During June NOAA's Satellite Analysis Branch repeatedly noted light plumes from the volcano. The plumes were typically "cigar-shaped" and attached to the source; in GOES-8 satellite imagery they frequently remained discernible 50-100 km W to WNW. Two days after the [25] June outburst, an ash cloud to over 10 km moved N-NW to ~200 km from the volcano.
Key events. Table 21 summarizes events during 14 May-25 June 1997. The 14 May rockfalls followed about two-and-a-half months of relative stability; by 19 May the intensity of rockfalls increased and they spilled N into Tuitt's Ghaut. On 29 May, Tuitt's Ghaut was also the scene of a minor pyroclastic flow. Subsequent pyroclastic flows increased during early June; during mid-June they reached into Mosquito Ghaut and Gages Valley (figure 23).
Table 21. Time line summary for Soufriere Hills leading up to the destructive 25 June 1997 outburst. Where unspecified, pyroclastic flow runout distances are measured from the crater. Modified from MVO Special Report 03 (29 June 1997).
| Date | Description of Activity |
| 14 May 1997 | Beginning of rock falls on dome's N face. |
| 19 May 1997 | First rockfall spills N into Tuitt's Ghaut. |
| 29 May 1997 | First pyroclastic flows enter northern ghauts. |
| 02 Jun 1997 | Pyroclastic flow down Tuitt's Ghaut travels 1 km from the crater. |
| 03 Jun 1997 | Pyroclastic flow in Tuitt's Ghaut travels 1.4 km. |
| 04 Jun 1997 | Pyroclastic flow in Tuitt's Ghaut travels 1.8 km. |
| 05 Jun 1997 | Pyroclastic flow in Tuitt's Ghaut travels 2.9 km, 250 m from intersection with the Paradise River. |
| 07-14 Jun 1997 | Rockfalls and pyroclastic flows concentrated in Tuitt's Ghaut. |
| 15 Jun 1997 | Pyroclastic flow material advanced 500 m down Mosquito Ghaut. Gage's Valley was the scene of a small rockfall. |
| 16 Jun 1997 | Pyroclastic flows in Gage's Valley travel 1.6 km from the crater rim. Smaller pyroclastic flows in Mosquito and Tuitt's Ghaut. |
| 17 Jun 1997 | Strong deflation on tiltmeters preceded a dome collapse at 2330; pyroclastic flows traveled 2 km down Gages Valley (200 m further than previous ones) and 3.5 km down Mosquito Ghaut. Many of the rock samples collected from the pyroclastic flow into Mosquito Ghaut were moderately vesicular and were therefore interpreted as juvenile (not dome material). |
| 22 Jun 1997 | Inflation and subsequent deflation were pronounced and rapid; the latter coincided with pyroclastic flows that traveled ~1 km E down the Tar River Valley. After this event, inflation-deflation cycles shortened and their amplitudes increased. The pyroclastic flows were also followed by a short volcano-tectonic earthquake swarm and the return of hybrid swarms. |
| 24 Jun 1997 | For the first time since 17 June, small pyroclastic flows moved down Mosquito Ghaut; they reached 1 km from the crater rim. Dome growth seen at the top of Mosquito Ghaut. |
Limited visibility during June led to the poorly defined, but relatively high extrusion rate of ~3.5 m3/s. The dome's additional bulk furnished less-impeded access to the volcano's N slopes.
Eruption of 25 June. During 1255 to 1320 on 25 June pyroclastic flows sweeping over the volcano's N flanks followed paths down Mosquito Ghaut and the Paradise River almost to the sea (figure 24). Pyroclastic flows and associated surge clouds damaged or destroyed 100-150 houses (severely affecting the villages of Streatham, Dyers, Harris, Bethel, Bramble, Trants, Farm, and Spanish Point). A mid-July official statement confirmed ten people dead and another nine missing and presumed dead. An earlier report mentioned five people who suffered serious burns.
The pyroclastic flows were the largest since the eruption began in 1995; the eruption's intensity exceeded that of the explosion of 17 September 1996. An estimated 4-7 million cubic meters of the lava dome was unloaded during the event, and the resulting flow and surge deposits covered 4 km2 (figure 24). The ash fell over W and NW Montserrat. Maximum accumulations reached 2 mm. The event left a steeply-dipping, circular scar ~200 m across in the dome's NNW face.
Table 22 and figures 26, 27, and 28 summarize events on a variety of time scales, the latter two covering intervals just before and during the 25 June outburst. The previously mentioned hybrid earthquake swarm at 0300 had up to 4-5 events/minute, similar to swarms seen during the previous four days. Earthquakes were of moderate amplitude; they caused saturations on the Gages and Windy Hill drum records.
Table 22. Timeline for the destructive 25 June 1997 outburst at Soufriere Hills. Modified from MVO Special Report 03 (29 June 1997).
| Date | Time | Event |
| 25 Jun 1997 | 0300 | Start of hybrid earthquake swarm |
| 25 Jun 1997 | 0600-0800 | Deflation accompanied by small pyroclastic flows in Mosquito Ghaut |
| 25 Jun 1997 | 1050 | Start of hybrid earthquake swarm |
| 25 Jun 1997 | 1200 | Crater inflation peaked |
| 25 Jun 1997 | 1245 | Volcanic tremor; steam and ash production |
| 25 Jun 1997 | 1255 | Start of pyroclastic flow activity |
| 25 Jun 1997 | 1257 | First seismic pulse |
| 25 Jun 1997 | 1300 | Second seismic pulse |
| 25 Jun 1997 | 1300 | First pyroclastic flow observed in Mosquito Ghaut from MVO |
| 25 Jun 1997 | 1302 | First flow seen from airport |
| 25 Jun 1997 | 1303 | Loss of seismic signals from eastern stations |
| 25 Jun 1997 | 1308 | Third seismic pulse |
| 25 Jun 1997 | 1315 | Second flow seen from airport |
| 25 Jun 1997 | 1320 | End of seismic activity |
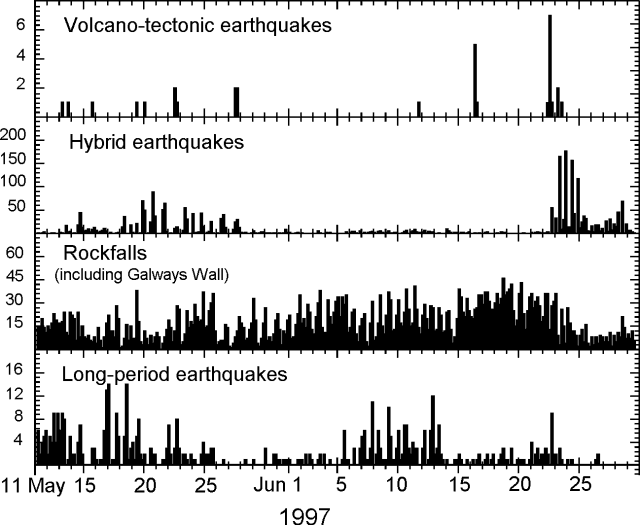 |
Figure 26. Seismicity at Soufriere Hills during 11-29 May 1997. The term "rockfalls" refers to seismically detected rockfalls. Modified from MVO Special Report 03 (29 June 1997). |
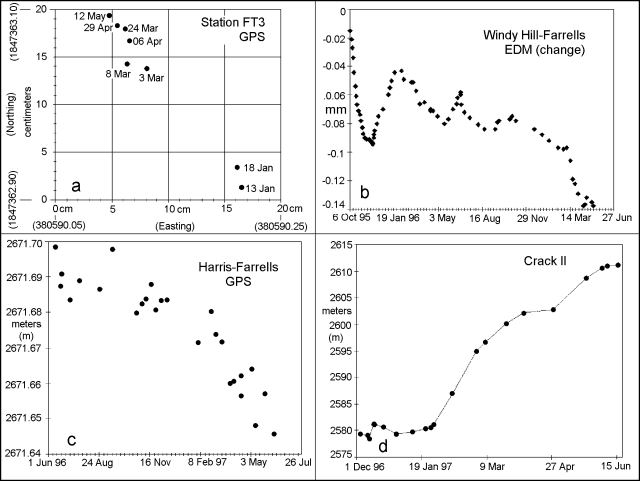 |
Figure 27. Four studies of Soufriere Hills deformation for stated dates. Modified from MVO Special Report 03 (29 June 1997). A) (top left) Map view showing the relative location of GPS site FT3 on the crater wall, January-May 1997; values in parentheses are local map coordinates and directions. Site FT3 lies near the "C" in figure 23. B) (top right) Plot of the change in EDM baseline length, 6 October 1995-27 June 1997; Y-axis lengths (in meters) correspond to the change in distances between Windy Hill and Farrells. The points were plotted using a 5-point moving average. C) (bottom left) Plot of GPS baseline length, 1 June 1996-26 July 1997; Y-axis lengths correspond to the (absolute) distances measured between Harris and Farrells. D) (bottom right) Shear length of Chances Peak crack II illustrating progressive offset, 1 December 1996-15 June 1997. |
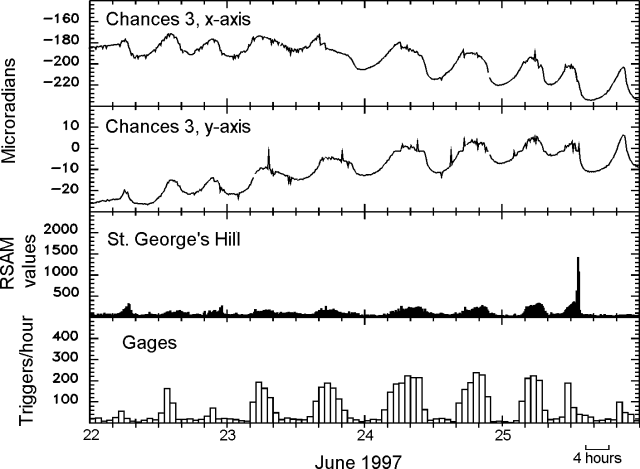 |
Figure 28. Tilt (upper plots) and seismicity (lower plots) at Soufriere Hills during 22-25 June 1997 showed a high degree of in-phase cyclical behavior. The tilt at Chances Peak was acquired along two orthogonal axes: "x" refers to an axis oriented nearly E-W (099-degree bearing) and "y", to an axis nearly N-S (009-degree bearing). St. George's Hill and Gages seismic data (lower two plots) include the amplitude of all detected earthquakes. At Gages, "triggers" refer to the number of events above an unstated threshold. The tick marks above stated dates indicate the start of indicated day (0000 hours); time between adjacent tick marks is 4 hours. Modified from MVO Special Report 03 (29 June 1997). |
Tilt peaked at 0520 and the volcano started to deflate at about 0610 (figure 28). The hybrid earthquake swarm diminished gradually after about 0615. At 0705 the earthquakes gave way to low tremor. Rock falls and minor pyroclastic flows commenced, fitting the established pattern. Between 0600 and 0800 semi-continuous pyroclastic flows ran down Mosquito Ghaut to ~1 km. There were also simultaneous rockfalls and small pyroclastic flows from the dome's SE and E faces. Re-inflation of the dome area began at approximately 0900 and a second hybrid swarm started at 1050 and escalated rapidly, reaching ~6 events/minute between 1130 and 1230. The earthquake amplitudes were uniform, and similar to those in the earlier swarm. At 1200 the inflation trend peaked. By 1245 the seismic record was dominated by tremor, and hybrid earthquakes were barely discernible. A dilute steam and ash cloud blew W at the altitude of ~1.5 km.
Between 1240 and 1250 the tiltmeter registered the start of a sharp deflation. At 1255 a strong seismic signal began and at 1257 and 1300 intense pulses occurred. The latter pulse was roughly coincident with eruption of a dense, dark ash cloud that rose vertically from the N flank of dome above Mosquito Ghaut. This was considered the main event, and sent an ash cloud to 10 km in minutes.
At 1303 the eastern stations of the seismic network stopped transmitting data due to the destruction of either the telephone exchange or the line across the central corridor by a pyroclastic flow down Mosquito Ghaut. Available stations registered a third seismic pulse at 1308.
MVO staff positioned N of the airport witnessed the front of the flow coming around the bend at Pea Ghaut, just up-slope of Trant's village (figure 24). At 1315 MVO observers flying over the airport found that the initial pulse had overrun the lower parts of local settlements (Harris, Farm, and Trant's), and came to within 50 m of the sea. They also reported a final pulse coming down Paradise Ghaut and surges continuing to spread slowly westward in the Spanish Point area. The final pulse advanced at ~30 m/s across flat land near Trants; this was captured on film by a time-lapse video recorder at the airport control tower.
Deposits and destruction. In Mosquito Ghaut, the main part of the flow caused intense scouring to the top (but not over) the steep valley walls; scouring was particularly intense on the outside of bends. The deposits, not extensive in the upper part, generally thickened towards the lower end where Mosquito meets Paradise Ghaut.
Flow deposits completely filled Pea Ghaut and formed a thick, broad fan emerging NW from Paradise Ghaut just N of Bethel (figure 24). Houses 200 m from the edge of the fan were completely buried. A separate lobe of coarse material ran over the lip of Paradise Ghaut immediately W of Bethel. Blocks within this lobe were up to 5 m in size and caused widespread destruction to houses in Bethel village. This was the only area where a high concentration of coarse material spilled from the main ghauts.
As the pyroclastic flows emerged from between peaks B and C (figure 23) and progressed into Mosquito Ghaut, fine-grained pyroclastic surges spread laterally onto the ridges on either side. These surges extended as far E as Paradise Estate, went northward to within 250 m of Windy Hill, inundated the entire village of Streatham, and spread W as far as Gun Hill. They broke and flattened trees on the ridges in the Farrell's and Paradise area. The surges did not spill into Tuitt's Ghaut to the E, but at one or two points they drained into the unnamed ghaut to the W. In Streatham, charring of trees and telegraph poles was limited to the E-SE sides. The orientation of charring, shadow zones behind a few of the houses, and the transport of a water tank indicated that surge movement in this area was WNW.
In the Farrell's area, blocks above 1 m across were rare; occasional blocks ~0.5 m across were present on Farrell's road. The deposits indicated that drainage of flow material into the Dyers river occurred largely in the narrow area S of Gun Hill and W of Riley's Yard. Samples collected in the Farm River area and Spanish Point included both dense and moderately vesicular lithologies.
Pyroclastic flows extended into the Belham valley as far as the last of the tight bends before Cork Hill. The flow-front was marked by a pile of logs aligned cross-valley; still, most trees remained standing, even near the base of the valley. Deposits along the whole length of the Belham valley were fine-grained with a near absence of coarse blocks. In addition, two small concrete bridges were left intact at the base of the valley. The fine grained deposits were interpreted as originating from pyroclastic surges that diverged NW from the main flow in Mosquito Ghaut.
Elevated seismic signals persisted until 1318, and the large deflation recorded by the tiltmeter bottomed out at 1430. Low amplitude tremor with hybrid earthquakes continued until 1500, at which time the seismicity dropped to background levels. The RSAM peak for the event, which lasted for 30 minutes, indicated shorter but more intense activity relative to the explosion of 17 September 1996.
Seismicity overview. Hybrid earthquake swarms occurred during 13 to 27 May (~100 earthquakes/day, figure 26). Rockfalls immediately followed each swarm of earthquakes, and in addition, after the earthquake swarms ended, the rockfall events continued (figure 26).
On the morning of 22 June, after a moderate pyroclastic flow and associated deformation, hybrid earthquakes suddenly restarted (table 23, figure 26). A small swarm of volcano-tectonic earthquakes also appeared; such earthquakes had been rare in recent months, usually occurring in single swarms. Between 22 and 25 June MVO noted seven hybrid swarms; both the duration and number of component events in these swarms increased (figure 26). Within a given swarm, the earthquakes generally had similar magnitudes and the few larger earthquakes were of relatively small magnitude; much larger ones had been recorded previously. Nevertheless, the swarms on 24 and 25 June increased in intensity, reaching a state where repetitive events merged into continuous tremor that was difficult to distinguish from rockfall signals on the drum records.
Long-period earthquakes became more numerous following the 5 June pyroclastic flows (table 23). The number of these earthquakes remained low, not exceeding 40/day, and returned to normal levels after 13 June.
Deformation studies. Figure 27 shows examples of monitored deformation, which includes both Total Station (combined electronic distance measurement (EDM) and theodolite) and global positioning system (GPS) techniques. Cracks in the crater walls were monitored by frequent measurements between fixed points across them. Telemetry links to two tiltmeters and one extensometer at Chances Peak and one tiltmeter at Long Ground.
In early March 1997 GPS surveys detected deformation of the northern crater walls (figure 27a). GPS station FT3 was installed on the crater wall adjacent to Peak C (figure 23); during 13 January-3 March it had moved ~15 cm NW; it continued moving NW with a total displacement by 12 May of 21.5 cm (after which the site was considered too dangerous to visit). Since July 1996, GPS on Chances Peak showed sustained motion away from the dome. By 29 June this site had a total displacement of 16 cm.
In the eruption's early stages, an EDM/GPS station on the N-flank (at Farrells) moved slowly N, away from the dome complex. Thus, by 30 November 1995 a shortening of 9 cm occurred. Although two cycles of lengthening and shortening occurred during 1996, since December 1996 only sustained shortening occurred along certain baselines (Windy Hill and Harris). This shortening continued at an increasing rate until the last measurement on 10 June.
Prior to 16 June, the Chances Peak tiltmeter showed a cyclical pattern of inflation and deflation, centered at the dome, with 12- to 16-hour periods and 16- to 18-µrad amplitudes. During 16-17 June the inflation-deflation cycle flattened to 5- to 10-µrad amplitudes.
At approximately 1600 on 17 June inflation increased steeply, peaking at 2100; rapid deflation followed. This deflation preceded a dome collapse at 2330 that sent pyroclastic flows down Gages and Mosquito drainages. For the next day and a half there was a return of the pronounced inflation-deflation pattern seen prior to 16 June.
In contrast, during 19 June until the early morning of 22 June there prevailed a flattened inflation-deflation pattern. Then, at 0530 on 22 June, a rapid inflation occurred; subsequent sharp deflation at 0630 was coincident with sustained pyroclastic flows.
This event marked the beginning of inflation-deflation cycles with periods shortened to 8 hours and amplitudes increased to ~40 µrad. As previously mentioned, the change was accompanied by a short volcano-tectonic earthquake swarm that preceded the hybrid earthquakes. The number of hybrid earthquakes varied in-phase with the inflation-deflation cycle (i.e. the maximum number of hybrid earthquakes occurred at peak inflation, figure 28).
Following the 25 June pyroclastic flows, the inflation-deflation cycle continued with the same period and amplitude that began 22 June. Prior to 25 June, tiltmeters indicated inflation on the N flank (or deflation on the S); after 25 June, tiltmeters indicated inflation at the dome's center.
Post-event activity and interpretations. After the episode of pyroclastic flows, seismicity remained low for several hours. However, starting at 2000 more inflation was accompanied by a small swarm of hybrid earthquakes. In subsequent days, the inflation and deflation pattern continued, earthquake swarms became more intense, and there were pyroclastic flows in Mosquito Ghaut and Gages valley.
Two small explosions on 27 June caused concern that the activity was still escalating, and the chance of significant explosive activity was judged to have increased. Brief views of the dome on 28 June indicated that a large part had been removed during the pyroclastic flows and rapid growth was occurring within the scar.
The large event was not a surprise because in the weeks prior to 25 June repetitive hybrid earthquake swarms and inflation-deflation cycles suggested that the rate of dome growth and conduit pressure were elevated. The effects of the pyroclastic flow were largely anticipated by the hazard zonation and warnings issued in MVO reports throughout June. The surge into Dyer's Ghaut and the Belham River valley was remarkable in that a relatively fine-grained flow traveled a significant distance off the main flow path.
In the days after 25 June, high activity levels and inflation at the Chances Peak tiltmeter prevailed. Earlier in the eruption significant events were normally followed by a respite in activity and a change in the eruption pattern. This was taken as a sign of further intense activity.
Risk map. During June 1997 MVO published four successive risk maps. With the advent of each map, the A-B zone (with no access) gradually increased in size to cover most of the S part of the island. Seven zones and six possible alert levels produced 42 different options; a new map could simplify the previous system.
The new map in early July (figure 25) contained three zones: the northern, central, and exclusion zones, and only one alert level, "volcanic alert." To decide where the boundaries between risk zones should lie, the distal margins of pyroclastic flows and surges through June 1997 were indicated. There was potential for flows to reach much of the S of Montserrat; thus MVO decided that an exclusion zone should include these areas. The line across the island's center was controlled primarily by topography.
North of the exclusion zone MVO considered that the risk of pyroclastic flows and surges was low enough to allow people to live and work as normal; however, in the case of increased activity it was thought that people in the area directly N of the exclusion should be ready to move at short notice. Therefore, a central zone was designated in which people should be on increased alert. The further that people moved away from the exclusion zone, the safer. Thus, the northern boundary of the central zone was marked as a dotted line. During an increase in alert level, citizens were advised to move uphill and away from the Belham River Valley. To announce an evacuation of the central zone the plan included deployment of wailing sirens and maroons (explosive fireworks).
Geological Summary. The complex, dominantly andesitic Soufrière Hills volcano occupies the southern half of the island of Montserrat. The summit area consists primarily of a series of lava domes emplaced along an ESE-trending zone. The volcano is flanked by Pleistocene complexes to the north and south. English's Crater, a 1-km-wide crater breached widely to the east by edifice collapse, was formed about 2000 years ago as a result of the youngest of several collapse events producing submarine debris-avalanche deposits. Block-and-ash flow and surge deposits associated with dome growth predominate in flank deposits, including those from an eruption that likely preceded the 1632 CE settlement of the island, allowing cultivation on recently devegetated land to near the summit. Non-eruptive seismic swarms occurred at 30-year intervals in the 20th century, but no historical eruptions were recorded until 1995. Long-term small-to-moderate ash eruptions beginning in that year were later accompanied by lava-dome growth and pyroclastic flows that forced evacuation of the southern half of the island and ultimately destroyed the capital city of Plymouth, causing major social and economic disruption.
Information Contacts: Montserrat Volcano Observatory (MVO), c/o Chief Minister's Office, PO Box 292, Plymouth, Montserrat (URL: http://www.mvo.ms/); NOAA/NESDIS Satellite Analysis Branch (SAB), Room 401, 5200 Auth Road, Camp Springs, MD 20746, USA.