Report on Axial Seamount (Undersea Features) — January 1998
Bulletin of the Global Volcanism Network, vol. 23, no. 1 (January 1998)
Managing Editor: Richard Wunderman.
Axial Seamount (Undersea Features) Seismicity indicates eruption in late January
Please cite this report as:
Global Volcanism Program, 1998. Report on Axial Seamount (Undersea Features) (Wunderman, R., ed.). Bulletin of the Global Volcanism Network, 23:1. Smithsonian Institution. https://doi.org/10.5479/si.GVP.BGVN199801-331021
Axial Seamount
Undersea Features
45.95°N, 130°W; summit elev. -1410 m
All times are local (unless otherwise noted)
Beginning at 0400 on 25 January 1998, the most intense seismicity yet observed by the NOAA/PMEL T-phase Monitoring System was detected in the NE Pacific. The system uses acoustic information from the U.S. Navy Sound Surveillance System (SOSUS). Three small earthquakes preceded the activity on 24 January during 1900-2100; within hours, ~100 events/hour were occurring. The high rate of seismicity sustained for 2.5 days.
Although the initial level of activity was higher at Axial, the character of the seismicity was very similar to that observed in 1993 at CoAxial Segment (BGVN 18:07) and in 1996 at the N end of the Gorda Ridge (BGVN 21:02 and 21:06); both episodes were later confirmed to be eruptive events.
Initial seismic activity was located on the summit and S flank of Axial Seamount (figures 1, 2, and 3) on the central Juan de Fuca Ridge at 45.92°N, 130.00°W (~480 km W of Cannon Beach, Oregon). After ~10 hours of activity, earthquake epicenters began to migrate S along the rift zone (figure 2). The gap in epicenter activity between 45.80°N and 45.87°N could not be explained.
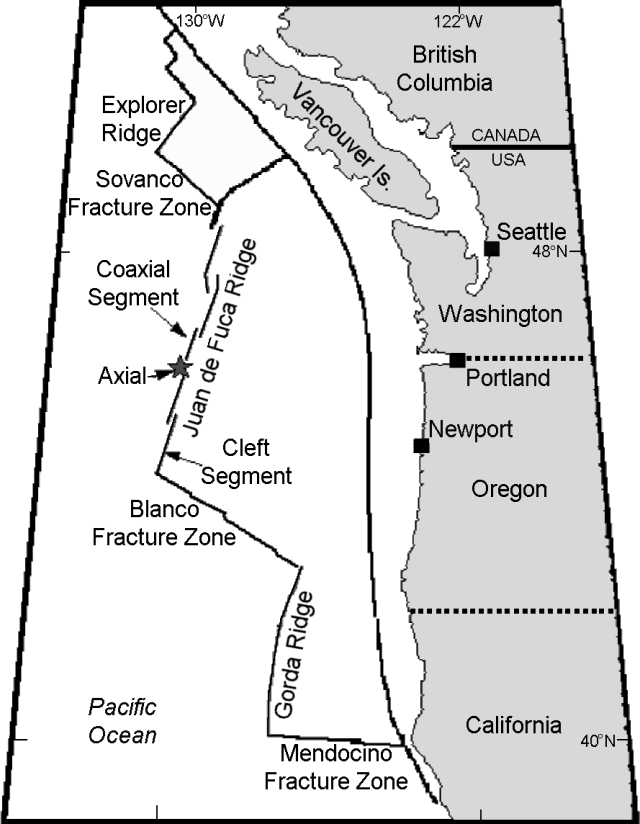 |
Figure 1. Map of plate boundaries and other features associated with the Juan de Fuca Ridge in the NE Pacific. Courtesy of NOAA/PMEL. |
 |
Figure 2. Latitude of earthquake epicenters at Axial Seamount during 25-27 January 1998. In this interval, epicenters migrated onto the seamount's S flanks. The migration rate was similar that observed during earlier episodes at both CoAxial and Gorda Ridge sites. Activity focused at 45.725 N on the first half of 26 January and at 45.64 N late on 26 January may represent secondary eruptive centers. Courtesy of NOAA/PMEL. |
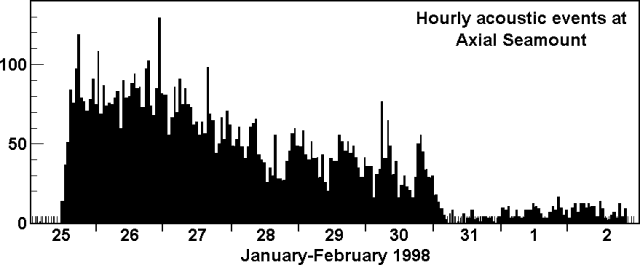 |
Figure 3. Number of events per hour at Axial Seamount during 25 January-2 February 1998. On 31 January the closest SOSUS arrays failed to operate. Courtesy of NOAA/PMEL. |
The onset of activity and migration of epicenters seen during this event were characteristic of shield volcano eruptions and prior sea floor eruptive episodes detected by SOSUS. The initiation of high levels of seismic activity without a large seismic main shock is considered typical of volcanic activity. In addition, the relatively slow migration of epicenters down-rift was judged to be characteristic of a lateral dike injection and possibly of a flank eruption.
Associated with this seismicity, on 25 January at 1707 and on 26 January at 1128, two M 4.5 earthquakes were recorded by seismic networks in the Pacific Northwest of the US. The high-angle normal faulting with NW strike was consistent with movement along the faults bounding the summit caldera of Axial Seamount. The faulting was judged to be associated with readjustment of the caldera in response to the removal of magma beneath the summit.
On 28 January activity continued at a rate of 30-40 events/hour and epicenters continued migrating S. Epicenters were located as far S as 45.47°N, compared to 45.92°N during the initial activity (figure 2). In addition, on 28 January a M 4.7 earthquake was recorded.
During the night of 28-29 January, seismicity dropped to 25 events/hour but increased in the morning to 50 events/hour. As of 29 January, the epicenters had stopped migrating, going no farther S than 45.47°N and focusing at 45.50°N. By 0830 on 29 January the total number of earthquakes detected had reached 6,000. On 30 January, seismic activity continued with 20-30 events/hour.
Although on 31 January three SOSUS arrays were disabled, two returned to service by 1 February. The disabled equipment affected the number of apparent events and limited the ability to locate events accurately. Still, activity decreased steadily in early February; on 1 February, there were 8-10 events/hour, on 2 February, 5-10 events/hour, and on 3 February, 3-5 events/hour. By 5 February, the seismicity had ceased; nearly 8,200 earthquakes were detected during the episode.
Instrumentation at the site currently includes two volcanic systems monitors that measure tilt, pressure, harmonic tremor, ocean current velocity, and water temperature, as well as an acoustic extensometer array. A field response using the Oregon State University research vessel Wecoma was tentatively scheduled for mid-February. In addition, a full Ocean Bottom Seismometer array will be deployed in summer 1998.
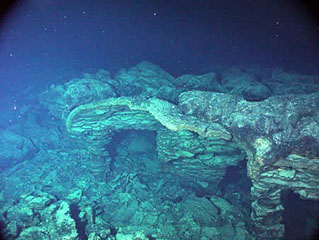
Axial rises 700 m above the mean level of the ridge crest and is the most magmatically robust and seismically active site on the Juan de Fuca Ridge between the Blanco Fracture Zone and the Cobb offset (figure 1). The summit is marked by an unusual rectangular-shaped caldera (3 x 8 km) that lies between the two rift zones. The caldera is defined on three sides by a boundary fault of up to 150 m relief. Hydrothermal vents colonized with biological communities are located near the caldera fault or along the rift zones. Following the discovery of hydrothermal venting N of the caldera in 1983, a concentrated mapping and sampling effort was made in the mid-late 1980s.
Reference. Results from a broad range of studies at Axial Seamount were published in a special issue of the Journal of Geophysical Research (vol. 95, no. B8, August 10, 1990).
Geological Summary. Axial Seamount rises 700 m above the mean level of the central Juan de Fuca Ridge crest about 480 km W of Cannon Beach, Oregon, to within about 1,400 m of the ocean surface. It is the most magmatically and seismically active site on the Juan de Fuca Ridge between the Blanco Fracture Zone and the Cobb offset. The summit is marked by an unusual rectangular-shaped caldera (3 x 8 km) that lies between two rift zones and is estimated to have formed about 31,000 years ago. The caldera is breached to the SE and is defined on three sides by boundary faults of up to 150 m relief. Hydrothermal vents with biological communities are located near the caldera fault and along the rift zones. Hydrothermal venting was discovered north of the caldera in 1983. Detailed mapping and sampling efforts have identified more than 50 lava flows emplaced since about 410 CE (Clague et al., 2013). Eruptions producing fissure-fed lava flows that buried previously installed seafloor instrumentation were detected seismically and geodetically in 1998 and 2011, and confirmed shortly after each eruption during submersible dives.
Information Contacts: Chris Fox, Bob Dziak, and Bob Embley, NOAA Pacific Marine Environmental Laboratory (PMEL), 2115 SE Osu Drive, Newport, OR 97365 USA (URL: https://www.pmel.noaa.gov/).