Report on Atmospheric Effects (1995-2001) — March 1998

Atmospheric Effects (1995-2001)
Bulletin of the Global Volcanism Network, vol. 23, no. 3 (March 1998)
Managing Editor: Richard Wunderman.
Atmospheric Effects (1995-2001) Lidar data from Germany and Virginia
Please cite this report as:
Global Volcanism Program, 1998. Report on Atmospheric Effects (1995-2001) (Wunderman, R., ed.). Bulletin of the Global Volcanism Network, 23:3. Smithsonian Institution.
Atmospheric Effects (1995-2001)
All times are local (unless otherwise noted)
Table 13 lists atmospheric lidar data from Hampton, Virginia for 8 April 1997 through 26 February 1998, and from Garmisch-Partenkirchen, Germany for 3 November 1997 to 14 April 1998. The aerosol backscatter measured at Hampton on 26 February 1998 shows a typical winter increase in stratospheric aerosol compared to measurements made the previous summer. The increase from summer to winter is generally a function of the difference in tropopause height between the two seasons. In this case there is a significant decrease in integrated stratospheric aerosol compared to measurements obtained during the winter of 1997 (Bulletin v. 22, nos. 1, 3).
Table 13. Lidar data collected for Virginia (April 1997-February 1998) and Germany (November 1997-April 1998) showing altitudes of aerosol layers. Backscattering rations from Hampton are for the ruby wavelength of 0.69 µm; those from Garmisch-Partenkirchen are for the Nd-YAG wavelength of 0.53 µm, with equivalent ruby values in parentheses. The integrated value shows total backscatter, expressed in steradians-1, integrated over 300-m intervals from the tropopause to 30 km for both Virginia and Germany. Courtesy of Mary Osborne and Horst Jäger.
| DATE | LAYER ALTITUDE (km) (peak) | BACKSCATTERING RATIO | BACKSCATTERING INTEGRATED |
| Hampton, Virginia (37.1°N, 76.3°W) | |||
| 08 Apr 1997 | 17-27 (20.5) | 1.12 | 5.02 x 10⁻⁵ |
| 16 Apr 1997 | 17-27 (19.6) | 1.17 | 6.90 x 10⁻⁵ |
| 07 May 1997 | 17-27 (20.3) | 1.14 | 4.90 x 10⁻⁵ |
| 22 May 1997 | 15-28 (20.5) | 1.13 | 4.76 x 10⁻⁵ |
| 11 Jun 1997 | 15-25 (20.6) | 1.12 | 3.01 x 10⁻⁵ |
| 15 Jul 1997 | 15-27 (18.1) | 1.14 | 3.73 x 10⁻⁵ |
| 01 Aug 1997 | 15-28 (23.6) | 1.11 | 3.53 x 10⁻⁵ |
| 05 Sep 1997 | 14-30 (21.7) | 1.11 | 4.06 x 10⁻⁵ |
| 26 Feb 1998 | 12-28 (16.4) | 1.10 | 4.28 x 10⁻⁵ |
| Garmisch-Partenkirchen, Germany (47.5°N, 11.0°E) | |||
| 03 Nov 1997 | 13-26 (17.4) | 1.07 (1.13) | -- |
| 08 Nov 1997 | 10-26 (19.9) | 1.06 (1.13) | -- |
| 10 Nov 1997 | 9-25 (18.9) | 1.08 (1.15) | -- |
| 19 Nov 1997 | 10-24 (20.3) | 1.06 (1.12) | -- |
| 27 Nov 1997 | 10-23 (16.0) | 1.07 (1.13) | -- |
| 09 Jan 1998 | 10-26 (21.9) | 1.08 (1.15) | -- |
| 30 Jan 1998 | 11-28 (14.7) | 1.07 (1.13) | -- |
| 13 Feb 1998 | 12-30 (18.1) | 1.08 (1.16) | -- |
| 18 Feb 1998 | 12-27 (18.3) | 1.09 (1.18) | -- |
| 10 Mar 1998 | 11-33 (17.3) | 1.10 (1.20) | -- |
| 25 Mar 1998 | 10-28 (17.0) | 1.05 (1.09) | -- |
| 14 Apr 1998 | 11-32 (16.3) | 1.07 (1.13) | -- |
A graph of integral stratospheric aerosol backscatter (figure 5) shows how the stratospheric aerosol load had declined by the end of 1997 to pre-Pinatubo values. More observations are needed to decide whether a new background level has been reached or will be reached in the near future.
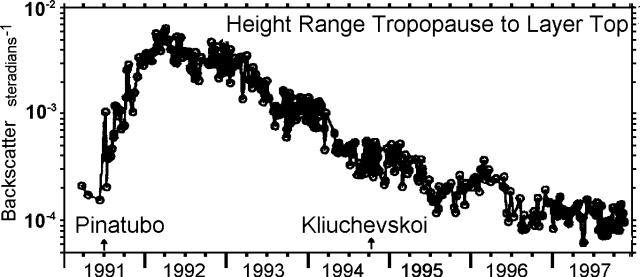 |
Figure 5. Graph showing the log of the lidar backscatter versus time at Garmisch-Partenkirchen, Germany for the latter two-thirds of 1991 through end-1997. The plotted data are preliminary 532 nm integral values of stratospheric aerosol backscatter (integrated from the tropopause or cirrus to the top of the aerosol layer) versus time. Labeled arrows indicate the eruptions of Pinatubo and Kliuchevskoi. Courtesy of Horst Jäger. |
Information Contacts: Mary Osborn, NASA Langley Research Center (LaRC), Hampton, VA 23665 USA; Horst Jäger, Fraunhofer -- Institut für Atmosphärische Umweltforschung, Kreuzeckbahnstrasse 19, D-82467 Garmisch-Partenkirchen, Germany.