Report on Guagua Pichincha (Ecuador) — September 1999
Bulletin of the Global Volcanism Network, vol. 24, no. 9 (September 1999)
Managing Editor: Richard Wunderman.
Guagua Pichincha (Ecuador) Magmatic outbursts; unprecedented seismicity; explosions up 2-fold
Please cite this report as:
Global Volcanism Program, 1999. Report on Guagua Pichincha (Ecuador) (Wunderman, R., ed.). Bulletin of the Global Volcanism Network, 24:9. Smithsonian Institution. https://doi.org/10.5479/si.GVP.BGVN199909-352020
Guagua Pichincha
Ecuador
0.171°S, 78.598°W; summit elev. 4784 m
All times are local (unless otherwise noted)
This report chiefly covers the turbulent period of 1 September through 19 October 1999. Histograms available on the Instituto Geofísico's website for the crisis interval through 31 October illustrated that September and October had a striking abundance of both phreatic explosions and earthquakes. The monthly explosion count for October 1999 (53 phreatic explosions) was almost double any other month during the crisis.
Despite the steep increases in explosions and earthquakes during September and October, non-explosive episodes were common during the reporting interval. They were marked with fumarolic emissions rising from a few meters to a few kilometers above the summit vent.
Microscopic inspection of tephra erupted on 30 August led researchers to conclude that the explosions to that point had continued to eject older, non-juvenile material. But John Ewert of the USGS noted that juvenile pumice of dacitic composition began to appear in deposits starting on 26 September. And, the comparatively large 5 and 7 October eruptions both contained similar juvenile pumice.
The intracrater dome, cold at the start of the crisis, began to grow by lava extrusion around 28 September. The volume of material extruded was small,3. The comparatively large eruptions on 5 and 7 October excavated part of the dome and sent pyroclastic flows 4-5 km down the W-flank into the Rio Cristal. Shortly after both events Ewert shot videos of their still-steaming deposits.
Earthquakes. Compared to the earlier stages of the crisis, the number of multiphase, volcano-tectonic, and long-period earthquakes grew sharply during September and October. For all three types, the highest numbers seen during the entire crisis interval (July 1998-October 1999) took place during October when multiphase earthquakes occurred 15,024 times, volcano-tectonic, 1,701 times, and long-period, 15,075 times. Omitting September 1999 and comparing the October 1999 earthquakes to the previous monthly highs during the crisis, one obtains the following: multiphase earthquakes underwent a 7-fold increase; volcano-tectonic earthquakes, a ~10-fold increase; and long-period earthquakes, an impressive ~70-fold increase. It was not just the numbers of events that rose. Seismic amplitudes at stations 7 to 9 km from the summit increased notably during September and October. Many of the earthquakes had depths between the surface and 6 km.
Eruptions. Table 5 provides an overview of some of the interval's larger outbursts. The one on 3 September yielded a reduced displacement (RD) of over 25 cm2. The event generated a plume to ~5.5 km altitude, which could be seen from Quito and included four distinct explosions (at 0723, 0726, 0743, and 0751). The plume dispersed after 30 minutes. Ash fall concentrated over the N flank. The next day, aerial observers noted that the 1981 crater had merged with another recent one, leaving a larger, roughly E-W trending crater in the vent area.
Table 5. Noteworthy explosions at Guagua Pichincha during 3 September through 19 October 1999. Cases shown are those where reduced displacements were stated in daily reports, with the exception of 7 October, for which the explosion's RD remained undisclosed. Plume heights were frequently undetermined due to restricted visibility (eg. darkness and clouds). Courtesy of the Instituto de Geofísico.
| Date | Reduced displacement (RD, cm2) | Estimated plume altitude (km) and displacement direction |
| 03 Sep 1999 | > 25 | 5.5 km |
| 07 Sep 1999 | > 21, < 5 | -- |
| 08 Sep 1999 | 22, 5 | ~ 2 km W |
| 09 Sep 1999 | 3 | -- |
| 12 Sep 1999 | 6, 18 | 4 km |
| 15 Sep 1999 | 20 | 4 km; W and N |
| 20 Sep 1999 | > 21 | 1.5-2.5 km |
| 22 Sep 1999 | > 21 | 5-6 km |
| 23 Sep 1999 | < 5 | -- |
| 24 Sep 1999 | > 21 | -- |
| 26 Sep 1999 | 21 | -- |
| 02 Oct 1999 | 1.4 | 4 km |
| 04 Oct 1999 | 12 | -- |
| 05 Oct 1999 | 36 | 8 km; E and W |
| 07 Oct 1999 | -- | 16.5 km; E and W |
| 09 Oct 1999 | 2.7 | -- |
| 13 Oct 1999 | 3 | -- |
| 15 Oct 1999 | 8.9 | -- |
| 16 Oct 1999 | 4.2 | -- |
| 18 Oct 1999 | 16 | 10 km |
| 19 Oct 1999 | 8.3 | -- |
The 26 September explosion was described as "important." The loud noise accompanying the early morning outburst (at 0315) awakened residents on the SSW flank in Lloa (see maps in BGVN 23:09). Ash fell over some areas; a lahar moved down the W flank Rio Cristal.
Eruption on 5 October. The explosion with the largest reduced displacement disclosed during the reporting interval (36 cm2) happened on 5 October; it was associated with an ash column to over 8 km altitude. The explosion vented on the caldera's W side; observers on the scene saw airborne material move SW and SE. In addition, the next day it was reported that ash thicknesses of 2 and 3 mm were found in central and N Quito as well as the settlement of Nono. Accumulated ash in other sectors (Mindo, Cumbayá, Tumbaco, Conocoto, El Tingo, Pomasqui, and Guayllabamba) reached only minor thicknesses. On the morning of 6 October, technicians visiting monitoring stations found ash-covered solar panels.
The 6 October issue of the newspaper Diario Hoy reported that the 5 October eruption took place at 1409, and that residents in S Quito heard the explosion. They also said that the resulting plume attained a height of 20 km. Diario Hoy further wrote that one hour after the audible sound, the first ash particles descended on N Quito, which became darkened by an enormous gray cloud. In four hours the cloud covered the city in a thick fog-like mantle; Marshal Sucre airport closed at 1730. The paper noted that Quito citizens would find their normal potable water supply intact. The news report added a comment by the mayor that this behavior could persist for months or even years. Although the news report, and other information around this time described the eruption as phreatic, tephra samples indicated the presence of juvenile pumice (mentioned above), indicating that the eruption was at least partly magmatic.
Observers on a flight at around 0800 on 6 October over the S part of the volcano confirmed extensive coverage of ash, but they saw vigorous, 3-km-tall fumarolic plumes-not ash plumes-being emitted. Ash hanging over Quito at that time was therefore assumed to mainly have resulted from earlier deposited ash remobilized by traffic and wind. The 5 October eruption column was captured on NOAA GOES-8 imagery, which can be viewed as a time-lapse animation, revealing some of the dynamics of the ash column (for URL, see discussion below). Portions of the rising column split into components directed E and W, forming what appeared as a dumbbell-shaped bifurcating plume. A plume on 7 October behaved in much the same way. In both cases, analysts attributed the bifurcation to wind shear.
Eruption on 7 October. Another comparatively large explosion took place the morning of 7 October (figure 16). Hugo Yepes, John Ewert, and Dan Miller of the Instituto and USGS accompanied Ecuador's president and members of the media on a flight just after the explosion. The pilot tried to approach the S flank but a curtain of falling ash prevented the occupants from seeing into the caldera. Ash fell over Quito, the Capital. The U.S. National Oceanographic and Atmospheric Administration (NOAA) reported that the plume rose to 16.5 km altitude.
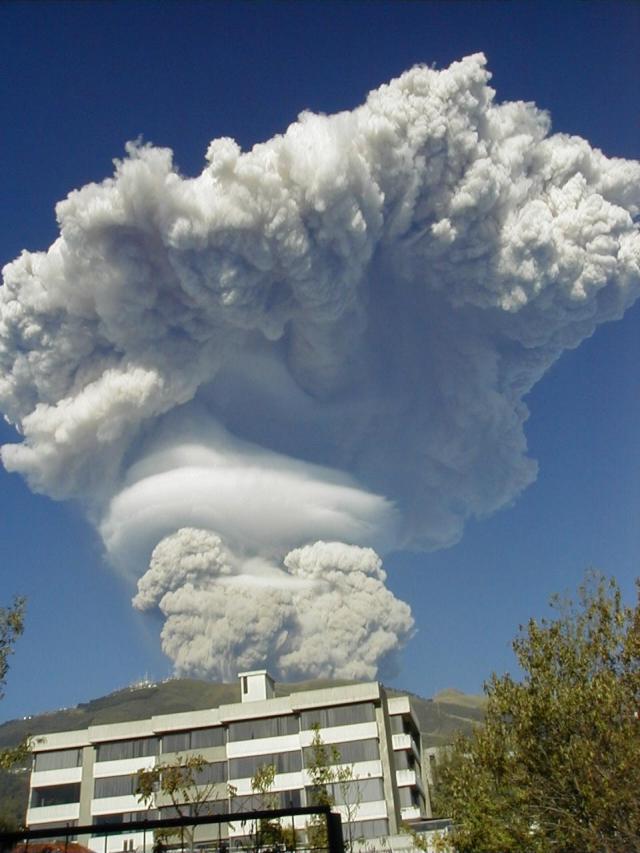 |
Figure 16. Guagua Pichincha's ascending ash plume at 0730 on 7 October 1999 as shot with a digital camera from the uplands of Quito. Pichincha's summit vent was ~ 11 km W, lying well behind the peak in the foreground. Courtesy of Arden and Debra Burgess. |
Regarding the 7 October explosion, the Diario Hoy's headline read "Guagua: A million tons of ash." The article went on to note that the Instituto estimated 1.1 x 10⁶ metric tons of ash lay within 15 km of the summit. Thicknesses of 1-3 mm accumulated in the northern parts of Quito. Ash clean-up proceeded within the city and at the airport. The article went on to caution that in a stronger eruption 5-10 cm of ash might fall on the city.
In similar manner to satellite images of the 5 October plume, those of the 7 October plume showed that it also bifurcated. Figure 17 shows GOES-8 visible imagery available on websites operated by both NOAA and the Cooperative Institute for Meteorological Satellite Studies (CIMSS) at the University of Wisconsin. An initial pre-eruption image was made at 0645 (1145 GMT) (not shown on figure 5); the image a half hour later showed the plume at an early stage. Due to variable wind shear with height, the advecting 7 October plume moved in two directions: the highest portion (~15 km in altitude) drifted W, away from Quito, while a lower portion (~12 km in altitude) drifted E over Quito.
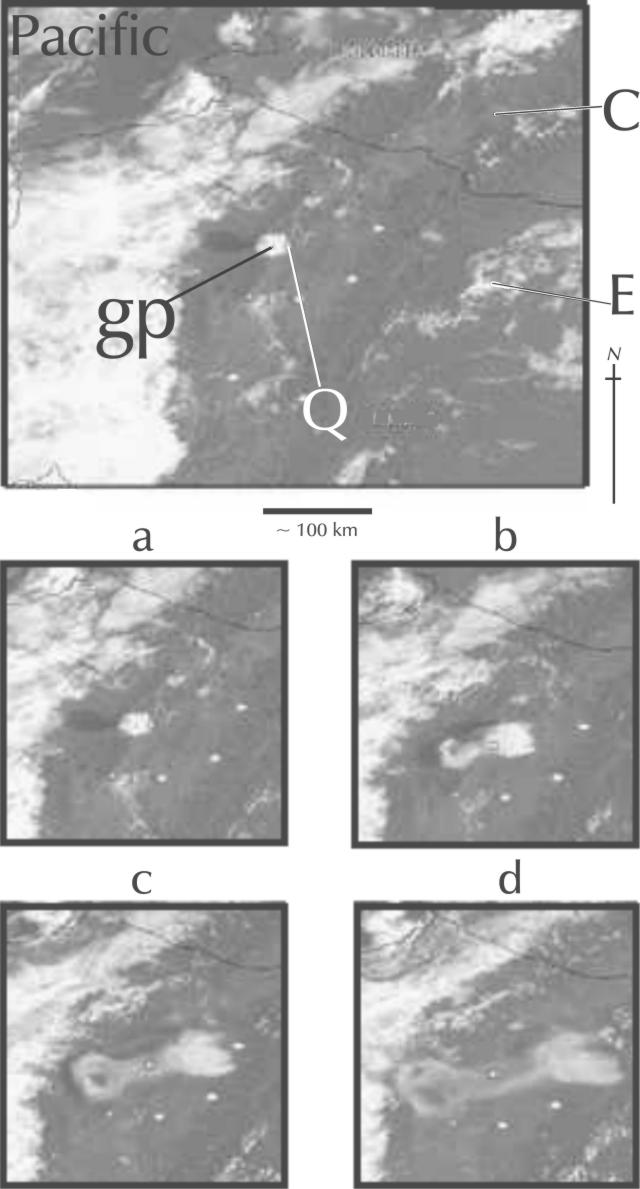 |
Figure 17. GOES-8 satellite images showing the dynamics of Guagua Pichincha's ascending 7 October plume. All images came from visible wavelengths; they are all similarly oriented and at identical scales although the upper image covers a larger area. The upper image shows the location of Guagua Pichincha (gp) and Quito (Q). Clouds on that image lay over parts of the Pacific Ocean and Ecuador (E), but N-central Ecuador and much of Colombia (C) remained unobscured. The first image (a) was taken directly from the larger one; both were captured at 0715 (1215 GMT). In the first image (a) the plume was compact and circular. The image at 0745 (b) shows the plume beginning to split into components directed W towards the Pacific, and E over Quito. The two components may have differed slightly in reflectivity. By 0815 (c), the plume had become decidedly dumb-bell shaped with the area above the volcano becoming relatively diffuse. The plume continued to spread at 0845 (d), where now the W component had also become diffuse. The eastern plume still sustained a relatively dense white color. These and associated images are displayed as time-lapse animations on NOAA and CIMSS websites (see URLS below). Courtesy of NOAA and CIMSS. |
Other processed views and animations of the 7 October plume dynamics were also available on the web. Scott Bachmeier at CIMSS posted an image prepared from GOES infrared (IR) data. He used a difference or "split window" technique that enhances the ash plume. Radiation escaping from a body can be described in terms of emissivity (emissive power). The emissivity of silicate particles within an ash plume varies with wavelength. This image processed the wavelengths 10.7 and 12.0 micrometers, which led to brightness temperature differences of 1-5 Kelvin. The IR difference product shows the ash plume very well initially; but later, the plume became thinner, losing its identity on the IR difference product images.
The eastern portion of the 7 October ash plume was tracked for a longer time on the GOES 6.7 micrometer IR ("water vapor") channel. Due to the generally dry middle and upper troposphere over northern South America that day, the water vapor content in the higher plume created a discernible contrast that drifted eastward across Ecuador toward Colombia and Perú.
John Ewert took videos of the plume's dynamics, as seen from the ground. From that perspective the ascending plume appeared to have a strong rotational component. He also noted that these plumes' behaviors were hard to forecast from available wind data.
Background. On September 27, the Mayor of Quito closed schools and raised the alert from yellow to orange signifying a possible eruption within days (BGVN 24:08). About a week later the character of the alerts was revised to become more local in scope. For example, on the W flank, small settlements incorporating about 60 families along the Rio Cristal were evacuated and the status there stood at the highest level, red. The SSW flank city of Lloa remained at orange alert; and in Quito, it returned to yellow where it remained throughout the reporting period, including during times of ashfall.
During early October, the U.S. State Department issued these statements: "Geological experts conclude that the city of Quito is protected from possible lava flows, avalanches, and lateral explosions by the bulk of Pichincha Mountain, which stands between the city and the volcano crater. Parts of Quito could be affected by secondary mud flows caused by heavy rains that usually accompany an eruption. The entire city could also be affected by slight to significant ash falls and resulting disruptions of water, power, communications, and transportation. According to geological experts, lava flows, ash falls, avalanches, and lateral explosions would almost certainly head W and SW from the volcano, in the direction of three small communities, Lloa, Mindo, and Nono, popular destinations for birdwatchers. Travelers should avoid these towns."
In addition to Guagua Pichincha, a second volcanic crisis has developed at Tungurahua. Volcanological and geophysical colleagues from multiple countries have participated, or continue to collaborate in instrumenting and monitoring these crises. In the midst of these events Ecuador's economy has undergone a serious downturn with the currency recently declining in value by more than 50%.
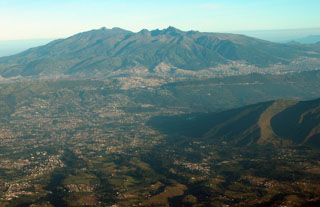
Geological Summary. Guagua Pichincha and the older Pleistocene Rucu Pichincha stratovolcanoes form a broad volcanic massif that rises immediately W of Ecuador's capital city, Quito. A lava dome grew at the head of a 6-km-wide scarp formed during a late-Pleistocene slope failure ~50,000 years ago. Subsequent late-Pleistocene and Holocene eruptions from the central vent consisted of explosive activity with pyroclastic flows accompanied by periodic growth and destruction of the lava dome. Many minor eruptions have been recorded since the mid-1500's; the largest took place in 1660, when ash fell over a 1,000 km radius and accumulated to 30 cm depth in Quito. Pyroclastic flows and surges also occurred, primarily to then W, and affected agricultural activity.
Information Contacts: Instituto Geofísico (URL: http://www.igepn.edu.ec/); John Ewert, Volcano Disaster Assistance Team (VDAP), United States Geologic Survey (USGS), Cascades Volcano Observatory, 5400 MacArthur Blvd., Vancouver, WA 98661 USA (URL: https://volcanoes.usgs.gov/observatories/cvo/); Diario Hoy ("Hoy Digital,", URL: http://www.hoy.com.ec/); Arden and Debra Burgess, Centro Aereo 1Q1702, P.O. Box 02-5268, Miami, FL 33102-5268 USA; NOAA/NESDIS Operational Significant Event Imagery Support Team, E/SP22, 5200 Auth Road, Camp Springs, MD 20746-4304 USA (URL: https://www.nnvl.noaa.gov/); Scott Bachmeier, Cooperative Institute for Meteorological Satellite Studies (CIMSS), University of Wisconsin, 1225 West Dayton St., Madison, WI 53706 USA (URL: http://cimss.ssec.wisc.edu/).