Report on Guagua Pichincha (Ecuador) — October 1999
Bulletin of the Global Volcanism Network, vol. 24, no. 10 (October 1999)
Managing Editor: Richard Wunderman.
Guagua Pichincha (Ecuador) A growing dome, high seismicity, and wind-assessment challenges
Please cite this report as:
Global Volcanism Program, 1999. Report on Guagua Pichincha (Ecuador) (Wunderman, R., ed.). Bulletin of the Global Volcanism Network, 24:10. Smithsonian Institution. https://doi.org/10.5479/si.GVP.BGVN199910-352020
Guagua Pichincha
Ecuador
0.171°S, 78.598°W; summit elev. 4784 m
All times are local (unless otherwise noted)
This report covers 20 October through 21 November 1999, an interval when the new, still-emerging dome exceeded half the height of the adjacent 1660 dome, and in addition extruded a 75-m-tall spine. Seismic records through 31 October illustrated that September and October had a striking abundance of both earthquakes and phreatic explosions (figures 18 and 19). In contrast to September and the first two-thirds of October (BGVN 24:09), during this interval explosions were comparatively rare (table 6).
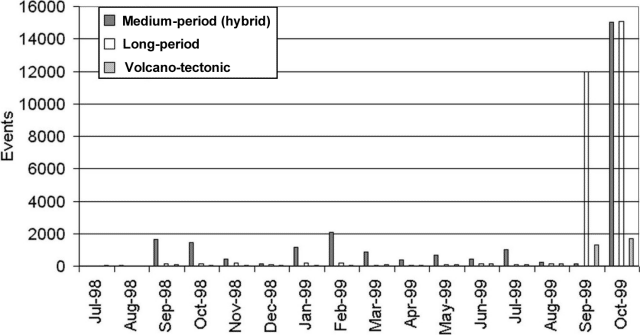 |
Figure 18. The number of monthly earthquakes at Guagua Pichincha during July 1998-October 1999. Earthquakes are reported in three categories (shown left-to-right for each month): medium-period (hybrid), long-period, and volcano-tectonic. For July 1998, registered events in these categories were 0, 8, and 45, respectively. Hybrid earthquakes generally dominated the record until September 1998 when the long-period earthquakes became most common. Hybrid earthquakes, typically found at less than 3 km depth below the caldera, are here defined as having noteworthy spectral energy at both 1.8-2 Hz and 3-6 Hz, with the higher frequency particularly conspicuous in the early arrival portion of the record. Volcano-tectonic earthquakes only appear for September and October 1999 at this scale. Courtesy of the Geophysical Institute. |
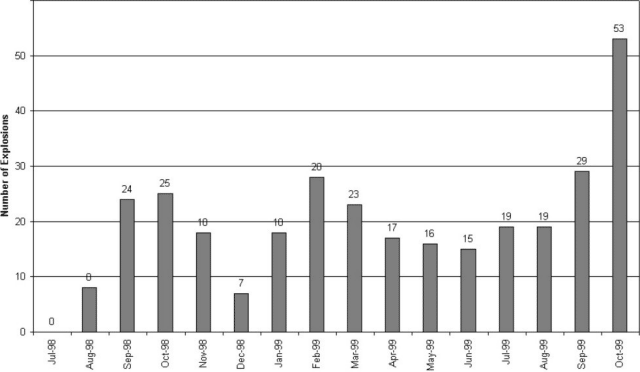 |
Figure 19. The number of monthly explosions at Guagua Pichincha, July 1998-October 1999. Courtesy of the Geophysical Institute. |
Table 6. A summary of 20 October-21 November events at Guagua Pichincha as conveyed in the Geophysical Institute's daily reports. Unless noted otherwise, the stated plume and column heights (e.g. "1.5 km plume") refer to the distance from the plume's base to its top. Courtesy of the Geophysical Institute.
| Date | Explosions | Estimated plume heights and other comments |
| 20 Oct 1999 | 0 | -- |
| 21 Oct 1999 | 0 | An overflight took place and surficial evidence of dome building was noted |
| 22 Oct 1999 | 0 | Strong fumarolic activity seen and heard, steam rising to ~1.5-2 km |
| 23 Oct 1999 | 0 | 2-km steam plume |
| 24 Oct 1999 | 0 | 1.5-km steam plume |
| 25 Oct 1999 | 0 | 1.6-km steam plume |
| 26 Oct 1999 | 0 | 2.5-km steam plume; aerial observers found evidence of continued venting of tephra |
| 27 Oct 1999 | 0 | 1.5-km steam plume |
| 28 Oct 1999 | 0 | Red tephra covering caldera; slight growth and plentiful fractures noted in dome area; COSPEC measurements failed to show important variations (values unreported) |
| 29 Oct 1999 | 0 | 1.2-km high plumes bearing wind-blown ash; low fumarolic activity |
| 30 Oct 1999 | 0 | Ongoing dome growth; limited fumarolic activity |
| 31 Oct 1999 | 0 | Rockfalls in the dome area; limited fumarolic activity |
| 01 Nov 1999 | 0 | Plume to 1.3 km; some plumes appeared tinted blue or red |
| 02 Nov 1999 | 0 | Plume to under 1 km; an infrared camera indicated a source of high heat flux in the dome area. |
| 03 Nov 1999 | 0 | Steam plume to under 1 km; low fumarolic emission rates |
| 04 Nov 1999 | 0 | Reddish gray fumarolic plume to 1.2-1.3 km; rocks sliding off dome's carapace to W |
| 05 Nov 1999 | 0 | -- |
| 06 Nov 1999 | 0 | Cloudy, but an observer heard noises attributed to avalanches |
| 07 Nov 1999 | 0 | New growth recognized on the active dome, which rose ~ 10 m above the middle of the 1660 dome. |
| 08 Nov 1999 | 0 | -- |
| 09 Nov 1999 | 0 | Degassing vapor appeared gray and occasionally earth-toned in color as it rose ~ 800 m. The dome extrusion included a 75-m-tall spine. |
| 10 Nov 1999 | 1 | Small explosion; fumarolic plumes rose to ~1.5 km |
| 11 Nov 1999 | 0 | -- |
| 12 Nov 1999 | -- | Not posted |
| 13 Nov 1999 | -- | The depression hosting the new dome had increased in diameter; materials detached from both the new dome and its spine. |
| 14 Nov 1999 | 0 | Low fumarolic activity |
| 15 Nov 1999 | 0 | Rapid dome growth continued; 2 km tall column incorporating dust from an intracrater landslide |
| 16 Nov 1999 | 0 | -- |
| 17 Nov 1999 | 16 | Explosion signals. The most important explosion signals had reduced displacements of 13 and 26 cm2. The weather was cloudy, with abundant airborne ash; the official press release noted that during the afternoon a light gray ash column attained an altitude of 5 km, but the text stated the column only contained a minor ash component. |
| 18 Nov 1999 | 1 | This eruption took place at 2126 and had a reduced displacement of 18 cm2. The resulting plume rose to an altitude of 9 km. |
| 19 Nov 1999 | 0 | 1.2-km-high fumarolic plume |
| 20 Nov 1999 | 0 | Cloudy |
| 21 Nov 1999 | 0 | Cloudy |
Reports and observations of dome growth were sporadic, interrupted by bad weather and the difficulty of monitoring the intracrater area. On 21 October dome material extruded at a spot W of the 1660 dome. Mid-November reports repeatedly noted rapid dome growth, although this was occasionally offset by intervals with abundant mass-wasting. The daily report on 4 November noted that the cumulative energy from long-period earthquakes was larger than that seen prior to the 5 October eruption. Substantial, though not necessarily larger, outbursts occured after 21 November.
Data from the Geophysical Institute indicated that robust seismicity continued through much of November. There were more total earthquakes in November than in either September or October. The biggest differences occurred in long-period and medium-period (hybrid) earthquakes, both of which rose substantially in November and dominated the number of earthquakes registered in September-October (figure 1). Four November days had long-period earthquake peaks equivalent to or larger than the daily number seen in October. The number of hybrid earthquakes fell in the last week of October, but considerable numbers continued through about 10 November. Volcano-tectonic earthquakes peaked in October. Rockfalls also peaked in October but a second, broader peak occurred into November.
Winds aloft. The morphology of the volcano, its proximity to Quito, and deposits from previous eruptive episodes suggest airborne ash as a key hazard. To forecast when ash will fall in Quito requires knowing the local winds from the altitude of the volcano to the top of the ash column.
According to John Ewert, historical wind data were obtained from reports by the Civil Aviation Agency (Direccion De Aviacion Civil, DAC), which were summarized in Barberi and others (1992). Useful as background for planning purposes, these historical records are less relevant than actual wind velocity data at the time of the eruption. Daily wind directions are reported by NOAA, derived in part from automated routines that track cloud and water vapor drift on Geostationary Operational Environmental Satellite (GOES) images. Such data are fairly accurate for the troposphere, but at least one of the larger eruptions in early October penetrated through the troposphere and entered the stratosphere at ~11 km. But, obtaining stratospheric wind data has proven difficult.
Some relevant wind field observations can come from aviators in aircraft equipped with suitable navigation instruments. Accordingly, scientists suggested this to the Ecuadorian Civil Aviation agency, who requested that pilots in the area call in their GPS-derived cockpit wind measurements. Although this has been helpful for understanding the local tropospheric winds, it still left the higher altitudes winds uncharted.
On their website, the Geophysical Institute has posted wind data derived from atmospheric wind measurements by radiosondes ("weather balloons") launched from the critical region of interest and penetrating well into the stratosphere (to altitudes over ~30 km)-but these were unavailable in early October. At the Instituto's request, the U.S. Office of Federal Disaster Assistance provided funding for a U.S. Air Force meteorological team to travel to Ecuador to work with the Ecuadoran Meteorological Institute (INAMHI) and the Civil Aviation Agency to better define the local wind fields. The Air Force team repeatedly conducted the highly desirable radiosonde measurements. Ewert said the Air Force team returned to the U.S., so he was not sure how long such radiosondes probes would continue.
In early October, Ewert tried to obtain realistic models of plume drift to understand the dispersal of potential large ash columns at Pichincha. He did so using the Volcanic Ash Forecast Transport And Dispersion (VAFTAD) model that was developed by NOAA's Air Resources Laboratory (Heffter and Stunder, 1993) to support the Washington and Anchorage Volcanic Ash Advisory Centers (VAACs). Ewert gained access to the model using the NOAA web site. The site contains VAFTAD model output issued by NOAA in response to individual eruptions.
VAFTAD uses output from the NOAA global meteorological model. Grid dimensions vary with latitude; near the equator the horizontal grid is ~100 km to a side (farther towards the poles at 60 degrees latitude, ~190 km to a side). The concentration grid dimensions are set to half the size of the horizontal grid (i.e. ~50 km to a side near the equator). Given these dimensions, its not surprising that Ewert found VAFTAD only marginally effective for comprehension of ash dispersal in areas immediately adjacent Pichincha (and Tungurahua). What is needed is a more local-scale modeling capability for Pichincha based on an understanding of the local-scale 3-D meteorology. According to atmospheric modeler J. L. Heffter, serious modeling challenges in South America also include the effects of terrain, local air flow patterns, and a broad scarcity of meteorological data. In the absence of such models, Ewert concluded that the local radiosonde data was the best practical solution for gauging the velocity of winds aloft. Atmospheric modeler Barbara Stunder of NOAA also concluded that local radiosonde data extrapolated out a few hours may give a sufficient forecast of transport velocity.
On their Real-time Environmental Applications and Display sYstem (READY) website, NOAA displays regular VAFTAD forecasts for hypothetical eruptions for planning purposes. These include dispersal models for Pichincha, and 10 other recently active volcanoes (Augustine, Colima, Fuego, Kliuchevskoi, Pacaya, Pavlof, Popocatépetl, Shishaldin, Soufriere Hills, and Tungurahua). These models are run automatically once a day and the resulting plume forecasts appear on charts. In addition, from this same website, users can run the VAFTAD model for volcanic eruptions at any location.
As a historical note, during the Cook Inlet eruptions, NOAA's forecast wind field data were accessed using a personal computer to print out projected trajectories. In the case of the 24 February 1990 eruption of Redoubt, which reached ~8.5 km altitude, the actual ground deposit was surprisingly close to the relevant projected trajectories (Murray and others, 1994). Currently, the Canadian Volcanic Ash Advisory Center (VAAC) provides a web-accessible, real-time trajectory modeling routine for selected volcanoes on North America and elsewhere.
References. Barberi, F., Ghigliotti, M., Macedonio, G., Orellana H., Pareschi M.T., and Rosi, M., 1992, Volcanic hazard assessment of Guagua Pichincha (Ecuador) based on past behavior and numerical models: Journal of Volcanology and Geothermal Research, v. 49, no. 1-2, p. 53-68.
Heffter, J.L., and Stunder, B.J.B, 1993, Volcanic Ash Forecast Transport And Dispersion (VAFTAD) model: Weather Forecasting, v. 8, p. 534-541.
Murray, T.L., Bauer, C.I., and Paskievitch, J.F., 1994, Using a personal computer to obtain predicted plume trajectories during the 1989-90 eruption of Redoubt Volcano, Alaska: in USGS Bulletin 2047-Volcanic Ash and Aviation Safety, p. 253-256.
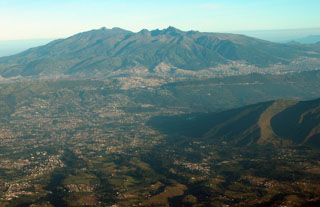
Geological Summary. Guagua Pichincha and the older Pleistocene Rucu Pichincha stratovolcanoes form a broad volcanic massif that rises immediately W of Ecuador's capital city, Quito. A lava dome grew at the head of a 6-km-wide scarp formed during a late-Pleistocene slope failure ~50,000 years ago. Subsequent late-Pleistocene and Holocene eruptions from the central vent consisted of explosive activity with pyroclastic flows accompanied by periodic growth and destruction of the lava dome. Many minor eruptions have been recorded since the mid-1500's; the largest took place in 1660, when ash fell over a 1,000 km radius and accumulated to 30 cm depth in Quito. Pyroclastic flows and surges also occurred, primarily to then W, and affected agricultural activity.
Information Contacts: Geophysical Institute (Instituto Geofísico), Escuela Politécnica Nacional, Apartado 17-01-2759, Quito, Ecuador; John Ewert, Volcano Disaster Assistance Team (VDAP), United States Geologic Survey (USGS), Cascades Volcano Observatory, 5400 MacArthur Blvd., Vancouver, WA 98661 USA (URL: https://volcanoes.usgs.gov/observatories/cvo/); Barbara Stunder, NOAA Air Resources Laboratory (ARL), 3rd Floor, 1315 East-West Highway, Silver Spring, MD 20910 USA (URL: http://www.arl.noaa.gov/); NOAA/NESDIS Operational Significant Event Imagery Support Team, E/SP22, 5200 Auth Road, Camp Springs, MD 20746-4304 USA (URL: https://www.nnvl.noaa.gov/); Montreal Volcanic Ash Advisory Centre, Operations Branch, Canadian Meteorological Centre, 2121 Voie de Service Nord, Route Transcanadienne, Dorval, Québec H9P 1J3, Canada (URL: http://www.cmc.ec.gc.ca/cmc/cmoe/vaac/A-vaac.html).