Report on Tungurahua (Ecuador) — July 2001
Bulletin of the Global Volcanism Network, vol. 26, no. 7 (July 2001)
Managing Editor: Richard Wunderman.
Tungurahua (Ecuador) Summary of August 2000-August 2001 eruptive activity
Please cite this report as:
Global Volcanism Program, 2001. Report on Tungurahua (Ecuador) (Wunderman, R., ed.). Bulletin of the Global Volcanism Network, 26:7. Smithsonian Institution. https://doi.org/10.5479/si.GVP.BGVN200107-352080
Tungurahua
Ecuador
1.467°S, 78.442°W; summit elev. 5023 m
All times are local (unless otherwise noted)
Tungurahua was last discussed in BGVN 25:07, in a report covering the first half of the year 2000. This report was taken chiefly from available updates on the Instituto Geofísico (IG) website. Some of the graphics currently available there and discussed in this report cover the interval 1998-2000.
The subsequent part of this report focuses on activity from August 2000 through 15 August 2001. During this latter interval, aviation reports were issued daily, often several times a day. The final section of this report presents some statistics on Tungurahua's recent human impact from a report issued on 5 September 2001.
Tunguharua's continued eruptions were accompanied by varying SO2 fluxes, tremor, and earthquakes. Hazard concerns remained high, and plume heights reached over 11 km altitude (5 km over the summit) on three days in the first half of August 2001.
Observations during 2000. Between January and October 2000 Tungurahua produced significant discharges and explosions, some of which included impressive ash columns and shows of lava in the crater documenting the presence of shallow magma in the edifice. Seismically inferred magmatic intrusions took place in January, April-May, and August-October 2000. The critical seismicity included intense tremor and swarms of long-period and volcano-tectonic earthquakes.
As shown on figure 7, earthquakes of long-period (LP) and volcano-tectonic (VT) types both underwent progressive increases during the year 2000 but decreased again by November 2000. (More recent data were unavailable at the time of this writing.) Earthquakes attributed to explosions grew in number suddenly during November 1999 and then subsequently proceeded to decrease in number until becoming inconspicuous during late 2000. Elevated numbers of earthquakes, particularly LP earthquakes, correlated with eruptive outbursts (arrows). High numbers of LP earthquakes also persisted between outbursts.
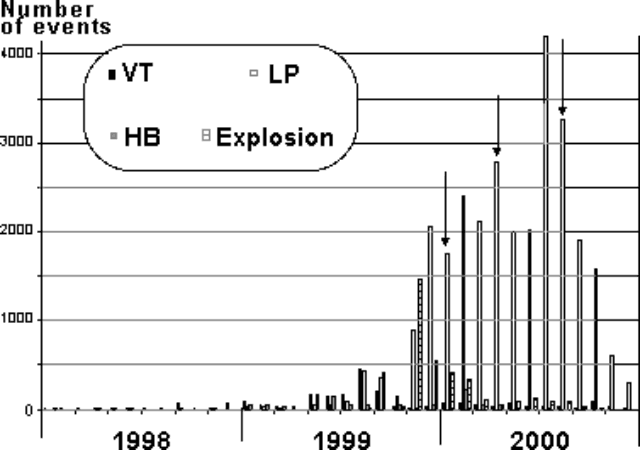 |
Figure 7. Monthly number of earthquakes registered at Tungurahua during January 1998 to December 2000. High numbers of volcano-tectonic and long-period earthquakes generally occurred starting in middle to late 1999. Around this time, earthquakes with explosion signatures were sometimes abundant as well. Arrows indicate times of seismically inferred magmatic intrusions. Courtesy of Instituto Geofisico. |
Figure 8 illustrates how during September 1999-December 2000 the energy contained in combined harmonic tremor and hydrothermally generated tremor underwent a sudden peak in January 2000, a time when the numbers of earthquakes seen on figure 1 also showed a strong rise. Two subsequent, progressively smaller peaks in tremor energy occurred at roughly 4-month intervals. Intervals of high tremor energy strongly correlated with eruptive outbursts.
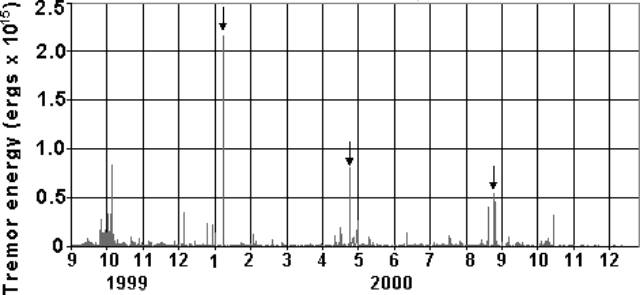 |
Figure 8. At Tungurahua, the energy contained in tremor (both harmonic and hydrothermal types) during September 1999-December 2000. The interval of maximum tremor energy, around January 2000, developed rapidly and then decreased through time at least as late as December 2000. The intervals that included the highest tremor energy were inferred to reflect magmatic intrusions (arrows). Courtesy of Instituto Geofisico. |
SO2 flux climbed to over 10,000 tons/day during late 1999 and early 2000, but dropped thereafter stabilizing in the hundreds of tons per day range in late 2000 (figure 9). A synopsis of SO2 flux has yet to be reported for 2001. A statement discussing the week of 10-16 January 2001 noted that SO2 flux had been in the 1,000 tons/day range but had risen to 2,000-2,400 tons/day. During that same week, new fumaroles were noted at an inaccessible spot on the NW flank above Baños. Plumes that week rose at least one kilometer over the summit (table 4).
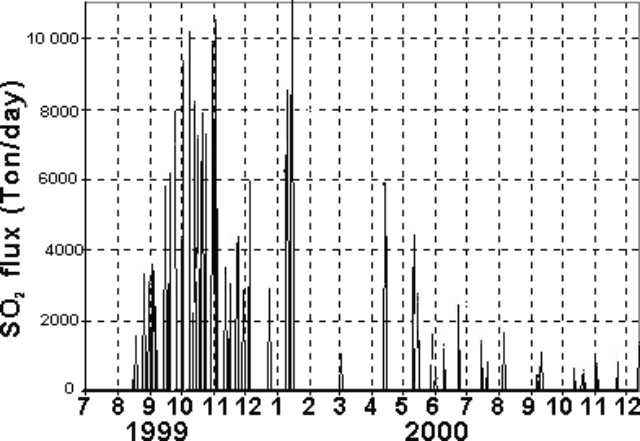 |
Figure 9. SO2 flux measured at Tungurahua during July 1999-December 2000. After the large peaks (~10,000 tons/day) the SO2 values dropped significantly and then tended to decrease through the end of 2000. Courtesy of Instituto Geofisico. |
Table 4. A summary of hazard status and plume height observations for Tungurahua, 1 November 2000 to 21 August 2001. These data were summarized from GVP / USGS WeeklyRreports derived from IG data. Some of the taller plume heights came from the Washington VAAC and were based on satellite imagery and local aviation reports.
| Dates | Description of Activity |
| 01 Nov-07 Nov 2000 | Plumes 0.5 km above crater. |
| 08 Nov-14 Nov 2000 | 13 November small ash cloud near the summit level blown SE. |
| 22 Nov-28 Nov 2000 | 27 November small ash-and-gas discharges reached 0.5 km above the summit. |
| 29 Nov-05 Dec 2000 | Sporadic gas column. Plumes 0.3-0.5 km above crater. |
| 06 Dec-12 Dec 2000 | 9 December ash cloud moving SW at summit height. |
| 13 Dec-19 Dec 2000 | 14 December ash cloud moving NE at 0.5 km above the summit. |
| 20 Dec-26 Dec 2000 | 21 December ash cloud at 1 km above the summit but not seen on GOES-8 imagery. |
| 03 Jan-09 Jan 2001 | Plumes seen several times during this week; no ash visible. Emissions on 3-4 January were moderate sized and ash bearing. 2.9-km maximum plume height. |
| 10 Jan-16 Jan 2001 | Plumes ~ 2 km above crater. |
| 17 Jan-23 Jan 2001 | Plumes ~ 2 km above crater. |
| 14 Feb-20 Feb 2001 | 19 February lahars down NW flank via Cusua Gorge; steam column to 1 km. |
| 21 Feb-27 Feb 2001 | Plumes ~ 4 km above crater. |
| 14 Mar-20 Mar 2001 | 13 March ash cloud moving NW at 4.6 km above the summit. 15 March ash cloud 3.2 km above the summit. 16 March ash cloud 3.8 km above the summit. |
| 21 Mar-27 Mar 2001 | 22 March incandescent eruption column 2 km above the summit; 23 March ash cloud ~2 km above the summit resulting from a half-hour emission. |
| 28 Mar-03 Apr 2001 | 29 March ash cloud moving W at 1 km above the summit; another small eruption on 2 April. |
| 11 Apr-17 Apr 2001 | Plumes ~2 km above crater. |
| 18 Apr-24 Apr 2001 | Incandescent dome followed by small steam columns. |
| 25 Apr-01 May 2001 | 25 April ash cloud at 2 km; more eruptions followed but poor visibility. 29 and 30 April lahars to the Pampas, Cusua, Hacienda, and Achupashal sectors; river levels rose in the Ulba and Mandur sectors. Lahars in Pampas sector blocked the Pelileo-Banos channel during 0710 to 1100 on 29 April and destroyed the highway. |
| 02 May-08 May 2001 | Small steam-and-ash plumes during the week. Possible small lahar on 3 May. |
| 09 May-15 May 2001 | Heavy rainfall caused remobilization of ash deposited on the upper flanks, producing several lahars. Lahars went down the Cusua, Basural, Mandur, Bascun, and Ulba gorges and closed the Banos-Riobamba highway and blocked a route to the town of Banos. |
| 16 May-22 May 2001 | Small 15 May eruptions sent ash up to 3 km above the summit. Light ash fell in the towns of Cotalo and Bilbao. 17 May ash cloud 4 km above the summit drifted SW. Intense activity suggested by seismicity but cloudy conditions. 19 May ash cloud rose to 1.7 km. |
| 23 May-29 May 2001 | 2-km-high ash plume on 26 May, poor visibility. |
| 30 May-05 Jun 2001 | Activity increased. A large number of long-period earthquakes accompanied several small eruptions and near-continuous ash clouds. 31 May eruption sent an ash cloud up to 2.9 km above the summit, which drifted W. Incandescent blocks ejected and a sound like a cannon shot was heard kilometers away. Eruptions on 29 May at 2012 sent ash 2.2 km above the summit, on 30 May at 1211 (ash plume to unknown height), and on 2 June at 1709 with an ash plume 2.9 km above the summit. Incandescent material visible in the crater. |
| 06 Jun-12 Jun 2001 | Several small eruptions. 5 June ash cloud moving W at 2 km above the summit. |
| 13 Jun-19 Jun 2001 | 4.7-7 km maximum plume height. |
| 20 Jun-26 Jun 2001 | 22 June eruptions at 0630 and 0652 sent ash clouds 0.8 and 3.8 km above the summit, respectively. No ash visible on satellite imagery. Small explosions 25 June at 0138 and 1328 produced ash clouds that rose ~1 km above the summit and drifted W. Small amounts of ash deposited in the town of Ambato, ~40 km NW. |
| 27 Jun-03 Jul 2001 | 17 and 28 June ash clouds to 2 km above the summit; ash fell W, damaging crops. 3 July W-drifting ash 0.8-2.6 km above the summit. |
| 04 Jul-10 Jul 2001 | 5 July a larger-than-average ash plume rose to 2.6 km above the summit; however, satellite imagery and additional information suggested that a dense, SE-drifting ash cloud rose to 4 km above the summit. |
| 11 Jul-17 Jul 2001 | 12 July an eruption sent a cloud to ~3.3 km above the summit; it drifted W to NW. |
| 18 Jul-24 Jul 2001 | Heavy rain remobilized ash deposited on the flanks, generating lahars, and several small-to-moderate eruptions produced ash clouds. On 19 July lahars down the W flank reached the Banos-Riobamba highway. Larger eruption on 20 July produced an ash cloud that rose to ~2.9 km above the summit. |
| 25 Jul-31 Jul 2001 | 25 July the highest ash cloud of the week rose ~4 km above the summit and drifted SW. |
| 01 Aug-07 Aug 2001 | 2 August until at least 3 August there was an increase in activity. Continuous tremor began on 3 August; maybe associated with continuous ash emission. Several eruptions during the week; largest on 5 August produced ash cloud to ~7.5 km above the summit. |
| 08 Aug-14 Aug 2001 | Ongoing eruptions since at least 6 August, sending steam-and-ash clouds to 2.5-8 km above the summit. Ash clouds primarily drifted W. On 13 August three particularly strong emissions at about 0630, 1200, and 1315. Two distinct areas of ash visible in satellite imagery; one contained ash from the strong emissions, rose to ~6.6 km above the summit and drifted E; the other ash cloud was fed from continuous emissions and possibly rose to ~5 km above the summit and drifted SW. On 14 August one of about five explosions ascended to 8 km above the summit. It was emitted at 0746 and had a reduced displacement of 13.2 cm2. |
| 15 Aug-21 Aug 2001 | Series of eruptions that began on 6 August continued during the week. Seismicity characterized by many long-period earthquakes and seismic signals that represented ash emissions. Several sporadic explosions occurred, with the largest explosion beginning on 15 August. The eruption produced an ash cloud that rose to 7.2 km above the summit. On 17 August volcanic activity increased slightly and incandescent material was ejected up to 1 km W of the crater. According to news reports, as of 15 August ash affected more than 23,000 people, blanketed approximately 89,000 acres of crops, and killed an undetermined number of livestock. |
Reports noted an inferred intrusion during 9-12 October 2000. On 13 October, a debris flow occurred, but volcanism diminished considerably. The last explosion around this time took place on 23 October.
At the beginning of December 2000, IG survey crews detected a slight swelling in the EDM lines on the volcano's NW flank. An electronic inclinometer that could have helped confirm this deformation was located above the Refugio station. Unfortunately it was damaged when struck by rocks.
Summary of activity during November 2000-August 2001.Variable ash-cloud heights and other activity are summarized in table 1, which covers the time interval 1 November 2000 through 15 August 2001. Stated in terms of height above the summit, ash clouds rose to more than 7 km on two days in August; to 6 km on 1 day in August; and to 2-4 km on 38 days, mostly in June and July. Smaller ash clouds ascended 1-2 km on 28 days in the early months of 2001. Plumes ascended
During 17 October 1999-12 November 2000 ash plume heights exceeded 7 km over the summit on 8 days, chiefly during late 1999 through early 2000. In October 1999 an ash plume rose to ~13 km over the summit.
Observations during 2001. In early January 2001, two volcano-tectonic (VT) events were located 4-5 km below the NW flank. After 3 January, Tungurahua's 300-m-diameter summit crater had an increase in ash emissions, seen visually from the Guadalupe branch observatory, 11 km N of the volcano (table 1).
New fumaroles became apparent in late November 2000 at 4,400 m elevation on the NW flank, in the main drainage that feeds into the town of Baños (population 18,000). The fumaroles were located in a 100- to 150-m-long area.
During 10-12 June 2001, uncommonly intense and prolonged rains fell over the eastern provinces and the Andean foothills of Ecuador. At one pluviometer (rain gauge) that the IG operates on Tungurahua's NW flank, 120 mm of rain fell in two days. The rain-generated lahars that flowed down Tungurahua's flanks were the largest ever recorded, carrying volcanic blocks the size of small cars. The lahars closed the road between Ambato and Baños for hours and totally destroyed the road between Baños and Penipe. Other floods and lahars were recorded in rivers born on the volcano. Along the Vascun and Ulba rivers, some houses on the flood plains were inundated but not destroyed. The Rio Pastaza, on the N flank of Tungurahua, registered a record water flow rate of 1,760 m3/s.
The rains triggered a landslide that overcame two people living downstream of Baños in the vicinity of Rio Negro. Out milking cows, they were swept into the nearby Pastaza river. These two deaths, although in Tungurahua province, were not related to the lahars. As of July 2001, no one had died from the recent lahars. All together, the rainy season left a death toll of ~80 people in Ecuador, including losses from landslides and flooding away from the volcano.
An explosion on 17 June 2001 rose 4.8-7 km above the summit. Owing to clear weather, it was witnessed by many of the region's inhabitants. No pyroclastic flows were produced, and the explosion ceased after about a minute. After that time, the volcano produced about 1 explosion/day. These mid-June explosions were relatively small (their seismic signatures had reduced displacements of 2-5 cm2), but they generally came without warning.
Light ashfalls were also frequent W of the volcano. They affected many crops (including corn, peas, beans, potatoes, tomatoes, blackberries, and squash; as well as orchards of peaches and apples). A 27 August report by the Pan American Health Organization (PAHO) stated that by late August 2001 various areas had received up to 2.5 cm of ash.
Scientists came to believe that a weak seal was forming in the volcano's conduit system. The seal was thought to break under sufficient recharge pressure. In addition, this new spurt of mid-June activity could be attributed to a small injection of magma that was believed to have occurred during 17-18 May. The fresh injection rose up through the conduit and was seen as incandescence on 26 May and when Strombolian fountaining was observed. Later explosions could stem from residual gases and heat.
Earth Probe TOMS (Total Ozone Mapping Spectrometer) detected a weak ash and SO2 plume from Tungurahua on 6 August at around 0630. The plume was directed generally WSW and extended to approximately 4°S, 83°W, containing an estimated SO2mass of
Practice evacuation and maps. On 26 June 2001, 2,000-3,000 people in Baños conducted a simulated evacuation, the first in over a year. It was organized by "Ojos del Volcán" ("Eyes of the Volcano"), a local organization whose members include hotel owners, climbing guides, and tour operators. Other organizers included the IG, local civil defense authorities, the Red Cross, police, firefighters, and health officials. Participants walked to three previously identified zones of temporary refuge. The exercise was successful and revealed some unforseen shortcomings in the local disaster plans. Figures 10 and 11 show maps indicating topography and potential hazard zones.
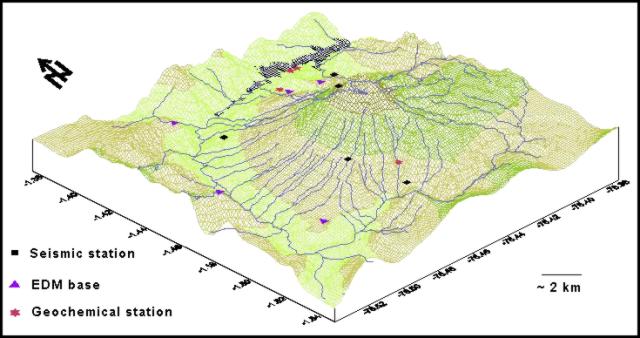 |
Figure 10. Diagram showing Tunguharua's landscape as seen from the SW. Note N arrow along left margin. Courtesy of Instituto Geofisico. |
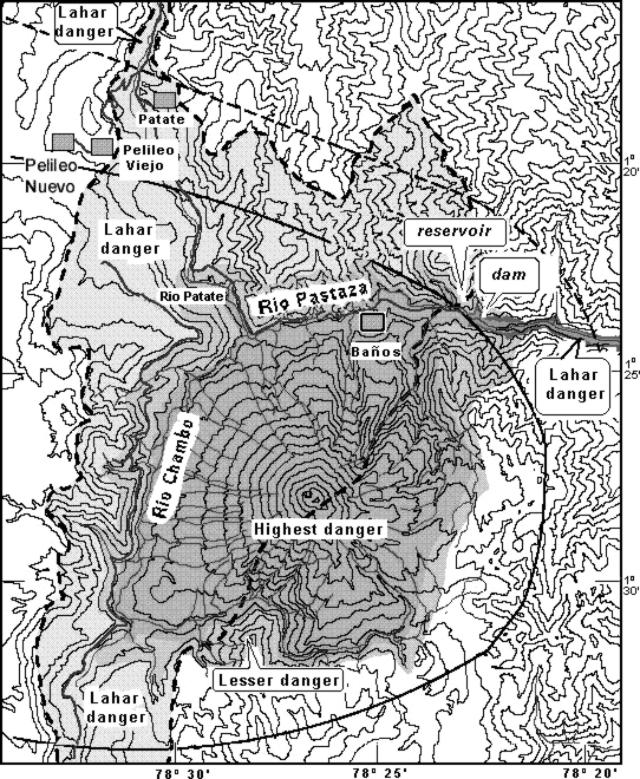 |
Figure 11. Generalized Tunguharua hazards map (N is towards the top) indicating areas of relative risk. The city of Baños lies within the zone of highest potential risk (central, darker shaded area). The town of Patate lies within the zone of lowest potential risk (lightly shaded); Pelileo Nuevo and Pelileo Viejo lie just outside this zone. Lahar risks continue hundreds of kilometers off the map towards the E along the downstream portions of the Rio Pastaza (dark strand intersecting the map's E margin). The Pastaza is confined by a dam ~4 km E of Baños. Solid and dashed curves represent areas with inferred risks from airfall ash. Courtesy of Instituto Geofisico. |
Human impact. A report was issued by the United Nations Office for the Coordination of Humanitarian Affairs on 5 September 2001, following a multi-agency meeting the day before. The report cited updated Civil Defense statistics on Tungurahua's impact.
As of 5 September, no ash had fallen in the previous 10 days; still, 39,000 people (8,000 families) had been affected by the volcano. Respiratory infections had increased. Ash had affected potable water supplies in some rural communities prompting more water-quality monitoring. There were 3,107 houses damaged.
A total of 53,597 hectares (ha) of farmland and pastures have been affected, of which 17,017 ha lie in the province of Tungurahua, 28,580 ha in Chimborazo, and 8,000 ha in Bolivar. Due to stress and new feed, 13,113 cattle developed health problems. Some were evacuated. The report also discussed a system for enlisting and tracking relief contributions.
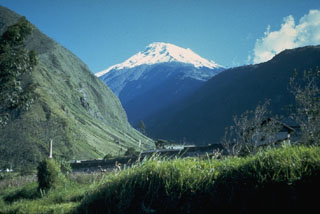
Geological Summary. Tungurahua, a steep-sided andesitic-dacitic stratovolcano that towers more than 3 km above its northern base, is one of Ecuador's most active volcanoes. Three major edifices have been sequentially constructed since the mid-Pleistocene over a basement of metamorphic rocks. Tungurahua II was built within the past 14,000 years following the collapse of the initial edifice. Tungurahua II collapsed about 3,000 years ago and produced a large debris-avalanche deposit to the west. The modern glacier-capped stratovolcano (Tungurahua III) was constructed within the landslide scarp. Historical eruptions have all originated from the summit crater, accompanied by strong explosions and sometimes by pyroclastic flows and lava flows that reached populated areas at the volcano's base. Prior to a long-term eruption beginning in 1999 that caused the temporary evacuation of the city of Baños at the foot of the volcano, the last major eruption had occurred from 1916 to 1918, although minor activity continued until 1925.
Information Contacts: Geophysical Institute (Instituto Geofísico), Escuela Politécnica Nacional, Apartado 17-01-2759, Quito, Ecuador; Associated Press; NOAA Operational Significant Events Imagery Support Team (OSEI), NOAA/NESDIS, World Weather Building, Room 510, 5200 Auth Road, Camp Springs, MD 20748 (URL: https://www.nnvl.noaa.gov/); Washington VAAC, Satellite Analysis Branch (SAB), NOAA/NESDIS E/SP23, NOAA Science Center Room 401, 5200 Auth Road, Camp Springs, MD 20746, USA (URL: http://www.ssd.noaa.gov/); Volcano Disaster Assistance Program (VDAP), U.S. Geological Survey, 5400 MacArthur Blvd, Vancouver, WA 98661 (URL: https://volcanoes.usgs.gov/vdap/); Simon Carn and Arlin Krueger, Joint Center for Earth Systems Technology (NASA/UMBC), University of Maryland Baltimore County, Academic IV-/a, Room 114J, 1000 Hilltop Circle, Baltimore, MD 21250; Office for the Coordination of Humanitarian Affairs (OCHA), United Nations, New York, NY 10017 USA (URL: https://reliefweb.int/); Pan American Health Organization (PAHO), United Nations, 525-23rd Street, NW, Washington, DC 20037 USA (URL: http://www.paho.org/).