Report on Anatahan (United States) — April 2005
Bulletin of the Global Volcanism Network, vol. 30, no. 4 (April 2005)
Managing Editor: Richard Wunderman.
Anatahan (United States) Explosive eruption on 6 April 2005 issues highest ash plume recorded here
Please cite this report as:
Global Volcanism Program, 2005. Report on Anatahan (United States) (Wunderman, R., ed.). Bulletin of the Global Volcanism Network, 30:4. Smithsonian Institution. https://doi.org/10.5479/si.GVP.BGVN200504-284200
Anatahan
United States
16.35°N, 145.67°E; summit elev. 790 m
All times are local (unless otherwise noted)
Anatahan's third historical eruption began on 5 January 2005, and is described in BGVN 29:12. Further details and satellite images were presented in BGVN 30:02, which covered events until mid-February 2005. A 5-6 April 2005 eruption cloud rose to at least 15 km altitude, which was the highest yet seen at the volcano.
Anatahan erupted almost continuously after 5 January 2005, when it started its third eruption in recorded history. An image collected by the Ozone Monitoring Instrument on NASA's Aura satellite shows atmospheric sulfur dioxide (SO2) concentrations between 31 January and 4 February 2005 (figure 14). A long SO2 plume extends NE and SW of Anatahan, and the edge of the plume covers Guam (the southernmost island) and the other Mariana Islands immediately to Anatahan's N and S.
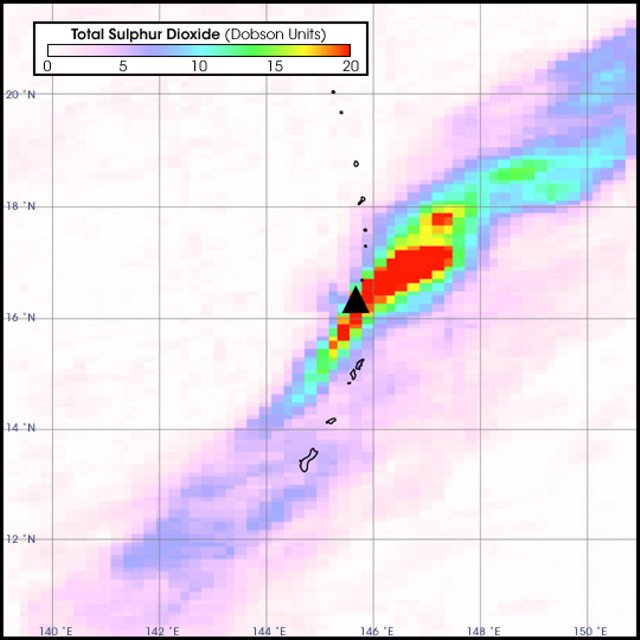 |
Figure 14. Anatahan's atmospheric SO2 as imaged by Aura's OMI instrument on 31 January 2005. The OMI (Ozone Monitoring Instrument) measures SO2 in Dobson Units. Dobson Units, which derive from spectroscopic measurement techniques, can be thought of as the mass of molecules per unit area of Earth's atmospheric column. One Dobson Unit equals 0.0285 grams of SO2 per square meter. The Ozone Monitoring Instrument (OMI) that created this image tracks global ozone change and monitors aerosols like sulfates in the atmosphere. It was added to the Aura satellite as part of a collaboration between the Netherlands' Agency for Aerospace Programs and the Finnish Meteorological Institute. NASA describes the Eos system Aura as "A mission dedicated to the health of the Earth's atmosphere." NASA image courtesy Simon Carn (Joint Center for Earth Systems Technology (JCET), University of Maryland Baltimore County (UMBC)). |
Volcanogenic SO2 combines with water to create a sulfuric acid haze. Called "vog," this haze can cause illness and make breathing difficult. Volcanic haze grew so thick during the first week of February that the National Weather Service issued a volcanic haze advisory for Guam, where several illnesses were reported.
After mid-February 2005, eruptive activity at Anatahan steadily declined to less than 5% of the peak level attained since the eruption started on 5 January. Ash eruptions continued, and the 2003 crater floor was almost entirely covered by fresh lava out to a diameter of ~ 1 km. A MODIS image taken at 0115 on 18 February showed a plume of steam and vog extending about ~ 170 km SW of Anatahan. Seismic and acoustic records during the last week of February 2005 showed very low levels of activity. Seismic amplitudes during 23-28 February were similar to those recorded prior to the 5 January eruption. NASA MODIS (Moderate Resolution Imaging Spectroradiometer) imagery taken on 28 February showed a faint plume of vog and steam trending W of Anatahan.
During the first two weeks of March 2005 volcanic and seismic activity increased relative to the previous weeks. During 14-17 March, seismicity increased and steam rose a few hundred meters above the volcano. The inner E crater had been nearly filled with lava flows and lapilli since early January.
A small eruption began on 18 March at 1544 according to seismic data. On 19 March the Washington VAAC issued an advisory that an ash plume was visible on satellite imagery below 4 km altitude. Small explosions that began late on 20 March lasted for 14 hours. No emissions were visible on satellite imagery, but others were, later in March and April.
A strong outburst apparently began on 21 March, a day when seismicity increased significantly. Seismic amplitudes peaked on the 25th and faded out on the 26th. Near the peak on the 25th, the U.S. Air Force Weather Agency (AFWA) detected a hot spot on the island on satellite imagery and reported an ash plume briefly reaching ~ 5.8 km altitude. The plume height soon dropped to below 3 km altitude, and by near midday on the 27th the plume had changed from ash and steam to steam and vog. On the 27th the plume extended ~ 240 km SW.
On 5 April at about 2200 seismic signals began to increase slowly, and the Washington VAAC began to see increased ash on satellite imagery. On 6 April 2005 around 0300 an explosive eruption began and produced an ash plume to an initial height of ~ 15.2 km altitude, the highest in recorded history from the volcano. Seismicity peaked at the same time.
The AFWA reported an upper level ash plume at ~ 15.2 km altitude blowing E to SE and a lower level ash plume at ~ 4.6 km altitude blowing SW; the upper plume extended more than 465 km. Earth Probe TOMS data on 6 April at 1046 showed a compact sulfur-dioxide cloud drifting E of Anatahan following the eruption.
Chuck Sayon, the superintendent of American Memorial Park noted, "On Saipan at around 10 AM the skies darkened and light ash started falling . . . park operation[s] have been restricted to indoor activities due to irritation to eyes and breathing as ash starts to lightly coat the area. Schools are closed as well as the airport until further notice . . .."
On 6 April during 0400 to 0900 the seismicity at Anatahan decreased to near background. The seismicity surged for about 1 hour, with amplitudes about one-half those reached during the earlier eruption, and subsequently dropped again to near background. Prior to the 6 April eruption, during 31 March to 4 April the amplitudes of harmonic tremor varied, reaching a 2-month high on the 3rd. Small explosions occurred every one minute to several minutes, probably associated with cinder-cone formation. Steam-and-ash plumes drifted ~ 200 km, and vog drifted ~ 400 km at altitudes below ~ 2.4- 4.6 km.
The U.S. Geological Survey (USGS) (in conjunction with the Commonwealth of the Northern Mariana Islands) stated that the "eruption of 6 April 2005 was the largest historical eruption of Anatahan and expelled roughly 50 million cubic meters of ash. The eruption column and the amplitude of harmonic tremor both grew slowly over about 5 hours and both peaked about 0300 on 6 April local time . . .. The peak of the eruption lasted about one hour and then the activity declined rapidly over the following hour."
The 6 April 2005 eruption's plume was captured on satellite images. The image showed a plume that was tan or brown in color and clearly ash laden (figure 15).
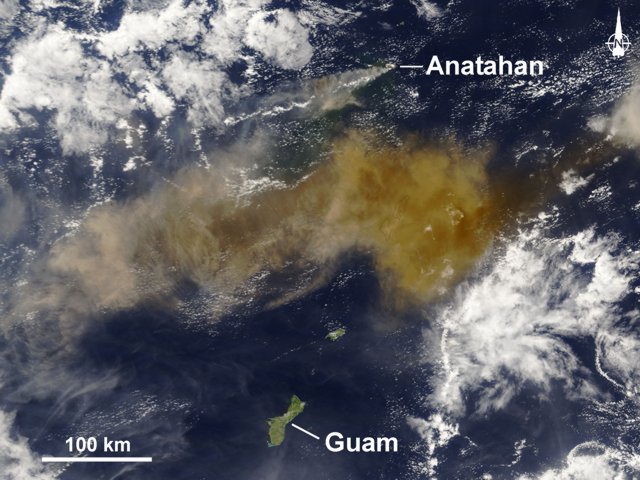 |
Figure 15. A major eruption from Anatahan on 6 April 2005 sent an ash plume to ~ 15 km. The eruption was considered the largest since Anatahan's first recorded eruption on 10 May 2003. This Moderate Resolution Imaging Spectroradiometer (MODIS) image was acquired by NASA's Terra satellite at 0035 UTC, about 8 hours after the eruption began. By this time, the ash plume had spread S to entirely cover Saipan and Tinian, islands immediately to the S. Courtesy of the MODIS Rapid Response Image Gallery, sponsored in part by NASA. |
Figure 16 shows SO2 concentrations in the atmosphere on 7 April 2005, over 30 hours after the large 6 April eruption. SO2 emissions from the eruption were measured by the Ozone Monitoring Instrument (OMI) on NASA's EOS/Aura satellite. OMI detects the total column amount of SO2 between the sensor and the Earth's surface and maps this quantity as it orbits the planet. A new perspective on the vertical distribution of the SO2 is revealed by combining the OMI data with coincident measurements made by the Microwave Limb Sounder (MLS), also part of the Aura mission.
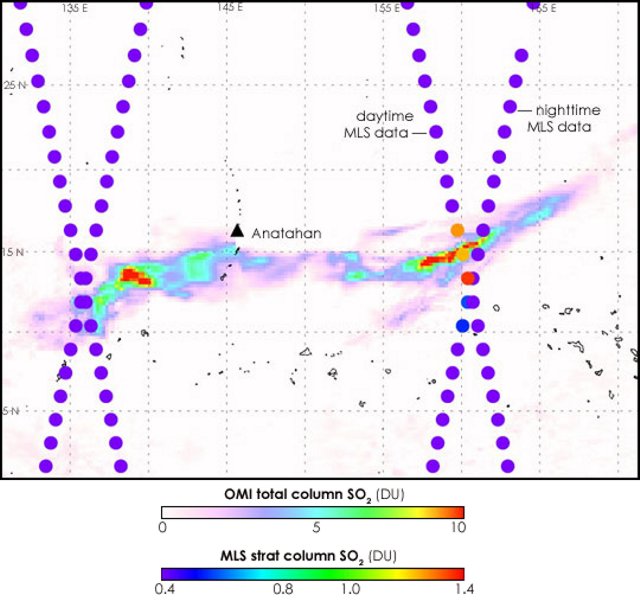 |
Figure 16. Anatahan's 5-6 April 2005 eruption injected significant SO2 high into the atmosphere. This OMI image depicts the concentrations found over 30 hours after the eruption, a time when the SO2 formed two separate zones at distance from the source. Analysis suggests that the westerly zone of SO2 was probably in the lower troposphere and the eastern zone was probably in the upper troposphere or above. Courtesy of Simon Carn. |
The MLS data crisscross the OMI image and clearly show that some, but not all, of the SO2 measured by OMI to the volcano's E was in the upper troposphere or above. At these altitudes, SO2—and the sulfate aerosols that form from it—can stay in the atmosphere and affect the climate for a longer period of time. A weaker SO2 signal was also measured in the same region during the nighttime MLS overpass, which crosses the image from upper right to lower left. The daytime data, running from upper left to lower right, coincide with the OMI measurements. The MLS data west of Anatahan show no significant SO2 signal, indicating that the SO2 measured by OMI in this region was in the lower troposphere.
MLS measures thermal emissions from the Earth's limb, so unlike the OMI sensor it also collects data at night. It is designed to measure vertical profiles of atmospheric gases that are important for studying the Earth's ozone layer, climate, and air quality, such as SO2. These images, derived from preliminary, unvalidated OMI and MLS data, show MLS SO2 columns (filled circles) measured every 165 km along the Aura orbit, plotted over the OMI SO2 map. The MLS SO2 columns shown here are derived from profile measurements made from the upper troposphere into the stratosphere (~ 215-0 hPa (hectoPascal, 102 Pa) or ~ 12 km altitude and above), and the circles do not represent the actual size of the MLS footprint, which is roughly 165 x 6 km.
Anatahan's morphological changes were highlighted in before (pre-eruption) versus after (post-eruption) images (figure 17). Seismicity decreased at Anatahan after 6 April and during 7-11 April was at very low levels, near background. On 11 April, a steam-and-ash plume rose ~ 2.7 km altitude and drifted ~ 280 km WSW.
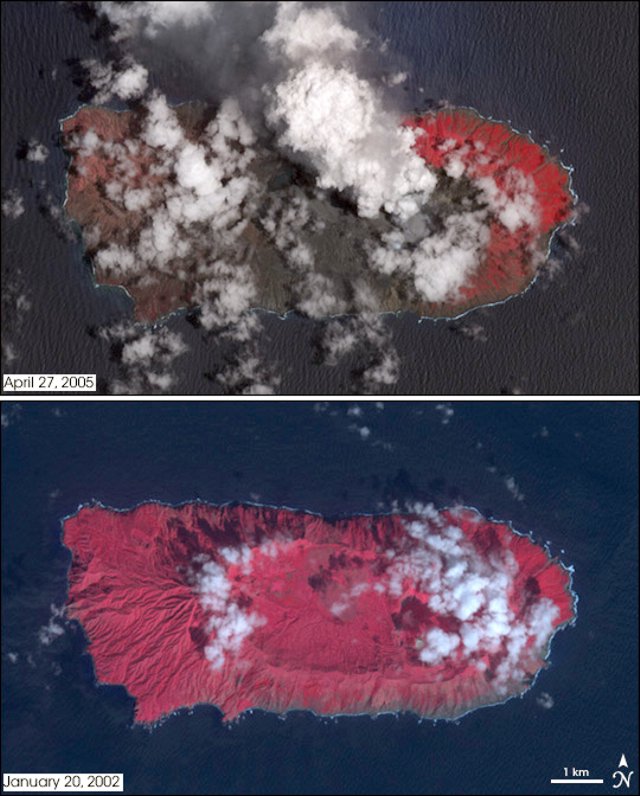 |
Figure 17. Two satellite images of Anatahan cropped and oriented for direct comparison, one from 20 January 2002 (pre-eruption), the other from 27 April 2005 ("post-eruption" in the sense that it was taken after the May 2003 eruption began). The NASA's Earth Observatory website described the pre-eruption image (bottom) as follows: "In 2002, when the Advanced Spaceborne Thermal Emission and Reflection Radiometer (ASTER) captured the lower image, the island was made up of two volcanoes whose conjoined summit calderas formed an elliptical valley at the island's center. Aside from occasional tremors, the island was quiet and no eruption had ever been recorded." Green plants, shown on the false-color (infrared-enhanced) image in red, covered the island and filled the caldera at its center. The same website described the post-eruption image (top) as showing that the volcano was still emitting steam and ash on 27 April 2005. The island's center was completely devoid of plants, covered instead by gray volcanic material. Ash appears to have blanketed the western fringe of the island, where a layer of gray covers the underlying vegetation. The light cloud, ash, and steam that cover the island make it difficult to see changes to the caldera, but it appears that the eruptions may have destroyed its southern wall. On higher resolution images, it also appears that volcanic material may have flowed into the Pacific Ocean on the island's S side. Courtesy of NASA's Earth Observatory. |
Occasional data from Anatahan revealed that seismicity appeared to increase during 24-25 April. During 20-25 April, a continuous thin plume of ash-and-steam rose to less than ~ 3 km altitude and drifted more than 185 km from the volcano. Harmonic tremor dropped dramatically on 1 May after being at high levels for several days. During 27 April to 1 May, the main ash-and-steam plume rose to ~ 3 km altitude According to a news article, the volcanic plume from Anatahan reached Philippine airspace on 4 May.
On 5 May an extensive ash-and-steam plume to 4.5 km altitude was visible in all directions. Ash extended 770 km N, 130 km S (to northern Saipan), and 110 km W. Vog extended in a broad swath from 3,000 km W, over the Philippines, to 1,000 km N of Anatahan. By 9 May harmonic tremor amplitude had decreased to near-background levels, with a corresponding drop in eruptive activity. As of 10 May AFWA was reporting ash to about 3 km altitude extending 400 km W and an area of vog less than half that noted on 5 May.
On 11 May AFWA reported thick ash rising to 4.2 km altitude and moving WNW. The thick ash extended in a triangular shape from the summit 444 km to the WSW through 510 km to the NW. A layer of thin ash at 3 km altitude extended another 1,000 km beyond the thick ash. A broad swath of vog extended over 2,200 km W nearly to the Philippines and over 1,400 km NNW of Anatahan. Although the ash plume diminished over the next few days and was not as thick, it remained significant, rising to 2.4 km and extending 370 km WNW on the 13th. Scientific personnel from the Emergency Management Office and the USGS working the next day at a spot 2-3 km W of the active vent heard a continuous roaring sound. They also saw ash and steam rising by pure convection, not explosively, to 3 km altitude.
Reference. Chadwick, W.W., Embley, R.W., Johnson, P.D., Merlea, S.G., Ristaub, S., and Bobbitta, A., 2005, The submarine flanks of Anatahan volcano, Commonwealth of the Northern Mariana Islands: Jour. of Volcanology and Geothermal Res. (In press, June 2005).
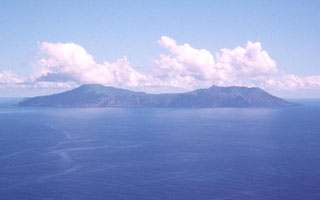
Geological Summary. The elongate, 9-km-long island of Anatahan in the central Mariana Islands consists of a large stratovolcano with a 2.3 x 5 km compound summit caldera. The larger western portion of the caldera is 2.3 x 3 km wide, and its western rim forms the island's high point. Ponded lava flows overlain by pyroclastic deposits fill the floor of the western caldera, whose SW side is cut by a fresh-looking smaller crater. The 2-km-wide eastern portion of the caldera contained a steep-walled inner crater whose floor prior to the 2003 eruption was only 68 m above sea level. A submarine cone, named NE Anatahan, rises to within 460 m of the sea surface on the NE flank, and numerous other submarine vents are found on the NE-to-SE flanks. Sparseness of vegetation on the most recent lava flows had indicated that they were of Holocene age, but the first historical eruption did not occur until May 2003, when a large explosive eruption took place forming a new crater inside the eastern caldera.
Information Contacts: Juan Takai Camacho and Ramon Chong, Emergency Management Office of the Commonwealth of the Northern Mariana Islands (CNMI/EMO), PO Box 100007, Saipan, MP 96950, USA (URL: http://www.cnmihsem.gov.mp/); Simon Carn, Joint Center for Earth Systems Technology (JCET), University of Maryland Baltimore County (UMBC), 1000 Hilltop Circle, Baltimore, MD 21250, USA; Hawaiian Volcano Observatory (HVO), U.S. Geological Survey, PO Box 51, Hawaii National Park, HI 96718, USA (URL: https://volcanoes.usgs.gov/observatories/hvo/); Charles Holliday, U.S. Air Force Weather Agency (AFWA), Offutt Air Force Base, Nebraska 68113, USA; Randy White and Frank Trusdell, U.S. Geological Survey, 345 Middlefield Road, Menlo Park, CA 94025-3591 USA (URL: https://volcanoes.usgs.gov/nmi/activity/); Saipan Tribune, PMB 34, Box 10001, Saipan, MP 96950, USA (URL: http://www.saipantribune.com/); Operational Significant Event Imagery (OSEI) team, World Weather Bldg., 5200 Auth Rd Rm 510 (E/SP 22), NOAA/NESDIS, Camp Springs, MD 20748, USA (URL: https://www.nnvl.noaa.gov/); Washington Volcanic Ash Advisory Center (VAAC), Satellite Analysis Branch, NOAA/NESDIS E/SP23, NOAA Science Center Room 401, 5200 Auth Road, Camp Springs, MD 20746, USA (URL: http://www.ssd.noaa.gov/); Chuck Sayon, American Memorial Park, Saipan, MP 96950, USA; NASA Earth Observatory (URL: http://earthobservatory.nasa.gov/).