Report on Merapi (Indonesia) — February 2007
Bulletin of the Global Volcanism Network, vol. 32, no. 2 (February 2007)
Managing Editor: Richard Wunderman.
Merapi (Indonesia) March-July 2006 volcanic crisis; May earthquake killed ~5,800
Please cite this report as:
Global Volcanism Program, 2007. Report on Merapi (Indonesia) (Wunderman, R., ed.). Bulletin of the Global Volcanism Network, 32:2. Smithsonian Institution. https://doi.org/10.5479/si.GVP.BGVN200702-263250
Merapi
Indonesia
7.54°S, 110.446°E; summit elev. 2910 m
All times are local (unless otherwise noted)
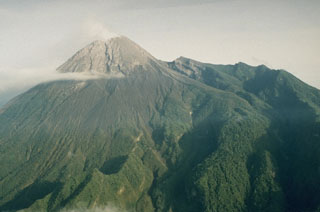
Merapi, one of the most dangerous volcanoes in the world owing to its perched lava dome and location in populous central Java, underwent vigorous dome growth during early to mid-2006, and its increasingly unstable summit dome released numerous pyroclastic flows and incandescent avalanches. Thousands of residents evacuated and the volcano became prominent in international news. The longest pyroclastic flows of mid-2006 took place on 8 and 14 June, with respective run-out distances from the summit area of ~ 5 and 7 km. Merapi's summit lies 32 km N of the large city of Yogyakarta.
This report contains summary notes on activity during 7 March to 1 July 2006. These notes were assembled and reported by scientists from the Merapi Volcano Observatory and the Center of Volcanology and Geological Hazard Mitigation (CVGHM), formerly the Volcanological Survey of Indonesia, and augments material presented previously (BGVN 31:05 and 31:06).
The USGS provided a satellite image with labels showing key drainages and features near the summit (figure 27). The dome's instability leads to pyroclastic flows and various kinds of rockfalls and other mass wasting episodes down the labeled drainages. During the 7 March to 1 July reporting interval, pyroclastic flows followed the headwaters of the Gendol , Krasak, Boyong, and Sat rivers, which trend to the SE, SW, SSW, and W, respectively.
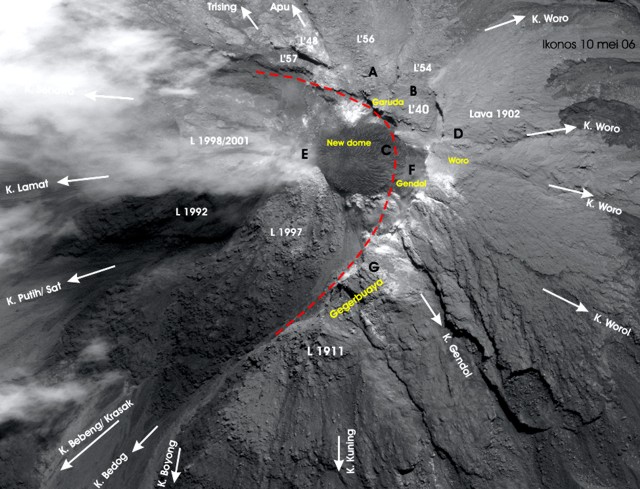 |
Figure 27. An annotated Ikonos satellite image of Merapi taken 10 May 2006. Image resolution is 2 m; N is to the top, and the scale is such that the entire distance N-S on the image is approximately 1 km. The labeled arrows indicate key rivers into which upslope avalanche shoots drain. Multiple drainage names are separated by a slash, and many western headwaters descend into the Woro river. The "K." stands for Kali, Indonesian for stream. Lava domes and viscous flows ("L") are labeled with the year of extrusion. The Gegerbuaya ridge was formed by 1911 lavas. Garuda, Woro, and Gendol identify headwaters. Letters reference locations used by scientists to facilitate communication. The Kaliurang Observatory lies ~ 4 km to the SE of the summit. The labeled image was a collaborative effort provided here courtesy of John Pallister, USGS. Image copyright 2006, GeoEye. |
Tectonic earthquake on 27 May 2006. The tectonics of Java are dominated by the subduction of the Australia plate to the NNE beneath the Sunda plate with a relative velocity of ~ 6 cm/year. The Australia plate dips NNE from the Java trench, attaining depths of 100-200 km beneath the island of Java, and depths of 600 km to the N of the island. The earthquake of 27 May 2006 occurred at shallow depth in the overriding Sunda plate, well above the dipping Australia plate.
The pace of volcanism and the intensity of the regional crisis increased after 27 May 2006. At 0553 that day, a destructive Mw 6.3 earthquake occurred leaving damage across central Java's southern coastal and inland areas (figure 28). The earthquake occurred at 10 km focal depth. The epicenter (at 7.962°S, 110.458°E) was 20 km SSE of Yogyakarta (population, 511,000; 6 million in the larger metro area). Some initial estimates put the earthquake at MR 5.9; this was later revised and even the newer (above-stated) seismic parameters are preliminary.
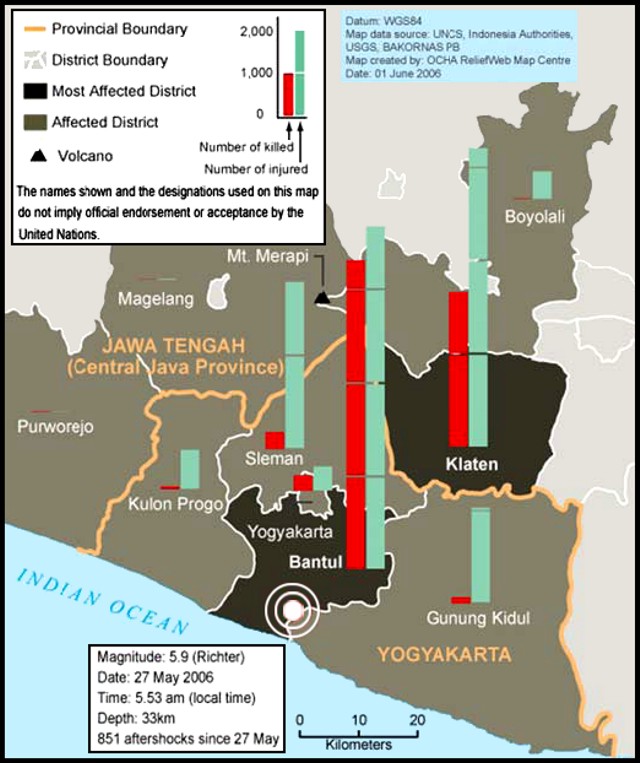 |
Figure 28. Epicenter of the 27 May 2006 earthquake in Central Java, including impact on regions around Merapi. The histograms show numbers of people killed (on left bar) and injured (right bar). As mentioned in text, some of the seismic parameters stated were later revised. Modified from a UN OCHA ReliefWeb Map Centre (1 June 2006) map in a 2006 United Nations report (see References). |
A US Geological Survey (USGS) summary stated that the earthquake caused 5,749 deaths, 38,568 injuries, and led to as many as 600,000 people displaced in the Bantul-Yogyakarta area. The shaking left more than 127,000 houses destroyed and an additional 451,000 houses damaged in the area, with the total loss estimated at ~3.1 billion US dollars. Modified Mercalli intensities were as follows: at Bantul and Klaten, IX; at Sleman and Yogyakarta, VIII; at Surakarta, V; at Salatiga and Blitar, IV; and at Surabaya, II. The earthquake was felt in much of Java and at Denpasar, Bali. The website of the US Geological Survey's Earthquake Hazards Program features a large number of photos (captioned in English) depicting various aspects of the earthquake.
Events during 7 March-1 July 2006. Tables 17 and 18 summarize some of the details during the reporting interval. Merapi's activity had increased to include volcanic earthquakes and deformation of the summit area a year earlier (in July 2005). Although the number of daily lava avalanches and pyroclastic flows had increased almost a week earlier, a tectonic earthquake, MR 6.3 (Richter scale magnitude), at 0555 (local time, WIB) on 27 May was followed by another significant increase in those events for another week (tables 17 and 18). Pyroclastic flows and lava avalanches between 10 May and 30 June were rare in the W-flank Sat drainage (31 May, 2 June, and 10 June), and did not descend into the Boyong drainage (SSW) after 4 June (table 18). The Krasak river drainage (SW) had material entering it on an almost daily basis after 27 May, except for a brief time during 14-19 June, with maximum run-out distances of 4 km. The Gendol drainage (SE) also experienced daily pyroclastic flows and lava avalanches starting on 28 May. Most of these flows to the SE did not extend more than 5 km, but on 14 June a pyroclastic flow descended 7 km.
Table 17. A compilation of seismic events at Merapi during 7 March to 1 July 2006. In creating this table Bulletin editors merged the category "landslides" with the category "lava avalanches". Similarly, the category "hot cloud reports" was interpreted to be equivalent to "pyroclastic flow" and those were also merged. Those mergers were driven by sudden shifts in terminology found in CVGHM reports. No data was available for 26-27 April, 29 April-5 May, 8 May, 12-21 May, 24-26 May, 9 June, or 16-18 June. * Earthquake, MR 6.3 (Richter scale magnitude) recorded at 0555 (local time, WIB). ** Incomplete data only 0000-0600 (local time). All data courtesy of CVGHM.
| Date | Plume seen to (meters above summit) | Lava avalanche signals | Multiphase earthquakes | Pyroclastic flow signals | Tectonic earthquakes |
| 07-12 Mar 2006 | -- | -- | 198 | -- | -- |
| 13-19 Mar 2006 | -- | -- | 239 | -- | -- |
| 21 Apr 2006 | -- | 13 | 162 | -- | 1 |
| 22 Apr 2006 | -- | 12 | 95 | -- | -- |
| 23 Apr 2006 | -- | 5 | 60 | -- | 1 |
| 24 Apr 2006 | -- | 21 | 178 | -- | 1 |
| 25 Apr 2006 | 200 | 6 | 25 | -- | -- |
| 28 Apr 2006 | -- | 20 | 126 | -- | -- |
| 06 May 2006 | -- | 82 | 95 | -- | -- |
| 07 May 2006 | -- | 59 | 104 | -- | -- |
| 10 May 2006 | -- | 133 | 153 | -- | -- |
| 11 May 2006 | 600 | 88 | 115 | -- | -- |
| 22 May 2006 | -- | 309 | 56 | 25 | -- |
| 23 May 2006 | 700 | 243 | 60 | 31 | -- |
| 27 May 2006 * | 100 | 279 | -- | 54 | 138 |
| 28 May 2006 | 1600 | 237 | 43 | 159 | 95 |
| 29 May 2006 | 500 | 332 | 18 | 88 | 57 |
| 30 May 2006 | 800 | 337 | 19 | 56 | 40 |
| 31 May 2006 | 800 | 276 | 36 | 127 | 24 |
| 01 Jun 2006 | 1300 | 315 | 35 | 144 | 13 |
| 02 Jun 2006 | 650 | 338 | 25 | 163 | 24 |
| 03 Jun 2006 | 800 | 488 | 79 | 107 | 16 |
| 04 Jun 2006 | 900 | 397 | 54 | 118 | 25 |
| 05 Jun 2006 | 400 | 300 | 9 | 157 | 17 |
| 06 Jun 2006 | 300 | 212 | 10 | 78 | 14 |
| 07 Jun 2006 | 275 | 256 | 12 | 66 | 8 |
| 08 Jun 2006 | 300 | 210 | 28 | 67 | 10 |
| 10 Jun 2006 | 900 | 337 | 37 | 34 | 4 |
| 11 Jun 2006 | 800 | 299 | 20 | 20 | 10 |
| 12 Jun 2006 | 350 | 264 | 31 | 22 | 8 |
| 13 Jun 2006 | 1200 | 273 | 88 | 28 | 5 |
| 14 Jun 2006 | 500 | 371 | 29 | 61 | 2 |
| 15 Jun 2006 | 900 | 260 | 100 | 27 | 6 |
| 19 Jun 2006 | 600 | 272 | 88 | 21 | 7 |
| 20 Jun 2006 | 1250 | 312 | 136 | 38 | 4 |
| 21 Jun 2006 | -- | 256 | 65 | 15 | 4 |
| 22 Jun 2006 | 1200 | 319 | 39 | 4 | 5 |
| 23 Jun 2006 ** | 600 | 78 | 5 | 4 | 5 |
| 24 Jun 2006 | 1500 | 338 | 48 | 21 | 6 |
| 25 Jun 2006 | 800 | 321 | 32 | 18 | 17 |
| 26 Jun 2006 | 800 | 372 | 27 | 17 | 11 |
| 27 Jun 2006 | 1000 | 251 | 16 | 23 | 11 |
| 28 Jun 2006 | 1000 | 308 | 16 | 19 | 1 |
| 29 Jun 2006 | 700 | 290 | 11 | 15 | 12 |
| 30 Jun 2006 | 500 | 74 | 0 | 9 | 3 |
| 01 Jul 2006 ** | 350 | 250 | 4 | 13 | 4 |
Table 18. Record of run out distances (km) of pyroclastic flows and lava avalanches (the latter, in parentheses) toward river drainages on Merapi from 10 May to 30 June 2006. No data was reported for 16-18 June, and weather obscured views on21-22 June. Courtesy of CVGHM.
| Date | Gendal (km) | Krasak (km) | Boyong (km) | Sat (km) |
| 10 May 2006 | 0.2 | 1.5 | -- | -- |
| 20 May 2006 | 3.0 | 3.0 | 3.0 | -- |
| 22 May 2006 | -- | 3.5 | -- | -- |
| 27 May 2006 | -- | 3.8 (2.0) | (2.0) | -- |
| 28 May 2006 | 3.0 (1.0) | (2.5) | (2.5) | -- |
| 29 May 2006 | 1.0 (1.0) | 3.5 (2.0) | (2.0) | -- |
| 30 May 2006 | 2.0 (1.0) | 3.5 (2.0) | (2.0) | -- |
| 31 May 2006 | 2.0 (1.5) | 3.5 (2.5) | 3.5 (2.5) | (2.5) |
| 01 Jun 2006 | 1.5 (1.5) | 2.0 (3.0) | 2.0 (3.0) | -- |
| 02 Jun 2006 | 1.0 (1.0) | 3.0 | 3.0 | (1.0) |
| 03 Jun 2006 | 4.0 (1.0) | 2.0 (1.0) | 2.0 (2.0) | -- |
| 04 Jun 2006 | 4.0 (1.0) | 1.5 (2.0) | 1.5 (2.0) | -- |
| 05 Jun 2006 | 3.0 (1.0) | 1.5 (2.0) | -- | -- |
| 06 Jun 2006 | 2.0 (1.0) | (2.0) | -- | -- |
| 07 Jun 2006 | 3.0 (1.0) | 1.5 (2.0) | -- | -- |
| 08 Jun 2006 | 5.0 (1.0) | 4.0 (2.0) | -- | -- |
| 09 Jun 2006 | 4.0 | -- | -- | -- |
| 10 Jun 2006 | 3.5 (1.0) | (2.0) | -- | (3.0) |
| 11 Jun 2006 | 4.0 | (3.0) | -- | -- |
| 12 Jun 2006 | 1.5 | (3.0) | -- | -- |
| 13 Jun 2006 | 3.0 (1.0) | (2.0) | -- | -- |
| 14 Jun 2006 | 7.0 | -- | -- | -- |
| 15 Jun 2006 | 4.5 | -- | -- | -- |
| 19 Jun 2006 | 3.0 (1.0) | -- | -- | -- |
| 20 Jun 2006 | 3.5 (1.0) | (2.0) | -- | -- |
| 23 Jun 2006 | (1.0) | (2.0) | -- | -- |
| 24 Jun 2006 | 4.0 (1.0) | 2.5 (2.5) | -- | -- |
| 25 Jun 2006 | 3.0 (1.0) | (3.0) | -- | -- |
| 26 Jun 2006 | 4.5 (1.0) | 4.0 (3.0) | -- | -- |
| 28 Jun 2006 | 3.0 (1.0) | (2.5) | -- | -- |
| 29 Jun 2006 | 2.0 (1.0) | (2.5) | -- | -- |
| 30 Jun 2006 | 3.0 (1.0) | (2.0) | -- | -- |
Because of the vigor of activity, the Alert Level rose in several steps as follows: 19 March (Green to Yellow), 12 April (Yellow to Orange), and 13 May (Orange to Red). The step to Red (which is the highest alert level, and sometimes also referred to as Level 4) followed clear deformation at the dome during elevated seismicity. On 28 April, a new lava dome emerged. By 20 May, pyroclastic flows several kilometers long were regularly seen passing down several key drainages (table 18). Figure 29 shows a 15 May pyroclastic flow (seen two days after the alert status rose to red).
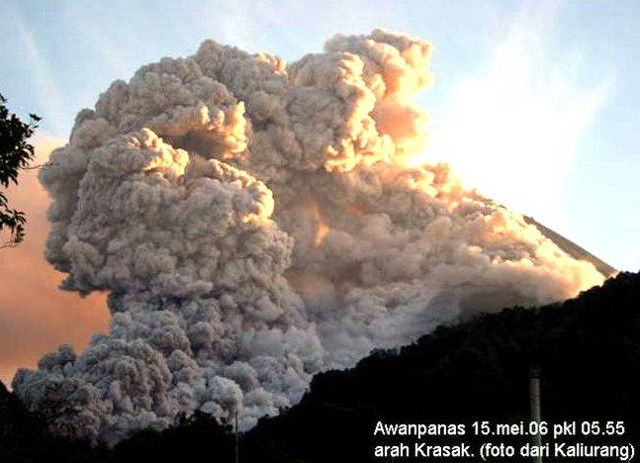 |
Figure 29. A photo taken on 15 May 2006 (0555 local time) of a pyroclastic flow traveling down the W flank of Merapi (the Krasak headwaters). Photo taken from the Kaliurang Observatory; courtesy of CVGHM. |
Volcano enthusiasts and photographers Martin Rietze and Tom Pfeiffer viewed Merapi on the morning of 27 May, during the destructive earthquake, from a high-elevation parking area ~ 4 km S of the summit. Prior to the earthquake, Rietze took several spectacular photos of incandescent avalanches pouring down avalanche shoots (figure 30 A-B). During the earthquake, he described horizontal swinging motion and dull rumbling sounds lasting perhaps 20 seconds. Dust rose from the volcano. Plants rubbing together also produced a rustling noise. Cries and engine noises in the background came from distant residents responding to the earthquake. At ~1-minute intervals, Merapi emitted about six pyroclastic flows and a substantial ash cloud grew overhead, reaching several kilometers in altitude above them. The photo in figure 30 C depicts the scene on Merapi around that time (which Rietze lists as 0555 on 27 May). His companion, Tom Pfeiffer, also took photos just after the large earthquake (e.g., figure 30 D).
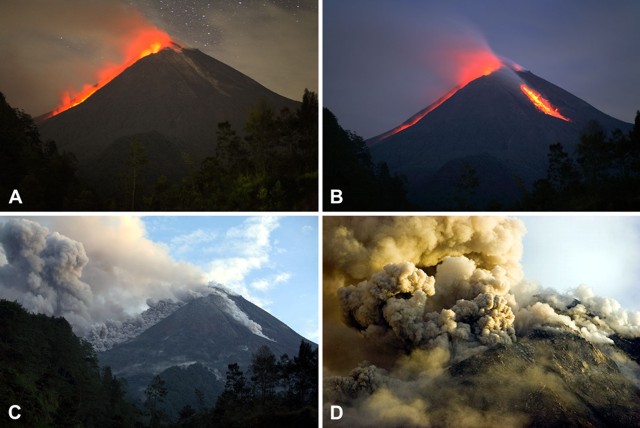 |
Figure 30. (A and B) Pre-dawn shots of incandescent material traveling down S-flank avalanche shoot(s) at Merapi on 27 May 2006 (prior to the M ~ 6 earthquake). (C) A photo of Merapi's response at 0555 on 27 May during or just after the M ~ 6 earthquake, with several pyroclastic flows clearly visible. (D) A second photo of the scene on Merapi during or just after the earthquake. This photo captured the chaotic scene at the summit and upper slopes, including a complex array of billowing ash clouds seemingly from multiple sources, and suspended dust hanging over many parts of the volcano (particularly distinguishable along the photo's lower central and right-hand areas). Copyrighted photos; those labeled A-C, used with permission of Martin Rietze; the one labeled D, with permission of Tom Pfeiffer. |
During early June the activity level of Merapi remained at red and on 4 June, the increase in volume of the new lava dome had caused the southern part of the crater wall called Gegerbuaya (1910 lavas) to collapse. Prior to its collapse, Gegerbuaya had functioned as a barrier to prevent pyroclastic flows moving southward from entering the Gendol River, which they did later in June.
On 8 June, multiple pyroclastic flows reached 4 km from the Krasak and Boyong Rivers and up to 4.5 km down the Gendol River. On 9 June, ash drifted W and NW and accumulated as ashfall ~ 1.5 mm thick. Pyroclastic flows traveled as far as 4 km toward the Gendol River. Figures 31 and 32 show pyroclastic flows on 7 and 10 June.
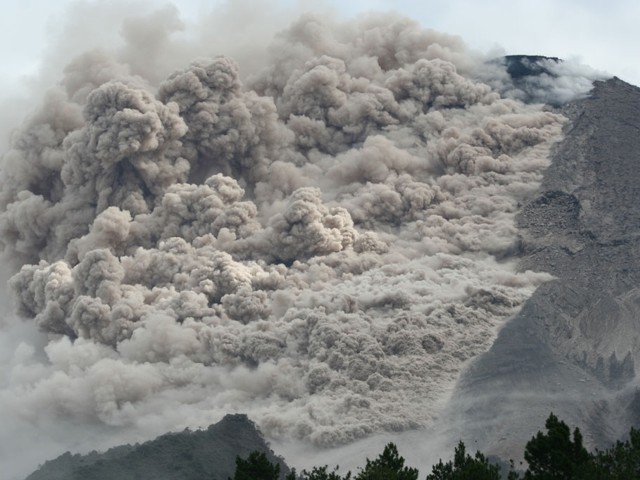 |
Figure 31. A pyroclastic flow at Merapi at 08:54:37 on 7 June 2006 shown traveling down Merapi's upslope region in a generally SE direction. Photo credit to BPPTK (The Research and Technology Development Agency for Volcanology, Yogyakarta). Provided courtesy of CVGHM. |
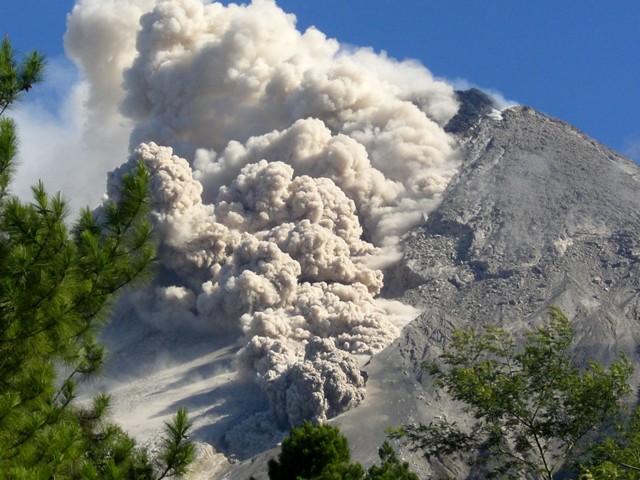 |
Figure 32. A Merapi pyroclastic flow in its early stages as seen at 08:50:53 on 10 June 2006. Photo credit to BPPTK; provided courtesy of CVGHM. |
In the period after the hazard level was raised to red, the lava dome grew and by 22 May its volume was ~ 2.3 million cubic meters. The M 6.3 earthquake in S-Central Java on 27 May triggered additional activity at Merapi. The dome's growth rate increased from the previous rate of around 100,000 cubic meters/day, leading to a lava dome volume on 8 June 2006 of ~4.3 million cubic meters. That lava dome stood 116 m above the nominal summit elevation of Merapi's peak (Garuda peak).
Dome collapse created the longest pyroclastic flow of the reporting interval, which took place on 14 June 2006. That pyroclastic flow attained a run-out distance of 7.0 km (table 18, figures 33 and 34, and previously reported in BGVN 31:05).
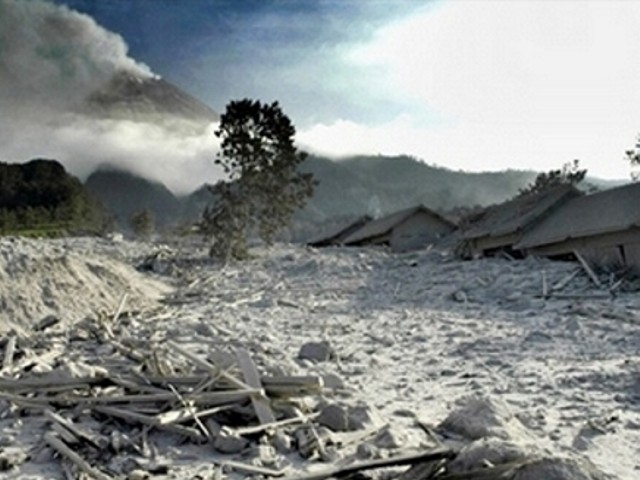 |
Figure 33. Deserted houses and dislodged lumber amid ash and volcanic rocks from Merapi (left-background) as seen in the village of Kaliadem (E of Kinahrejo near Bebeng, on the SE flank ~ 5 km from the summit) shortly after the 14 June 2006 pyroclastic flows passed through the settlement. Courtesy of Agence France Presse (photo by Tarko Sudiarno). |
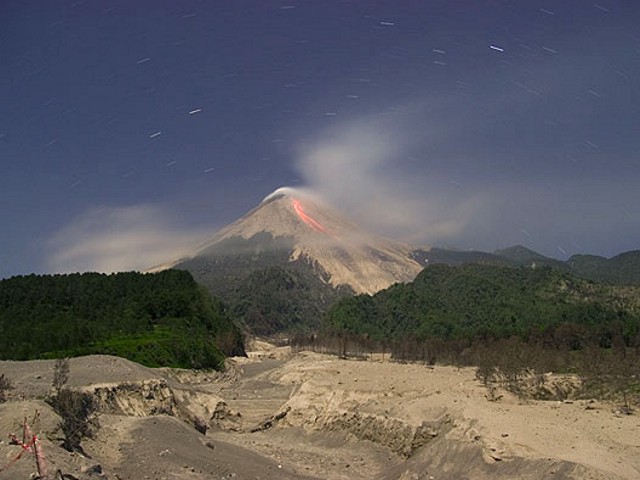 |
Figure 34. Night photo of Merapi (unknown date) showing incandescence on the slopes and, in the foreground, the large pyroclastic flow deposited on 14 June 2006. This photo is taken from nearly the same spot as the photos of 27 May (figure 30, above). Copyrighted photo used with permission of Tom Pfeiffer. |
At least in part owing to loss of topographic relief at the Gegerbuaya ridge along the S crater wall (figure 27), the 14 June pyroclastic flow took a different path. It crossed the former barrier and descended the Gendol drainage. As previously noted (BGVN 31:05), the 14 June pyroclastic flow took two lives when the underground bunker where the victims sought refuge was buried by the pyroclastic flow.
The bunker overridden on 14 June resides in Kaliadem village (~ 5 km SE of the summit). News stories showed pictures of the rescue attempt with initial digging commencing using picks and shovels, with the excavation by soldiers wearing dust masks and standing on boards or wooden platforms, presumably to reduce the heat flow from the fresh deposit. The article also noted that the soldiers wore heat-retardant clothes. A report from the Taipei Times of 16 June 2006 and credited to the Associated Press said that "The fierce heat melted the troops' shovels and the tires on a mechanical digger brought in to plow through more than 2 m of volcanic debris covering the bunker, built for protection from volcanic eruption . . .." Later news reports noted that authorities unearthed the bunker, which lay beneath more than 2 m of steaming pyroclastic flow deposit. The two bodies had suffered burns and the facility's door was ajar. A BBC report showed deeper portions of the hole being excavated by a large backhoe. They also noted that upon deeper excavation a probe into the deposit with a hand-held digital thermometer apparently indicated temperatures reached ~ 400°C. Several grim photographs circulated in the press showing the excavated entrance of the bunker and a team in the process of removing the victim's bodies. No report has been found discussing the exact reason for the bunker's failure, although several comments in the press suggested it was not designed to withstand burial by a pyroclastic flow.
Prior to that, on 13 June, the alert status dropped to orange, but it rose back to red again the next day after the pyroclastic flow and increases in multi-phased earthquakes. Activity remained stable but high through June 29 but began to decrease after 30 June. During July the intensity and frequency of pyroclastic flows and rock falls decreased. On 10 July, authorities reduced the alert status to orange on all but the S slopes. By the end of July 2006, pyroclastic flows had ceased.
Merapi's long-term dome growth continued at low to modest levels during the rest of 2006 and early 2007. The Darwin Volcanic Ash Advisory Center noted a plume to 6.1 km altitude drifting NE on 19 March 2007. These later incidents will be discussed in more detail in a forthcoming issue of the Bulletin.
MODVOLC Thermal Alerts. The Hawai'i Institute of Geophysics and Planetology MODIS Thermal Alert System web site lacked any thermal alerts for over a year preceding May 2006. Thermal alerts over Merapi began 14 May 2006 and extended through early September 2006 on nearly a daily basis. The alerts continued intermittently into 2007.
Reference. United Nations, 2006, Indonesia Earthquake 2006 Response Plan: United Nations, OCHA Situation Report No. 5, Issued 31 May 2006, GUDE EQ-2006-000064-IDN, 42 p.
Geological Summary. Merapi, one of Indonesia's most active volcanoes, lies in one of the world's most densely populated areas and dominates the landscape immediately north of the major city of Yogyakarta. It is the youngest and southernmost of a volcanic chain extending NNW to Ungaran volcano. Growth of Old Merapi during the Pleistocene ended with major edifice collapse perhaps about 2,000 years ago, leaving a large arcuate scarp cutting the eroded older Batulawang volcano. Subsequent growth of the steep-sided Young Merapi edifice, its upper part unvegetated due to frequent activity, began SW of the earlier collapse scarp. Pyroclastic flows and lahars accompanying growth and collapse of the steep-sided active summit lava dome have devastated cultivated lands on the western-to-southern flanks and caused many fatalities.
Information Contacts: Center of Volcanology and Geological Hazard Mitigation (CVGHM), Jalan Diponegoro 57, Bandung 40122, Indonesia (URL: http://vsi.esdm.go.id/); United Nations-Office for the Coordination of Humanitarian Affairs (OCHA), United Nations, New York, NY 10017, USA; National Earthquake Information Center, US Geological Survey, PO Box 25046, Denver Federal Center MS967, Denver, CO 80225, USA (URL: http://earthquake.usgs.gov/); Darwin Volcanic Ash Advisory Centre (VAAC), Bureau of Meteorology, Northern Territory Regional Office, PO Box 40050, Casuarina, Northern Territory 0811, Australia (URL: http://www.bom.gov.au/info/vaac/advisories/); John Pallister, Volcano Disaster Assistance Program, USGS Cascades Volcano Observatory, 1300 SE Cardinal Court, Suite 100, Vancouver, WA 98683-9589, USA (URL: http://volcanoes.usgs.gov/); Tom Pfeiffer and Martin Rietze, Volcano Discovery (URL: http://www.decadevolcano.net/), http://www.tboeckel.de/); Tarko Sudiarno, Agence France Presse (AFP) (URL: http://www.afp.com/english/home/); Taipei Times (URL: http://www.taipeitimes.com/); Associated Press (URL: http://www.ap.org/); Hawai'i Institute of Geophysics and Planetology (HIGP) Thermal Alerts System, School of Ocean and Earth Science and Technology (SOEST), Univ. of Hawai'i, 2525 Correa Road, Honolulu, HI 96822, USA (URL: http://modis.higp.hawaii.edu/).