Report on Guagua Pichincha (Ecuador) — December 2011
Bulletin of the Global Volcanism Network, vol. 36, no. 12 (December 2011)
Managing Editor: Richard Wunderman.
Guagua Pichincha (Ecuador) During 2008-2010 the lava dome was stable, occasional phreatic explosions
Please cite this report as:
Global Volcanism Program, 2011. Report on Guagua Pichincha (Ecuador) (Wunderman, R., ed.). Bulletin of the Global Volcanism Network, 36:12. Smithsonian Institution. https://doi.org/10.5479/si.GVP.BGVN201112-352020
Guagua Pichincha
Ecuador
0.171°S, 78.598°W; summit elev. 4784 m
All times are local (unless otherwise noted)
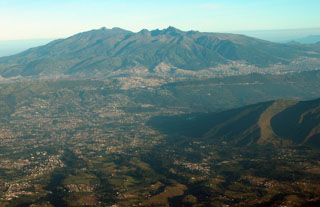
This report mainly summarizes information on Guagua Pichincha conveyed in 2008 to 2010 yearly reports by the IG-EPN (Instituto Geofísico Escuela Politécnica Nacional). In broad terms, and with the exceptions of an anomalously high number of emission and explosion signals in 2009, Guagua Pichincha volcanic activity continued to decline since the eruptions during September 1999 to June 2001. Further, the volcano has cooled and crater morphology, as stated in IG-EPN yearly reports, has remained relatively unchanged since 2002 (Samaniego,P, 2006, and 2007-2010 yearly reports). Nevertheless, it is possible for further emissions and explosions to occur as potential hazards to life and property. Especially since Guagua Pichincha (figures 22 and 23) is 11 km from the capital, Quito, a city with a population of over 2.5 million (as estimated by the Metropolitan District of Quito population projection, Directorate of Territorial Planning and Public Services). Our previous report on the volcano (BGVN 32:12) discussed phreatic explosions that occurred in early 2008. This report includes seismic data plots, locations of events on topographic maps and a multi-year seismic table beginning in the year 2005.
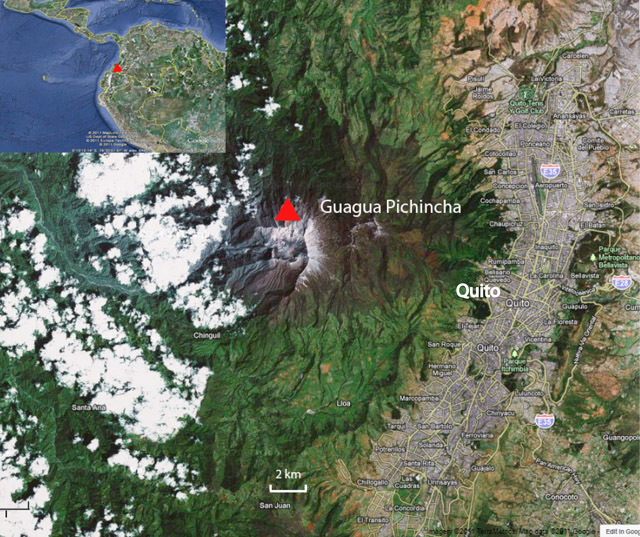 |
Figure 22. Map showing proximity of Quito to Guagua Pichincha. Courtesy of Google Earth. |
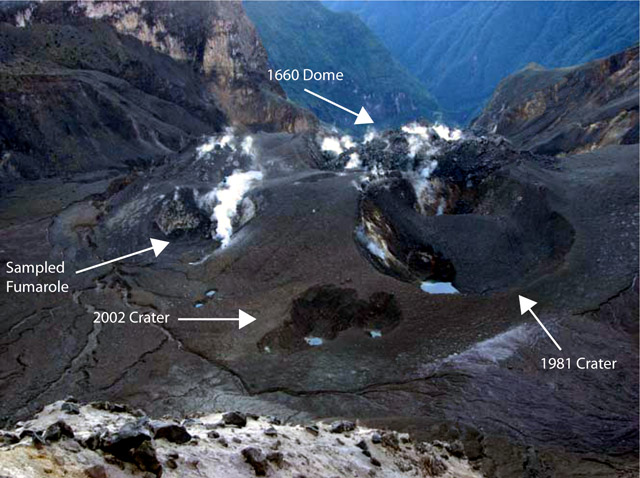 |
Figure 23. Photograph of Guagua Pichincha's crater taken in May 2008, showing the still-active year 1660 dome and adjacent crater floor. The area is heavily pockmarked with explosion craters (labeled). Note sampled fumarole (bottom left). Photo courtesy of J. Bustillos (IG-EPN 2008 annual report). |
During the 2008-2010 reporting interval, the IG yearly reports cited fumarolic emissions, surfurous odors, and noise at various locations within the crater, including the 1660 dome, and the 1981 and 2002 craters. As discussed below, rainfall often correlated with phreatic eruptions during 2008 and 2009.
Seismicity is monitored using five short-period (1 Hz) seismic stations, of which three are single-component stations (GGP, JUA2, YANA) and two are three-components stations (PINE, TERV).
Low seismicity generally prevailed during 2003-2010, with few long-period (LP) and hybrid (hb) earthquake occurrences (figure 24). Compared to 2003 to 2005 the number of volcano-tectonic (VT) earthquakes increased during 2006 to 2010 (figure 24).
 |
Figure 24. Guagua Pichincha volcano seismic event data from 2002 to 2010, shown in the number of events. Above the plot, earthquakes and periods of emission are indicated by arrows. Multiple events that happened closely spaced in time are shown by a single arrow. Data courtesy of IG-EPN (2008-2010 annual reports). |
During the period from 2005 to 2010 (table 11) the annual number of total seismic events generally remained in the range of several hundred to over 1,700. Seismically detected emission signals (phreatic outbursts) were recorded less than 25 times per year. The number of emissions in 2008 and 2009 were the largest in the years in discussion, 20 and 24 events respectively. At most, several explosions (producing non-juvenile ash found in vicinity of the crater) were recognized each year but three years had zero. More details on the 2008, 2009, and 2010 reports follows.
Table 11. Seismic data for Guagua Pichincha from IG-EPN 2005 to 2010 yearly summaries. Note the explosion column, which was often low, under three per year. IG-EPN attributed the emission cases to phreatic eruptions, in the explosion cases they recognized non-juvenile ash at the crater. The value for emissions in 2009 corrects those in the 2009 IG-EPN report. Data courtesy of IG-EPN.
| Year | Volcano-tectonic | Long-period | Hybrid | Rockfalls | Emissions | Explosions | Earthquakes in Quito |
| 2005 | 325 | 39 | 8 | 115 | 13 | 2 | 311 |
| 2006 | 811 | 84 | 28 | 174 | 4 | 3 | 162 |
| 2007 | 1274 | 84 | 30 | 83 | 8 | 0 | 84 |
| 2008 | 1531 | 105 | 190 | 107 | 20 | 3 | 62 |
| 2009 | 553 | 195 | 32 | 26 | 24 | 0 | 137 |
| 2010 | 1113 | 196 | 1 | 38 | 3 | 0 | 95 |
2008 seismicity. The three explosion events in 2008 took place on 27 January (two events) and on 5 May (one event). 2008 seismicity remained at a similar level as in 2007, with increased earthquakes in January and May, 326 and 299, respectively (figure 24). These two months had appreciable numbers of located events compared to other months. The locations of events tended to fall along trends to the WNW and NE. The WNW group is distributed in a line that runs from the N of the caldera to the foothills of Pichincha, following the Rumipamba gorge (figure 25a), which deepens towards the E. Epicenters of the NE group fall in a line on and near the caldera (figure 25a).
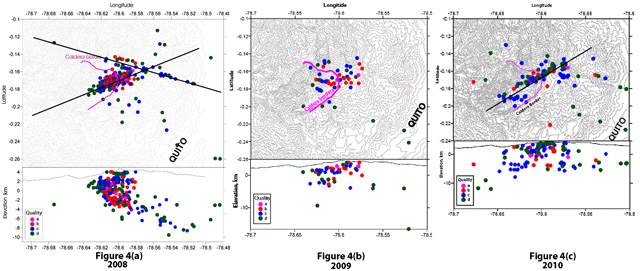 |
Figure 25. Located earthquakes (colored dots) at Guagua Pichincha presented as a series of annual maps: 2008 (4a), 2009 (4b), and 2010 (4c). The colors indicate accuracy and are listed as follows from highest to lowest accuracy: pink, red, blue, green. Courtesy of IG-EPN. |
2009 seismicity. The first half of the year was the most seismically active and ~77% of the total earthquakes occurred then (figure 24). Of the hundreds of events recorded for 2009, only 63 could be located. Their foci occurred below the crater around 7 km depth. Vapor-associated emissions mainly occurred during the first several months of the year (figure 24), coinciding with the rainy season. The highest number of emission events were on 16 February, 7 March, and 11 March.
2010 seismicity. No explosions occurred in 2010. Of the events recorded, 161 were localized near the crater (figure 25c). These recorded events were mainly grouped under the crater and to the NE with a majority of near depths of 7 km. Another group, fewer in number, was located and aligned E of the caldera (figure 25c). IG related emission events to existing heat inside the volcano interacting with groundwater.
Correlation of phreatic explosions and the rainy season. The occurrence of phreatic explosions and emissions appears to be related to the rainy season at the beginning of the year (SEAN 07:06, BGVN 18:02, 24:02, 24:11, 29:06, and 32:12). This behavior was most-recently reported on by the IG in 2008 and 2009. A possible model for the interaction of rain water with the volcanic system can be found in BGVN 24:11.
2008-2010 cooling and morphologic stability. Continued cooling of the dome was indicated by the temperatures recorded in situ from November 2000 to 2005 in the IG 2005 report. It was concluded the dome shows no thermal anomalies. IG 2010 ASTER TIR images are consistent with information from previous years and show continued cooling. In addition to undergoing continual cooling, the crater morphology has remained relatively unchanged since the formation of an additional crater in 2002. The IG concluded that Guagua Pichincha was generally becoming less active over time. However, they noted that it is possible for further emissions and explosions to occur that could possibly threaten Quito.
Reference. Samaniego, P; Robin, C; Monzier, M; Mothes,P; Beate; B; Garcia, 2006, Guagua Pichincha Volcano Holocene and Late Pleistocine Activity, Cities on Volcanoes, Fourth Conference; IAVCEI, Quito Equador, (URL: http://www.igepn.edu.ec/images/collector/collection/biblioteca/guaguapichincha_ field_guide.pdf).
Geological Summary. Guagua Pichincha and the older Pleistocene Rucu Pichincha stratovolcanoes form a broad volcanic massif that rises immediately W of Ecuador's capital city, Quito. A lava dome grew at the head of a 6-km-wide scarp formed during a late-Pleistocene slope failure ~50,000 years ago. Subsequent late-Pleistocene and Holocene eruptions from the central vent consisted of explosive activity with pyroclastic flows accompanied by periodic growth and destruction of the lava dome. Many minor eruptions have been recorded since the mid-1500's; the largest took place in 1660, when ash fell over a 1,000 km radius and accumulated to 30 cm depth in Quito. Pyroclastic flows and surges also occurred, primarily to then W, and affected agricultural activity.
Information Contacts: Instituto Geofísico Escuela Politécnica Nacional (IG-EPN), Apartado 17-01-2759, Quito, Ecuador (URL: http://www.igepn.edu.ec/); Observatorio Vulcanológico Pichincha (OVGGP) (URL: http://www.igepn.edu.ec/index.php/nuestro-blog/item/158).