Report on Spurr (United States) — January 2012
Bulletin of the Global Volcanism Network, vol. 37, no. 1 (January 2012)
Managing Editor: Richard Wunderman.
Edited by Robert Dennen.
Spurr (United States) Summit ice cauldron, debris flows through 2006; fumarolic activity continues
Please cite this report as:
Global Volcanism Program, 2012. Report on Spurr (United States) (Dennen, R., and Wunderman, R., eds.). Bulletin of the Global Volcanism Network, 37:1. Smithsonian Institution. https://doi.org/10.5479/si.GVP.BGVN201201-313040
Spurr
United States
61.299°N, 152.251°W; summit elev. 3374 m
All times are local (unless otherwise noted)
The 2004 unrest at Mount Spurr (BGVN 29:10) continued for nearly two years before the Alaska Volcano Observatory (AVO) lowered the Level of Concern Color Code from Yellow to Green (on a scale from Green to Yellow to Orange to Red) on 21 February 2006. During those two years, hydrothermal and fumarolic activity within the ice-filled summit crater resulted in the formation of a summit ice cauldron and emplacement of debris-flow deposits on the upper slopes of Spurr. The summit crater and cauldron remained active after most other signs of unrest had declined. This report discusses observations of the development of the unrest following November 2004 (activity prior to that time covered in BGVN 29:10).
A depression in the summit ice was observed in its early stages in June 2004 (figures 12 and 13). The subsidence became more pronounced, and was recognized as an ice cauldron on 2 August, following debris flows emplaced in late July (figure 14). The cauldron housed a lake, whose water was described by Neal and others (2005) and McGimsey and others (2008) as "dark battleship gray" and turquoise in color, respectively, likely due to dissolved sulfur compounds (figure 15).
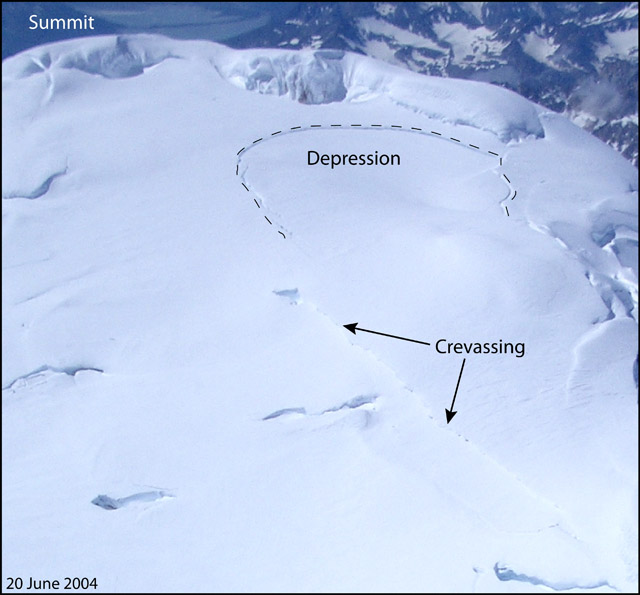 |
Figure 12. Photograph of Mount Spurr's summit (viewing SSW) on 20 June 2004, showing the initial development of a depression (dashed outline) in the ice and snow covering the summit. Crevassing of the snow and ice downslope is indicated by arrows. This is the earliest image of the 2004 development of the summit ice cauldron. Photograph courtesy of Bruce Hopper, Alaska Volcano Observatory (AVO). |
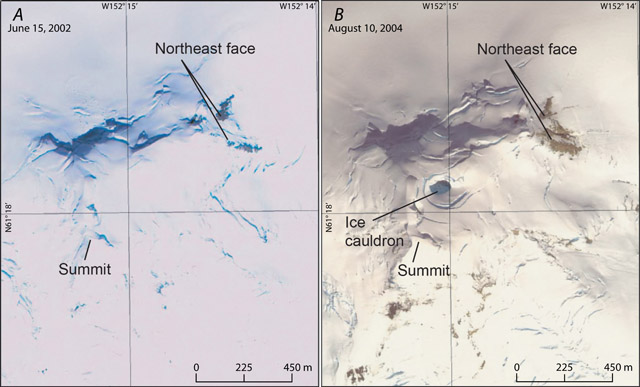 |
Figure 13. Satellite photography highlighting the 2004 development of Mount Spurr's summit ice cauldron, acquired on (A) 15 June 2002 and (B) 10 August 2004. Modified from Coombs and others (2005). |
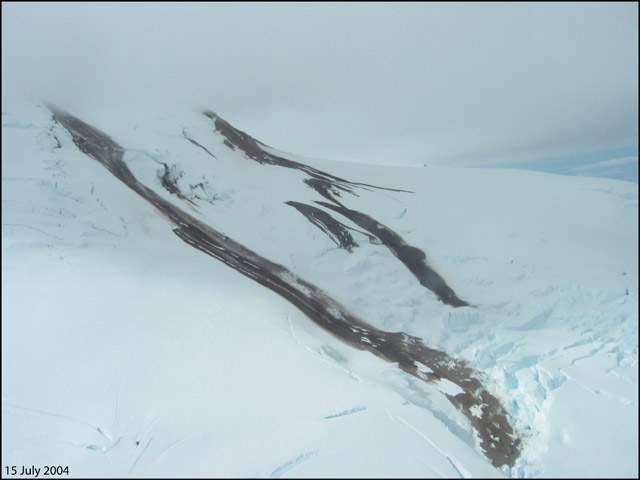 |
Figure 14. Debris flow deposits on the upper slopes of Mount Spurr, photographed on 15 July 2004, viewing NNW. The debris flow deposits prompted an observation flight, which resulted in the observation of the summit ice cauldron on 2 August. Courtesy of Christina Neal, Alaska Volcano Observatory (AVO). |
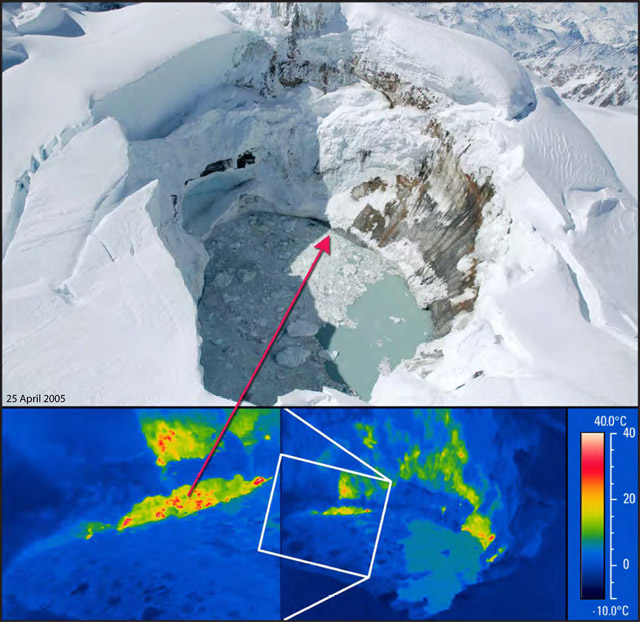 |
Figure 15. Aerial photograph and Forward Looking Infrared Radiometer (FLIR) images of Mount Spurr's summit ice cauldron and lake, taken on 25 April 2005. Hottest parts of the FLIR image correspond to the exposed bedrock on the shore of the lake (see temperature scale at right). The light blue gray color of the lake is likely due to dissolved sulfur compounds (Neal and others, 2005). Courtesy of McGimsey and others (2008). |
Ice cauldron widens. Neal and others (2005) reported that measurements made on 10 August and 30 October 2004 revealed enlargement of the ice cauldron from ~65 m x 95 m to ~130 m x 130 m in two and a half months' time. Gas measurements during the same time revealed that CO2 emissions had more than doubled (figure 16).
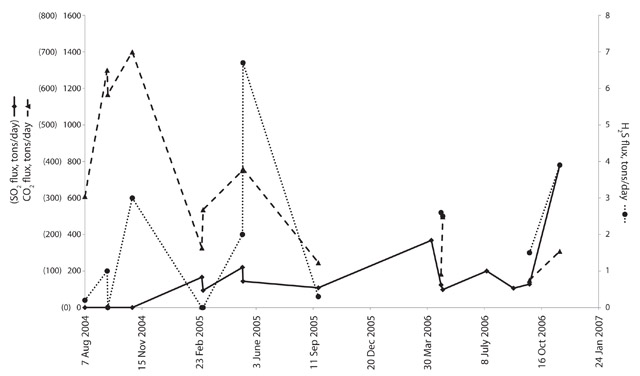 |
Figure 16. Measured gas emissions (tons/day) at Mount Spurr during the 2004-2006 active period. SO2 (in parentheses) and CO2 fluxes plotted on left axis; H2S flux plotted on right axis. Data courtesy of Doukas and McGee (2007). |
Forward Looking Infrared Radiometer (FLIR) measurements on 24 September showed that the crater lake was ~0 °C (substantially warmer than the surrounding ice and snow), and the surrounding exposed bedrock (and main fumarolic emission area) was as hot as ~39 °C (figure 15).
By the end of 2004, seismicity remained elevated, and most located earthquakes were within 0-5 km depth below sea level (figure 17; Neal and others 2005).
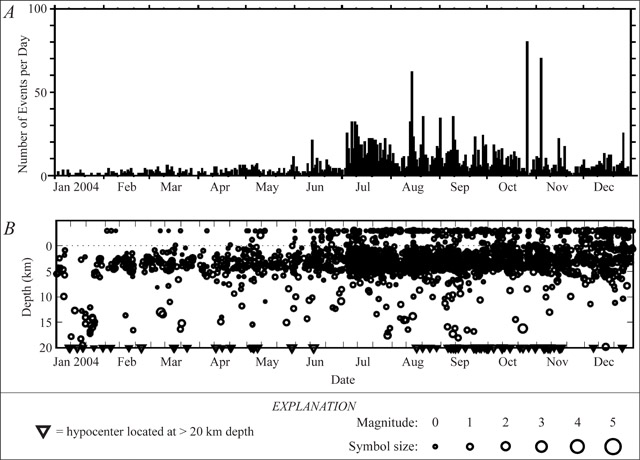 |
Figure 17. Earthquakes located beneath Mount Spurr during 2004 showed increased seismicity correlating to increased gas emissions and hydrothermal activity responsible for the formation of the summit ice cauldron. Plots show (A) number of earthquakes per day and (B) hypocenter depths below sea level. Symbol size indicates the relative magnitude of the earthquakes; triangles indicate located hypocenters at depths greater than 20 km. Courtesy of Neal and others (2005). |
During 2005, growth of the summit ice cauldron continued (figures 18 and 19), and areas of exposed bedrock increased along the N and NW walls of the crater. According to McGimsey and others (2008), FLIR measurements on 25 April 2005 showed similar temperatures to those measured in September 2004 (figure 15).
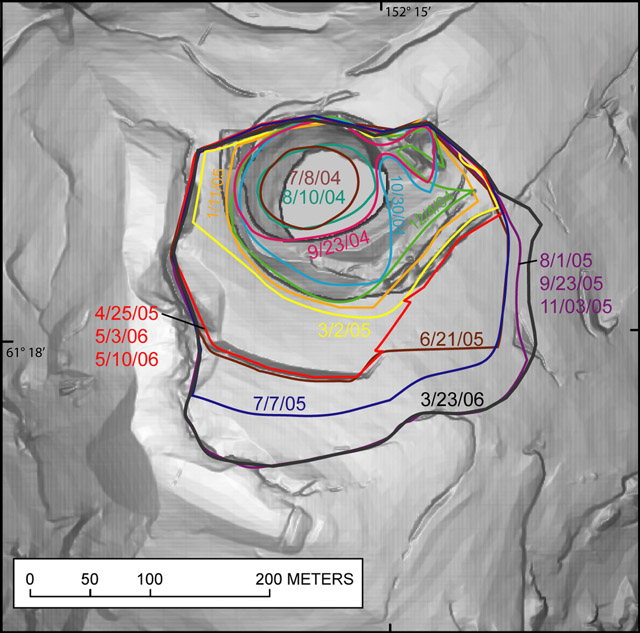 |
Figure 18. Mount Spurr's summit ice cauldron extent as it expanded during 2004-2006. Colored lines indicate the rim of the cauldron as measured on the dates indicated. Courtesy of Coombs and others (2006). |
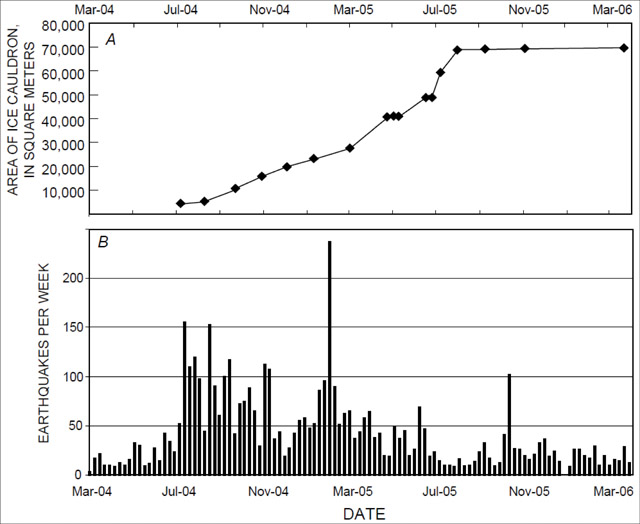 |
Figure 19. Two plots showing (A) the area of Mount Spurr's ice cauldron and (B) the number of earthquakes per week during March 2004-March 2006. Courtesy of Coombs and others (2006). |
May 2005 debris flow. A small debris flow was captured on webcam views of the summit on 2 May 2005 (figure 20). Observations a week later revealed that the cauldron lake level had dropped by ~15 m, and fumaroles on the N shore of the lake had been exposed (McGimsey and others, 2008). The fumaroles were described as vigorous by McGimsey and others (2008). FLIR measurements during an observation flight on 21 June indicated increasing temperatures of exposed bedrock within the crater (up to 60 °C; orange areas within the ice cauldron outline, figure 20) and observers noted strong upwelling within the N half of the cauldron lake.
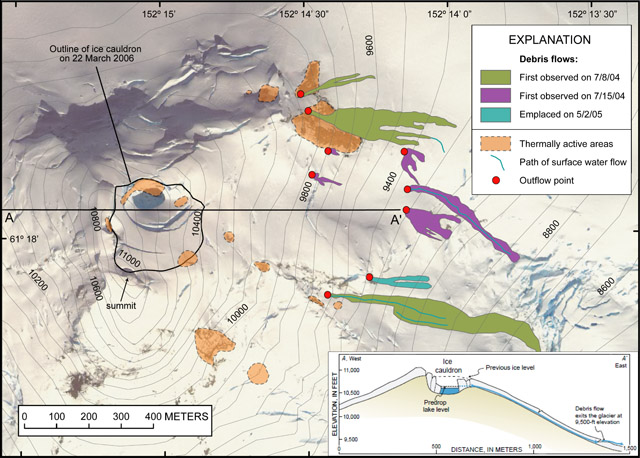 |
Figure 20. Map and interpretive cross-section highlighting the locations of debris flows emplaced onto the summit cone of Mount Spurr during 2004-2005. Dates of observation or emplacement of debris flows are provided in the explanation; associated outflow points are indicated by red dots. Orange areas indicate zones of elevated thermal activity and/or exposed bedrock. Schematic cross-section (bottom right) is along the line A-A', and indicates the probable pathway of debris-laden water from the cauldron lake to the outflow points of the debris flows. Base image from QuickBird satellite image, acquired 10 August 2004. Modified from Coombs and others (2006). |
The likely (or at least nearly) contemporaneous lake level drop and debris flow on 2 May were not associated with any significant ice collapse into the cauldron lake; Coombs and others (2006) thus concluded that the debris flows were the result of widening of englacial or subglacial pathways by erosion, heating, or glacial flow (cross-section, figure 20). They also interpreted the main source of the debris carried in the debris flows to be melted glacial ice containing layers of tephra and ash. The primary source of the tephra and ash layers was likely the 1992 eruptions of Crater Peak (Spurr's satellite cone and youngest vent) and possibly the 1989-90 eruptions of Mount Redoubt (Coombs and others, 2006). Some component of the debris was also likely sourced from the summit crater floor and wall rocks.
Snow/ice melts from summit crater. By 1 August 2005, the ice cauldron had reached its largest size (i.e. the snow/ice had melted from within the perimeter of the summit crater; figures 18 and 19), and was thus no longer termed the "ice cauldron", but simply the summit crater (McGimsey, personal communication, 2012). In September, the crater lake was observed to be completely ice-free, and most likely remained as such through mid January 2006. McGimsey and others (2008) reported that, as of 3 November 2005, ~5.4 x 10⁶ m3 of ice and snow had been melted and consumed by the summit lake.
Decreasing seismicity prompted the AVO to lower the Level of Concern Color Code from Yellow to Green on 21 February 2006. With the exception of an earthquake swarm during 11-12 April, seismicity continued to decrease, and reached background levels by May 2006. During the earthquake swarm, Neal and others (2009) reported 157 volcano-tectonic earthquakes (reaching M ~2.3) that occurred at less than 5 km depth below sea level and ~1-3 km W of the summit. FLIR measurements two days after the earthquake swarm revealed that fumaroles within the summit crater were as hot as 150 °C (Neal and others, 2009). By mid July, however, snow and ice had started accumulating on the lake's surface, and by 17 November 2006, a rise in the level of the lake was observed. As fumarolic activity continued, yellow, sulfur stained ice and snow, as well as a strong sulfur smell, was often reported by pilots passing the summit.
Since 2006, most of the sides and bottom of the summit crater have been covered by snow, with the exception of the fumarole field in the N part of the crater floor. As of the last observation flight, the fumarole field maintained a small patch of snow/ice free bedrock on the summit crater's floor, an area still active as of 28 August 2011 (figure 21). Later satellite imagery suggested that the fumarole field had been covered as the summit crater filled with snow and ice during the first part of the 2011-2012 winter (figure 22), but there have been no observation flights to confirm this as of 24 February 2012.
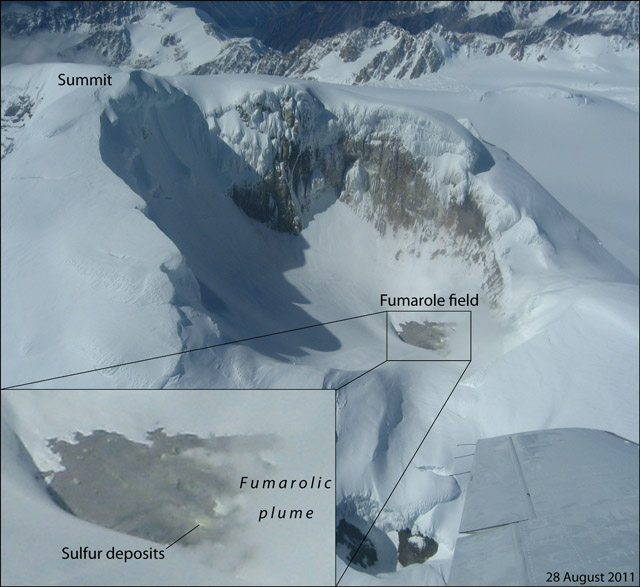 |
Figure 21. Aerial observation photograph of Mount Spurr's summit on 28 August 2011. Although the crater had begun refilling with snow, the fumarole field on the crater floor remained in a clear patch of bedrock. Photograph courtesy of Game McGimsey, Alaska Volcano Observatory (AVO). |
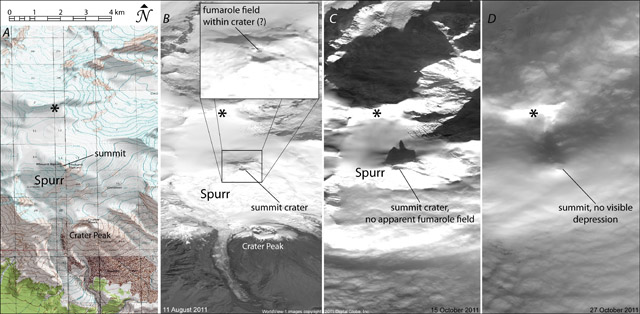 |
Figure 22. WorldView-1 daytime optical panchromatic imagery detailing the apparent filling of Mount Spurr's summit crater with snow and ice during the early 2011-2012 winter. (B) shows Spurr on 11 August 2011, with the fumarole field and area of exposed bedrock in the N of the summit crater (enlarged, inset). Snow appears white, and vegetation at the bottom of the image appears dark. (C) shows the same area on 15 October, with the fumarole field and exposed bedrock areas apparently covered by snow at the bottom of the summit crater. Vegetation is no longer visible at the bottom of the image. (D) shows the same area on 27 October, but the summit crater appears to be completely filled with snow, no longer exhibiting a depression. Topographic map of the same area is shown for reference (A). '*' symbol indicates a prominent topographic ridge to the N of Spurr that is visible in each image. Scale is approximate for the satellite imagery (B-D). Courtesy of Alaska Volcano Observatory (AVO) and Digital Globe, Inc. (B-D). |
Coombs and others (2006) stated that the overall effect of the hydrothermal activity (including water/debris flow releases from the summit) on the glacial system of Spurr were likely minimal, pointing out that the volume of water released was relatively small and probably easily accommodated "without significant modification of the icemass."
References. Coombs, M.L., Neal, C.A., Wessels, R.L., and McGimsey, R.G., 2006, Geothermal disruption of summit glaciers at Mount Spurr Volcano, 2004-6: An unusual manifestation of volcanic unrest: U.S. Geological Survey Professional Paper 1732-B, 33 p.
Doukas, M.P., and McGee, K.A., 2007, A compilation of gas emission-rate data from volcanoes of Cook Inlet (Spurr, Crater Peak, Redoubt, Iliamna, and Augustine) and Alaska Peninsula (Douglas, Fourpeaked, Griggs, Mageik, Martin, Peulik, Ukinrek, and Veniaminof), Alaska, from 1995-2006: U.S. Geological Survey Open-File Report 2007-1400, 16 p.
McGimsey, R.G., Neal, C.A., Dixon, J.P., and Ushakov, S., 2008, 2005 Volcanic activity in Alaska, Kamchatka, and the Kurile Islands: Summary of events and response of the Alaska Volcano Observatory: U.S. Geological Survey Scientific Investigations Report 2007-5269, 94 p.
Neal, C.A., McGimsey, R.G., Dixon, J.P., Manevich, A., and Rybin, A., 2009, 2006 Volcanic activity in Alaska, Kamchatka, and the Kurile Islands: Summary of events and response of the Alaska Volcano Observatory: U.S. Geological Survey Scientific Investigations Report 2008-5214, 102 p.
Neal, C.A., McGimsey, R.G., Dixon, J., and Melnikov, D., 2005, 2004 Volcanic activity in Alaska and Kamchatka: Summary of events and response of the Alaska Volcano Observatory: U.S. Geological Survey Open-File Report 2005-1308, 71 p.
Geological Summary. Mount Spurr is the closest volcano to Anchorage, Alaska (130 km W) and just NE of Chakachamna Lake. The summit is a large lava dome at the center of a roughly 5-km-wide amphitheater open to the south formed by a late-Pleistocene or early Holocene debris avalanche and associated pyroclastic flows that destroyed an older edifice. The debris avalanche traveled more than 25 km SE, and the resulting deposit contains blocks as large as 100 m in diameter. Several ice-carved post-collapse cones or lava domes are present. The youngest vent, Crater Peak, formed at the southern end of the amphitheater and has been the source of about 40 identified Holocene tephra layers. Eruptions from Crater Peak in 1953 and 1992 deposited ash in Anchorage.
Information Contacts: Bruce Hopper, Game McGimsey, and Christina Neal, Alaska Volcano Observatory (AVO), a cooperative program of a) U.S. Geological Survey (USGS), 4200 University Drive, Anchorage, AK 99508-4667 USA (URL: http://www.avo.alaska.edu/), b) Geophysical Institute, University of Alaska, PO Box 757320, Fairbanks, AK 99775-7320, USA, and c) Alaska Division of Geological & Geophysical Surveys (ADGGS), 794 University Ave., Suite 200, Fairbanks, AK 99709, USA (URL: http://www.dggs.alaska.gov/); Digital Globe, Inc. (URL: http://www.digitalglobe.com/).