Report on Masaya (Nicaragua) — April 2012
Bulletin of the Global Volcanism Network, vol. 37, no. 4 (April 2012)
Managing Editor: Richard Wunderman.
Edited by Julie A. Herrick.
Masaya (Nicaragua) Continuous monitoring of emissions and new investigations from collaborators
Please cite this report as:
Global Volcanism Program, 2012. Report on Masaya (Nicaragua) (Herrick, J.A., and Wunderman, R., eds.). Bulletin of the Global Volcanism Network, 37:4. Smithsonian Institution. https://doi.org/10.5479/si.GVP.BGVN201204-344100
Masaya
Nicaragua
11.9844°N, 86.1688°W; summit elev. 594 m
All times are local (unless otherwise noted)
In our last report on Masaya volcano, we reviewed field investigations and gas measurements from 2008-2011 including the attempt to launch a small Zeppelin as an experiment to measure gas emissions in March 2011 (BGVN 36:11). Here we present results from monitoring efforts focused on the elevated activity that has continued from Masaya's Santiago crater, one of the nested summit craters in Nindirí cone (figure 30). New gas measurements and field observations have become available from the Instituto Nicaragüense de Estudios Territoriales (INETER) from November 2011 through March 2012. Reports were also available for Masaya's Comalito cinder cone, a site of continuous gas emissions and elevated temperatures. In February 2012, INETER met with collaborators from both Simon Fraser University (Canada) and The Open University (UK). We highlight some of the results from these collaborators including mapping and modeling of Masaya's hydrothermal complex, results from long-term SO2 flux monitoring, and a conceptual model that links magma chamber dynamics with intermittent explosive activity.
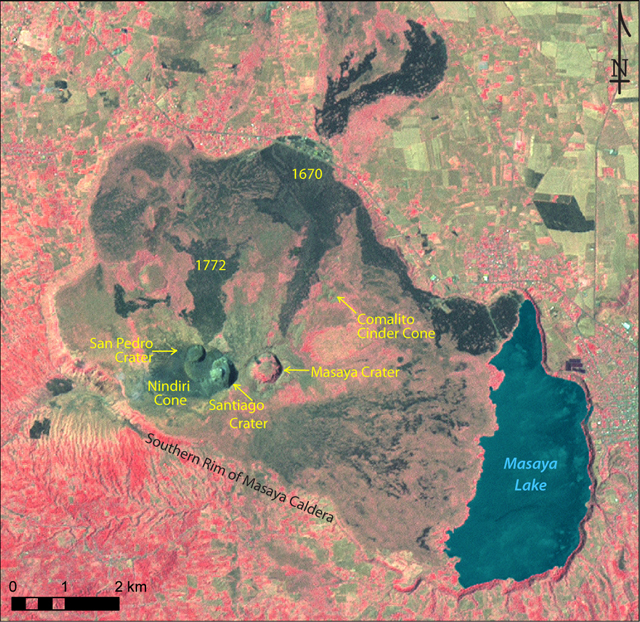 |
Figure 30. In this false-color image, Masaya caldera is well-defined. Landsat bands 4,3,2 emphasize vegetation (red) and soil (brown to yellow) and the panchromatic analysis improved the distinction between dark rock (lava) and water (Masaya lake, at the E edge of the caldera) (NASA Landsat Program, 2007). Annotation is based on sketch maps by Mooser and others (1958) and Girard and van Wyk de Vries (2005); image processed by GVP. |
The false-color image of Masaya (figure 30) and the surrounding area is a standard composite image (bands 4,3,2) captured by Landsat on 25 March 2001, during Nicaragua's dry season (November through April). Here, vegetation appears in shades of red (darker in areas with denser vegetation), urban areas are cyan blue, and soils vary from dark to light browns. Located just 500 m E of Santiago crater, Masaya crater is distinguished by older deposits, last active around 150 AD, and contains a ring of vegetation (which appears as a pale pink circle). Masaya's recent lava flows have been contained within the larger caldera except for those dating from 1670 when lava ponded along the northern caldera rim and spilled over to cover more than 1 km2 outside the caldera.
In November 2011, INETER recorded little activity from Masaya. No field visits were made and no earthquakes were large enough to locate hypocenters. Seismicity that month was low, at 50 RSAM units.
On 12 December 2011, INETER conducted site visits to Masaya's active crater (Santiago) and Comalito cinder cone. With an infrared thermometer, temperatures were measured from vents within Santiago crater; the highest temperatures measured were 42 and 45°C. The field investigators learned from National Park personnel that, recently during a 2-hour period, booming noises were heard from Santiago crater. INETER suggested that the noise resulted from strong gas release from deep within the crater - no visible material was ejected during the episodes. Areas of gas release could be visually identified within the crater; these were also locations where debris had been shed from the S and SW walls. Rockfalls from these locations were likely affecting gas emissions.
Additional visits to Comalito cone (figure 30), a satellite cone located less than 2 km NE of Santiago crater, allowed in situ measurements of fumarole temperatures. Four sites were measured; the highest temperature was 79°C, the lowest was 75°C (fumaroles 4 and 1 respectively). These temperatures were considered typical compared to others during 2011 (as compiled by INETER; figure 31). The lowest temperatures of the year 2011 were recorded in May and July with some values as low as 60-65°C.
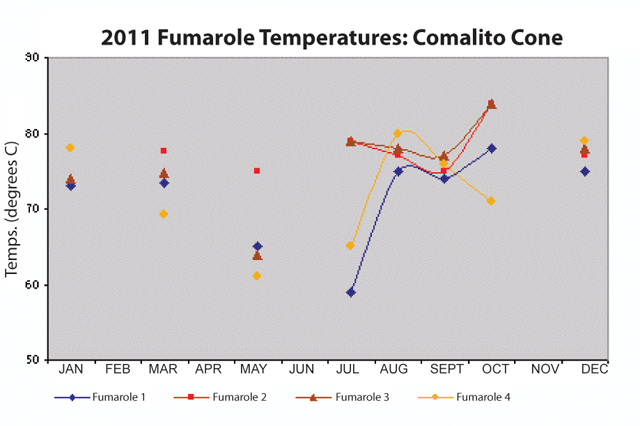 |
Figure 31. Temperature measurements made by INETER during 2011 at Masaya's Comalito cone. Four fumaroles were measured consistently throughout the year. Courtesy of INETER. |
To quantify SO2 gas emissions, INETER used a mobile Mini DOAS throughout the year transported on two different routes. The road between Ticuantepe and San Juan de la Concepción was the closest route available when the plume trended SW. An additional route, at a greater distance (figure 25 from BGVN 36:11) was available between Las Quatro Esquinas and El Crucero. On 13 December, cloud cover limited the number of successful traverses; however, an average SO2 flux of 648 metric tons per day (t/d) was calculated from three of the six traverses. This was a significant increase compared to values obtained in October 2011 when 13 successful traverses that month yielded an average of 153 t/d. These values (and others in this report) have not been corrected for meteorological conditions and error calculations were not available during this reporting period.
On 23 January 2012 INETER conducted traverses below Masaya's plume with a Mini DOAS. Measurements along both routes, proximal (Ticuantepe and San Juan de la Concepción) and distal (Las Quatro Esquinas and El Crucero) were attempted. From 10 calculations, SO2 flux from the proximal route yielded 801 t/d. From the distal route, the average flux rate was 543 t/d.
INETER conducted fieldwork during 30-31 January 2012, visiting Santiago crater and Comalito cone. Temperatures from fumarole sites on Comalito had maximum temperatures of 70°C (fumarole 4) and 78°C (fumarole 2) on 30 January. The maximum temperature measured from Santiago crater had increased to 95°C.
On 1 February 2012, INETER visited Comalito cone and reported fumarole temperatures. The highest temperature was 97°C (fumarole 1); on 23 February the highest temperature was 86°C (fumarole 2). Fieldwork also included visits to Santiago crater; temperatures within the crater were relatively low, 75 and 70°C (from 1 February and 23 February, respectively). SO2 flux from Mini DOAS from the closest route (Ticuantepe and San Juan de la Concepción) yielded an average of 943 t/d based on 12 traverses, continuing the trend of increased SO2 emissions since December 2011.
In March 2012, National Park personnel reported that acoustic noise from the crater was less frequent compared to the previous month. Also, visible gas emissions appeared concentrated at the SW and innermost portions of Santiago crater. On 12 March 2012, INETER visited Masaya and measured temperatures from Santiago crater. A wide range of values was recorded: 100°C to 43°C. Relatively stable temperatures were measured from Comalito cone: 73°C to 76°C. The highest temperatures were measured at fumaroles 3 and 4.
On 20 March INETER conducted Mini DOAS traverses beneath Masaya's SW-trending gas plume. On the proximal route, 12 traverses were successful and determined an average SO2 flux of 1002 t/d suggesting the increasing trend that began in early December 2011 was continuing. Without error calculations and assessing meteorological conditions, however, this trend could not be directly interpreted.
Geohydrology. Long-term interest in diffuse CO2 gas emissions spurred recent investigations into Masaya's hydrothermal system. Mauri and others (2012) found active hydrothermal anomalies under many of the cinder cones and investigated these conditions with field measurements of soil CO2 concentration, self-potential (SP), soil temperatures, and flow-path modeling (figure 32). Self potential methods make observations "of the static natural voltage existing between sets of points on the ground (Sheriff, 1982)". From Comalito cone, Nindirí cone, and the lower slopes of Masaya, CO2 gas concentrations ranged from 26 to 43 ppm (mean values). During a 5-year investigation, the authors collected SP geophysical data over extensive transects within the caldera. The datasets yielded significant correlations between high CO2 soil concentrations and SP anomalies. Water depths were determined by processing the SP data with mathematical techniques (wavelets from the Poisson kernel family). They concluded that interconnected structures (ring faults, fissures, and dikes) serve as flow paths for gas, fluids, and heat. These structures also have the potential to block groundwater flow, a conclusion suggested by their models of groundwater contributions to Masaya Lake (Laguna de Masaya) (figure 32).
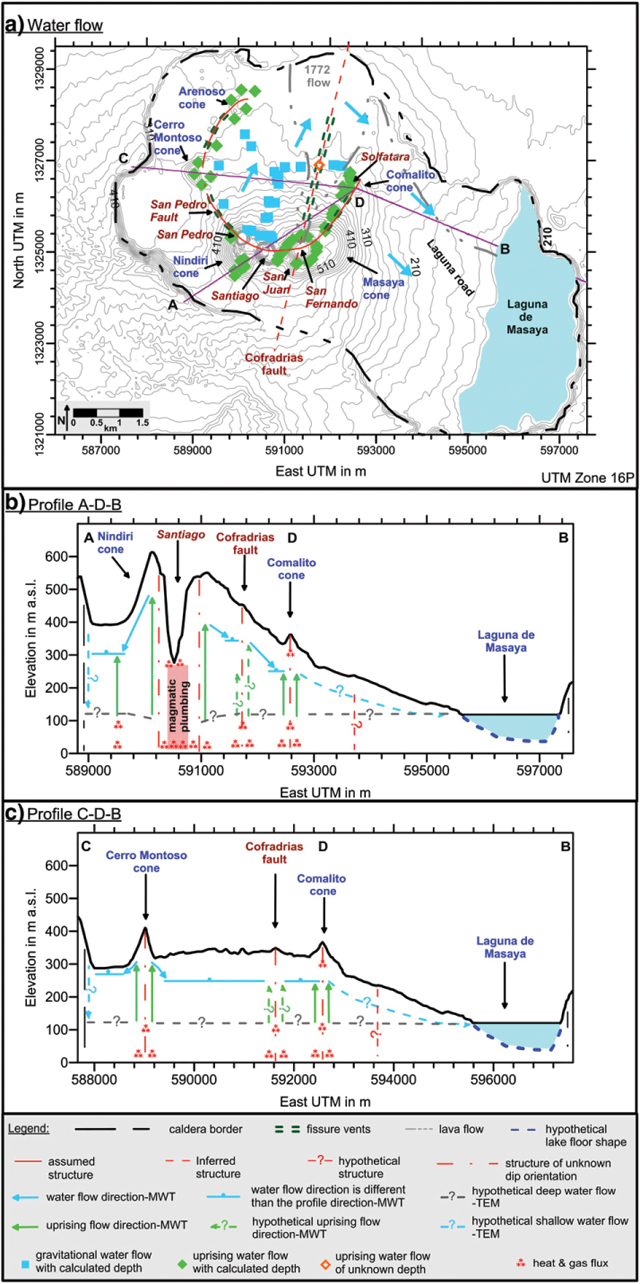 |
Figure 32. Groundwater flow model for Masaya volcano taken from Mauri and others (2012). (a) A map indicating key geographic and geologic features including groundwater flow. (b,c) Two vertical profiles with a legend at the bottom. The groundwater was mapped using two geo-electrical prospecting techniques. The self-potential (SP) technique yielded data processed with multi-scale wavelet tomography (MWT). The second technique was the transient electromagnetic method (TEM) (see key and text). |
In Figure 32a, we see the spatial localization of uprising fluids associated with hydrothermal activity (green diamonds) and gravitational water flow (blue squares) within Masaya caldera for which depths have been determined. The names of volcanic cones are in blue; crater names and ground structures are in dark red; dark green dashed lines are the fissure vent structures; solid red lines represent the inferred structures (faults, fissures) based on previous work by Crenshaw and others (1982) and Harris (2009). The red dashed lines are the hypothetical structures (faults, fissures) (Crenshaw and others, 1982). The black dashed line is the inferred limit of the caldera.
The three segments traced in Figure 32a correspond to cross-sections along A-D-B (figure 32b) and C-D-B (figure 32c). Cross-section A-D-B represents the water flow direction across the caldera while the cross-section along profile C-D-B represents the water flow direction through the active Santiago crater and across the caldera. The dashed red lines represent underground structures in cases where the dip orientation is unknown and are based on the work of Williams (1983) and Crenshaw and others (1982). Blue lines with a single dot above the center represent water flow having a flow direction different than the cross-section view. Solid arrows represent the flow direction inferred from the self potential/elevation gradient. Elevations of the shallow flow direction (blue and solid green arrows) were estimated from multi-scale wavelet tomography (MWT). MWT is a signal processing method based on waves that allow for location of dipole and monopole sources which correspond to the electrical anomalies generated by water flow through bedrock. The dashed grey line and dashed blue arrows are deep hypothetical flows from the transient electromagnetic method (TEM) results (MacNeil and others, 2007). TEM results were considered in this study because they offered a different level of sensitivity to SP method and, at the time of the study, direct well data was not available to correlate results, making it difficult to determine which model (MWT or TEM) best represented the true water depth.
Long-term SO2 fluxes and windspeed-induced errors. Nadeau and Williams-Jones (2009) consolidated data spanning three decades (figure 33) and assessed current methods for constraining uncertainties in SO2 data collected on traverses with UV correlation spectrometers (COSPEC/DOAS/FLYSPEC). The authors agreed with previous investigators that the following factors contribute to uncertainties: variable local windspeed, emission rate, dry deposition of sulfur from the plume, and conversion of SO2 to sulfate aerosols within the plume. Of these factors, the authors stressed that for low-lying volcanoes such as Masaya, the local wind patterns cause the largest errors. "One must be wary of using one blanket plume speed value for all data collected at different locations, as it can result in misleading variations within the SO2 flux dataset (Nadeau and Williams-Jones, 2009)." At Masaya, this led to as much a 50% apparent decrease in measured SO2 flux between the proximal and distal routes.
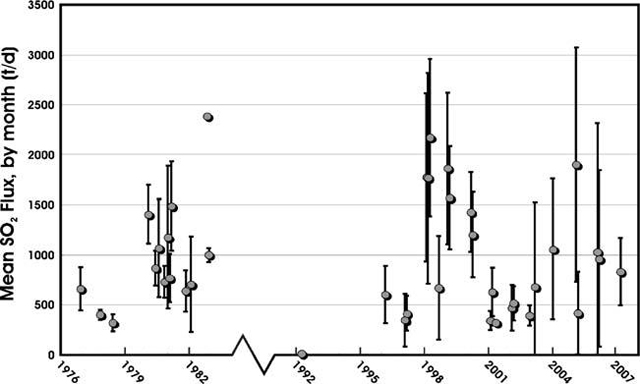 |
Figure 33. Mean SO2 fluxes grouped by month from numerous field campaigns at Masaya. Error bars represent 1 standard deviation of 1 month of measurements. Note the break in the x-axis. Data from Nadeau and Williams-Jones (2009), which expanded on previous work by numerous investigators listed in that publication. |
Modeling Masaya's magma system. Glyn Williams-Jones from Simon Fraser University visited Masaya with student researchers on 21 February 2012. At the National Park facilities, this group presented recent research and results from the 8-year-long collaborative effort between Simon Fraser University, The Open University, and INETER. Williams-Jones reviewed the primary monitoring techniques applied to Masaya and preliminary results regarding the environmental impact of the persistent degassing. In particular, gravity measurements, GPS, and DOAS/FLYSPEC have been used to characterize activity. SO2 flux and air quality measurements have been part of an additional effort to characterize environmental impacts related to resident's health. The varying trend in the SO2 flux observed since 1976 has been interpreted as being related to varying rates of magma convection in the volcanic plumbing system, as opposed to models invoking intermittent magma supply (Williams-Jones and others, 2003; Stix, 2007).
The model invoking convection within the system links Masaya's periodic explosive activity with intense, long-term degassing (Williams-Jones and others, 2003; Stix, 2007). The accumulation of a gas-rich magma within a shallow reservoir could develop a buoyant, pressurized foam. This setting would be susceptible to disruptions (by convection cells or structural adjustments, for example) and could be destabilized, leading to explosive activity.
References. Crenshaw, W.B., Williams, S.N., and Stoiber, R.E., 1982, Fault location by radon and mercury detection at an active volcano in Nicaragua, Nature, 300: 345?346.
Harris, A.J.L., 2009, The pit-craters and pit-crater-filling lavas of Masaya volcano, Bulletin of Volcanology, 71(5): 541?558.
MacNeil, R.E., Sanford, W.E., Connor, C.B., Sandberg, S.K., and Diez, M., 2007, Investigation of the groundwater system at Masaya Caldera, Nicaragua, using transient electromagnetics and numerical simulation, Journal of Volcanology and Geothermal Research, 166(3?4): 216?232.
Mauri, G., Williams-Jones, G., Saracco, G., and Zurek, J.M., 2012, A geochemical and geophysical investigation of the hydrothermal complex of Masaya volcano, Nicaragua, Journal of Volcanology and Geothermal Research, 227?228: 15?31.
Nadeau, P.A. and Williams-Jones, G., 2009, Apparent downwind depletion of volcanic SO2 flux-lessons from Masaya Volcano, Nicaragua, Bulletin of Volcanology, 71: 389?400.
NASA Landsat Program, 2007, Landsat ETM+ scene 7dx20010325, Orthorectified, USGS, Sioux Falls, Mar. 25, 2001.
Sheriff, R.E., 1982, Encyclopedic Dictionary of Exploration Geophysics, Eighth Edition, Society of Exploration Geophysicists, Tulsa, OK, 266 pp.
Stix, J., 2007, Stability and instability of quiescently active volcanoes: the case of Masaya, Nicaragua. Geology, 35(6):535?538.
Williams, S.N., 1983, Geology and eruptive mechanisms of Masaya Caldera complex, Nicaragua [PhD Thesis]: Hanover, New Hampshire, Dartmouth College, 169 p.
Williams-Jones, G., Rymer, H., and Rothery, D.A., 2003, Gravity changes and passive SO2 degassing at the Masaya caldera complex, Nicaragua, Journal of Volcanology and Geothermal Research, 123: 137?160.
Geological Summary. Masaya volcano in Nicaragua has erupted frequently since the time of the Spanish Conquistadors, when an active lava lake prompted attempts to extract the volcano's molten "gold" until it was found to be basalt rock upon cooling. It lies within the massive Pleistocene Las Sierras caldera and is itself a broad, 6 x 11 km basaltic caldera with steep-sided walls up to 300 m high. The caldera is filled on its NW end by more than a dozen vents that erupted along a circular, 4-km-diameter fracture system. The Nindirí and Masaya cones, the source of observed eruptions, were constructed at the southern end of the fracture system and contain multiple summit craters, including the currently active Santiago crater. A major basaltic Plinian tephra erupted from Masaya about 6,500 years ago. Recent lava flows cover much of the caldera floor and there is a lake at the far eastern end. A lava flow from the 1670 eruption overtopped the north caldera rim. Periods of long-term vigorous gas emission at roughly quarter-century intervals have caused health hazards and crop damage.
Information Contacts: Instituto Nicaragüense de Estudios Territoriales (INETER), Apartado Postal 2110, Managua, Nicaragua (URL: http://www.ineter.gob.ni/); Glyn Williams-Jones, Department of Earth Sciences, Simon Fraser University, Burnaby, Canada (URL: http://www.sfu.ca/earth-sciences.html); Hazel Rymer, Department of Environment, Earth and Ecosystems, The Open University, Milton Keynes, UK (URL: http://www8.open.ac.uk/science/environment-earth-ecosystems/).