Report on Puyehue-Cordon Caulle (Chile) — September 2013
Bulletin of the Global Volcanism Network, vol. 38, no. 9 (September 2013)
Managing Editor: Richard Wunderman.
Edited by Julie A. Herrick.
Puyehue-Cordon Caulle (Chile) Explosive phases ended in April 2012 and the rhyolitic dome continued to flow ~1 year later
Please cite this report as:
Global Volcanism Program, 2013. Report on Puyehue-Cordon Caulle (Chile) (Herrick, J.A., and Wunderman, R., eds.). Bulletin of the Global Volcanism Network, 38:9. Smithsonian Institution. https://doi.org/10.5479/si.GVP.BGVN201309-357150
Puyehue-Cordon Caulle
Chile
40.59°S, 72.117°W; summit elev. 2236 m
All times are local (unless otherwise noted)
The rift zone eruption that began at Puyehue-Cordón Caulle on 4 June 2011 (BGVN 37:03) persisted through early 2012 and declined toward the end of 2012. Relative quiescence was observed through October 2013, which is the end of this reporting period. The Observatorio Volcanológico de Los Andes del Sur-Servicio Nacional de Geología y Minería (OVDAS-SERNAGEOMIN) maintained Red Alert (the highest level in a four-color scale) from 4 June 2011 to 23 March 2012; declining activity led to a downgrade in the Alert Level on 23 March 2012 to Orange, and then again on 24 April to Yellow. The status remained at Yellow until 16 August 2012, when it decreased to Green. Green Alert was maintained through the end of this reporting period of October 2013.
Early stages of the eruption captured by remote sensing. Based on polar-orbiting satellites, scientists at the Montreal Volcanic Ash Advisory Centre (VAAC) were able to detect the volcanic ash cloud as it circled the southern hemisphere. Using a combination of infrared channels, five satellites contributed to a mosaic of data showing the wide dispersion of volcanic ash over the period of 4-6 June 2011 (figure 8). A mosaic created on 14 June 2011 captured the 4 June 2011 ash as it approached the Chilean coast while, at the same time, a new ash eruption was occurring at Puyehue-Cordón Caulle (figure 9).
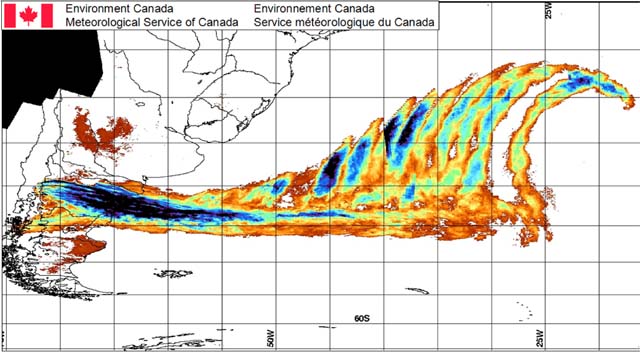 |
Figure 8. Composite image of volcanic ash from Puyehue-Cordón Caulle as detected by satellites between 1937 on 4 June and 1551 on 6 June 2011. The 4-km resolution data was collected during 30 passes (satellites NOAA 15, 16, 18, 19, and MetOp-A) using a combination of infrared channels. The colors correspond to values of brightness temperature differences (i.e. ch4 - ch5) ranging from -0.5° C to -12° C. The image was produced at Montreal VAAC with the Terascan software and the NOAA CLASS data. Courtesy of René Servranckx, Meteorological Service of Canada. |
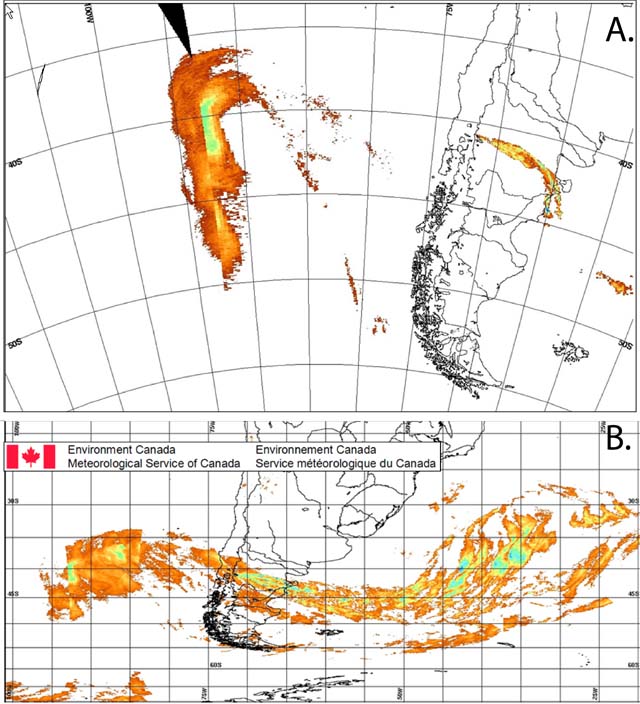 |
Figure 9. (A) Composite image from NOAA satellites NOAA-19 and NOAA-18 capturing two different stages of ash plumes from Puyehue-Cordón Caulle. The large plume over the Pacific Ocean was generated by explosive activity on 4 June 2011 and circled the southern hemisphere within 10 days. At 1938 on 14 June 2011, a new ash plume was erupting, contributing additional ash in the atmosphere. (B) Five satellites contributed to this image of Cordón Caulle's ash plume during 14-16 June 2011. With 4 km resolution, the image comprises 56 satellite passes using a combination of infrared channels. The color coding corresponds to values in the range of -1.5° C to -10.0° C. Both images were produced at Montreal VAAC with Terascan software and data retrieved from the NOAA CLASS website. Courtesy of René Servranckx, Meteorological Service of Canada. |
Post-processing of satellite images from GOES-13 highlighted the strong thermal anomalies that occurred during the early stages of the eruption. Daniel Lindsey of NOAA prepared a video sequence of images during 12-14 June 2011 that provided a clear way to identify the ash plume extending across Chile and Argentina (figure 10). From those images, it was possible to infer that a significant amount of ash was released from this eruption based on the persistent cold infrared brightness temperatures.
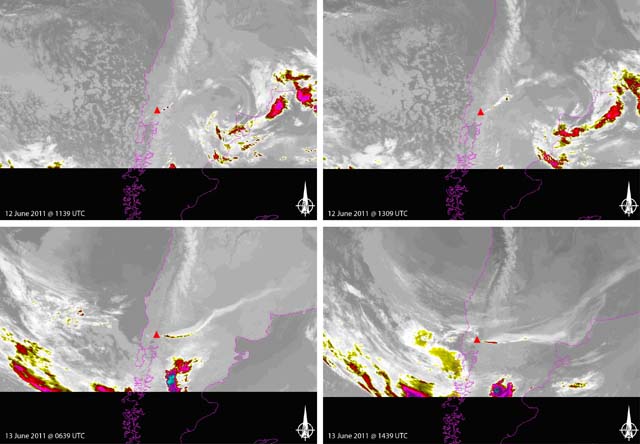 |
Figure 10. Images of GOES-13 data show the extent of elevated cold infrared brightness temperatures and the ash plume from Puyehue-Cordón Caulle at four different times: 12 June 2011 at 1139, 12 June at 1309, 13 June 2011 at 0639, and 13 June at 1439; all times given in UTC. The purple color in these infrared layers corresponds to approximately -40 to -50°C. The location of Cordón Caulle is marked with a red triangle. Courtesy of Daniel Lindsey of NOAA/NESDIS/STAR/RAMM Branch. |
Based on webcamera observations, OVDAS-SERNAGEOMIN reported that incandescence was visible during 23 February-30 April 2012 and, at times, the local webcam views captured incandescence reaching up to 600 m above the rim (table 2).
Table 2. Seismicity and observations of Cordón Caulle's eruption during 2012 were documented in regular reports from OVDAS- SERNAGEOMIN. This table highlights data from 23 February to 22 April. Note that incandescence and plume heights correspond to km above the crater. Courtesy of SERNAGEOMIN-OVDAS.
| Alert Level | DATE | # Eqs | Max Mag | Incandescence | Plume Characteristics |
| Red | 23-Feb | 1.7 | yes | up to 1 km | |
| 26-Feb | 1.4 | yes | up to 0.5 km | ||
| 27-Feb | 1.8 | no | no | ||
| 28-Feb | 1.7 | no | up to 1 km , drifted NNE | ||
| 1-Mar | 1.3 | yes | up to 0.7 km , drifted SE | ||
| 4-Mar | 1.2 | yes | up to 0.8 km , drifted ESE for ~30 km | ||
| 5-Mar | 2.5 | yes, up to 0.2 km | up to 1.2 km , drifted E for ~50 km | ||
| 6-Mar | 0.5 | yes, up to 0.2 km | up to 1.2 km , drifted N for ~30 km | ||
| 7-Mar | 1 | yes, up to 0.1 km | up to 0.5 km , drifted SW for ~40 km | ||
| 8-Mar | 3.2 | no | up to 1 km , drifted E for ~35 km | ||
| 9-Mar | 1.6 | no | up to 0.4 km , drifted SSW for ~40 km | ||
| 10-Mar | 0.6 | yes, up to .1 km | no | ||
| 11-Mar | 3.1 | no | up to 1 km | ||
| 12-Mar | 0.9 | yes, up to .3 km | up to 0.3 km , drifted NNE for ~50 km | ||
| 13-Mar | 2.5 | yes, up to .4 km | up to 1.2 km , drifted E for ~30 km | ||
| 14-Mar | 0.5 | no | up to 0.5 km , drifted N for ~20 km | ||
| 15-Mar | 1.7 | yes, up to .2 km | up to 0.4 km , drifted for ~12 km | ||
| 16-Mar | 1.2 | yes, up to .2 km | no | ||
| 17-Mar | 0 | 0 | yes, up to .1 km | no | |
| 18-Mar | 1.4 | yes, up to .6 km | no | ||
| 19-Mar | 0.5 | yes, up to .3 km | up to 1 km , drifted NNE for ~17 km | ||
| 20-Mar | 0.6 | no | no | ||
| 21-Mar | 0 | 0 | no | up to 0.5 km | |
| 22-Mar | 1.5 | no | up to 0.4 km | ||
| 23-Mar | 1.1 | yes, up to .1 km | no | ||
| 24-Mar | 0.1 | yes, up to .1 km | up to 0.5 km | ||
| 25-Mar | 1 | yes, up to .1 km | up to 0.1 km | ||
| 26-Mar | 1.3 | yes, up to .1 km | up to 0.1 km , drifted 9 km | ||
| 27-Mar | 0.9 | yes, up to .1 km | no | ||
| 28-Mar | 0.6 | yes, up to .1 km | up to 0.5 km | ||
| 29-Mar | 1 | yes, up to .1 km | up to 1.2 km | ||
| 30-Mar | 1.4 | yes, up to .1 km | up to 0.4 km | ||
| 31-Mar | 1.4 | yes, up to .1 km | up to 0.5 km | ||
| 1-Apr | 2.4 | yes | up to 0.6 km | ||
| 2-Apr | 1.8 | yes | up to 0.8 km | ||
| 4-Apr | 1.4 | no | no | ||
| 8-Apr | 2.8 | no | up to 0.45 km | ||
| Orange | 9-Apr | 1.4 | yes, up to .1 km | up to 0.4 km | |
| 10-Apr | 1.3 | yes, up to .1 km | up to 0.5 km | ||
| 11-Apr | 1.4 | no | up to 1 km | ||
| 12-Apr | 1.7 | no | up to 0.3 km | ||
| 13-Apr | 1.1 | no | up to 0.2 km | ||
| 14-Apr | 1.5 | no | no | ||
| 15-Apr | 1.9 | no | no | ||
| 16-Apr | 1.7 | no | no | ||
| 17-Apr | 1.8 | yes | no | ||
| 18-Apr | 2 | no | no | ||
| 19-Apr | 1.8 | no | no | ||
| 20-Apr | 3 eq/hour | 1.7 | yes, up to .1 km | up to 0.1 km | |
| 21-Apr | 1.9 | no | up to 0.2 km | ||
| 22-Apr | 3.4 | no | up to 0.4 km |
Based on seismicity and visual observations, declining activity was noted from late April 2012 through October 2013 (table 3). Incandescence and plumes from the crater were rarely documented, partly due to poor weather conditions. Seismicity was reported in terms of individual counts and, after the Alert Level was downgraded to Green, seismicity rarely exceeded 20 events per month.
Table 3. Activity at Puyehue-Cordón Caullefrom 24 April 2012 to 31 October 2013. Earthquake types, volcano-tectonic and long-period are abbreviated with VT and LP, respectively. MD refers to magnitudes calculated from signal duration; RD is the abbreviation for reduced duration. Courtesy of SERNAGEOMIN-OVDAS.
| Alert Level | DATE | # Eqs | Max Mag | #VT | #LP | MD | Max RD | Tremor | RD | Incandescence | Plume Characteristics | |
| Yellow | 2012 | 24-30 Apr | 256 | 2.5 | 5 | 251 | 2.2 | 8.9 | 0 | 0 | at night | up to 1,200 m |
| 1-31 May | 341 | 1.4 | 17 | 265 | 1.7 | 59.5 | 59 | 4.3 | na | bad weather | ||
| 1-15 Jun | 23 | 0.7 | 3 | 20 | 1.3 | 9.7 | 0 | 0 | na | bad weather | ||
| 16-30 Jun | 7 | 1.4 | 4 | 2 | 1 | 11.2 | 0 | 0 | na | generally bad weather, but a white plume up to 400 m (25 Jun) | ||
| 16-31 Jul | 6 | 0.3 | 2 | 4 | 1.8 | 3.6 | 0 | 0 | na | bad weather | ||
| Green | 16-31 Aug | 3 | 1.1 | 2 | 1 | 0.7 | 1.9 | 0 | 0 | na | bad weather | |
| 1-30 Sept | 9 | 1.3 | 2 | 7 | 1.8 | 34.2 | 0 | 0 | na | bad weather | ||
| 1-31 Oct | 18 | 1.4 | 10 | 8 | 1.3 | 13 | 0 | 0 | na | bad weather | ||
| 1-30 Nov | 4 | 0.7 | 2 | 2 | 1 | 5.4 | 0 | 0 | na | bad weather | ||
| 1-31 Dec | 2 | 1.1 | 0 | 2 | 1.1 | 4.4 | 0 | 0 | na | bad weather | ||
| 2013 | 1-31 Jan | 10 | 0.7 | 2 | 8 | 1.7 | 2.5 | 0 | 0 | na | remobilized ash observed by local authorities; suspected new activity but not corroborated | |
| 1-28 Feb | 17 | 0.9 | 7 | 10 | 1.1 | 13.4 | 0 | 0 | na | no | ||
| 1-31 Mar | 9 | 1 | 7 | 2 | 1.1 | 7.7 | 0 | 0 | na | no | ||
| Apr | na | na | na | na | na | na | na | na | na | no | ||
| 1-31 May | 1 | 2 | 1 | 0 | 0 | 0 | 0 | 0 | na | no | ||
| Jun | na | na | na | na | na | na | na | na | na | no | ||
| 1-31 Jul | 20 | 1.5 | 13 | 7 | 1.2** | 5.9 | 0 | 0 | na | no | ||
| 1-31 Aug | 29 | 1.9 | 16 | 13 | 1.1** | 4.7 | 0 | 0 | na | no | ||
| 1-30 Sept | 30 | 1.4 | 22 | 8 | 1.3** | 4.3 | 0 | 0 | na | no | ||
| 1-31 Oct | 30 | 2.4 | 21 | 9 | 1.7** | 3.8 | 0 | 0 | na | no | ||
Although activity had diminished significantly by April 2012, field researchers determined that the rhyolitic dome material remained mobile. In an interview with Earthweek released on 15 November 2013, Hugh Tuffen of Lancaster University explained that, "the lava was still oozing after almost a year, and it advances between 1 and 3 meters a day." Fieldwork yielded results later published in 2013 that highlighted the heterogeneity of processes (brittle and ductile) that could have existed in order to allow rhyolitic magma to travel explosively and effusively to the surface. This investigation included video documentation of explosive phases of the eruption in 2012 (figure 11).
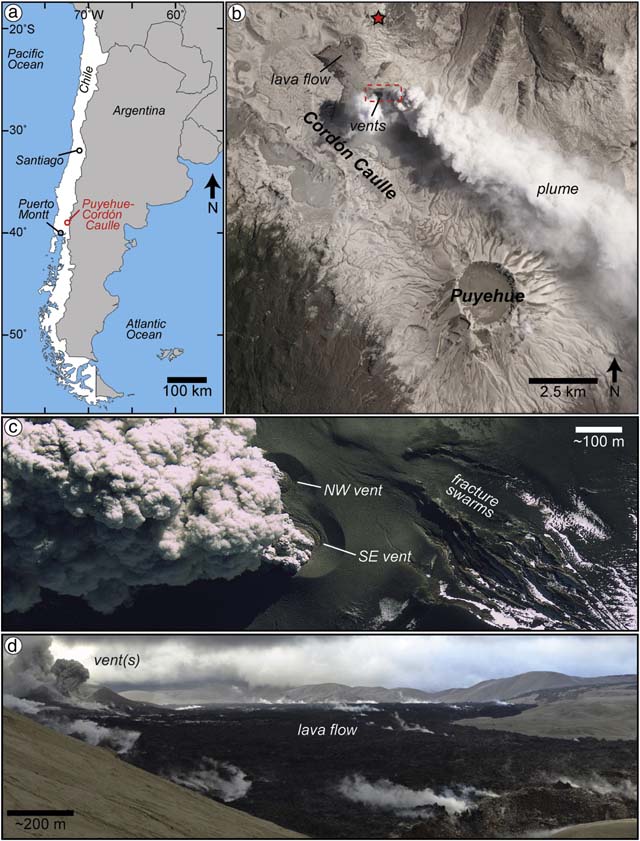 |
Figure 11. This series of images includes: (a) a location map for Puyehue-Cordón Caulle; (b) a NASA ALI image taken on 26 January 2012 including annotated locations of observation points (red star) and the red box corresponds to the area in "c"; (c) the overlapping vent structures and ash plumes were captured in this GeoEye-1 image from 3 July [2011]; (d) and this panorama of the active lava flow observed on 10 January 2012 (note that the scale is approximate). Original images are from Schipper and others, 2013. |
References. Earthweek: A diary of the planet, 15 Nov. 2013, http://www.earthweek.com/2013/ew131115/ew131115d.html.
Schipper, C.I., Castro, J.M., Tuffen, H., James, M.R., and How, P., 2013. Shallow vent architecture during hybrid explosive-effusive activity at Cordón Caulle (Chile, 2011-12): Evidence from direct observations and pyroclast textures, Journal of Volcanology and Geothermal Research, 262: 25-37.
Links for full animation of IR images from GOES-13 data provided by Daniel Lindsey of NOAA/NESDIS/STAR/RAMM Branch:
4-6 June 2011:
http://rammb.cira.colostate.edu/templates/loop_directory.asp?data_folder=dev/lindsey/loops/4jun11_chile_ir&image_width=1020&image_height=720&no_toggle=1
12-14 June 2011:
http://rammb.cira.colostate.edu/templates/loop_directory.asp?data_folder=dev/lindsey/loops/13jun11_chile_ir&image_width=1020&image_height=720&no_toggle=1
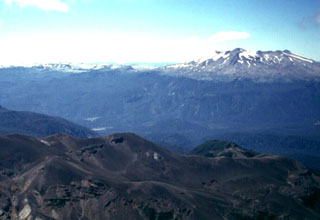
Geological Summary. The Puyehue-Cordón Caulle volcanic complex (PCCVC) is a large NW-SE-trending late-Pleistocene to Holocene basaltic-to-rhyolitic transverse volcanic chain SE of Lago Ranco. The 1799-m-high Pleistocene Cordillera Nevada caldera lies at the NW end, separated from Puyehue stratovolcano at the SE end by the Cordón Caulle fissure complex. The Pleistocene Mencheca volcano with Holocene flank cones lies NE of Puyehue. The basaltic-to-rhyolitic Puyehue volcano is the most geochemically diverse of the PCCVC. The flat-topped, 2236-m-high volcano was constructed above a 5-km-wide caldera and is capped by a 2.4-km-wide Holocene summit caldera. Lava flows and domes of mostly rhyolitic composition are found on the E flank. Historical eruptions originally attributed to Puyehue, including major eruptions in 1921-22 and 1960, are now known to be from the Cordón Caulle rift zone. The Cordón Caulle geothermal area, occupying a 6 x 13 km wide volcano-tectonic depression, is the largest active geothermal area of the southern Andes volcanic zone.
Information Contacts: Observatorio Volcanológico de Los Andes del Sur-Servicio Nacional de Geología y Minería (OVDAS-SERNAGEOMIN), Avda Sta María No. 0104, Santiago, Chile (URL: http://www.sernageomin.cl/); Daniel Lindsey, NOAA/NESDIS/STAR/RAMM Branch (URL: http://rammb.cira.colostate.edu/); René Servranckx, Meteorological Service of Canada (URL: http://www.ec.gc.ca/meteo-weather/default.asp?lang=En&n=FDF98F96-1); and Montreal Volcanic Ash Advisory Centre (VAAC) (URL: http://ec.gc.ca/meteo-weather/default.asp?lang=En&n=6B59FE0C-1).